survey methods and identification of ethnic crops for the ... · pdf filesurvey methods and...
TRANSCRIPT

New Jersey Agricultural Experiment Station
P-02903-1-07 May 2007
Survey Methods and Identification of Ethnic Crops for the East Coast in the USA: A
Procedural Synopsis
Ramu Govindasamy
Richard VanVranken William Sciarappa
Albert Ayeni Venkata S. Puduri
Kim Pappas James E. Simon Frank Mangan Mary Lamberts
and Gene McAvoy
Department of Agricultural, Food and Resource Economics Rutgers Cooperative Extension
New Jersey Agricultural Experiment Station School of Environmental and Biological Sciences
Rutgers, The State University of New Jersey New Brunswick, New Jersey 08901
May 2007
This project was supported by the National Research Initiative (NRI) of the Cooperative State Research, Education and Extension Service, United States Department of
Agriculture (USDA), Award # 2005-35618-15735.

Survey Methods and Identification of Ethnic
Crops for the East Coast in the USA: A Procedural Synopsis
Ramu Govindasamy1, Richard VanVranken2, William Sciarappa2, Albert Ayeni3,Venkata S. Puduri1, Kim Pappas1, James E. Simon 4,
Frank Mangan5, Mary Lamberts6, and Gene McAvoy 7
1Department of Agricultural, Food and Resource Economics, Rutgers University, New Brunswick, NJ 08901; 2Department of Agriculture and Resource Management Agents, Rutgers Cooperative Extension, Rutgers University, New Brunswick, NJ 08901; 3International Programs, Rutgers University, New Brunswick, NJ 08901; 4New Use Agriculture and Natural Plant Products Program, Rutgers University, New Brunswick, NJ 08901; 5Department of Plant, Soil & Insect Sciences, Amherst, MA 01003; 6Florida Cooperative Extension, Homestead, FL 33030; 7Florida Cooperative Extension, LaBelle, FL 33975.
Correspondence Address
Dr. Ramu Govindasamy.
Department of Agricultural, Food, and Resource Economics Rutgers, The State University of New Jersey
55 Dudley Road New Brunswick, NJ 08901-8520
Tel.: (732) 932-9155 ext.254 FAX: (732) 932-8887
E-mail address: [email protected]
Acknowledgements The authors acknowledge several individuals who contributed valuable expertise and
guidance to the progress of the project. At the University of Maryland, we appreciate the
inputs of Stephan Tubene, Agricultural Economist, Coordinator of the Small Farm
Institute, and State Coordinator of Cooperative State Research, Education, and Extension
Service (CSREES) – USDA Small Farm Programs. We also recognize the valuable
contributions from Rutgers Food Innovation Center (FIC) and Interregional Research
Project No. 4 (IR-4) and most notably, the respective marketing and crop expertise of
Diane D. Holtaway, Associate Director and Hong Chen, Chair - International Crop
Grouping Consulting Committee. These university partners made significant
contributions in the initial consumer survey development, specifically in the ethnic crop
identification and selection process. We acknowledge the Language Institute at Rutgers
and, in particular, Professors R. Van Ness Simmons and Phyllis Zatlin for their assistance
in securing translators from their respective Asian and Spanish language departments to
prepare bilingual versions of the ethnic consumer surveys. Morris Gbolo, Brian Hulme,
and Vivian Quinn of Rutgers Cooperative Extension are recognized and appreciated for
their field trial management. We also thank Drs. Chung Park and Qing-Li Wu of Rutgers
Plant Biology and Pathology for their valuable assistance and support relative to Asian
ethnic crops.
This project was supported by the National Research Initiative (NRI) of the Cooperative
State Research, Education and Extension Service, United States Department of
Agriculture (USDA), Award # 2005-35618-15735. The opinions expressed in the article
are those of the authors and do not necessarily reflect official positions or policies of the
USDA, NRI,, Rutgers University, University of Florida, or University of Massachusetts.
1

TABLE OF CONTENTS
Page
Acknowledgements .................................................................................................................... 1
TABLE OF CONTENTS ........................................................................................................... 2
List of Tables.............................................................................................................................. 3
List of Figures ............................................................................................................................ 4
1. Introduction ............................................................................................................................ 8
2. Research Approach................................................................................................................. 9
3. ETHNIC CONSUMER SURVEY ....................................................................................... 12 3.1. Sample and Method ........................................................................................................... 12
3.2. Implementation and Outcomes .......................................................................................... 14
3.3. Design; Sequence and Content .......................................................................................... 18
3.4. Data Purpose ...................................................................................................................... 20
4. CROP SELECTION PROCESS .......................................................................................... 20 4.1. Identify Ethnic Crops of Interest; 100+ Crops................................................................... 21
4.2. Assess Demand and Supply/Production Potential; 42 crops ............................................. 22
4.3. Prioritize Production Research; 28 Crops.......................................................................... 23
4.4. Develop Production Plot Plans; 12 Research and 16 Demo Crops ................................... 32
5. ETHNIC CROP PRODUCTION AND RESEARCH PROGRAM..................................... 35 5.1. Production Trials................................................................................................................ 35
5.2. Case Studies....................................................................................................................... 36
5.3. Outreach............................................................................................................................. 36
6. CONCLUSIONS AND RECOMMENDATIONS FOR FURTHER RESEARCH............. 37
References ................................................................................................................................ 38
Appendix: Ethnic Consumer Survey Questionnaire ................................................................ 39

List of Tables
Page
Table 3.1. East Coast Ethnic Populations .....................................................................................13 Table 3.2. Ethnic Consumer Survey Respondent Summary.........................................................16 Table 3.3. Ethnic Consumer Survey Administration ....................................................................17 Table 4.1. Chinese Ethnic Produce Survey Ranking ....................................................................24 Table 4.2. Asian Indian Ethnic Produce Survey Ranking ............................................................25 Table 4.3. Mexican Ethnic Produce Survey Ranking ...................................................................26 Table 4.4. Puerto Rican Ethnic Produce Survey Ranking ............................................................27 Table 4.5. Prioritization Process; Proposed Production Crops .....................................................30 Table 4.6. Selected Crops for Production Plots ............................................................................34

List of Figures Page
Figure 2.1. Recent U.S. Population Growth Rates .......................................................................10 Figure 2.2. Projected Trends in U.S. Population ..........................................................................11 Figure 4.1. Crop Selection Process ...............................................................................................21

EXECUTIVE SUMMARY
The rapid expansion of ethnic populations presents significant opportunities for fruit and
vegetable producers along the East Coast to take advantage of their close proximity to
densely populated areas. This study was undertaken to document and quantify the
current market for selected ethnic vegetables and assess the demand so farmers may grow
crops targeted from a demand perspective. The project has two phases; Phase I and II.
Phase I includes assessment and quantification of ethnic market demand to focus
production efforts in the subsequent phase. Phase II utilizes the demand findings to
develop production trials, grower recommendations, and strategies to coordinate year-
round production of select ethnic crops to serve this market niche. The procedural
synopsis contained in this publication documents the survey methods and crop
identification processes used to identify and quantify the market, assess demand, and
select appropriate crops for production trials. It provides an overview of the market-first
approach and interdependency of Phase I and II necessary to address the existing local
supply-demand gap.
The specific ethnic market subjects of study were the Asian and Hispanic segments,
chosen for their strong recent growth and continued growth expectations. The top two
sub-groups within each of these segments were chosen for the study; Chinese and Asian
Indian (Asian sub-groups) and Puerto Rican and Mexican (Hispanic sub-groups). The
geographic focus is the East Coast and includes Washington D.C. and sixteen states
bordering the East Coast. A statistically representative sampling of consumers from each
of the four ethnic sub-groups in area was gathered via a stratified sampling method.
Bilingual phone surveys were developed and administered and 1,084 completed surveys
were collected to assess ethnic produce demand, quantify the current market, and acquire
purchase data for ethnic crops to prioritize selections for production trials.
The ethnic crops of interest were identified through a selection process that began with a
crop expert panel review of an initial list of over 100 ethnic crops to select 42 produce
items for inclusion in the ethnic consumer survey questionnaire. Results of the survey of

271 randomly selected East Coast consumers from each of the four ethnic groups were
used to rank the crops included in the questionnaire, within ethnicity, according to
expenditure and/or purchase data. Multiple criteria were established to rank produce
items and allow for comparisons across produce items of various unit types (i.e. pounds,
bunches, and numbers). The surveyed demand criteria included average expenditures,
frequency of purchase, and volume of purchase. In addition to the surveyed demand,
crops were also evaluated for production research potential (research interest, yield
potential, and anticipated cost effectiveness) by production trial participants in three
states. A combined assessment (actual survey demand and estimated production
potential) was particularly important in cases where a single systematic demand approach
(comparison) was not sufficient to distinguish between crops for research prioritization
purposes.
The result of the production research prioritization process based upon primarily survey
demand, combined with production considerations, yielded a targeted list of 28 (of 42)
crops recommended for production trials. Logistical concerns (space, labor and budget
constraints) drove decisions to limit the number of replicated crops to twelve and include
crops of similar species suited for production on black plastic mulch with drip irrigation
systems. Species with cross-ethnic demand were given higher priority for replication to
maximize the return on research efforts. Also, despite not using the most appropriate
production system for them, the crops with the highest overall survey rank from each of
the ethnic groups was included to ensure that the crops with the highest demand from
each group were represented, once the cross-ethnic list had been exhausted. The same
underlying factors that supported the decisions for replicated trial selections also
contributed to the selection of ten crops for demonstration trials (incremental research
benefits, seed availability, and survey demand).
Demonstration and research trials are already underway and will ultimately be
established at six sites located in three states along the East Coast (two in Florida, one in
Massachusetts, and three in New Jersey). Trials are to be conducted at each location for
two seasons. Due to varying climates, production seasons vary from site to site and

special attention to variations in yield and quality of produce, as may be affected by
season and geographic location, is warranted. Crop quality and yield parameters will be
evaluated statistically to determine suitability for commercial production and develop
recommendations for geographic sequencing of production, by month/season, to sustain a
twelve month production supply in the eastern United States. Information from the
production trials will be combined with case study findings to make final crop
recommendations and communicated accordingly to East Coast farmers. Completion of
the second phase of the study is targeted for 2009.
1. Introduction
Economic opportunities have arisen in the last decade for specialty crop agriculture
catering to the ethnically diverse consumers along the eastern coast of the United States
(Govindasamy et al. 2006; Mendonca et al. 2006; Sciarappa, 2001-2003; Tubene, 2001).
United States Census data show average population increases of 13% from 1990 to 2000
as compared to 48% for Asians and 58% for Hispanic (Census 1990, 2000). The ethnic
population boom along the East Coast is even more pronounced. In ethnically diverse
population hubs such as the Northeast Region, the Asian population growth reached 60%.
Similarly growing Hispanics concentrations are geographically dispersed along the East
Coast, with just five states (FL, GA, NY, NC, and NJ) accounting for over one fifth of the
nation’s Hispanic population growth and yielding a combined growth rate of 59%. The
rapid expansion of ethnic populations presents significant opportunities for fruit and
vegetable producers in the region to take advantage of their close proximity to densely
populated areas. To help East Coast farmers remain economically viable, this U.S.
Department of Agriculture, National Research Initiative study was undertaken to
document and quantify the current market for selected ethnic vegetables. Assessing
demand allows farmers to target crops with the highest potential return.
A survey based on random sampling was prepared for four predominant and growing
ethnic groups, specifically; Chinese, Indian, Mexican and Puerto Rican. Two hundred
seventy one East Coast residents were interviewed from each selected ethnicity totaling
1,084 samples. Crop production experts along the East Coast from Florida to
Massachusetts narrowed a potential list of over 100 fruits and vegetables based upon
production and climatic criteria. Bilingual surveys of the ethnic consumers from the
identified groups indicated food crop purchasing preferences of the top 10-12 crops for
each group which helped refine selections for field trialing.
The general objectives of the overall study are to:

1) identify and estimate the market size for ethnic segments that present significant
opportunities to regional growers;
2) assess demand, conduct production studies, and make production
recommendations for appropriate ethnic produce items for this market; and
3) develop strategies and production timelines to coordinate year-round production
of select ethnic crops to exploit this market niche.
The intended outcome of the project is to generate and distribute science-based
information about production, marketability, and utilization of selected ethnic food crops
and herbs. This initiative bridges the supply-demand gap, delivering practical solutions
to economic problems faced by many vegetable growers, and contributes to the
nutritional and health needs of regional consumers.
The procedural synopsis contained in this publication documents the survey methods and
crop identification processes used to identify and quantify the market, assess demand, and
select appropriate crops for production trials in order to address the supply-demand gap
(Phase I of overall project). The balance of the overall project objectives which include
production crop recommendations, strategies, and timelines (Phase II) will be provided in
a separate publication, after production trials are completed, to deliver science-based
supply-side recommendations.
2. Research Approach
National trends. Opportunities to capture anticipated market growth in certain ethnic
markets were identified, specifically for ethnic market segments growing at faster rates
than their ethnic and/or non-ethnic counterparts and for which growth is expected to
continue. The primary groups meeting these criteria included Asians and Hispanics
(recent rate of growth; Fig. 2.1. and continued growth expectations; Fig. 2.2.). The top
two sub-groups within each of these segments were chosen for the study; Chinese and
Asian Indian (Asian sub-groups) and Puerto Rican and Mexican (Hispanic sub-groups).

Figure 2.1. Recent U.S. Population Growth Rates
U.S. Population Growth Ratesby Race and Hispanic Origin
6%
19%
13%
20%
1%0%
5%
10%
15%
20%
25%
2000 to 2001 2000 to 2002 2000 to 2003 2000 to 2004 2000 to 2005
Year Comparison
Cum
ulat
ive
Gro
wth
Black AsianAll other races Hispanic (of any race)White alone (not Hispanic)
Source: Population Estimates; April 1, 2000 to July 1, 2005, Population Division, U.S. Census Bureau, 2006

Figure 2.2. Projected Trends in U.S. Population
U.S. Population Projections by Race and Hispanic Origin
0
50
100
150
200
250
2000 2010 2020 2030 2040 2050Year
Popu
latio
n (M
)
Black AsianAll other races Hispanic (of any race)White alone (not Hispanic)
Source: “U.S. Interim Projections by Age, Sex, Race, and Hispanic Origin”, U.S. Census Bureau, 2004
Rationale and Significance. Despite the competitive disadvantages relative to year-round
producers in western production areas, significant comparative advantages exist for local
East Coast growers as a result of their proximity to densely populated areas rich in ethnic
diversity (Govindasamy, Nemana, Puduri, Pappas, 2006). Increasingly, these producers
adopt new crops or create new value-added products in order to remain economically
viable. Growing ethnic crops presents opportunities for producers to exploit existing
comparative advantages associated with serving densely populated local ethnic markets
in order to increase profitability and sustain farming operations. The coordination of
production and marketing are critical to avoid the threats of rapid over-production (which
can quickly lead to depressed prices) and to overcome inadequate marketing
infrastructure in order to move product into community markets. Establishing or
extending existing cooperative marketing associations along the East Coast, from North

to South, can create an improved market system that provides appropriate year-round
supplies to the area.
Data Collection. The research program included the development, administration, and
data collection from an ethnic consumer survey. The survey objective was to gather
relevant consumer information from four ethnic groups (Chinese, Indian, Mexican, and
Puerto Rican) to include demographics, shopping patterns, preferences and opinions,
related practices, willingness to pay premiums over traditional American produce, and
typical produce expenditures. The data collected was utilized to analyze ethnic
consumers’ patterns of purchase and propensity to purchase ethnic produce, estimate the
associated market potential, and prioritize subsequent production studies of individual
crops in order to make recommendations to for local production.
Market Estimation and Production Research. The survey expenditure data collected
included both respondent estimates of average spending on all of their produce, ethnic
and total (including conventional American), and specific purchase data on selected
ethnic produce items. The ethnic produce expenditure data provided the data necessary
to estimate the respective ethnic produce markets for each of the four ethnicities of study.
The combination of ethnic and total produce expenditure allowed for a relative
comparison. The ethnic produce item specifics helped to guide decisions for production
research trials. The 42 produce items included in the survey questionnaire were selected
from an initial list of over 100 ethnic crops, as a result of a crop expert panel review. The
surveyed crop list was further refined through a systematic process based on the survey
results (demand) and relevant production considerations (supply) for the local
marketplace.
3. ETHNIC CONSUMER SURVEY
3.1. Sample and Method Sample sizes for each ethnicity were identified based on 2000 Census populations for
Chinese, Asian Indians, Mexicans and Puerto Ricans in the 16 East Coast states and the
District of Columbia (Table 3.1.). Sample sizes of 271 surveys for each of the four ethnic

groups were statistically determined for a total of 1,084 surveys of ethnic produce
consumers. (The sampling error associated with an East Coast sample of 271 people
from each of the four ethnic groups is approximately +5% with a 90% confidence
interval.)
Table 3.1. East Coast Ethnic Populations (United States Census 2000) (United States Census 2000)
12,21152,8718,3565,967South Carolina
1,3741,1748581,330Vermont
228,55755,17857,24150,650Pennsylvania
31,117246,54526,19718,984North Carolina
1,050,293260,889251,724424,774New York
366,788102,929169,180100,355New Jersey
199,20722,28843,80184,392Massachusetts
2,2752,7561,0212,034Maine
25,57039,90049,90949,400Maryland
35,532275,28846,13227,446Georgia
482,027363,92570,74046,368Florida
2,3285,0982,8453,734District of Columbia
14,00512,9865,2804,128Delaware
194,44323,48423,66219,172Connecticut
GROUPETHNIC
2,718,495 1,549,761 812,576 884,748 TOTAL
41,13173,97948,81536,966Virginia
25,4225,8812,9424,974Rhode Island
6,2154,5903,8734,074New Hampshire
Puerto RicanMexican
Asian Indian Chinese STATE

Further sample size requirements were established, based upon ethnic group by state in
accordance with a stratified random sampling method (stratified random sampling was
used where the sample is selected such that ethnic groups are represented in the same
respective proportion, by state, as they occur in the population, per Census 2000), with a
minimum requirement of one sample per state for each ethnic group. An additional
sample size of 271 was established, irregardless of state and ethnic group, to gather data
in a short survey delivered to non-purchasers of ethnic produce to assess their reasons for
not purchasing these items and determine their willingness to buy ethnic produce based
upon the availability of certain attributes.
3.2. Implementation and Outcomes Administration. An outsourced firm specializing in telephone and internet data collection,
The Wats Room Incorporated (WATS), was contracted to conduct 1,355 telephone
interviews using Computer-Assisted Telephone Interview (CATI) technology. Their
surveys were conducted by phone to ensure that a statistically significant randomized
sample was obtained. This entailed targeting and achieving the required sample sizes by
ethnicity and state while minimizing any costs associated with sample surpluses in certain
states and deficits in others (as might occur with a mail-administered survey). The
phone-administered questionnaires were to be completed by the principal grocery
shopper in each household, as identified by each respondent with prompting from the
interviewer.
Qualified (bi-lingual) interviewers received on-site Human Subjects Certification
Program (HSCP) training, per Federal-wide Assurance guidelines, in addition to survey-
specific training and practice, prior to conducting actual interviews. (HSCP includes
background material on human subject research which includes history, policies,
regulations, procedures and ethical practices.) A member of the Rutgers research team
was on-site at WATS in Rochelle Park, New Jersey during this training to monitor the
process, tour the facility, and oversee operations. Ongoing interviewer monitoring

throughout the field period was conducted by WATS. Interviewing commenced in late
February 2006, continued into March, with initial results available by the end of March
and final data files provided in early May, 2006.
Response Rate. Over 13,000 potential interviewee leads were utilized by WATS in order to
meet the sample size requirements. These leads were generated by ethnic surnames,
selected using a randomized selection process, and further randomized through CATI
programming. Ultimately, a total of 1,366 phone surveys were completed by ethnic
consumers as follows; 1,084 long-version surveys by purchasers of ethnic produce (271
ethnic produce purchasers from each of the four ethnicities surveyed; Chinese, Asian Indian,
Mexican, and Puerto Rican) and 282 short-version surveys by non-purchasers of ethnic
produce (defined as not having purchased within the past year), irrespective of ethnic group
(Table 3.2.; the actual number of short-version surveys collected exceeded the objective
slightly, resulting in 1,366 useable surveys as compared to the original 1,355 objective).
Roughly 10% of the numbers selected at random for each ethnic group yielded complete
interviews (Table 3.3.). However, many of telephone numbers originally selected were non-
residential or non-working numbers. Removal of these non-working numbers from the
equation reveals that 14% of the calls to working residential numbers resulted in completed
interviews. Many multiple call attempts to working residential numbers were unsuccessful
in contacting the principal grocer shopper in the house, as required for the survey interview.
Surveys were conducted between 5 pm and 9 pm EST to accommodate those shoppers that
work. Despite repeat call attempts of up to 10 telephone calls and/or three appointment
setting follow-ups per number, many qualified interviewees could not be reached. The
cooperation rate, or completed interviews as a percent of calls to a qualified (accessible)
interviewee, was approximately 37% (the cooperation rate is defined for these purposes as
completed interviews as a percentage of the sum of completed interviews, refusals, and
language barriers cited.).

Table 3.2. Ethnic Consumer Survey Respondent Summary ETHNIC GROUP
STATE
Chinese Asian Indian
Mexican
Puerto Rican Total
Connecticut 6
8 4 19
37
Delaware 1
2 2 1
6
District of Columbia 1
1 1 1
4
Florida 14
23 63 46
146
Georgia 8
15 48 4
75
Massachusetts 26
15 4 20
65
Maryland 15
17 7 3
42
Maine 1
1 1 1
4
North Carolina 6
9 43 3
61
New Hampshire 1
1 1 1
4
New Jersey 31
56 18 36
141
New York 130
83 45 104
362
Pennsylvania 15
19 10 23
67
Rhode Island 2
1 1 3
7
South Carolina 2
3 9 1
15
Vermont 1
1 1 1
4
Virginia 11
16 13 4
44
Purchasers* 271 271 271 271
1,084
Non-purchasers** 107 36 105 34
282
Total Surveys 378 307 376 305
1,366
* Purchasers are respondents that indicated they have purchased ethnic fruits and vegetables within the past 12 months. ** Non-purchasers are respondents that indicated they have not purchased ethnic fruits and vegetables within the past 12 months.

Table 3.3. Ethnic Consumer Survey Administration Ethnic Produce Survey
Summary & Call Completion Analysis
COMPLETED SURVEYS Asian Puerto TotalChinese Indian Mexican Rican
Purchasers 271 271 271 271 1,084 Non-purchasers 107 36 105 34 282
TOTAL 378 307 376 305 1,366
CALL COMPLETION ANALYSISa Complete surveys 378 307 376 305 1,366 b Total number of leads 3,505 3,514 3,421 2,790 13,230
Residential or Non-working #s: 550 700 1,454 882 3,586
c Working Residential #s (complete, refusals, language, max calls) 2,955 2,814 1,967 1,908 9,644 d Refusals 669 739 221 245 1,874 e Language Barriers (including deaf) 199 121 85 23 428 f Live (i.e. at least one call attempt made; active phone # determination) 1,514 1,622 393 866 4,496
a/b Completion Rate = Complete/Total numbers selected 11% 9% 11% 11% 10%
a/c Rigid Response Rate = Complete/Working Residential #s 13% 11% 19% 16% 14%
a/(a+d+e) Cooperation Rate = Complete/(Complete + Refusals + Language Barrier) 30% 26% 55% 53% 37%
Nuances of Ethnic Languages and Crop Names. The surveys were administered by
trained, bilingual phone interviewers in order to minimize response bias due to potential
language barriers. The interview languages made available were as follows; (1) Chinese
interviews offered/conducted in English, Mandarin, and Cantonese; (2) Indian interviews
offered/ conducted in English and Hindi; and (3) Mexican and Puerto Rican
offered/conducted in English and Spanish (reflective of respective dialect differences
between the two countries of origin; used, as needed, according to interviewer
confirmation of respondent’s country of origin).

Both the targeted call completion time for ethnic produce purchasers and the WATS
estimated completion time by WATS, prior to survey implementation, were under twelve
minutes. Average completion times by ethnic group actually ran up to three minutes longer,
depending on ethnicity, with the Asian (Chinese/Indian) segments being at the higher
extreme and the Hispanic (Mexican/Puerto Rican) segments closer to the original estimate
(Minutes; 15.39 Chinese, 13.64 Indian, 12.48 Mexican, 12.31 Puerto Rican). A greater need
for language/translation assistance, particularly in crop name recognition, by Asian versus
Hispanic interviewees was cited by WATS as the primary reason for the extended call
times. In anticipation of such crop name recognition issues, the bi-lingual interviewers
were well-prepared in advance of survey implementation to address these crop name
recognition issues and mitigate any potential reduction in survey completions. Interviewers
were provided with additional crop name variations and/or crop pictures to ensure
interviewer crop familiarity and increase their ability to ensure the same for survey
respondents. Therefore, although the Asian respondents experienced longer interview
times than their Hispanic counterparts, their call completion rates were similar (between
9% and 11% for all 4 groups surveyed).
3.3. Design; Sequence and Content Two sets of data were collected, according to the two versions of the survey; long and
abridged. The questionnaire was designed to first assess whether the ethnic respondent
was a consumer of ethnic produce (in the past twelve months) or not, using a “yes” or
“no” screening question. Then a skip sequence was used by the interviewer, depending
on the interviewee’s response, to either; if “yes”, continue with a line of questioning that
will help to identify ethnic produce demand factors, or if “no”, identify reasons for not
purchasing ethnic produce (potential market opportunities).
The “purchasers” (respondents answering in the affirmative) proceeded to complete the
longer form of the survey, inclusive of questions about their purchase patterns
(frequency, spending, location or point of purchase, quantity, price, and expenditures)
and preferences and opinions with regard to product, placement, and price. Such inquiries
were made to quantify demand, assess the importance of product attributes, compare

ethnic versus conventional outlets (consumer perception), and determine price potential
(via consumer willingness-to-pay a premium over comparable American or conventional
substitutes). These respondents were also asked questions about different promotions and
advertisements and whether or not they influence purchase decisions. In addition, each
respondent was asked about related practices (whether or not he/she grows ethnic
produce for consumption at home and whether he/she is a vegetarian). Demographic
inquiries were made with regard to neighborhood, residency, household size and age
composition, languages and proficiency, and country of origin, in addition to other basic
socio-economic factors (age, education, income, etc.).
The “non-purchasers” (respondents with a negative answer) were urged to provide
reasons they do not generally purchase ethnic produce and were prompted with plausible
causes, if need be, such as “do not like ethnic produce”, “lack of availability”, “poor
selection”, “ethnic outlet not available or too far”, or “other”. These respondents then
proceeded to complete the abridged form of the survey.
Both purchasers and non-purchasers were asked questions about their relative willingness
(i.e. more willing, indifferent, less willing, or unsure) to buy ethnic produce based on
certain factors and/or product attributes.
The long version of the survey (completed by purchasers only) was intended to gather
demand and marketing information inclusive of the proverbial “4 P’s” of marketing
(Product, Placement, Price, and Promotion). The results of these surveys were used to
assess the market demand for the respective high-potential ethnic markets, and to direct
subsequent research (i.e. prioritize production crops) to satisfy and/or capture some of
this demand. The abridged survey version (completed by “non-purchasers”, irrespective
of ethnic group), was collected to ascertain reasons for non-purchase and identify
potential new, extended opportunities to exploit these markets. This shortened version
gathered primarily product attribute information for promotional purposes, to extend the
marketing reach of the initial project efforts to potentially underserved markets.

3.4. Data Purpose Consumer Demographics, Patterns, Preferences, and Practices. The purpose of the
socio-demographic data collection is to identify relationships between ethnic consumer
expenditures and the respective demographic profiles. In addition to the typical socio-
demographic data (age, education, income, etc.), information such as birthplace, length of
residency in the United States, and age of immigration to the United States was collected
to measure acculturation.
Additional analysis of the survey sample expenditures and demographics as they
correspond to consumer shopping patterns, preferences, and related practices, will be
utilized to develop predictive demand models for the larger populations. These models
will facilitate effective distribution efforts by enabling producers, wholesalers, and
retailers to target appropriate markets and locations, based upon demographic profiles
and geographic population concentrations. This will help to marry the supply with local
demand, as appropriate, to optimize marketing efforts.
Produce Expenditures. The preliminary focus of the purchase pattern survey results data
was to quantify the average weekly expenditure for specific ethnic crops to prioritize the
subsequent production research. Detailed data including the quantity, unit of measure
(pounds/bunches/numbers), price, and average expenditure for each produce item was
collected and analyzed. Once summarized, this data yielded average expenditures for
each crop, by ethnic group, and served as a common denominator to compare and
prioritize crops across groups (described in greater detail in the “Crop Selection Process”
section that follows).
4. CROP SELECTION PROCESS The crop selection process began with a crop expert panel review of an initial list of over
100 ethnic crops to select 42 produce items for inclusion in the ethnic consumer survey
questionnaire (Fig. 4.1). The surveyed crop list was further refined through a systematic
process based on the survey results (demand) and relevant production considerations
(supply) for the local marketplace, to arrive at a list of 28 crops to enter into production
trials (12 research and 16 demonstration plots).

Figure 4.1. Crop Selection Process
Identify Identify Ethnic Crops Ethnic Crops
of Interestof Interest
Generate Plot Plans; Maximize Research PotentialGenerate Plot Plans; Maximize Research PotentialConsider logistical concerns such as;Consider logistical concerns such as;
* budget constraints * irrigation * seed availability* budget constraints * irrigation * seed availability* cross* cross--contamination * plot space *supplies (plastic mulch, trelliscontamination * plot space *supplies (plastic mulch, trellis))
ReRe--visit Research Candidates visit Research Candidates Examine survey demand rankExamine survey demand rankReRe--evaluate Survey Rank evaluate Survey Rank Consider production research potentialConsider production research potentialConsolidate/Maximize Consolidate/Maximize Remove/replace duplicates, improve varietyRemove/replace duplicates, improve varietyReRe--prioritize Crops for Production prioritize Crops for Production Select top 7 per ethnicitySelect top 7 per ethnicity
Rank Crops (2x); Production Potential & Survey DemandRank Crops (2x); Production Potential & Survey DemandAsian Indian (#1Asian Indian (#1--10) Mexican (#110) Mexican (#1--10)10)Chinese (#1Chinese (#1--12) Puerto Rican (#112) Puerto Rican (#1--10)10)
Conduct Process of Elimination; Conduct Process of Elimination; Identify Research Crop CandidatesIdentify Research Crop CandidatesConvene Panel of Experts toConvene Panel of Experts to reduce list by reduce list by ~50% due to existing production barriers;~50% due to existing production barriers;
ClimateClimateGrowth cycle Growth cycle Seed availability/regulationSeed availability/regulationCompetition/Commodity natureCompetition/Commodity nature
Create Initial Crop ListCreate Initial Crop ListCommon ethnic crops in local Common ethnic crops in local marketplacemarketplace
Assess Assess Supply & Supply & DemandDemand
Develop Develop Production Production Plot PlansPlot Plans
Prioritize Prioritize Production Production
ResearchResearch
x 2 Years
4.1. Identify Ethnic Crops of Interest; 100+ Crops Create Initial Ethnic Crop List. An initial list of ethnic crops commonly sold/marketed
and considered as ethnic produce items for each of the four ethnic groups of study was
compiled based upon a combination of focus groups and identification through related
research (Govindasamy, 2006).

Conduct Process of Elimination. To determine which crops from the initial list to include
in the survey, a panel of twelve marketing, field/extension, and crop specialists
scrutinized the list of ethnic crops to eliminate those with existing production barriers that
could impede their local production and/or marketplace success. Production barriers
included local climate limitations, growth cycle (relatively short cycle necessary to grow
in designated East Coast production sites), lack of seed supply due to regulatory issues,
and local competition and/or commodity nature of certain produce items. Thus, specialty
crops with short post-harvest life were given priority over commodity and less-perishable
crops such as beans and certain peppers used primarily as spices.
This process reduced the survey crop candidate list to 42 crops (10 each for Asian Indian,
Mexican, and Puerto Rican, and 12 for Chinese) to assess demand. Due to budgetary
constraints, the list required further reductions to arrive at a final list of approximately 28
crops (targeting roughly 7 per ethnicity) to be included in subsequent production
research. Assessment of the survey results, along with additional production evaluation
for each, was conducted to achieve program goals.
4.2. Assess Demand and Supply/Production Potential; 42 crops Rank Crops by Ethnicity. Results of the survey of 271 randomly selected East Coast
consumers from each of the four ethnic groups were used to rank the crops included in
the questionnaire, within ethnicity, according to expenditure and/or purchase data.
Multiple criteria were established to rank produce items according to: (1) mean (weekly)
expenditures across all respondents (including zero purchases); (2) mean (weekly)
expenditures across only respondents purchasing that item (excluding zero purchases);
(3) frequency of purchase across respondents (binary; 1 or 0 for purchase or non-
purchase, respectively), (4) volume (number of pounds, bunches, or units) purchased by
each respondent for each produce item; and (5) overall rank (average of results rankings
#1 thru #4) for each produce item.

In addition to assessment of the survey demand, crops were also evaluated for production
research potential (research interest, yield potential, and anticipated cost effectiveness) by
field study participants at each site.
A combined assessment (actual survey demand and estimated production potential) was
particularly important in cases where a single systematic demand approach was not
sufficient to distinguish between crops for research prioritization purposes.
4.3. Prioritize Production Research; 28 Crops Re-visit Research Candidates; Examine Survey Demand Rank. The rank order according
to survey respondents’ purchases varied somewhat across the multiple criteria. An
Overall Rank threshold of 8 (average rank higher than 7) was established to help identify
crops with relatively low survey demand in an initial attempt to arrive at 28 crops (7 per
ethnicity) for the final production study. Crops at or above this threshold were more
closely examined based on the other four (independent) criteria. A few produce items
from each ethnicity consistently ranked 8 or higher across all of the criteria, allowing for
a systematic approach to eliminating crops from the research candidacy list. Crops
ranked 8 or higher in all (5) categories were systematically removed from further
production considerations. The remaining crops were further evaluated for supply-side
potential and consolidated across ethnic groups to maximize production research. This
process resulted in a proposed list of 28 production research crops.
Expenditure results of the Chinese consumers surveyed revealed a distinct ranking of 12
Chinese crops (Table 4.1). Five Chinese crops received an Overall Rank of 8 or higher.
Four out of these five crops consistently ranked 8 or higher in each category, suggesting
lower marketplace potential relative to their 1 thru 7 ranked counterparts. As such, these
four crops (oriental mustard, basil, Malabar spinach, and perilla) were not considered
strong candidates for further research and were removed from the candidacy list
altogether.

Table 4.1. Chinese Ethnic Produce Survey Ranking
Table 5 0.191211.2511111112Perilla
0.201111.2512121011
Malabar Spinach
0.221010.510101210Basil
0.7198.58989Oriental Mustard
0.7987.759778Edamame
1.10767836Ridged Gourd/ Luffa
1.0465.53397Napa Cabbage
1.29556644Snow Peas
1.28455465
Oriental Spinach
1.6033.54523Oriental Eggplant
1.7722.251152Pak Choy
2.2611.52211Baby Pak Choy
Avg Exp($)
Overall RankAverage Rank
Volume of Produce Bought
Produce Purchase
Frequency
Mean Expenditure without Zero
Purchase
Mean Expenditure With Zero Purchase
Rank Based on Criteria (weekly purchases)
Produce
0.191211.2511111112Perilla
0.201111.2512121011
Malabar Spinach
0.221010.510101210Basil
0.7198.58989Oriental Mustard
0.7987.759778Edamame
1.10767836Ridged Gourd/ Luffa
1.0465.53397Napa Cabbage
1.29556644Snow Peas
1.28455465
Oriental Spinach
1.6033.54523Oriental Eggplant
1.7722.251152Pak Choy
2.2611.52211Baby Pak Choy
Avg Exp($)
Overall RankAverage Rank
Volume of Produce Bought
Produce Purchase
Frequency
Mean Expenditure without Zero
Purchase
Mean Expenditure With Zero Purchase
Rank Based on Criteria (weekly purchases)
Produce
Results of the similarly surveyed Asian Indian consumers reveal the ranking of 10 Indian
crops (Table 4.2). Three crops received an Overall Rank of 8 or higher. One of these
(white pumpkin) ranked higher than 8 in every category and was removed from the
candidacy list altogether.

Table 4.2. Asian Indian Ethnic Produce Survey Ranking
The results of the similarly surveyed Mexican consumers reveal the ranking of 10 select 0.56109.2599910White Pumpkin
0.6198.25101049Amaranth
0.6887.584108Mint Leaves
0.9476.256757Ridge Gourd
1.0665.57816Mustard Leaves
1.3155.254575Bottle Gourd
1.3344.55634Cluster Beans
1.48343283Fenugreek Leaves
2.2322.51162Eggplant
2.48122321Bitter Gourd
AvgExpen-diture
$
Overall RankAverage Rank
Volume of Produce Bought
Produce Purchase
Frequency
Mean Expenditure without Zero
Purchase
Mean Expenditure With Zero Purchase
Rank Based on Criteria (weekly purchases)
Produce
0.56109.2599910White Pumpkin
0.6198.25101049Amaranth
0.6887.584108Mint Leaves
0.9476.256757Ridge Gourd
1.0665.57816Mustard Leaves
1.3155.254575Bottle Gourd
1.3344.55634Cluster Beans
1.48343283Fenugreek Leaves
2.2322.51162Eggplant
2.48122321Bitter Gourd
AvgExpen-diture
$
Overall RankAverage Rank
Volume of Produce Bought
Produce Purchase
Frequency
Mean Expenditure without Zero
Purchase
Mean Expenditure With Zero Purchase
Rank Based on Criteria (weekly purchases)
Produce
Mexican crops (Table 4.3). Three crops received an Overall Rank of 8 or higher and two
of these (Chili Habanero and Tutuma) consistently did so across all criteria and were
removed from the candidacy list.

Table 4.3. Mexican Ethnic Produce Survey Ranking
0.10109.51010810Tutuma
0.24999999Chili Habanaro
0.8387.58868Anaheim Pepper
0.92777777Chili Serrano
1.246531106Cilantro
1.2854.755554Calabacita
1.2844.56615Chili Poblano
1.4933.254423Calabaza
1.7322.752342Tamatillo
2.7611.751231Chili Jalapeno
AvgExpen-diture
$
Overall RankAverage Rank
Volume of Produce Bought
Produce Purchase
Frequency
Mean Expenditure without Zero
Purchase
Mean Expenditure With Zero Purchase
Rank Based on Criteria (weekly purchases)
Produce
The results for surveyed Puerto Rican consumers reveal the ranking of 10 select Puerto
Rican crops (Table 4.4). Three crops received an Overall Rank of 8 or higher, but none of
these consistently ranked 8 or higher in all categories. As a result, none of these three
crops were systematically eliminated from the candidacy list.

Table 4.4. Puerto Rican Ethnic Produce Survey Ranking
0.10107.751010110Verdolaga
0.4397.758959Calabacita
0.5187.257778Berenjena
0.5676.759837ChileCaribe
0.7066.2555105Pepinillo
0.63566666Fava Beans
0.96454394Calabaza
1.6833.252182Cilantro
1.58233423Aji Dulce
1.74121241Batata
AvgExpen-diture
$
Overall RankAverage Rank
Volume of Produce Bought
Produce Purchase
Frequency
Mean Expenditure without Zero
Purchase
Mean Expenditure With Zero Purchase
Rank Based on Criteria (weekly purchases)
Produce
Re-evaluate Survey Rank; Consider Production Potential. Once the crops that qualified
for systematic elimination from production research were removed, the remaining crops
were re-evaluated with consideration for production interests to either justify including
them as production candidates or remove them accordingly. The analysis considered the
incremental research benefits of comparisons of similar crop types and the marketplace
and/or profitability potential, among other considerations.
In the case of Chinese crops, the removal of relatively low demand crops resulted in a list
of production candidates with significant research potential, as relatively little historic
research exists on local production of these crops.
The proposed Asian Indian production crop candidates contained three types of leaves,
but the inclusion of more than two types of leaves was not warranted from a production

perspective (i.e. limited uniqueness of potential research findings associated with these
two crops of similar cultural production methods relative to the other candidates in the
group). The relative commodity nature of these leaves drove the decision to eliminate
one of the leaf varieties. Fenugreek remained as a candidate, given it was ranked in the
top three based on Overall Rank as well as three of the four individual rank criteria. A
pre-existing local production interest in mint, given its additional non-food/religious
demand and non-spice uses (i.e. additional marketing potential), fueled the decision to
retain it as a production candidate. Consequently, mustard leaves were eliminated from
production candidacy.
The Mexican production candidate list contained multiple types of peppers. Despite the
limited incremental research benefits associated with an abundance of crops of similar
species, there were no existing supply-side concerns which distinguished one pepper
from another in terms of production preferences. Therefore, no crops were removed from
the production list solely on the basis of limited (individual) production potential. Rather,
the subsequent review of a combined list of peppers from both Hispanic groups of study
(i.e. Mexican and Puerto Rican), resulted in a consolidated list with fewer pepper
candidates (i.e. without duplicates or redundant ‘hot’ or ‘sweet’ types).
The Puerto Rican production candidates required further refinement, as no crops were
systematically eliminated on the basis of relatively low demand. Each of the ten
surveyed crops was closely scrutinized on the basis of supply and profit potential. Fava
beans were considered to have relatively limited supply (profit) potential, given the
relatively short season for local production and the history of limited successes by local
growers who have experimented with small-scale production of this crop. As a result,
fava beans were eliminated from production candidacy. The remaining crops were
reviewed for duplication across the Hispanic ethnic groups (i.e. along with the Mexican
list) to arrive at a proposed production candidate list of 7 crops for each group.
Consolidate/Maximize Across Ethnicities. Additional deletions were made to the
remaining crop lists for each ethnicity to eliminate duplication across ethnic groups and

maximize production research efforts. This consolidation of candidates from the four
ethnic lists resulted in a combined list of 28 unique crop candidates and was conducted in
a manner that balanced 7 crops per ethnic group (by design, such that survey rank was
not a factor in the manner, or order, in which duplicates were removed from a particular
ethnic group, as both groups stand to benefit from subsequent production research).
Specifically, the following additional eliminations of crops were made;
• Ridged gourd/luffa was removed from the Chinese list (duplicate of Indian list)
• Bitter gourd was removed from the Asian Indian list (duplicate of pepinillo on the
Puerto Rican list)
• Cilantro was removed from the Mexican list (duplicate of Puerto Rican list)
• Calabaza and calabacita were removed from the Puerto Rican list (duplicates of
Mexican list)
Re-prioritize Crops for Production. The result of the production research prioritization
process based upon primarily survey demand, combined with production considerations,
yielded the targeted list of 28 (of 42) crops recommended for production trials (Table
4.5).
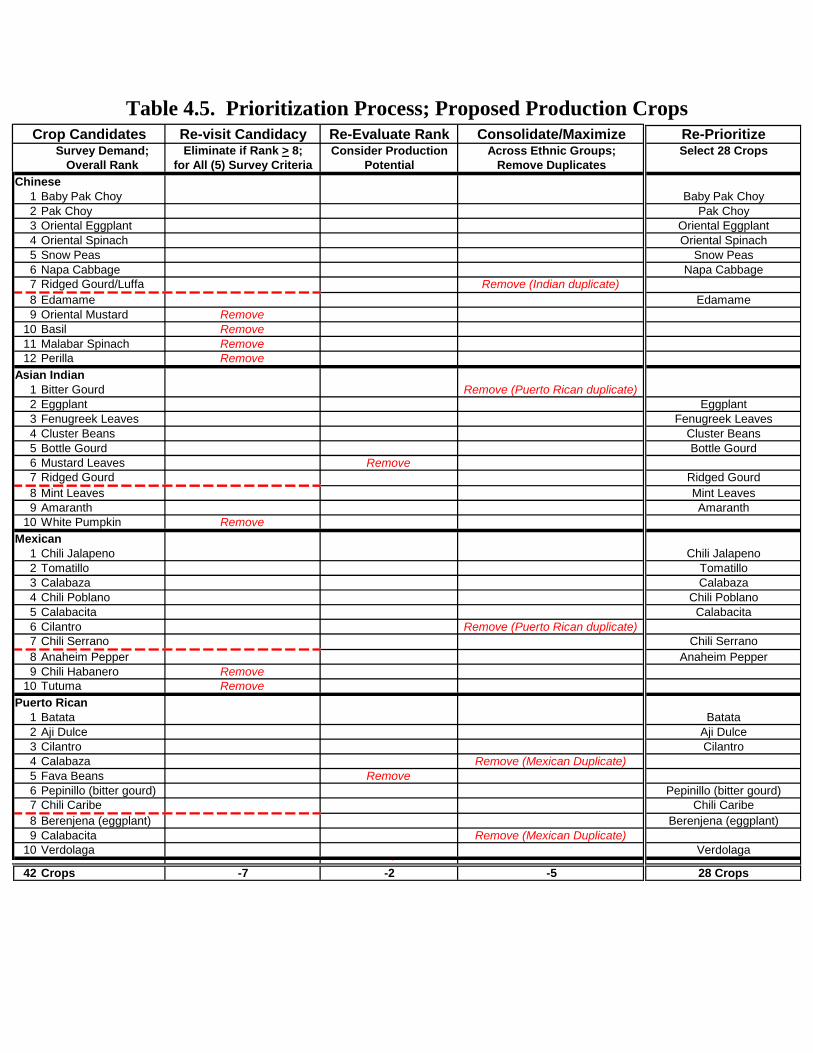
Table 4.5. Prioritization Process; Proposed Production Crops Crop Candidates Re-visit Candidacy Re-Evaluate Rank Consolidate/Maximize Re-Prioritize
Survey Demand; Eliminate if Rank > 8; Consider Production Across Ethnic Groups; Select 28 CropsOverall Rank for All (5) Survey Criteria Potential Remove Duplicates
Chinese1 Baby Pak Choy Baby Pak Choy2 Pak Choy Pak Choy3 Oriental Eggplant Oriental Eggplant4 Oriental Spinach Oriental Spinach5 Snow Peas Snow Peas6 Napa Cabbage Napa Cabbage7 Ridged Gourd/Luffa Remove (Indian duplicate)
RemoveRemoveRemoveRemove
Remove (Puerto Rican duplicate)
Remove
Remove
Remove (Puerto Rican duplicate)
RemoveRemove
Remove (Mexican Duplicate)Remove
Remove (Mexican Duplicate)
8 Edamame Edamame9 Oriental Mustard
10 Basil11 Malabar Spinach12 Perilla
Asian Indian1 Bitter Gourd2 Eggplant Eggplant3 Fenugreek Leaves Fenugreek Leaves4 Cluster Beans Cluster Beans5 Bottle Gourd Bottle Gourd6 Mustard Leaves7 Ridged Gourd Ridged Gourd8 Mint Leaves Mint Leaves9 Amaranth Amaranth
10 White PumpkinMexican
1 Chili Jalapeno Chili Jalapeno2 Tomatillo Tomatillo3 Calabaza Calabaza4 Chili Poblano Chili Poblano5 Calabacita Calabacita6 Cilantro7 Chili Serrano Chili Serrano8 Anaheim Pepper Anaheim Pepper9 Chili Habanero
10 TutumaPuerto Rican
1 Batata Batata2 Aji Dulce Aji Dulce3 Cilantro Cilantro4 Calabaza5 Fava Beans6 Pepinillo (bitter gourd) Pepinillo (bitter gourd)7 Chili Caribe Chili Caribe8 Berenjena (eggplant) Berenjena (eggplant)9 Calabacita
10 Verdolaga Verdolaga442 Crops -7 -2 -5 28 Crops

This re-prioritized list contained four species that had significant cross-ethnicity demand
that were deemed high production research priorities as a result. Specifically, the four
species, ethnic groups consuming them, and corresponding crops in this list were as
follows:
Cucurbits (Cucurbita)
Cucurbits were in demand by all four ethnic groups of study. A total of five
unique cucurbits were included in the consumer survey. These were categorized
into two cultural production types, trellised vs.non-trellised, for production plot
planning purposes. The two trellised cucurbits included luffa (ridged gourd, in
demand by both Asian groups) and bitter melon (bitter gourd/pepinillo in demand
by Asian Indians and Puerto Ricans, respectively). There were three non-
trellised: bottle gourd (in demand by Asian Indians), calabaza squash (Hispanic
winter squash), and zucchini (calabacita; Hispanic summer squash).
Eggplant (Solanum)
Eggplants were in demand by three groups (Chinese/Asian Indian/Puerto Rican).
Three types of eggplant were included in the candidate list (Oriental eggplant var.
Orient Express, Asian Indian eggplant var. Raavayya variety and
Berenjena/Dominican eggplant).
Chili/Peppers (Capsicum)
Peppers were in demand by two groups (Mexican/Puerto Rican). A total of six
types of pepper were included in the candidate list (chili jalapeno, chili poblano,
chili Serrano, chili caribe, aji dulce, and Anaheim pepper).
Coriander (Coriandrum)
Coriander/cilantro, in demand by two groups (Mexican/Puerto Rican), was
included in the candidate list.

4.4. Develop Production Plot Plans; 12 Research and 16 Demo Crops Identify Top Priority Crops for Replicated Trials. Logistical concerns (space, labor and
budget constraints) drove decisions to limit the number of replicated crops to twelve and
include crops of similar species suited for production on black plastic mulch with drip
irrigation systems. Species with cross-ethnic demand were given higher priority for
replication to maximize the return on research efforts. Fifteen crops on the list had cross-
ethnic demand.
Coriander/cilantro was the only crop with cross-ethnic demand that did not have two or
more types to compare, and along with the Chinese greens, is already grown extensively
by New Jersey and Florida growers. Ultimately, because cilantro and the Chinese greens
are usually grown in bare-ground, wide beds with overhead irrigation, these crops were
placed in demonstration plots rather than being replicated. Four cucurbits, three
eggplants, and two Capsicum peppers with cross-ethnic demand would be replicated.
Cucurbits. Lack of seed availability drove the final decisions of which (four) cucurbits to
include in the replicated plots. Appropriate seeds for calabaza and calabacita were not
found in time for the production trial season. Calabacita was shifted from a replicated to
a demonstration plot plan since a true seed for this variety was not obtained and another
zucchini variety was substituted. There was no available seed substitute for calabaza so it
was replaced by a second luffa (smooth luffa; in addition to the ridged gourd/luffa) to
allow for luffa comparisons. The remaining cucurbits, bitter gourd and bottle gourd,
were included the replicated trials.
Eggplants. Appropriate seeds for berenjena (Dominican eggplant) were also not secured
in time for trials. Another Asian Indian eggplant variety (Bharta) was substituted and
entered into replicated trials, along with the Oriental eggplant and Raavayya variety.
Peppers. The number of Capsicum peppers to be replicated was reduced from six
varieties to two due to the lateness of obtaining seed. Qnly the pepper types with the
highest overall survey demand rank from each of the Mexican and Puerto Rican lists

were included (chili jalapeno and aji dulce, respectively) representing one hot and one
sweet variety.
Additional High-Demand Crops. Despite not using the most appropriate production
system for them, the crops with the highest overall survey demand/rank from each of the
Chinese, Mexican, and Puerto Rican groups were added to the replicated plots (the
highest ranked crop from the Asian Indian list was already included) to ensure that the
crops with the highest demand from each list were included, once the cross-ethnic list had
been exhausted. These three additional crops completed the list of twelve crops to be
included in replicated trials.
Develop research and demonstration crop plot plans. A recommended plot plan,
inclusive of twelve replicated crops and sixteen demonstration crops (ten specified crops,
with additional space for six ‘cooperator’s choice’ crops), was developed to permit the
statistical inclusion of data across locations for comparative analyses. It also allowed
field participants at each site to research crops and/or varieties that might be particularly
relevant in their local area.
A process of elimination was used to arrive at ten crops to be included in demonstration
trials at all sites. The same underlying factors that supported the decisions for replicated
trial selections also contributed to this process: incremental research benefits, seed
availability, and survey demand. Seed/plant availability was the limiting factor for
several of the pepper types and cluster beans as appropriate varieties were not found in
time for the production trial season. Amaranth and verdolaga were excluded due to low
demand relative to the remaining proposed production crops (illustrated in Table 4.2 and
Table 4.4, respectively). The remaining ten proposed crops were selected for
demonstration plots at every site along with the twelve previously identified replicated
crops (Table 4.6).

Table 4.6. Selected Crops for Production Plots (by Ethnic Group; Research vs. Demonstration)
Ethnic Group
Plot Type Ethnic Crop Name Scientific Name
Chinese Research Baby Pak Choy Brassica rapa L. ssp chinensis Oriental Eggplant Solanum melongena L. Smooth Luffa Luffa aegyptiaca Mill. (or L. cylindrica (L) M. Roemer) Demo Edamame Glycine max (L.) Merr.
Napa Cabbage Brassica rapa L. ssp chinensis
Oriental Spinach Spinacia oleracea L.
Pak Choy Brassica rapa L. ssp chinensis
Snow Peas Pisum sativum L. var. macrocarpon
Asian Indian Research Bottle Gourd Lagenaria siceraria (Mol.) Standl. Eggplant (Raavayya) Solanum melongena L. var. Raavayya Eggplant (Bharta) Solanum melongena L. var. Bharta Ridged Gourd Luffa acutangular (L.) Roxb. Demo Fenugreek Leaves Trigonella foenum-graecum L.
Mint Leaves (Spearmint) Mentha spicata L. Mexican Research Chili Jalapeno Capsicum anuum L. Tomatillo Physalis philadelphica Lam. (or P. ixocarpa Brot.) Demo Calabacita Cucurbita pepo L.
Chili Pablano/Ancho Capsicum anuum L. Puerto Rican Research Aji Dulce Capsicum chinense Jacq Batata Ipomoea batatas ( L.) Lam. Pepinillo/Bitter gourd Momordica charantia L.
Demo Cilantro/Coriander Coriandrum sativum L.

5. ETHNIC CROP PRODUCTION AND RESEARCH PROGRAM
After completing the first phase of the ethnic produce project related to consumer survey
results, the second phase focused on food crop production research and demonstration.
The four primary objectives of this phase were to;
1) establish a common set of field demonstration and research plots in each
collaborating state;
2) demonstrate and evaluate a variety of ethnic crops grown at each site;
3) conduct case-studies of specialty-ethnic produce growers; and
4) communicate ethnic crop production information to advisors and growers via
presentations, tours, websites, fact sheets, articles, and other forms of
informational literature.
5.1. Production Trials Trial Locations and Evaluation Parameters. For the 2006/07 trials, demonstration and
research crops, selected as previously described, were to be established at six sites
located in three states along the East Coast: two in Florida, one in Massachusetts, and
three in New Jersey.
Crop quality and yield parameters were developed in order to make recommendations for
geographic sequencing of production, by month/season, to sustain a twelve month
production supply in the eastern United States.
Summer 2006 demonstration and research trials were established in Massachusetts and
New Jersey on research farms. Commercially available cultivars of the selected crops
were grown following standard commercial production practices in a randomized plot
design including one replication of demonstration crops and 3 to 4 replications of
research crops at each site. Crop quality and yield parameters were measured and will be
evaluated statistically to determine suitability for commercial production. Special

attention will be paid to variations in yield and quality of produce as may be affected by
season and geographic location. Winter production intended to begin in Florida in early-
2007 has been postponed to consider redesigning the research plots to obtain more useful
information. Within the limitations of the grant, the trials will be conducted at each
location for two seasons.
5.2. Case Studies Cooperating growers of specialty and/or ethnic crops will be identified in each
collaborator’s area. One or two will be selected to participate in a full-farm case study of
their business. The case study analysis will compare farm size, number of crops and
rotations, primary market(s) and selling methods, gross income, amount of labor used,
and the owner’s perceptions of ethnic crop markets in order to ascertain barriers to and
opportunities for production and marketing of ethnic produce.
5.3. Outreach Results of the production trials and case studies will be presented at appropriate
professional and trade conferences, included in journal and trade publications, and
through media outreach to growers and ethnic consumers. Professional and trade
conference affiliations to-date include presentations and corresponding papers in
associated proceedings at the American Society of Horticultural Sciences National
Conference, the New Crops and New Uses 6th Annual Symposium, and numerous
extension meetings and trade shows throughout the East Coast (e.g. SC, PA, NJ, DE,
NY). PowerPoint presentations and posters have been developed for outreach to local
vegetable growers to communicate information from these ethnic crop studies providing
them with demand assessments in order to a adopt market-first approach to crop
production. These outreach tools provide graphical consumer data, identify specific
ethnic crops with significant ethnic consumer demand, and promote alternative/niche
marketing.

6. CONCLUSIONS AND RECOMMENDATIONS FOR FURTHER RESEARCH
The approach outlined in this paper uses a detailed market driven assessment and then
custom tailors field production research and supportive applied studies to bolster and
drive the market study. Such a model is often discussed but rarely practiced. The
approach described provides a model to bridge the gap between consumer, distributors
and growers. This strategic approach to new crop introduction provides the needed
research support to commercial growers linking the production research to specific
consumer demands. Information from the production trials will be combined with case
study findings to make final crop recommendations and communicated accordingly to
East Coast farmers. Completion of the second phase of the study is targeted for 2009 to
accommodate the postponed Florida trials and still allow for two seasons in all three
states of study.

References Bureau of Labor and Statistics (BLS), 2004. Consumer Expenditures Survey. United
States Department of Commerce. Washington, DC. http://bls.gov/ces/home.htm Govindasamy, R., A. Nemana, V. Puduri, K. Pappas, B. Schilling, J.E. Simon, R.
VanVranken, L. Brown, 2006. Demographics and the Marketing of Asian Ethnic Produce in the Mid-Atlantic Sates, NJ Agricultural Experiment Station, Rutgers University. NJAES P-029031-06. May 2006.
Govindasamy, R., A. Nemana, V. Puduri, K. Pappas, 2006. Ethnic Produce Marketing in
the Mid-Atlantic States: Consumer Shopping Patterns and Willingness-to-Pay Analysis. Choices – The Magazine of Food, Farm, and Resource Issues. 4th Quarter 2006. Vol. 21. No. 4. pp. 237-241.
http://www.choicesmagazine.org/2006-4/produce/2006-4-07.htm Mendonca, Raquel U. de, M. Moreira, F. Mangan, and T. Brashear. 2006 Production and
Marketing of New Eggplant Varieties for New Markets. UMass Vegetable Notes. Vol. 17. No. 3. pp. 1-4.
Produce Marketing Association (PMA) 2006. Hispanics, Asians and Fresh Produce.
http://www.pma.com Sciarappa, W. 2001. Growing Ethnic Vegetables with Plasticulture. Vegetable Growers
News. April 2001. Volume 35, No. 4. pp. 32-33. Sciarappa, W. 2003. Heritage Crop Research at Rutgers. Proceedings National
Association of County Agricultural Agents. July 2003. p. 122. Tubene, S. 2001. Market Potential for Ethnic Produce in the Mid-Atlantic Region.
Maryland Cooperative Extension, University of Maryland, College Park-Eastern Shore.
U. S. Census, 2000. United States Department of Commerce. Washington, DC. U. S. Census, 1990. United States Department of Commerce. Washington, DC.

Appendix: Ethnic Consumer Survey Questionnaire Ethnic Produce Consumer Survey Hello, I am calling on behalf of Rutgers University and the United States Department of Agriculture. <Language and ethnicity determination> We are conducting a survey to understand the trends in Ethnic consumers’ fruits and vegetable purchases.
May I speak with the principal grocery shopper in your household? “N/A”: “Is there a time when he/she will most likely be available?” <Record and re-attempt> “No”: “Thank you and have a pleasant day/evening” <Terminate call> <New interviewee>: Repeat above then continue below <Currently speaking>: Continue with, “Then please be aware that…”
Your responses will remain anonymous. The information you provide will not be linked to you personally, but rather, will be combined with the responses of the other individuals that participate in the survey. Your voluntary participation will assist in the assessment and response to <Asian Indian/Chinese/Mexican/Puerto Rican> consumer trends and preferences. It will take approximately five to ten minutes to complete this survey. May I proceed with asking you some questions about your fruits and vegetable purchases? Y/N
“Yes”: Proceed to questionnaire “No”: “Thank you and have a pleasant evening” <Terminate call>
______________________________________________________________________________________________ 1a. Have you purchased any <Ethnic group> fresh fruits or vegetables over the
past 12 months? 1.1 Yes 2.1 No
“Yes”: Proceed to question #2 “No”: Follow-up with question 1b;
1b. What are your reasons for NOT purchasing? Please provide all reasons that contribute to your decision NOT to purchase. <If necessary, prompt/code all that apply> 1.1 Do not like <Ethnic group> produce 4.1 Closest ethnic outlet
is too far 2.1 Lack of availability in American store5.1 No ethnic
store/outlet available 3.1 Poor selection in American store 6.1 Other <”Please
specify”>_________
Go to question #12, record response, and close with “Since you have not purchased <Ethnic group> fresh fruits or vegetables over the past 12 months, that completes our survey. Thank you for your valued participation in this study.”
2. Over the course of the year, how often do you typically purchase <Ethnic
group> fruits and vegetables within a month? XXXX times/visits
3. On average, how much do you spend on <Ethnic group> fruits & vegetables per visit? $XXX.XX
39

4. On average, how much do you spend for all of your fruits & vegetables, in a month? $XXX.XX
5. Where do you tend to buy <Ethnic group> fruits & vegetable during the course
of the year? Please indicate all places, even if only available seasonally, from the following: <Code all that apply>
1.1 Typical American grocery stores 4.1 On-farm markets or roadside stands
2.1 Ethnic grocery stores 5.1 Other <”Please specify”>_________
3.1 Community farmers' market 6. What portion of your <Ethnic group> fruits & vegetables are purchased at
typical American grocery stores? Would you say, “ALL, MOST, SOME, or NONE”? <If necessary, provide examples of “American grocery stores” such as; “A&P, Albertsons/ACME, Food Lion, Foodtown, Piggly Wiggly, Sam’s Club/Walmart, and Wegmans” > 1. 1 All 2.1 Most 3.1 Some 4.1 None
7. How close to your home is the nearest <Ethnic group> grocery store or
market? XXXX miles <If necessary, encourage to approximate, or code:> 1 Not aware of such a store w/in 60 miles
8. I am now going to read you, in your language of origin, the names of some
<Ethnic group> fruits and vegetables. I will ask you for the quantity that you buy per week and the typical price that you pay for the item, regardless of where you purchase.
<Respondent purchase data is to be collected and recorded, by produce item, as follows;
Read first name listed for item. List alternate names, as needed, until respondent recognizes item. If necessary, prompt with “pounds, bunches, or numbers”. Code response accordingly. If necessary, prompt with “either price per unit OR total purchase cost”. Code as appropriate; only one of the two (price or purchase cost) need be recorded, as it will be used to estimate the other.>
No: Name Quantity/Week Price/Unit Total Purchase Cost
1 Lbs/bunch/numbers
2 Lbs/bunch/numbers
3 Lbs/bunch/numbers
4 Lbs/bunch/numbers
5 Lbs/bunch/numbers
6 Lbs/bunch/numbers
7 Lbs/bunch/numbers
8 Lbs/bunch/numbers
9 Lbs/bunch/numbers
10 Lbs/bunch/numbers

I am going to read to you a list of attributes, and ask you to rate the importance of each in terms of your decision to shop for and purchase <Ethnic group> fruits and vegetables. 9. Please respond to each of the following with whether the attribute is “VERY, SOMEWHAT, or NOT” important: <If necessary, repeat categories and/or define attribute as indicated> Very Somewhat Not important Unsure a) Store Availability (Location/Season) 1.1 2.1 3.1 4.1 b) Language (Spoken/Understood/Labels/Ads) 1.1 2.1 3.1 4.1 And specifically, in terms of the fruits and vegetables: c) Selection (Variety/Origin) 1.1 2.1 3.1 4.1 d) Freshness (Ripeness/Maturity) 1.1 2.1 3.1 4.1 e) Quality (Taste/Nutrition/Shelf-life) 1.1 2.1 3.1 4.1 f) Price (per relative unit) 1.1 2.1 3.1
4.1 g) Packaging (Type or pack size/units) 1.1 2.1 3.1
4.1 h) Other <”Please specify”>:_______ 1.1 2.1 Now I will read you a few of those same attributes, and ask you to compare <Ethnic group> outlets to typical American or conventional establishments, based on each attribute. 10. Please respond to the following with whether you find the <Ethnic group>
outlets to be “BETTER, the SAME, or WORSE” than the conventional establishments, in terms of their fruits and vegetables: <If necessary, repeat categories and/or define as in #9 and below>
Better Same Worse Unsure
a) Selection is 1.1 2.1 3.1 4.1 b) Freshness is 1.1 2.1 3.1 4.1 c) Quality is (Includes packaging) 1.1 2.1 3.1 4.1 d) Price is 1.1 2.1 3.1 4.1 e) Packaging (Type or pack size/units) 1.1 2.1 3.1 4.1 f) Other <”Please specify”>:_______ 1.1 2.1 3.1 4.1 11. Are you willing to pay more for <Ethnic group> fruits and vegetables than
the comparable American or conventional substitutes, and if so, what percent more? XXXX percent (“No” =0) <If necessary, prompt with, “Would you say approximately 5, 10, 15, 20%, or more
than 20%?”>

12. If made available to you, would you be “MORE willing to buy, INDIFFERENT to, or LESS willing to buy” <Ethnic group> fruits and vegetables that are:
<If necessary, repeat answer choices:> More willing Indifferent Less willing Unsure
a) Sold in <Ethnic group> outlets 1.1 2.1 3.1 4.1 b) Grown on local farms 1.1 2.1 3.1 4.1 c) Organically grown 1.1 2.1 3.1 4.1 d) Genetically modified 1.1 2.1 3.1 4.1 d) Labeled according to country of origin 1.1 2.1 3.1 4.1 e) Recently introduced or new to market 1.1 2.1 3.1 4.1
13. Which types of advertisements would influence your decision to purchase
<Ethnic group> fruits & vegetables? Please indicate all types, even if not currently available, from the following: <Code all categories that apply, after providing examples listed>
1.1 Out-of-store ads (media including radio, TV, newspaper, and on-line)
2.1 Visible-from-road ads (such as billboards and on-farm or roadside stands promotions)
3.1 On-site or in-store ads (displays, demos, brochures, posters/banners, or announcements) 4.1 Point-of-purchase ads (price cards/tags or produce identification; labels/stickers) 5.1 None 6.1 Other <”Please specify”>_________
14. Do you grow <Ethnic group> fruits or vegetables for consumption at home? 1.1 Yes 2.1 No 15. Are you a vegetarian? 1.1 Yes 2.1 No The following information concerning you and your household are necessary for classification purpose. Again, your answers will be kept strictly confidential and used only to help us interpret the aggregate survey results. 16. Is your neighborhood URBAN, SUBURBAN, or RURAL? 1.1 Urban 2.1 Suburban 3.1 Rural 17. How many years have you been living in <City, State>? XXXX years 18. Including yourself, how many people are in your household? XXXX people 19. How many of the people in your household are age 17 or less? XXXX people 20. Which of the following ranges includes your age: <Read options> 1.1 Less than 20 4.1 51 to 65 2.1 21 to 35 5.1 Over 65 3.1 36 to 50

21. What is the highest level of education equivalent that you have completed: <Read options> 1.1 Less than 12th grade 3.1 4 year college degree 2.1 High school graduate 4.1 Post graduate or advanced degree 3.1 2 year college degree 22. Which of the following best describes your current occupation? <Read options>
1.1 Employed by someone else 4.1 Full-time Homemaker 2.1 Self-employed 5.1 Unemployed 3.1 Retired 6.1 Other <”Please specify”>:_______
23. Which of the following ranges includes the annual-income of your household before taxes: 1.1 Less than $20,000 4.1 $60,000 to $79,999 7.1 $125,000 to $149,999 2.1 $20,000 to $39,999 5.1 $80,000 to $99,999 8.1 $150,000 to $199,999 3.1 $40,000 to $59,999 6.1 $100,000 to $124,999 9.1 $200,000 or more 24. Which of the following best describes your current marital status? <Read options> 1.1 Married 4.1 Separated 2.1 Single 5.1 Widower
3.1 Divorced 6.1 Other <”Please specify”>:_______ 25. <Code based on interviewer’s determination> 1.1 Female 2.1 Male 26. Do you speak your ethnic language? <If necessary, prompt to answer with “Yes” or “No”>
1.1 Yes 2.1 No 3.1 Somewhat/very little <Only if indecisive> 27. Where were you born?
1.1 U.S. 2.1 <Country of Ethnic origin> 3.1Other (please
specify):________ “US”: (Skip question #28) Read final statements and then terminate call <Country of Ethnic origin> or “Other”: proceed to question #28
28. How old were you when you arrived in the US? XXXX Years Our survey is now complete. Thank you for your valued participation in this study. <If necessary at any time during the survey, provide project sponsor information and contacts below:>

Rutgers University contact: Dr. Ramu Govindasamy PHONE: (732)932-9171,x-254 E-MAIL: [email protected]
Sponsoring organization: Department of Agricultural, Food & Resource Economics Rutgers, The State University of New Jersey 55 Dudley Road New Brunswick, New Jersey 08901-8520 PHONE: 732/932-9155 FAX: 732/932-8887 WEBSITE: www.aesop.rutgers.edu/~agecon Partner Sponsoring Organization: Unites States Department of Agriculture (USDA) WEBSITE: www.usda.gov OR USDA Agricultural Research Service 5601 Sunnyside Avenue Beltsville, Maryland 20705-5128 WEBSITE: www.ars.udsa.gov