survey of accountancy in generally ... › download › pdf › 159487913.pdfgenerally accepted...
TRANSCRIPT

SURVEY OF ACCOUNTANCY IN GENERALLY ACCEPTED ACCOUNTING PRINCIPLES AND FINANCIAL STATEMENT ANALYSIS
by
Evan M. Turner
A thesis submitted to the faculty of The University of Mississippi in partial fulfillment of the requirements of the Sally McDonnell Barksdale Honors College in conjunction with
the E.H. Patterson School of Accountancy.
Oxford, MS
May 2018
Approved by:
________________________________
Advisor: Dr. Vicki Dickinson
________________________________
Reader: Dr. Mark Wilder, Dean, Patterson School of Accountancy

ii
©2018
Evan M. Turner
ALL RIGHTS RESERVED
iii
ABSTRACT
EVAN MARCUS TURNER: Survey of Accountancy in Generally Accepted Accounting Principles and Financial Statement Analysis (Under the direction of Dr. Vicki Dickinson)
This paper surveys the current landscape of accountancy following U.S. Generally
Accepted Accounting Principles through a series of twelve case studies spanning
different areas of financial reporting, taxation, financial statement analysis, and research.
Several cases involve research using sections from the FASB Codification, financial
statement analysis using ratios, and commentary on the impact from the perspective of
users of financial statements. The cases span several areas of financial accounting
including leases, stockholders equity, inventory, and deferred tax assets/liabilities in
order to offer a broad perspective on the current landscape of financial reporting through
individual, focused cases.
The cases within this paper were facilitated through the Accountancy 420 course,
instructed by Dr. Vicki Dickinson. Accountancy 420 is a Sally McDonnell Barksdale
Honors College Course housed in the Patterson School of Accountancy. The course met
once each week throughout the academic calendar year in order to guide progress through
the cases and provide feedback on each response.

iv
SUMMARY OF FINDINGS AND IMPACT
The guided thesis in accountancy offered the opportunity to examine several
different areas of financial accounting and financial reporting as facilitated by individual
case studies focusing on each area individually. This vehicle for surveying the current
landscape accountancy under U.S. Generally Accepted Accounting Principles provided a
valuable opportunity to interact with specific accounting and financial reporting issues,
gain experience with research in authoritative literature in the field of accountancy, and
contribute to discussions and higher-level analysis of financial reporting from the
perspective of an investor or other user of financial statements. This guided thesis
offered an opportunity to interact with material and delve deeper into specific topics in
accountancy that I otherwise would not have been afforded in my tenure as an
undergraduate at the University of Mississippi.
Among the most useful endeavors in completing this thesis was experience
navigating and interpreting standards in the Financial Accounting Standards Board
(FASB) Codification. Several cases draw upon specific language from the Codification
in order to interpret and apply the appropriate accounting and financial reporting
treatment to the specific situation. This was especially useful because it bridged the gap
between theoretical and conceptual accounting offered in a classroom setting and real-
world practice where the standards are actually being implemented. I found this to be
particularly useful in understanding what the Codification was, how to research an area to
determine proper accounting and financial reporting treatment, and gaining sufficiency in
understanding how accounting decisions impact financial reporting and presentation.
v
Another area that was particularly useful was delving into specific areas of
accounting that were particularly complex or did not receive as much coverage in the
standard curriculum of the undergraduate accounting program. An example of this is the
Zagg Case dealing with deferred tax assets and deferred tax liabilities. In a classroom
setting, this is a concept that is discussed, and the entries are taught, but the perspective
for how they are used in practice and the potential impact to investors in not within the
scope of a typical undergraduate course in financial accounting. Conversely, in the field
a client may have so many deferred tax assets or deferred tax liabilities that it would be
incredibly difficult to understand their calculations and implications in a brief period of
time. The case, however, offered a vehicle that provided the perspective from a company
and their financial reporting process without becoming too complex to break down and
analyze in detail. This was useful in extending the learning of the classroom to a more
practical understanding while maintaining brevity and conciseness that may not be found
in the field.
Finally, throughout the thesis process, I have gained valuable experience in
writing proficiency, time management, research skills, and communication. Several of
the cases involved communication between other honors college students, discussions
facilitated during the course period, and individual research to refine analysis of specific
areas. The guided thesis also typically occurs during the junior year of the accountancy
program, which is a demanding time given the balance between the traditional course
load, recruiting for public accounting internships and leadership programs, and
maintaining involvement in organizations on campus. The guided thesis offered a setting
to maintain accountability toward meaningful progress on the thesis each week with
vi
regular feedback and interaction to discuss each case. This was a valuable experience in
growing as a student and professional with regard to time management and
communications skills.
As a whole, I believe that the process of completing this undergraduate thesis as a
student in the Sally McDonnell Barksdale Honors College and the Patterson School of
Accountancy has been one of my most valuable academic endeavors. I have grown as a
student, scholar, and professional as a result, and I am grateful to have had this
experience during my undergraduate tenure at the University of Mississippi.
vii
TABLE OF CONTENTS
SECTION 1: HOME HEATERS CASE ………………………………………… 1
SECTION 1 APPENDIX ………………………………………………………… 13
SECTION 2: TOTZ CASE ……………………………………………………… 15
SECTION 3: ROCKY MOUNTAIN CHOCOLATE FACTORY CASE ……… 18
SECTION 4: INTERNAL CONTROLS………………………………………… 26
SECTION 5: INVENTORY ANALYSIS IN MANUFACTURING …………… 29
SECTION 6: WORLDCOM CASE ……………………………………………… 34
SECTION 7: TARGA CO. ……………………………………………………… 38
SECTION 8: MERCK CO. ……………………………………………………… 41
SECTION 9: XILINX, INC. ……………………………………………………… 45
SECTION 10: BIER HAUS CASE ……………………………………………… 49
SECTION 11: ZAGG, INC. ……………………………………………………… 54
SECTION 12: BUILD-A-BEAR WORKSHOP, INC. …………………………… 59
1
SECTION 1: HOME HEATERS CASE
EXECUTIVE SUMMARY
Upon analysis of the financial reporting of Glenwood Heating, Inc. and Ead’s Heating, Inc. I would recommend Ead’s Heating, Inc. as the better investment option out of the two. While many of the ratios may lead Glenwood to look like the more desirable option, Ead’s is more prepared to continue operations in the future and has shown a conservative and sustainable approach to their operations. Ead’s Heating opted to use double-declining balance to depreciate their equipment faster than the straight-line approach of Glenwood, they have secured an eight-year capital lease for their equipment while Glenwood has only secured a rental agreement through the next year, and Ead’s uses a more conservative approach to calculate their Allowance for Bad Debt.
Both companies exhibit strong performance for their first year of operations with both companies posting a positive net income, current ratios higher than 4, and working capital of over $100,000. On the surface, Glenwood shows a slightly higher net income, current ratio, and profit margin; however, Ead’s maintains higher total assets and operating income.
One of the most critical factors in choosing Ead’s Heating over Glenwood is Ead’s negotiation of a capital leasing agreement for their equipment. This lease will allow them the benefit of expensing the depreciation as well as the long term use and eventual ownership of the equipment. This makes Ead’s a much safer investment option in the long run since Glenwood has only established a rental agreement on the equipment for the next year.
For a more in-depth look, the remainder of the report details how each of their adjusting entry decisions impacted their financial statements, what their statements look like, and how they were put together. Equipped with this information, I am confident that Ead’s will be the better long-term investment.
In the following report, the general journal entries apply to both companies, and the adjusting entries reflect the areas where the companies diverge in accounting methods. Tables are included within the body of the text to show the entries as well as each company’s resulting financial statements, and supporting calculations can be found in the appendices referenced in the footnotes.
2
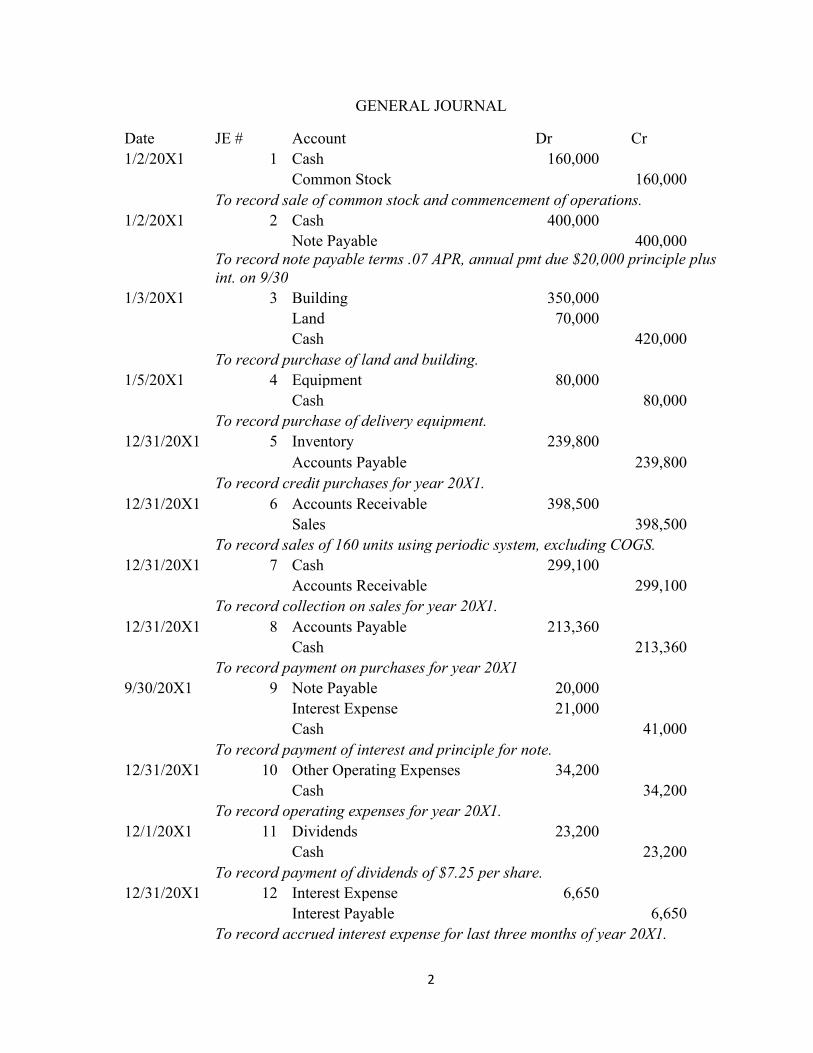
GENERAL JOURNAL
Date JE # Account Dr Cr 1/2/20X1 1 Cash 160,000 Common Stock 160,000 To record sale of common stock and commencement of operations. 1/2/20X1 2 Cash 400,000 Note Payable 400,000
To record note payable terms .07 APR, annual pmt due $20,000 principle plus int. on 9/30
1/3/20X1 3 Building 350,000 Land 70,000 Cash 420,000 To record purchase of land and building. 1/5/20X1 4 Equipment 80,000 Cash 80,000 To record purchase of delivery equipment. 12/31/20X1 5 Inventory 239,800 Accounts Payable 239,800 To record credit purchases for year 20X1. 12/31/20X1 6 Accounts Receivable 398,500 Sales 398,500 To record sales of 160 units using periodic system, excluding COGS. 12/31/20X1 7 Cash 299,100 Accounts Receivable 299,100 To record collection on sales for year 20X1. 12/31/20X1 8 Accounts Payable 213,360 Cash 213,360 To record payment on purchases for year 20X1 9/30/20X1 9 Note Payable 20,000 Interest Expense 21,000 Cash 41,000 To record payment of interest and principle for note. 12/31/20X1 10 Other Operating Expenses 34,200 Cash 34,200 To record operating expenses for year 20X1. 12/1/20X1 11 Dividends 23,200 Cash 23,200 To record payment of dividends of $7.25 per share. 12/31/20X1 12 Interest Expense 6,650 Interest Payable 6,650 To record accrued interest expense for last three months of year 20X1.

3
GLENWOOD HEATING, INC. ADJUSTING JOURNAL ENTRIES
12/31/20X1 AJE1 Bad Debt Expense 994.00
Allowance for Bad Debt 994.00 To record bad debt estimate.
12/31/20X1 AJE2 Cost of Goods Sold 177,000.00
Inventory 177,000.00
To record Cost of Goods Sold for year 20X1.
12/31/20X1 AJE3 Depreciation Expense 19,000.00
Acc. Dep. - Bldg. 10,000.00 Acc. Dep. - Equip. 9,000.00 To record annual depreciation.
12/31/20X1 AJE4 Rent Expense 16,000.00
Cash 16,000.00 To record rental of operating equipment.
12/31/20X1 AJE5 Provisions for Tax 30,914.00
Cash 30,914.00 To record estimated payment to the IRS for income tax provision.
Notes on Glenwood Heating, Inc. adjusting entries:
AJE 1: Allowance for Bad Debt is calculated based on 1% of ending accounts receivable.1
AJE 2: Cost of Goods Sold are calculated using the FIFO inventory method.2
AJE 3: Depreciation for both the building and delivery equipment are calculated using the Straight-Line Method of depreciation.3
AJE 4: Equipment rental was negotiated at a rate of $16,000 per year for the year 20X1 and 20X2.
AJE 5: Estimated payment for income tax is calculated based on 25% of income.4
EAD’S HEATING, INC. ADJUSTING JOURNAL ENTRIES
1 Calculation of Allowance for Bad Debt shown in Appendix 1.
2 Calculation of Cost of Goods Sold shown in Appendix 2.
3 Calculation of Depreciation shown in Appendix 3.
4 Calculation of income tax provision shown in Appendix 4.

4
12/31/20X1 AJE1 Bad Debt Expense 4,970 Allowance for Bad Debt 4,970 To record bad debt estimate. 12/31/20X1 AJE2 Cost of Goods Sold 188,800 Inventory 188,800 To record Cost of Goods Sold for year 20X1. 12/31/20X1 AJE3 Depreciation Expense 30,000 Acc. Dep. - Bldg. 10,000 Acc. Dep. - Equip. 20,000 To record annual depreciation. 12/31/20X1 AJE4 Leased Equipment 92,000 Lease Payable 92,000 Interest Expense 7,360 Lease Payable 8,640 Cash 16,000 Depreciation Expense 11,500 Acc. Dep. Leased Equip. 11,500 To record capital lease of equipment. 12/31/20X1 AJE5 Provision for income taxes 23,505 Cash 23,505 To record payment to IRS for income tax provision.
Notes on Ead’s Heating, Inc. adjusting entries:
AJE 1: Allowance for Bad Debt is calculated based on 5% of ending Accounts Receivable.5
AJE 2: Cost of Goods Sold are calculated using the LIFO inventory method.6
AJE 3: Depreciation for the building is calculated using the Straight Line method, and Depreciation for equipment is calculated using the Double-Declining Balance method.7
AJE 4: A capital leasing agreement was negotiated for the equipment.8
AJE 5: Estimated payment for income tax is calculated based on 25% of income.9
ANALYSIS OF ADJUSTING ENTRY DECISIONS
5 Calculation of Allowance for Bad Debt shown in Appendix 6.
6 Calculation of Cost of Goods Sold shown in Appendix 7.
7 Calculation of Depreciation shown in Appendix 8
8 Calculations of Depreciation on leased equipment and interest and lease agreement are shown in Appendix 9.
9 Calculation of Provision for Income Tax is shown in Appendix 10.

5
Glenwood Heating, Inc. and Ead’s Heating, Inc. each made different choices on how to adjust their accounts, which ultimately caused their financial statements to differ. Each of the adjusting entries, how they were treated in each company, and their impact are explained below. AJE1: In the calculation for Bad Debt, Glenwood calculated their estimation based on 1% of ending accounts receivable whereas Ead’s calculated theirs using 5% of accounts receivable. This increased expense for Ead’s causes their net income to appear lower than that of Glenwood, however with a more conservative approach, they are less likely to have unexpected losses from bad debts. AJE2: In determining Cost of Goods Sold, Glenwood uses the FIFO inventory method whereas Ead’s uses the LIFO method. FIFO is likely more accurate based on the physical movement of parts, since both companies are likely to use their oldest inventory first; however, LIFO more closely allocates the recent costs of inventory with recent sales. Again, Ead’s reports a higher expense here, causing their net income to look lower, however their method more closely matches their current inventory costs with their current sales. AJE3: For depreciation purposes, Glenwood just uses straight-line depreciation, while Ead’s uses straight-line for the building depreciation and double-declining balance for their equipment. In Ead’s case, this depreciates their equipment faster, allocating more of the expense in early years. As with the first two entries, this increased expense causes their net income calculation to be lower than that of Glenwood. AJE4: The difference in Glenwood and Ead’s on the fourth adjustment is more significant than the others. Glenwood chose to rent equipment for the year 20X1 and arranged the same rental agreement for 20X2. Ead’s negotiated a capital lease, allowing them to capitalize and depreciate the equipment over the next eight years. This entry increased Ead’s total assets as well as their total liabilities, which shifted their current ratio and debt-to-equity ration slightly unfavorably; however it allows them a consistent agreement to use the equipment over the next eight years while Glenwood only has their rental agreement planned through the next year. This long-term planning gives Ead’s more stability for long-term operation. AJE5: The estimated payment for both companies was made based on 25% of GAAP income, and since income was higher for Glenwood, their estimated payment is higher.
Using these general entries and adjusting entries for the first year of operations, the following financial statements were compiled.

6
Glenwood Heating, Inc. Income Statement
For Year Ended 12/31/20X1
Revenue 398,500.00 Cost of Goods Sold 177,000.00 Gross Profit 221,500.00 Operating Expenses Other operating expenses 34,200.00 Rent expense 16,000.00 50,200.00 Operating Income 171,300.00 Non-Operating Expenses Bad Debt Expense 994.00 Depreciation Expense 19,000.00 Interest Expense 27,650.00 Provision for Income Taxes 30,914.00 78,558.00 Net Income 92,742.00
Glenwood Heating, Inc. Statement of Changes in Stockholder's Equity
For Year Ended 12/31/20X1
Common Stock Retained Earnings
Total Stockholder's Equity
Balance on January 1 -
- -
Issued Shares for Cash
160,000.00
- 160,000.00
Net Income -
92,742.00 92,742.00
Cash Dividends -
(23,200.00) (23,200.00)
Balance on December 31
160,000.00
69,542.00 229,542.00

7
Glenwood Heating, Inc. Balance Sheet 12/31/20X1
Assets Liabilities Current Assets Accounts Payable 26,440.00
Cash 426.00 Interest Payable 6,650.00 Accounts Receivable 99,400.00 Note Payable 380,000.00
Allowance for Bad Debt (994.00) Lease Payable - Inventory 62,800.00 Total Liabilities 413,090.00
Total Current Assets 161,632.00 Equity
Non-Current Assets Common Stock 160,000.00 Land 70,000.00 Retained Earnings 69,542.00
Building 350,000.00 Total Equity 229,542.00 Accumulated Depreciation, building (10,000.00)
Equipment 80,000.00 Total Liabilities and
Equity 642,632.00 Accumulated Depreciation,
equipment (9,000.00) Leased Equipment -
Accumulated Depreciation, leased equipment -
Total Non-Current Assets 481,000.00
Total Assets 642,632.00
8
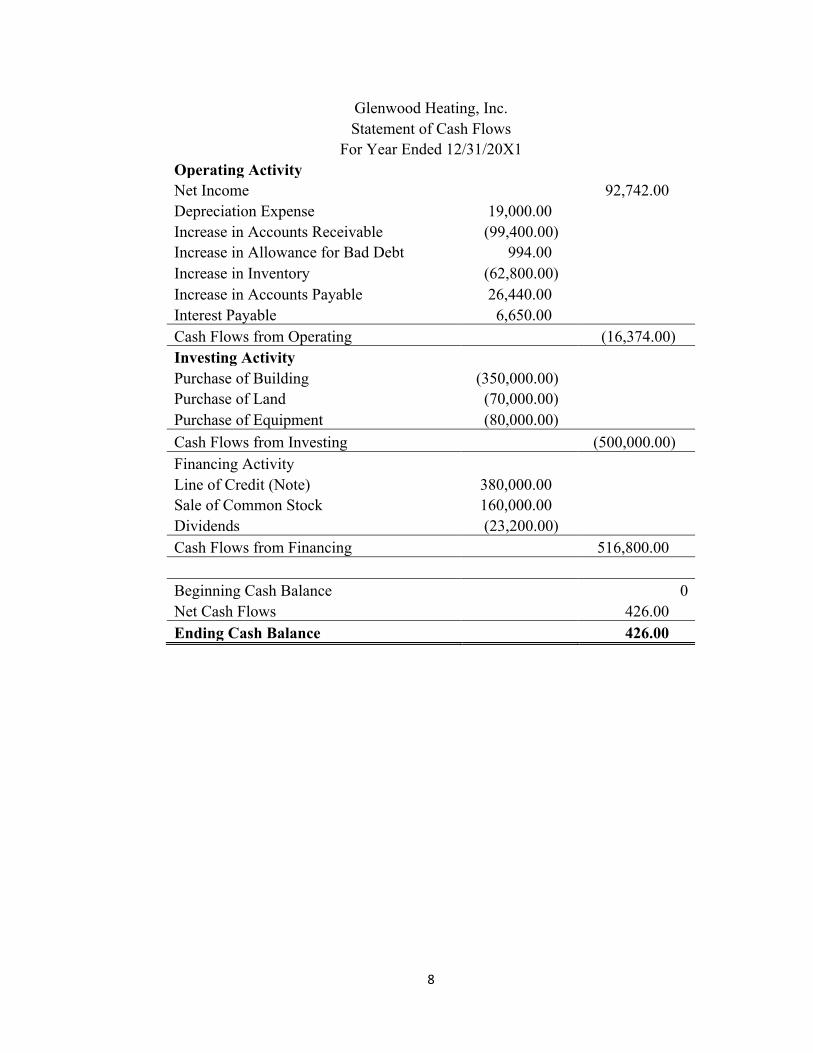
Glenwood Heating, Inc. Statement of Cash Flows
For Year Ended 12/31/20X1 Operating Activity Net Income 92,742.00 Depreciation Expense 19,000.00 Increase in Accounts Receivable (99,400.00) Increase in Allowance for Bad Debt 994.00 Increase in Inventory (62,800.00) Increase in Accounts Payable 26,440.00 Interest Payable 6,650.00 Cash Flows from Operating (16,374.00) Investing Activity Purchase of Building (350,000.00) Purchase of Land (70,000.00) Purchase of Equipment (80,000.00) Cash Flows from Investing (500,000.00) Financing Activity Line of Credit (Note) 380,000.00 Sale of Common Stock 160,000.00 Dividends (23,200.00) Cash Flows from Financing 516,800.00 Beginning Cash Balance 0 Net Cash Flows 426.00 Ending Cash Balance 426.00
9
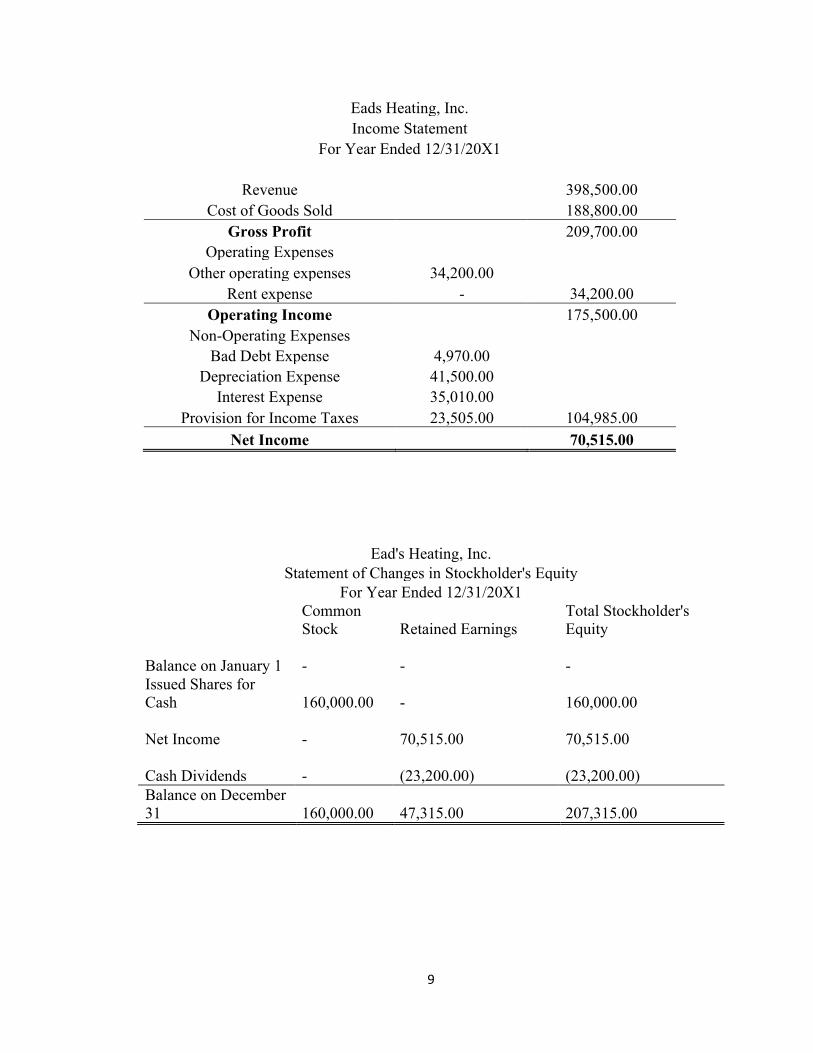
Eads Heating, Inc. Income Statement
For Year Ended 12/31/20X1
Revenue 398,500.00 Cost of Goods Sold 188,800.00
Gross Profit 209,700.00 Operating Expenses
Other operating expenses 34,200.00 Rent expense - 34,200.00
Operating Income 175,500.00 Non-Operating Expenses
Bad Debt Expense 4,970.00 Depreciation Expense 41,500.00
Interest Expense 35,010.00 Provision for Income Taxes 23,505.00 104,985.00
Net Income 70,515.00
Ead's Heating, Inc. Statement of Changes in Stockholder's Equity
For Year Ended 12/31/20X1
Common Stock Retained Earnings
Total Stockholder's Equity
Balance on January 1 -
-
-
Issued Shares for Cash
160,000.00
-
160,000.00
Net Income -
70,515.00
70,515.00
Cash Dividends -
(23,200.00)
(23,200.00)
Balance on December 31
160,000.00
47,315.00
207,315.00

10
Ead's Heating, Inc. Balance Sheet 12/31/20X1
Assets Liabilities
Current Assets Accounts Payable 26,440.00
Cash 7,835.00 Interest Payable
6,650.00
Accounts Receivable 99,400.00 Note Payable
380,000.00
Allowance for Bad Debt (4,970.00) Lease Payable
83,360.00
Inventory 51,000.00 Total Liabilities
496,450.00
Total Current Assets 153,265.00
Equity
Non-Current Assets Common Stock 160,000.00
Land 70,000.00 Retained Earnings
47,315.00
Building 350,000.00 Total Equity
207,315.00
Accumulated Depreciation, building
(10,000.00)
Equipment 80,000.00
Total Liabilities and Equity
703,765.00
Accumulated Depreciation, equipment
(20,000.00)
Leased Equipment 92,000.00
Accumulated Depreciation, leased equipment
(11,500.00)
Total Non-Current Assets 550,500.00
Total Assets 703,765.00
11
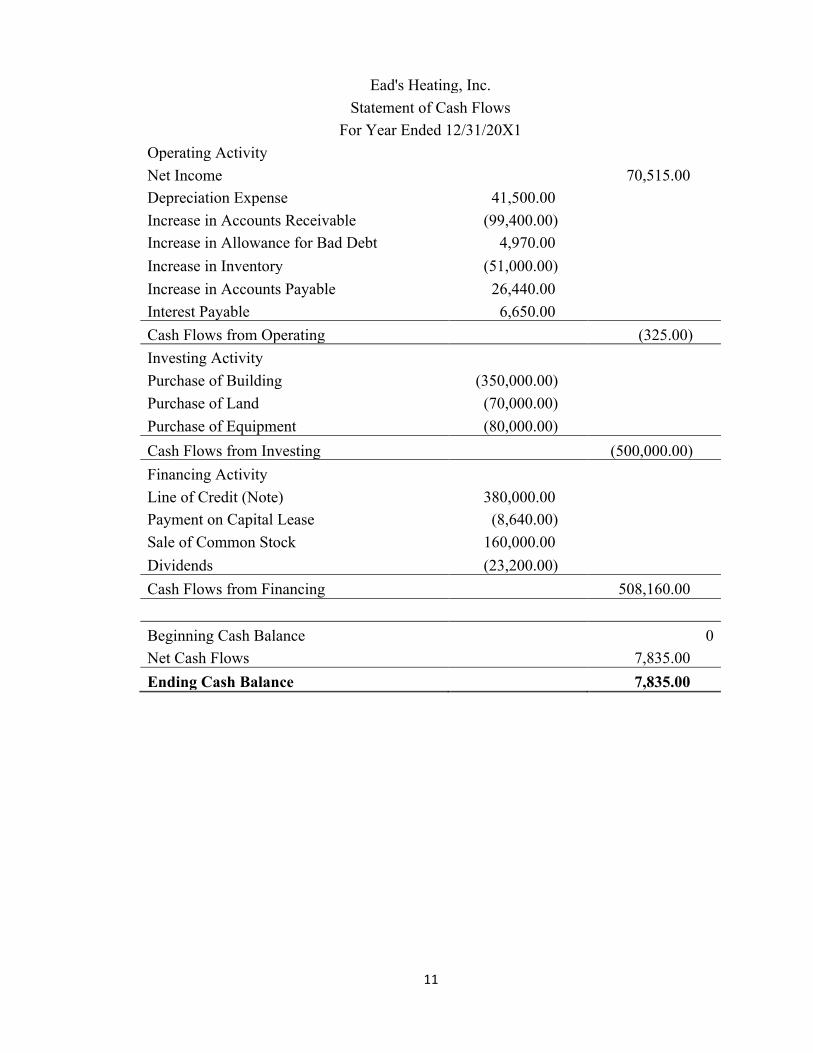
Ead's Heating, Inc. Statement of Cash Flows
For Year Ended 12/31/20X1 Operating Activity
Net Income 70,515.00 Depreciation Expense 41,500.00 Increase in Accounts Receivable (99,400.00) Increase in Allowance for Bad Debt 4,970.00 Increase in Inventory (51,000.00) Increase in Accounts Payable 26,440.00 Interest Payable 6,650.00 Cash Flows from Operating (325.00) Investing Activity
Purchase of Building (350,000.00) Purchase of Land (70,000.00) Purchase of Equipment (80,000.00) Cash Flows from Investing (500,000.00) Financing Activity
Line of Credit (Note) 380,000.00 Payment on Capital Lease (8,640.00) Sale of Common Stock 160,000.00 Dividends (23,200.00) Cash Flows from Financing 508,160.00
Beginning Cash Balance 0 Net Cash Flows 7,835.00 Ending Cash Balance 7,835.00

12
SUMMARY OF IMPORTANT VALUES
Glenwood Heating, Inc.
Ead's Heating, Inc.
Net Income 92,742.00 70,515.00 RE 69,542.00 47,315.00 Operating Income 171,300.00 175,500.00 Total Assets 642,632.00 703,765.00 Working Capital 128,542.00 120,175.00 Ratios
Current Ratio 4.8846 4.6318 Income Margin 0.2327 0.1770 Liab to Equity 1.7996 2.3947 Debt to Assets 0.6428 0.7054 Lease on Equipment No Capital Lease Capital Lease
SUMMARY
These values, calculated for each of the two companies, show how they appear to investors. On the surface, Glenwood exhibits a higher net income, higher current ratio, and lower liability to equity ratio. This seemingly makes them a more attractive investment; however, I would choose to invest my money in Ead’s Heating, Inc.
Ead’s operates more conservatively in how they estimate Bad Debt, how they calculate Cost of Goods Sold, and how they depreciate their equipment. These adjustments, coupled with their long-term arrangement for a capital lease of equipment make them a more undervalued and sustainable company to invest in. With the same operations, they have posted lower figures for income and common financial ratios. This would mean that Ead’s would have a lower valuation price and would be undervalued when compared to Glenwood. Given the two companies had the same operations other than their adjustment decisions, Ead’s will be the better investment or lending option.

13
HOME HEATERS CASE APPENDIX
1. Glenwood Bad Debt Expense = 99,400 * 0.01 = $994 2. Glenwood Schedule of Cost of Goods Sold
3. Glenwood Depreciation Expense Calculation a. Building
i. Original Cost = $350,000 ii. Salvage Value = $50,000
iii. Useful Life: 30 years iv. Depreciation Expense = (350,000-50,000)/30 = 10,000 per year
b. Equipment i. Original Cost = $80,000
ii. Salvage Value = $8,000 iii. Useful Life: 8 years iv. Depreciation Expense = (80,000-8,000)/8 = 9,000 per year
4. Glenwood Tax Provision Calculation
5. Ead’s Bad Debt Expense = 99,400 * 0.05 = $4,970 6. Ead’s Schedule of Cost of Goods Sold
7. Ead’s Depreciation Expense Calculation a. Building
i. Original Cost = $350,000 ii. Salvage = $50,000
Schedule of COGS40 1,000.00 40,000.00 60 1,100.00 66,000.00 20 1,150.00 23,000.00 40 1,200.00 48,000.00
4,450.00 177,000.00
Net Income before AJE5Revenue 398,500.00 Expenses 274,844.00 NI before AJE5 123,656.00 Tax provision 30,914.00
Schedule of COGS28.00 1,300.00 36,400.00 62.00 1,200.00 74,400.00 20.00 1,150.00 23,000.00 50.00 1,100.00 55,000.00
188,800.00
14
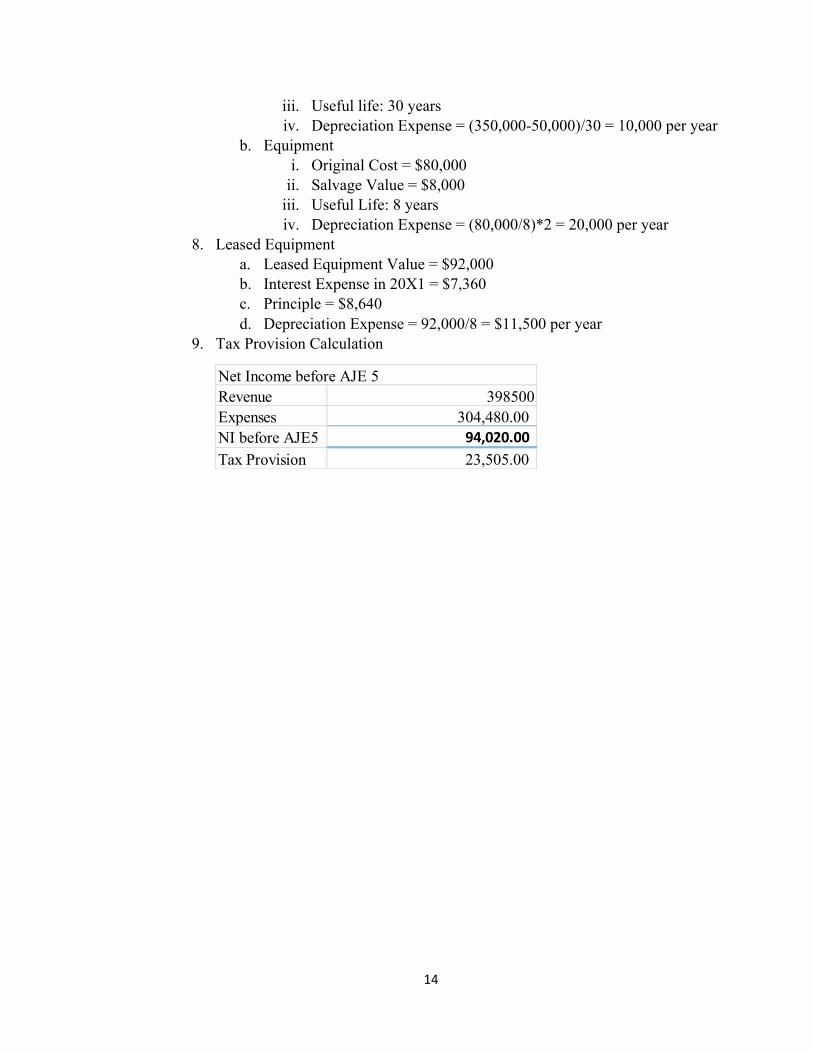
iii. Useful life: 30 years iv. Depreciation Expense = (350,000-50,000)/30 = 10,000 per year
b. Equipment i. Original Cost = $80,000
ii. Salvage Value = $8,000 iii. Useful Life: 8 years iv. Depreciation Expense = (80,000/8)*2 = 20,000 per year
8. Leased Equipment a. Leased Equipment Value = $92,000 b. Interest Expense in 20X1 = $7,360 c. Principle = $8,640 d. Depreciation Expense = 92,000/8 = $11,500 per year
9. Tax Provision Calculation
Net Income before AJE 5Revenue 398500Expenses 304,480.00 NI before AJE5 94,020.00Tax Provision 23,505.00

15
SECTION 2: TOTZ CASE
EXECUTIVE SUMMARY
The activity of Totz and its subsidiary, Doodlez art studio, have provided
information of operations and activity for the 2016 fiscal year as well as supporting information from 2015 and 2014. The following report details how each piece of information provided by the client should be handled in the reporting of their 2016 Income Statement.
Along with the explanation of each section is justification based on authoritative GAAP literature found within the Codification. Section numbers from the Codification and SEC resources are provided for further reference related to specific subject matter.
Aspects of the income statement items provided are broken down into four sections, as presented in the case document. The first references handling of net sales, then Gross Profit, Gains, and a Class Action Settlement. Using the guidance from the SEC documents and the Codification along with information provided by the client, we should be able to provide accurate support and guidance for the compilation of Totz’ 2016 financial statements.

16
EXPLANATION AND JUSTIFICATION 1. Net sales was provided by the client as $74.5 million in 2015 and $86.5 million for 2016. This was a result of increases driven in part by service revenue of Doodlez, which increased from $3.9 million to $11.2 million, as well as the $4.7 million increase in from retail sales. When compiling the income statement, Totz should include data from both the 2015 and 2016 fiscal year, as prescribed in the Codification section ASC 205-10-45-2, which is included below.
ASC 205-10-45-2 “In any one year it is ordinarily desirable that the statement of financial position, the income statement, and the statement of changes in equity be presented for one or more preceding years, as well as for the current year.”
The sales values of Totz and service revenues of Doodlez should be reported separately in the sales section of the income statement according to ASC 225-10-S99-2b. ASC 225-10-S99-2b “Costs and expenses applicable to sales and revenues. State
separately the amount of (a) cost of tangible goods sold, (b) operating expenses of public utilities or others, (c) expenses applicable to rental income, (d) cost of services, and (e) expenses applicable to other revenues.”
2. This section details Gross Profit, which is representative of net sales less the cost of sales, which was $28 million in 2015 and $30.4 million in 2016. The gross profit is the result of the calculation of net sales less cost of sales, which will appear at the end of the sales section of the Income Statement, subtotaling the values of that section (see 225-10-S99-2b above). This value, however, does not include depreciation, which is described as a miscellaneous disclosure in ASC 225-10-S99-8, provided below, and therefore Totz should not report a gross profit subtotal because the excluded depreciation is attributable to its cost of sales.
225-10-S99-8 “To avoid placing undue emphasis on "cash flow," depreciation, depletion and amortization should not be positioned in the income statement in a manner which results in reporting a figure for income before depreciation.”
3. Gain on sale of a corporate headquarters when relocating to Mountain View, CA yielded a $1.7 million gain. Due to recent changes in reporting standards, this amount will not be recorded as an extraordinary item, but rather, it should be considered an abandonment of property. Abandonment of property is explicitly stated to not be treated as an extraordinary item by ASC 205-20-45-3C, included below. Instead, the gain should

17
considered as a discontinued operation, and reported in the non-operating section of the income statement.
ASC 205-20-45-3C “A gain or loss recognized on the disposal (or loss recognized on classification as held for sale) of a discontinued operation shall be calculated in accordance with the guidance in other Subtopics. For example, if a discontinued operation is within the scope of Topic 360 on property, plant, and equipment, an entity shall follow the guidance in paragraphs 360-10-35-37 through 35-45 and 360-10-40-5 for calculating the gain or loss recognized on the disposal (or loss on classification as held for sale) of the discontinued operation.”
4. Totz received a settlement from a class action lawsuit with a provider, bringing in proceeds of $2.7 million during 2016. This is considered a non-operating revenue or gain, and should be reported in the non-operating section of the income statement, as prescribed by ASC 225-10-S99-2, provided on pg. 3, stating that income items (including miscellaneous or other income) should be stated separately on the income statement. Thus, the proceeds of the settlement, should be recorded in the non-operating section of the income statement as a miscellaneous or other source of income for the year.
In summary, at least the past two years of income data should be reported on the client’s income statement in a comparative format. Net sales and cost of sales will be recorded in the sales section (part of the operating section) of the income statement, and depreciation should not be included in the cost of sales for the calculation of gross profit. The gain on sale from relocating the company headquarters will be treated as a discontinued operation and recorded in the non-operating section of the statement. Finally, the settlement received from the class action lawsuit with a supplier will be recorded as a miscellaneous source of income in the non-operating section of the income statement. For further detail and information, Codification reference sections have been provided in the body of the report, and excerpts relevant to the referenced sections have been included in italics. Using this research and treatment of items provided by the client, we should be able to successfully and accurately account for these areas of Totz’ income statement within GAAP compliance.

18
SECTION 3: ROCKY MOUNTAIN CHOCOLATE FACTORY CASE
EXECUTIVE SUMMARY
The primary purpose of this case was to understand hoe economic events are recorded in financial statements, appreciate the linkages between the balance sheet and income statement, record transactions and adjustments in journal entry form, prepare a set of financial statements, and distinguish between cash and accrual-basis accounting.
The Rocky Mountain Chocolate Factory case utilized the premise of a fictitious company in order to explore the accounting cycle and the process of preparing a set of financial statements on a small-scale. The case involved recording several economic events as journal entry transactions, recording adjustments, preparing a pre-closing trial balance, record closing entries, prepare a post-closing trial balance, and then create a full set of financial statements based on that balance. This exercise provided a meaningful perspective of the accounting cycle and preparation of statements without the full scope and size involved of a real company.
This case was completed entirely within Microsoft Excel, and the tables and statements created for the case are inserted and formatted below for printing purposes. The case elements included are a General Journal, a ledger-style posting of those journal entries, an income statement, and a balance sheet. To address cash flows, each entry posted in the general journal includes a column detailing the impact on cash flows.

19
GENERAL JOURNAL
General Journal Entriesk. Section of Cash Flow Statement
# Account Dr. Cr.1 Inventory 7,500,000 Increase in Payables would appear in the operating section as an addition.
Accounts Payable 7,500,000 2 Salaries & Wages Expense 6,000,000 Increase in Accrued Salaries & Wages would appear in the operating section as an addition.
Accrued Salaries and Wages 6,000,000 3 Cash 17,000,000
Accounts Receivable 5,000,000 Increase in Receivables would appear as a subtraction in the operating section.Sales 22,000,000 Cost of Goods Sold 14,000,000 No effect on cash flows.Inventory 14,000,000
4 Accounts Payable 8,200,000 Decrease in payables decreases cash in the operating section.Cash 8,200,000
5 Cash 4,100,000 Decrease in receivables increases cash in the operating section.Accounts Receivable 4,100,000
6 Sales and Marketing Expense 1,505,431 Increase in Accrued Expenses would appear as an addition in the operating section.General and Administrative Expense 2,044,569 Retail Operating Expense 1,750,000 Cash 2,000,000 Other Accrued Expenses 3,300,000
7 Accrued Salaries and Wages 6,423,789 Decrease in Accrued Salaries & Wages would be a decrease in the operating section.Cash 6,423,789
8 Cash 125,000 No effect on cash flows.Deferred Income 125,000
9 Poperty and Equipment 498,832 Increase in Property and Equipment would be a subtraction in the Investing section. Cash 498,832
10 Dividends 2,407,167 Dividends would appear in the financing section of the Cash Flow Statement.Dividends Payable 3,709 Cash 2,403,458
20
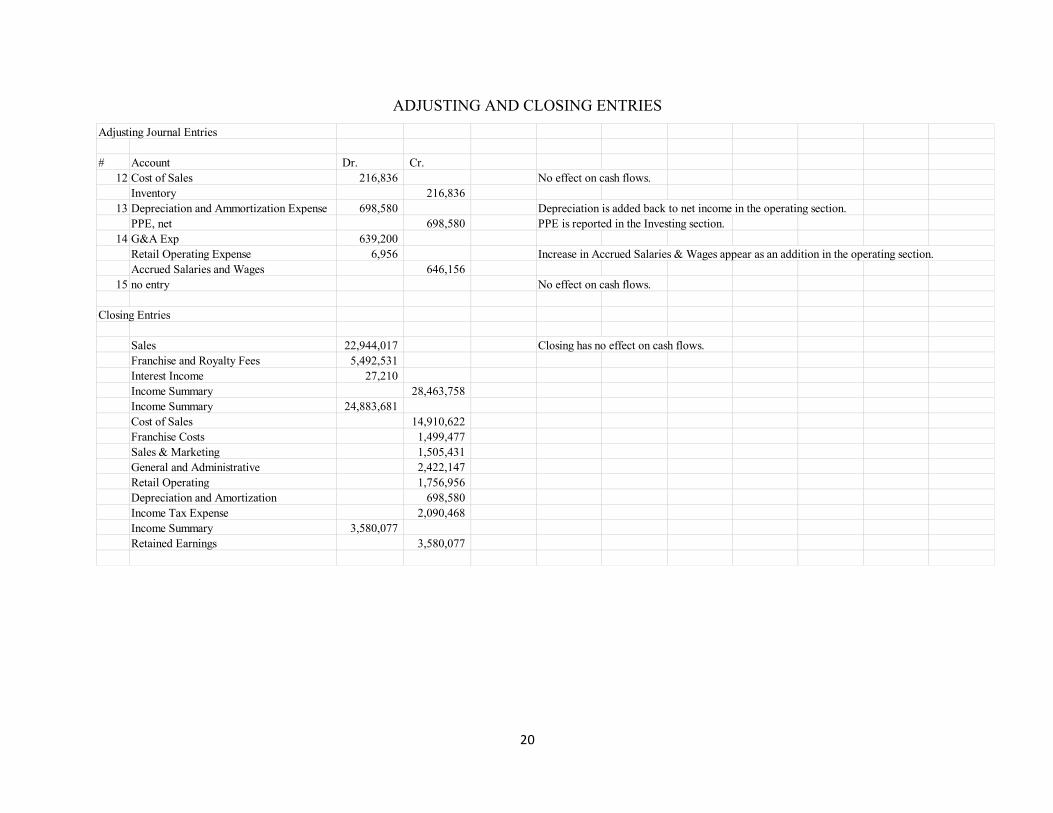
ADJUSTING AND CLOSING ENTRIES
Adjusting Journal Entries
# Account Dr. Cr. 12 Cost of Sales 216,836 No effect on cash flows.
Inventory 216,836 13 Depreciation and Ammortization Expense 698,580 Depreciation is added back to net income in the operating section.
PPE, net 698,580 PPE is reported in the Investing section. 14 G&A Exp 639,200
Retail Operating Expense 6,956 Increase in Accrued Salaries & Wages appear as an addition in the operating section.Accrued Salaries and Wages 646,156
15 no entry No effect on cash flows.
Closing Entries
Sales 22,944,017 Closing has no effect on cash flows. Franchise and Royalty Fees 5,492,531 Interest Income 27,210 Income Summary 28,463,758 Income Summary 24,883,681 Cost of Sales 14,910,622 Franchise Costs 1,499,477 Sales & Marketing 1,505,431 General and Administrative 2,422,147 Retail Operating 1,756,956 Depreciation and Amortization 698,580 Income Tax Expense 2,090,468 Income Summary 3,580,077 Retained Earnings 3,580,077

21
LEDGER ENTRIES
Begi
nnin
g Ba
lanc
e (F
ebru
ary
28, 2
009)
1. P
urch
ase
Inve
ntor
y
2. In
cur F
acto
ry W
ages
3. S
ell I
nven
tory
for C
ash
and
On
Acc
ount
4. P
ay fo
r Inv
ento
ry
5. C
olle
ct R
ecei
vabl
es
6. In
cur S
G&
A (C
ash
and
Paya
ble)
7. P
ay W
ages
8. R
ecei
ve F
ranc
hise
Fee
9. P
urch
ase
PPE
10. D
ivid
ends
Dec
lare
d an
d Pa
id
11. A
ll ot
her t
rans
actio
ns
Una
djus
ted
Bala
nce
Cash and Cash Equivalents 1,253,947 17,000,000 (8,200,000) 4,100,000 (2,000,000) (6,423,789) 125,000 (498,832) (2,403,458) 790,224 3,743,092 Accounts Receivable 4,229,733 5,000,000 (4,100,000) (702,207) 4,427,526 Notes Receivable, current - 91,059 91,059 Inventories 4,064,611 7,500,000 6,000,000 (14,000,000) (66,328) 3,498,283 Deferred Income Taxes 369,197 92,052 461,249 Other 224,378 (4,215) 220,163 Property and Equipment, net 5,253,598 498,832 132,859 5,885,289 Notes Receivable, less current portion 124,452 139,198 263,650 Goodwill, net 1,046,944 - 1,046,944 Intangible Assets, net 183,135 (73,110) 110,025 Other 91,057 (3,007) 88,050 Accounts Payable 1,074,643 7,500,000 (8,200,000) 503,189 877,832 Accrued Salaries and Wages 423,789 6,000,000 (6,423,789) - - Other Accrued Expenses 531,941 3,300,000 (2,885,413) 946,528 Dividend Payable 598,986 3,709 (1) 602,694 Deferred Income 142,000 125,000 (46,062) 220,938 Deferred Income Taxes 827,700 66,729 894,429 Common Stock 179,696 1,112 180,808 Additional Paid-in Capital 7,311,280 315,322 7,626,602 Retained Earnings 5,751,017 (2,407,167) 3,343,850 Sales - 22,000,000 944,017 22,944,017 Franchise and Royalty Fees - 5,492,531 5,492,531 Cost of Sales - 14,000,000 693,786 14,693,786 Franchise Costs - 1,499,477 1,499,477 Sales & Marketing - 1,505,431 - 1,505,431 General and Administrative - 2,044,569 (261,622) 1,782,947 Retail Operating - 1,750,000 - 1,750,000 Depreciation and Amortization - - - Interest Income - (27,210) (27,210) Income Tax Expense - 2,090,468 2,090,468 A = L + OE + R - E - - - - - - - - - - - - -
22
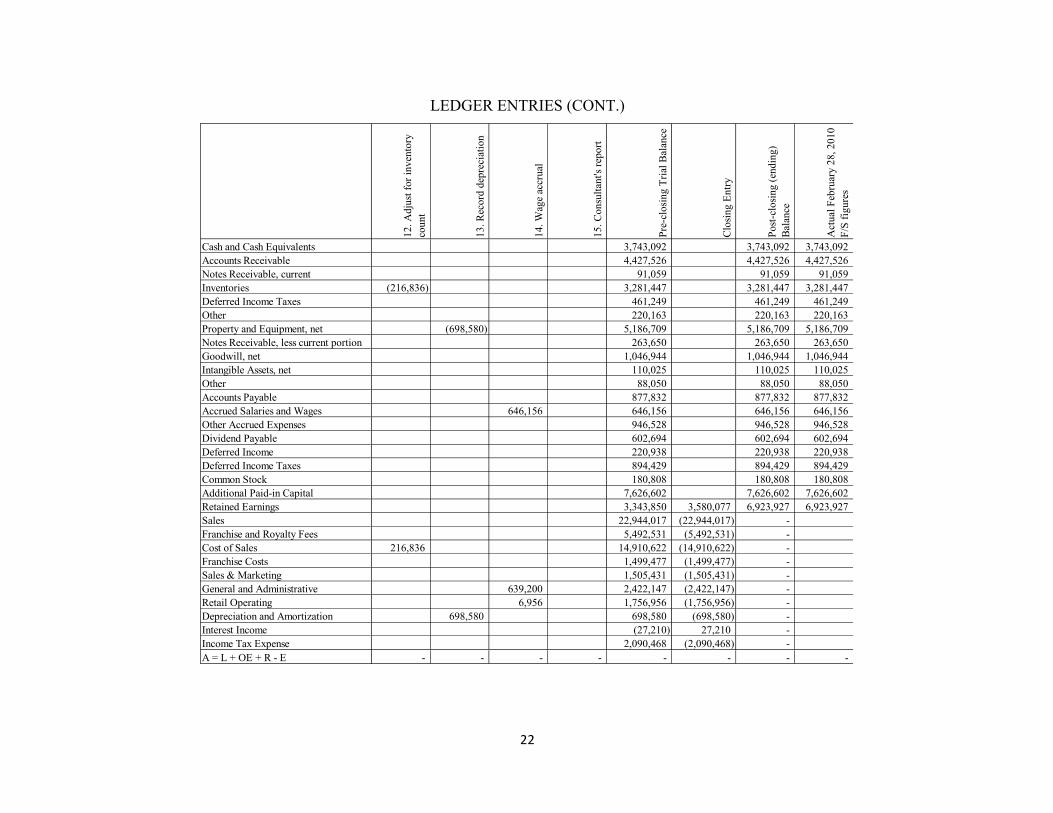
LEDGER ENTRIES (CONT.)
12. A
djus
t for
inve
ntor
y co
unt
13. R
ecor
d de
prec
iatio
n
14. W
age
accr
ual
15. C
onsu
ltant
's re
port
Pre-
clos
ing
Tria
l Bal
ance
Clos
ing
Entry
Post-
clos
ing
(end
ing)
Ba
lanc
e
Act
ual F
ebru
ary
28, 2
010
F/S
figur
es
Cash and Cash Equivalents 3,743,092 3,743,092 3,743,092 Accounts Receivable 4,427,526 4,427,526 4,427,526 Notes Receivable, current 91,059 91,059 91,059 Inventories (216,836) 3,281,447 3,281,447 3,281,447 Deferred Income Taxes 461,249 461,249 461,249 Other 220,163 220,163 220,163 Property and Equipment, net (698,580) 5,186,709 5,186,709 5,186,709 Notes Receivable, less current portion 263,650 263,650 263,650 Goodwill, net 1,046,944 1,046,944 1,046,944 Intangible Assets, net 110,025 110,025 110,025 Other 88,050 88,050 88,050 Accounts Payable 877,832 877,832 877,832 Accrued Salaries and Wages 646,156 646,156 646,156 646,156 Other Accrued Expenses 946,528 946,528 946,528 Dividend Payable 602,694 602,694 602,694 Deferred Income 220,938 220,938 220,938 Deferred Income Taxes 894,429 894,429 894,429 Common Stock 180,808 180,808 180,808 Additional Paid-in Capital 7,626,602 7,626,602 7,626,602 Retained Earnings 3,343,850 3,580,077 6,923,927 6,923,927 Sales 22,944,017 (22,944,017) - Franchise and Royalty Fees 5,492,531 (5,492,531) - Cost of Sales 216,836 14,910,622 (14,910,622) - Franchise Costs 1,499,477 (1,499,477) - Sales & Marketing 1,505,431 (1,505,431) - General and Administrative 639,200 2,422,147 (2,422,147) - Retail Operating 6,956 1,756,956 (1,756,956) - Depreciation and Amortization 698,580 698,580 (698,580) - Interest Income (27,210) 27,210 - Income Tax Expense 2,090,468 (2,090,468) - A = L + OE + R - E - - - - - - - -
23
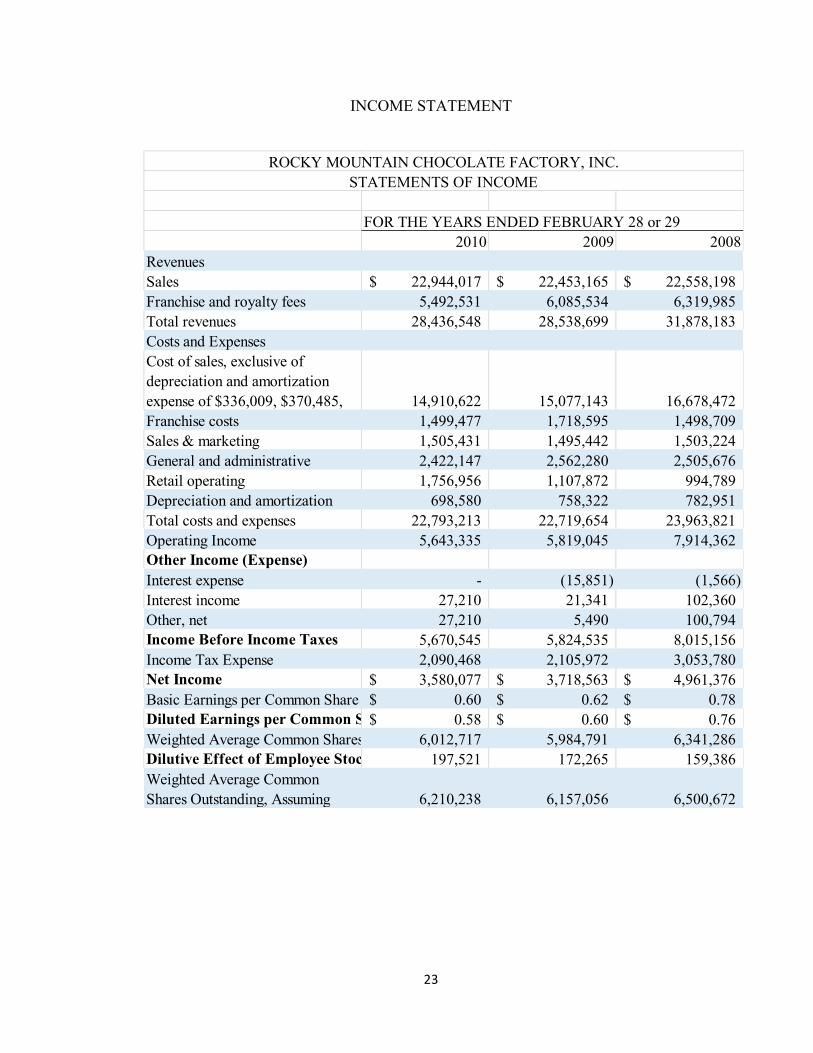
INCOME STATEMENT
FOR THE YEARS ENDED FEBRUARY 28 or 292010 2009 2008
RevenuesSales 22,944,017$ 22,453,165$ 22,558,198$ Franchise and royalty fees 5,492,531 6,085,534 6,319,985 Total revenues 28,436,548 28,538,699 31,878,183 Costs and Expenses
Franchise costs 1,499,477 1,718,595 1,498,709 Sales & marketing 1,505,431 1,495,442 1,503,224 General and administrative 2,422,147 2,562,280 2,505,676 Retail operating 1,756,956 1,107,872 994,789 Depreciation and amortization 698,580 758,322 782,951 Total costs and expenses 22,793,213 22,719,654 23,963,821 Operating Income 5,643,335 5,819,045 7,914,362 Other Income (Expense)Interest expense - (15,851) (1,566) Interest income 27,210 21,341 102,360 Other, net 27,210 5,490 100,794 Income Before Income Taxes 5,670,545 5,824,535 8,015,156 Income Tax Expense 2,090,468 2,105,972 3,053,780 Net Income 3,580,077$ 3,718,563$ 4,961,376$ Basic Earnings per Common Share 0.60$ 0.62$ 0.78$ Diluted Earnings per Common Share 0.58$ 0.60$ 0.76$ Weighted Average Common Shares Outstanding6,012,717 5,984,791 6,341,286 Dilutive Effect of Employee Stock Options 197,521 172,265 159,386 Weighted Average Common Shares Outstanding, Assuming 6,210,238 6,157,056 6,500,672
ROCKY MOUNTAIN CHOCOLATE FACTORY, INC.STATEMENTS OF INCOME
Cost of sales, exclusive of depreciation and amortization expense of $336,009, $370,485, 14,910,622 15,077,143 16,678,472

24
BALANCE SHEET
AS OF FEBRUARY 282010 2009
AssetsCurrent AssetsCash and cash equivalents 3,743,092 1,253,947
Notes receivable, current 91,059 -
Deferred income taxes 461,249 369,197 Other 220,163 224,378 Total current assets 12,224,536 10,141,866 Property and Equipment, Net 5,186,709 5,253,598 Other AssetsNotes receivable, less current portion 263,650 124,452 Goodwill, net 1,046,944 1,046,944 Intangible assets, net 110,025 183,135 Other 88,050 91,057 Total other assets 1,508,669 1,445,588 Total assets 18,919,914 16,841,052 Liabilities and Stockholders' EquityCurrent LiabilitiesAccounts payable 877,832 1,074,643 Accrued salaries and wages 646,156 423,789 Other accrued expenses 946,528 531,941 Dividend payable 602,694 598,986 Deferred income 220,938 142,000 Total current liabilities 3,294,148 2,771,359 Deferred Income Taxes 894,429 827,700 Commitments and Contingencies
Inventories, less reserve for slow moving inventory of $263,872 and $251,922, 3,281,447 4,064,611
ROCKY MOUNTAIN CHOCOLATE FACTORY, INC.BALANCE SHEETS
Accounts receivable, less allowance for doubtful accounts of $395,291 and $332,719, 4,427,526 4,229,733
25
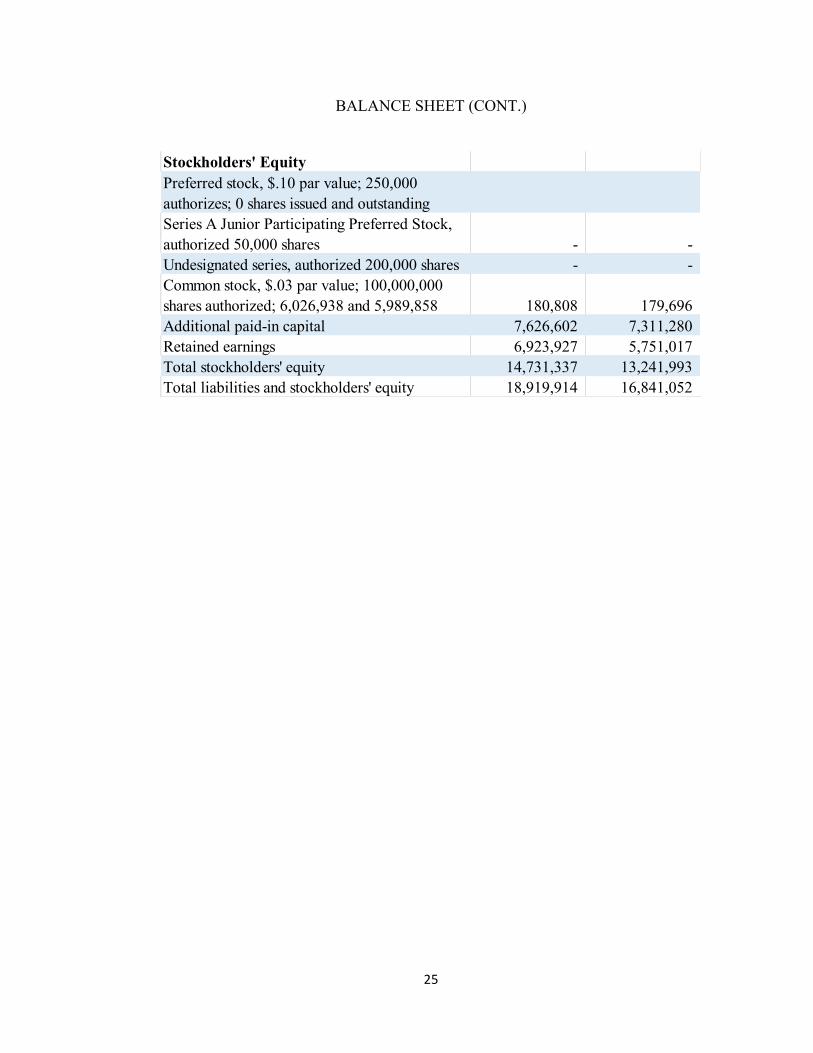
BALANCE SHEET (CONT.)
Stockholders' Equity
Undesignated series, authorized 200,000 shares - -
Additional paid-in capital 7,626,602 7,311,280 Retained earnings 6,923,927 5,751,017 Total stockholders' equity 14,731,337 13,241,993 Total liabilities and stockholders' equity 18,919,914 16,841,052
Common stock, $.03 par value; 100,000,000 shares authorized; 6,026,938 and 5,989,858 180,808 179,696
Preferred stock, $.10 par value; 250,000 authorizes; 0 shares issued and outstandingSeries A Junior Participating Preferred Stock, authorized 50,000 shares - -
26
SECTION 4 – INTERNAL CONTROLS
EXECUTIVE SUMMARY
The fourth case study involved an understanding of internal controls. This was a group case, completed with classmates Katherine Camilleri, Hagen Gurley, Walt Kearney, Jennifer Lyons, and myself. The group was charged with brainstorming and discussing internal controls that would address various control issues at a company.
The situation presented for the case was a fictitious company with relatively few employees in addition to the store owner. Several potential fraud schemes were developed in order to establish a discussion frame for improving the internal controls of the company, and then based on each of those fraud schemes, the group discussed potential control solutions.
This case was a good opportunity to interact in a team setting and explore the time of work that may be relevant to an advisory role. Condensing several ideas into a concise solution was a good opportunity to practice group decision-making and allowed for more thought and debate than would have come from completing the case individually. Each potential fraud scheme and its corresponding control recommendation are included below.

27
PotentialFraudScheme InternalControlLucyisresponsibleforrecordingsalesandpreparingbankdeposits.Givenherautonomywiththisprocess,Lucycouldbeunderreportingsalesandfailingtodepositallofthemoney.
Inordertocomplywithseparationofduties,oneemployeeshouldberesponsibleforrecordingsalesandanothershouldberesponsiblefordepositingmoneyforthosesales.Thisseparationofresponsibilitymakesitharderforonepersontocommitthistypeoffraud.
ThestorethatKaylaownsmayhaveapettycashfundthatwasestablishedforsmallerandmiscellaneousexpenses.Iftheydohaveapettycashfund,employeesmaybeincorrectlybeingreimbursedfromthefund.
Inordertopreventthisandensurethatpettycashfunddisbursementsareaccurate,thereshouldbeaccesscontrols.Kaylashouldbethecustodian.Thismeansthatsheistheonlypersonthatcanmakepayments.Also,Kayla,servingasthecustodian,willneedtocollectreceiptsasawayofprovingaccuratedisbursement.
Kayla’sstorejustimplementedanewcoupondiscountprogram.Employeescouldbescanningcouponsbutchargingthecustomersfullpriceandthenpocketingthedifference.
Withthisnewprogram,thereislimitedevidenceofprocessingthetransaction.Clerksshouldhavetoenterallamountsintothesystemandkeepthecouponwiththereceiptofthetransaction.
Thereisnoevidenceofasystemtotrackthehoursthateachemployeeworks.
Kaylashouldimplementatimecardsystemtotrackexactlywheneachemployeeworks.
Kaylaisresponsiblefortheoversightofinventory,ordersfornewinventory,andpaymentsofinventory.Shecouldcommitanactoffraudbyfalsifyingorders,payingthemtoanexternalaccount,andexpensingmoreinventorythanactualtomakeupforthedifference.Thiswouldreducetheincometaxexpenseofthebusinessbyunderreportingincomewhilefunnelingcashoutofthebusiness.
Aseparateemployeeshouldberesponsibleforinventoryordersandpaymentofinventoryorders.Thisseparationofresponsibilitywouldpreventonepersonfromautonomouslyfalsifyingorderstobepaidtoexternalaccounts.
Kaylahasfullcustodyofassets,andshealsodoestherecordkeeping.
Kaylashouldnotbehandlingsomuchresponsibilitywithinthebusinesssincesheistheownerofthecompany.Someoneelseshouldbehelpingwithortakingoverthisarea.
KaylaandLucybothhaveaccesstotheaccountingsystem,withKaylahandlingallaccountingfunctionsandLucyrecordingsalesdataandpreparingbankdeposits.
ThisisanissuebecauseLucyandKaylacanbothaccessrecords,whichcouldleadtosmallchangestothesalesrecordsbyLucywithoutKaylarealizingit.Thoughtseparationofdutiesisimportant,itisalsoimportantfortheinformationtobevalidandconsistent.

28
PotentialFraudScheme InternalControlThereisonlyonecreditcardmachineforbothcashregisters.
Thereisnowayofknowingwhichemployeeisresponsibleforthecreditcardsale.Thereshouldbeacreditcardmachineforeachregistersothatcreditcardtransactionscanbeallocatedtothecorrectemployee.
Thereisnomentionofasecuritysystem. Ifasecuritysystemwasputinplace,completewithcameras,thenemployeeswouldbemonitoredatalltimes.
Eachemployeehasfullauthoritytoentereachtypeoftransaction,meaningthattheycouldchangeprevioustransactions.
Kaya,astheowner,shouldbetheonlypersonwithfullauthority.Allotheremployeesshouldhavelimitedauthoritythatallowsthemtoonlyrecordtransactionsthataredirectlyrelatedtothesalesprocess.

29
SECTION 5 – INVENTORY ANALYSIS IN MANUFACTURING
EXECUTIVE SUMMARY
Inventory is an important area of accounting, especially for manufacturers. This case is all about analyzing a manufacturer based on different figures and ratios related to their inventory systems.
This case delves into the realm of cost accounting by following the inventory system from raw materials to works in process to finished goods. Additional topics covered in the case were obsolescence and unmarketable inventory, cost of sales, inventory turnover, and inventory holding. The case allowed the opportunity to explore a more analytical approach to cost accounting. In addition to just recording the inventory transactions and understanding the accounting behind them, the case involved analyzing the attributes associated with the company’s inventory system in order to gain perspective on the company as a potential investor.
Each area of the case is numbered, with explanations and analysis incorporated throughout.

30
INVENTORY
1. In raw materials, I would expect to see costs including the amount recorded for purchases of raw materials used in production. Examples of this could include costs from raw materials like woods, plastics, metals, and composites in addition to freight costs for purchases free on board at the shipping point and any other handling costs associated with acquiring materials. Works in process will include the costs of the direct materials associated with products still yet to be completed. Works in process will also include the cost of the direct labor associated with working on those units. Finally, works in process will include overhead items. Overhead included in works in process could be indirect materials like factory supplies, packaging materials, and other items not directly used on the product as well as indirect labor such as management and office staff hours. These indirect costs will be applied on a chosen basis to be assigned to units of the works in process inventory. Finished goods will be the cumulative costs (direct materials, direct labor, and overhead) of all units that have been completed and are ready for sale.
2. Inventory recorded on a net basis is recorded at the lower value between its original cost of acquisition (historical cost) and its current selling value (fair market value). This company uses the first-in first-out (FIFO) inventory method to track Cost of Goods Sold. Inventory recorded on a net basis allows for obsolete or unmarketable inventory. Obsolete inventories occur primarily toward the end of a product cycle and are items that have decreased selling value or no selling value at all. These items are marked down in order to record the cost of inventory at a more realistic cost. The estimated allowance for obsolete and unmarketable inventory is based upon inventory levels, sales trends, and historical experience according to the company. These estimations help determine the net value of inventory applicable to products that will continue through to a sale and be recorded as Cost of Goods Sold. The calculation to record inventory net will be the ending balance of Inventory (raw materials, works in process, and finished goods) less the estimated allowance.
3. Allowance for Obsolete and Unmarketable Inventory
a. The ending balance of the Allowance for Obsolete and Unmarketable Inventory will not appear directly in the financial statements; however, it will be reflected in the net value of inventory recorded on the balance sheet.
b. Gross Inventory in 2011 = 233,070 + 10,800 = $243,870
Gross Inventory in 2012 = 211,734 + 12,520 = $224,254

31
c. The entire allowance would be allocated to finished goods given the nature of obsolete and unmarketable goods. These would typically be products that have been finished and sitting in inventory and have lost value over time. Marking down these inventory items would typically apply to the costs found in finished goods, though in some cases the company may have small portions allocated to raw materials no longer used (for example, if they stopped using a particular material in their production but still had some left over from before). In application, however, I think the company would apply all of the allowance to their balance in finished goods.
4. Cost of Sales 13,348
Allowance for Obsolete and Unmarketable Inventory 13,348
Allowance for Obsolete and Unmarketable Inventory 11,628
Finished Goods Inventory 11,628
5. Inventory Accounts, Accounts Payable, and Cost of Sales

32
6. Inventory Turnover Ratio
a. 2011 Inventory Turnover = 575,226 / ((268,591 + 233,070) / 2) = 2.2933 times
b. 2012 Inventory Turnover = 585,897 / ((233,070 + 211,734) / 2) = 2.6344 times
7. Inventory Holding Period
a. 2011 Inventory Holding Period = 365 days / 2.2933 = 159.16 days
b. 2012 Inventory Holding Period = 365 days / 2.6344 = 138.55 days
Inventory holding period is, on average, the amount of time it takes the company to manufacture and sell its entire inventory. Since the inventory holding period is decreasing, the company is becoming more efficient with its inventory. Ideally, companies strive for a just-in-time inventory method, meaning that inventory is purchased only when needed and products are finished as needed. This reduced the amount of inventory on hand at any given time, reducing overhead costs of storage, minimizes wastes from overproduction, and generates a very quick inventory turnover.
8. Finished Goods, net 167,646
Provision 13,348
Finished Goods, gross 154,298
Estimated percent of obsolete finished goods = 13,348 / 154,298 = 8.65%
By backing out the provision made in 2012 from the reported finished goods inventory, we can arrive at a gross value for finished goods. The provision made in 2012 would be based on the percentage of finished goods that are estimated to become obsolete or unmarketable. This provision was $13,348 in 2012, so that over the gross finished goods amount shows that 8.65%.
As an investor, this percentage of finished goods that become obsolete or unmarketable seems quite high. About one out of every twelve products finished is estimated to be written off as obsolete or unmarketable. This also likely relates to their long inventory holding period. Recent trends in manufacturing have shifted drastically toward lean processes and just-in-time inventory systems. Having a company with an inventory holding period over 100 days and 8% of
33
their finished goods becoming obsolete before being sold is a definite red flag to investors.
I would like to know how the company plans to improve their inventory system to decrease inventory on hand, decrease inventory holding period, increase their turnover, and decrease their write-offs from obsolete and unmarketable goods. This is clearly an area that this company could improve upon in order to become more profitable and become a better investment option.
It would also be helpful to know why the company consistently has a material amount of obsolete and unmarketable goods. It could be because their product cycle is too short, waste from overproduction, or a decline in demand. Each of these presents a different kind of issue that the firm could address to improve their situation going into the future. As an investor, it would be important to not only recognize what the weaknesses of the company are, but whether or not they recognize them and have a plan in place to address those weaknesses.
34
SECTION 6: WORLDCOM, INC.
EXECUTIVE SUMMARY
The WorldCom case explores the accounting surrounding the misstatements that led to the demise of WorldCom. This case was a critical factor in the dissolution of Arthur Anderson, the largest CPA firm in the world at the time, and was one of a number of significant accounting scandals that came to light in the early 2000’s.
The accounting at hand in this case deals with the capitalization of assets that should have been expensed. By capitalizing assets that should have been expensed, WorldCom increased their reported assets, overstated income, and realized tax benefits from depreciation of the capitalized asset over its life.
This case analyzes this historic accounting scandal through the lens of FASB Statement of Concepts No. 6, to demonstrate how the firm should have reported their financials. Additionally, the misstatements are projected and explained in their various impacts with regard to financial reporting.
35
WORLDCOM, INC.
a. FASB Statement of Concepts No. 6 i. Assets are probably future economic benefits obtained or
controlled by a particular entity as a result of past transactions. Expenses are outflows or other using up of assets or incurrences of liabilities (or a combination of both) from delivering or producing goods, rendering services, or carrying out other activities that constitute the entity’s ongoing major or central operations.
ii. Regular and necessary expenditures related to the company’s operations, sustaining performance, producing goods, and making repairs that sustain current levels of production are items that should be expensed since they have no increase in future generation of revenues. Investments and expenditures that increase future production capability, enhance the quality of the product, increase the lifespan of equipment, or otherwise increase future revenues, should be capitalized as an asset and depreciated to allocate that expense over future periods.
b. After items are capitalized, they are then expensed over a period of time through depreciation or amortized costs. Depreciation expense takes the cost of the capitalized asset and divides it into several periods, disbursing the cost over the periods in which the asset is expected to increase revenues. This increases assets on the balance sheet as items remain in the property, plant, equipment section of the assets. It also increases income in early years since it is deferring expenses to be recorded in later years.
c. Line costs for 2001: Line costs…………………………………. 14,739,000,000 Cash or A/P…………………………………. 14,739,000,000 Line costs are the costs spent for use of local and regional telephone lines to connect distance communications networks.
d. Many of the costs that were capitalized were “charges paid to local telephone networks to complete phone calls.” A significant portion of
36
these operating expenses were moved into capital expenditures. These costs do not meet the requirement of having future increases to revenues if they were incurred to complete phone calls in the given period. Instead, these are operating costs that were incurred to fulfill ongoing and central operations of providing telecommunications services to clients, and thus they should have been recorded and expensed in the year that they occurred.
e. Entry to improperly capitalize line costs. Property, plant, equipment (various accounts)………. 3,055,000,000 Line Cost (expense)………………………………… 3,055,000,000 This adjustment increases assets in the property, plant, equipment portion of the balance sheet, and reduces current year income by decreasing the expenses reported in the operating section. Instead of appearing in the operating section of the cash flow statement, they would appear in the investing section.
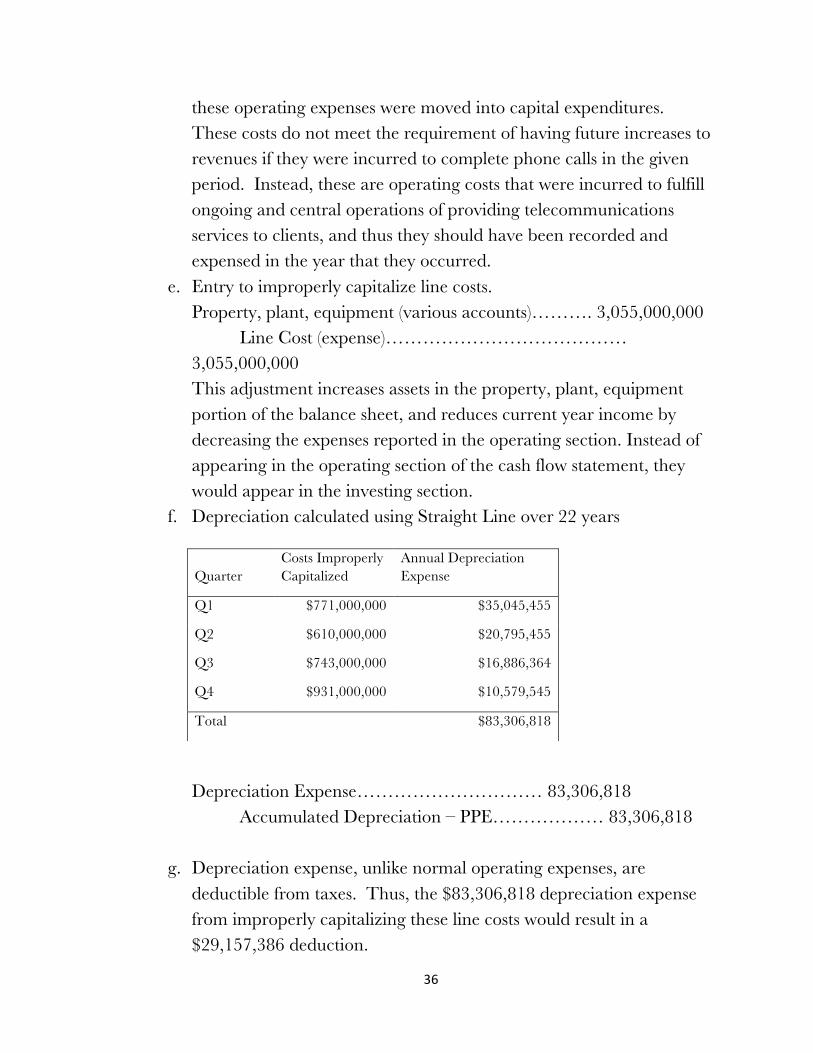
f. Depreciation calculated using Straight Line over 22 years
Depreciation Expense………………………… 83,306,818 Accumulated Depreciation – PPE……………… 83,306,818
g. Depreciation expense, unlike normal operating expenses, are deductible from taxes. Thus, the $83,306,818 depreciation expense from improperly capitalizing these line costs would result in a $29,157,386 deduction.
Quarter Costs Improperly Capitalized
Annual Depreciation Expense
Q1 $771,000,000 $35,045,455
Q2 $610,000,000 $20,795,455
Q3 $743,000,000 $16,886,364
Q4 $931,000,000 $10,579,545
Total $83,306,818

37
Income before taxes, as reported $2,393,000,000
Depreciation for the year 83,306,818
Line costs improperly categorized (3,055,000,000)
Loss before taxes, restated (578,693,182)
Income tax benefit 202,542,614
Minority interest 35,000,000
Net loss, restated (341,150,568)
38
SECTION 7: TARGA CASE
EXECUTIVE SUMMARY
The Targa case analyzes Targa Co., who is going through a restructuring process in which they are restructuring one of their business lines and will be forced to terminate certain employees as a result. The company has notified the employees about the non-voluntary termination, and now they are in the process of accounting for the termination benefits that will be paid to terminated employees as well as the relocation costs and staff training costs due to the restructuring.
This case explores financial reporting through the lens of research. The case focuses on justifying financial reporting choices by locating and properly utilizing specific sections of the FASB Codification, which is the database in which U.S. Generally Accepted Accounting Principles are stored.
39
TARGA CASE
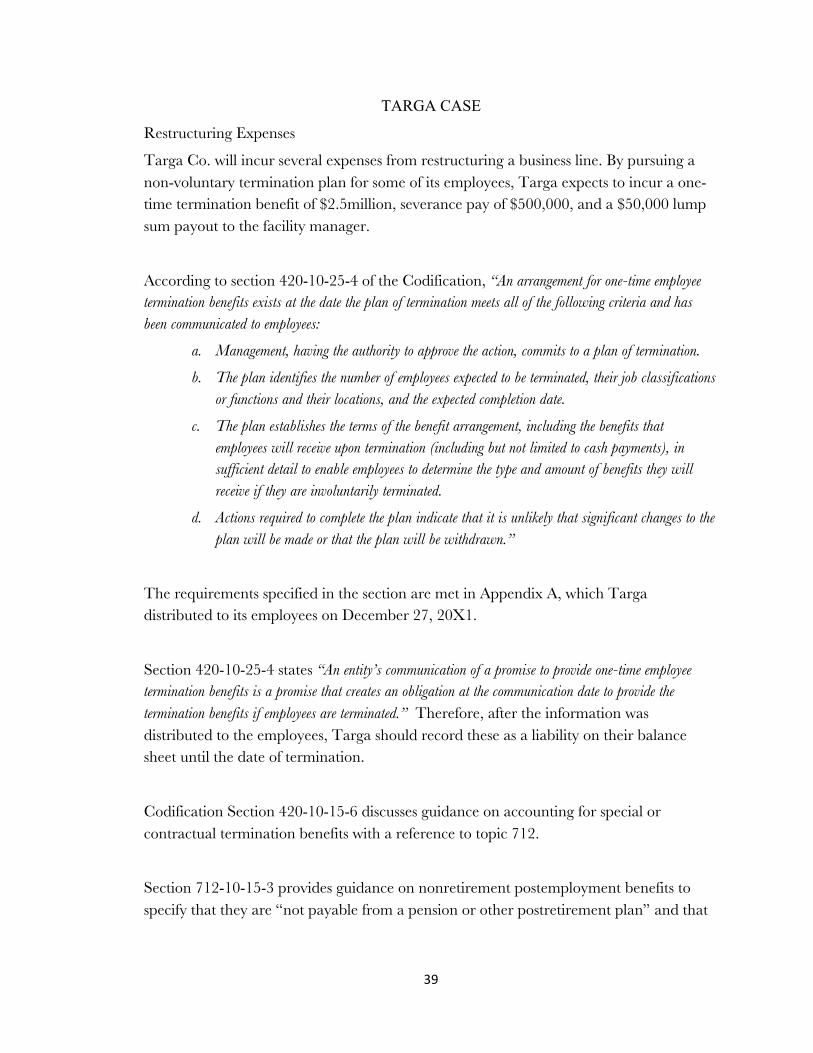
Restructuring Expenses
Targa Co. will incur several expenses from restructuring a business line. By pursuing a non-voluntary termination plan for some of its employees, Targa expects to incur a one-time termination benefit of $2.5million, severance pay of $500,000, and a $50,000 lump sum payout to the facility manager.
According to section 420-10-25-4 of the Codification, “An arrangement for one-time employee termination benefits exists at the date the plan of termination meets all of the following criteria and has been communicated to employees:
a. Management, having the authority to approve the action, commits to a plan of termination.
b. The plan identifies the number of employees expected to be terminated, their job classifications or functions and their locations, and the expected completion date.
c. The plan establishes the terms of the benefit arrangement, including the benefits that employees will receive upon termination (including but not limited to cash payments), in sufficient detail to enable employees to determine the type and amount of benefits they will receive if they are involuntarily terminated.
d. Actions required to complete the plan indicate that it is unlikely that significant changes to the plan will be made or that the plan will be withdrawn.”
The requirements specified in the section are met in Appendix A, which Targa distributed to its employees on December 27, 20X1.
Section 420-10-25-4 states “An entity’s communication of a promise to provide one-time employee termination benefits is a promise that creates an obligation at the communication date to provide the termination benefits if employees are terminated.” Therefore, after the information was distributed to the employees, Targa should record these as a liability on their balance sheet until the date of termination.
Codification Section 420-10-15-6 discusses guidance on accounting for special or contractual termination benefits with a reference to topic 712.
Section 712-10-15-3 provides guidance on nonretirement postemployment benefits to specify that they are “not payable from a pension or other postretirement plan” and that

40
“benefits may be paid immediately upon cessation of active employment or over a specified period of time.
Targa also estimates a $500,000 relocation cost and a $1.5 million cost of staff training due to the restructuring.
Section 852-10-45-9 states “Revenues, expenses, realized gains and losses, and provisions for losses resulting from the reorganization and restructuring of the business shall be reported separately as reorganization items, except for those required to be reported as discontinued operations and extraordinary items in conformity with Subtopics 205-20 and 225-20.”
In this case, the $500,000 and $1.5 million expenses from restructuring would be listed as line items on the income statements as expenses from restructuring.

41
SECTION 8: MERCK CASE
EXECUTIVE SUMMARY
This case analyzes equity in financial reporting following the operations of Merck Co. The case involves distinguishing between shares authorized, shares outstanding, stock price, and operations to calculate total market capitalization of Merck Co. Further, the case extends into a discussion of why companies pay dividends on common shares and the impact of that decision on stock price. Finally, the case explores the concept of treasury stock and its impact on financial reporting.
This case approaches accounting through the lens of an investor, and offers a perspective on how accounting information is used to make decisions with regard to company financing, and how those decisions affect markets.
42
MERCK, CO.
1) Merck Co.
a) Merck’s Common Shares
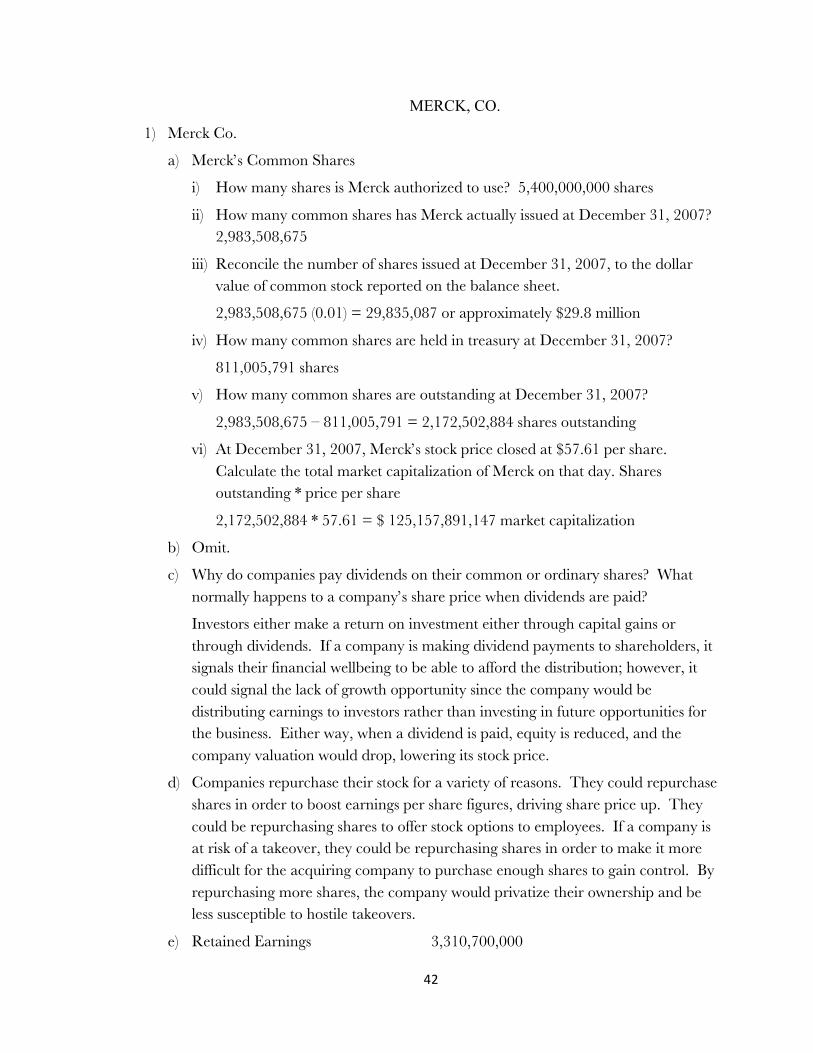
i) How many shares is Merck authorized to use? 5,400,000,000 shares
ii) How many common shares has Merck actually issued at December 31, 2007? 2,983,508,675
iii) Reconcile the number of shares issued at December 31, 2007, to the dollar value of common stock reported on the balance sheet.
2,983,508,675 (0.01) = 29,835,087 or approximately $29.8 million
iv) How many common shares are held in treasury at December 31, 2007?
811,005,791 shares
v) How many common shares are outstanding at December 31, 2007?
2,983,508,675 – 811,005,791 = 2,172,502,884 shares outstanding
vi) At December 31, 2007, Merck’s stock price closed at $57.61 per share. Calculate the total market capitalization of Merck on that day. Shares outstanding * price per share
2,172,502,884 * 57.61 = $ 125,157,891,147 market capitalization
b) Omit.
c) Why do companies pay dividends on their common or ordinary shares? What normally happens to a company’s share price when dividends are paid?
Investors either make a return on investment either through capital gains or through dividends. If a company is making dividend payments to shareholders, it signals their financial wellbeing to be able to afford the distribution; however, it could signal the lack of growth opportunity since the company would be distributing earnings to investors rather than investing in future opportunities for the business. Either way, when a dividend is paid, equity is reduced, and the company valuation would drop, lowering its stock price.
d) Companies repurchase their stock for a variety of reasons. They could repurchase shares in order to boost earnings per share figures, driving share price up. They could be repurchasing shares to offer stock options to employees. If a company is at risk of a takeover, they could be repurchasing shares in order to make it more difficult for the acquiring company to purchase enough shares to gain control. By repurchasing more shares, the company would privatize their ownership and be less susceptible to hostile takeovers.
e) Retained Earnings 3,310,700,000

43
Dividends Payable 4,200,000 (should be $3.4M)
Cash 3,307,300,000
f) Omit
g) During 2007, Merck repurchased a number of its own common shares on the open market.
i) Describe the method Merck uses to account for its treasury stock transactions.
Merck uses the cost method of accounting for treasury stock.
ii) Refer to note 11 to Merck’s financial statements. How many shares did Merck repurchase on the open market during 2007?
Merck purchased 26,500,000
iii) How much did Merck pay, in total and per share, on average, to buy back its stock during 2007? What type of cash flow does this represent?
1,429,700,000 / 26,500,000 = $53.95 / share
This would be an outflow of cash reported in the financing section of the cash flow statement.
iv) Why doesn’t Merck disclose its treasury stock as an asset?
Treasury stock is not an asset because it is not something held for future value. While it may be beneficial to the company to repurchase their stock, it is not the same as a long term investment in another company’s stock. Instead, it is there own stock repurchased, so treasury stock reduces shareholder equity rather than increasing the assets of the company. As such, it is treated as a contra-equity.
h) Omit.
i)
Merck($)
2007 2006
DividendsDeclared 3,310,700,000 3,318,700,000
SharesOutstanding 2,172,502,884 2,167,785,445
NetIncome $3,275,400,000 $4,433,800,000
TotalAssets $48,350,700,000 $44,569,800,000
OperatingCashFlows $6,999,200,000 $6,765,200,000
Year-endStockPrice $57.61 $41.94

44
DividendsperShare 1.52391052 1.530917189
DividendYield 2.645% 3.650%
DividendPayout 1.0108 0.7485
DividendstoTotalAssets 0.0685 0.0745
DividendstoOperatingCashFlows 0.4730 0.4906
45
SECTION 9: XILINX, INC.
EXECUTIVE SUMMARY
The Xilinx, Inc. case continues the discussion of equity and addresses stock options and restricted stock of the company. The case explores how stock options and stock compensation are implemented in a company, the concept of restricted stock and how it is used, and the impact of both on a company’s financial reporting and disclosures.
The case again takes a financial statement user perspective to explore how accounting, financial reporting, and disclosures impact decision-making. Further, this case extends to a discussion of trends among companies in terms of how employees are compensated and why these trends may exist.

46
XILINX, INC.
a. Stock option plans provide incentives for employees to perform well and for executives to make decisions for the wellbeing of the company. By offering ownership opportunities, the goal is to align the interests of the employees with the individuals of the company. Specifically, the option allows employees to purchase stock at a later date for a pre-determined price, or strike price. This means the employees personally gain from the stock price increase, which is intended to incentivize their work efforts and decision-making for the benefit of the company.
b. Restricted stock units are similar to stock options in the sense that it offers employees an ownership opportunity in the future, however it is different in that the shares are not issued until the requirements are satisfied. This could be used for employee retention by offering restricted stock contingent upon continuous employment with the company, whereas stock options may have a shorter-term incentive to increase stock price so that the options can be realized. Companies may offer both to balance short-term performance with long-term retention of employees. In addition, the value of stock options are dependent on the increase of share price within the vesting period, so if the stock price decreases, stock options can be rendered worthless. In contrast, restricted stock units will always maintain some level of value despite the market price of the stock. This could offer a balance between volatility and stability of compensation offerings to employees.
c. Explain briefly the following:
a. Grant date: Also called the enrollment date, this is typically the first day of the offering period.
b. Exercise price: The exercise price, or strike price, is the agreed upon purchase price for the shares.
c. Vesting period: The vesting period is the amount of time an employee must wait in order to exercise the option.
d. Expiration date: The expiration date is the latest date that an employee may exercise the option.
e. Options / RSU’s granted: These are the number of stock options or RSU’s that have been offered to employees.
f. Options exercised: Options exercised are options that have been used, meaning the employees have purchased and received shares at the exercise price.
g. Options / RSU’s forfeited or cancelled: These are the options and RSU’s that have not been exercise, either by decision of the employee not to

47
purchase the stock option or by failing to comply with the requirements to receive the RSU (e.g. an employee leaves the company before the vesting date).
d. At Xilinx, Inc. employees are offered a 24-month purchase right for common stock at the end of each six-month period. Participation in the offer is limited to 15% of the employee’s annual earnings up to a $21,000 cap per calendar year. The purchase price offered is 85% of the lower of FMB at the beginning of the 24-month offering period or at the end of each six-month exercise period. The time duration of the offer period differs from stock options and RSU’s, but more notably, there is no pre-determined purchase price. Giving a percentage of the fair market value of the stock means that this stock purchase plan retains value to the employees regardless of whether stock price has increased or decreased. In contrast with RSU’s the employees still have to exercise the option to purchase shares, investing cash back into the company.
e. The company measures the cost of employee equity compensation that are expected to be exercised based on the grant date and fair market value of the options. They record the options into a compensation expense account throughout the period, crediting the accounts associated with the different types of offerings. Some of these will end up being capitalized through inventory into cost of goods sold, others are recorded into selling, general, and administrative expense, or into research and development expense. A tax benefit is recorded as a deferred tax asset since the company is required to wait to record the expense when the shares are exercised for tax purposes. The company uses straight-line to recognize compensation costs of the service period. Once the options are exercised, cancelled, or expired, the deferred tax asset is eliminated for each vesting period following a FIFO basis. The excess tax benefits are calculated using the alternative transition method.
f. Consider Xilinx’s 2013 statement of income, statement of cash flows, and table in the annual report disclosing information about stock-based compensation expense.
a. The total expense before income taxes is $77,862
b. They include this expense in various sections: Cost of Revenues, Research and Development Expense, and Selling, General, and Administrative Expense. The entry is as follows:
c. This expense is added back to the operating section of the cash flows statement since it is a non-cash transaction that impacted net income.
48
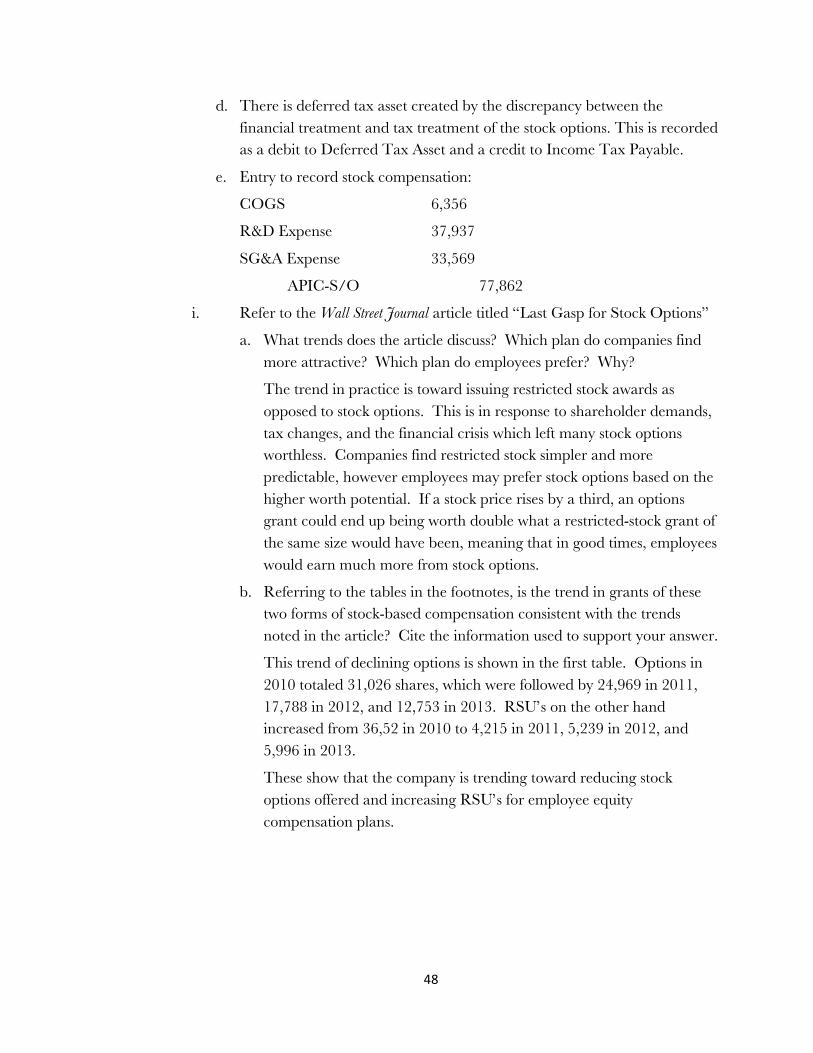
d. There is deferred tax asset created by the discrepancy between the financial treatment and tax treatment of the stock options. This is recorded as a debit to Deferred Tax Asset and a credit to Income Tax Payable.
e. Entry to record stock compensation:
COGS 6,356
R&D Expense 37,937
SG&A Expense 33,569
APIC-S/O 77,862
i. Refer to the Wall Street Journal article titled “Last Gasp for Stock Options”
a. What trends does the article discuss? Which plan do companies find more attractive? Which plan do employees prefer? Why?
The trend in practice is toward issuing restricted stock awards as opposed to stock options. This is in response to shareholder demands, tax changes, and the financial crisis which left many stock options worthless. Companies find restricted stock simpler and more predictable, however employees may prefer stock options based on the higher worth potential. If a stock price rises by a third, an options grant could end up being worth double what a restricted-stock grant of the same size would have been, meaning that in good times, employees would earn much more from stock options.
b. Referring to the tables in the footnotes, is the trend in grants of these two forms of stock-based compensation consistent with the trends noted in the article? Cite the information used to support your answer.
This trend of declining options is shown in the first table. Options in 2010 totaled 31,026 shares, which were followed by 24,969 in 2011, 17,788 in 2012, and 12,753 in 2013. RSU’s on the other hand increased from 36,52 in 2010 to 4,215 in 2011, 5,239 in 2012, and 5,996 in 2013.
These show that the company is trending toward reducing stock options offered and increasing RSU’s for employee equity compensation plans.

49
SECTION 10: BIER HAUS CASE
EXECUTIVE SUMMARY
The Bier Haus Case is a theoretical example to examine ASC 606-10-05-04, ASC 606-10-25-1, and ASC 606-10-25-30 from the FASB codification to discuss when a contract is initiated, when a performance obligation is agreed upon, how transaction price is set and allocated to the performance obligation(s), and how the transaction should be recorded. The case walks through the accounting entries for four separate cases, referencing different areas of the codification in each to explain the appropriate accounting entry based on the situation.
While this case is not as realistic nor company-focused as others in this thesis, it is a good example of how small details can impact treatment for accounting and financial reporting purposes. Additionally, it is an exercise in utilizing and interpreting language from the FASB codification in order to apply the proper accounting treatment to various situations.

50
BIER HAUS CASE
Part I:
Background:
Week 1: a college student walks into the Bier Haus on campus and orders a large plastic cup of beer. The bartender takes the order and says it will cost $5. The student hands the bartender $5. The bartender then pours the beer into a large cup and hands it to the student. The student rushes off to ACCY 304.
Requirements:
1. Read ASC 606-10-05-04, 606-10-25-1 and 606-10-25-30.
2. How does each step in the five-step revenue model apply to this transaction?
Step 1: A verbal contract is initiated between the student and the bartender when the order is taken.
Step 2: The performance obligation is agreed upon, which in this case is the glass of beer being poured.
Step 3: The transaction price of $5 is communicated by the bartender to the student.
Step 4: The transaction price is allocated to the performance obligation when the student hands $5 to the bartender.
Step 5: Revenue is recognized, and the performance obligation is satisfied when the bartender hands the beer to the student.
3. Prepare the journal entry to record the transaction.
Cash 5
Beer Revenue 5
Part II:
Background:
Week 2: the same student goes into the Bier Haus and orders a large beer in an Ole Miss thermal beer mug as part of a “drink on campus” campaign. The student plans to use this mug daily for refills rather than using plastic cups. The bartender pours the beer into the mug and delivers it to the student. The bartender then collects $7 from the student. Standalone selling prices are $5 for the beer and $3 for the mug, so the student got a bargain on the combined purchase. The student takes the beer in the new mug and enjoys it while reading the codification.
Requirements:

51
1. Read ASC 606-10-25-19 to 22 and 606-10-32-31 to 32.
2. How does each step in the five-step revenue model apply to this transaction?
Step 1: A verbal contract is established when the bartender and student agree to a purchase arrangement for a beer and a mug at a discounted price of $7.
Step 2: The performance obligation is for two distinct products, a beer and a mug.
Step 3: The transaction price of $7 is agreed upon by both parties. This discounted transaction price will be recorded separately to the two distinct products at $4.40 and $2.60 respectively.
Step 4: The transaction price is allocated to the performance obligation when the student pays the bartender.
Step 5: Revenue is recognized upon satisfaction of the performance obligation, which is the beer and mug are handed to the student.
3. Prepare the journal entry to record the transaction.
Cash 7
Beer Revenue 4.40
Mug Revenue 2.60
Part III:
Background:
Week 3: the same student goes into the Bier Haus bringing in his beer mug and orders a large beer and a pretzel. Standalone selling prices are $5 for the beer and $2 for the pretzel. The bartender tells the student they are out of pretzels. The bartender then offers the student the large beer and a coupon for two pretzels (its typical business practice) for $7. The student pays the $7 to the bartender. The bartender gives the student a coupon for two pretzels. The bartender pours the beer into the beer mug and hands it to the student. The student then takes the beer and the coupon and heads to the dorm to study for the upcoming Intermediate accounting exam. The Bier Haus sells a coupon for two pretzels for $3.50. To increase visits, these coupons can be redeemed any date after the date of purchase. The Bier Haus has limited experience with these coupons but, so far, these coupons have always been redeemed.
Requirements:
1. Read ASC 606-10-25-2 to 6.
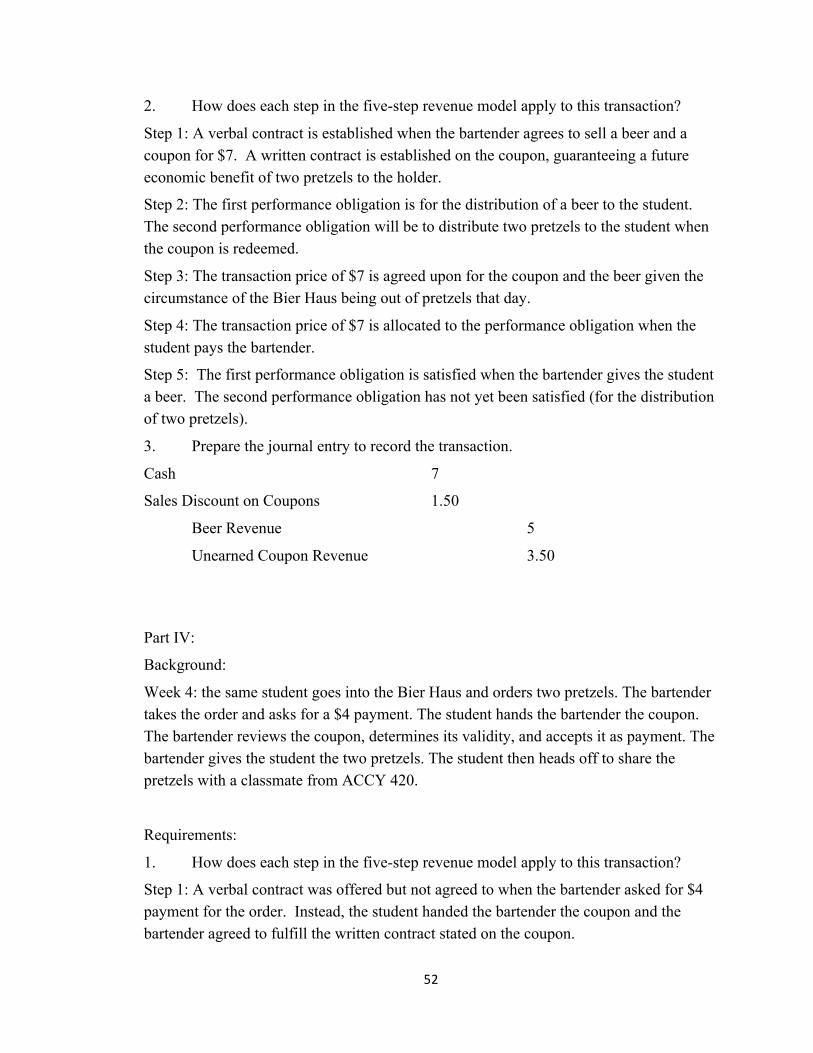
52
2. How does each step in the five-step revenue model apply to this transaction?
Step 1: A verbal contract is established when the bartender agrees to sell a beer and a coupon for $7. A written contract is established on the coupon, guaranteeing a future economic benefit of two pretzels to the holder.
Step 2: The first performance obligation is for the distribution of a beer to the student. The second performance obligation will be to distribute two pretzels to the student when the coupon is redeemed.
Step 3: The transaction price of $7 is agreed upon for the coupon and the beer given the circumstance of the Bier Haus being out of pretzels that day.
Step 4: The transaction price of $7 is allocated to the performance obligation when the student pays the bartender.
Step 5: The first performance obligation is satisfied when the bartender gives the student a beer. The second performance obligation has not yet been satisfied (for the distribution of two pretzels).
3. Prepare the journal entry to record the transaction.
Cash 7
Sales Discount on Coupons 1.50
Beer Revenue 5
Unearned Coupon Revenue 3.50
Part IV:
Background:
Week 4: the same student goes into the Bier Haus and orders two pretzels. The bartender takes the order and asks for a $4 payment. The student hands the bartender the coupon. The bartender reviews the coupon, determines its validity, and accepts it as payment. The bartender gives the student the two pretzels. The student then heads off to share the pretzels with a classmate from ACCY 420.
Requirements:
1. How does each step in the five-step revenue model apply to this transaction?
Step 1: A verbal contract was offered but not agreed to when the bartender asked for $4 payment for the order. Instead, the student handed the bartender the coupon and the bartender agreed to fulfill the written contract stated on the coupon.
53
Step 2: The performance obligation is the delivery of two pretzels.
Step 3: In this case the transaction price had already been agreed upon and paid when the coupon was purchased.
Step 4: The transaction price had already been allocated to the performance obligation when the student purchased the coupon.
Step 5: The purchase obligation is completed and revenue is recognized for the coupon when the pretzels are given to the student.
2. Prepare the journal entry to record the transaction.
Unearned Coupon Revenue 3.50
Coupon Revenue 3.50
54
SECTION 11: ZAGG, INC.
EXECUTIVE SUMMARY
The Zagg, Inc. case is an exploration into the financial reporting impact of deferred tax assets and deferred tax liabilities. The case uses Zagg, Inc. as a vehicle to explain, discuss, and analyze temporary tax differences and permanent tax differences in order to apply the proper accounting and financial reporting treatment.
Further, the case applies these concepts to the company in order to demonstrate calculation and recording of deferred taxes and calculations of effective tax rates resulting from these differences. Finally, the case addresses how deferred tax assets and deferred tax liabilities are consolidated into the net amount shown on the face of the financial statements and why an investor would be interested in seeing and understanding the impact of these values.

55
ZAGG, INC. CASE
a. Book income is the amount of income reported using financial accounting methodology. It is the result of total revenues less total expenses, which in the U.S. are reported under Generally Accepted Accounting Principles (GAAP). This differs from taxable income, which is income reported to the IRS and taxed accordingly, due to differences in requirements and regulations for each kind of reporting. For example, a depreciation expense may be accelerated in financial reporting under a valid GAAP standard; however, that same piece of equipment may be depreciated over the straight-line method for tax purposes as a requirement by the IRS. Discrepancies such as these can cause differences in the reported book income and reported taxable income. Zagg’s 2012 book income for FY2012 is $14,505,000.
b. In your own words, define the following terms:
a. Permanent tax differences: These are tax differences that result from disparities between financial reporting and tax reporting that will never be reconciled. An example of this would be expenses for meals and entertainment. While these expenses will be reported for financial reporting purposes, they are subject to a 50% limitation for tax reporting. The other 50% will never be reconciled to match the financial reporting amounts.
b. Temporary tax differences: Much like permanent tax differences, these arise from disparities between financial reporting and tax reporting; however, these will be reconciled in a subsequent period. An example of a temporary tax difference is depreciation. Financial reporting may use an accelerated depreciation method to capture more of the expense early on in the life of a piece of equipment. Tax reporting requires these to be depreciated using the straight-line method. Therefore, early in the equipment’s life, the financial reporting expenses will be greater. Later in the equipment’s life, that will reverse, and the tax reporting expenses will be greater than the financial reporting depreciation expense. By the time the piece of equipment is fully depreciated, the two will have reconciled to record the same total amount of depreciation.
c. Statutory tax rate: The statutory tax rate is simply the expressed legal tax rate imposed on a certain level of income.
d. Effective tax rate: An effective tax rate is the actual amount of tax that will be paid relative to the total amount of income. The effective tax rate will be lower than the statutory rate due to deductions, exclusions, and other methods of reducing reported tax income.

56
c. For financial reporting purposes, deferred tax assets and deferred tax liabilities are included to accurately represent current assets and current liabilities arising from the temporary and permanent tax differences. The aim of financial reporting is to accurately capture the financial standing of the company, so reporting these deferred tax impacts gives a clearer insight for investors to base valuation of the company upon.
d. A deferred tax liability arises when the income tax expense from financial reporting is greater than that of the income tax payable from tax reporting. This can occur in situations such as accelerated depreciation of equipment. For financial reporting, accelerated depreciation will increase the depreciation expense early in the life of the equipment. This will yield higher expenses reported on financial statements than for tax purposes, creating a deferred tax liability. Later in the life of the equipment, the tax payable from tax reporting will exceed the financial reporting depreciation expense, and the additional tax payment will decrease the deferred tax liability. By the end of the equipment’s useful life, the deferred tax liability should be depleted; however, it will never become a deferred tax asset.
A deferred tax asset occurs when the expenses reported for tax purposes exceed expenses from tax reporting. An example of this is bad debt expense. For financial reporting, bad debts are estimated at the end of each period in order to more closely match expenses with revenues for the period. For tax purposes, however, these estimates cannot be included. Only actual bad debts incurred can be reported. This means that when bad debts are estimated and greater than bad debt write-offs for the period, a deferred tax asset is built up. When those bad debts are written off in the subsequent period, they deplete the allowance for doubtful accounts and will not appear in financial reporting as an expense for that period, but they will be reported for tax purposes, depleting the deferred tax asset.
e. A deferred income tax valuation allowance is used when a company believes it is probable that it will not return a portion of their deferred tax asset. An example of this could be if a company has been operating at a loss and built up a deferred tax asset but believes the company will operate at a loss or be unable to offset the loss against profits. In this case they use a valuation allowance to decrease the deferred tax asset down to what they believe they will realize, or deplete it entirely.
f. Consider the information disclosed in Note 8 – Income Taxes to answer the following
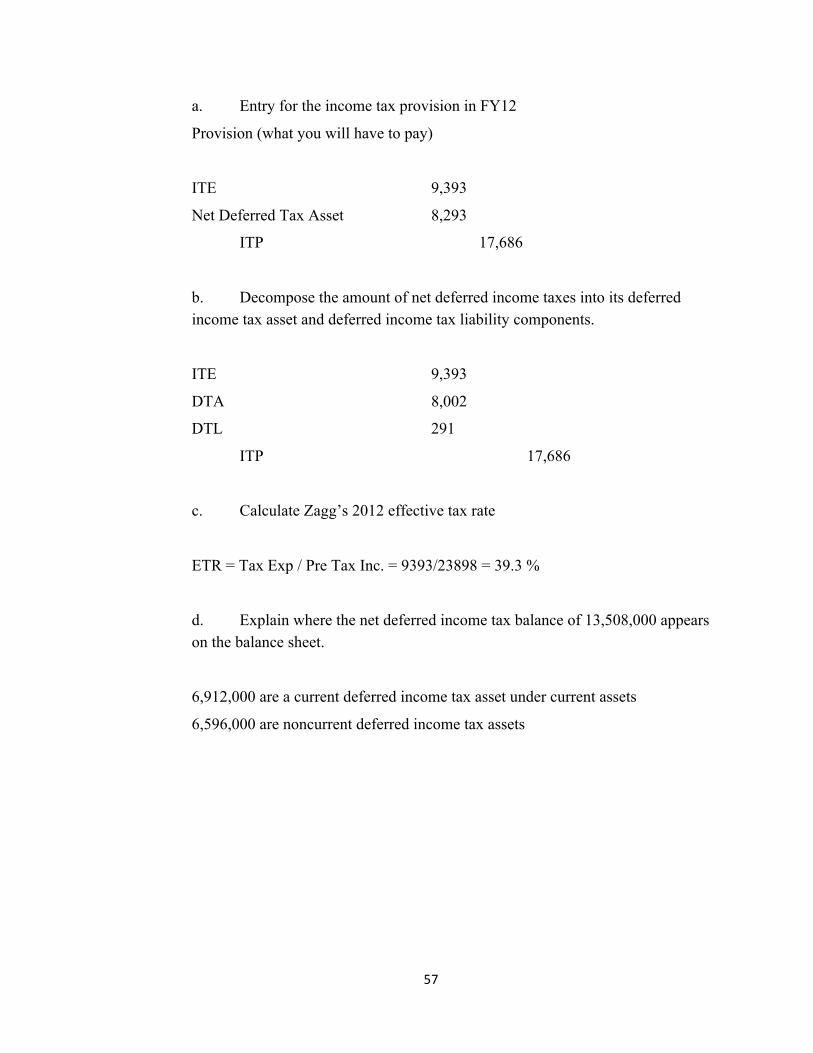
57
a. Entry for the income tax provision in FY12
Provision (what you will have to pay)
ITE 9,393
Net Deferred Tax Asset 8,293
ITP 17,686
b. Decompose the amount of net deferred income taxes into its deferred income tax asset and deferred income tax liability components.
ITE 9,393
DTA 8,002
DTL 291
ITP 17,686
c. Calculate Zagg’s 2012 effective tax rate
ETR = Tax Exp / Pre Tax Inc. = 9393/23898 = 39.3 %
d. Explain where the net deferred income tax balance of 13,508,000 appears on the balance sheet.
6,912,000 are a current deferred income tax asset under current assets
6,596,000 are noncurrent deferred income tax assets

58
Why would an investor care?
Investors often value companies and place trades based on what they expect the company to earn in the future. In predicting future earnings, it can be helpful to know what assets and liabilities are current and will be realized within the next period and which assets and liabilities are long-term and will not be realized for several periods. Current deferred tax assets or liabilities may have a more immediate role in valuing a company, whereas non-current tax impacts may factor into long-term investing decisions.
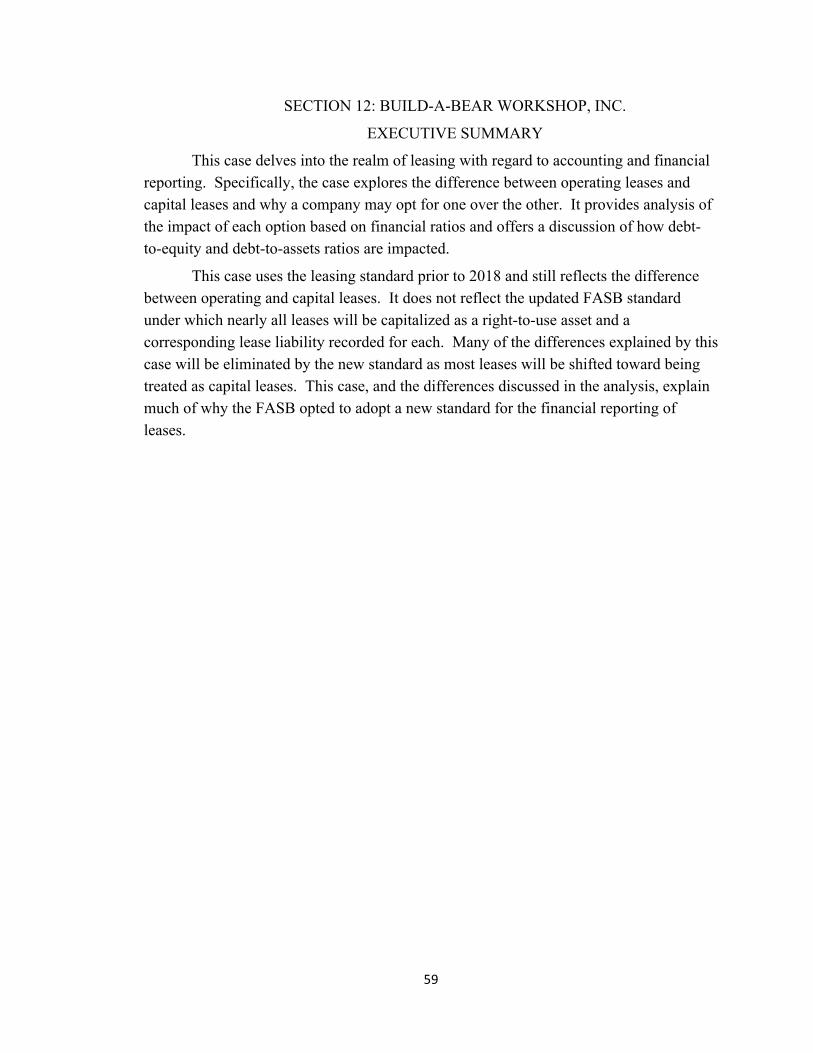
59
SECTION 12: BUILD-A-BEAR WORKSHOP, INC.
EXECUTIVE SUMMARY
This case delves into the realm of leasing with regard to accounting and financial reporting. Specifically, the case explores the difference between operating leases and capital leases and why a company may opt for one over the other. It provides analysis of the impact of each option based on financial ratios and offers a discussion of how debt-to-equity and debt-to-assets ratios are impacted.
This case uses the leasing standard prior to 2018 and still reflects the difference between operating and capital leases. It does not reflect the updated FASB standard under which nearly all leases will be capitalized as a right-to-use asset and a corresponding lease liability recorded for each. Many of the differences explained by this case will be eliminated by the new standard as most leases will be shifted toward being treated as capital leases. This case, and the differences discussed in the analysis, explain much of why the FASB opted to adopt a new standard for the financial reporting of leases.

60
BUILD-A-BEAR WORKSHOP, INC.
a. There are several benefits and incentives for a company to lease certain assets as opposed to purchasing them outright. First of all, by leasing, a smaller amount of up-front capital is required to gain access to the asset. This is good for cash flow management, freeing up liquid assets for other areas of the business. Additionally, leases offer flexibility with returns and updates. For example, if a company leases technology equipment such as computers or phones, they may be able to upgrade their technology more frequently than if they had to purchase each new fleet. Finally, there are tax benefits associated with leases since lease costs can be deducted from business income, reducing the overall tax liability of the company.
b. An operating lease is a relatively short-term lease used to obtain access to an asset or piece of equipment. In an operating lease, ownership is not transferred to the lessee. The asset is not depreciated and the lease expense is recorded in each period. In a capital lease, the lease acts more as a financing activity than a rental activity. Ownership rights are transferred to the lessee and the asset is capitalized and depreciated. A direct-financing lease combines the sales and financing processes. The lessee assumes ownership and pays periodic payments to the lessor. The lessor records revenue on the interest received. A sales-type lease involves real estate. These leases are different in that their carrying value and fair value differ at the start of the lease, however ownership is still transferred to the lessee, similar to capital and direct-financing leases.
c. Different kinds of leases offer different advantages and disadvantages. Differences in leases allow companies to discern specifics on depreciation, ownership, flexibility, and other specific areas to govern different types of assets. For example, a company leasing computer technology may want an operating lease so that they can more frequently update their systems. Capital leases, on the other hand, may be used for assets like equipment that may be used for many periods to come.
d. Five-year lease term, lease payments of $100,000, title does not transfer, useful life of 25 years, and fair value is estimated at $1,500,000
a. Since ownership does not transfer, this will serve as an operating lease.
b. Entry to record the first lease payment.
Rent Expense 100,000
Cash 100,000
c. Assume a second lease identical to the first is offered with a “first year rent-free.” The company makes $125,000 payments at the end of years 2 through 5.
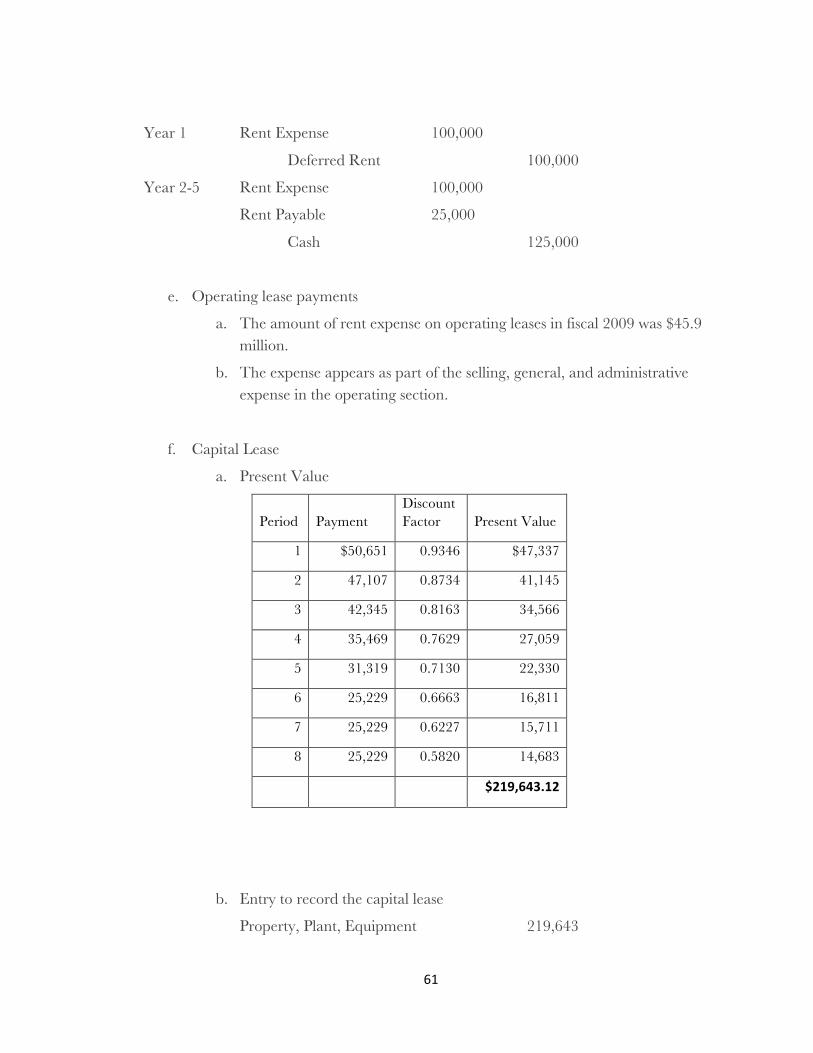
61
Year 1 Rent Expense 100,000
Deferred Rent 100,000
Year 2-5 Rent Expense 100,000
Rent Payable 25,000
Cash 125,000
e. Operating lease payments
a. The amount of rent expense on operating leases in fiscal 2009 was $45.9 million.
b. The expense appears as part of the selling, general, and administrative expense in the operating section.
f. Capital Lease
a. Present Value
Period Payment Discount Factor Present Value
1 $50,651 0.9346 $47,337
2 47,107 0.8734 41,145
3 42,345 0.8163 34,566
4 35,469 0.7629 27,059
5 31,319 0.7130 22,330
6 25,229 0.6663 16,811
7 25,229 0.6227 15,711
8 25,229 0.5820 14,683
$219,643.12
b. Entry to record the capital lease
Property, Plant, Equipment 219,643

62
Lease Obligation 219,643
c. Omit.
d. Omit.
e. Entries
Lease Obligation 35,276
Interest Expense 15,375
Cash 50,651
Depreciation Expense 27,455
Accumulated Depreciation 27,455
g. With an operating lease, the company is able to keep their liabilities down. GAAP currently allows operating leases to be expensed without recording the obligation of future payments as a liability. Instead, these are disclosed in a footnote.
h. Financial ratios
a.
Current ratio: To calculate the current ratio using the capital lease approach to the lease obligation, cash remains constant. In considering the liabilities, it is important to consider both the reduction in the lease obligation on the current interest entry as well as the amount to become current for the upcoming period.
CV after first period
184367
Amount to become current
12905.69
Lease Obligation in Y2
34201.31
Operating Lease Capital Lease
Current Ratio 1.6578 1.6798
Debt-to-Equity 0.7252 1.8440
Long-Term Debt-to-Assets 0.1323 0.4659

63
Debt-to-Equity: Debt is increased with a capital lease by the amount of the total lease obligation, reduced by the amount debited in this year’s entry. The equity section remains unchanged.
Debt-to-Assets: Debt is effected in the same way it is for the Debt-to-Equity ratio. Assets are increased by the total fair market value of the asset and reduced by the accumulated depreciation recorded this year.