survey of educational provision for blind and partially sighted children in england, scotland and...
TRANSCRIPT
http://jvi.sagepub.com/British Journal of Visual Impairment
http://jvi.sagepub.com/content/21/3/93The online version of this article can be found at:
DOI: 10.1177/026461960302100302
2003 21: 93British Journal of Visual ImpairmentSue Keil and Sue Keil
Wales in 2002Survey of educational provision for blind and partially sighted children in England, Scotland and
Published by:
http://www.sagepublications.com
can be found at:British Journal of Visual ImpairmentAdditional services and information for
http://jvi.sagepub.com/cgi/alertsEmail Alerts:
http://jvi.sagepub.com/subscriptionsSubscriptions:
http://www.sagepub.com/journalsReprints.navReprints:
http://www.sagepub.com/journalsPermissions.navPermissions:
http://jvi.sagepub.com/content/21/3/93.refs.htmlCitations:
What is This?
- Sep 1, 2003Version of Record >>
at University of Sussex Library on March 1, 2013jvi.sagepub.comDownloaded from
93
Survey of educational provisionfor blind and partially sightedchildren in England, Scotlandand Wales in 2002by Sue Keil
The purpose of this paper is to present a summaryof the main findings from a postal questionnairesurvey of local education authority (LEA) visualimpairment (VI) services in England, Scotlandand Wales that was carried out by the RoyalNational Institute for the Blind (RNIB) in 2002.A population estimate of just under 24,000blind and partially sighted children aged 0-16in Britain was obtained, 50% of whom haveadditional disabilities. Comparison with data froma similar type of RNIB survey carried out in 1997indicates that the pattern of educational placementhas not changed over the past five years, witharound six in ten visually impaired pupilsbetween the ages of five and 16 being educatedin the mainstream sector.
Introduction
Special educational needs (SEN) provision andfunding in Britain has been subject to considerablechange over the past few years. Some of thesechanges have affected the way in which localeducation authority (LEA) visual impairment (VI)advisory services are organised and administered. In2002 RNIB’s education and employment divisioncarried out its third national postal questionnairesurvey of LEA Vi advisory services. The two previoussurveys were undertaken in 1995 (Clunies-Ross,1997) and in 1997 (Clunies-Ross, Franklin & Keil,1999). Comparison of findings from the three .
surveys enables us to map trends and to obtain
some measure of the impact of central and localGovernment policies on specialist support for pupilswith visual impairment.
The aims of the current survey were: 1 ) To obtain anestimate of the numbers of blind and partially sightedchildren in England, Scotland and Wales who receivespecialist educational support to enable them to accessthe curriculum. 2) To obtain information about the typeof educational provision and support for blind andpartially sighted children across Britain. 3) To obtain anoverview of the policies and practices underpinningeducational provision for children with visual impairment.
Methodology
Survey questionnaireQuestionnaires were mailed to 204 LEA visual
impairment advisory services in England, Scotlandand Wales during January 2002. A response rate of65% of LEAs was obtained, representing 67% of thebase population of 0-16-year-olds in Britain.
Some Vi services experienced difficulties in providingcomplete population data and it would appear, based
on information provided in questionnaires and fromtalking to some heads of VI services, that this isattributable, to some extent at least, to the differentmodels of VI service organisation that now exist. Whenthe last RNIB survey was carried out five years
previously, details about all blind and partially sightedchildren in an LEA (with the possible exception of somepupils with Multiple Disabilities of Visual Impairment(MDVI) educated in special schools) was in most LEAsheld centrally by the Vi service. In 2002 this was nolonger necessarily the case. This seems to occur whereschools with delegated budgets may choose to exercisethe option of ’buying back’ specialist support from theVI service or from an alternative provider. Anotherexample is of mainstream schools additionally resourcedfor pupils with visual impairment using their delegated
at University of Sussex Library on March 1, 2013jvi.sagepub.comDownloaded from
94
funds to function independently from the VI service. Anexample that was also cited was that of some specialschools which directly employ qualified teachers ofpupils with visual impairment (QTVI). As the centralLEA Vi service is not responsible for supportingthe pupils attending these schools, it does not hold
data on them. The implications of this incidentalfinding are discussed further in the conclusion.
Categories of pupil with visual impairment. As inprevious surveys, respondents were asked tocategorise pupils according to age groupingsreflecting the common division in education placementbetween early years (under five years), primary (fiveto 10/11 years) and secondary (11 to 16 years) ages.
For the purposes of this survey children were also
categorised according to whether or not they had otherdifficulties in addition to a visual impairment. Fourcategories were used: visually impaired; visuallyimpaired with additional disabilities; multi-disabledvisually impaired (pupils within the range of severe orprofound and multiple learning difficulties [SLD/PMLD]);and Deafblind (defined as pupils who require substantialintervention/differentiation but do not have SLD or PMLD).
It is emphasised that in allocating children withvisual impairment to what may be seen by some tobe arbitrary categories, the objective was not tolabel them. Neither should these categories beregarded as definitive. We elected to use thesecategories for this particular questionnaire because itwas felt that they would provide information aboutthe characteristics of the population of blind andpartially sighted pupils that are likely to be linked totheir educational support needs and placement.Other research questions may require quite differentpopulation groupings or categories.
Method of analysis. Quantitative data were pre-codedand analysed using the statistical package for the socialsciences (SPSS). Open-ended questions were codedmanually according to emergent categories. Populationestimates for Britain were obtained by extrapolating fromthe Office for National Statistics (ONS) 2001 mid-yearpopulation estimates for all children and young peopleaged 0-16 inclusive in England, Wales and Scotland.
Findings
Numbers of blind and partially sighted children inEngland, Scotland and Wales in 2002. We estimatethat there were just under 24,000 blind and partiallysighted children and young people up to and includingthe age of 16 known to LEA VI services in England,Scotland and Wales in 2002. This estimate is
extrapolated from data provided by 120 LEAs whichbetween them contained 56% of all children up to
and including the age of 16.
Prevalence of visual impairment. The surveyrevealed a prevalence rate of 2.4 blind and partiallysighted children per 1,000 of children and youngpeople up to and including the age of 16. This figureincludes all blind and partially sighted children,including children with additional difficulties. At bothLEA regional and country level there were variationsin the prevalence rate. In the local governmentregions in England, prevalence rates were found torange from 1.7 per 1,000 to 3.1 per 1,000. Therewas less variation between the three countries: for
England a prevalence rate of 2.5 visually impairedchildren per 1,000 was found; and for both Walesand Scotland the figure was 2.0 per 1,000.
Blind and partially sighted children with additionaldisabilities. One in two (50%) of the blind andpartially sighted children identified in Britain had noother disabilities. A little under one in three (30%)had additional complex needs including severe orprofound and multiple learning difficulties, just underone in five (18%) of blind and partially sighted pupilsknown to VI services were found to have additional
disabilities, other than SLD or PMLD. The proportionof children identified as Deafblind was just over 1 %.It should be emphasised that for the purposes ofthis survey the definition of Deafblind was kept verynarrow, and this figure does not therefore representthe complete population of children with dual-sensoryimpairment.
The group of children with visual impairment andadditional complex needs is often (although notuniversally) referred to as being ’multi-disabled,visually impaired’ (MDVI). In previous RNIB surveysof LEA visual impairment advisory services(Clunies-Ross, 1997; Clunies-Ross et al., 1999),pupils with MDVI were found to represent around36% of the visually impaired child population. Thedecrease in the proportion of MDVI pupils may beexplained by the introduction of two new categoriesin the current survey. These are children with
disabilities other than SLD or PMLD, and childrenwith a dual-sensory impairment that necessitatedsubstantial curriculum intervention or differentiation
(but excluding SLD and PMLD). Previous RNIBresearch (Clunies-Ross et al., 1999) had found thatover one in four (28%) of LEA VI services did notconsider learning difficulties an essential criterion forinclusion in the MDVI category. It is therefore possiblethat pupils categorised as MDVI in previous surveyshave been defined by VI services as ’visually
at University of Sussex Library on March 1, 2013jvi.sagepub.comDownloaded from
95
impaired with additional disabilities’ or as ’Deafblind’in the current survey. However, it is also possible thatif, as appears to be the case, some special schoolsprovide support for pupils with visual impairment andlearning difficulties independently of the VI serviceby employing their own qualified teachers of thevisually impaired (QTVI), a proportion of pupils withMDVI in those LEAs may not have been representedin the survey. In any event, RNIB has consistentlymaintained that the population of MDVI children isunder-represented in surveys of LEA VI services as,due to the complexity and severity of other disabilities,their visual impairment is not always recognisedand they are not, therefore, referred to VI advisoryservices. Anecdotal evidence suggests that this isstill the case, and it would appear likely that thereremains a substantial proportion of visually impairedchildren with additional complex needs whose visionhas not been assessed by a QT1/I and whose visualneeds are therefore not being met.
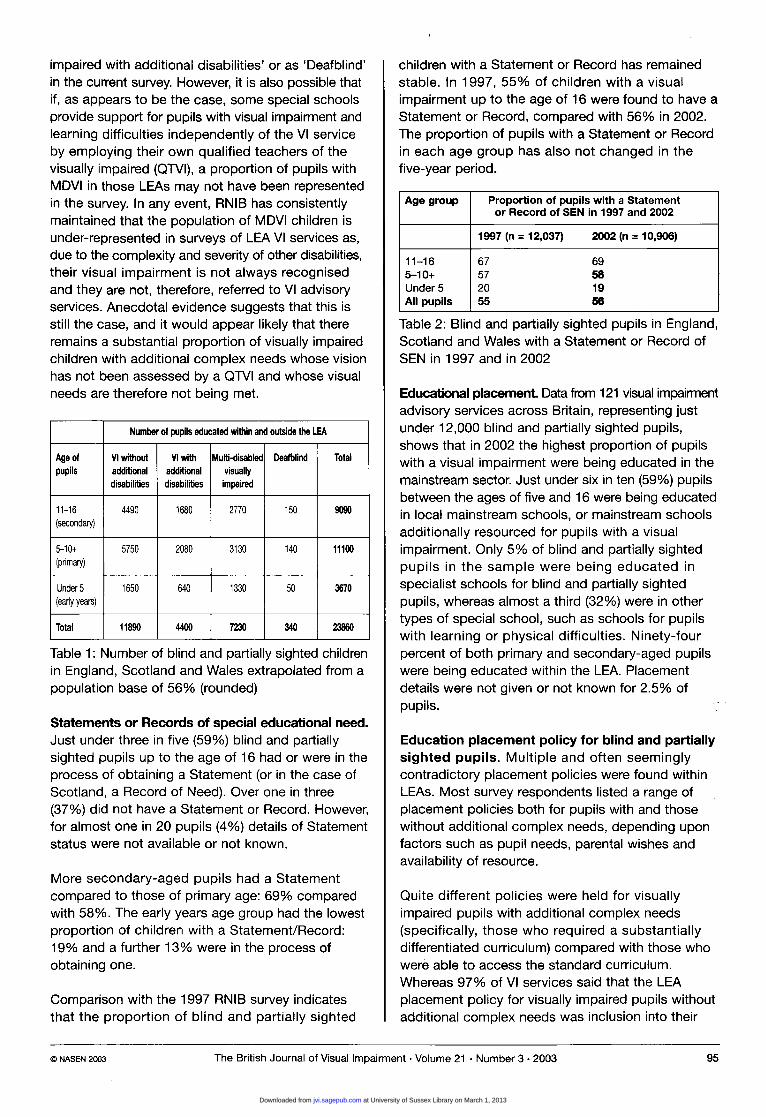
Table 1: Number of blind and partially sighted childrenin England, Scotland and Wales extrapolated from apopulation base of 56% (rounded)
Statements or Records of special educational need.Just under three in five (59%) blind and partiallysighted pupils up to the age of 16 had or were in theprocess of obtaining a Statement (or in the case ofScotland, a Record of Need). Over one in three(37%) did not have a Statement or Record. However,for almost one in 20 pupils (4%) details of Statementstatus were not available or not known.
More secondary-aged pupils had a Statementcompared to those of primary age: 69% comparedwith 58%. The early years age group had the lowestproportion of children with a Statement/Record:19% and a further 13% were in the process of
obtaining one.
Comparison with the 1997 RNIB survey indicatesthat the proportion of blind and partially sighted
children with a Statement or Record has remained
stable. In 1997, 55% of children with a visual
impairment up to the age of 16 were found to have aStatement or Record, compared with 56% in 2002.The proportion of pupils with a Statement or Recordin each age group has also not changed in thefive-year period.
Table 2: Blind and partially sighted pupils in England,Scotland and Wales with a Statement or Record of
SEN in 1997 and in 2002
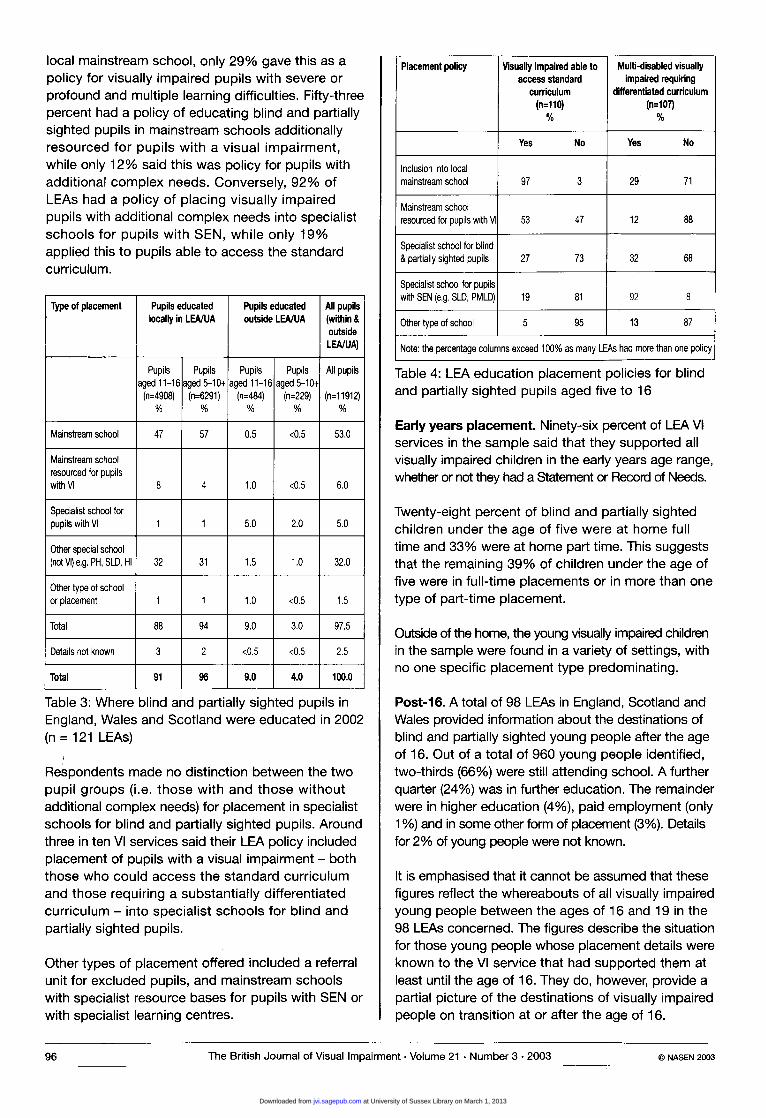
Educational placement Data from 121 visual impairmentadvisory services across Britain, representing justunder 12,000 blind and partially sighted pupils,shows that in 2002 the highest proportion of pupilswith a visual impairment were being educated in themainstream sector. Just under six in ten (59%) pupilsbetween the ages of five and 16 were being educatedin local mainstream schools, or mainstream schools
additionally resourced for pupils with a visualimpairment. Only 5% of blind and partially sightedpupils in the sample were being educated inspecialist schools for blind and partially sightedpupils, whereas almost a third (32%) were in othertypes of special school, such as schools for pupilswith learning or physical difficulties. Ninety-fourpercent of both primary and secondary-aged pupilswere being educated within the LEA. Placementdetails were not given or not known for 2.5% ofpupils. ,
Education placement policy for blind and partiallysighted pupils. Multiple and often seeminglycontradictory placement policies were found withinLEAs. Most survey respondents listed a range ofplacement policies both for pupils with and thosewithout additional complex needs, depending uponfactors such as pupil needs, parental wishes andavailability of resource.
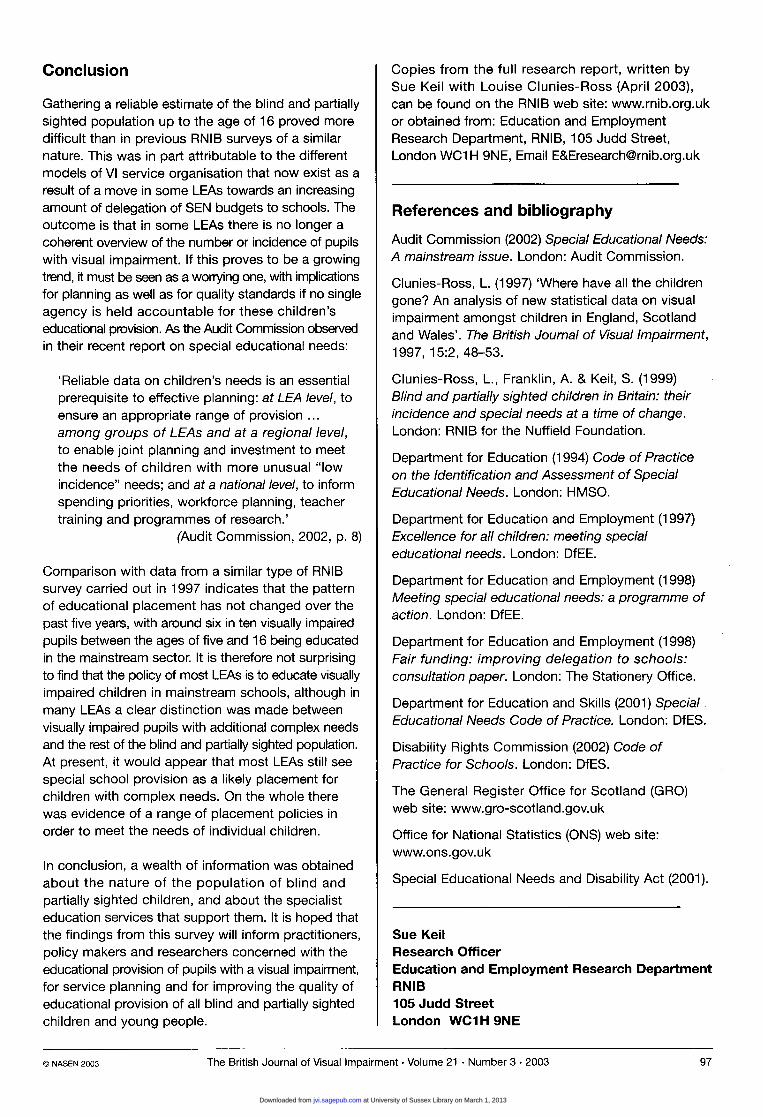
Quite different policies were held for visuallyimpaired pupils with additional complex needs(specifically, those who required a substantiallydifferentiated curriculum) compared with those whowere able to access the standard curriculum.
Whereas 97% of VI services said that the LEA
placement policy for visually impaired pupils withoutadditional complex needs was inclusion into their
at University of Sussex Library on March 1, 2013jvi.sagepub.comDownloaded from
96
local mainstream school, only 29% gave this as apolicy for visually impaired pupils with severe orprofound and multiple learning difficulties. Fifty-threepercent had a policy of educating blind and partiallysighted pupils in mainstream schools additionallyresourced for pupils with a visual impairment,while only 12% said this was policy for pupils withadditional complex needs. Conversely, 92% ofLEAs had a policy of placing visually impairedpupils with additional complex needs into specialistschools for pupils with SEN, while only 19%applied this to pupils able to access the standardcurriculum.
Table 3: Where blind and partially sighted pupils inEngland, Wales and Scotland were educated in 2002(n = 121 LEAs)
Respondents made no distinction between the twopupil groups (i.e. those with and those withoutadditional complex needs) for placement in specialistschools for blind and partially sighted pupils. Aroundthree in ten Vi services said their LEA policy includedplacement of pupils with a visual impairment - boththose who could access the standard curriculum
and those requiring a substantially differentiatedcurriculum - into specialist schools for blind andpartially sighted pupils.
Other types of placement offered included a referralunit for excluded pupils, and mainstream schoolswith specialist resource bases for pupils with SEN orwith specialist learning centres.
Table 4: LEA education placement policies for blindand partially sighted pupils aged five to 16
Early years placement. Ninety-six percent of LEA Viservices in the sample said that they supported allvisually impaired children in the early years age range,whether or not they had a Statement or Record of Needs.
Twenty-eight percent of blind and partially sightedchildren under the age of five were at home full
time and 33% were at home part time. This suggeststhat the remaining 39% of children under the age offive were in full-time placements or in more than onetype of part-time placement.
Outside of the home, the young visually impaired childrenin the sample were found in a variety of settings, withno one specific placement type predominating.
Post-16. A total of 98 LEAs in England, Scotland andWales provided information about the destinations ofblind and partially sighted young people after the ageof 16. Out of a total of 960 young people identified,two-thirds (66%) were still attending school. A furtherquarter (24%) was in further education. The remainderwere in higher education (4%), paid employment (only1 %) and in some other form of placement (3%). Detailsfor 2% of young people were not known.
It is emphasised that it cannot be assumed that thesefigures reflect the whereabouts of all visually impairedyoung people between the ages of 16 and 19 in the98 LEAs concerned. The figures describe the situationfor those young people whose placement details wereknown to the VI service that had supported them atleast until the age of 16. They do, however, provide apartial picture of the destinations of visually impairedpeople on transition at or after the age of 16.
at University of Sussex Library on March 1, 2013jvi.sagepub.comDownloaded from
97
Conclusion
Gathering a reliable estimate of the blind and partiallysighted population up to the age of 16 proved moredifficult than in previous RNIB surveys of a similarnature. This was in part attributable to the differentmodels of Vi service organisation that now exist as aresult of a move in some LEAs towards an increasingamount of delegation of SEN budgets to schools. Theoutcome is that in some LEAs there is no longer acoherent overview of the number or incidence of pupilswith visual impairment. If this proves to be a growingtrend, it must be seen as a worrying one, with implicationsfor planning as well as for quality standards if no singleagency is held accountable for these children’s
educational provision. As the Audit Commission observedin their recent report on special educational needs:
’Reliable data on children’s needs is an essential
prerequisite to effective planning: at LEA level, toensure an appropriate range of provision ...
among groups of LEAs and at a regional level,to enable joint planning and investment to meetthe needs of children with more unusual &dquo;low
incidence&dquo; needs; and at a national level, to inform
spending priorities, workforce planning, teachertraining and programmes of research.’
(Audit Commission, 2002, p. 8)
Comparison with data from a similar type of RNIBsurvey carried out in 1997 indicates that the patternof educational placement has not changed over thepast five years, with around six in ten visually impairedpupils between the ages of five and 16 being educatedin the mainstream sector. It is therefore not surprisingto find that the policy of most LEAs is to educate visuallyimpaired children in mainstream schools, although inmany LEAs a clear distinction was made between
visually impaired pupils with additional complex needsand the rest of the blind and partially sighted population.At present, it would appear that most LEAs still see
special school provision as a likely placement forchildren with complex needs. On the whole therewas evidence of a range of placement policies inorder to meet the needs of individual children.
In conclusion, a wealth of information was obtainedabout the nature of the population of blind andpartially sighted children, and about the specialisteducation services that support them. It is hoped thatthe findings from this survey will inform practitioners,policy makers and researchers concerned with theeducational provision of pupils with a visual impairment,for service planning and for improving the quality ofeducational provision of all blind and partially sightedchildren and young people.
Copies from the full research report, written bySue Keil with Louise Clunies-Ross (April 2003),can be found on the RNIB web site: www.rnib.org.ukor obtained from: Education and EmploymentResearch Department, RNIB, 105 Judd Street,London WC1 H 9NE, Email E&[email protected]
References and bibliography
Audit Commission (2002) Special Educational Needs:A mainstream issue. London: Audit Commission.
Clunies-Ross, L. (1997) ’Where have all the childrengone? An analysis of new statistical data on visualimpairment amongst children in England, Scotlandand Wales’. The British Journal of Visual Impairment,1997, 15:2, 48-53.
Clunies-Ross, L., Franklin, A. & Keil, S. (1999)Blind and partially sighted children in Britain: theirincidence and special needs at a time of change.London: RNIB for the Nuffield Foundation.
Department for Education (1994) Code of Practiceon the Identification and Assessment of SpecialEducational Needs. London: HMSO.
Department for Education and Employment (1997)Excellence for all children: meeting specialeducational needs. London: DfEE.
Department for Education and Employment (1998)Meeting special educational needs: a programme ofaction. London: DfEE.
Department for Education and Employment (1998)Fair funding: improving delegation to schools:consultation paper. London: The Stationery Office.
Department for Education and Skills (2001) SpecialEducational Needs Code of Practice. London: DfES.
Disability Rights Commission (2002) Code ofPractice for Schools. London: DfES.
The General Register Office for Scotland (GRO)web site: www.gro-scotland.gov.uk
Office for National Statistics (ONS) web site:www.ons.gov.uk
Special Educational Needs and Disability Act (2001).
Sue Keil
Research Officer
Education and Employment Research DepartmentRNIB
105 Judd Street
London WC1 H 9NE
at University of Sussex Library on March 1, 2013jvi.sagepub.comDownloaded from