survey of la policies, staffing and … · survey of la policies, staffing and resources for the...
TRANSCRIPT

SURVEY OF LA POLICIES, STAFFING AND RESOURCES FOR THE HISTORIC ENVIRONMENT IN SCOTLAND
Geoff Peart Consulting with
Arup Planning
2009
i
CONTENTS
EXECUTIVE SUMMARY iii CHAPTER 1: INTRODUCTION BACKGROUND TO THE RESEARCH 1 PROJECT AIMS AND OBJECTIVES 2 CHAPTER 2: RESEARCH METHODOLOGY DESK-BASED LITERATURE REVIEW 3 STAKEHOLDER DISCUSSIONS 3 LOCAL AUTHORITY SURVEY 5 CHAPTER 3: LOCAL AUTHORITY MANAGEMENT OF THE HISTORIC ENVIRONMENT OPERATING CONTEXT 8 HISTORIC ENVIRONMENT STAFFING 12 FINANCIALRESOURCESFOR THE HISTORIC ENVIRONMENT 21 HISTORIC ENVIRONMENT WORKLOAD 28 HISTORIC ENVIRONMENT PERFORMANCE 40 HISTORIC ENVIRONMENT POLICIES 47 CHAPTER 4: CONCLUSIONS INTRODUCTION 52 THE QUESTIONNAIRE SURVEY METHODOLOGY 52 OPERATING CONTEXT 54 INPUTS AND OUTCOMES 57 NEED AND EFFECTIVENESS 61 IMPLICATIONS FOR THE MANAGEMENT OF THE HISTORIC ENVIRONMENT 64
ANNEXES: ANNEX 1: SURVEY QUESTIONNAIRE ANNEX 2:CASE STUDY INTERVIEW TEMPLATE ANNEX 3: LIST OF RESOURCES USED
Note: This report has been prepared by independent consultants and any opinions expressed in the document are those of the consultants, not of Historic Scotland.
ii
TABLES and FIGURES
Table 2.1: Responses from Survey Authority Departments 6 Table 3.1: Principal Local Authority Historic Environment Services 8 Table 3.2: Broad Organisational Arrangements for the Delivery of Historic Environment Services 9 Figure 3.1: Historic Environment Assets per 1000 Population in Survey Authorities 10 Figure 3.2: Historic Environment Assets per Square Kilometre in Survey Authorities 11 Table 3.3: Main HE - Related Functions of LA/NPA Specialist and Support Staff 12 Figure 3.3: HE Assets per head of Core HE Staff 13 Figure 3.4: LBCs and CACs determined per 1.0 FTE DM Staff in Survey Authorities 14 Figure 3.5: FTE Conservation Policy and Projects Staff in Survey Authorities 15 Figure 3.6: FTE Archaeological Services Staff in Survey Authorities 16 Table 3.4: Salary Structure of Historic Environment Specialist Staff 16 Table 3.5: Age Structure of Historic Environment Specialist Staff 17 Table 3.6: Qualifications held by Historic Environment Specialist Staff 18 Table 3.7: Professional Affiliations held by Historic Environment Specialist Staff 18 Table 3.8: Training Opportunities provided for Historic Environment Specialist Staff 19 Table 3.9: Most Useful Additional Skills or Training for HE Specialist Staff 19 Table 3.10: Past and Projected Changes in Historic Environment Specialist Staff 20 Table 3.11: Past and Projected Changes in Historic Environment Support Staff 21 Figure 3.7: Expenditure per Head of Population on HE ‘Core’ Staff Salary and Overheads 22 Table 3.12: Expenditure on Historic Environment Activities 2007-8 by Survey Authorities 23 Figure 3.8: Payments to Third Parties for Historic Environment Services 24 Table 3.13: Past and Projected Changes in Historic Environment Expenditure 25 Table 3.14: Income from Historic Environment Activities 2007-8 by Survey Authorities 25 Figure 3.9: External Heritage Grants Received by Survey Authorities 26 Table 3.15: Heritage Grants Applications by Survey Authorities 26 Table 3.16: Past and Projected Changes in Historic Environment Income 27 Table 3.17: HE Specialist Services undertaken by Survey Authorities 29 Figure 3.10: Historic Buildings Advice Share of Total HE Workload 29 Figure 3.11: Conservation Project Management Share of Total HE Workload 30 Table 3.18: HE Specialist Services procured by Survey Authorities 31 Table 3.19: HE Specialist Services provided by Survey Authorities to Other Authorities 31 Table 3.20: HE Specialist input to the determination of Planning Applications and Appeals 33 Table 3.21: Levels of LBC and CAC Activity in Survey Authorities 33 Table 3.22: Progress with conservation area Appraisals in Scotland 34 Figure 3.12: Progress with conservation area Appraisals in Survey Authorities 34 Table 3.23: Levels of HE-Related Enforcement Activity in Survey Authorities 35 Table 3.24: Historic Environment Records kept by Survey Authorities 35 Table 3.25: Management of Historic Environment Records by Survey Authorities 37 Table 3.26: Archaeological Services provided by Survey Authorities 37 Figure 3.13: Advice on Planning Applications Share of Total Archaeological Workload 38 Table 3.27: Outreach Activities undertaken by Survey Authorities 39 Table 3.28: Past and Projected Changes in Historic Environment Workload 39 Table 3.29: Type of difficulties in delivering historic environment services 41 Figure 3.14: Authorities having difficulties in delivering historic environment services 41 Figure 3.15: Number of HE Performance Indicators (PIs) Used by Survey Authorities 42 Table 3.30: Suggested Ideas for Future Performance Indicators 44 Table 3.31: Examples of Best Practice in the Management of the Historic Environment 47 Table 3.32: References to the Historic Environment in Community Plans 48 Table 3.33: Assessment of Development Plan Policies for the Historic Environment 51 Table 4.1: Suggested Future Audit Indicators 53

iii
EXECUTIVE SUMMARY
PROJECT AIMS AND OBJECTIVES
In 2007 the Historic Environment Advisory Council for Scotland (HEACS) recommended to Scottish Ministers that there should be an independent survey of local authority policies, staffing and resources for the historic environment. Ministers accepted this recommendation and in December 2007, Geoff Peart Consulting and Arup were awarded the contract by Historic Scotland to carry out and report on the survey. The aim of the project was to gather and analyse information on policies, staffing and resources, so as to enable the need for local authority historic environment services; current inputs and outcomes; the effectiveness of delivery and the implications of these results for the ongoing and future management of the historic environment in Scotland to be assessed.
RESEARCH METHODOLOGY After piloting the survey with three authorities, a comprehensive self-completion questionnaire was issued to around 100 appropriate staff in the 32 local authorities and two National Parks. Responses were received from all authorities, but not from all services within those authorities with historic environment responsibilities. Every respondent did not answer all of the questions but a reasonable response was obtained in relation to ‘core’ services. Five local authorities were also selected as case studies for more intensive analysis of issues surrounding their management of the local historic environment While it was understandable that in trying to establish benchmark information there would be a desire to be comprehensive, the conclusion from this exercise is that too much information was requested at one time. The lesson for the future, if this, or a similar, exercise is to be repeated, is that a much shorter, more focused questionnaire, perhaps dealing with different topics on a rolling basis, would provide a better model for data collection
LOCAL AUTHORITY MANAGEMENT OF THE HISTORIC ENVIRONMENT
Operating Context The survey authorities vary considerably in terms of their population size, land area and distribution of heritage assets and this clearly has some implications in relation to the capacity of different sizes of authority to manage the historic environment. No local authority located all of the activities concerned with the management of the historic environment within a single department and responsibilities were usually distributed across a number of services and in some instances contracted out to external providers. The overall picture was one of fragmentation of responsibilities, albeit in most authorities a significant ‘core’ of activities is located in the Planning Service. The historic environment had to compete with a wide range of other services and was not generally high in terms of local political priorities. Staffing The overall number of staff with some historic environment responsibilities identified by the survey totalled 203 FTEs, but this underestimated those in maintenance, outreach and
iv
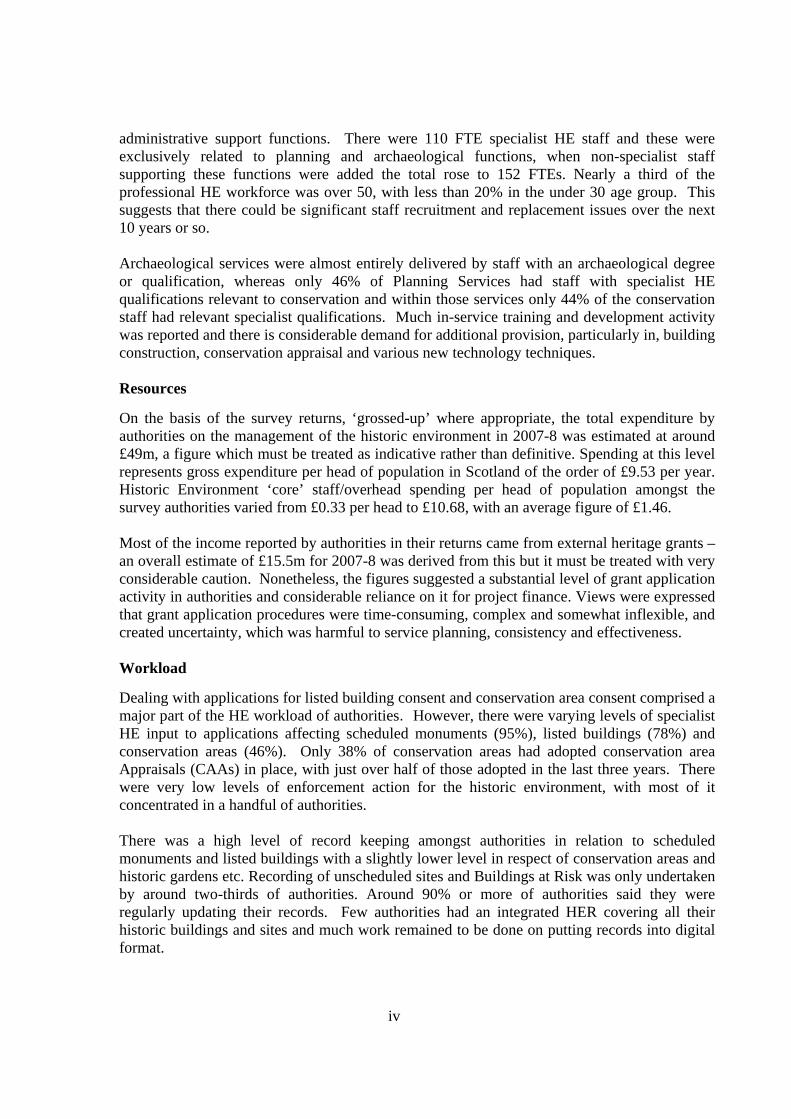
administrative support functions. There were 110 FTE specialist HE staff and these were exclusively related to planning and archaeological functions, when non-specialist staff supporting these functions were added the total rose to 152 FTEs. Nearly a third of the professional HE workforce was over 50, with less than 20% in the under 30 age group. This suggests that there could be significant staff recruitment and replacement issues over the next 10 years or so. Archaeological services were almost entirely delivered by staff with an archaeological degree or qualification, whereas only 46% of Planning Services had staff with specialist HE qualifications relevant to conservation and within those services only 44% of the conservation staff had relevant specialist qualifications. Much in-service training and development activity was reported and there is considerable demand for additional provision, particularly in, building construction, conservation appraisal and various new technology techniques. Resources On the basis of the survey returns, ‘grossed-up’ where appropriate, the total expenditure by authorities on the management of the historic environment in 2007-8 was estimated at around £49m, a figure which must be treated as indicative rather than definitive. Spending at this level represents gross expenditure per head of population in Scotland of the order of £9.53 per year. Historic Environment ‘core’ staff/overhead spending per head of population amongst the survey authorities varied from £0.33 per head to £10.68, with an average figure of £1.46. Most of the income reported by authorities in their returns came from external heritage grants – an overall estimate of £15.5m for 2007-8 was derived from this but it must be treated with very considerable caution. Nonetheless, the figures suggested a substantial level of grant application activity in authorities and considerable reliance on it for project finance. Views were expressed that grant application procedures were time-consuming, complex and somewhat inflexible, and created uncertainty, which was harmful to service planning, consistency and effectiveness. Workload Dealing with applications for listed building consent and conservation area consent comprised a major part of the HE workload of authorities. However, there were varying levels of specialist HE input to applications affecting scheduled monuments (95%), listed buildings (78%) and conservation areas (46%). Only 38% of conservation areas had adopted conservation area Appraisals (CAAs) in place, with just over half of those adopted in the last three years. There were very low levels of enforcement action for the historic environment, with most of it concentrated in a handful of authorities. There was a high level of record keeping amongst authorities in relation to scheduled monuments and listed buildings with a slightly lower level in respect of conservation areas and historic gardens etc. Recording of unscheduled sites and Buildings at Risk was only undertaken by around two-thirds of authorities. Around 90% or more of authorities said they were regularly updating their records. Few authorities had an integrated HER covering all their historic buildings and sites and much work remained to be done on putting records into digital format.

v
Archaeological advice on planning applications affecting historic interests and the maintenance of archaeological records was provided by around 60% of authorities (excluding those with outsourcing arrangements) and these activities on average comprised around 57% of the archaeological service workload, where authorities delivered this service themselves. Promotional and outreach activities also formed an essential, if relatively minor, part (10%) of the workload of historic environment services. Nearly 90% of authorities felt that there had been a recent increase in workload and 96% considered that this would be likely to continue over the next three years. The general picture to emerge was of statutory HE regulatory functions dominating the workload and authorities generally coping with demands but not without difficulty. Enforcement continued to be a key area of under-activity. Proactive work on conservation areas appeared to have improved in recent years but there was a substantial backlog of Appraisals. Overall, the survey and case study interviews showed that the workload focus was on meeting statutory requirements and even this was not at desirable levels, for example: record keeping and monitoring were not as good as they should have been; availability of expert advice was restricted; enforcement activity was very low; CAAs only covered 30-40% of conservation areas; etc. In relation to more proactive activities - the ability of many authorities to work up new projects, seek support funding and intervene to save/improve buildings - was limited. Needs and Performance HE officers were clear that the historic environment was a vital element both in place-making and sustainable development and was important in creating better places. It would appear from views expressed to us that there was more work to be done to spread these convictions to senior local authority managers and politicians. Survey returns indicate that at present there was no rigorous way of measuring the performance of authorities in relation to either their efficiency or their effectiveness in managing the historic environment. Approaches were patchy and unsystematic. Around a third had no specific HE performance indicators at all and there was little consistency in the measures used – with a mix of process, activity and impact measures. However, a national indicator has now been agreed and was being used by a number of authorities. None of the survey authorities indicated that they had developed a set of local service standards for the historic environment, or that they carried out any regular self assessment against these standards. The possible introduction of national standards, as benchmarks against which to judge local provision and performance, produced a mixed response from respondents. Policies In terms of Community Planning across Scotland the historic environment barely features. The new Single Outcome Agreement process explicitly refers to the historic environment, but action on meaningful performance indicators was weak. Nonetheless, the SOA process provides a framework within which a national performance management system for the historic environment could be developed.
vi
With respect to Development Plan policies for the historic environment, these were effectively in place in all authorities, although respondents indicated that more Supplementary Guidance on key local issues could be useful. There was little systematic evidence on the effectiveness of Development Plan HE policies available and none was obtained from the survey. The 2006 Planning Act imposed a statutory duty to assess the effectiveness of policies and there was a potential overlap between this and arrangements in respect of the SOA performance monitoring process CONCLUSIONS There is, as yet, no currently available, systematic definition of ‘need’ in relation to the historic environment. The view of some respondents was that needs were not being properly met. The system was coping with the pressures with which it had to deal and there was no evidence that it was in crisis, but all authorities identified areas of unmet need, some of which were significant. In particular, the system did not appear to have the capacity to undertake many of the discretionary activities which would make local stewardship more effective.
1
CHAPTER 1: INTRODUCTION BACKGROUND
1.1 In its ‘Report and recommendations on the role of local authorities in conserving the historic environment’ the Historic Environment Advisory Council for Scotland (HEACS) made a number of recommendations to Scottish Ministers on how to strengthen the role of local authorities in relation to the historic environment. In the course of its work in preparing the report, HEACS noted that there was a lack of basic evidence to enable a detailed assessment of the issues. Ministers accepted a recommendation that they should ‘commission an independent survey of current local authority policies, staffing and resources at the earliest opportunity’. Historic Scotland has taken this forward, using its existing Local Authority Historic Environment Forum Working Group (LAHEFWG), comprising a range of national and local government professionals with an interest in the historic environment, to steer the survey process.
1.2 Local authorities have major responsibilities for the conservation of the historic environment and the delivery of historic environment services in Scotland, mainly through the planning system. The HEACS report identified that local authorities had ‘considerable delegated authority to allocate their budgets and discharge their planning powers according to local circumstances and priorities’ and that ‘this level of autonomy, together with local circumstances and diversity in the nature of the heritage resource inevitably leads to a varied response to the way in which local authorities organise themselves to care for the historic environment’. 1.3 To date there has been no comprehensive research undertaken in Scotland to provide a detailed insight into the workings of local authorities in conserving the historic environment. It is anticipated that this survey will establish baseline information about current local authority policies, staffing and resources for both policy-makers and practitioners across the sector. The LAHEFWG considered that the baseline information provided by this survey might also be useful in relation to several other recommendations made by HEACS to Ministers, in particular: recommendation (6) ‘to establish a recommended set of performance indicators for local authorities dealing with historic environment matters’; and recommendation (7) ‘to develop minimum national standards for a quality local authority historic environment service including professional standards, staffing and resources’. 1.4 In December 2007, Geoff Peart Consulting and Arup were awarded the contract to design, carry out and report on the survey and make recommendations on possible performance indicators and standards for the sector. PROJECT AIM AND OBJECTIVES
1.5 The overall aim of the project was to gather and analyse information on current local authority policies, staffing and resources to inform an assessment of how local authorities manage the historic environment.
2
1.6 The specific project objectives were, first, to gather and analyse information from local authorities and other relevant stakeholders that would address:
• the operating context for local authorities in relation to the protection and management of the historic environment;
• the need for local authority historic environment services; • the current inputs and outcomes in terms of local authority policies, staffing and
resources for the historic environment; • the effectiveness of local authorities in providing historic environment services; • the implications of these results for the ongoing and future management of the historic
environment in Scotland.
The brief also indicated the need to suggest suitable peer groups that could be used to report local authority results in an anonymised and aggregate form. 1.7 The second objective was to recommend relevant headline indicators that could be used to assess trends over time and which could contribute to the establishment of a set of performance indicator for local authorities dealing with historic environment matters. 1.8 The third objective was to highlight any baseline information and issues from the study that might be of use in considering minimum standards for provision of local authority historic environment services. The research specification also required the contractor to undertake follow-up case studies to explore some of the more complex issues, such as effectiveness, in more detail.
3
CHAPTER 2: RESEARCH METHODOLOGY
DESK-BASED LITERATURE REVIEW 2.1 The research specification highlighted a number of useful sources relating to the historic environment and local authority surveys and particular use was made of:
• Local Authority Conservation Provision in England (Oxford Brookes University); • Historic Environment Local Delivery Project (Atkins); • Local Authority Involvement in the Historic Environment (IHBC); • Scotland’s Historic Environment Audit (Historic Scotland).
These were supplemented by a further internet-based literature search and review which was used to inform other aspects of the research. A full list of the resources used is attached at Annex 3. 2.2 Three other specific pieces of desk-based research were undertaken. These were:
• an analysis of the treatment of the historic environment in Community Plans; • an analysis of the treatment of the historic environment in a sample of Single Output
Agreement documents; • an analysis of the conformity of Local Plan policies for the historic environment with
model policies set out in the then draft SPP 23 (in this we were assisted by some work undertaken by the Scottish Civic Trust).
STAKEHOLDER DISCUSSIONS 2.3 The first event required under the agreed methodology was a workshop for key stakeholders in the historic environment. Consequently, it was agreed that key historic environment stakeholder contacts would be invited to a workshop to be held on 4 February 2008, in the Historic Scotland Holyrood Education Centre, Edinburgh. 2.4 Representatives of the following organisations were invited to the workshop:
• Built Environment Forum Scotland (BEFS); • Institute of Field Archaeologists (IFA); • Convention of Scottish Local Authorities (COSLA); • Association of Local Government Archaeology Officers (ALGAO); • Council for Scottish Archaeology (CSA) (now Archaeology Scotland); • Architectural Heritage Society Scotland (AHSS); • National Trust for Scotland (NTS); • Scottish Civic Trust (SCT); • Scottish Society of Directors of Planning (SSDP); • Royal Commission on Ancient and Historical Monuments Scotland (RCAHMS); • Institute of Historic Building Conservation (IHBC); • Heritage Lottery Fund (HLF);
4
• Scottish Government Planning Directorate (SGPD); • Scottish Government Rural Directorate (SGRD); • Scottish Government Landscapes and Habitats Directorate (SGLHD); • Historic Environment Advisory Council for Scotland (HEACS); • Scottish Natural Heritage (SNH).
Historic Scotland staff were also present. In all, 22 people attended the workshop (excluding the consultants) and all bar three of the organisations identified above were represented. In addition, ECOTEC, the consultants appointed by HEACS to assess the economic impact of the historic environment in Scotland were also present and arrangements were made for the exchange of relevant information between the two parallel exercises. 2.5 The purpose of the stakeholder workshop was to bring together an expert group to explore fully what the issues were, to scope the survey and devise a suitable methodology. The workshop covered:
• the identification of the full scope of historic environment activities; • the identification of available sources of existing data on local policies, activities and
resources; • the identification of key historic environment contacts both in local authorities and
other HE stakeholders not represented at the workshop - especially local trusts and societies;
• the development of a better understanding of the operational context within which local authorities delivered services for the historic environment;
• the identification and consideration of the key issues which the local authority questionnaire should address, including the best format for the questionnaire;
• preliminary consideration of potential effectiveness and performance measures for the local management of the historic environment.
2.6 The main conclusions from the workshop were:
• general support for the wide SHEP 1 definition of the historic environment to be used to scope involvement in the survey;
• a number of further possible sources of published data were identified; • there was confirmation that the pattern of provision across authorities was likely to be
quite varied and that consequently this had to be reflected in the survey design; • staff skills and competencies in HE were highlighted as important issues for the survey; • it was suggested that the survey should try to identify what elements of the HE
workload were not prioritised or undertaken because of insufficient resources; • it was confirmed that the survey would need to address the role of arms-length bodies
working on behalf of the LA and the HE; • there was a view that the survey should try and measure whether LAs were taking a
reactive or proactive approach towards the HE; • there was strong support for piloting the LA survey before going ‘live’; • some potential ‘case study’ authorities were suggested; • there was support for a stakeholder survey but the scale and diversity of the group was
noted as a potential difficulty in terms of realistic coverage.

5
THE LOCAL AUTHORITY SURVEY
Survey Design and Scope 2.7 Following discussions with the client it was agreed that the survey would seek to target key contacts in local authorities directly rather than to adopt a centralised approach. In order to identify appropriate key contacts, the study team wrote to all LA Chief Executives to introduce the project, set out what would be involved, how they would benefit from it, and to request that they nominate key personnel in their authority whose roles related to the historic environment. This letter was sent out on 22 February 2008. 2.8 It was hoped that staff would be nominated from a wide range of services within the council, including those with responsibilities for highways, parks and educational outreach as well as the planning and archaeological services which were more commonly associated with the historic environment. Although Chief Executives identified about 100 individuals across Scotland, some responses nominated only one individual contact, typically a leading officer with responsibilities for planning or archaeological services. This hampered the team’s ability to obtain the widest possible range of data for further analysis. 2.9 After the stakeholder workshop on 4 February, a scoping paper was prepared. Appropriate councils were identified for the pilot surveys: Scottish Borders Council as a rural authority; City of Edinburgh Council as a large urban authority; and Perth and Kinross Council as a mix of urban and rural. The pilot surveys were launched in the week beginning 10 March and returned on 28 March 2008.
2.10 Following the pilot exercise, the survey was amended slightly. Minor revisions were also required better to reflect the circumstances of those authorities which supply historic environment services to neighbouring authorities. The final survey questionnaires were issued by e-mail to all local authority contacts on 21 and 22 April. Recipients were asked to return their forms by the end of May 2008. A copy of the survey is attached at Annex 1.
2.11 The surveys were accompanied by a request for respondents to reply on behalf of their service alone, rather than on behalf of the whole LA. This was intended to minimise the time required to fill in the form, but led to a very fragmented response which made the analysis considerably more complex than originally anticipated. Surveys were issued to relevant local authority contacts on 21 April, with follow-up letters and phone calls to increase the response rate. The period for survey receipt was closed at the end of July, total responses to which are listed in Table 2.1 below. 2.12 In addition to the authorities listed in the table – the West of Scotland Archaeology Service (WoSAS) who provided archaeological advice to Local and National Park Authorities completed an abbreviated questionnaire and Rathmell Archaeology Ltd, a private company, provided e-mail information in respect the services they provided to one council. 2.13 Generally, respondents commented that the survey had been very time-consuming to complete, and that much of the data was not readily available in the detail and disaggregated format requested. As can be seen from the table, the majority of complete responses were received from council planning departments who tended to take responsibility for most of the
6
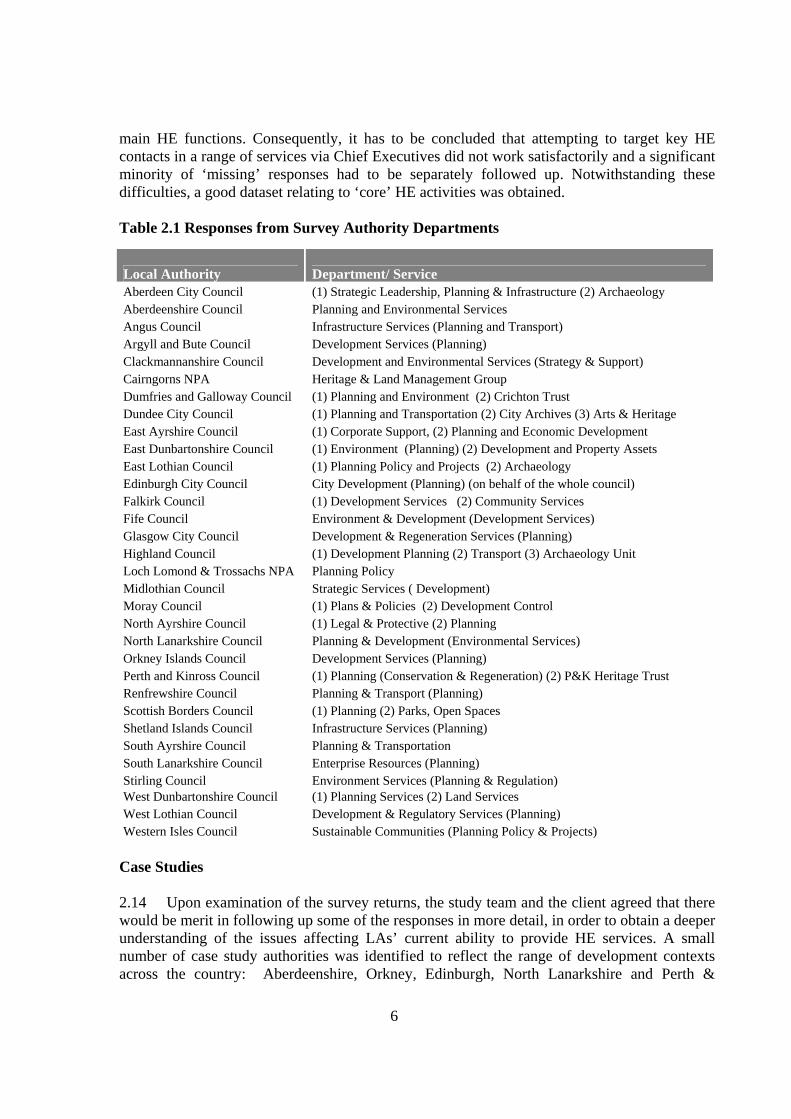
main HE functions. Consequently, it has to be concluded that attempting to target key HE contacts in a range of services via Chief Executives did not work satisfactorily and a significant minority of ‘missing’ responses had to be separately followed up. Notwithstanding these difficulties, a good dataset relating to ‘core’ HE activities was obtained. Table 2.1 Responses from Survey Authority Departments
Local Authority Department/ Service Aberdeen City Council (1) Strategic Leadership, Planning & Infrastructure (2) Archaeology Aberdeenshire Council Planning and Environmental Services Angus Council Infrastructure Services (Planning and Transport) Argyll and Bute Council Development Services (Planning) Clackmannanshire Council Development and Environmental Services (Strategy & Support) Cairngorns NPA Heritage & Land Management Group Dumfries and Galloway Council (1) Planning and Environment (2) Crichton Trust Dundee City Council (1) Planning and Transportation (2) City Archives (3) Arts & Heritage East Ayrshire Council (1) Corporate Support, (2) Planning and Economic Development East Dunbartonshire Council (1) Environment (Planning) (2) Development and Property Assets East Lothian Council (1) Planning Policy and Projects (2) Archaeology Edinburgh City Council City Development (Planning) (on behalf of the whole council) Falkirk Council (1) Development Services (2) Community Services Fife Council Environment & Development (Development Services) Glasgow City Council Development & Regeneration Services (Planning) Highland Council (1) Development Planning (2) Transport (3) Archaeology Unit Loch Lomond & Trossachs NPA Planning Policy Midlothian Council Strategic Services ( Development) Moray Council (1) Plans & Policies (2) Development Control North Ayrshire Council (1) Legal & Protective (2) Planning North Lanarkshire Council Planning & Development (Environmental Services) Orkney Islands Council Development Services (Planning) Perth and Kinross Council (1) Planning (Conservation & Regeneration) (2) P&K Heritage Trust Renfrewshire Council Planning & Transport (Planning) Scottish Borders Council (1) Planning (2) Parks, Open Spaces Shetland Islands Council Infrastructure Services (Planning) South Ayrshire Council Planning & Transportation South Lanarkshire Council Enterprise Resources (Planning) Stirling Council Environment Services (Planning & Regulation) West Dunbartonshire Council (1) Planning Services (2) Land Services West Lothian Council Development & Regulatory Services (Planning) Western Isles Council Sustainable Communities (Planning Policy & Projects)
Case Studies
2.14 Upon examination of the survey returns, the study team and the client agreed that there would be merit in following up some of the responses in more detail, in order to obtain a deeper understanding of the issues affecting LAs’ current ability to provide HE services. A small number of case study authorities was identified to reflect the range of development contexts across the country: Aberdeenshire, Orkney, Edinburgh, North Lanarkshire and Perth &

7
Kinross councils were approached and agreed to be interviewed. Interviews were carried out with leading HE staff, Chief Executives and other relevant individuals (including a senior elected member) in these authorities during July and early August 2008.
2.15 The quantitative information supplied by respondents to the survey has been augmented by the findings of the interviews. Chapter 3 presents these thematically, including examples from case study authorities as appropriate. The templates for the case study interviews are attached at Annex 2.

8
CHAPTER 3: LOCAL AUTHORITY MANAGEMENT OF THE HISTORIC ENVIRONMENT
OPERATING CONTEXT
3.1 The management of the historic environment has been defined for the purposes of this research exercise as comprising a number of inter-related activities as set out in Table 3.1. This definition was not as extensive as that set out in SHEP 11 but was considered to be a more manageable option in the context of the survey and was, nevertheless, more extensive than that used in the survey of Local Authority Conservation Provision in England.2
Table 3.1: Principal Local Authority Historic Environment Services
Main Historic Environment Service s Related Activities
Protection and conservation of historic buildings
Processing listed building and conservation area consents; regeneration and enhancement project development and implementation; development advice; strategy/policy formulation; funding bids etc.
Archaeological services
Advice on policy and planning applications; archaeological fieldwork; funding bids; maintenance of records etc.
Conservation and maintenance of historic parks, open spaces, properties and other structures
Responsibility for repairs and routine maintenance to historic parks; designed landscapes, historic buildings and other structures etc in ownership of the authority
Promotion and interpretation of the historic environment
Responsibility for promotional leaflets; exhibitions and events; liaison with local groups; school liaison; training etc
Management, administrative and technical support
Historic environment management and supporting clerical and technical staff activities
3.2 No local authority in Scotland located all of these activities within a single department and historic environment responsibilities were usually distributed across a number of services and in some instances contracted out to external providers. The exceptions to this general pattern were the two National Park Authorities, which had a narrower range of responsibilities and services and where responsibilities were generally more concentrated. 3.3 The broad organisational pattern revealed by the survey is set out in summary form in Table 3.2. This shows that, in relation to the four main elements of the historic environment function (excluding management and support), the principal council department with responsibilities for the historic environment was the Planning Service. The Planning Service itself is almost always part of a larger directorate with other environmental and developmental responsibilities. While it might be expected that the regulatory and project development
1 Scottish Historic Environment Policy 1, Historic Scotland 2007 2 Local Authority Conservation Provision in England, Oxford Brookes University. 2003
9
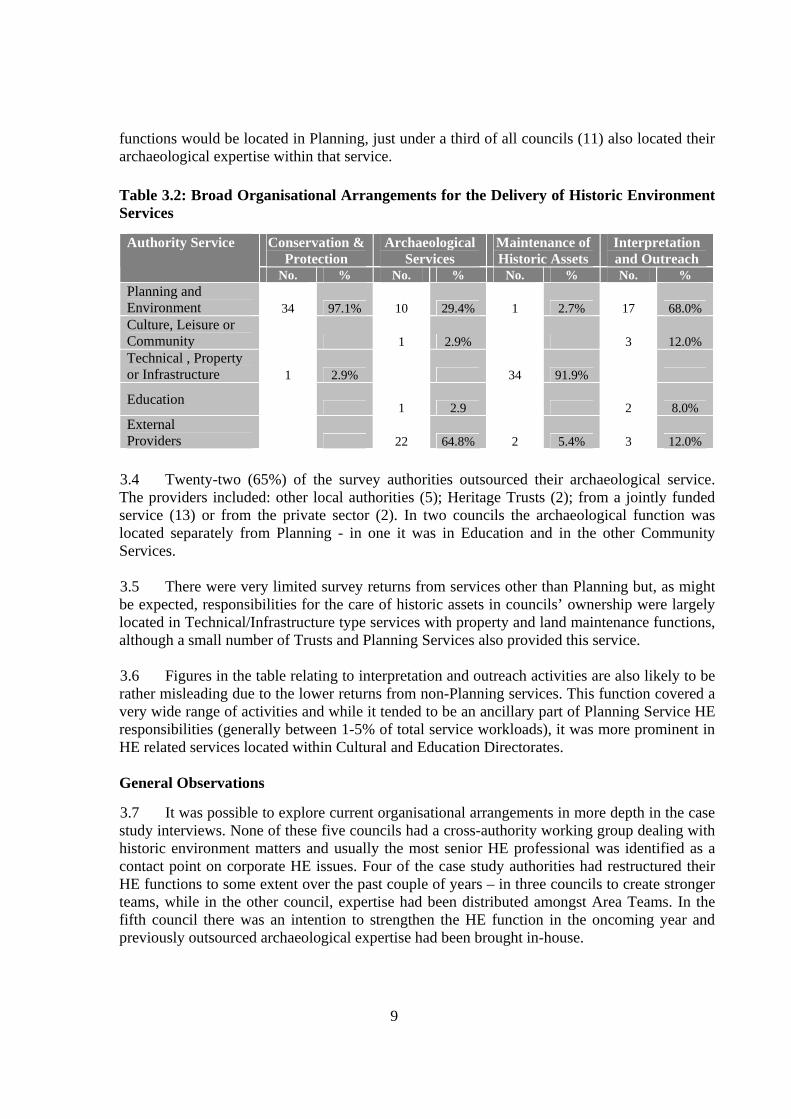
functions would be located in Planning, just under a third of all councils (11) also located their archaeological expertise within that service.
Table 3.2: Broad Organisational Arrangements for the Delivery of Historic Environment Services
Conservation & Protection
Archaeological Services
Maintenance of Historic Assets
Interpretation and Outreach
Authority Service
No. % No. % No. % No. % Planning and Environment 34 97.1% 10 29.4% 1 2.7% 17 68.0% Culture, Leisure or Community 1 2.9% 3 12.0% Technical , Property or Infrastructure 1 2.9% 34 91.9%
Education 1 2.9 2 8.0% External Providers 22 64.8% 2 5.4% 3 12.0%
3.4 Twenty-two (65%) of the survey authorities outsourced their archaeological service. The providers included: other local authorities (5); Heritage Trusts (2); from a jointly funded service (13) or from the private sector (2). In two councils the archaeological function was located separately from Planning - in one it was in Education and in the other Community Services. 3.5 There were very limited survey returns from services other than Planning but, as might be expected, responsibilities for the care of historic assets in councils’ ownership were largely located in Technical/Infrastructure type services with property and land maintenance functions, although a small number of Trusts and Planning Services also provided this service. 3.6 Figures in the table relating to interpretation and outreach activities are also likely to be rather misleading due to the lower returns from non-Planning services. This function covered a very wide range of activities and while it tended to be an ancillary part of Planning Service HE responsibilities (generally between 1-5% of total service workloads), it was more prominent in HE related services located within Cultural and Education Directorates. General Observations 3.7 It was possible to explore current organisational arrangements in more depth in the case study interviews. None of these five councils had a cross-authority working group dealing with historic environment matters and usually the most senior HE professional was identified as a contact point on corporate HE issues. Four of the case study authorities had restructured their HE functions to some extent over the past couple of years – in three councils to create stronger teams, while in the other council, expertise had been distributed amongst Area Teams. In the fifth council there was an intention to strengthen the HE function in the oncoming year and previously outsourced archaeological expertise had been brought in-house.
10
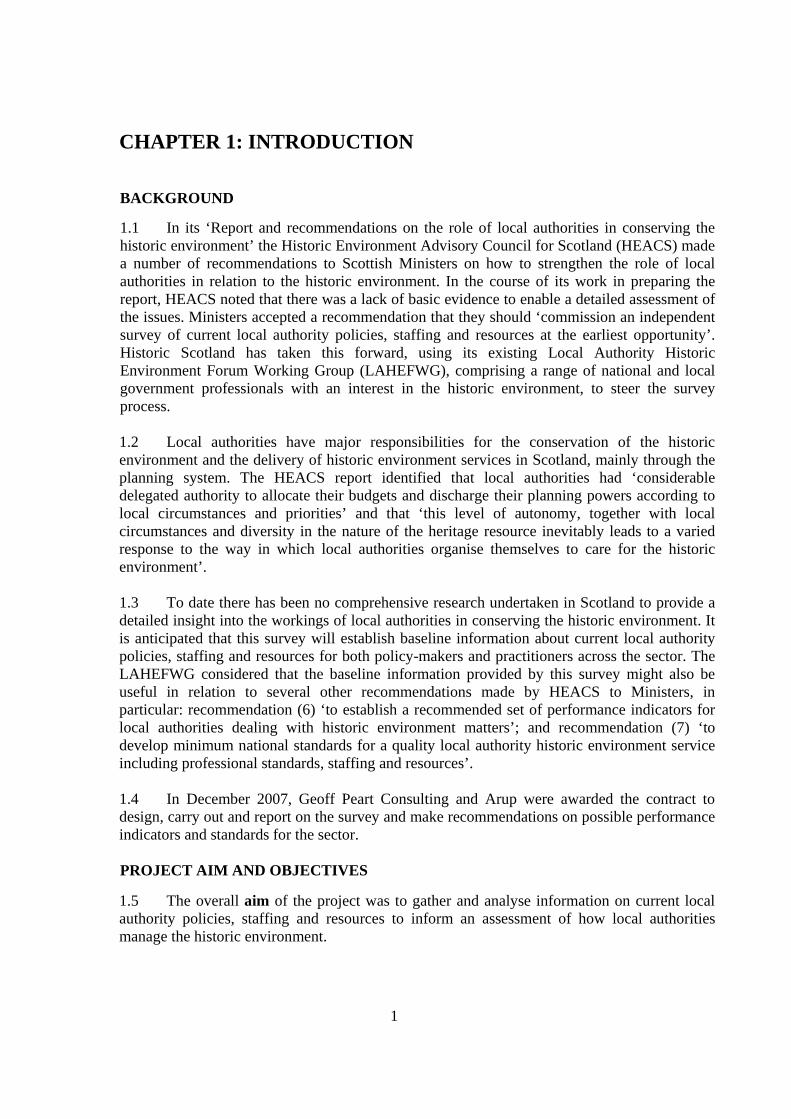
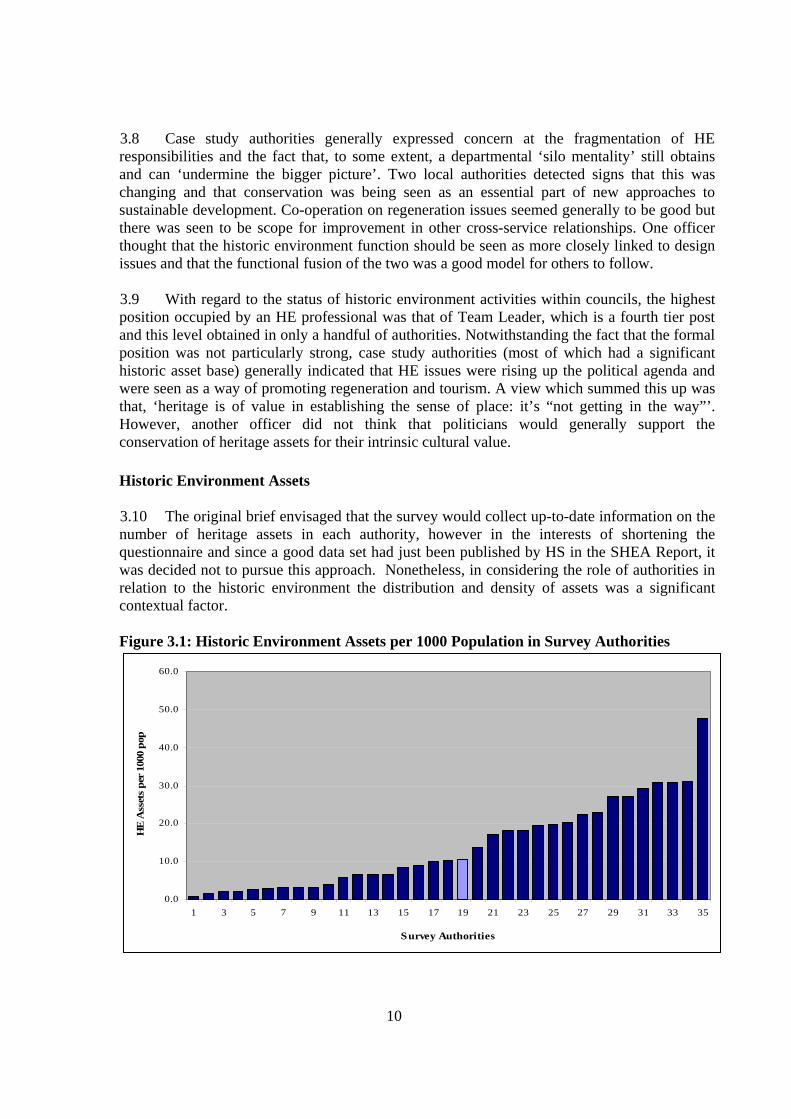
3.8 Case study authorities generally expressed concern at the fragmentation of HE responsibilities and the fact that, to some extent, a departmental ‘silo mentality’ still obtains and can ‘undermine the bigger picture’. Two local authorities detected signs that this was changing and that conservation was being seen as an essential part of new approaches to sustainable development. Co-operation on regeneration issues seemed generally to be good but there was seen to be scope for improvement in other cross-service relationships. One officer thought that the historic environment function should be seen as more closely linked to design issues and that the functional fusion of the two was a good model for others to follow. 3.9 With regard to the status of historic environment activities within councils, the highest position occupied by an HE professional was that of Team Leader, which is a fourth tier post and this level obtained in only a handful of authorities. Notwithstanding the fact that the formal position was not particularly strong, case study authorities (most of which had a significant historic asset base) generally indicated that HE issues were rising up the political agenda and were seen as a way of promoting regeneration and tourism. A view which summed this up was that, ‘heritage is of value in establishing the sense of place: it’s “not getting in the way”’. However, another officer did not think that politicians would generally support the conservation of heritage assets for their intrinsic cultural value. Historic Environment Assets 3.10 The original brief envisaged that the survey would collect up-to-date information on the number of heritage assets in each authority, however in the interests of shortening the questionnaire and since a good data set had just been published by HS in the SHEA Report, it was decided not to pursue this approach. Nonetheless, in considering the role of authorities in relation to the historic environment the distribution and density of assets was a significant contextual factor. Figure 3.1: Historic Environment Assets per 1000 Population in Survey Authorities
0.0
10.0
20.0
30.0
40.0
50.0
60.0
1 3 5 7 9 11 13 15 17 19 21 23 25 27 29 31 33 35
Survey Authorities
HE
Ass
ets
per
1000
pop
11
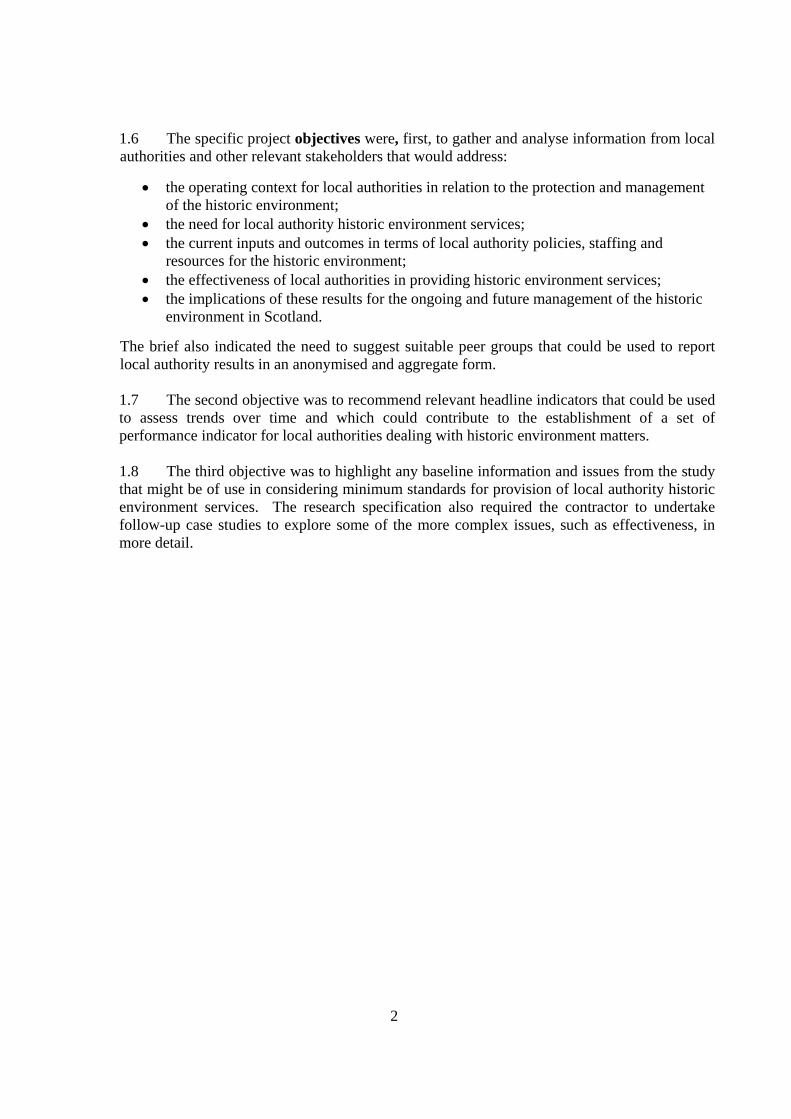
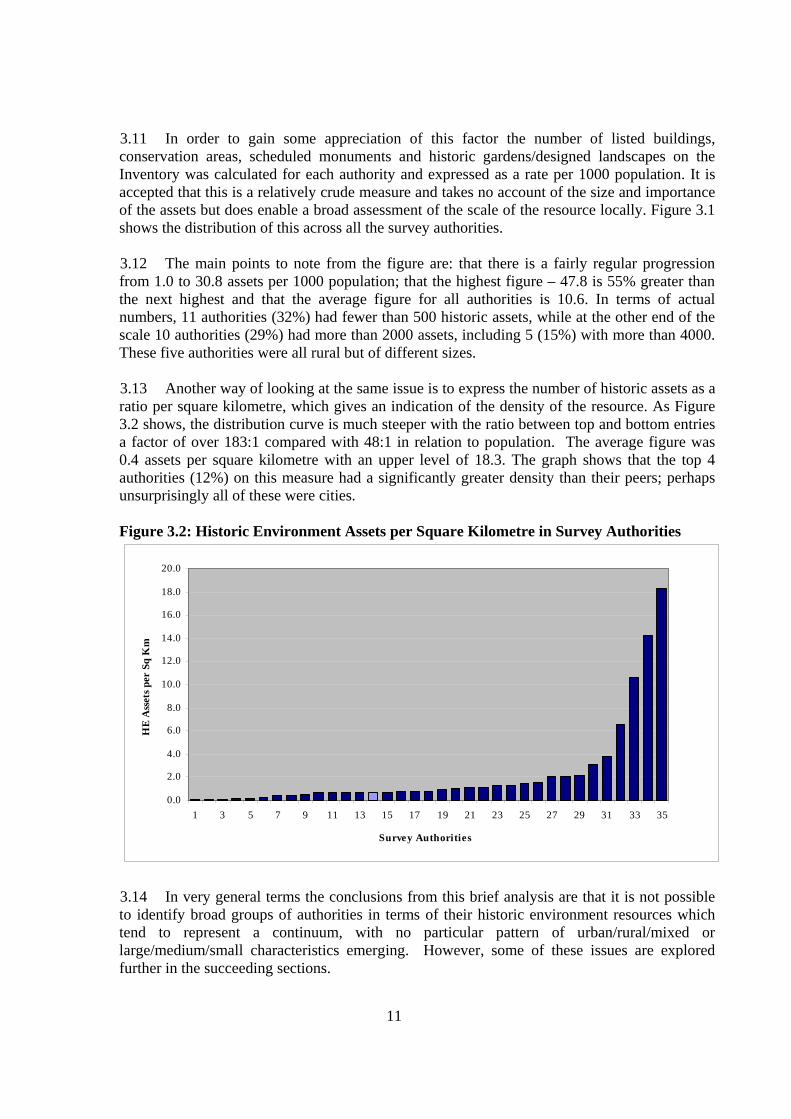
3.11 In order to gain some appreciation of this factor the number of listed buildings, conservation areas, scheduled monuments and historic gardens/designed landscapes on the Inventory was calculated for each authority and expressed as a rate per 1000 population. It is accepted that this is a relatively crude measure and takes no account of the size and importance of the assets but does enable a broad assessment of the scale of the resource locally. Figure 3.1 shows the distribution of this across all the survey authorities. 3.12 The main points to note from the figure are: that there is a fairly regular progression from 1.0 to 30.8 assets per 1000 population; that the highest figure – 47.8 is 55% greater than the next highest and that the average figure for all authorities is 10.6. In terms of actual numbers, 11 authorities (32%) had fewer than 500 historic assets, while at the other end of the scale 10 authorities (29%) had more than 2000 assets, including 5 (15%) with more than 4000. These five authorities were all rural but of different sizes. 3.13 Another way of looking at the same issue is to express the number of historic assets as a ratio per square kilometre, which gives an indication of the density of the resource. As Figure 3.2 shows, the distribution curve is much steeper with the ratio between top and bottom entries a factor of over 183:1 compared with 48:1 in relation to population. The average figure was 0.4 assets per square kilometre with an upper level of 18.3. The graph shows that the top 4 authorities (12%) on this measure had a significantly greater density than their peers; perhaps unsurprisingly all of these were cities. Figure 3.2: Historic Environment Assets per Square Kilometre in Survey Authorities
0.0
2.0
4.0
6.0
8.0
10.0
12.0
14.0
16.0
18.0
20.0
1 3 5 7 9 11 13 15 17 19 21 23 25 27 29 31 33 35
Survey Authorities
HE
Ass
ets p
er S
q K
m
3.14 In very general terms the conclusions from this brief analysis are that it is not possible to identify broad groups of authorities in terms of their historic environment resources which tend to represent a continuum, with no particular pattern of urban/rural/mixed or large/medium/small characteristics emerging. However, some of these issues are explored further in the succeeding sections.
12
HISTORIC ENVIRONMENT STAFFING Overview 3.15 One of the principal purposes of the survey was to establish the number of people within the 32 Local Authorities and two National Park Authorities who had historic environment management responsibilities. In this context, the questionnaire asked respondents to distinguish between specialist historic environment staff, and these were defined as those spending 50% or more of their time on historic environment activities, and others in a supporting role, who spent less time than this on HE activities. Table 3.3: Main HE - Related Functions of LA/NPA Specialist and Support Staff
Specialist Staff Support Staff Total Staff Main HE Functions No of
FTEs % No of FTEs % No of
FTEs % Development Management (HE Apps) 8.20 7% 29.45 32% 37.65 19% Conservation Projects/Policy 64.70 59% 8.75 9% 73.45 36% Archaeological Services 37.05 34% 3.80 4% 40.85 20% Interpretation/Outreach/Education 12.95 14% 12.95 6% Property & OS Maintenance 16.95 18% 16.95 8% Administrative and Technical Support 21.40 23% 21.40 11% Total 109.95 100% 93.30 100% 203.25 100%
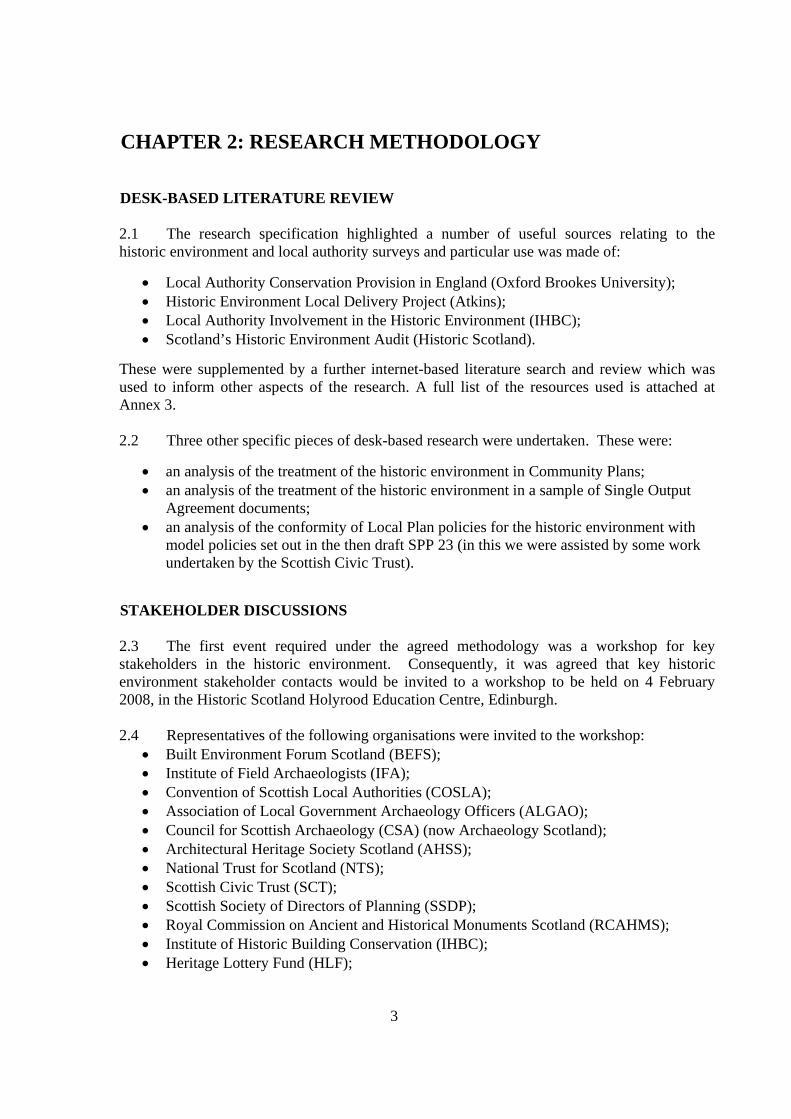
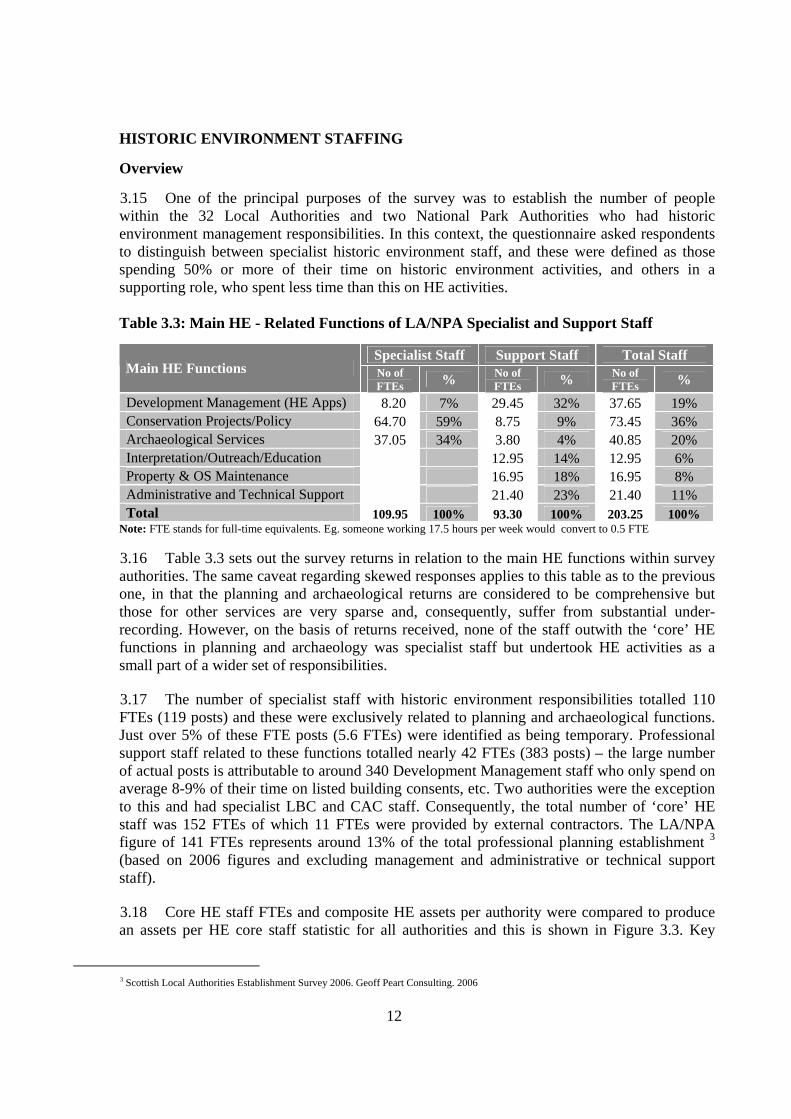
Note: FTE stands for full-time equivalents. Eg. someone working 17.5 hours per week would convert to 0.5 FTE 3.16 Table 3.3 sets out the survey returns in relation to the main HE functions within survey authorities. The same caveat regarding skewed responses applies to this table as to the previous one, in that the planning and archaeological returns are considered to be comprehensive but those for other services are very sparse and, consequently, suffer from substantial under-recording. However, on the basis of returns received, none of the staff outwith the ‘core’ HE functions in planning and archaeology was specialist staff but undertook HE activities as a small part of a wider set of responsibilities. 3.17 The number of specialist staff with historic environment responsibilities totalled 110 FTEs (119 posts) and these were exclusively related to planning and archaeological functions. Just over 5% of these FTE posts (5.6 FTEs) were identified as being temporary. Professional support staff related to these functions totalled nearly 42 FTEs (383 posts) – the large number of actual posts is attributable to around 340 Development Management staff who only spend on average 8-9% of their time on listed building consents, etc. Two authorities were the exception to this and had specialist LBC and CAC staff. Consequently, the total number of ‘core’ HE staff was 152 FTEs of which 11 FTEs were provided by external contractors. The LA/NPA figure of 141 FTEs represents around 13% of the total professional planning establishment 3 (based on 2006 figures and excluding management and administrative or technical support staff). 3.18 Core HE staff FTEs and composite HE assets per authority were compared to produce an assets per HE core staff statistic for all authorities and this is shown in Figure 3.3. Key
3 Scottish Local Authorities Establishment Survey 2006. Geoff Peart Consulting. 2006
13
points to note from the graph are that the range varied from 98 to 1223 with an average of 363. Figures need careful interpretation as high figures might mean low staff levels or a large number of assets. The highest four authorities in fact did not have high staffing levels. Once again there was no particular size or urban/rural pattern to the distribution. Figure 3.3: HE Assets per Head of Estimated Core HE Staff
0
200
400
600
800
1000
1200
1400
1 3 5 7 9 11 13 15 17 19 21 23 25 27 29 31 33 35
Survey Authorities
Ass
ets
per
Cor
e H
E S
taff
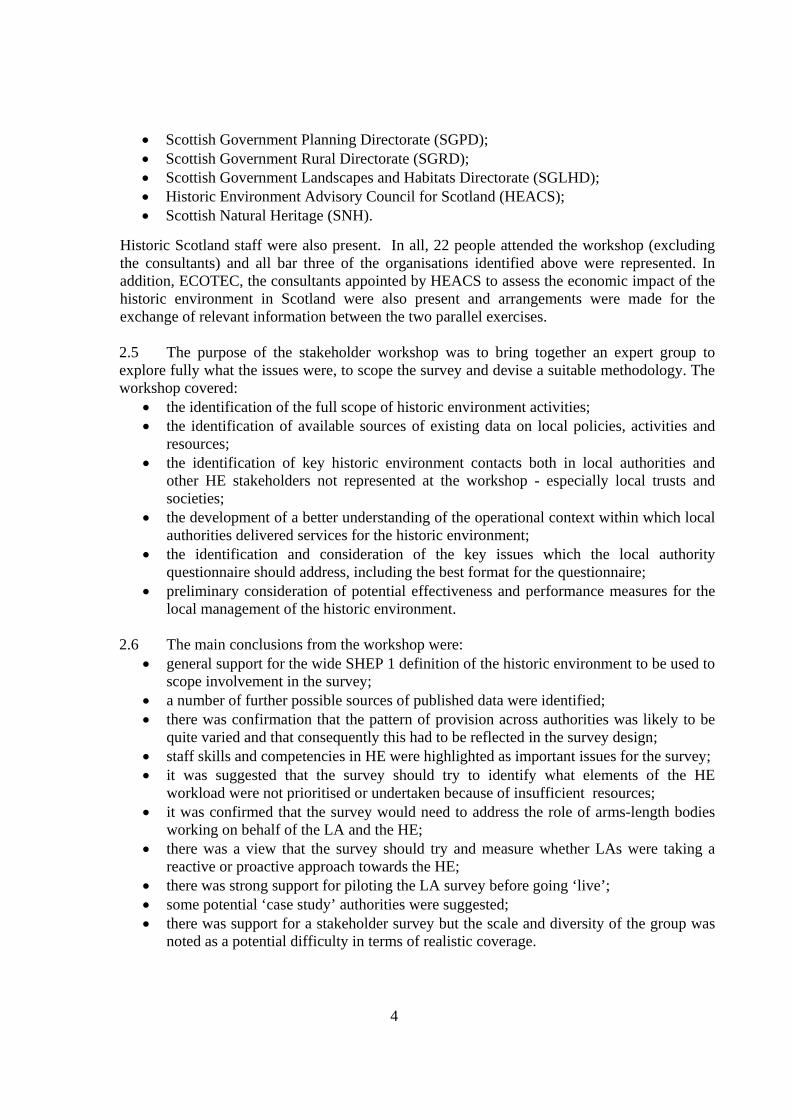
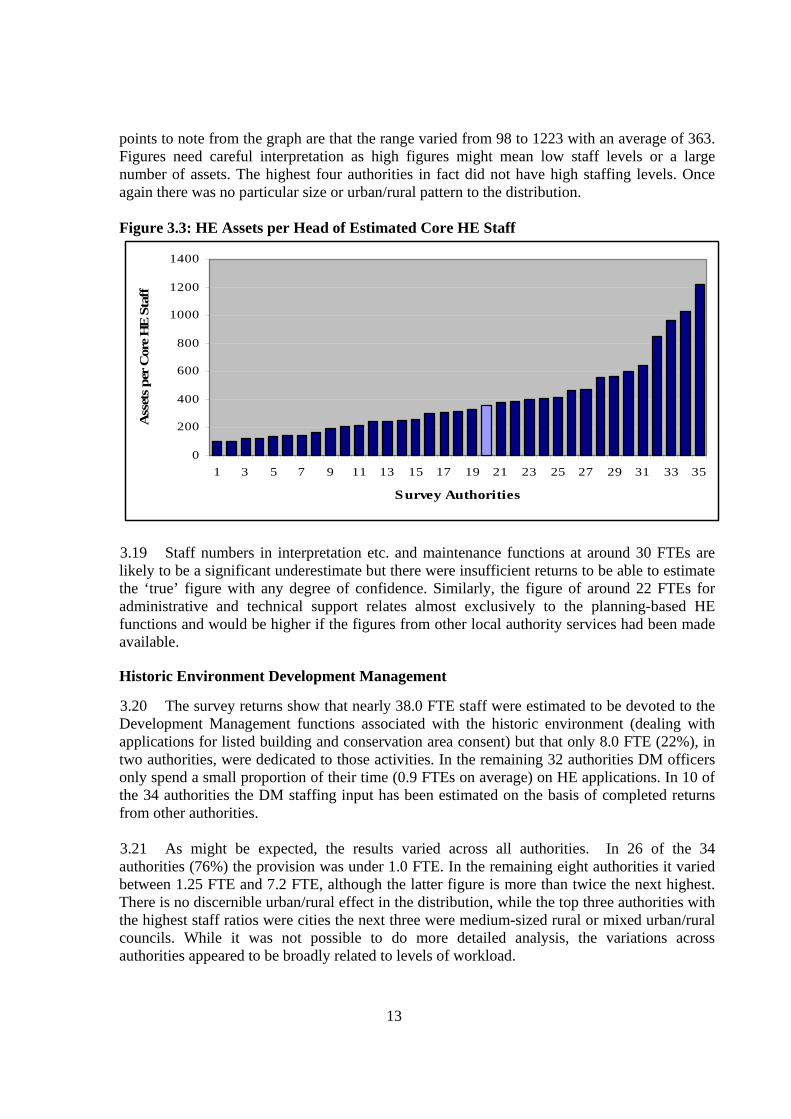
3.19 Staff numbers in interpretation etc. and maintenance functions at around 30 FTEs are likely to be a significant underestimate but there were insufficient returns to be able to estimate the ‘true’ figure with any degree of confidence. Similarly, the figure of around 22 FTEs for administrative and technical support relates almost exclusively to the planning-based HE functions and would be higher if the figures from other local authority services had been made available. Historic Environment Development Management 3.20 The survey returns show that nearly 38.0 FTE staff were estimated to be devoted to the Development Management functions associated with the historic environment (dealing with applications for listed building and conservation area consent) but that only 8.0 FTE (22%), in two authorities, were dedicated to those activities. In the remaining 32 authorities DM officers only spend a small proportion of their time (0.9 FTEs on average) on HE applications. In 10 of the 34 authorities the DM staffing input has been estimated on the basis of completed returns from other authorities. 3.21 As might be expected, the results varied across all authorities. In 26 of the 34 authorities (76%) the provision was under 1.0 FTE. In the remaining eight authorities it varied between 1.25 FTE and 7.2 FTE, although the latter figure is more than twice the next highest. There is no discernible urban/rural effect in the distribution, while the top three authorities with the highest staff ratios were cities the next three were medium-sized rural or mixed urban/rural councils. While it was not possible to do more detailed analysis, the variations across authorities appeared to be broadly related to levels of workload.
14
Figure 3.4: LBCs and CACs determined per 1.0 FTE Estimated DM Staff in Survey
Authorities
0
50
100
150
200
250
300
350
400
450
1 3 5 7 9 11 13 15 17 19 21 23 25 27 29 31 33 35Authorities
LB
Cs
etc
per
FTE
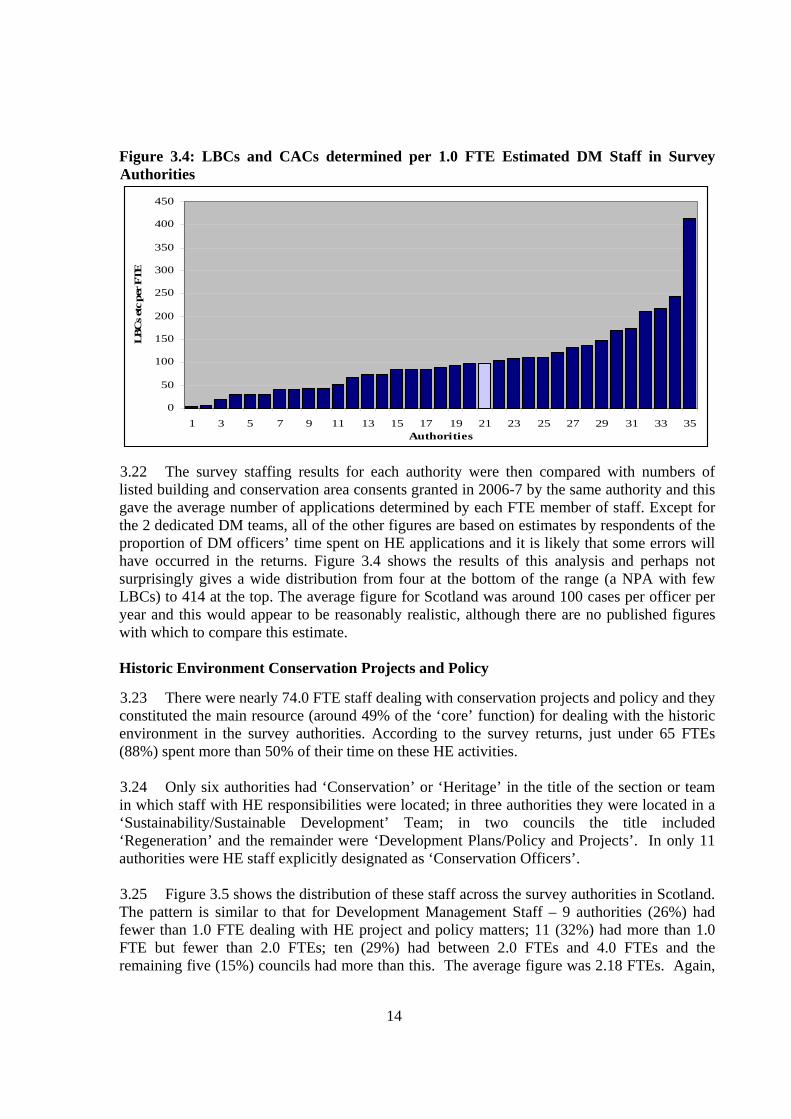
3.22 The survey staffing results for each authority were then compared with numbers of listed building and conservation area consents granted in 2006-7 by the same authority and this gave the average number of applications determined by each FTE member of staff. Except for the 2 dedicated DM teams, all of the other figures are based on estimates by respondents of the proportion of DM officers’ time spent on HE applications and it is likely that some errors will have occurred in the returns. Figure 3.4 shows the results of this analysis and perhaps not surprisingly gives a wide distribution from four at the bottom of the range (a NPA with few LBCs) to 414 at the top. The average figure for Scotland was around 100 cases per officer per year and this would appear to be reasonably realistic, although there are no published figures with which to compare this estimate. Historic Environment Conservation Projects and Policy 3.23 There were nearly 74.0 FTE staff dealing with conservation projects and policy and they constituted the main resource (around 49% of the ‘core’ function) for dealing with the historic environment in the survey authorities. According to the survey returns, just under 65 FTEs (88%) spent more than 50% of their time on these HE activities. 3.24 Only six authorities had ‘Conservation’ or ‘Heritage’ in the title of the section or team in which staff with HE responsibilities were located; in three authorities they were located in a ‘Sustainability/Sustainable Development’ Team; in two councils the title included ‘Regeneration’ and the remainder were ‘Development Plans/Policy and Projects’. In only 11 authorities were HE staff explicitly designated as ‘Conservation Officers’. 3.25 Figure 3.5 shows the distribution of these staff across the survey authorities in Scotland. The pattern is similar to that for Development Management Staff – 9 authorities (26%) had fewer than 1.0 FTE dealing with HE project and policy matters; 11 (32%) had more than 1.0 FTE but fewer than 2.0 FTEs; ten (29%) had between 2.0 FTEs and 4.0 FTEs and the remaining five (15%) councils had more than this. The average figure was 2.18 FTEs. Again,
15
there was no urban/rural effect, with the five best resourced authorities comprising two cities, two large rural authorities and a medium-sized mixed urban/rural council. Figure 3.5: FTE Conservation Policy and Projects Staff in Survey Authorities
0.00
2.00
4.00
6.00
8.00
10.00
12.00
14.00
1 3 5 7 9 11 13 15 17 19 21 23 25 27 29 31 33 35
Authorities
FTE
Staf
f
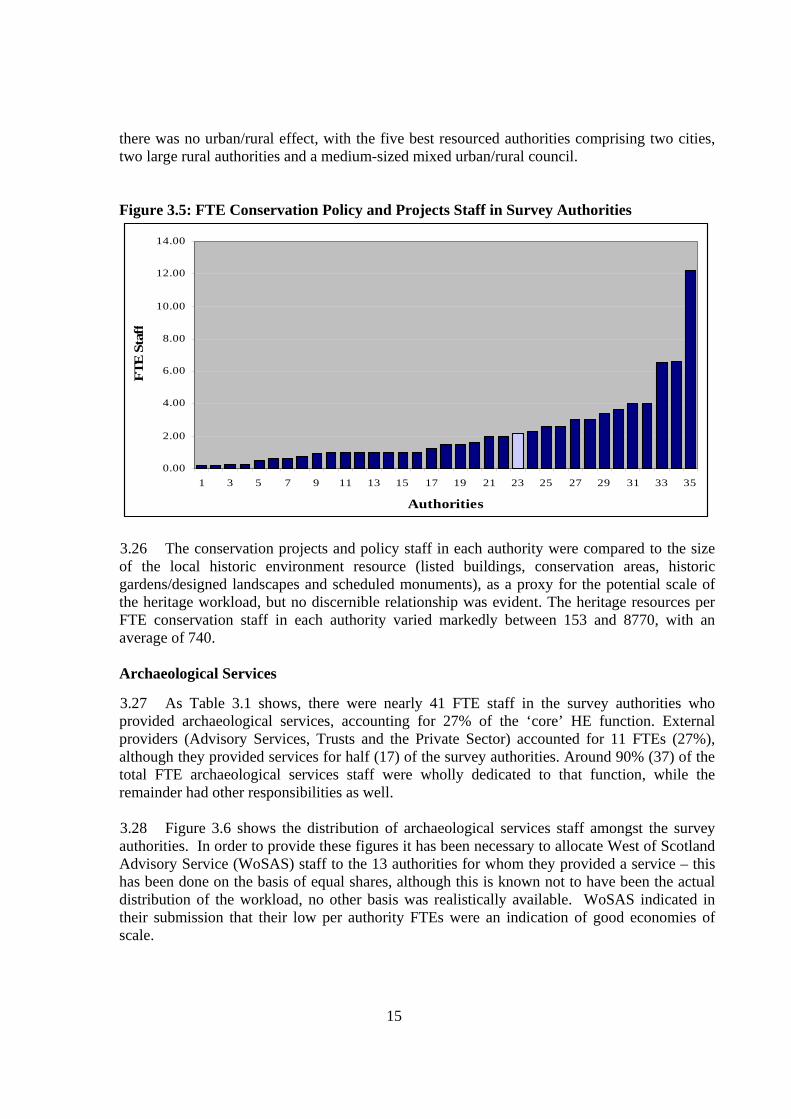
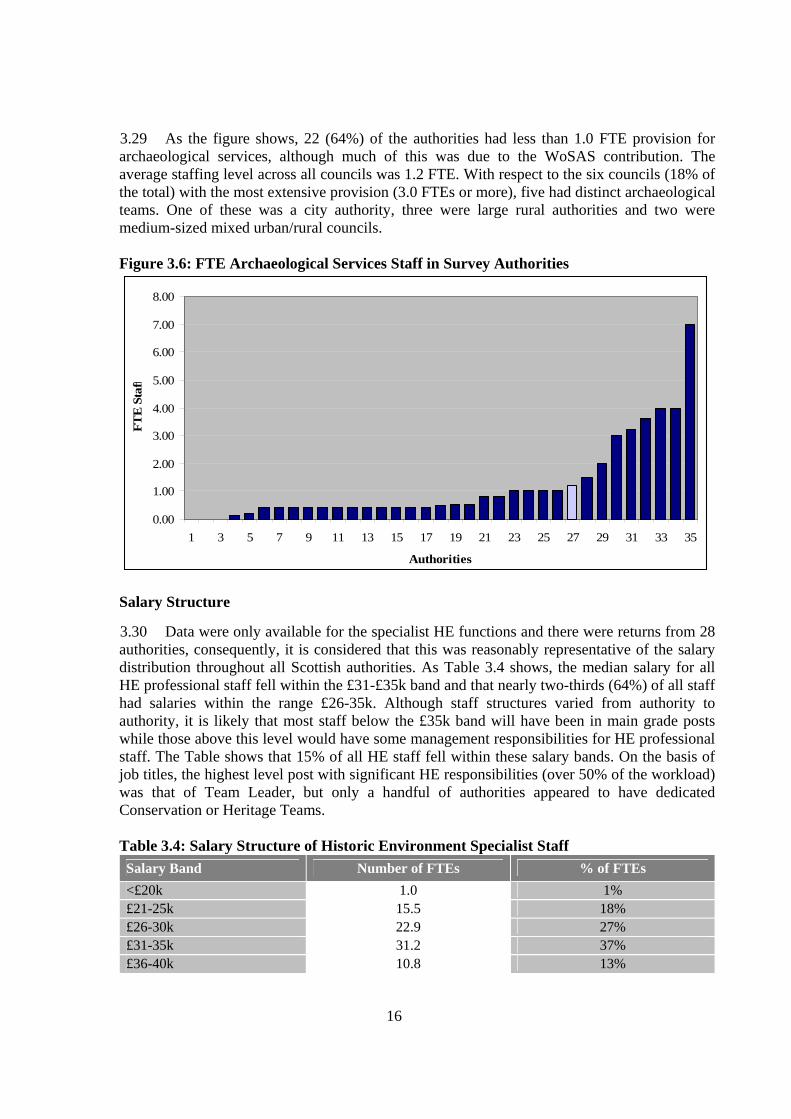
3.26 The conservation projects and policy staff in each authority were compared to the size of the local historic environment resource (listed buildings, conservation areas, historic gardens/designed landscapes and scheduled monuments), as a proxy for the potential scale of the heritage workload, but no discernible relationship was evident. The heritage resources per FTE conservation staff in each authority varied markedly between 153 and 8770, with an average of 740. Archaeological Services 3.27 As Table 3.1 shows, there were nearly 41 FTE staff in the survey authorities who provided archaeological services, accounting for 27% of the ‘core’ HE function. External providers (Advisory Services, Trusts and the Private Sector) accounted for 11 FTEs (27%), although they provided services for half (17) of the survey authorities. Around 90% (37) of the total FTE archaeological services staff were wholly dedicated to that function, while the remainder had other responsibilities as well. 3.28 Figure 3.6 shows the distribution of archaeological services staff amongst the survey authorities. In order to provide these figures it has been necessary to allocate West of Scotland Advisory Service (WoSAS) staff to the 13 authorities for whom they provided a service – this has been done on the basis of equal shares, although this is known not to have been the actual distribution of the workload, no other basis was realistically available. WoSAS indicated in their submission that their low per authority FTEs were an indication of good economies of scale.
16
3.29 As the figure shows, 22 (64%) of the authorities had less than 1.0 FTE provision for archaeological services, although much of this was due to the WoSAS contribution. The average staffing level across all councils was 1.2 FTE. With respect to the six councils (18% of the total) with the most extensive provision (3.0 FTEs or more), five had distinct archaeological teams. One of these was a city authority, three were large rural authorities and two were medium-sized mixed urban/rural councils. Figure 3.6: FTE Archaeological Services Staff in Survey Authorities
0.00
1.00
2.00
3.00
4.00
5.00
6.00
7.00
8.00
1 3 5 7 9 11 13 15 17 19 21 23 25 27 29 31 33 35
Authorities
FTE
Sta
ff
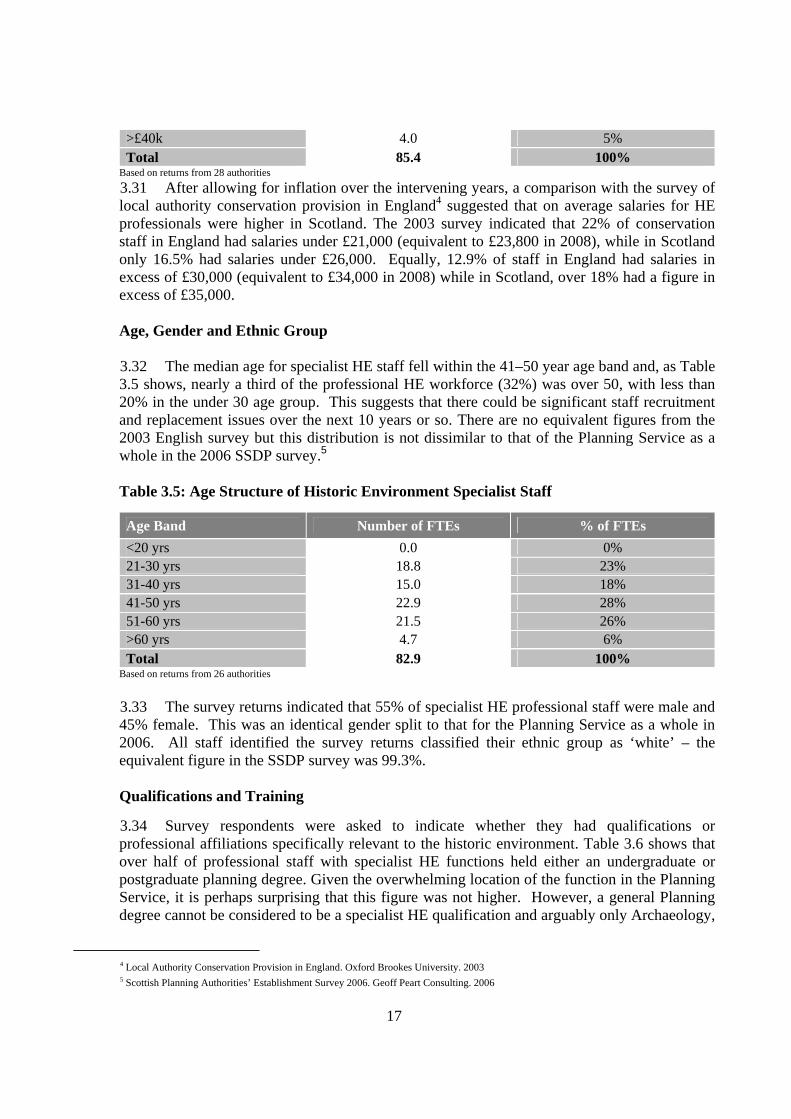
Salary Structure 3.30 Data were only available for the specialist HE functions and there were returns from 28 authorities, consequently, it is considered that this was reasonably representative of the salary distribution throughout all Scottish authorities. As Table 3.4 shows, the median salary for all HE professional staff fell within the £31-£35k band and that nearly two-thirds (64%) of all staff had salaries within the range £26-35k. Although staff structures varied from authority to authority, it is likely that most staff below the £35k band will have been in main grade posts while those above this level would have some management responsibilities for HE professional staff. The Table shows that 15% of all HE staff fell within these salary bands. On the basis of job titles, the highest level post with significant HE responsibilities (over 50% of the workload) was that of Team Leader, but only a handful of authorities appeared to have dedicated Conservation or Heritage Teams. Table 3.4: Salary Structure of Historic Environment Specialist Staff Salary Band Number of FTEs % of FTEs <£20k 1.0 1% £21-25k 15.5 18% £26-30k 22.9 27% £31-35k 31.2 37% £36-40k 10.8 13%
17
>£40k 4.0 5% Total 85.4 100%
Based on returns from 28 authorities 3.31 After allowing for inflation over the intervening years, a comparison with the survey of local authority conservation provision in England4 suggested that on average salaries for HE professionals were higher in Scotland. The 2003 survey indicated that 22% of conservation staff in England had salaries under £21,000 (equivalent to £23,800 in 2008), while in Scotland only 16.5% had salaries under £26,000. Equally, 12.9% of staff in England had salaries in excess of £30,000 (equivalent to £34,000 in 2008) while in Scotland, over 18% had a figure in excess of £35,000. Age, Gender and Ethnic Group 3.32 The median age for specialist HE staff fell within the 41–50 year age band and, as Table 3.5 shows, nearly a third of the professional HE workforce (32%) was over 50, with less than 20% in the under 30 age group. This suggests that there could be significant staff recruitment and replacement issues over the next 10 years or so. There are no equivalent figures from the 2003 English survey but this distribution is not dissimilar to that of the Planning Service as a whole in the 2006 SSDP survey.5 Table 3.5: Age Structure of Historic Environment Specialist Staff
Age Band Number of FTEs % of FTEs <20 yrs 0.0 0% 21-30 yrs 18.8 23% 31-40 yrs 15.0 18% 41-50 yrs 22.9 28% 51-60 yrs 21.5 26% >60 yrs 4.7 6% Total 82.9 100%
Based on returns from 26 authorities 3.33 The survey returns indicated that 55% of specialist HE professional staff were male and 45% female. This was an identical gender split to that for the Planning Service as a whole in 2006. All staff identified the survey returns classified their ethnic group as ‘white’ – the equivalent figure in the SSDP survey was 99.3%. Qualifications and Training 3.34 Survey respondents were asked to indicate whether they had qualifications or professional affiliations specifically relevant to the historic environment. Table 3.6 shows that over half of professional staff with specialist HE functions held either an undergraduate or postgraduate planning degree. Given the overwhelming location of the function in the Planning Service, it is perhaps surprising that this figure was not higher. However, a general Planning degree cannot be considered to be a specialist HE qualification and arguably only Archaeology,
4 Local Authority Conservation Provision in England. Oxford Brookes University. 2003 5 Scottish Planning Authorities’ Establishment Survey 2006. Geoff Peart Consulting. 2006
18
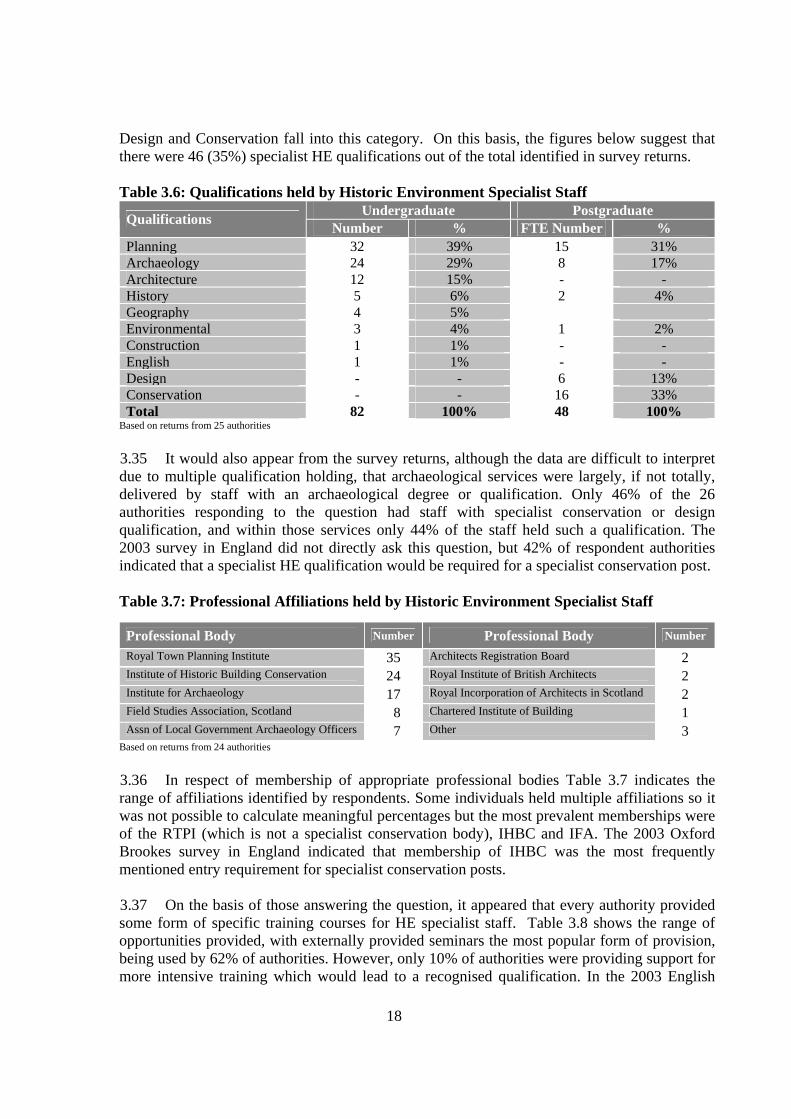
Design and Conservation fall into this category. On this basis, the figures below suggest that there were 46 (35%) specialist HE qualifications out of the total identified in survey returns. Table 3.6: Qualifications held by Historic Environment Specialist Staff
Undergraduate Postgraduate Qualifications Number % FTE Number % Planning 32 39% 15 31%Archaeology 24 29% 8 17%Architecture 12 15% - -History 5 6% 2 4%Geography 4 5% Environmental 3 4% 1 2%Construction 1 1% - -English 1 1% - -Design - - 6 13%Conservation - - 16 33%Total 82 100% 48 100%
Based on returns from 25 authorities 3.35 It would also appear from the survey returns, although the data are difficult to interpret due to multiple qualification holding, that archaeological services were largely, if not totally, delivered by staff with an archaeological degree or qualification. Only 46% of the 26 authorities responding to the question had staff with specialist conservation or design qualification, and within those services only 44% of the staff held such a qualification. The 2003 survey in England did not directly ask this question, but 42% of respondent authorities indicated that a specialist HE qualification would be required for a specialist conservation post. Table 3.7: Professional Affiliations held by Historic Environment Specialist Staff
Professional Body Number Professional Body Number
Royal Town Planning Institute 35 Architects Registration Board 2 Institute of Historic Building Conservation 24 Royal Institute of British Architects 2 Institute for Archaeology 17 Royal Incorporation of Architects in Scotland 2 Field Studies Association, Scotland 8 Chartered Institute of Building 1 Assn of Local Government Archaeology Officers 7 Other 3
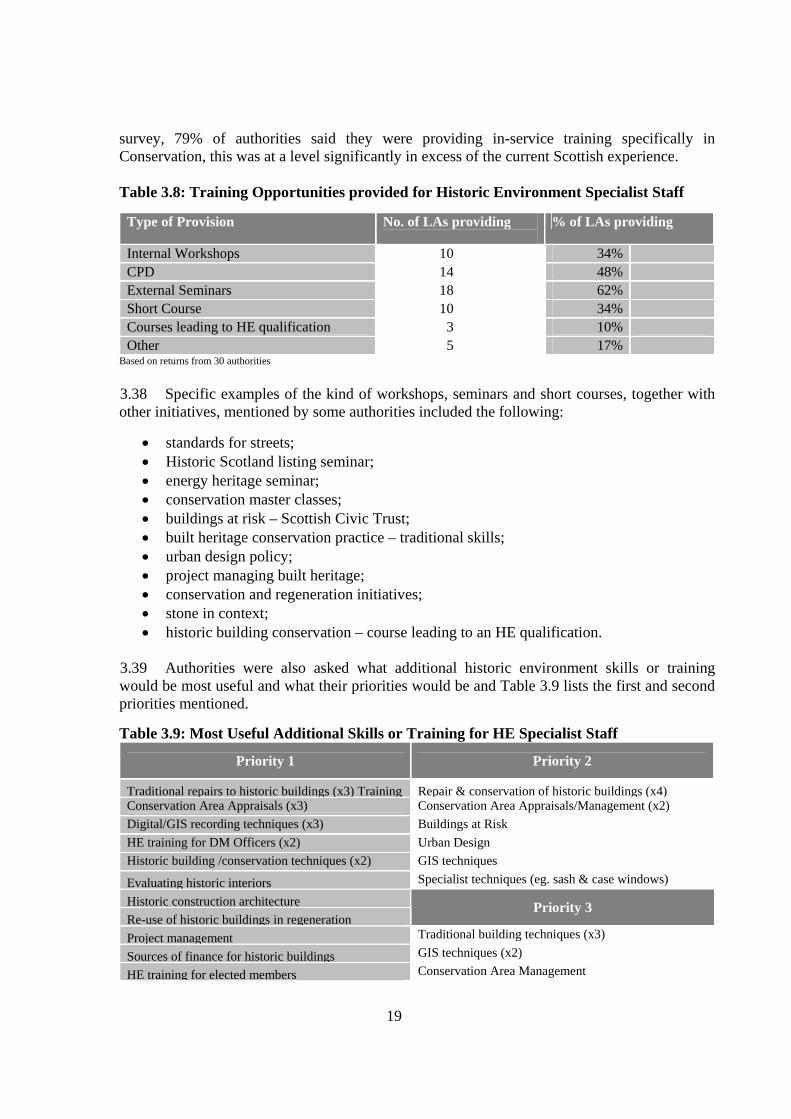
Based on returns from 24 authorities 3.36 In respect of membership of appropriate professional bodies Table 3.7 indicates the range of affiliations identified by respondents. Some individuals held multiple affiliations so it was not possible to calculate meaningful percentages but the most prevalent memberships were of the RTPI (which is not a specialist conservation body), IHBC and IFA. The 2003 Oxford Brookes survey in England indicated that membership of IHBC was the most frequently mentioned entry requirement for specialist conservation posts. 3.37 On the basis of those answering the question, it appeared that every authority provided some form of specific training courses for HE specialist staff. Table 3.8 shows the range of opportunities provided, with externally provided seminars the most popular form of provision, being used by 62% of authorities. However, only 10% of authorities were providing support for more intensive training which would lead to a recognised qualification. In the 2003 English
19
survey, 79% of authorities said they were providing in-service training specifically in Conservation, this was at a level significantly in excess of the current Scottish experience. Table 3.8: Training Opportunities provided for Historic Environment Specialist Staff
Type of Provision No. of LAs providing % of LAs providing
Internal Workshops 10 34% CPD 14 48% External Seminars 18 62% Short Course 10 34% Courses leading to HE qualification 3 10% Other 5 17%
Based on returns from 30 authorities 3.38 Specific examples of the kind of workshops, seminars and short courses, together with other initiatives, mentioned by some authorities included the following:
• standards for streets; • Historic Scotland listing seminar; • energy heritage seminar; • conservation master classes; • buildings at risk – Scottish Civic Trust; • built heritage conservation practice – traditional skills; • urban design policy; • project managing built heritage; • conservation and regeneration initiatives; • stone in context; • historic building conservation – course leading to an HE qualification.
3.39 Authorities were also asked what additional historic environment skills or training would be most useful and what their priorities would be and Table 3.9 lists the first and second priorities mentioned. Table 3.9: Most Useful Additional Skills or Training for HE Specialist Staff
Priority 1 Priority 2
Traditional repairs to historic buildings (x3) Training Repair & conservation of historic buildings (x4) Conservation Area Appraisals (x3) Conservation Area Appraisals/Management (x2) Digital/GIS recording techniques (x3) Buildings at Risk HE training for DM Officers (x2) Urban Design Historic building /conservation techniques (x2) GIS techniques
Evaluating historic interiors Specialist techniques (eg. sash & case windows)
Historic construction architecture Re-use of historic buildings in regeneration
Priority 3
Project management Traditional building techniques (x3)
Sources of finance for historic buildings GIS techniques (x2)
HE training for elected members Conservation Area Management
20
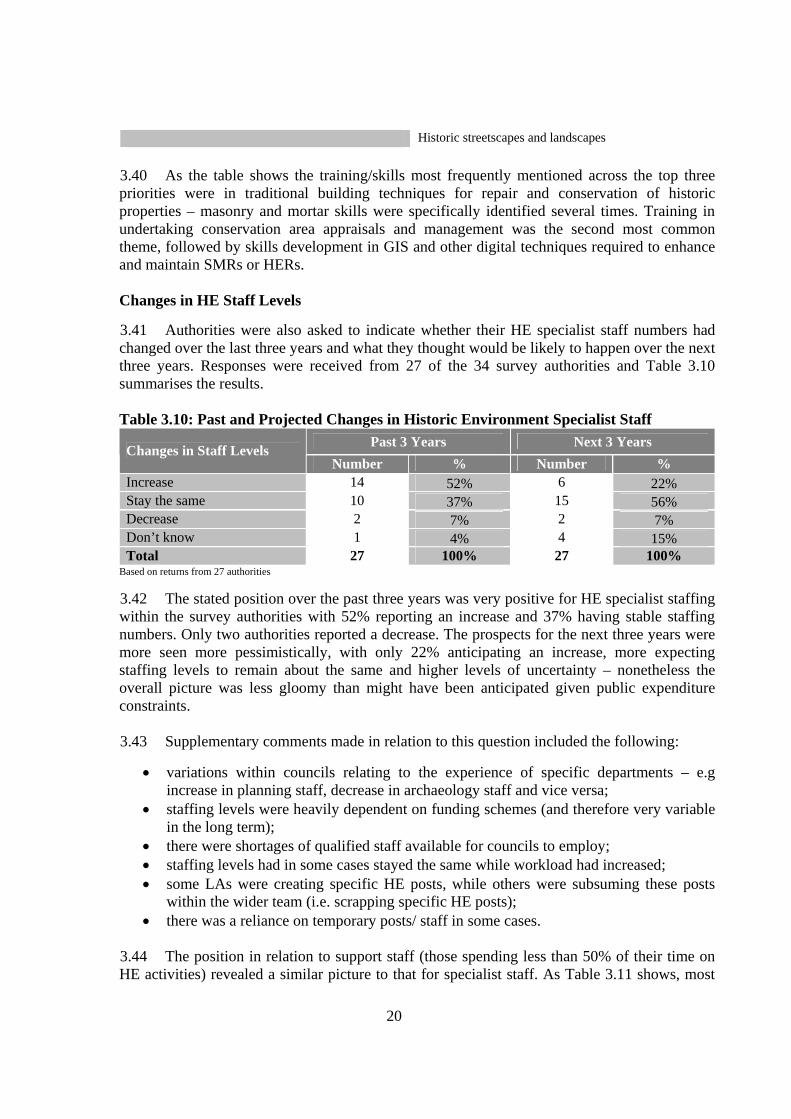
Historic streetscapes and landscapes 3.40 As the table shows the training/skills most frequently mentioned across the top three priorities were in traditional building techniques for repair and conservation of historic properties – masonry and mortar skills were specifically identified several times. Training in undertaking conservation area appraisals and management was the second most common theme, followed by skills development in GIS and other digital techniques required to enhance and maintain SMRs or HERs. Changes in HE Staff Levels 3.41 Authorities were also asked to indicate whether their HE specialist staff numbers had changed over the last three years and what they thought would be likely to happen over the next three years. Responses were received from 27 of the 34 survey authorities and Table 3.10 summarises the results. Table 3.10: Past and Projected Changes in Historic Environment Specialist Staff
Past 3 Years Next 3 Years Changes in Staff Levels Number % Number %
Increase 14 52% 6 22% Stay the same 10 37% 15 56% Decrease 2 7% 2 7% Don’t know 1 4% 4 15% Total 27 100% 27 100%
Based on returns from 27 authorities 3.42 The stated position over the past three years was very positive for HE specialist staffing within the survey authorities with 52% reporting an increase and 37% having stable staffing numbers. Only two authorities reported a decrease. The prospects for the next three years were more seen more pessimistically, with only 22% anticipating an increase, more expecting staffing levels to remain about the same and higher levels of uncertainty – nonetheless the overall picture was less gloomy than might have been anticipated given public expenditure constraints. 3.43 Supplementary comments made in relation to this question included the following:
• variations within councils relating to the experience of specific departments – e.g increase in planning staff, decrease in archaeology staff and vice versa;
• staffing levels were heavily dependent on funding schemes (and therefore very variable in the long term);
• there were shortages of qualified staff available for councils to employ; • staffing levels had in some cases stayed the same while workload had increased; • some LAs were creating specific HE posts, while others were subsuming these posts
within the wider team (i.e. scrapping specific HE posts); • there was a reliance on temporary posts/ staff in some cases.
3.44 The position in relation to support staff (those spending less than 50% of their time on HE activities) revealed a similar picture to that for specialist staff. As Table 3.11 shows, most

21
authorities expected staffing levels to remain the same but more expected an increase in support staff than decrease. Table 3.11: Past and Projected Changes in Historic Environment Support Staff
Past 3 Years Next 3 Years Changes in Staff Levels Number % Number %
Increase 7 28% 5 25% Stay the same 13 52% 13 65% Decrease 5 20% 2 10% Don’t know 0 0% 1 5% Total 25 100% 21 100%
Based on returns from 25 and 21 authorities respectively
3.45 Other general comments made by authorities relating to HE staffing included:
• budget cuts often hit services such as HE; • HE was not taken seriously by the corporate centre; • there was an absence of guidance over how the conservation function should be
properly discharged; • attracting qualified staff was a problem with particular difficulties in finding younger
recruits with HE knowledge/ qualifications.
FINANCIAL RESOURCES FOR THE HISTORIC ENVIRONMENT Introduction 3.46 All survey authorities were asked to provide information on their expenditure and income relating to the historic environment over the previous financial year (2007-8). As with returns on staffing, the responses in relation to this question, both from authorities as a whole and from services within authorities with different responsibilities for the historic environment, were very variable. 3.47 Question 9 asked for information on seven categories of HE expenditure and the number of authorities completing returns for each of these categories varied between eight and 22 out of a possible total of 34. Question 11 asked for information on four categories of HE income and the number of authorities completing returns for each of these categories varied between 12 and 28 It was also clear that some returns were actual figures while others were best estimates. 3.48 Consequently, on the basis of these returns it is only possible to determine the broad order of magnitude of expenditure and income relating to different aspects of the management of the historic environment by local and National Park authorities and further, more detailed work would be required to provide more accurate figures. In order to estimate figures for all authorities, actual returns have been ‘grossed up’ on the basis that non-responses broadly follow the same pattern as those for which data were available, allowing for differences in size and urban/rural characteristics. Expenditure on Staffing and Overheads
22
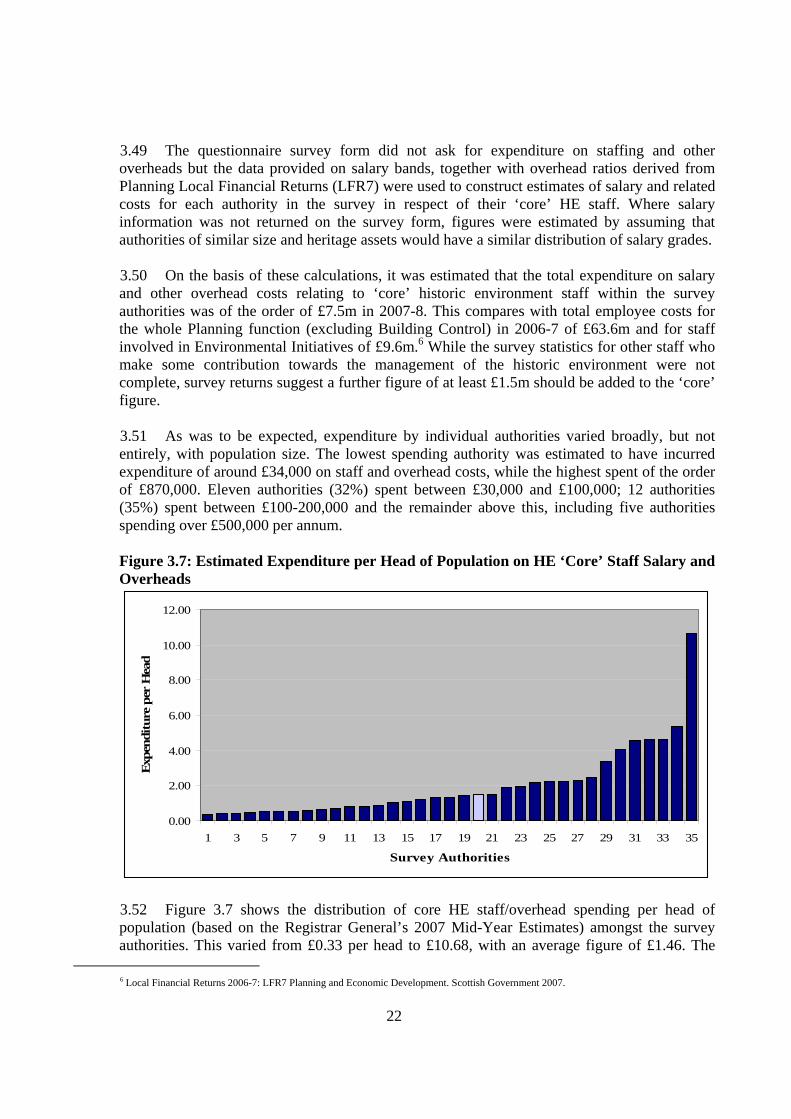
3.49 The questionnaire survey form did not ask for expenditure on staffing and other overheads but the data provided on salary bands, together with overhead ratios derived from Planning Local Financial Returns (LFR7) were used to construct estimates of salary and related costs for each authority in the survey in respect of their ‘core’ HE staff. Where salary information was not returned on the survey form, figures were estimated by assuming that authorities of similar size and heritage assets would have a similar distribution of salary grades. 3.50 On the basis of these calculations, it was estimated that the total expenditure on salary and other overhead costs relating to ‘core’ historic environment staff within the survey authorities was of the order of £7.5m in 2007-8. This compares with total employee costs for the whole Planning function (excluding Building Control) in 2006-7 of £63.6m and for staff involved in Environmental Initiatives of £9.6m.6 While the survey statistics for other staff who make some contribution towards the management of the historic environment were not complete, survey returns suggest a further figure of at least £1.5m should be added to the ‘core’ figure. 3.51 As was to be expected, expenditure by individual authorities varied broadly, but not entirely, with population size. The lowest spending authority was estimated to have incurred expenditure of around £34,000 on staff and overhead costs, while the highest spent of the order of £870,000. Eleven authorities (32%) spent between £30,000 and £100,000; 12 authorities (35%) spent between £100-200,000 and the remainder above this, including five authorities spending over £500,000 per annum. Figure 3.7: Estimated Expenditure per Head of Population on HE ‘Core’ Staff Salary and Overheads
0.00
2.00
4.00
6.00
8.00
10.00
12.00
1 3 5 7 9 11 13 15 17 19 21 23 25 27 29 31 33 35
Survey Authorities
Expe
nditu
re p
er H
ead
3.52 Figure 3.7 shows the distribution of core HE staff/overhead spending per head of population (based on the Registrar General’s 2007 Mid-Year Estimates) amongst the survey authorities. This varied from £0.33 per head to £10.68, with an average figure of £1.46. The
6 Local Financial Returns 2006-7: LFR7 Planning and Economic Development. Scottish Government 2007.
23
upper figure relates to a small authority without significant historic environment resources and appears to be a substantial overestimate, given that it was twice the figure of the next highest authority. No strong regional patterns emerged from the analysis but there was a high preponderance of authorities from West Central Scotland amongst those spending less than the average figure and significant proportion of rural authorities spending above this figure.
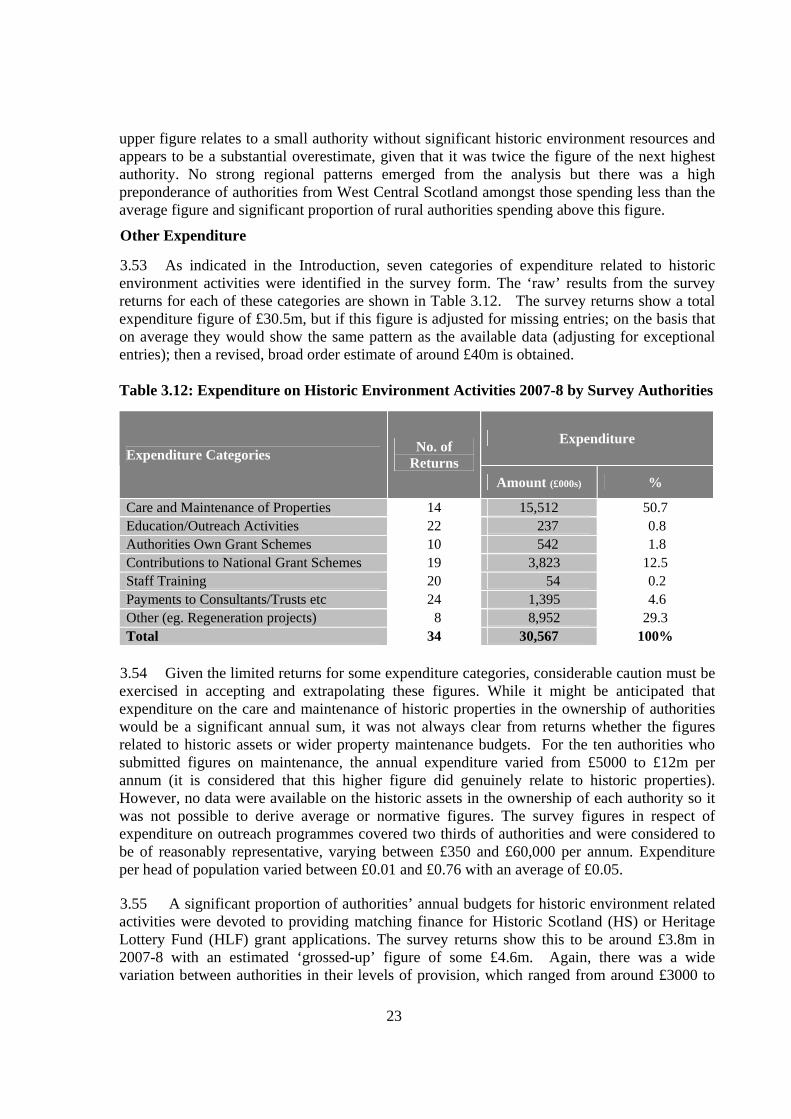
Other Expenditure 3.53 As indicated in the Introduction, seven categories of expenditure related to historic environment activities were identified in the survey form. The ‘raw’ results from the survey returns for each of these categories are shown in Table 3.12. The survey returns show a total expenditure figure of £30.5m, but if this figure is adjusted for missing entries; on the basis that on average they would show the same pattern as the available data (adjusting for exceptional entries); then a revised, broad order estimate of around £40m is obtained. Table 3.12: Expenditure on Historic Environment Activities 2007-8 by Survey Authorities
Expenditure Expenditure Categories No. of
Returns Amount (£000s) %
Care and Maintenance of Properties 14 15,512 50.7 Education/Outreach Activities 22 237 0.8 Authorities Own Grant Schemes 10 542 1.8 Contributions to National Grant Schemes 19 3,823 12.5 Staff Training 20 54 0.2 Payments to Consultants/Trusts etc 24 1,395 4.6 Other (eg. Regeneration projects) 8 8,952 29.3 Total 34 30,567 100%
3.54 Given the limited returns for some expenditure categories, considerable caution must be exercised in accepting and extrapolating these figures. While it might be anticipated that expenditure on the care and maintenance of historic properties in the ownership of authorities would be a significant annual sum, it was not always clear from returns whether the figures related to historic assets or wider property maintenance budgets. For the ten authorities who submitted figures on maintenance, the annual expenditure varied from £5000 to £12m per annum (it is considered that this higher figure did genuinely relate to historic properties). However, no data were available on the historic assets in the ownership of each authority so it was not possible to derive average or normative figures. The survey figures in respect of expenditure on outreach programmes covered two thirds of authorities and were considered to be of reasonably representative, varying between £350 and £60,000 per annum. Expenditure per head of population varied between £0.01 and £0.76 with an average of £0.05. 3.55 A significant proportion of authorities’ annual budgets for historic environment related activities were devoted to providing matching finance for Historic Scotland (HS) or Heritage Lottery Fund (HLF) grant applications. The survey returns show this to be around £3.8m in 2007-8 with an estimated ‘grossed-up’ figure of some £4.6m. Again, there was a wide variation between authorities in their levels of provision, which ranged from around £3000 to
24
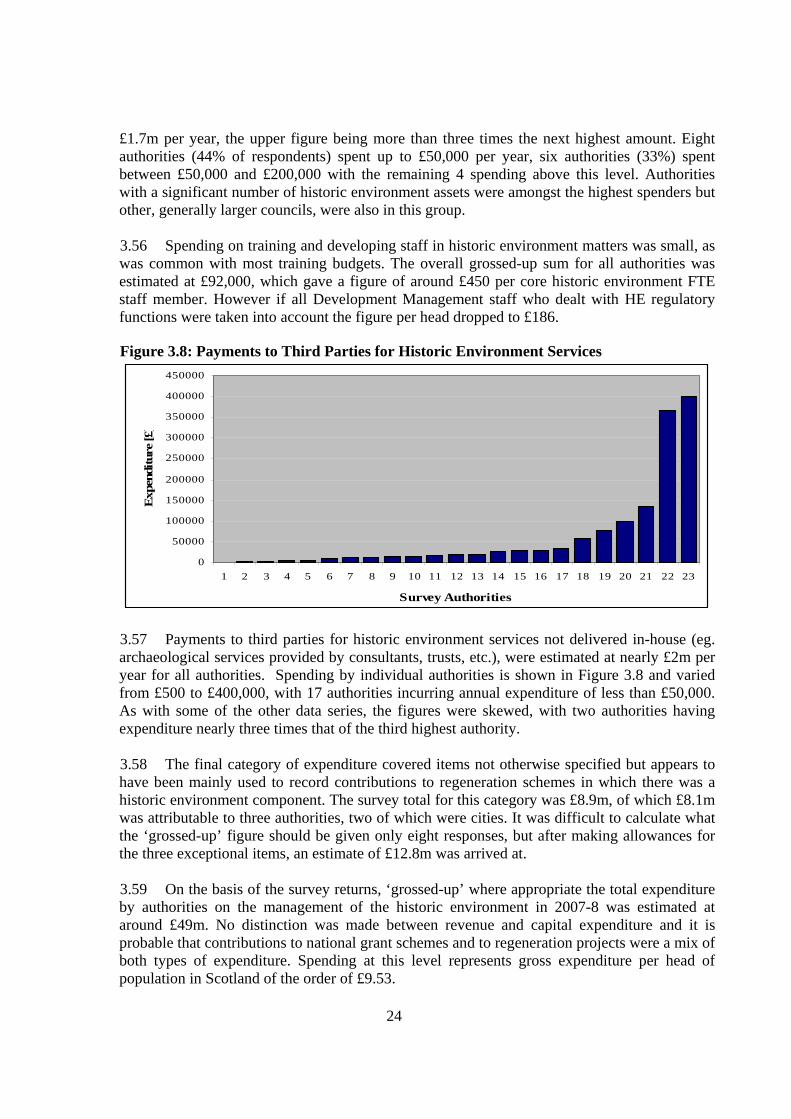
£1.7m per year, the upper figure being more than three times the next highest amount. Eight authorities (44% of respondents) spent up to £50,000 per year, six authorities (33%) spent between £50,000 and £200,000 with the remaining 4 spending above this level. Authorities with a significant number of historic environment assets were amongst the highest spenders but other, generally larger councils, were also in this group. 3.56 Spending on training and developing staff in historic environment matters was small, as was common with most training budgets. The overall grossed-up sum for all authorities was estimated at £92,000, which gave a figure of around £450 per core historic environment FTE staff member. However if all Development Management staff who dealt with HE regulatory functions were taken into account the figure per head dropped to £186. Figure 3.8: Payments to Third Parties for Historic Environment Services
0
50000
100000
150000
200000
250000
300000
350000
400000
450000
1 2 3 4 5 6 7 8 9 10 11 12 13 14 15 16 17 18 19 20 21 22 23
Survey Authorities
Exp
endi
ture
[£]
3.57 Payments to third parties for historic environment services not delivered in-house (eg. archaeological services provided by consultants, trusts, etc.), were estimated at nearly £2m per year for all authorities. Spending by individual authorities is shown in Figure 3.8 and varied from £500 to £400,000, with 17 authorities incurring annual expenditure of less than £50,000. As with some of the other data series, the figures were skewed, with two authorities having expenditure nearly three times that of the third highest authority. 3.58 The final category of expenditure covered items not otherwise specified but appears to have been mainly used to record contributions to regeneration schemes in which there was a historic environment component. The survey total for this category was £8.9m, of which £8.1m was attributable to three authorities, two of which were cities. It was difficult to calculate what the ‘grossed-up’ figure should be given only eight responses, but after making allowances for the three exceptional items, an estimate of £12.8m was arrived at. 3.59 On the basis of the survey returns, ‘grossed-up’ where appropriate the total expenditure by authorities on the management of the historic environment in 2007-8 was estimated at around £49m. No distinction was made between revenue and capital expenditure and it is probable that contributions to national grant schemes and to regeneration projects were a mix of both types of expenditure. Spending at this level represents gross expenditure per head of population in Scotland of the order of £9.53.
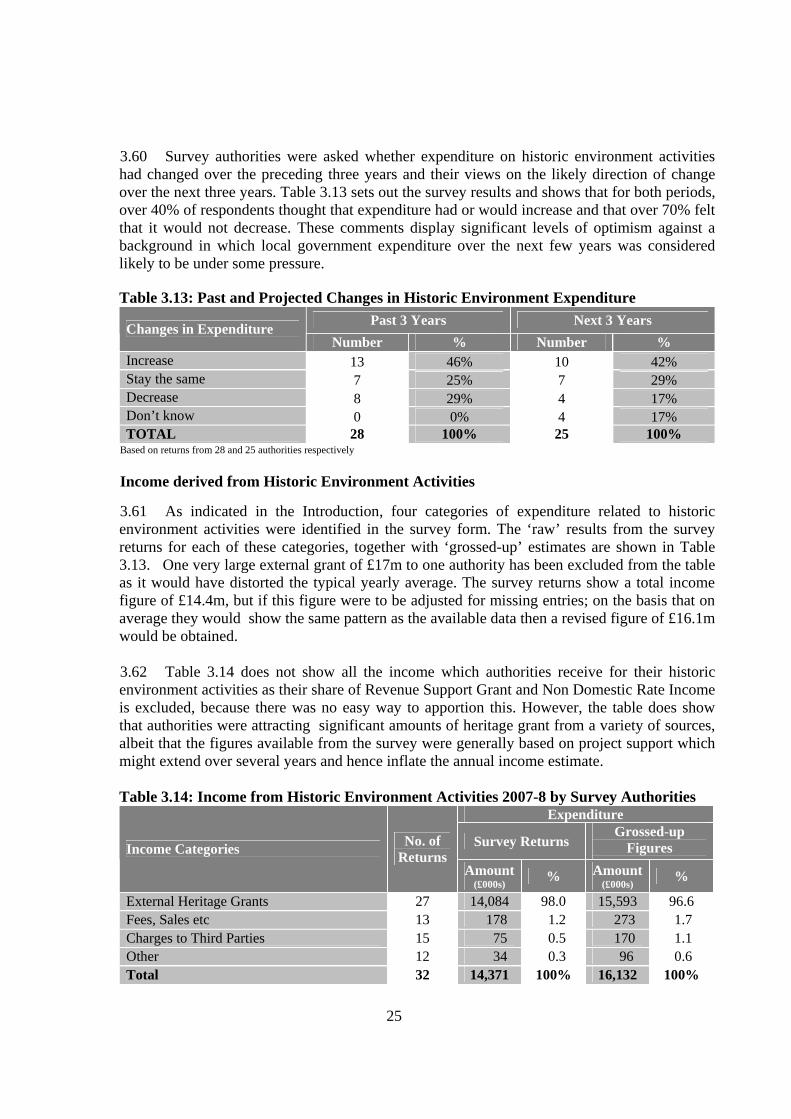
25
3.60 Survey authorities were asked whether expenditure on historic environment activities had changed over the preceding three years and their views on the likely direction of change over the next three years. Table 3.13 sets out the survey results and shows that for both periods, over 40% of respondents thought that expenditure had or would increase and that over 70% felt that it would not decrease. These comments display significant levels of optimism against a background in which local government expenditure over the next few years was considered likely to be under some pressure. Table 3.13: Past and Projected Changes in Historic Environment Expenditure
Past 3 Years Next 3 Years Changes in Expenditure Number % Number %
Increase 13 46% 10 42% Stay the same 7 25% 7 29% Decrease 8 29% 4 17% Don’t know 0 0% 4 17% TOTAL 28 100% 25 100%
Based on returns from 28 and 25 authorities respectively Income derived from Historic Environment Activities 3.61 As indicated in the Introduction, four categories of expenditure related to historic environment activities were identified in the survey form. The ‘raw’ results from the survey returns for each of these categories, together with ‘grossed-up’ estimates are shown in Table 3.13. One very large external grant of £17m to one authority has been excluded from the table as it would have distorted the typical yearly average. The survey returns show a total income figure of £14.4m, but if this figure were to be adjusted for missing entries; on the basis that on average they would show the same pattern as the available data then a revised figure of £16.1m would be obtained. 3.62 Table 3.14 does not show all the income which authorities receive for their historic environment activities as their share of Revenue Support Grant and Non Domestic Rate Income is excluded, because there was no easy way to apportion this. However, the table does show that authorities were attracting significant amounts of heritage grant from a variety of sources, albeit that the figures available from the survey were generally based on project support which might extend over several years and hence inflate the annual income estimate. Table 3.14: Income from Historic Environment Activities 2007-8 by Survey Authorities
Expenditure
Survey Returns Grossed-up
Figures Income Categories No. of Returns
Amount (£000s) % Amount
(£000s) %
External Heritage Grants 27 14,084 98.0 15,593 96.6 Fees, Sales etc 13 178 1.2 273 1.7 Charges to Third Parties 15 75 0.5 170 1.1 Other 12 34 0.3 96 0.6 Total 32 14,371 100% 16,132 100%
26
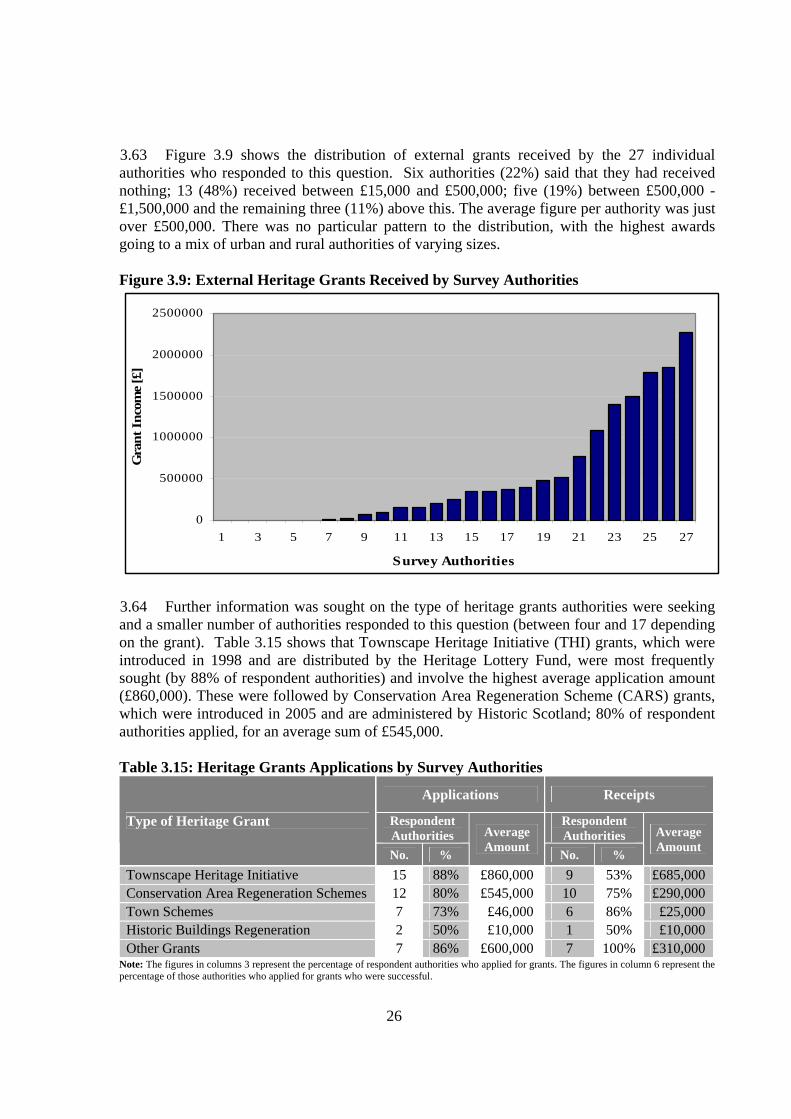
3.63 Figure 3.9 shows the distribution of external grants received by the 27 individual authorities who responded to this question. Six authorities (22%) said that they had received nothing; 13 (48%) received between £15,000 and £500,000; five (19%) between £500,000 - £1,500,000 and the remaining three (11%) above this. The average figure per authority was just over £500,000. There was no particular pattern to the distribution, with the highest awards going to a mix of urban and rural authorities of varying sizes. Figure 3.9: External Heritage Grants Received by Survey Authorities
0
500000
1000000
1500000
2000000
2500000
1 3 5 7 9 11 13 15 17 19 21 23 25 27
Survey Authorities
Gra
nt I
ncom
e [£
]
3.64 Further information was sought on the type of heritage grants authorities were seeking and a smaller number of authorities responded to this question (between four and 17 depending on the grant). Table 3.15 shows that Townscape Heritage Initiative (THI) grants, which were introduced in 1998 and are distributed by the Heritage Lottery Fund, were most frequently sought (by 88% of respondent authorities) and involve the highest average application amount (£860,000). These were followed by Conservation Area Regeneration Scheme (CARS) grants, which were introduced in 2005 and are administered by Historic Scotland; 80% of respondent authorities applied, for an average sum of £545,000. Table 3.15: Heritage Grants Applications by Survey Authorities
Applications Receipts
Respondent Authorities
Respondent Authorities
Type of Heritage Grant
No. %
Average Amount No. %
Average Amount
Townscape Heritage Initiative 15 88% £860,000 9 53% £685,000 Conservation Area Regeneration Schemes 12 80% £545,000 10 75% £290,000 Town Schemes 7 73% £46,000 6 86% £25,000 Historic Buildings Regeneration 2 50% £10,000 1 50% £10,000 Other Grants 7 86% £600,000 7 100% £310,000
Note: The figures in columns 3 represent the percentage of respondent authorities who applied for grants. The figures in column 6 represent the percentage of those authorities who applied for grants who were successful.
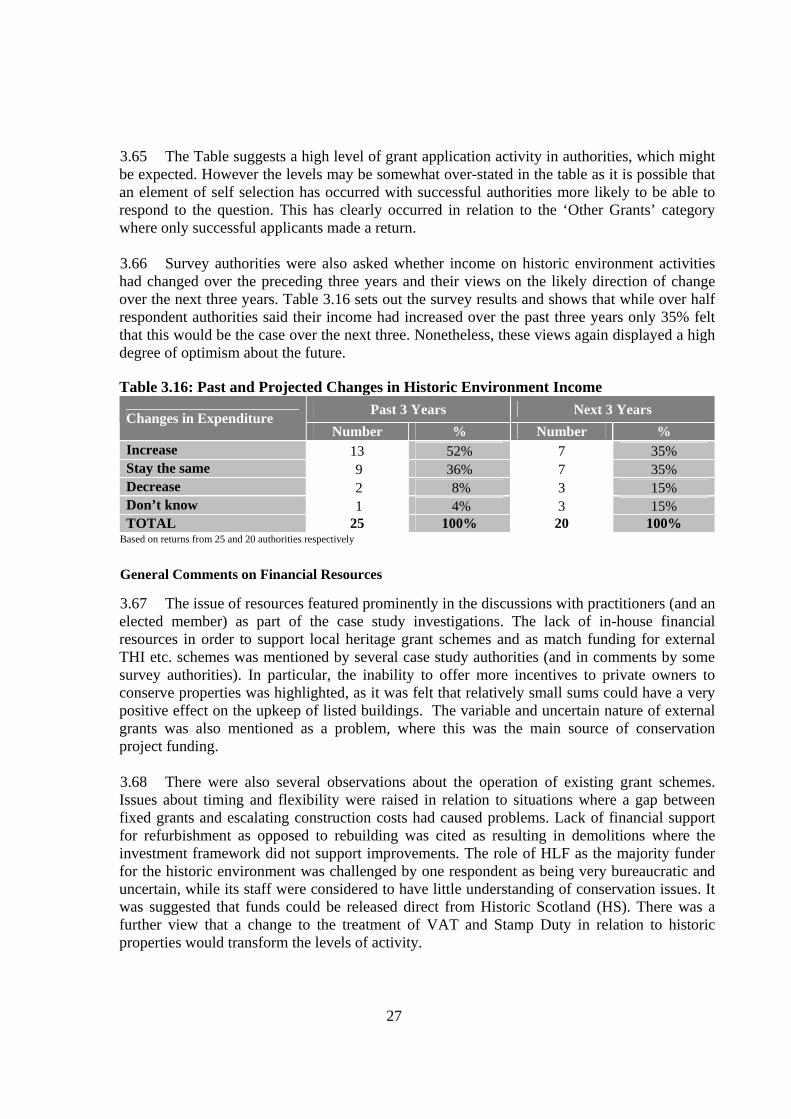
27
3.65 The Table suggests a high level of grant application activity in authorities, which might be expected. However the levels may be somewhat over-stated in the table as it is possible that an element of self selection has occurred with successful authorities more likely to be able to respond to the question. This has clearly occurred in relation to the ‘Other Grants’ category where only successful applicants made a return. 3.66 Survey authorities were also asked whether income on historic environment activities had changed over the preceding three years and their views on the likely direction of change over the next three years. Table 3.16 sets out the survey results and shows that while over half respondent authorities said their income had increased over the past three years only 35% felt that this would be the case over the next three. Nonetheless, these views again displayed a high degree of optimism about the future. Table 3.16: Past and Projected Changes in Historic Environment Income
Past 3 Years Next 3 Years Changes in Expenditure Number % Number %
Increase 13 52% 7 35% Stay the same 9 36% 7 35% Decrease 2 8% 3 15% Don’t know 1 4% 3 15% TOTAL 25 100% 20 100%
Based on returns from 25 and 20 authorities respectively General Comments on Financial Resources 3.67 The issue of resources featured prominently in the discussions with practitioners (and an elected member) as part of the case study investigations. The lack of in-house financial resources in order to support local heritage grant schemes and as match funding for external THI etc. schemes was mentioned by several case study authorities (and in comments by some survey authorities). In particular, the inability to offer more incentives to private owners to conserve properties was highlighted, as it was felt that relatively small sums could have a very positive effect on the upkeep of listed buildings. The variable and uncertain nature of external grants was also mentioned as a problem, where this was the main source of conservation project funding. 3.68 There were also several observations about the operation of existing grant schemes. Issues about timing and flexibility were raised in relation to situations where a gap between fixed grants and escalating construction costs had caused problems. Lack of financial support for refurbishment as opposed to rebuilding was cited as resulting in demolitions where the investment framework did not support improvements. The role of HLF as the majority funder for the historic environment was challenged by one respondent as being very bureaucratic and uncertain, while its staff were considered to have little understanding of conservation issues. It was suggested that funds could be released direct from Historic Scotland (HS). There was a further view that a change to the treatment of VAT and Stamp Duty in relation to historic properties would transform the levels of activity.
28
3.69 Several authorities highlighted the lack of resources to support or increase staffing levels as a significant problem. They indicated that there was a direct link between staff levels and the amount of project development and grant application work that could be undertaken. One authority was concerned at the high number of HE staff on temporary contracts and the difficulty in ‘mainstreaming’ such posts. Salary levels were also raised as an issue, although this was a matter for local authorities themselves. Individual views came through on the unfavourable comparability of salary levels between conservation-trained and other officers. 3.70 Although two case study authorities referred favourably to the three year tapered grants provided by English Heritage, which enabled specialist HE capacity to be developed in-house, no mention was made of HS’s long-running programme of support for SMR posts, and which one of the case study LAs had itself benefited from in the form of a tapering grant to support a post. 3.71 The marriage of conservation and regeneration interests was identified by respondents as particularly important in attracting funding and in promoting the recognition of the historic environment as a tourism and sustainability asset. Politicians and senior managers were recognising the value of this leverage capability and more funding bids needed to be framed in these terms. However, lack of adequate match funding remained a key obstacle to significant progress in this area. 3.72 Other comments included the need for significant financial resources in order to support moves to a wholly digital SMR system. One council also mentioned that the global financial situation was having an impact on developer behaviour, including developers’ approach to HE issues. They cited the example of the drop in the real value of a listed cinema over the past year, reducing the owners’ scope to re-use it. HISTORIC ENVIRONMENT WORKLOAD
Introduction
3.73 The survey sought information from each authority on the range of historic environment-related activities they carried out. As indicated in Chapter 2, although survey forms were sent to different services within most authorities, the majority of returns only covered HE planning and archaeology services and the results should, consequently, be interpreted in that context. Information on the overall composition of the workload between different activities and on more detailed aspects relating to planning, archaeology and outreach activities comprised the key elements of this section of the questionnaire. Overall Workload Composition 3.74 Question 14 of the survey asked service respondents to indicate which of ten specialist historic environment services listed they were responsible for delivering and to estimate the approximate share which each specialist service took up of the total HE workload. The survey results are shown in Table 3. 17. 3.75 The table shows that HE policy formulation and delivery of historic buildings advice were the two most widespread activities, followed by outreach, record maintenance and
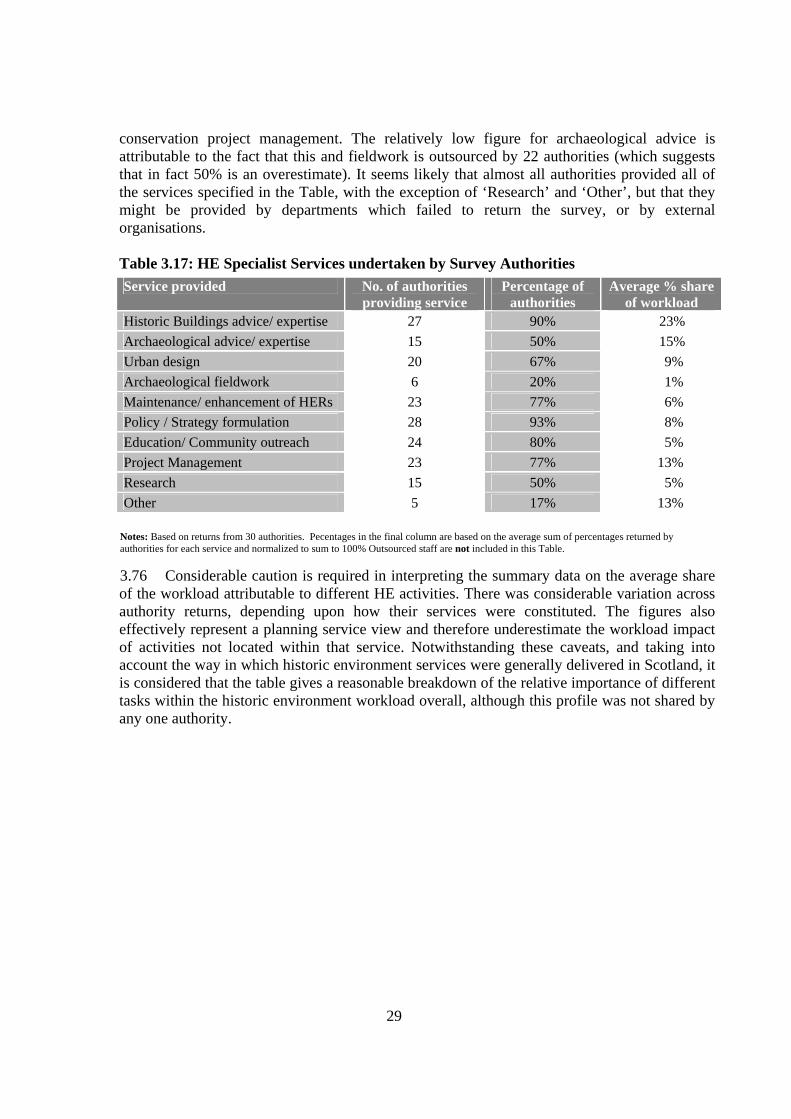
29
conservation project management. The relatively low figure for archaeological advice is attributable to the fact that this and fieldwork is outsourced by 22 authorities (which suggests that in fact 50% is an overestimate). It seems likely that almost all authorities provided all of the services specified in the Table, with the exception of ‘Research’ and ‘Other’, but that they might be provided by departments which failed to return the survey, or by external organisations. Table 3.17: HE Specialist Services undertaken by Survey Authorities
Notes: Based on returns from 30 authorities. Pecentages in the final column are based on the average sum of percentages returned by authorities for each service and normalized to sum to 100% Outsourced staff are not included in this Table. 3.76 Considerable caution is required in interpreting the summary data on the average share of the workload attributable to different HE activities. There was considerable variation across authority returns, depending upon how their services were constituted. The figures also effectively represent a planning service view and therefore underestimate the workload impact of activities not located within that service. Notwithstanding these caveats, and taking into account the way in which historic environment services were generally delivered in Scotland, it is considered that the table gives a reasonable breakdown of the relative importance of different tasks within the historic environment workload overall, although this profile was not shared by any one authority.
Service provided No. of authorities providing service
Percentage of authorities
Average % share of workload
Historic Buildings advice/ expertise 27 90% 23% Archaeological advice/ expertise 15 50% 15% Urban design 20 67% 9% Archaeological fieldwork 6 20% 1% Maintenance/ enhancement of HERs 23 77% 6% Policy / Strategy formulation 28 93% 8% Education/ Community outreach 24 80% 5% Project Management 23 77% 13% Research 15 50% 5% Other 5 17% 13%
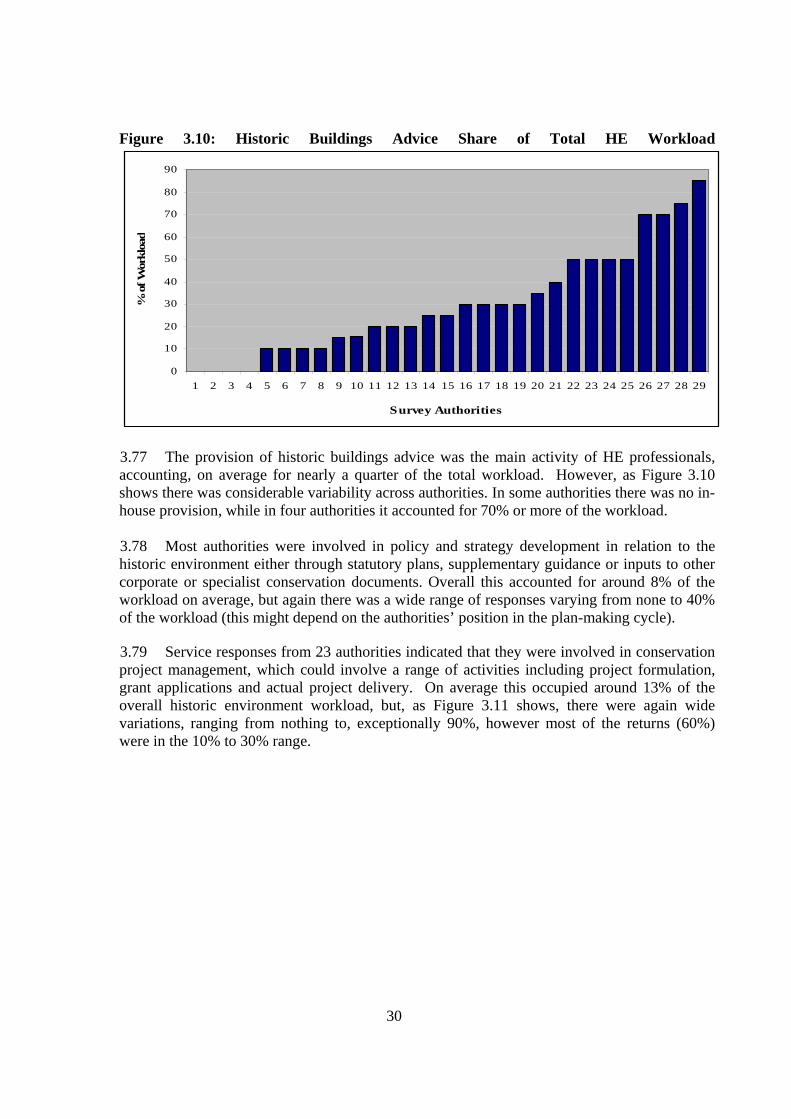
30
Figure 3.10: Historic Buildings Advice Share of Total HE Workload
0
10
20
30
40
50
60
70
80
90
1 2 3 4 5 6 7 8 9 10 11 12 13 14 15 16 17 18 19 20 21 22 23 24 25 26 27 28 29
Survey Authorities
% o
f Wor
kloa
d
3.77 The provision of historic buildings advice was the main activity of HE professionals, accounting, on average for nearly a quarter of the total workload. However, as Figure 3.10 shows there was considerable variability across authorities. In some authorities there was no in-house provision, while in four authorities it accounted for 70% or more of the workload. 3.78 Most authorities were involved in policy and strategy development in relation to the historic environment either through statutory plans, supplementary guidance or inputs to other corporate or specialist conservation documents. Overall this accounted for around 8% of the workload on average, but again there was a wide range of responses varying from none to 40% of the workload (this might depend on the authorities’ position in the plan-making cycle). 3.79 Service responses from 23 authorities indicated that they were involved in conservation project management, which could involve a range of activities including project formulation, grant applications and actual project delivery. On average this occupied around 13% of the overall historic environment workload, but, as Figure 3.11 shows, there were again wide variations, ranging from nothing to, exceptionally 90%, however most of the returns (60%) were in the 10% to 30% range.
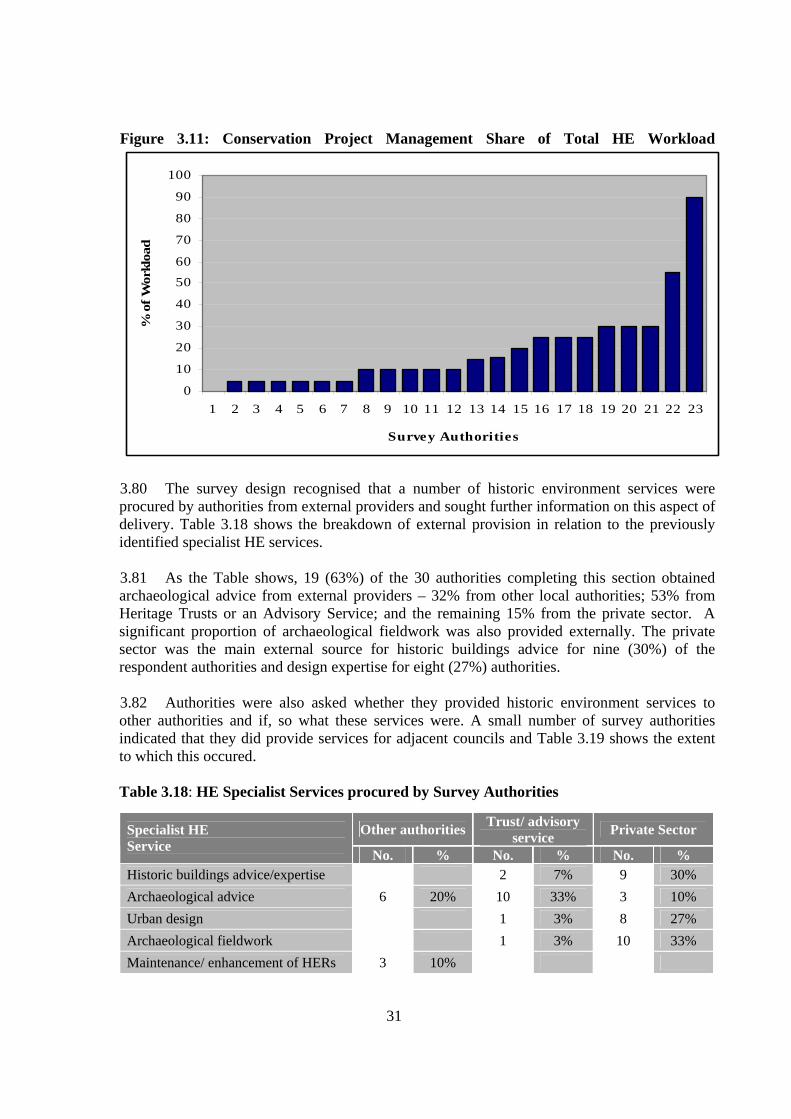
31
Figure 3.11: Conservation Project Management Share of Total HE Workload
0
10
20
30
40
5060
70
80
90
100
1 2 3 4 5 6 7 8 9 10 11 12 13 14 15 16 17 18 19 20 21 22 23
Survey Authorities
% o
f Wor
kloa
d
3.80 The survey design recognised that a number of historic environment services were procured by authorities from external providers and sought further information on this aspect of delivery. Table 3.18 shows the breakdown of external provision in relation to the previously identified specialist HE services. 3.81 As the Table shows, 19 (63%) of the 30 authorities completing this section obtained archaeological advice from external providers – 32% from other local authorities; 53% from Heritage Trusts or an Advisory Service; and the remaining 15% from the private sector. A significant proportion of archaeological fieldwork was also provided externally. The private sector was the main external source for historic buildings advice for nine (30%) of the respondent authorities and design expertise for eight (27%) authorities. 3.82 Authorities were also asked whether they provided historic environment services to other authorities and if, so what these services were. A small number of survey authorities indicated that they did provide services for adjacent councils and Table 3.19 shows the extent to which this occured. Table 3.18: HE Specialist Services procured by Survey Authorities
Other authorities Trust/ advisory service Private Sector Specialist HE
Service No. % No. % No. % Historic buildings advice/expertise 2 7% 9 30% Archaeological advice 6 20% 10 33% 3 10%
Urban design 1 3% 8 27%
Archaeological fieldwork 1 3% 10 33%
Maintenance/ enhancement of HERs 3 10%
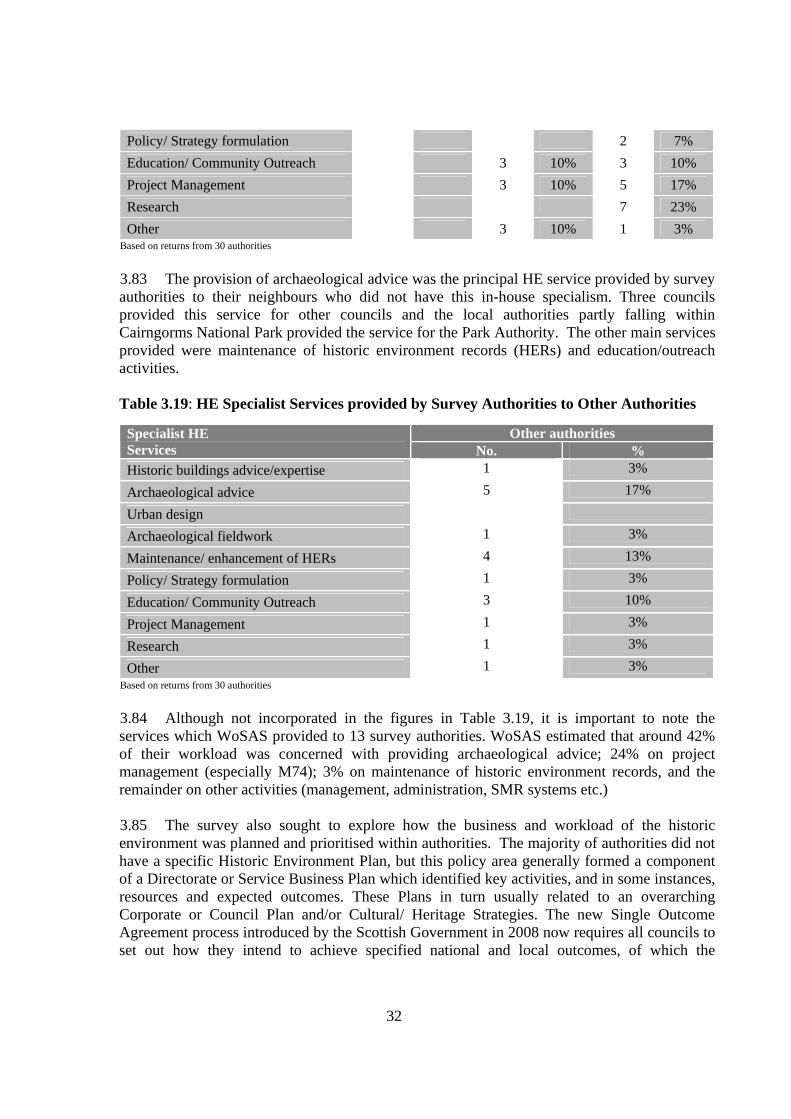
32
Policy/ Strategy formulation 2 7%
Education/ Community Outreach 3 10% 3 10%
Project Management 3 10% 5 17%
Research 7 23%
Other 3 10% 1 3% Based on returns from 30 authorities 3.83 The provision of archaeological advice was the principal HE service provided by survey authorities to their neighbours who did not have this in-house specialism. Three councils provided this service for other councils and the local authorities partly falling within Cairngorms National Park provided the service for the Park Authority. The other main services provided were maintenance of historic environment records (HERs) and education/outreach activities. Table 3.19: HE Specialist Services provided by Survey Authorities to Other Authorities
Other authorities Specialist HE
Services No. % Historic buildings advice/expertise 1 3%
Archaeological advice 5 17%
Urban design
Archaeological fieldwork 1 3%
Maintenance/ enhancement of HERs 4 13%
Policy/ Strategy formulation 1 3%
Education/ Community Outreach 3 10%
Project Management 1 3%
Research 1 3%
Other 1 3% Based on returns from 30 authorities
3.84 Although not incorporated in the figures in Table 3.19, it is important to note the services which WoSAS provided to 13 survey authorities. WoSAS estimated that around 42% of their workload was concerned with providing archaeological advice; 24% on project management (especially M74); 3% on maintenance of historic environment records, and the remainder on other activities (management, administration, SMR systems etc.) 3.85 The survey also sought to explore how the business and workload of the historic environment was planned and prioritised within authorities. The majority of authorities did not have a specific Historic Environment Plan, but this policy area generally formed a component of a Directorate or Service Business Plan which identified key activities, and in some instances, resources and expected outcomes. These Plans in turn usually related to an overarching Corporate or Council Plan and/or Cultural/ Heritage Strategies. The new Single Outcome Agreement process introduced by the Scottish Government in 2008 now requires all councils to set out how they intend to achieve specified national and local outcomes, of which the
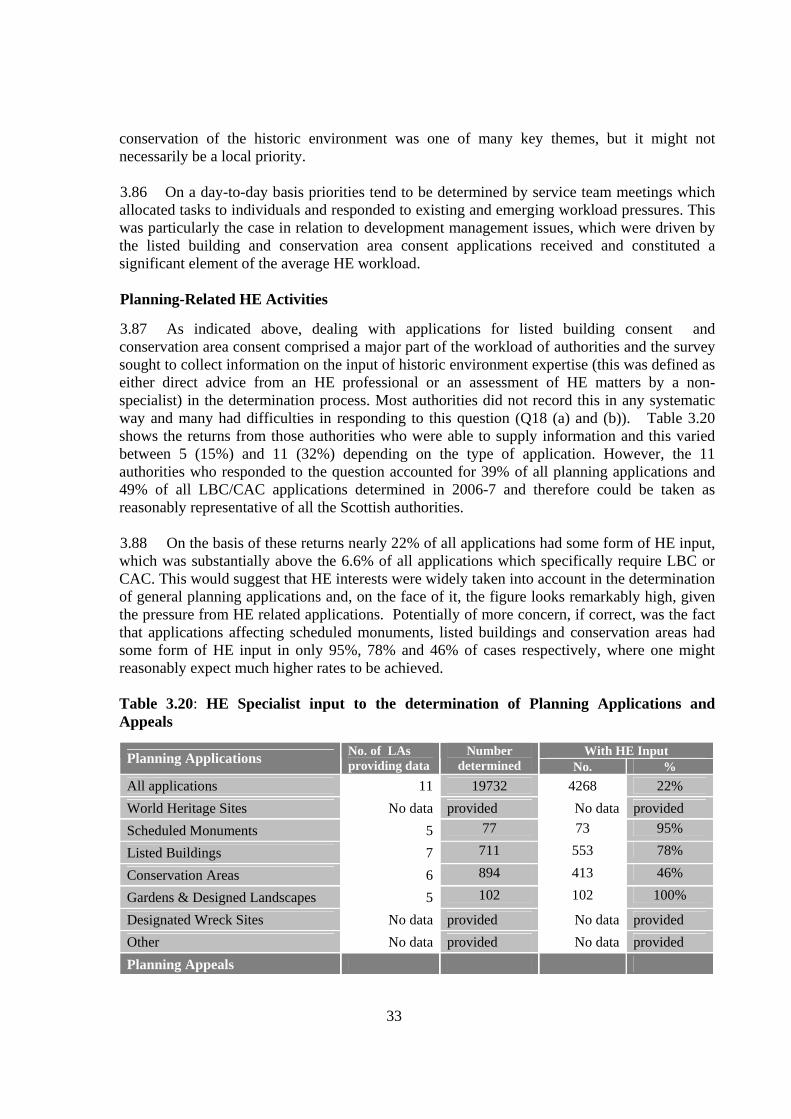
33
conservation of the historic environment was one of many key themes, but it might not necessarily be a local priority. 3.86 On a day-to-day basis priorities tend to be determined by service team meetings which allocated tasks to individuals and responded to existing and emerging workload pressures. This was particularly the case in relation to development management issues, which were driven by the listed building and conservation area consent applications received and constituted a significant element of the average HE workload. Planning-Related HE Activities 3.87 As indicated above, dealing with applications for listed building consent and conservation area consent comprised a major part of the workload of authorities and the survey sought to collect information on the input of historic environment expertise (this was defined as either direct advice from an HE professional or an assessment of HE matters by a non-specialist) in the determination process. Most authorities did not record this in any systematic way and many had difficulties in responding to this question (Q18 (a) and (b)). Table 3.20 shows the returns from those authorities who were able to supply information and this varied between 5 (15%) and 11 (32%) depending on the type of application. However, the 11 authorities who responded to the question accounted for 39% of all planning applications and 49% of all LBC/CAC applications determined in 2006-7 and therefore could be taken as reasonably representative of all the Scottish authorities. 3.88 On the basis of these returns nearly 22% of all applications had some form of HE input, which was substantially above the 6.6% of all applications which specifically require LBC or CAC. This would suggest that HE interests were widely taken into account in the determination of general planning applications and, on the face of it, the figure looks remarkably high, given the pressure from HE related applications. Potentially of more concern, if correct, was the fact that applications affecting scheduled monuments, listed buildings and conservation areas had some form of HE input in only 95%, 78% and 46% of cases respectively, where one might reasonably expect much higher rates to be achieved. Table 3.20: HE Specialist input to the determination of Planning Applications and Appeals
With HE Input Planning Applications No. of LAs
providing data Number
determined No. % All applications 11 19732 4268 22% World Heritage Sites No data provided No data provided Scheduled Monuments 5 77 73 95%
Listed Buildings 7 711 553 78%
Conservation Areas 6 894 413 46%
Gardens & Designed Landscapes 5 102 102 100%
Designated Wreck Sites No data provided No data provided Other No data provided No data provided Planning Appeals
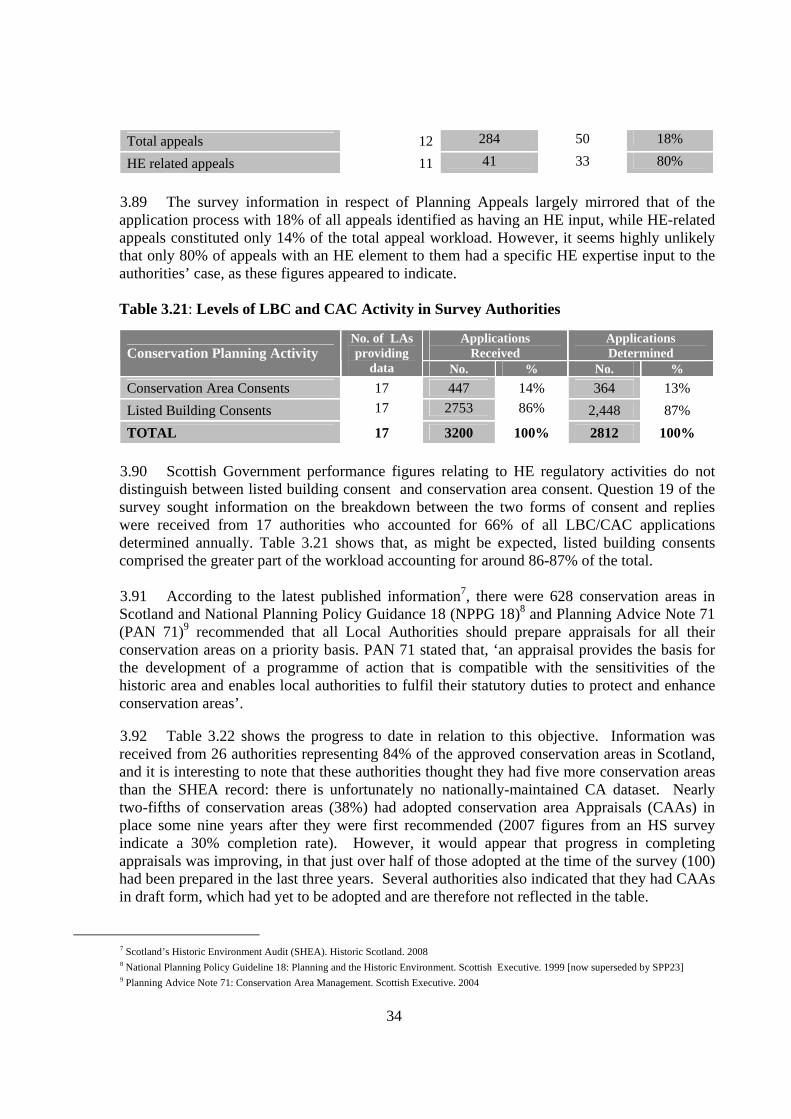
34
Total appeals 12 284 50 18%
HE related appeals 11 41 33 80%
3.89 The survey information in respect of Planning Appeals largely mirrored that of the application process with 18% of all appeals identified as having an HE input, while HE-related appeals constituted only 14% of the total appeal workload. However, it seems highly unlikely that only 80% of appeals with an HE element to them had a specific HE expertise input to the authorities’ case, as these figures appeared to indicate. Table 3.21: Levels of LBC and CAC Activity in Survey Authorities
Applications
Received Applications Determined Conservation Planning Activity
No. of LAs providing
data No. % No. % Conservation Area Consents 17 447 14% 364 13% Listed Building Consents 17 2753 86% 2,448 87% TOTAL 17 3200 100% 2812 100%
3.90 Scottish Government performance figures relating to HE regulatory activities do not distinguish between listed building consent and conservation area consent. Question 19 of the survey sought information on the breakdown between the two forms of consent and replies were received from 17 authorities who accounted for 66% of all LBC/CAC applications determined annually. Table 3.21 shows that, as might be expected, listed building consents comprised the greater part of the workload accounting for around 86-87% of the total. 3.91 According to the latest published information7, there were 628 conservation areas in Scotland and National Planning Policy Guidance 18 (NPPG 18)8 and Planning Advice Note 71 (PAN 71)9 recommended that all Local Authorities should prepare appraisals for all their conservation areas on a priority basis. PAN 71 stated that, ‘an appraisal provides the basis for the development of a programme of action that is compatible with the sensitivities of the historic area and enables local authorities to fulfil their statutory duties to protect and enhance conservation areas’.
3.92 Table 3.22 shows the progress to date in relation to this objective. Information was received from 26 authorities representing 84% of the approved conservation areas in Scotland, and it is interesting to note that these authorities thought they had five more conservation areas than the SHEA record: there is unfortunately no nationally-maintained CA dataset. Nearly two-fifths of conservation areas (38%) had adopted conservation area Appraisals (CAAs) in place some nine years after they were first recommended (2007 figures from an HS survey indicate a 30% completion rate). However, it would appear that progress in completing appraisals was improving, in that just over half of those adopted at the time of the survey (100) had been prepared in the last three years. Several authorities also indicated that they had CAAs in draft form, which had yet to be adopted and are therefore not reflected in the table.
7 Scotland’s Historic Environment Audit (SHEA). Historic Scotland. 2008 8 National Planning Policy Guideline 18: Planning and the Historic Environment. Scottish Executive. 1999 [now superseded by SPP23] 9 Planning Advice Note 71: Conservation Area Management. Scottish Executive. 2004
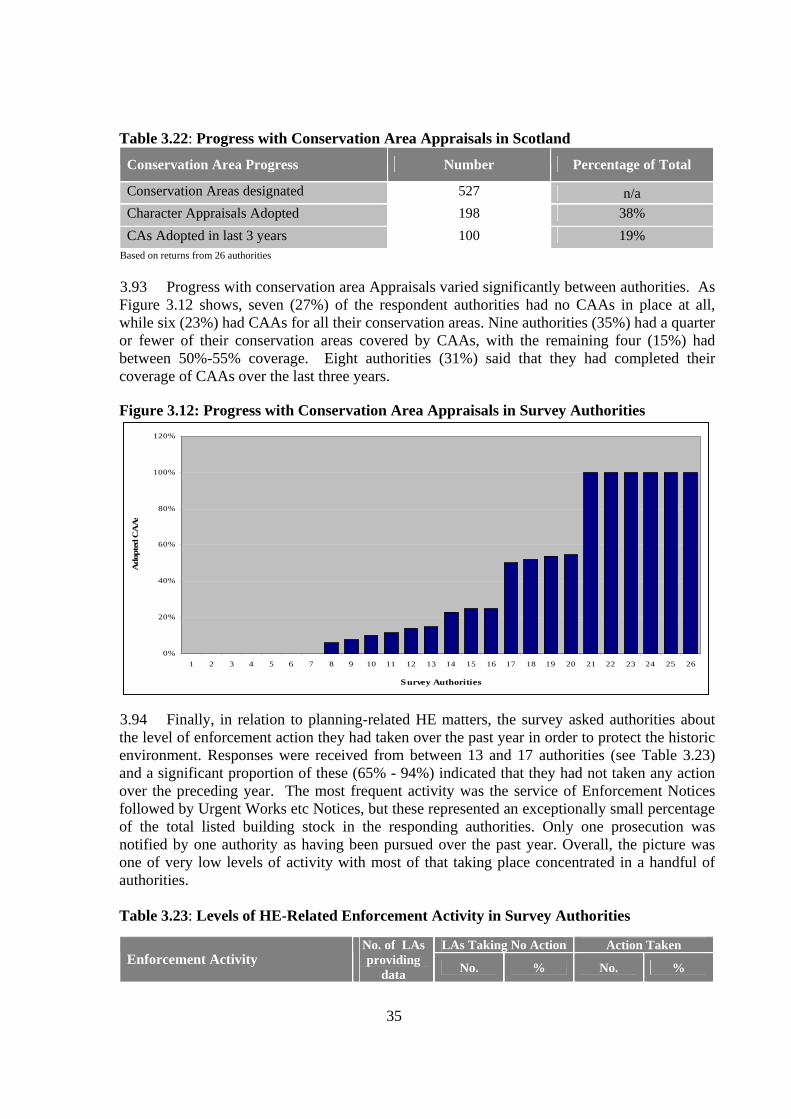
35
Table 3.22: Progress with Conservation Area Appraisals in Scotland
Conservation Area Progress Number Percentage of Total
Conservation Areas designated 527 n/a Character Appraisals Adopted 198 38% CAs Adopted in last 3 years 100 19%
Based on returns from 26 authorities 3.93 Progress with conservation area Appraisals varied significantly between authorities. As Figure 3.12 shows, seven (27%) of the respondent authorities had no CAAs in place at all, while six (23%) had CAAs for all their conservation areas. Nine authorities (35%) had a quarter or fewer of their conservation areas covered by CAAs, with the remaining four (15%) had between 50%-55% coverage. Eight authorities (31%) said that they had completed their coverage of CAAs over the last three years. Figure 3.12: Progress with Conservation Area Appraisals in Survey Authorities
0%
20%
40%
60%
80%
100%
120%
1 2 3 4 5 6 7 8 9 10 11 12 13 14 15 16 17 18 19 20 21 22 23 24 25 26
Survey Authorities
Ado
pted
CA
As
3.94 Finally, in relation to planning-related HE matters, the survey asked authorities about the level of enforcement action they had taken over the past year in order to protect the historic environment. Responses were received from between 13 and 17 authorities (see Table 3.23) and a significant proportion of these (65% - 94%) indicated that they had not taken any action over the preceding year. The most frequent activity was the service of Enforcement Notices followed by Urgent Works etc Notices, but these represented an exceptionally small percentage of the total listed building stock in the responding authorities. Only one prosecution was notified by one authority as having been pursued over the past year. Overall, the picture was one of very low levels of activity with most of that taking place concentrated in a handful of authorities. Table 3.23: Levels of HE-Related Enforcement Activity in Survey Authorities
LAs Taking No Action Action Taken
Enforcement Activity No. of LAs providing
data No. % No. %

36
Enforcement Notices 16 11 69% 43 0.16% Prosecutions 17 16 94% 1 0.00% Repairs Notices 13 11 85% 7 0.03% Urgent Works & Section 42 Notices 17 11 65% 15 0.06%
Note: the percentages in the final column of the table are based on the 26989 listed buildings in the responding authorities Archaeological and Related Services 3.95 Questions 22–26 in the survey sought information about a range of historic environment activities undertaken by authorities which were not part of the statutory planning function. Question 22 was concerned with the historic environment records kept by authorities and was in two parts. The first part concerned the extent to which records were kept at all, whether they were up-to-date and the percentage of the historic resource covered by the record. The survey returns are shown in Table 3.24. Table 3.24: Historic Environment Records kept by Survey Authorities
Records Kept Kept up-to-date Coverage Historic Environment Assets No. % No. % No with
100% %
Scheduled Monuments 28 97% 25 89% 15 83% Unscheduled Sites/Monuments 21 72% 16 76% 7 58% Listed Buildings 28 97% 26 93% 16 84% Conservation Areas 27 93% 24 89% 15 88% Gardens & Designed Landscapes 25 86% 23 92% 17 94% Maritime Heritage 8 28% 5 63% 2 67% Buildings at Risk 18 62% 12 67% 5 50% LA owned heritage assets 10 34% 7 70% 3 60% Other Records 6 21% 3 50% n/a n/a
Notes: Columns 2-5 based on returns from 30 authorities with percentages relating to the number of authorities keeping that specific record. Columns 6-7 based on returns from between 2-17 authorities with percentages based on authorities responding to that part of the question. 3.96 As the table shows, as might be expected, there was a high level of record keeping amongst authorities in relation to scheduled monuments and listed buildings with a slightly lower level in respect of conservation areas and Historic Gardens etc. Recording of unscheduled sites and Buildings at Risk was only undertaken by around two-thirds of authorities, although the latter was mainly carried out by the Scottish Civic Trust. Surprisingly, record-keeping in relation to authorities’ own historic assets appeared to be one of the weaker areas, although it was possible that these were also covered by other records such as those for listed buildings. 3.97 The ‘Other Records’ section of the table covered a wide range of topics and media. Those mentioned included the following:
• photographic databases including aerial photos; • historic land use and other maps; • historic artefacts information;
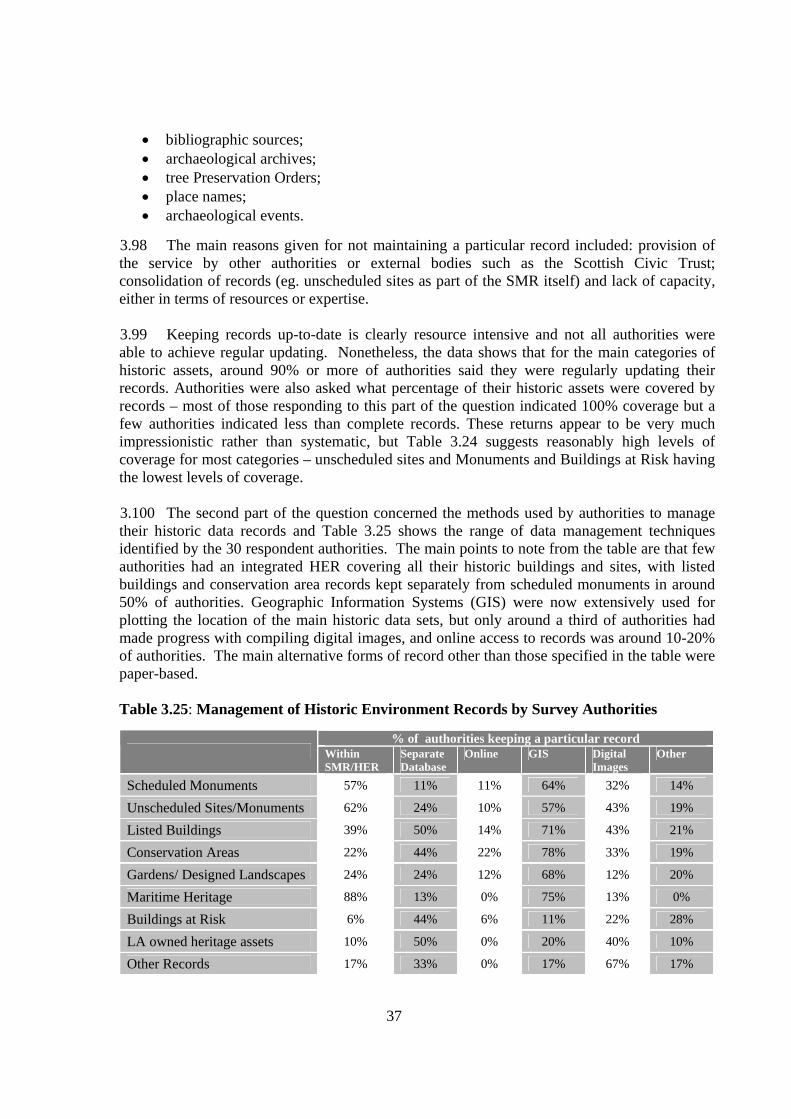
37
• bibliographic sources; • archaeological archives; • tree Preservation Orders; • place names; • archaeological events.
3.98 The main reasons given for not maintaining a particular record included: provision of the service by other authorities or external bodies such as the Scottish Civic Trust; consolidation of records (eg. unscheduled sites as part of the SMR itself) and lack of capacity, either in terms of resources or expertise. 3.99 Keeping records up-to-date is clearly resource intensive and not all authorities were able to achieve regular updating. Nonetheless, the data shows that for the main categories of historic assets, around 90% or more of authorities said they were regularly updating their records. Authorities were also asked what percentage of their historic assets were covered by records – most of those responding to this part of the question indicated 100% coverage but a few authorities indicated less than complete records. These returns appear to be very much impressionistic rather than systematic, but Table 3.24 suggests reasonably high levels of coverage for most categories – unscheduled sites and Monuments and Buildings at Risk having the lowest levels of coverage. 3.100 The second part of the question concerned the methods used by authorities to manage their historic data records and Table 3.25 shows the range of data management techniques identified by the 30 respondent authorities. The main points to note from the table are that few authorities had an integrated HER covering all their historic buildings and sites, with listed buildings and conservation area records kept separately from scheduled monuments in around 50% of authorities. Geographic Information Systems (GIS) were now extensively used for plotting the location of the main historic data sets, but only around a third of authorities had made progress with compiling digital images, and online access to records was around 10-20% of authorities. The main alternative forms of record other than those specified in the table were paper-based. Table 3.25: Management of Historic Environment Records by Survey Authorities
% of authorities keeping a particular record Within
SMR/HER Separate Database
Online GIS Digital Images
Other
Scheduled Monuments 57% 11% 11% 64% 32% 14%
Unscheduled Sites/Monuments 62% 24% 10% 57% 43% 19%
Listed Buildings 39% 50% 14% 71% 43% 21%
Conservation Areas 22% 44% 22% 78% 33% 19%
Gardens/ Designed Landscapes 24% 24% 12% 68% 12% 20%
Maritime Heritage 88% 13% 0% 75% 13% 0%
Buildings at Risk 6% 44% 6% 11% 22% 28%
LA owned heritage assets 10% 50% 0% 20% 40% 10%
Other Records 17% 33% 0% 17% 67% 17%
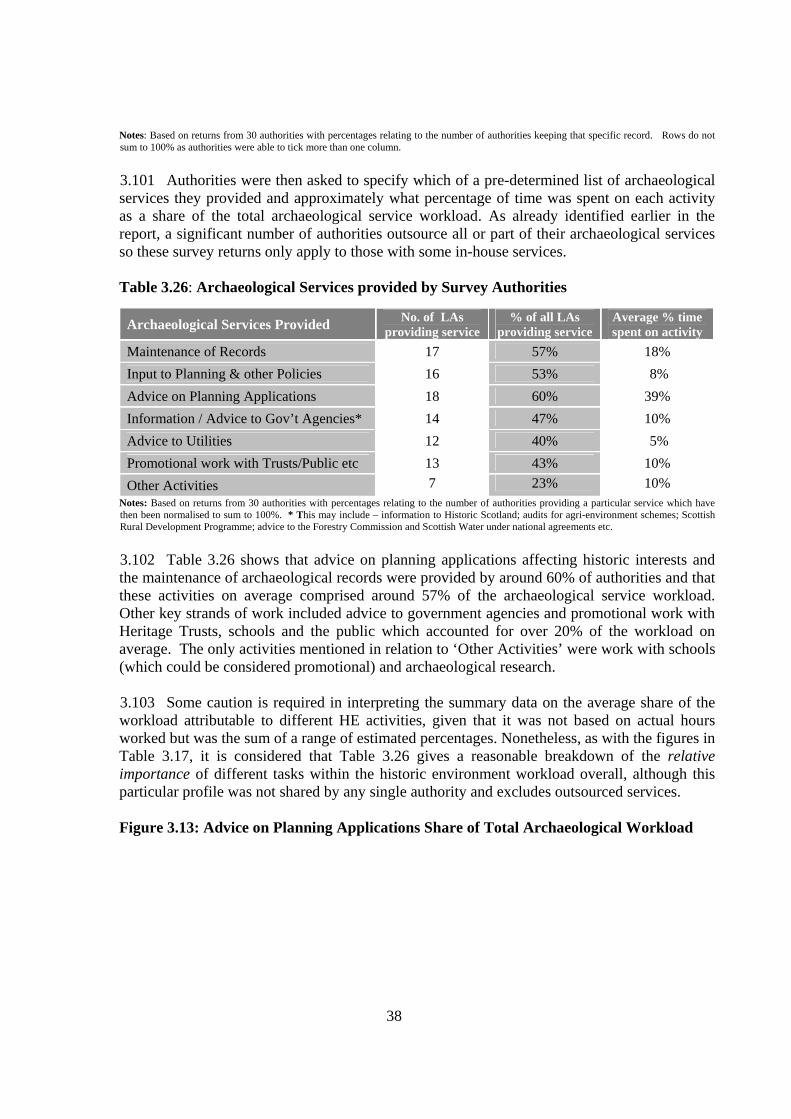
38
Notes: Based on returns from 30 authorities with percentages relating to the number of authorities keeping that specific record. Rows do not sum to 100% as authorities were able to tick more than one column.
3.101 Authorities were then asked to specify which of a pre-determined list of archaeological services they provided and approximately what percentage of time was spent on each activity as a share of the total archaeological service workload. As already identified earlier in the report, a significant number of authorities outsource all or part of their archaeological services so these survey returns only apply to those with some in-house services. Table 3.26: Archaeological Services provided by Survey Authorities
Archaeological Services Provided No. of LAs providing service
% of all LAs providing service
Average % time spent on activity
Maintenance of Records 17 57% 18% Input to Planning & other Policies 16 53% 8% Advice on Planning Applications 18 60% 39% Information / Advice to Gov’t Agencies* 14 47% 10% Advice to Utilities 12 40% 5% Promotional work with Trusts/Public etc 13 43% 10% Other Activities 7 23% 10%
Notes: Based on returns from 30 authorities with percentages relating to the number of authorities providing a particular service which have then been normalised to sum to 100%. * This may include – information to Historic Scotland; audits for agri-environment schemes; Scottish Rural Development Programme; advice to the Forestry Commission and Scottish Water under national agreements etc.
3.102 Table 3.26 shows that advice on planning applications affecting historic interests and the maintenance of archaeological records were provided by around 60% of authorities and that these activities on average comprised around 57% of the archaeological service workload. Other key strands of work included advice to government agencies and promotional work with Heritage Trusts, schools and the public which accounted for over 20% of the workload on average. The only activities mentioned in relation to ‘Other Activities’ were work with schools (which could be considered promotional) and archaeological research. 3.103 Some caution is required in interpreting the summary data on the average share of the workload attributable to different HE activities, given that it was not based on actual hours worked but was the sum of a range of estimated percentages. Nonetheless, as with the figures in Table 3.17, it is considered that Table 3.26 gives a reasonable breakdown of the relative importance of different tasks within the historic environment workload overall, although this particular profile was not shared by any single authority and excludes outsourced services. Figure 3.13: Advice on Planning Applications Share of Total Archaeological Workload
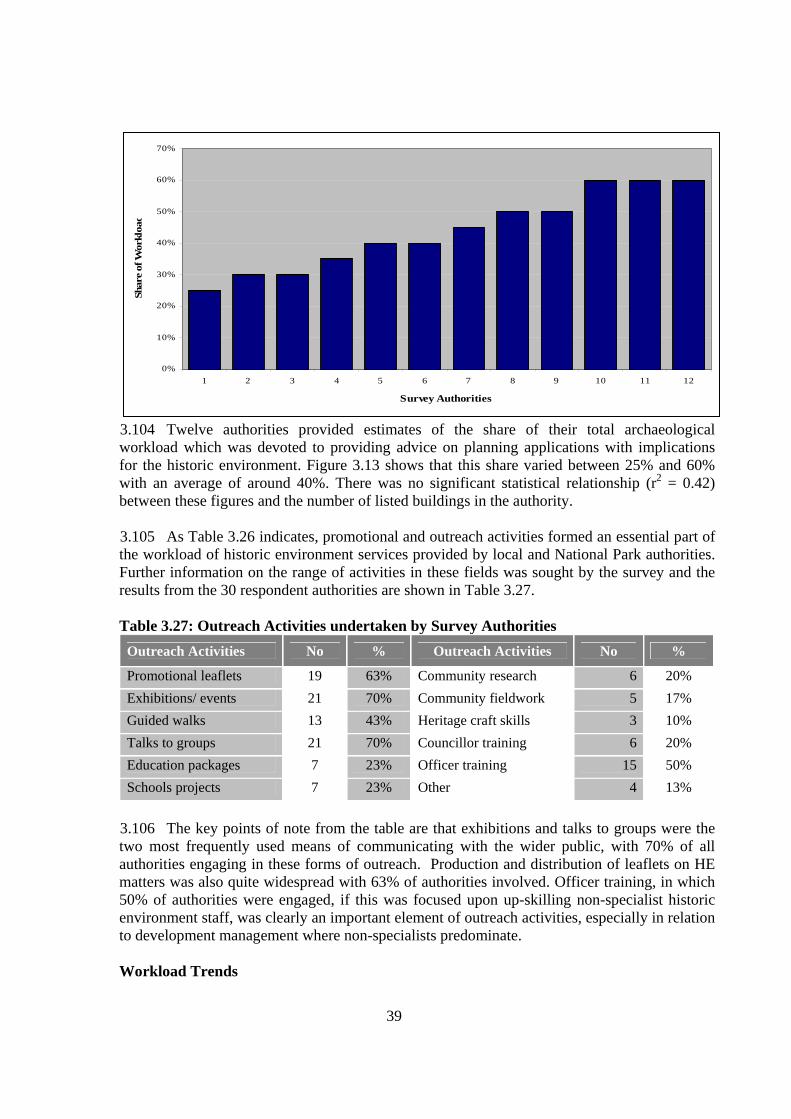
39
0%
10%
20%
30%
40%
50%
60%
70%
1 2 3 4 5 6 7 8 9 10 11 12
Survey Authorities
Shar
e of
Wor
kloa
d
3.104 Twelve authorities provided estimates of the share of their total archaeological workload which was devoted to providing advice on planning applications with implications for the historic environment. Figure 3.13 shows that this share varied between 25% and 60% with an average of around 40%. There was no significant statistical relationship (r2 = 0.42) between these figures and the number of listed buildings in the authority. 3.105 As Table 3.26 indicates, promotional and outreach activities formed an essential part of the workload of historic environment services provided by local and National Park authorities. Further information on the range of activities in these fields was sought by the survey and the results from the 30 respondent authorities are shown in Table 3.27. Table 3.27: Outreach Activities undertaken by Survey Authorities
Outreach Activities No % Outreach Activities No %
Promotional leaflets 19 63% Community research 6 20% Exhibitions/ events 21 70% Community fieldwork 5 17% Guided walks 13 43% Heritage craft skills 3 10% Talks to groups 21 70% Councillor training 6 20% Education packages 7 23% Officer training 15 50% Schools projects 7 23% Other 4 13%
3.106 The key points of note from the table are that exhibitions and talks to groups were the two most frequently used means of communicating with the wider public, with 70% of all authorities engaging in these forms of outreach. Production and distribution of leaflets on HE matters was also quite widespread with 63% of authorities involved. Officer training, in which 50% of authorities were engaged, if this was focused upon up-skilling non-specialist historic environment staff, was clearly an important element of outreach activities, especially in relation to development management where non-specialists predominate. Workload Trends
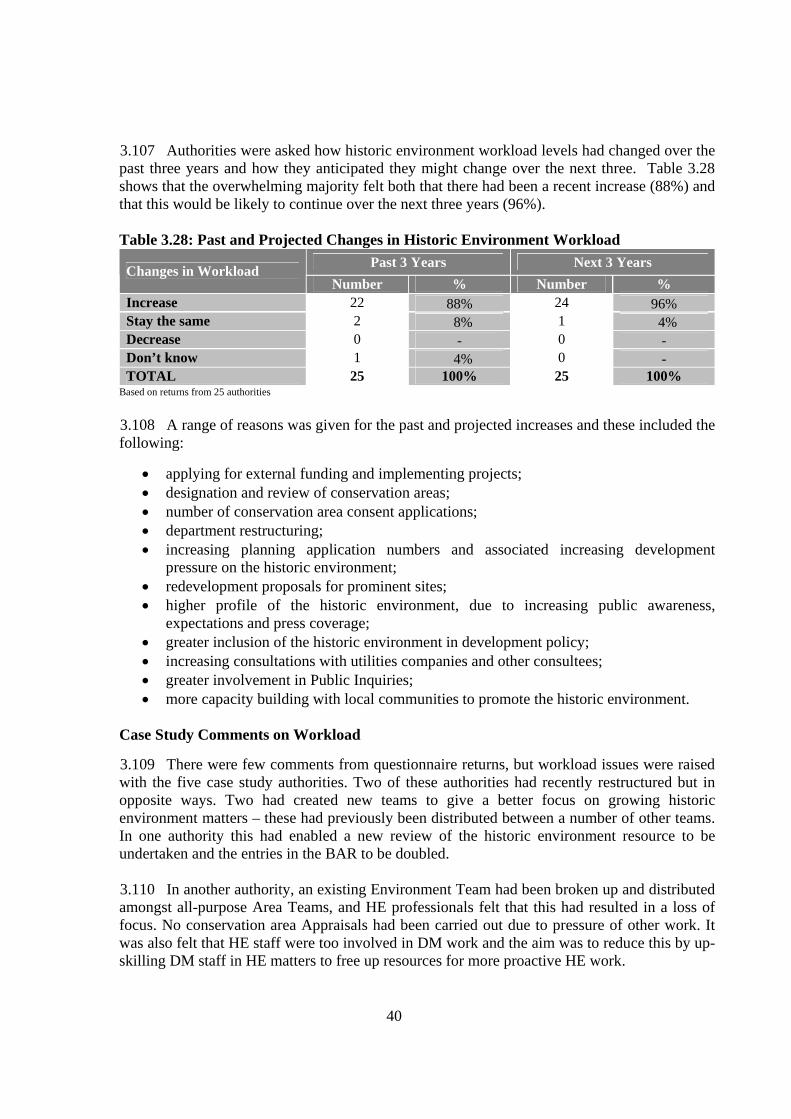
40
3.107 Authorities were asked how historic environment workload levels had changed over the past three years and how they anticipated they might change over the next three. Table 3.28 shows that the overwhelming majority felt both that there had been a recent increase (88%) and that this would be likely to continue over the next three years (96%). Table 3.28: Past and Projected Changes in Historic Environment Workload
Past 3 Years Next 3 Years Changes in Workload Number % Number %
Increase 22 88% 24 96% Stay the same 2 8% 1 4% Decrease 0 - 0 - Don’t know 1 4% 0 - TOTAL 25 100% 25 100%
Based on returns from 25 authorities 3.108 A range of reasons was given for the past and projected increases and these included the following:
• applying for external funding and implementing projects; • designation and review of conservation areas; • number of conservation area consent applications; • department restructuring; • increasing planning application numbers and associated increasing development
pressure on the historic environment; • redevelopment proposals for prominent sites; • higher profile of the historic environment, due to increasing public awareness,
expectations and press coverage; • greater inclusion of the historic environment in development policy; • increasing consultations with utilities companies and other consultees; • greater involvement in Public Inquiries; • more capacity building with local communities to promote the historic environment.
Case Study Comments on Workload 3.109 There were few comments from questionnaire returns, but workload issues were raised with the five case study authorities. Two of these authorities had recently restructured but in opposite ways. Two had created new teams to give a better focus on growing historic environment matters – these had previously been distributed between a number of other teams. In one authority this had enabled a new review of the historic environment resource to be undertaken and the entries in the BAR to be doubled. 3.110 In another authority, an existing Environment Team had been broken up and distributed amongst all-purpose Area Teams, and HE professionals felt that this had resulted in a loss of focus. No conservation area Appraisals had been carried out due to pressure of other work. It was also felt that HE staff were too involved in DM work and the aim was to reduce this by up-skilling DM staff in HE matters to free up resources for more proactive HE work.
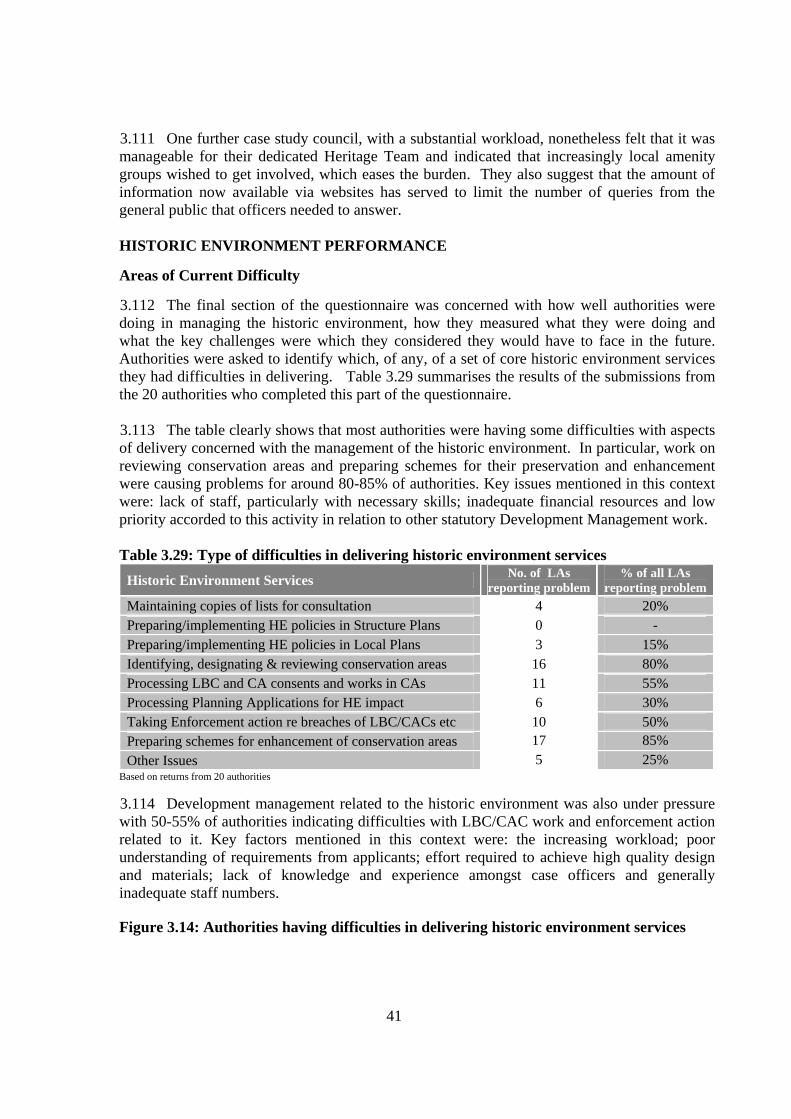
41
3.111 One further case study council, with a substantial workload, nonetheless felt that it was manageable for their dedicated Heritage Team and indicated that increasingly local amenity groups wished to get involved, which eases the burden. They also suggest that the amount of information now available via websites has served to limit the number of queries from the general public that officers needed to answer. HISTORIC ENVIRONMENT PERFORMANCE Areas of Current Difficulty 3.112 The final section of the questionnaire was concerned with how well authorities were doing in managing the historic environment, how they measured what they were doing and what the key challenges were which they considered they would have to face in the future. Authorities were asked to identify which, of any, of a set of core historic environment services they had difficulties in delivering. Table 3.29 summarises the results of the submissions from the 20 authorities who completed this part of the questionnaire. 3.113 The table clearly shows that most authorities were having some difficulties with aspects of delivery concerned with the management of the historic environment. In particular, work on reviewing conservation areas and preparing schemes for their preservation and enhancement were causing problems for around 80-85% of authorities. Key issues mentioned in this context were: lack of staff, particularly with necessary skills; inadequate financial resources and low priority accorded to this activity in relation to other statutory Development Management work. Table 3.29: Type of difficulties in delivering historic environment services
Historic Environment Services No. of LAs reporting problem
% of all LAs reporting problem
Maintaining copies of lists for consultation 4 20% Preparing/implementing HE policies in Structure Plans 0 - Preparing/implementing HE policies in Local Plans 3 15% Identifying, designating & reviewing conservation areas 16 80% Processing LBC and CA consents and works in CAs 11 55% Processing Planning Applications for HE impact 6 30% Taking Enforcement action re breaches of LBC/CACs etc 10 50% Preparing schemes for enhancement of conservation areas 17 85% Other Issues 5 25%
Based on returns from 20 authorities 3.114 Development management related to the historic environment was also under pressure with 50-55% of authorities indicating difficulties with LBC/CAC work and enforcement action related to it. Key factors mentioned in this context were: the increasing workload; poor understanding of requirements from applicants; effort required to achieve high quality design and materials; lack of knowledge and experience amongst case officers and generally inadequate staff numbers. Figure 3.14: Authorities having difficulties in delivering historic environment services
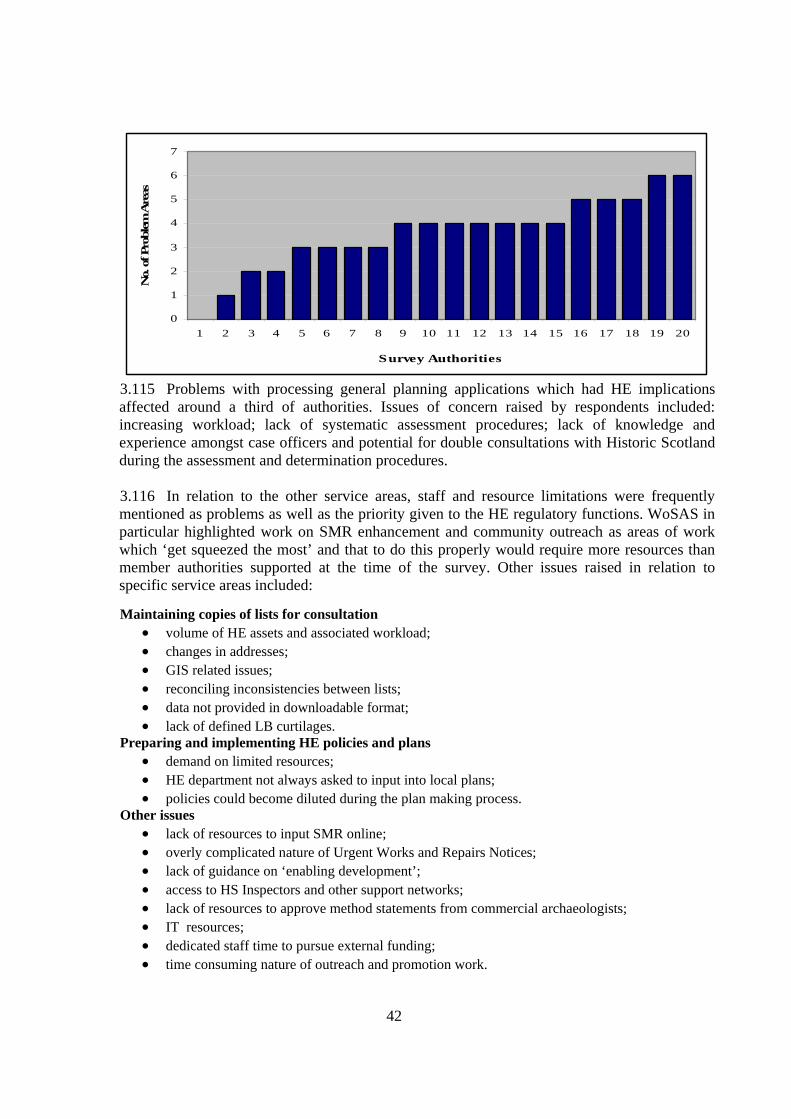
42
0
1
2
3
4
5
6
7
1 2 3 4 5 6 7 8 9 10 11 12 13 14 15 16 17 18 19 20
Survey Authorities
No.
of P
robl
em A
reas
3.115 Problems with processing general planning applications which had HE implications affected around a third of authorities. Issues of concern raised by respondents included: increasing workload; lack of systematic assessment procedures; lack of knowledge and experience amongst case officers and potential for double consultations with Historic Scotland during the assessment and determination procedures. 3.116 In relation to the other service areas, staff and resource limitations were frequently mentioned as problems as well as the priority given to the HE regulatory functions. WoSAS in particular highlighted work on SMR enhancement and community outreach as areas of work which ‘get squeezed the most’ and that to do this properly would require more resources than member authorities supported at the time of the survey. Other issues raised in relation to specific service areas included:
Maintaining copies of lists for consultation • volume of HE assets and associated workload; • changes in addresses; • GIS related issues; • reconciling inconsistencies between lists; • data not provided in downloadable format; • lack of defined LB curtilages.
Preparing and implementing HE policies and plans • demand on limited resources; • HE department not always asked to input into local plans; • policies could become diluted during the plan making process.
Other issues • lack of resources to input SMR online; • overly complicated nature of Urgent Works and Repairs Notices; • lack of guidance on ‘enabling development’; • access to HS Inspectors and other support networks; • lack of resources to approve method statements from commercial archaeologists; • IT resources; • dedicated staff time to pursue external funding; • time consuming nature of outreach and promotion work.
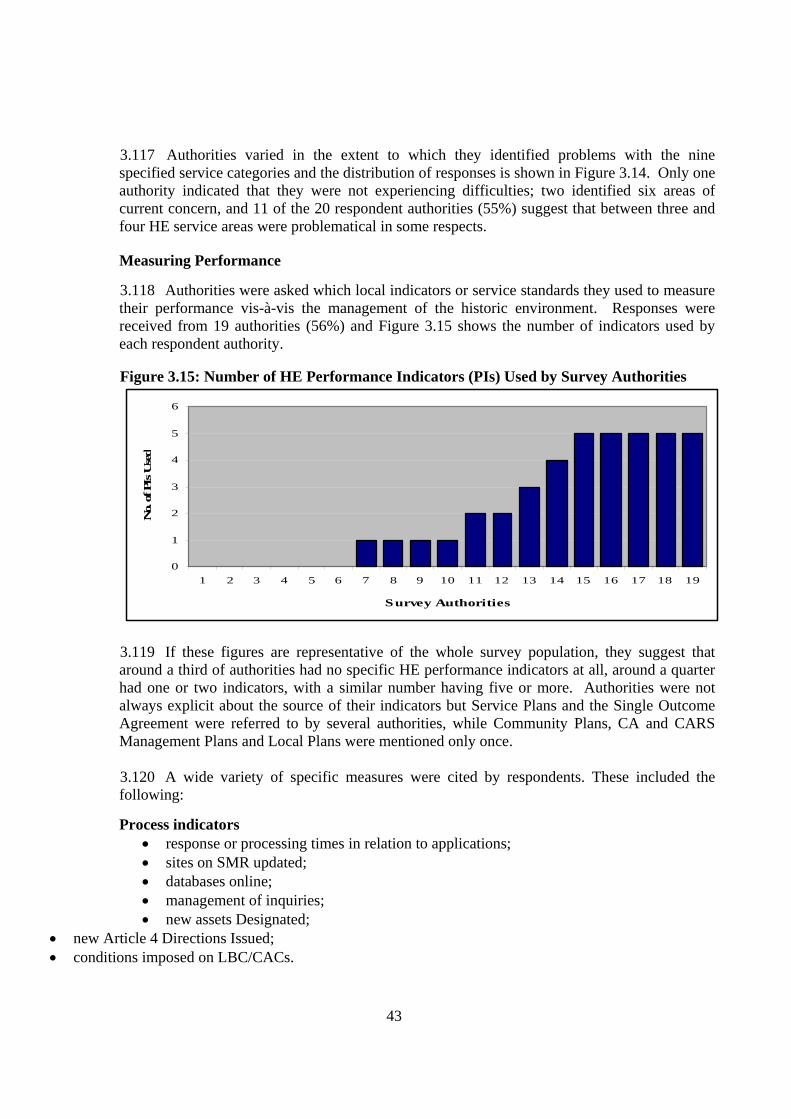
43
3.117 Authorities varied in the extent to which they identified problems with the nine specified service categories and the distribution of responses is shown in Figure 3.14. Only one authority indicated that they were not experiencing difficulties; two identified six areas of current concern, and 11 of the 20 respondent authorities (55%) suggest that between three and four HE service areas were problematical in some respects. Measuring Performance 3.118 Authorities were asked which local indicators or service standards they used to measure their performance vis-à-vis the management of the historic environment. Responses were received from 19 authorities (56%) and Figure 3.15 shows the number of indicators used by each respondent authority.
Figure 3.15: Number of HE Performance Indicators (PIs) Used by Survey Authorities
0
1
2
3
4
5
6
1 2 3 4 5 6 7 8 9 10 11 12 13 14 15 16 17 18 19
Survey Authorities
No.
of P
Is U
sed
3.119 If these figures are representative of the whole survey population, they suggest that around a third of authorities had no specific HE performance indicators at all, around a quarter had one or two indicators, with a similar number having five or more. Authorities were not always explicit about the source of their indicators but Service Plans and the Single Outcome Agreement were referred to by several authorities, while Community Plans, CA and CARS Management Plans and Local Plans were mentioned only once.
3.120 A wide variety of specific measures were cited by respondents. These included the following: Process indicators
• response or processing times in relation to applications; • sites on SMR updated; • databases online; • management of inquiries; • new assets Designated;
• new Article 4 Directions Issued; • conditions imposed on LBC/CACs.
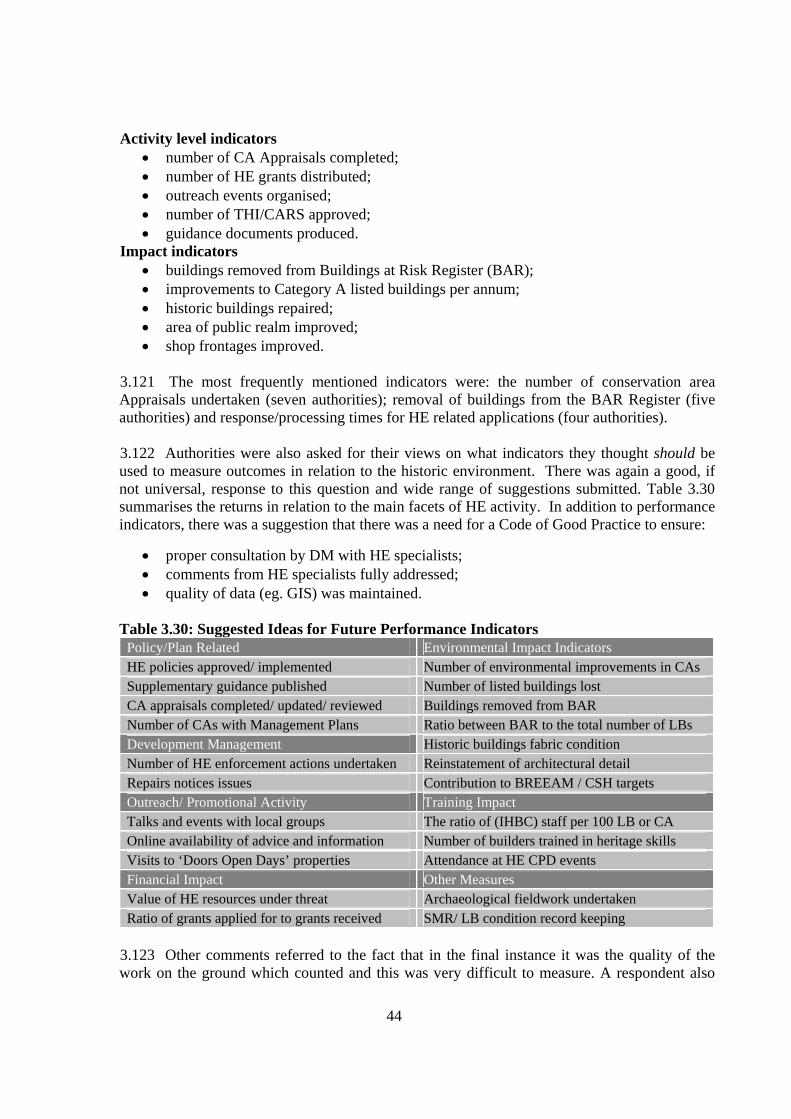
44
Activity level indicators • number of CA Appraisals completed; • number of HE grants distributed; • outreach events organised; • number of THI/CARS approved; • guidance documents produced.
Impact indicators • buildings removed from Buildings at Risk Register (BAR); • improvements to Category A listed buildings per annum; • historic buildings repaired; • area of public realm improved; • shop frontages improved.
3.121 The most frequently mentioned indicators were: the number of conservation area Appraisals undertaken (seven authorities); removal of buildings from the BAR Register (five authorities) and response/processing times for HE related applications (four authorities). 3.122 Authorities were also asked for their views on what indicators they thought should be used to measure outcomes in relation to the historic environment. There was again a good, if not universal, response to this question and wide range of suggestions submitted. Table 3.30 summarises the returns in relation to the main facets of HE activity. In addition to performance indicators, there was a suggestion that there was a need for a Code of Good Practice to ensure:
• proper consultation by DM with HE specialists; • comments from HE specialists fully addressed; • quality of data (eg. GIS) was maintained.
Table 3.30: Suggested Ideas for Future Performance Indicators
Policy/Plan Related Environmental Impact Indicators HE policies approved/ implemented Number of environmental improvements in CAs Supplementary guidance published Number of listed buildings lost CA appraisals completed/ updated/ reviewed Buildings removed from BAR Number of CAs with Management Plans Ratio between BAR to the total number of LBs Development Management Historic buildings fabric condition Number of HE enforcement actions undertaken Reinstatement of architectural detail Repairs notices issues Contribution to BREEAM / CSH targets Outreach/ Promotional Activity Training Impact Talks and events with local groups The ratio of (IHBC) staff per 100 LB or CA Online availability of advice and information Number of builders trained in heritage skills Visits to ‘Doors Open Days’ properties Attendance at HE CPD events Financial Impact Other Measures Value of HE resources under threat Archaeological fieldwork undertaken Ratio of grants applied for to grants received SMR/ LB condition record keeping
3.123 Other comments referred to the fact that in the final instance it was the quality of the work on the ground which counted and this was very difficult to measure. A respondent also
45
suggested that the level of commitment and engagement of individual officers working in HE often went well beyond that which was expected and this too was difficult to measure and often forgotten. 3.124 It was clear from the survey returns that the measurement of performance in respect of the management of the historic environment by authorities was patchy and unsystematic – some concentrated on a single indicator, others used a suite of measures, while some had none at all. As with most indicators they tended to measure what was readily measurable rather than what might be considered important in terms of real impact. Most measures were process or activity-based, although a few did focus on key outputs. The recommendations for future indicators contain some interesting suggestions and further consideration is given to this matter in Chapter 4. Case Studies 3.125 Issues related to performance formed the major part of discussions with case study authorities. Views about their own performance were mixed – some indicated real recent improvements (especially where new teams had recently been established), others just ticking over, or good in parts. All case study authorities felt that their capacity needed to be expanded (one identifying an additional requirement of around 30%) either to deal with additional pressures or deliver a better service and expected that this would require more resources – Historic Scotland and the Improvement Service were mentioned in this context. 3.126 The scope for efficiency gains in terms of quicker processing of applications was explored given that recent figures for Scotland as a whole had seen a decline over previous years. Although speed was not necessarily the key criterion, several authorities thought that turn-around times could be improved. Factors mentioned in this context included: better liaison between HE specialists and DM staff; improved applicant understanding of requirements, which would be aided by Supplementary Guidance including a validation checklist and more pre-application discussions with HE specialists. 3.127 Several authorities also indicated that it was almost impossible to determine LBCs/CACs in less than eight weeks given current procedures that allowed Historic Scotland a total of four weeks for responses to consultations. It was suggested that there was a need to ‘stop the clock’ on submission of recommendation to HS. There was also a call for HS delegation arrangements in relation to LBCs, which they had with some local authorities, to be further extended. In this context, it should be noted that HS have indicated that opportunities for authorities to issue decisions without first notifying HS would be brought forward in 2009 subject to the satisfactory completion of the pilot study in 2008-9. 3.128 In terms of achieving better quality outcomes, there were concerns about the cumulative impact of minor works in conservation areas and cumbersome Article 4 procedures to address this. Two councils thought that a statutory duty of care for the historic environment was needed and could be very important – it would concentrate minds in both the private and public sector which it was felt needed to lead by example. There was also a view from some respondents that listed building enforcement procedures would benefit from being simplified and strengthened.
46
3.129 Case study councils were also asked for their views on the unified HE consent process being mooted in England. This was generally considered worth examining, but one council indicated that the incorporation of SMC into the system would be problematical, as they would need to spend time and money training Agents, who submitted only patchy information on historic environment issues with their applications. 3.130 In relation to HE performance measurement and indicators there was general support from case study authorities for developing the approach – one suggested that they could help demonstrate workload pressures which could be useful in competing for limited resources. The Single Outcome Agreement (SOA) process was also felt to have potential to be helpful in raising the HE profile and ‘providing a hook’ on which to hang a greater emphasis on HE matters, although it was recognised that this approach was still in its infancy. There was one view that the development of Performance Indicators (PIs) should be channelled through the SOA process rather than any separate, stand-alone arrangement and that a consultative national approach should be adopted for their development. 3.131 There were a number of queries about the idea of introducing national standards for the historic environment. Interviewees sought clarification of the areas of HE activity to which national standards might apply, and there was a suggestion that they should cover both staffing/capacity (eg. 1 IHBC qualified officer per 1000 listed buildings) and service performance (eg. 10 working days for comments to DM). However, there were some concerns that if they operated like planning application target processing times they would put more pressure on the council and might divert action from more important areas of work. In particular, it was felt that they would not be particularly helpful unless they were resourced from the centre. In the absence of such support they could be used as a ‘stick with which to beat councils’. 3.132 Although not a formal case study authority, WoSAS, in its submission, indicated that it saw advantages in a national standard for archaeological services, especially since these were discretionary and covered a wide range of activities. Such a standard would indicate both to councils and to the public the kind of service they should expect to be provided. In particular, it highlighted the desirability of statutory SMR (HER) services together with an associated national standard as this would be likely to ensure that proper funding was put in place. 3.133 Case study authorities were asked what they thought of the Historic Environment-Local Management (H.E.L.M) website operated by English Heritage (EH). Around half of the officers interviewed had not heard of it. Those who had thought that the web-based support function tailored to different stakeholders in the HE management process would be very useful in Scotland. However, there were feelings that it would need to be carefully handled and developed in a collaborative way; there were also suggestions that any such initiative should be integrated with other planning advice and that there should be scope for local input. 3.134 Working relations with Historic Scotland (HS) were raised with the case study authorities and generally these were reported as being good, especially at the local area office level. Issues concerning consultation turn-around times and the possibility of extended delegation have already been noted. Guidance produced by HS was commended and there was a view that more of this would be welcome (eg. Technical Advice Notes and a Scottish equivalent of the EH publication Enabling Development). Some views were expressed about
47
the ‘listing’ process and, in particular, that a more strategic, rather than a perceived ‘ad hoc’ approach should be adopted and that this might lead to more selective decisions. One officer suggested that Historic Scotland should liaise more with Architecture and Design Scotland to create design champions and review panels. Future Challenges 3.135 Survey authorities were asked for their views on the key challenges which the management of the historic environment might pose for them in the years ahead. Given that almost all authorities considered that their workload would increase but many had doubts about whether staffing would grow commensurately, the issue of lack of/pressure on resources was the most frequently mentioned concern. There were many facets to this, including: shortages of skilled and experienced staff; recruitment difficulties in more remote areas and lack of skilled workers for repair and maintenance of historic buildings. 3.136 Finance was equally an issue, with high dependence on external funding and lack of certainty over its long-term availability a key concern, especially as budgetary cuts in LAs were anticipated. Related to this was the time-consuming nature of grant application and approval processes. Respondents felt that all of this inhibits long-term planning, the establishment of service consistency and ability to undertake proactive work. 3.137 Workload pressures were mentioned in paragraph 3.103 and many of these were cited again. In particular, fulfilling discretionary Scottish Rural Development Programme (SRDP) and Maritime heritage responsibilities; new duties arising from the recent Planning Act reforms and meeting national standards for converting GIS records from points to polygons showing the extent of assets, and MIDAS 2 compliance in respect of historic environment databases. Insufficient funding to maintain HE assets owned by Local Authorities was also highlighted. 3.138 A number of authorities also raised matters of local or national policy. Some thought that there was a poor corporate commitment to the HE in their councils with a weak understanding of its importance/ function and hence there was a failure to prioritise the historic environment amongst LA services. Others felt that Government policy guidance on HE should be strengthened and in particular there needed to be stronger listed building enforcement powers. 3.139 The challenges relating to the historic environment itself included the lack of private investment in listed buildings and the need to encourage improved maintenance amongst property owners. Securing positive uses for historic buildings and reuse of listed buildings and achieving new development compatible with listed building/conservation area materials and settings remained a constant challenge. Meeting the pace of change in historical urban environments and increasing public awareness and expectations were also cited.
Examples of Best Practice 3.140 Both the questionnaire and the case studies asked authorities for examples of what they considered to be best practice in the management of the historic environment undertaken by their service. A number of interesting projects in a variety of fields were submitted in response to this request and these have been summarised in Table 3. 31

48
Table 3.31: Examples of Best Practice in the Management of the Historic Environment Project Area Project Title Name of Authority
Archaeological Website Aberdeenshire Information Management Photographic record of shop fronts since 1937 Aberdeen City
Notes on replacement windows, railings etc Aberdeen City Range of non-statutory guidelines Edinburgh City Conservation Area maintenance guide East Ayrshire Preparation of Conservation Statements East Ayrshire
Guidance Material
Online Place-Making Guide Perth & Kinross Conservation Area Appraisals Argyll & Bute; Edinburgh Conservation Area Management Plans Edinburgh; East Ayrshire
Policy and Management
Archaeology Policy and Designations Fife Outreach Historic Glasgow Initiative Glasgow
Salvage Stores Aberdeen City; E Lothian Historic Kirkyards Aberdeenshire
Projects and Practice
Town Grant Scheme Orkney Islands HISTORIC ENVIRONMENT POLICIES Introduction 3.141 Part of the remit of the research exercise was to examine the extent to which survey authorities had historic environment policies in place and broadly what they covered. This did not form part of the questionnaire survey and had several strands which were tackled in different ways. First, a review and analysis of online Community Plans was undertaken; second, in a collaborative exercise with the Scottish Civic Trust statutory Development Plan documents were examined for their coverage of the historic environment, and finally, a sample of Single Outcome Agreement documents prepared by survey authorities was analysed in respect of their HE content. Community Plans 3.142 Community Planning involves public agencies working together with the community to plan and deliver better local services. It was given a statutory basis by the Local Government in Scotland Act 2003, which placed a duty to participate on local authorities (with the role of initiating and facilitating the process), NHS Boards, the Enterprise Networks, the Police and Fire Services and the Strathclyde Passenger Transport Authority. Community Planning Partnerships (CPPs) are encouraged to involve a wide range of other organisations in the partnership. The Act also requires CPPs to engage with the community on an ongoing basis. CPPs have been established in all 32 local authority areas, and all have prepared Community Plans, which set out the strategy for the area. 3.143 Table 3.32 summarises the results of the scrutiny of Community Plans undertaken as part of the research programme. The table shows that the historic environment did not feature strongly as a strategic issue of concern to local authorities. Only four councils (13%) mentioned it in relation to their vision for their areas; ten (31%) referred to it in relation to economic issues (primarily regeneration and tourism) and a further ten councils in relation to the physical and natural environment. Heritage or culture as an important local theme was

49
identified by only five authorities (16%). In 12 authorities (38%) there were no references to the historic environment. Table 3.32: References to the Historic Environment in Community Plans
References to the Historic Environment
Local Authority Date Overall Vision
Economic Issues
Environ-mental Issues
Cultural Issues Total
Aberdeen City Council 2001 1 0 1 1 3 Aberdeenshire Council 2006 0 0 0 0 0 Angus Council 2007 0 0 0 0 0 Argyll and Bute Council 2007 0 1 1 1 3 Clackmannanshire Council 2006 0 1 1 0 2 Dumfries & Galloway Council 2000 0 0 0 0 0 Dundee City Council 2005 0 1 0 0 1 East Ayrshire Council 2003 0 1 1 0 3 East Dunbartonshire Council 2006 0 1 0 0 2 East Lothian Council 2007 1 0 0 0 2 East Renfrewshire Council 2008 0 0 0 0 0 Edinburgh City Council 2004 0 1 0 0 1 Falkirk Council 2005 1 1 1 0 4 Fife Council 2004 0 0 0 0 0 Glasgow City Council 2005 0 0 0 0 1 Highland Council 2004 0 0 0 1 1 Inverclyde Council 2008 0 0 0 0 0 Midlothian Council 2007 0 0 0 0 0 Moray Council 2006 0 0 0 0 0 North Ayrshire Council 2006 0 0 1 0 1 North Lanarkshire Council 2004 0 0 0 0 0 Orkney Islands Council 2007 0 0 0 1 3 Perth and Kinross Council 2006 1 1 1 1 4 Renfrewshire Council 2001 0 0 0 0 2 Scottish Borders Council 2006 0 1 1 0 2 Shetland Islands Council 2007 0 0 1 0 1 South Ayrshire Council 2006 0 1 1 0 2 South Lanarkshire Council 2005 0 0 0 1 1 Stirling Council 2005 0 1 1 0 2 West Dunbartonshire Council 2007 1 0 0 0 1 West Lothian Council 2000 0 0 0 0 0 Western Isles Council 2004 0 0 0 0 0 Totals 5 11 11 6 42
3.144 The role of the historic environment in the Community Planning process was raised with case study authorities and a mixed picture emerged. In three of the five authorities HE was not an explicit priority, with people services and economic development generally higher priorities, although officers did not think that this necessarily meant that it was not viewed as important. The natural environment had a higher profile and was viewed as more directly relevant to the achievement of sustainable development objectives. There were also differing views about whether a greater involvement by Historic Scotland in Community Planning Partnerships (similar to that taken by Scottish Natural Heritage) would be helpful in raising awareness and securing more co-ordinated local action.
50
Single Outcome Agreements 3.145 In 2007 representatives of national and local government signed a Concordat, which committed both to moving towards Single Outcome Agreements for all 32 of Scotland's councils. The Concordat states that there will be a Single Outcome Agreement (SOA) for every council, based on the agreed set of national outcomes (underpinned by agreed national indicators), supported by streamlined external scrutiny and effective performance management. 3.146 The Single Outcome Agreements are a vehicle to allow individual local authorities to set out the prioritised outcomes they have each identified. These reflect local needs, circumstances and priorities, but are related to the relevant national outcomes agreed in the Concordat. The Scottish Government has developed a set of 45 ‘national indicators’ to track progress towards outcomes, which include explicit targets. . It is not intended that the SOA should list every area of activity nor that all 45 national indicators would be prioritised. Local Government has been developing a ‘menu’ of local indicators that Councils can select from to monitor progress at a local level. Councils can also use locally developed indicators alongside the indicators in the menu. 3.147 National outcome 12 encompasses the historic environment and states that, “We value and enjoy our built and natural environment and protect it and enhance it for future generations”. National indicator 34 is one of several intended to track progress towards this outcome, and while no indicator had been finalised before the first round of SOAs had been completed, it has now been agreed that the appropriate national measure is, “to reduce the % of A-listed buildings on the Buildings at Risk Register”. 3.148 A sample of half (16) of the SOAs prepared by councils were examined for their HE content. National outcome 12 covers a wide range of natural and built environment issues of which the historic environment is only one. Ten (62%) of the 16 SOAs examined explicitly referred to the historic environment in the narrative section relating to outcome 12, often indicating the number of listed buildings and conservation areas in the council area. However, three (30%) of these councils did not identify a local HE indicator. Nine (56%) of the 16 SOAs did identify local HE indicators, three (33%) of which had not highlighted the historic environment as important in their narrative section. Most only had one HE indicator but one large rural authority had three. 3.149 Historic Scotland carried out its own analysis of the first round of SOAs in relation to historic environment interests. This analysis was more extensive than that undertaken as part of this project, covering all SOAs, and also dealt with the extent to which HS was explicitly mentioned as a key LA partner. However, the conclusions were broadly the same from the two sets of analysis. Treatment of HE issues was variable, as might have been expected, with a range of different approaches being adopted. 3.150 A wide range of HE indicators was chosen by local authorities and generally measured levels of activity or throughputs. A few used the national indicator. Examples of other indicators used included the following:
51
• number of buildings under protection or receiving grant assistance; • number of interventions on Category ‘A’ listed buildings on the BAR Register; • number of organisations accessing HLF; • value of HLF awards; • participants in archaeology events; • number of buildings improved with repair grants; • number of listed buildings at risk; • THI or CARS projects completed.
A number of councils did not identify indicators as such but used general statements like, ‘protection of built heritage’ or, ‘promotion of heritage and culture of the area’. One council thought that local indicators were being developed by Historic Scotland. 3.151 The SOA process is clearly at a very early stage, but a comparison with Community Plans, suggests that the historic environment is much more prominent in the Agreement documentation. The extent to which this represents a real increase in profile will depend upon the degree to which these new policy statements are supported by commensurate resources and action. However, at a minimum, the SOA process provides a framework within which a national performance management system for the historic environment could be developed. Development Plan Policies 3.152 An examination was undertaken of all Local and National Park Authority Local Plans in order to compare their policies for the historic environment with the principles contained within the model policies set out in the draft Scottish Planning Policy 23: Planning and the Historic Environment (SPP23)10. This analysis is summarised in Table 3.33. 3.153 The analysis looked at policies in respect of four aspects of the historic environment:
• listed buildings; • conservation areas; • Archaeology; • gardens and designed landscapes.
3.154 Policies within published Local Plans were assessed in relation to the Draft SPP23 model policies. Clearly, as the specific final SPP23 policies had not been published at that stage, the analysis had to focus on the key principles of protection as set out in the relevant Acts and previous planning and other guidance. While this was inevitably a subjective exercise an attempt was made to identify (a) where authorities did not cover the policy issue at all (b) where the policy issue was covered but without detailed criteria (c) where there was full SPP23-type coverage of the policy issue. Table 3.33 sets out the results of this analysis. 3.155 Key points to emerge from the analysis were that the coverage of most elements was relatively good. The most notable omissions were criteria for the designation of conservation areas and policies to protect the setting of historic gardens and designed landscapes. Full policy
10 Draft Scottish Planning Policy 23: Planning and the Historic Environment. Scottish Government.2008

52
wording was highest for the demolition of listed buildings but elsewhere varied between 3% and 50%. Table 3.33: Assessment of Development Plan Policies for the Historic Environment Model Policy No Policy Basic Policy Full Policy Listed Buildings No. % No. % No. % preservation of key features of listed buildings (+ criteria) 1 3% 21 62% 12 35%
preservation of the setting of listed buildings (+ criteria) 2 6% 21 62% 11 32%
criteria to be met before demolition of a listed building 4? 12% 9 26% 21 62%
Conservation Areas No. % No. % No. % criteria for and or approach to designation 23 68% 10 29% 1 3%
criteria for development within a Conservation Area 1 3% 21 62% 12 35%
criteria for demolition within a Conservation Area 8 24% 21 62% 5 14%
Archaeology No. % No. % No. % preservation of scheduled monuments & other nationally important resources 1 3% 26 76% 7 21%
need to assess other significant resources 1 3% 26 76% 7 21%
developers to report and permit excavation 3 9% 15 44% 16 47%
Gardens/Landscapes No. % No. % No. % protection of historic gardens and designed landscapes 0 - 17 50% 17 50%
protection of setting of historic gardens & designed landscapes 16 47% 13 39% 5 14%
3.156 However, a well-worded policy is no guarantee that it will be effectively implemented and conversely, it is possible that authorities with less than ideal policies are, nonetheless effective in safeguarding their historic assets. We were not able to pursue this matter very much further as policy effectiveness is rarely systematically monitored at the local level due to lack of resources.

53
CHAPTER 4: CONCLUSIONS
INTRODUCTION 4.1 This report, which sets out baseline data on the management of the historic environment, is based on a number of strands of work. The main element draws on an intensive survey of all 34 Local and National Park Authorities in Scotland which obtained information on staffing; financial resources; workload and performance. This was supplemented by in-depth Case Studies of five councils and desk-based research covering Community and Development Plan policies in the survey authorities as well as a literature review of relevant studies from throughout the UK. The conclusions set out here draw on all of these sources. 4.2 The research brief indicated that the study should seek to address the following five issues:
• the operating context for local authorities in relation to the protection and management of the historic environment;
• the need for local authority historic environment services; • the current inputs and outcomes in terms of local authority policies, staffing and resources for the
historic environment; • the effectiveness of local authorities in providing historic environment services; • the implications of these results for the ongoing and future management of the historic
environment in Scotland. 4.3 These issues are considered in the rest of this chapter. In addition, given that a key purpose of the research was to establish baseline data, the implication was that this would be tracked on a regular basis. Consequently, the issue of how to keep this up-to-date is also relevant and it has been considered important therefore to draw lessons from the survey exercise. THE QUESTIONNAIRE SURVEY METHODOLOGY 4.4 A considerable amount of time and effort was spent in developing and refining the questionnaire, including extensive consultations and a pilot exercise. This resulted in the omission of a number of questions in order to shorten the survey form and some restructuring to make completion easier, and in these respects it was much less formidable than the equivalent Oxford Brookes form in England. Nonetheless, it remained quite a substantial document and the feedback from respondents was that it was not straightforward to complete and required considerable research to obtain relevant figures, which in only a few authorities were held as a matter of routine. This clearly affected the response rates and required more extensive follow-up than had been expected. 4.5 Much useful information was obtained from the survey but it would have been more satisfactory if response levels to some questions had been higher. While it was understandable that in trying to establish benchmark information there would be a desire to be comprehensive, the conclusion from this exercise is that too much information was requested at one time. The lesson for the future, if this exercise is to be repeated, is that a much shorter, more focused

54
questionnaire (perhaps dealing with different topics on a rolling basis) would provide a better model for data collection. 4.6 Another aspect of the survey methodology was the attempt to target a key contact in all the services relevant to the management of the historic environment in each authority from information supplied by Chief Executives, rather than getting each council to co-ordinate its own response (which it was assumed would be a recipe for delay and confusion). While multi-service lists of contacts were obtained, after some prompting by the survey team, from Chief Executives; actual responses were largely received from Planning Service representatives. 4.7 It was clear from the survey that future attempts to collect information on the operation of HE within local authorities should focus on ‘core’ HE staff because in general ‘non-core’ HE services showed no interest in completing the questionnaire. Furthermore, the potential for there to be multiple respondents within an authority led in some instances to confusion at to who was actually responsible for the survey return. Consequently, a key conclusion is that if regular data collection from local government was to be required, Historic Scotland should build up and maintain a single key HE contact in each authority (probably in Planning) and under the aegis of the Local Authority Historic Environment Forum . 4.8 It is considered that a rolling programme of focused data collection in each of the key areas of management interest - (a) staffing (b) finance (c) workload and (d) performance, rather than periodic comprehensive surveys would be the best way to proceed. The survey revealed that a wide variety of measures which were attempting to track the management of the historic environment were in use across local authorities at the time of the survey. There would be some merit, in terms of the Audit process, in agreeing a ‘core’ set of indicators and potential measures are shown in the Table below. Table 4.1: Suggested Future Audit Indicators
TOPIC AREA SUGGESTED INDICATOR Staffing (S1) Number dealing with HE as their main responsibility (S2) Number of those above with a specialist HE qualification Finance (F1) HE grants awarded by the LA - number and value (F2) HE grants received by the LA – number and value Workload (W1) Number of applications determined for (a) LBC (b) CAC and (c)
affecting scheduled monuments (more problematical) (W2) Number of individual HE records updated per year (W3) Number of CAAs (a) adopted (b) started (W4) Number of events held (talks, exhibitions etc etc.) Performance (P1) Number of listed buildings improved/repaired (P2) Number of buildings removed from the BAR register (P3) Number of interventions (refusals, amendments, enforcement) to
prevent inappropriate development
55
OPERATING CONTEXT
Heritage Assets 4.9 The survey authorities varied considerably in terms of their population size, land area and distribution of heritage assets. As indicated earlier in this report, much of this information has now been made available in the SHEA Report and we did not duplicate that work as part of this exercise. Although the Oxford Brookes survey did cover assets, their omission proved to be a sound decision, and while it will be important to keep national records of local assets up-to-date, the evidence from this exercise is that it would best achieved if undertaken separately from any questionnaire survey, possibly as some form of periodic return. 4.10 Although we did not attempt to collect new primary data on assets, we did use available published information to develop two, relatively crude, statistics which compared the number of heritage assets with population size and land area. Figures 3.1 and 3.2 show how the survey authorities varied on these measures. The order of difference between both ends of the spectrum varied between 1:48 for population and between 1:270 for land area. 4.11 These were substantial differences, which clearly had some implications in relation to the capacity of different sizes of authority to manage the historic environment and the levels of activity related to it. However, the relationship is not a straightforward one and no particular groupings of authorities according to population size or density (urbanity/rurality) were able to be detected in relation to these measures. 4.12 The ability to compare some composite measure of local heritage resources (which might operate as a proxy measure for ‘need’) with staffing levels; financial provision; workload levels and performance, could be useful in the development of national standards and/or performance indicators. However, this would require further more intensive work than was possible in the course of this research project. Organisation and Structures 4.13 For the purposes of this research historic environment services were divided into five main groups:
• protection and conservation of historic buildings; • archaeological Services; • conservation and maintenance of historic parks, open spaces, properties and other
structures; • promotion and interpretation of the historic environment; • management, administrative and technical support.
4.14 The survey revealed, as expected, that no local authority in Scotland located all of these activities within a single department and historic environment responsibilities were usually distributed across a number of services and in some instances contracted out to external providers. In National Park Authorities the management arrangements were much simpler. The principal council department with responsibilities for the historic environment was the Planning Service, which in a third of authorities also included archaeology. Twenty-two (65%) of the
56
survey authorities outsourced their archaeological service and only two authorities with their own service located this outwith the Planning Service. 4.15 Consequently, the overall picture was one of fragmentation of responsibilities, albeit in most authorities a significant ‘core’ of activities was located in the Planning Service. On the basis of evidence from case study authorities few councils, if any, had a cross-authority working group co-ordinating historic environment matters and usually the most senior HE professional was identified as a contact point on corporate HE issues. Generally, the evidence pointed to a mix of good working relations between HE specialists and colleagues in other services (usually on regeneration matters) and others, which were poorer, where a ‘silo mentality’ still existed. The majority view appeared to be that there remained considerable room for improvement in cross-service working on historic environment matters. 4.16 The highest position occupied by an HE professional was that of Team or Unit Leader, which is a fourth tier post, and this level obtained in only a handful of authorities. Elsewhere, Team Leaders had a range of other non-HE responsibilities. There was evidence from case study authorities (which tended to represent the upper end of the HE resource spectrum) that recent restructuring had created new more focused HE teams, but this did not appear to be the majority experience, with teams being broken up in some authorities. 4.17 The historic environment had to compete with a wide range of other services and was seen as not generally high in terms of local political priorities at the time of the survey. Often it had been seen as a problem, ‘getting in the way of desirable development’ rather than as an asset. Some case study officers saw signs that HE issues were rising up the political agenda and were seen as a way of promoting regeneration and tourism or as an integral part of council’s approach to sustainable development, all of which had a higher political salience. Consequently, there were clearly opportunities for HE activities to be harnessed to wider local, distinctive, place-making objectives in order to secure greater policy and resource priority and further guidance could be given to authorities on how to better co-ordinate cross-service activities in relation to the management of the historic environment, including examples of best practice. Historic Environment Activities 4.18 Survey authorities were asked which of ten historic environment activities they undertook and what share of their workload these occupied. The results are set out in Table 3.17. There was considerable variability across Scotland both in the activities undertaken and their share of the overall HE workload, although it is necessary to recognise some caveats about the comprehensiveness of the data. 4.19 The provision of historic buildings advice was the main activity of HE professionals in survey authorities; however, 30% of authorities said it was provided for them by the private sector. Nearly two-thirds of authorities obtained archaeological advice from external providers – 32% of these from other local authorities; 53% from Heritage Trusts or the West of Scotland Archaeology Service and the remaining 15% from the private sector. A significant proportion of archaeological fieldwork was also provided externally. There was, consequently, a mixed market of service provision in the HE sector.
57
4.20 The conclusion from the survey is that all authorities were involved in the provision of all the main HE services, some or all of which they provided themselves or, alternatively procured from external bodies. The survey did not reveal that key areas of HE activity were simply not taking place, but the extent and quality of provision were more important matters which are addressed later. There were no time series data available to analyse how these patterns of provision have changed, and what the implications of any changes might be, but this survey provides the basis for monitoring this in the future. Key Issues and Challenges 4.21 Much of this is covered in more detail in the succeeding paragraphs but in summary the issue of pressure on or lack of resources was the most frequently mentioned concern. There were many facets to this, including shortages of skilled and experienced HE staff and recruitment difficulties, especially in more remote areas. 4.22 Finance was equally an issue for authorities, with high dependence on external funding both for temporary staff and projects and lack of certainty over its long-term availability causing concern, while cuts in Local Authority budgets were also anticipated. Related to this, was the time-consuming nature of grant application and approval processes. All of this was felt to inhibit long-term planning, the establishment of service consistency and ability to undertake proactive HE work. 4.23 Workload pressures included the continuing high baseload of Development Management activity and additional, albeit discretionary, responsibilities in relation to the Scottish Rural Development Programme (SRDP) and maritime heritage, as well as new duties arising from the recent Planning Act reforms. Many authorities had problems in undertaking proactive work on conservation areas and on enforcement, while there were reports of work on SMRs and outreach activities being squeezed by the need to focus on more pressing statutory requirements. 4.24 A number of authorities also raised matters of local or national policy. As mentioned above, some thought that there was a poor corporate commitment to the HE in their councils with a weak understanding of its importance/function and hence a failure to prioritise the historic environment amongst LA services. Others felt that Government policy guidance on HE should be strengthened (for example: more Technical Advice Notes and a Scottish equivalent of the EH publication Enabling Development) and in particular there needed to be stronger listed building enforcement powers. 4.25 The challenges relating to the historic building fabric itself included the lack of private investment in listed buildings and need to encourage improved maintenance amongst property owners. This was proving more difficult as councils closed their own grant schemes as a result of expenditure restrictions. Securing positive uses for historic buildings and reuse of listed buildings and achieving new development compatible with listed building/conservation area materials and settings was also reported as a constant challenge. Meeting the pace of change in historical urban environments and increasing public awareness and expectations were also cited as current pressures.
58
INPUTS AND OUTCOMES
Historic Environment Policies 4.26 The assessment of HE policies was undertaken separately from the questionnaire survey and was based solely on published plans which were available online. The analysis focused exclusively on Community Plans, Local Single Outcome Agreements and Local Development Plans. 4.27 The historic environment did not feature strongly as a strategic issue of concern to local authorities in their published Community Plans. Only four councils (13%) mentioned it in relation to their vision for their areas and in 12 authorities (38%) there were no references to the historic environment at all. There were also mixed views about whether a greater involvement by Historic Scotland in Community Planning Partnerships (similar to that taken by Scottish Natural Heritage) would be helpful in raising awareness and securing more co-ordinated local action. 4.28 The Single Outcome Agreement arose out of the Concordat between the Scottish Government and COSLA and sets out local authorities’ priorities within the national performance framework. Ten (62%) of the 16 SOAs examined explicitly referred to the historic environment in the narrative section relating to national outcome 12, which concerns the built and natural environment. Only 9 (56%) of the 16 SOAs identified local HE indicators, but these covered a wide range of issues and generally measured levels of activity or throughputs. Nonetheless, while the SOA process is clearly at a very early stage, a comparison with Community Plans, suggests that the historic environment is much more prominent in the Agreement documentation. 4.29 Development Plan policies for the historic environment have been well developed over many years. All 34 authorities have Structure and Local Plan policies in place covering :
• listed buildings; • conservation areas; • archaeology; • gardens and designed landscapes.
However, our analysis shows that when these policies were assessed for their fit with the Draft SPP23 model policies, a variable picture emerged. Having said that, a well-worded policy is no guarantee that it will be effectively implemented and policy effectiveness is rarely monitored at the local level due to lack of resources. However, this would be required for new Local Development Plans under Section 16(8)(b) of the Planning etc Scotland Act 2006. 4.30 In conclusion, in terms of Community Planning across Scotland the historic environment barely features. This situation has improved somewhat in the new Single Outcome Agreements which explicitly refer to the historic environment, but action on meaningful performance indicators was weak. Nonetheless, the SOA process might provide a potential framework within which a national performance management system for the historic environment could be developed over time.
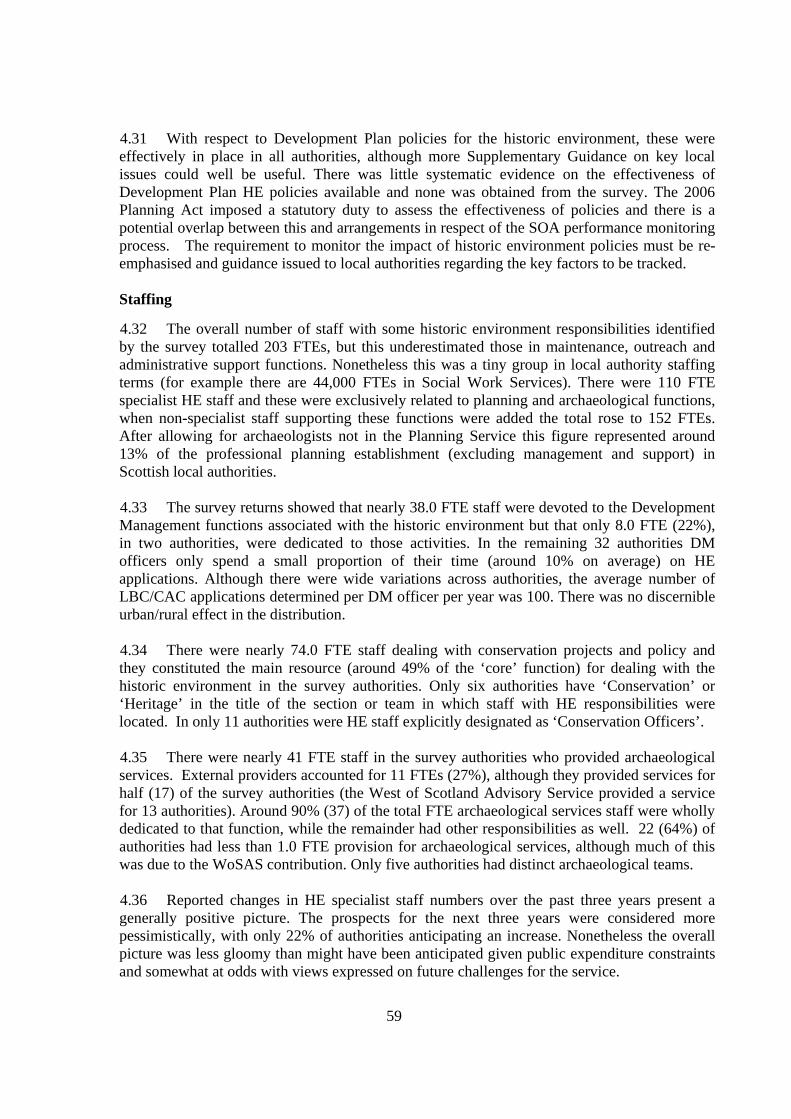
59
4.31 With respect to Development Plan policies for the historic environment, these were effectively in place in all authorities, although more Supplementary Guidance on key local issues could well be useful. There was little systematic evidence on the effectiveness of Development Plan HE policies available and none was obtained from the survey. The 2006 Planning Act imposed a statutory duty to assess the effectiveness of policies and there is a potential overlap between this and arrangements in respect of the SOA performance monitoring process. The requirement to monitor the impact of historic environment policies must be re-emphasised and guidance issued to local authorities regarding the key factors to be tracked. Staffing 4.32 The overall number of staff with some historic environment responsibilities identified by the survey totalled 203 FTEs, but this underestimated those in maintenance, outreach and administrative support functions. Nonetheless this was a tiny group in local authority staffing terms (for example there are 44,000 FTEs in Social Work Services). There were 110 FTE specialist HE staff and these were exclusively related to planning and archaeological functions, when non-specialist staff supporting these functions were added the total rose to 152 FTEs. After allowing for archaeologists not in the Planning Service this figure represented around 13% of the professional planning establishment (excluding management and support) in Scottish local authorities. 4.33 The survey returns showed that nearly 38.0 FTE staff were devoted to the Development Management functions associated with the historic environment but that only 8.0 FTE (22%), in two authorities, were dedicated to those activities. In the remaining 32 authorities DM officers only spend a small proportion of their time (around 10% on average) on HE applications. Although there were wide variations across authorities, the average number of LBC/CAC applications determined per DM officer per year was 100. There was no discernible urban/rural effect in the distribution. 4.34 There were nearly 74.0 FTE staff dealing with conservation projects and policy and they constituted the main resource (around 49% of the ‘core’ function) for dealing with the historic environment in the survey authorities. Only six authorities have ‘Conservation’ or ‘Heritage’ in the title of the section or team in which staff with HE responsibilities were located. In only 11 authorities were HE staff explicitly designated as ‘Conservation Officers’. 4.35 There were nearly 41 FTE staff in the survey authorities who provided archaeological services. External providers accounted for 11 FTEs (27%), although they provided services for half (17) of the survey authorities (the West of Scotland Advisory Service provided a service for 13 authorities). Around 90% (37) of the total FTE archaeological services staff were wholly dedicated to that function, while the remainder had other responsibilities as well. 22 (64%) of authorities had less than 1.0 FTE provision for archaeological services, although much of this was due to the WoSAS contribution. Only five authorities had distinct archaeological teams. 4.36 Reported changes in HE specialist staff numbers over the past three years present a generally positive picture. The prospects for the next three years were considered more pessimistically, with only 22% of authorities anticipating an increase. Nonetheless the overall picture was less gloomy than might have been anticipated given public expenditure constraints and somewhat at odds with views expressed on future challenges for the service.
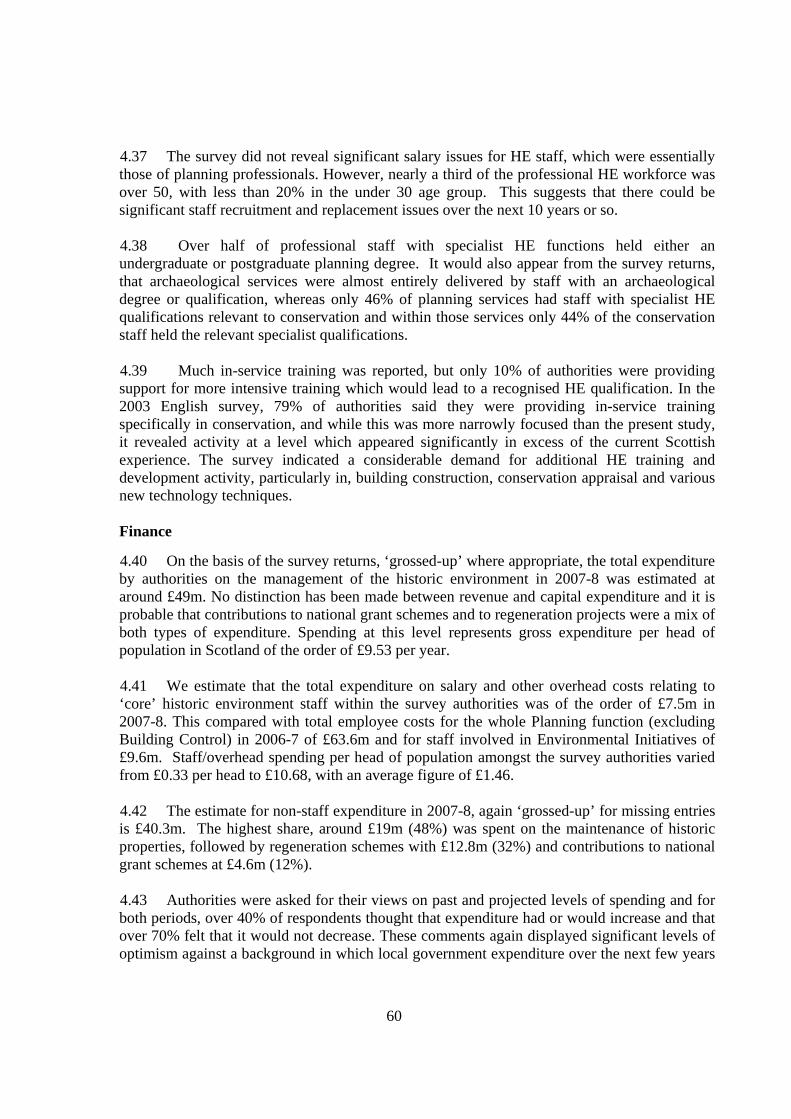
60
4.37 The survey did not reveal significant salary issues for HE staff, which were essentially those of planning professionals. However, nearly a third of the professional HE workforce was over 50, with less than 20% in the under 30 age group. This suggests that there could be significant staff recruitment and replacement issues over the next 10 years or so. 4.38 Over half of professional staff with specialist HE functions held either an undergraduate or postgraduate planning degree. It would also appear from the survey returns, that archaeological services were almost entirely delivered by staff with an archaeological degree or qualification, whereas only 46% of planning services had staff with specialist HE qualifications relevant to conservation and within those services only 44% of the conservation staff held the relevant specialist qualifications. 4.39 Much in-service training was reported, but only 10% of authorities were providing support for more intensive training which would lead to a recognised HE qualification. In the 2003 English survey, 79% of authorities said they were providing in-service training specifically in conservation, and while this was more narrowly focused than the present study, it revealed activity at a level which appeared significantly in excess of the current Scottish experience. The survey indicated a considerable demand for additional HE training and development activity, particularly in, building construction, conservation appraisal and various new technology techniques. Finance 4.40 On the basis of the survey returns, ‘grossed-up’ where appropriate, the total expenditure by authorities on the management of the historic environment in 2007-8 was estimated at around £49m. No distinction has been made between revenue and capital expenditure and it is probable that contributions to national grant schemes and to regeneration projects were a mix of both types of expenditure. Spending at this level represents gross expenditure per head of population in Scotland of the order of £9.53 per year.
4.41 We estimate that the total expenditure on salary and other overhead costs relating to ‘core’ historic environment staff within the survey authorities was of the order of £7.5m in 2007-8. This compared with total employee costs for the whole Planning function (excluding Building Control) in 2006-7 of £63.6m and for staff involved in Environmental Initiatives of £9.6m. Staff/overhead spending per head of population amongst the survey authorities varied from £0.33 per head to £10.68, with an average figure of £1.46. 4.42 The estimate for non-staff expenditure in 2007-8, again ‘grossed-up’ for missing entries is £40.3m. The highest share, around £19m (48%) was spent on the maintenance of historic properties, followed by regeneration schemes with £12.8m (32%) and contributions to national grant schemes at £4.6m (12%). 4.43 Authorities were asked for their views on past and projected levels of spending and for both periods, over 40% of respondents thought that expenditure had or would increase and that over 70% felt that it would not decrease. These comments again displayed significant levels of optimism against a background in which local government expenditure over the next few years
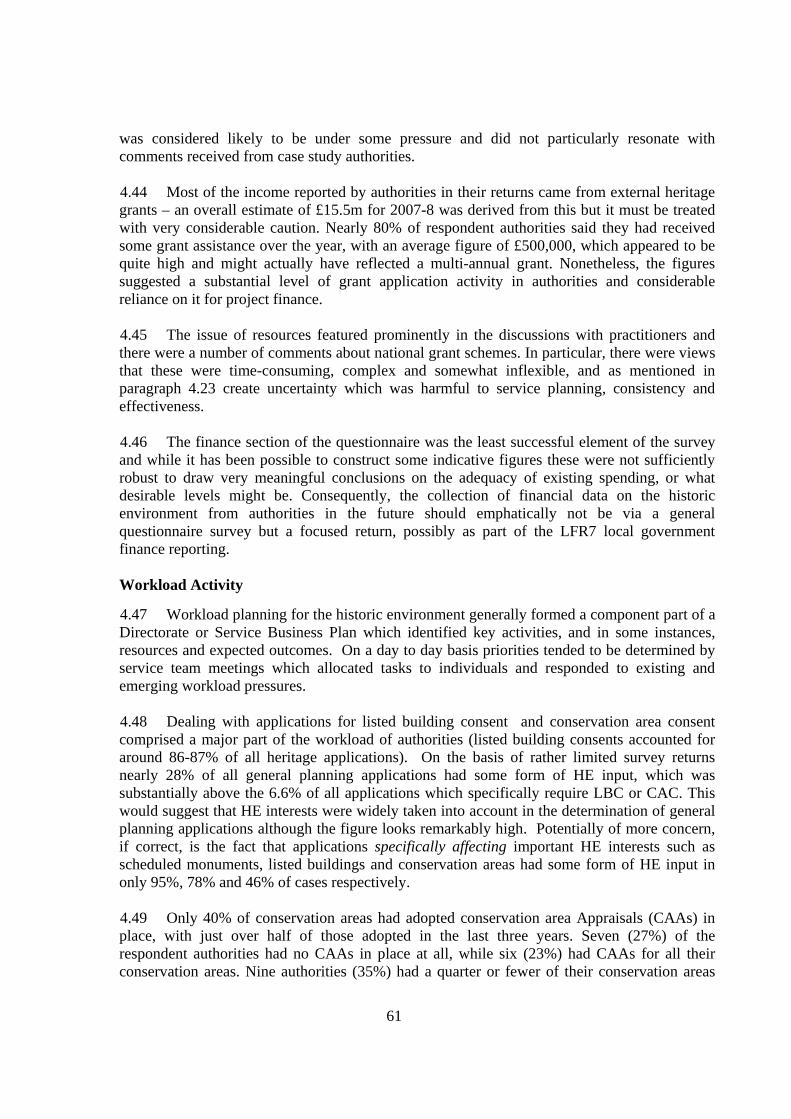
61
was considered likely to be under some pressure and did not particularly resonate with comments received from case study authorities. 4.44 Most of the income reported by authorities in their returns came from external heritage grants – an overall estimate of £15.5m for 2007-8 was derived from this but it must be treated with very considerable caution. Nearly 80% of respondent authorities said they had received some grant assistance over the year, with an average figure of £500,000, which appeared to be quite high and might actually have reflected a multi-annual grant. Nonetheless, the figures suggested a substantial level of grant application activity in authorities and considerable reliance on it for project finance. 4.45 The issue of resources featured prominently in the discussions with practitioners and there were a number of comments about national grant schemes. In particular, there were views that these were time-consuming, complex and somewhat inflexible, and as mentioned in paragraph 4.23 create uncertainty which was harmful to service planning, consistency and effectiveness. 4.46 The finance section of the questionnaire was the least successful element of the survey and while it has been possible to construct some indicative figures these were not sufficiently robust to draw very meaningful conclusions on the adequacy of existing spending, or what desirable levels might be. Consequently, the collection of financial data on the historic environment from authorities in the future should emphatically not be via a general questionnaire survey but a focused return, possibly as part of the LFR7 local government finance reporting. Workload Activity 4.47 Workload planning for the historic environment generally formed a component part of a Directorate or Service Business Plan which identified key activities, and in some instances, resources and expected outcomes. On a day to day basis priorities tended to be determined by service team meetings which allocated tasks to individuals and responded to existing and emerging workload pressures. 4.48 Dealing with applications for listed building consent and conservation area consent comprised a major part of the workload of authorities (listed building consents accounted for around 86-87% of all heritage applications). On the basis of rather limited survey returns nearly 28% of all general planning applications had some form of HE input, which was substantially above the 6.6% of all applications which specifically require LBC or CAC. This would suggest that HE interests were widely taken into account in the determination of general planning applications although the figure looks remarkably high. Potentially of more concern, if correct, is the fact that applications specifically affecting important HE interests such as scheduled monuments, listed buildings and conservation areas had some form of HE input in only 95%, 78% and 46% of cases respectively. 4.49 Only 40% of conservation areas had adopted conservation area Appraisals (CAAs) in place, with just over half of those adopted in the last three years. Seven (27%) of the respondent authorities had no CAAs in place at all, while six (23%) had CAAs for all their conservation areas. Nine authorities (35%) had a quarter or fewer of their conservation areas
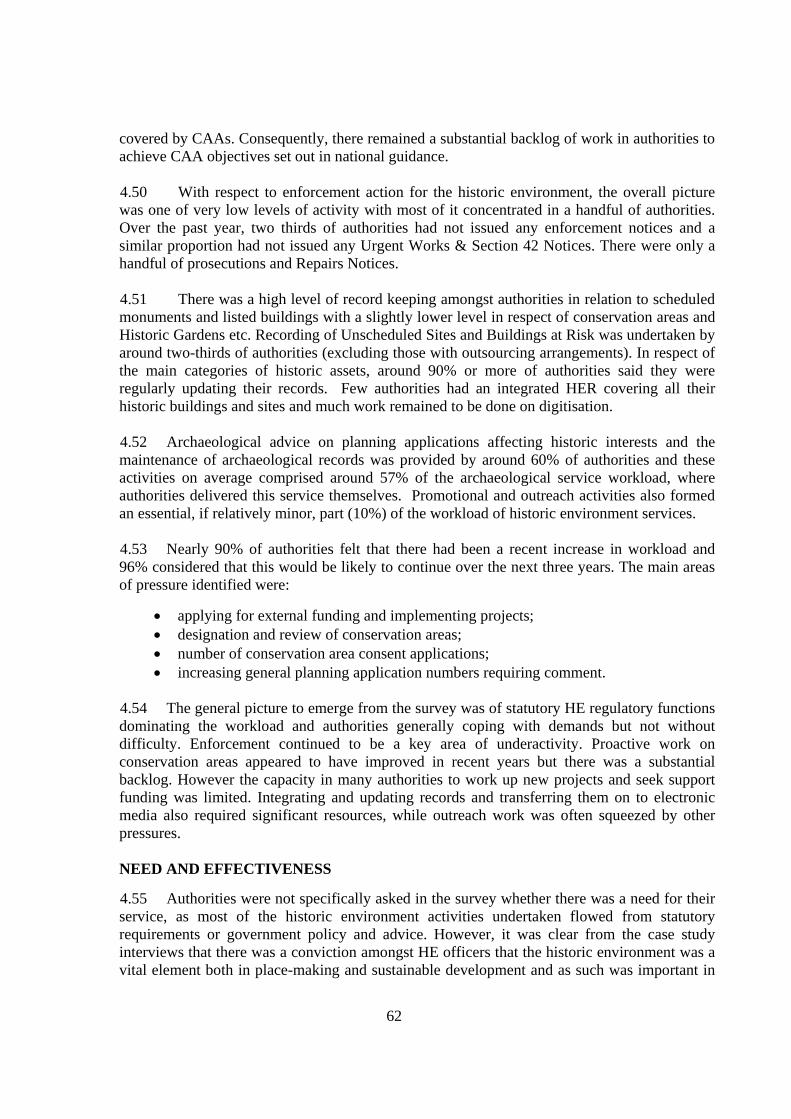
62
covered by CAAs. Consequently, there remained a substantial backlog of work in authorities to achieve CAA objectives set out in national guidance. 4.50 With respect to enforcement action for the historic environment, the overall picture was one of very low levels of activity with most of it concentrated in a handful of authorities. Over the past year, two thirds of authorities had not issued any enforcement notices and a similar proportion had not issued any Urgent Works & Section 42 Notices. There were only a handful of prosecutions and Repairs Notices. 4.51 There was a high level of record keeping amongst authorities in relation to scheduled monuments and listed buildings with a slightly lower level in respect of conservation areas and Historic Gardens etc. Recording of Unscheduled Sites and Buildings at Risk was undertaken by around two-thirds of authorities (excluding those with outsourcing arrangements). In respect of the main categories of historic assets, around 90% or more of authorities said they were regularly updating their records. Few authorities had an integrated HER covering all their historic buildings and sites and much work remained to be done on digitisation. 4.52 Archaeological advice on planning applications affecting historic interests and the maintenance of archaeological records was provided by around 60% of authorities and these activities on average comprised around 57% of the archaeological service workload, where authorities delivered this service themselves. Promotional and outreach activities also formed an essential, if relatively minor, part (10%) of the workload of historic environment services. 4.53 Nearly 90% of authorities felt that there had been a recent increase in workload and 96% considered that this would be likely to continue over the next three years. The main areas of pressure identified were:
• applying for external funding and implementing projects; • designation and review of conservation areas; • number of conservation area consent applications; • increasing general planning application numbers requiring comment.
4.54 The general picture to emerge from the survey was of statutory HE regulatory functions dominating the workload and authorities generally coping with demands but not without difficulty. Enforcement continued to be a key area of underactivity. Proactive work on conservation areas appeared to have improved in recent years but there was a substantial backlog. However the capacity in many authorities to work up new projects and seek support funding was limited. Integrating and updating records and transferring them on to electronic media also required significant resources, while outreach work was often squeezed by other pressures. NEED AND EFFECTIVENESS 4.55 Authorities were not specifically asked in the survey whether there was a need for their service, as most of the historic environment activities undertaken flowed from statutory requirements or government policy and advice. However, it was clear from the case study interviews that there was a conviction amongst HE officers that the historic environment was a vital element both in place-making and sustainable development and as such was important in
63
creating better places – a central strategic objective of all authorities. We had limited direct evidence but it would appear from views expressed to us that there was more work to be done to spread that conviction to senior local authority managers and politicians. 4.56 Implicit in the question regarding the need for historic environment services was the issue of how to value such services. This is a complex question, with many facets including both economic and cultural dimensions. It was explored in only a very limited way with some case study interviewees. There was some recognition of economic value, with the ability to leverage additional resources and generate income and hence jobs – however, this matter is being examined in more detail by the Ecotec consultancy project for HEACS. We were not made aware of any local authorities exploring how to measure the cultural value of the historic environment. 4.57 There has been limited time to examine what was a substantial topic in its own right, however, there is both a need and opportunity to develop this area of work further in order to assist in raising the profile of the historic environment in local authorities. The Ecotec research project will help in this context and could, with other material, form the basis of a Scottish version of the heritage dividend publication by English Heritage.11 There is also a mix of popular and academic work which has been recently published around the concept of local identity and this could also be drawn upon in preparing any advice. This could include:
• Clone Town Britain (New Economics Foundation); • Values and effects of local identity preservation (Free University of Amsterdam); • European Cities Brand Barometer (Saffron Brand Consultants); • Valuation of the Historic Environment (Eftec).
Performance Indicators 4.58 With respect to the measurement of performance - around a third of authorities had no specific HE performance indicators at all. There was little consistency in the measures used – with a mix of process, activity and impact measures. The most frequently mentioned were: the number of conservation area Appraisals undertaken (seven authorities); removal of buildings from the BAR Register (five authorities) and response/processing times for HE related applications (four authorities). Suggestions regarding future indicators (Table 3.30) covered a broader range of issues and focus rather more on impact. 4.59 Survey returns indicated that there was no rigorous way of measuring the performance of authorities in relation to either their efficiency or their effectiveness in managing the historic environment. Approaches were of variable scope and quality – some authorities concentrated on a single indicator, others used a suite of measures, while some had none at all. As with most indicators they tended to measure what was readily measurable rather than what might be considered important in terms of real impact. Most measures were process or activity-based, although a few do focus on key outputs. 4.60 Prior to the National Performance Framework in the 2007 Scottish Government Spending Review there were no national indicators which measured performance in relation to
11 Heritage Dividend Methodology. English Heritage 2005
64
the historic environment. In Scotland there have never been any Statutory performance Indicators (SPIs) covering this policy area. In England there were four Best Value Performance Indicators (BVPIs) relating to heritage and conservation (although none measured effectiveness), but for 2008-9 this approach has been replaced with a new National Indicator Set (NIS) of 198 measures, none of which now relate to the historic environment. 4.61 A new approach has also been introduced in Scotland via the Concordat and Single Outcome Agreement (SOA) process.12 The review of the first round of SOAs (paragraphs 3.145-3.150) has shown that the process in respect of the treatment of the historic environment had been somewhat haphazard. Several authorities had identified no HE indicator at all, while those chosen by authorities show no consistency of approach and generally measure levels of activity or throughputs. Notwithstanding this, the SOA has put the historic environment on the national performance agenda in a way which did not exist before and provides an opportunity to develop and refine some key impact measures. Service Standards 4.62 None of the survey authorities indicated that they had developed a set of local service standards for the historic environment, or that they carried out any regular self assessment against these standards. Most authorities had some form of service plan which covered the management of the historic environment to different degrees. We were only able to inspect a few of these but all were activity based – dealing with throughputs or progress with projects. Only two of the case study authorities felt that a statutory duty of care for the historic environment would be useful. 4.63 The only existing national standard for the historic environment is the target of processing LBCs and CACs within eight weeks of validation. Over the past three years for which information is available (2004-7) the percentage of applications decided within that period had fallen from 31% to 25%. This compared with figures for general planning applications over the same period of 63% and 61%. 4.64 Several case study authorities thought that LBC/CAC application decision times could be improved. Factors mentioned in this context included better liaison between HE specialists and DM staff and improved applicant understanding of requirements. There were views that it was almost impossible to determine LBCs/CACs in less than eight weeks given that current procedures allow Historic Scotland a total of 28 days for responses to consultations. It was suggested that there was a need to ‘stop the clock’ in relation to the eight weeks upon submission of recommendation to HS. There was also a call for current HS delegation arrangements in relation to LBCs, which they had with some local authorities, to be extended. 4.65 The possible introduction of national standards into other areas of historic environment activity produced a mixed response. Those in favour suggest that they should cover both staffing/capacity (eg. 1 IHBC qualified officer per 1000 listed buildings) and service performance (eg. 10 working days for comments from HE specialists to DM officers). Those with reservations felt they would put more pressure on the council and might divert action from
12 Concordat between the Scottish Government and CoSLA. Novemeber 2007.
65
more important areas of work. In particular, it was felt that they would not be particularly helpful unless they were properly resourced from the centre. 4.66 WoSAS, in its submission, indicated that it saw advantages in a national standard for archaeological services, especially since these were discretionary and covered a wide range of activities. Such a standard would indicate both to councils and to the public the kind of service they should expect to be provided. In particular, WoSAS highlighted the desirability of statutory SMR (HER) services together with an associated national standard as it considers this would be likely to ensure that proper funding was put in place. HELM 4.67 Case study authorities were asked what they thought of the Historic Environment-Local Management (HELM) website operated by English Heritage (EH). Around half of the officers interviewed had not heard of it. Those who had, thought that the web-based support function tailored to different stakeholders in the HE management process would be very useful in Scotland. However, there were feelings that it would need to be carefully handled and developed in a collaborative way; there were also suggestions that any such development should be integrated with other planning advice and that there should be scope for local input. 4.68 The local authority survey revealed that many authorities were undertaking a range of historic environment activities that they considered to be amongst the best practice in the field (paragraph 3.139). There was no readily available way of sharing this information across Scotland, and wider afield, and the development of a Scottish HELM could provide a useful platform for this type of initiative. IMPLICATIONS FOR THE MANAGEMENT OF THE HISTORIC ENVIRONMENT 4.69 There is, as yet no systematic definition of ‘need’ in relation to the historic environment. While the system was is coping at the time of the survey with the pressures with which it has to deal and there was no evidence that it was in crisis, all authorities identified areas of unmet need, some of which were significant. The survey also produced no evidence of HE staffing having been cut and there was only relatively minor use of temporary staff across Scotland as a whole, although there were authorities where it was a significant issue. Equally, there was some, but not extensive, use of shared arrangements. 4.70 Working relations with Historic Scotland (HS) were raised with the case study authorities and generally these were reported as being good, especially at the local area office level. Issues concerning consultation turn-around times and the possibility of extended delegation had already been noted. Guidance produced by HS was commended and there was a view that more of this would be welcome (eg. Technical Advice Notes and a Scottish equivalent of the EH publication Enabling Development). One officer suggested that Historic Scotland should liaise more with Architecture and Design Scotland to create design champions and review panels.

ANNEX 1: SURVEY QUESTIONNAIRE
Background to the Survey Historic Scotland have commissioned this independent survey of local authority and National Park provision for the historic environment and Geoff Peart Consulting and Arup have been appointed to carry out the survey. To date, there has been no comprehensive research to enable a detailed insight into the workings of local authorities in managing the historic environment. This survey aims to begin to fill that gap by establishing baseline information about local authority policies, staffing and resources. We anticipate the results will be of use for policy-makers and practitioners across the sector. The survey will also identify examples of good practice which can be shared between local authorities and may contribute to the development of a possible performance framework, in the context of the Single Outcome Agreement process. Notes for Completion In most authorities, this questionnaire is being sent to a number of different services each of which will complete it in relation to the historic environment services they provide. The survey should be completed by the lead official within your service who is responsible for historic environment activities. In February we wrote to all Chief Executives of Local Authorities to request appropriate contact details. We were given your details as the lead contact person in your service. If, however, you think you are not the appropriate official to complete the survey, please contact us to let us know. Can you please complete the sections relevant to your service and while the form may appear quite long, there are many questions which can be answered with an “X”. Sections B and C, however, do require the input of some annual figures and you may find it convenient to collect these beforehand. We anticipate that, with this information to hand the form should take no longer than 35 minutes or so to complete and for some services considerably less time. The detailed returns for your authority will be wholly confidential and results will only be published on an anonymous peer group basis. The questionnaire is in MS Word format and we would like it returned to us electronically if possible, but you may find it convenient to print it off to facilitate completion. There are 4 sections to the questionnaire: A. Staffing (Questions 1 to 8)……………..pages 2 - 5 B. Finance (Questions 9 to 13)……………pages 6 - 7 C. Workload (Questions 14 to 29)…………..pages 8 - 13 D. Performance (Questions 30 to 35)…............pages 14 - 16 Where possible we would like figures for the latest financial year [(April 2007 to March 2008]) but if these are not available the latest full year returns should be used. We would be grateful if you would return the completed questionnaire to Jillian Hastings at [email protected] soon as possible but in any event no later than Friday 30 May 2008. If you have any queries regarding the survey please contact Geoff Peart (Project Manager) on 01786 860318 or at [email protected]
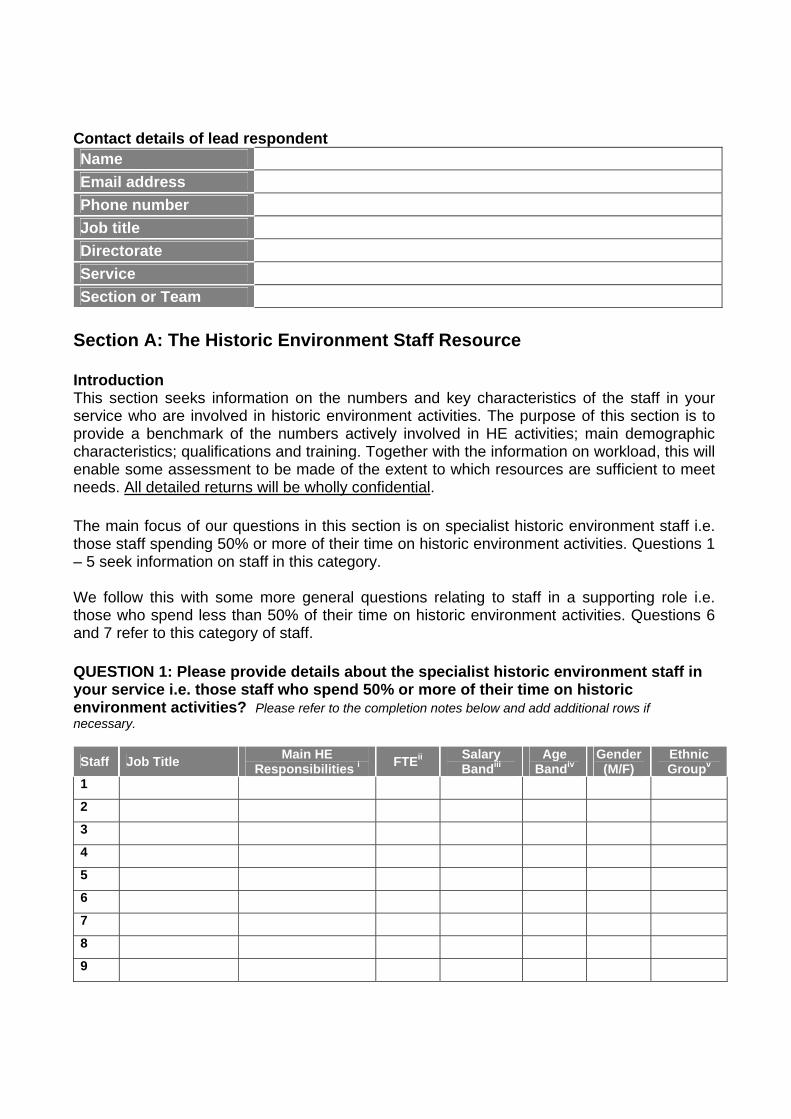
Contact details of lead respondent Name Email address Phone number Job title Directorate Service Section or Team
Section A: The Historic Environment Staff Resource Introduction This section seeks information on the numbers and key characteristics of the staff in your service who are involved in historic environment activities. The purpose of this section is to provide a benchmark of the numbers actively involved in HE activities; main demographic characteristics; qualifications and training. Together with the information on workload, this will enable some assessment to be made of the extent to which resources are sufficient to meet needs. All detailed returns will be wholly confidential. The main focus of our questions in this section is on specialist historic environment staff i.e. those staff spending 50% or more of their time on historic environment activities. Questions 1 – 5 seek information on staff in this category. We follow this with some more general questions relating to staff in a supporting role i.e. those who spend less than 50% of their time on historic environment activities. Questions 6 and 7 refer to this category of staff. QUESTION 1: Please provide details about the specialist historic environment staff in your service i.e. those staff who spend 50% or more of their time on historic environment activities? Please refer to the completion notes below and add additional rows if necessary.
Staff Job Title Main HE Responsibilities i FTEii Salary
Bandiii Age
Bandiv Gender (M/F)
Ethnic Groupv
1 2 3 4 5 6 7 8 9
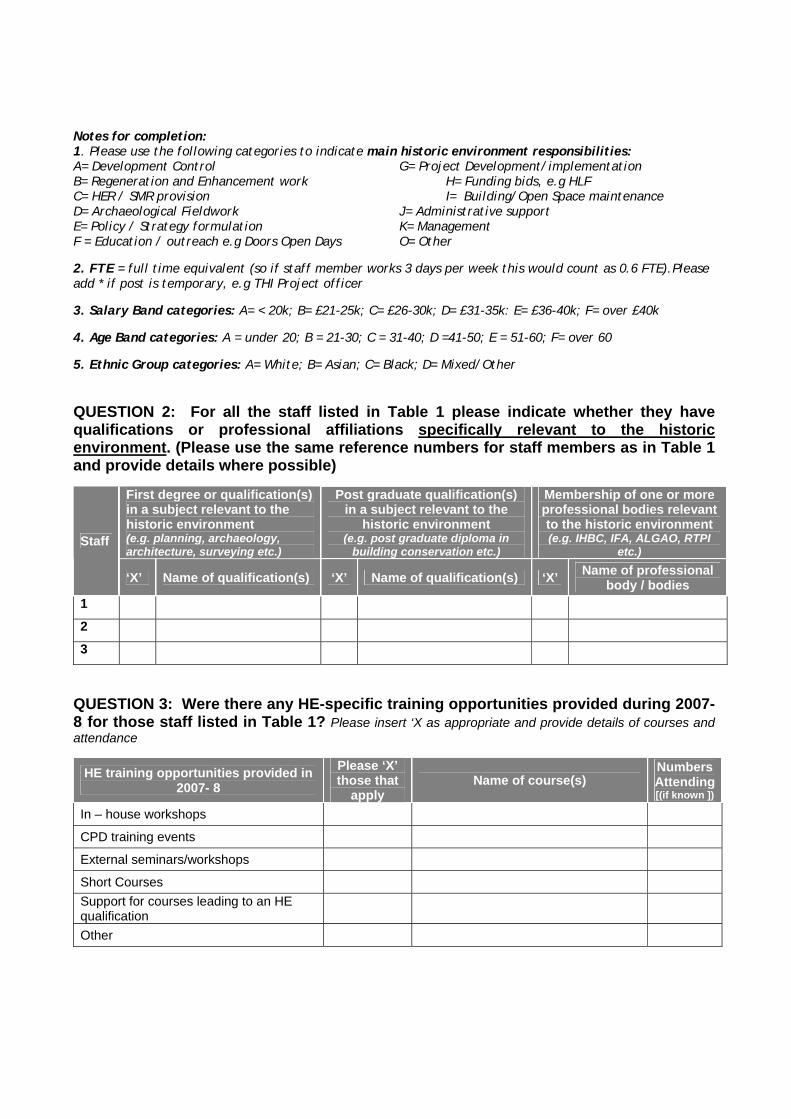
Notes for completion: 1. Please use the following categories to indicate main historic environment responsibilities: A= Development Control G= Project Development/implementation B= Regeneration and Enhancement work H= Funding bids, e.g HLF C= HER / SMR provision I= Building/Open Space maintenance D= Archaeological Fieldwork J= Administrative support E= Policy / Strategy formulation K= Management F = Education / outreach e.g Doors Open Days O= Other 2. FTE = full time equivalent (so if staff member works 3 days per week this would count as 0.6 FTE).Please add * if post is temporary, e.g THI Project officer 3. Salary Band categories: A= < 20k; B= £21-25k; C= £26-30k; D= £31-35k: E= £36-40k; F= over £40k 4. Age Band categories: A = under 20; B = 21-30; C = 31-40; D =41-50; E = 51-60; F= over 60 5. Ethnic Group categories: A= White; B= Asian; C= Black; D= Mixed/Other QUESTION 2: For all the staff listed in Table 1 please indicate whether they have qualifications or professional affiliations specifically relevant to the historic environment. (Please use the same reference numbers for staff members as in Table 1 and provide details where possible)
First degree or qualification(s) in a subject relevant to the historic environment (e.g. planning, archaeology, architecture, surveying etc.)
Post graduate qualification(s) in a subject relevant to the
historic environment (e.g. post graduate diploma in
building conservation etc.)
Membership of one or more professional bodies relevant to the historic environment (e.g. IHBC, IFA, ALGAO, RTPI
etc.) Staff
‘X’ Name of qualification(s) ‘X’ Name of qualification(s) ‘X’ Name of professional body / bodies
1 2 3
QUESTION 3: Were there any HE-specific training opportunities provided during 2007-8 for those staff listed in Table 1? Please insert ‘X as appropriate and provide details of courses and attendance
HE training opportunities provided in 2007- 8
Please ‘X’ those that
apply
Name of course(s)
Numbers Attending[(if known ])
In – house workshops CPD training events External seminars/workshops Short Courses Support for courses leading to an HE qualification
Other

QUESTION 4: What additional historic environment skills or training would be most useful to your service? Please order according to priority and add additional rows if required. Additional historic environment skills or training required [please list below] Priority [please indicate order
by 1,2, 3 etc]
QUESTION 5. Has the number of specialist staff involved in the delivery of historic environment activities in your service changed over the last 3 years? Do you think numbers are likely to change over the next 3 years? Please comment below.
Staff in a supporting role
In addition to the individuals listed under Question 1, there will be other categories of staff who contribute only part of their time (less than 50%) to historic environment activities, either in a direct or support role. This might include, for example: Development Control staff who deal with Listed Building applications as part of a general workload, or clerical staff who support HE professionals as part of their role(less than 50% of their time). Questions 6 and 7 refer to staff in this category. QUESTION 6: The table below should be completed for all staff in your service who contribute part of their time (less than 50%) to historic environment activities. Please estimate the overall amount of time (in FTE) that these staff spend on the HE, using the categories in the table below. For example, if 3 administrative staff spend around 25% of their time on HE related activities their FTE would be 0.75. (3 x 0.25)
Staff contributing under 50% of their time to HE activities
Estimate Overall
FTE Service(s) in which located
Professional e.g. Development Management staff; Education outreach staff etc
Technical e.g. Planning or Property technicians etc. Administrative e.g. shared Clerical Staff; Central support e.g. Finance; Legal; IT staff etc.
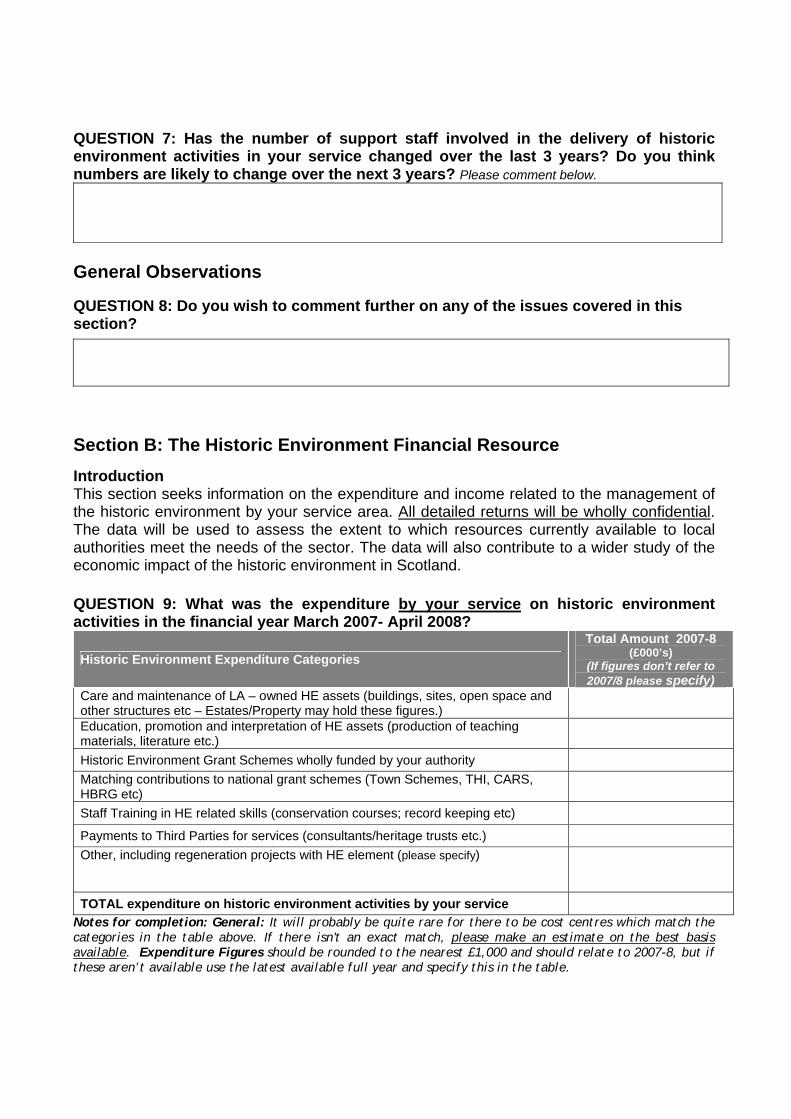
QUESTION 7: Has the number of support staff involved in the delivery of historic environment activities in your service changed over the last 3 years? Do you think numbers are likely to change over the next 3 years? Please comment below.
General Observations QUESTION 8: Do you wish to comment further on any of the issues covered in this section?
Section B: The Historic Environment Financial Resource Introduction This section seeks information on the expenditure and income related to the management of the historic environment by your service area. All detailed returns will be wholly confidential. The data will be used to assess the extent to which resources currently available to local authorities meet the needs of the sector. The data will also contribute to a wider study of the economic impact of the historic environment in Scotland. QUESTION 9: What was the expenditure by your service on historic environment activities in the financial year March 2007- April 2008?
Historic Environment Expenditure Categories Total Amount 2007-8
(£000’s) (If figures don’t refer to 2007/8 please specify)
Care and maintenance of LA – owned HE assets (buildings, sites, open space and other structures etc – Estates/Property may hold these figures.)
Education, promotion and interpretation of HE assets (production of teaching materials, literature etc.)
Historic Environment Grant Schemes wholly funded by your authority
Matching contributions to national grant schemes (Town Schemes, THI, CARS, HBRG etc)
Staff Training in HE related skills (conservation courses; record keeping etc)
Payments to Third Parties for services (consultants/heritage trusts etc.)
Other, including regeneration projects with HE element (please specify)
TOTAL expenditure on historic environment activities by your service
Notes for completion: General: It will probably be quite rare for there to be cost centres which match the categories in the table above. If there isn't an exact match, please make an estimate on the best basis available. Expenditure Figures should be rounded to the nearest £1,000 and should relate to 2007-8, but if these aren’t available use the latest available full year and specify this in the table.
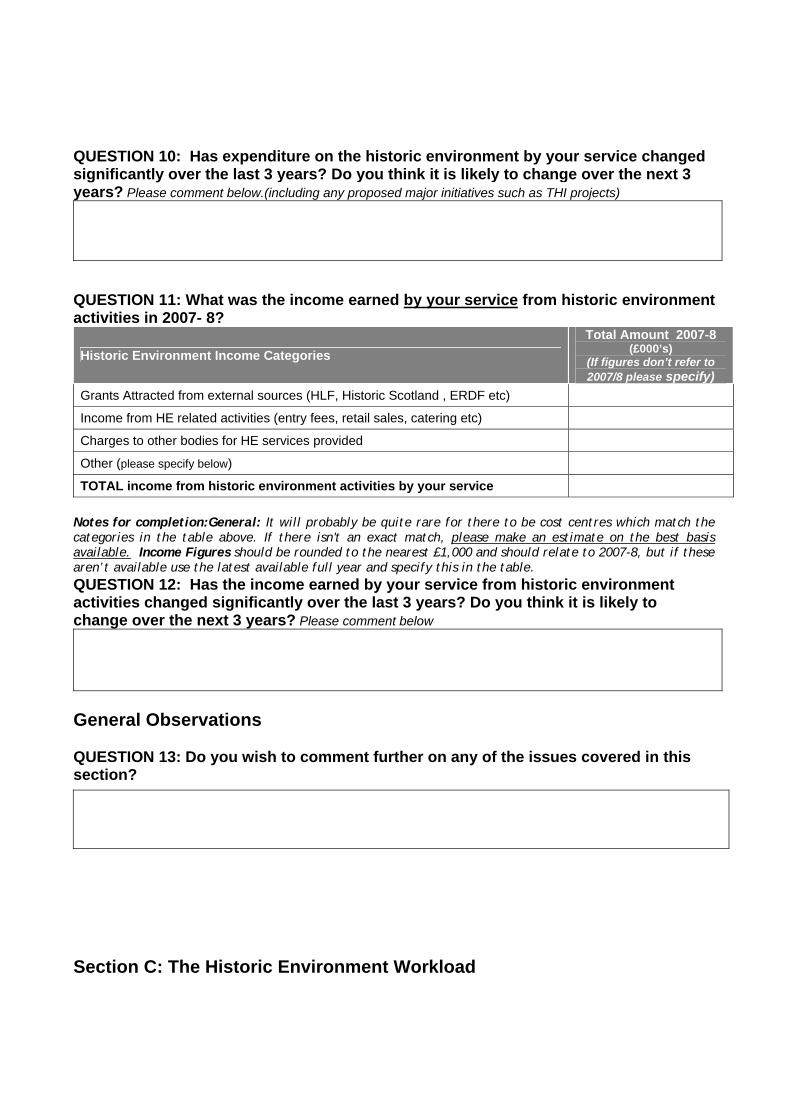
QUESTION 10: Has expenditure on the historic environment by your service changed significantly over the last 3 years? Do you think it is likely to change over the next 3 years? Please comment below.(including any proposed major initiatives such as THI projects)
QUESTION 11: What was the income earned by your service from historic environment activities in 2007- 8?
Historic Environment Income Categories Total Amount 2007-8
(£000’s) (If figures don’t refer to 2007/8 please specify)
Grants Attracted from external sources (HLF, Historic Scotland , ERDF etc) Income from HE related activities (entry fees, retail sales, catering etc) Charges to other bodies for HE services provided Other (please specify below) TOTAL income from historic environment activities by your service
Notes for completion:General: It will probably be quite rare for there to be cost centres which match the categories in the table above. If there isn't an exact match, please make an estimate on the best basis available. Income Figures should be rounded to the nearest £1,000 and should relate to 2007-8, but if these aren’t available use the latest available full year and specify this in the table. QUESTION 12: Has the income earned by your service from historic environment activities changed significantly over the last 3 years? Do you think it is likely to change over the next 3 years? Please comment below
General Observations QUESTION 13: Do you wish to comment further on any of the issues covered in this section?
Section C: The Historic Environment Workload
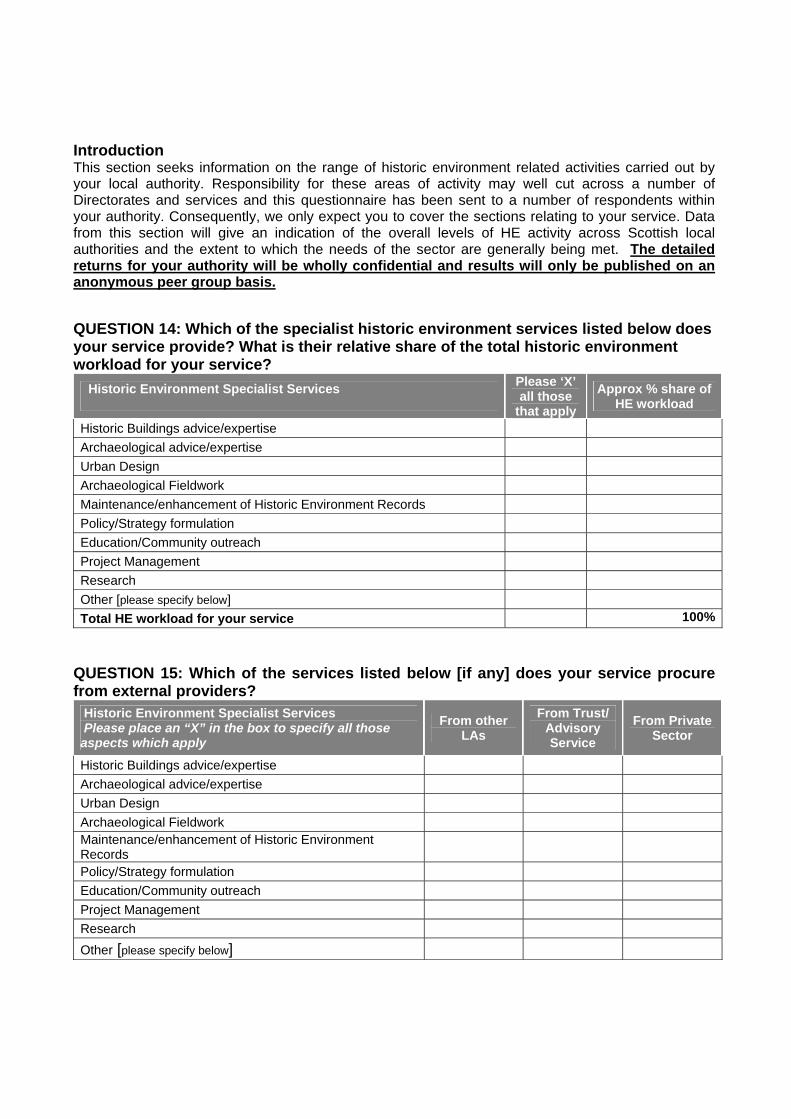
Introduction This section seeks information on the range of historic environment related activities carried out by your local authority. Responsibility for these areas of activity may well cut across a number of Directorates and services and this questionnaire has been sent to a number of respondents within your authority. Consequently, we only expect you to cover the sections relating to your service. Data from this section will give an indication of the overall levels of HE activity across Scottish local authorities and the extent to which the needs of the sector are generally being met. The detailed returns for your authority will be wholly confidential and results will only be published on an anonymous peer group basis. QUESTION 14: Which of the specialist historic environment services listed below does your service provide? What is their relative share of the total historic environment workload for your service? Historic Environment Specialist Services
Please ‘X’ all those
that apply Approx % share of
HE workload
Historic Buildings advice/expertise Archaeological advice/expertise Urban Design Archaeological Fieldwork Maintenance/enhancement of Historic Environment Records Policy/Strategy formulation Education/Community outreach Project Management Research Other [please specify below] Total HE workload for your service 100%
QUESTION 15: Which of the services listed below [if any] does your service procure from external providers? Historic Environment Specialist Services Please place an “X” in the box to specify all those aspects which apply
From other LAs
From Trust/ Advisory Service
From Private Sector
Historic Buildings advice/expertise Archaeological advice/expertise Urban Design Archaeological Fieldwork Maintenance/enhancement of Historic Environment Records
Policy/Strategy formulation Education/Community outreach Project Management Research Other [please specify below]
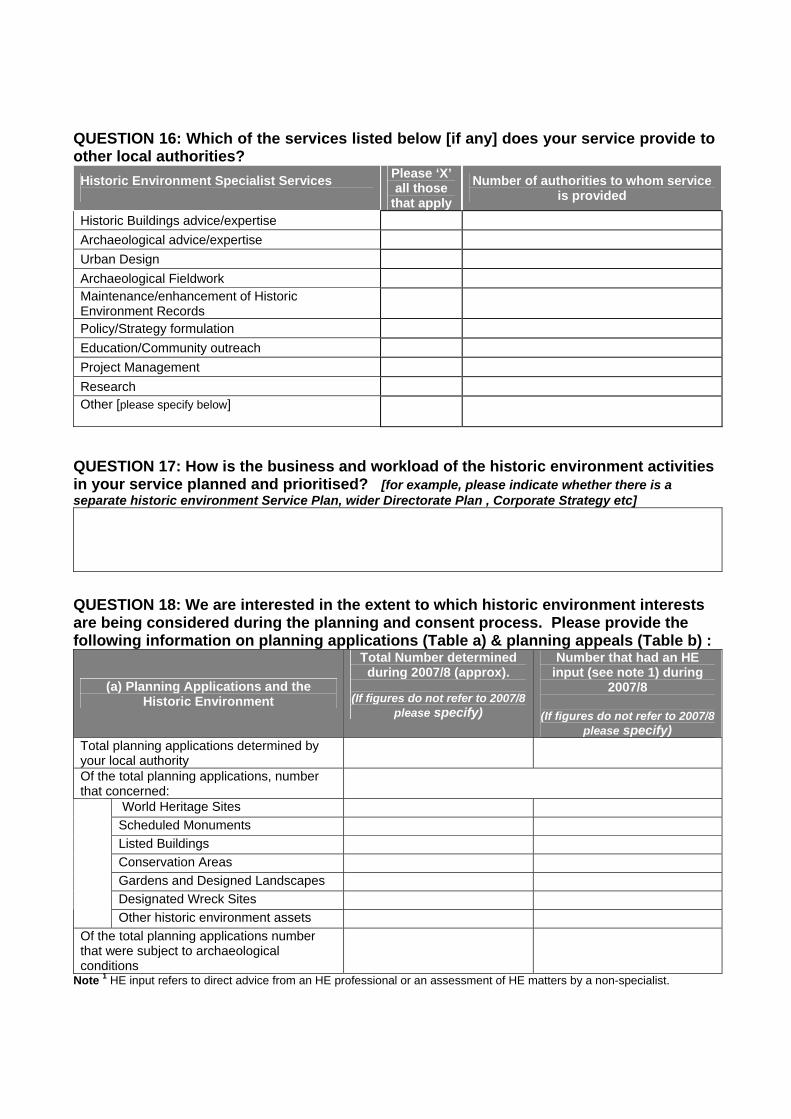
QUESTION 16: Which of the services listed below [if any] does your service provide to other local authorities? Historic Environment Specialist Services
Please ‘X’ all those
that apply Number of authorities to whom service
is provided
Historic Buildings advice/expertise Archaeological advice/expertise Urban Design Archaeological Fieldwork Maintenance/enhancement of Historic Environment Records
Policy/Strategy formulation Education/Community outreach Project Management Research Other [please specify below]
QUESTION 17: How is the business and workload of the historic environment activities in your service planned and prioritised? [for example, please indicate whether there is a separate historic environment Service Plan, wider Directorate Plan , Corporate Strategy etc]
QUESTION 18: We are interested in the extent to which historic environment interests are being considered during the planning and consent process. Please provide the following information on planning applications (Table a) & planning appeals (Table b) :
(a) Planning Applications and the Historic Environment
Total Number determined during 2007/8 (approx).
(If figures do not refer to 2007/8
please specify)
Number that had an HE input (see note 1) during
2007/8
(If figures do not refer to 2007/8 please specify)
Total planning applications determined by your local authority
Of the total planning applications, number that concerned:
World Heritage Sites Scheduled Monuments Listed Buildings Conservation Areas Gardens and Designed Landscapes Designated Wreck Sites
Other historic environment assets Of the total planning applications number that were subject to archaeological conditions
Note 1 HE input refers to direct advice from an HE professional or an assessment of HE matters by a non-specialist.
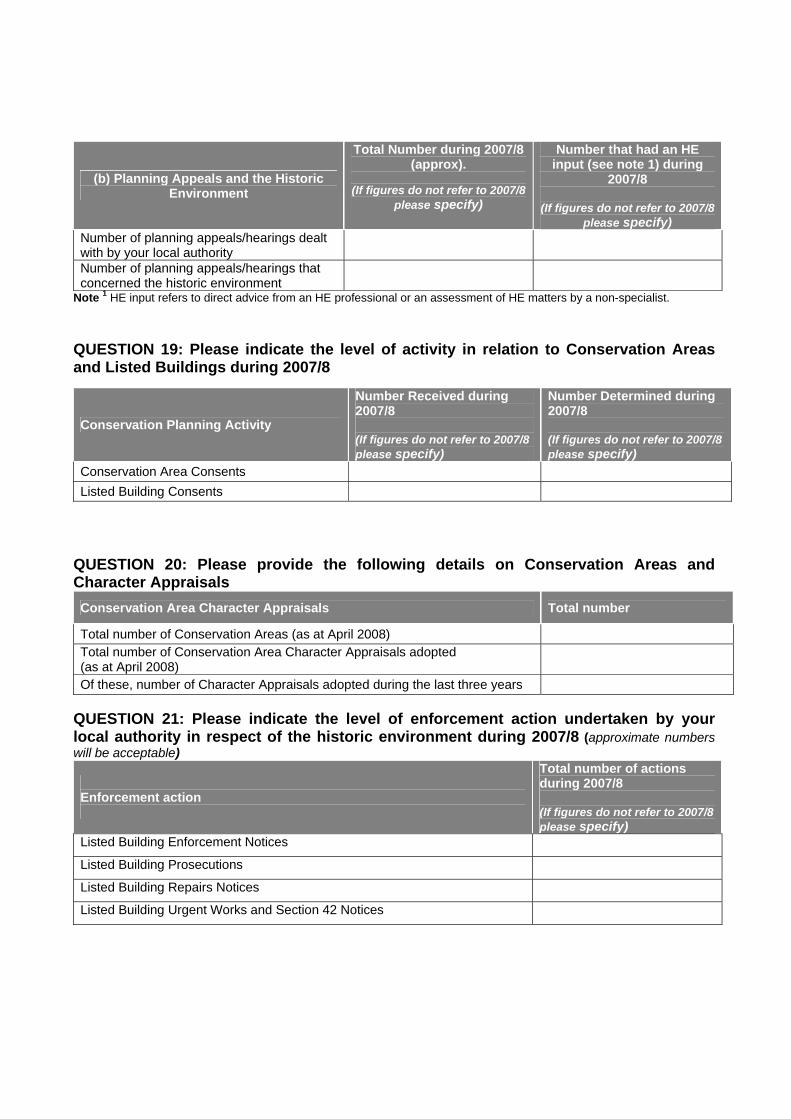
(b) Planning Appeals and the Historic Environment
Total Number during 2007/8 (approx).
(If figures do not refer to 2007/8
please specify)
Number that had an HE input (see note 1) during
2007/8
(If figures do not refer to 2007/8 please specify)
Number of planning appeals/hearings dealt with by your local authority
Number of planning appeals/hearings that concerned the historic environment
Note 1 HE input refers to direct advice from an HE professional or an assessment of HE matters by a non-specialist. QUESTION 19: Please indicate the level of activity in relation to Conservation Areas and Listed Buildings during 2007/8
Conservation Planning Activity
Number Received during 2007/8 (If figures do not refer to 2007/8 please specify)
Number Determined during 2007/8 (If figures do not refer to 2007/8 please specify)
Conservation Area Consents Listed Building Consents
QUESTION 20: Please provide the following details on Conservation Areas and Character Appraisals Conservation Area Character Appraisals Total number
Total number of Conservation Areas (as at April 2008) Total number of Conservation Area Character Appraisals adopted (as at April 2008)
Of these, number of Character Appraisals adopted during the last three years QUESTION 21: Please indicate the level of enforcement action undertaken by your local authority in respect of the historic environment during 2007/8 (approximate numbers will be acceptable)
Enforcement action
Total number of actions during 2007/8 (If figures do not refer to 2007/8 please specify)
Listed Building Enforcement Notices Listed Building Prosecutions Listed Building Repairs Notices Listed Building Urgent Works and Section 42 Notices
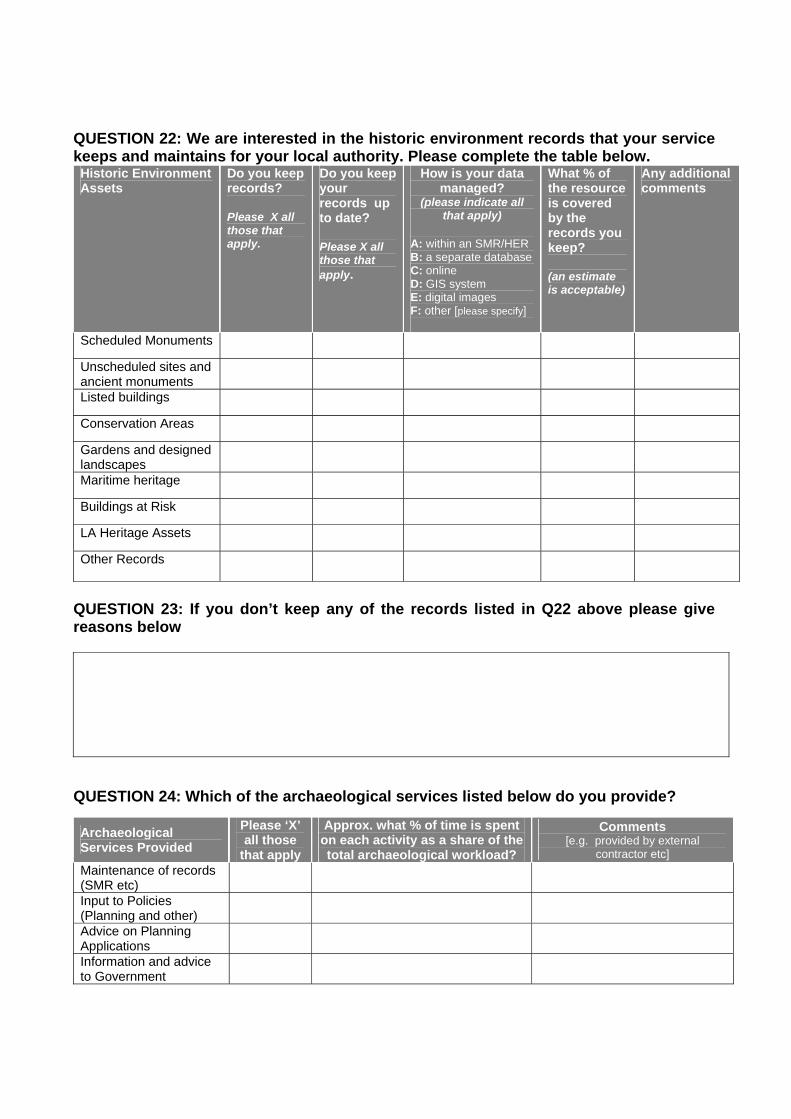
QUESTION 22: We are interested in the historic environment records that your service keeps and maintains for your local authority. Please complete the table below. Historic Environment Assets
Do you keep records? Please X all those that apply.
Do you keep your records up to date? Please X all those that apply.
How is your data managed?
(please indicate all that apply)
A: within an SMR/HER B: a separate database C: online D: GIS system E: digital images F: other [please specify]
What % of the resource is covered by the records you keep? (an estimate is acceptable)
Any additional comments
Scheduled Monuments Unscheduled sites and ancient monuments
Listed buildings Conservation Areas Gardens and designed landscapes
Maritime heritage Buildings at Risk LA Heritage Assets Other Records
QUESTION 23: If you don’t keep any of the records listed in Q22 above please give reasons below
QUESTION 24: Which of the archaeological services listed below do you provide?
Archaeological Services Provided
Please ‘X’ all those
that apply
Approx. what % of time is spent on each activity as a share of the total archaeological workload?
Comments [e.g. provided by external
contractor etc] Maintenance of records (SMR etc)
Input to Policies (Planning and other)
Advice on Planning Applications
Information and advice to Government

Agencies (note 1)
Advice to Utilities Promotional work with Trusts, public etc
Other [please specify]
TOTAL 100%
Note 1. This may include – Information to Historic Scotland; audits for agri-environment schemes; SRDP; advice to Forestry Commission and Scottish Water under national agreements etc. QUESTION 25: Which of the outreach/education activities listed below has your service undertaken over the past year 2007-8? Community Outreach Activities (Please mark all that apply with an “X”)
Promotional Leaflets Community Research Projects Exhibitions/Events Community Fieldwork Projects Guided Walks Heritage Craft Skills Courses Talks to Local Groups/Amenity Societies Councillor Training Courses Education Packages Officer Training Courses Schools Projects Other [please specify]
QUESTION 26: Which of the Heritage Grants listed below have you applied for/received over the past year? [Please liaise with other respondents from your authority to prevent double counting]
Type of Heritage Grant Number applied for
Value applied for (£s)
Number received
Value received (£s)
Change over the last 3 years [please indicate the broad direction of change up or down, or add any other explanatory comment]
Townscape Heritage Initiative
Conservation Area Regeneration Schemes
Town Schemes
Historic Buildings Regeneration Grant
Unknown
Other [please specify below]
QUESTION 27: Has the historic environment workload of your service changed over the last 3 years? Can you explain the increase or decrease? Please indicate the broad direction and dimensions of change and the reasons why you think the change has occurred
QUESTION 28: How do you expect the historic environment workload of the service to change over the next 3 years? What do you think will drive this?
General Observations QUESTION 29: Do you wish to comment further on any of the issues covered in this section?
Section D: Measuring Performance Introduction This section seeks information about how your service currently measures how well it is doing in its management of the historic environment. This can cover a range of issues such as the outcomes delivered (e.g. the number of listed buildings protected from adverse development); . or the quality of the service being provided (e.g. how frequently are policies and procedures updated; or methods used to engage with the public or developers). Local authorities are in Year 1 of developing Single Outcome Agreements, which include indicators to measure performance. So, when completing this section, it would be helpful if you think about your ongoing work in this context. The detailed returns for your authority will be wholly confidential and results will only be published on an anonymous peer group basis. QUESTION 30: What local performance indicators / service standards does your local authority currently use to measure outcomes in the historic environment? Please provide details in the box below.
QUESTION 31: Which local performance indicators / service standards do you think should be used to measure outcomes in the historic environment? Why do you think these are important? Please provide details in the box below.
QUESTION 32: Do you experience any problems delivering any of the HE services listed below? If so, please provide explanation. Historic Environment Services What problems with delivery are you experiencing (if any)? Maintain copies of the lists for consultation Prepare and implement HE policies in Structure Plans Prepare and implement HE policies in Local Plans Identify, designate and review Conservation Areas Process applications for LB consent; CA consent and works in CAs Process applications with reference to HE impact Take enforcement action re breaches of LBC and CAC & archaeological sites Prepare schemes for preservation and enhancement of Conservation Areas Other [please specify]
QUESTION 33: What do you consider to be the key challenges in meeting the needs of the historic environment in your local authority area? What do you think would help overcome these challenges?

QUESTION 34: Does your service undertake any HE activities or processes which you consider to be best practice? Please give examples (this might be a small initiative and not necessarily involve the whole service) Examples of Best Practice
Final Observations QUESTION 35: Do you have views on any other matters to do with the management of the historic environment which have not been raised in the questionnaire?
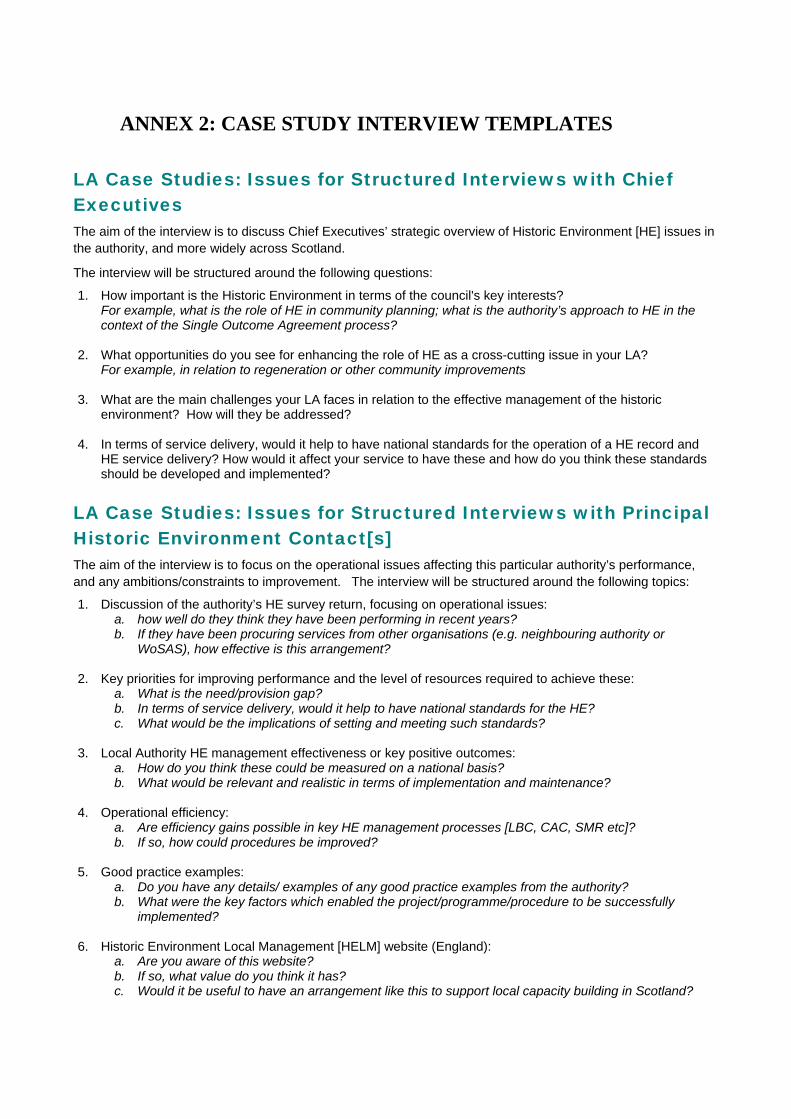
ANNEX 2: CASE STUDY INTERVIEW TEMPLATES LA Case Studies: Issues for Structured Interviews with Chief Executives The aim of the interview is to discuss Chief Executives’ strategic overview of Historic Environment [HE] issues in the authority, and more widely across Scotland.
The interview will be structured around the following questions:
1. How important is the Historic Environment in terms of the council's key interests? For example, what is the role of HE in community planning; what is the authority’s approach to HE in the context of the Single Outcome Agreement process?
2. What opportunities do you see for enhancing the role of HE as a cross-cutting issue in your LA? For example, in relation to regeneration or other community improvements
3. What are the main challenges your LA faces in relation to the effective management of the historic environment? How will they be addressed?
4. In terms of service delivery, would it help to have national standards for the operation of a HE record and HE service delivery? How would it affect your service to have these and how do you think these standards should be developed and implemented?
LA Case Studies: Issues for Structured Interviews with Principal Historic Environment Contact[s] The aim of the interview is to focus on the operational issues affecting this particular authority’s performance, and any ambitions/constraints to improvement. The interview will be structured around the following topics:
1. Discussion of the authority’s HE survey return, focusing on operational issues: a. how well do they think they have been performing in recent years? b. If they have been procuring services from other organisations (e.g. neighbouring authority or
WoSAS), how effective is this arrangement?
2. Key priorities for improving performance and the level of resources required to achieve these: a. What is the need/provision gap? b. In terms of service delivery, would it help to have national standards for the HE? c. What would be the implications of setting and meeting such standards?
3. Local Authority HE management effectiveness or key positive outcomes:
a. How do you think these could be measured on a national basis? b. What would be relevant and realistic in terms of implementation and maintenance?
4. Operational efficiency:
a. Are efficiency gains possible in key HE management processes [LBC, CAC, SMR etc]? b. If so, how could procedures be improved?
5. Good practice examples:
a. Do you have any details/ examples of any good practice examples from the authority? b. What were the key factors which enabled the project/programme/procedure to be successfully
implemented? 6. Historic Environment Local Management [HELM] website (England):
a. Are you aware of this website? b. If so, what value do you think it has? c. Would it be useful to have an arrangement like this to support local capacity building in Scotland?
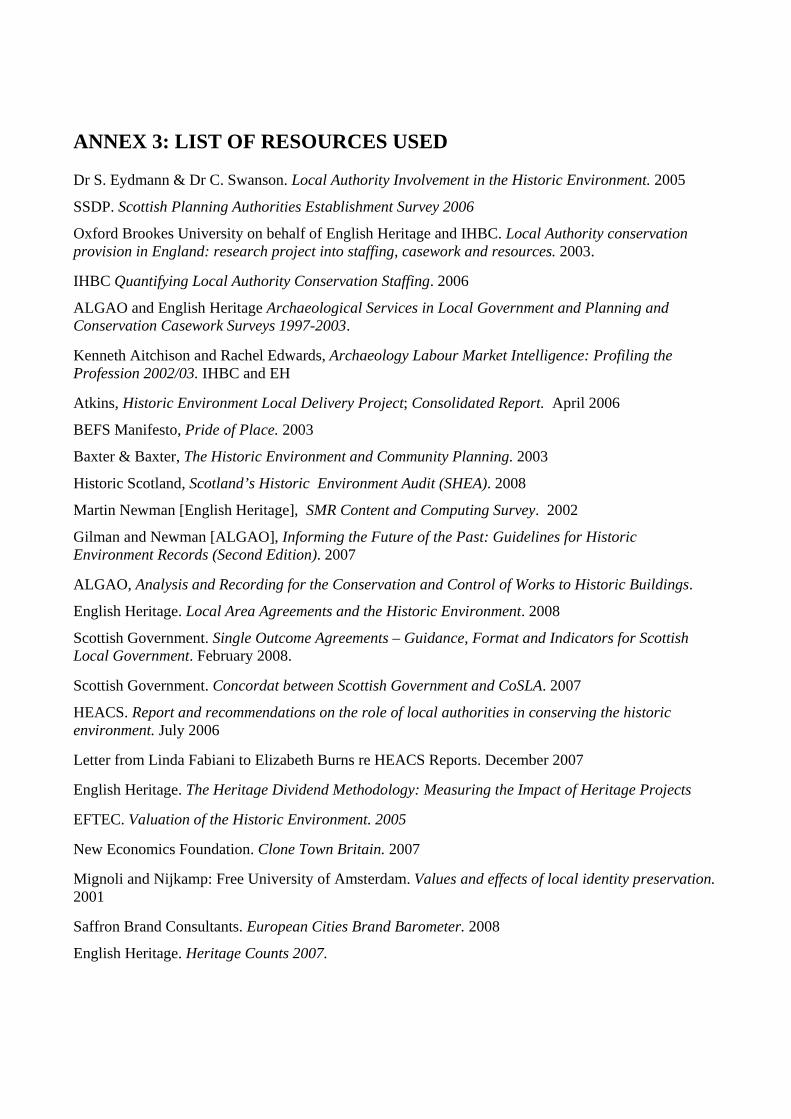
ANNEX 3: LIST OF RESOURCES USED Dr S. Eydmann & Dr C. Swanson. Local Authority Involvement in the Historic Environment. 2005
SSDP. Scottish Planning Authorities Establishment Survey 2006
Oxford Brookes University on behalf of English Heritage and IHBC. Local Authority conservation provision in England: research project into staffing, casework and resources. 2003. IHBC Quantifying Local Authority Conservation Staffing. 2006
ALGAO and English Heritage Archaeological Services in Local Government and Planning and Conservation Casework Surveys 1997-2003. Kenneth Aitchison and Rachel Edwards, Archaeology Labour Market Intelligence: Profiling the Profession 2002/03. IHBC and EH Atkins, Historic Environment Local Delivery Project; Consolidated Report. April 2006
BEFS Manifesto, Pride of Place. 2003
Baxter & Baxter, The Historic Environment and Community Planning. 2003
Historic Scotland, Scotland’s Historic Environment Audit (SHEA). 2008
Martin Newman [English Heritage], SMR Content and Computing Survey. 2002
Gilman and Newman [ALGAO], Informing the Future of the Past: Guidelines for Historic Environment Records (Second Edition). 2007 ALGAO, Analysis and Recording for the Conservation and Control of Works to Historic Buildings.
English Heritage. Local Area Agreements and the Historic Environment. 2008
Scottish Government. Single Outcome Agreements – Guidance, Format and Indicators for Scottish Local Government. February 2008. Scottish Government. Concordat between Scottish Government and CoSLA. 2007
HEACS. Report and recommendations on the role of local authorities in conserving the historic environment. July 2006 Letter from Linda Fabiani to Elizabeth Burns re HEACS Reports. December 2007 English Heritage. The Heritage Dividend Methodology: Measuring the Impact of Heritage Projects EFTEC. Valuation of the Historic Environment. 2005
New Economics Foundation. Clone Town Britain. 2007 Mignoli and Nijkamp: Free University of Amsterdam. Values and effects of local identity preservation. 2001 Saffron Brand Consultants. European Cities Brand Barometer. 2008
English Heritage. Heritage Counts 2007.

Institute of Historic Building Conservation. Quantifying Local Planning Authority Conservation Staffing. 2006 Department of Culture Media and Sport. Heritage Protection for the 21st Century. 2007 Scottish Executive. Planning Advice Note 71:Conservation Area Management. 2004 Scottish Government. Draft Scottish Planning Policy 23: Planning and the Historic Environment. 2008 ScottishGovernment. Planning Performance Statistics 2004-7. 2007.
ALGAO. Report on Staffing and Casework Surveys 1997-2003. 2003
Built Environment Forum Scotland. Auditing the Historic Environment. 2006
HEACS. Report and recommendations on the need for a heritage audit in Scotland. 2004
University of Glamorgan. Taking Forward Valuing our Environment.2006
