survey of the uk tax system
TRANSCRIPT

A SURVEY OF THE UK TAX SYSTEM
Lucy Chennells Andrew Dilnot
Nikki Roback
THE INSTITUTE FOR FISCAL STUDIES
Briefing Note No. 9 Version: August 2000
1
A Survey of the UK Tax System*
by
L. Chennells, A. Dilnot and N. Roback
Updated August 2000
1. Introduction
This document provides an overview of the UK tax system, describing how each of the main taxes works and setting their current state into the context of the past 21 years. We begin, in Section 2, with a brief assessment of the total amount of tax raised in the UK and the individual contribution made by each tax. In Section 3, we describe the structure of each of the main taxes: income tax; National Insurance contributions; value added tax and other indirect taxes; capital taxes such as capital gains tax and inheritance tax; corporation tax; taxes on North Sea oil production; local (council) tax; and the non-domestic property tax. The information given in these sections relates, where possible, to the tax system for the fiscal year 2000–01.
In Section 4, we set the current system in the context of reforms that have taken place over the last 21 years. This section attempts to draw together elements such as the changing structure of income tax and National Insurance contributions, the taxation of different forms of saving and developments in indirect taxation, corporation tax and local taxes.
2. Revenue raised by UK taxes
Total government receipts are forecast to be £375.6 billion in 2000–01, or 39.6% of UK GDP. This is equivalent to roughly £7,800 for every adult in the UK, or £6,300 per person. Table 1 summarises the breakdown of UK government revenue.
In 2000–01, the largest single source of revenue for the government will be taxes on income, both personal and corporate. Approximately £95.9 billion, or 25.5% of total current receipts, will be raised from income tax, with a further £58.8 billion from National Insurance contributions and £33.8 billion from corporation tax. These three sources alone will account for around 50% of total government revenue. Some £121.8 billion, or 32% of revenue, will be raised by taxes on expenditure, with VAT accounting for £59.6 billion and council tax £13.6 billion; the remainder will be raised by other indirect taxes, including excise duties on petrol, alcohol and tobacco, which
* This paper substantially revises and updates the UK chapter by A. Dilnot and G. Stears, published in K. Messere (ed.), The Tax System in Industrialized Countries, Oxford University Press, 1998. The paper was funded by the ESRC Centre for the Microeconomic Analysis of Fiscal Policy at the Institute for Fiscal Studies (IFS). The authors would like to thank Carl Emmerson, Julian McCrae, Sarah Smith and Zoë Smith for their help and advice during preparation of the paper, and Judith Payne for copy-editing. All remaining errors are the responsibility of the authors.

2
will raise a total of around £37.3 billion. Taxes on capital will provide a further £12.9 billion for the exchequer.
Table 1: Sources of government revenue, 2000–01 forecasts
Source of revenue Forecast 2000–01
(£bn)
Percentage of total
Income tax (net of income tax credits)a
National Insurance contributions Capital taxes Capital gains tax Inheritance tax Stamp duties Value added tax Other indirect taxes Petrol duties Tobacco duties Alcohol duties Betting and gaming duties Vehicle excise duty Air passenger duty Insurance premium tax Landfill tax Customs duties and levies Corporation taxes Corporation taxb
Petroleum revenue tax National non-domestic rates Oil royalties Council tax Other taxes and royalties Interest and dividends Gross operating surplus and rent Other receipts and accounting adjustments Current receipts
95.9 58.8
3.4 2.3 7.2
59.6
23.3 7.4 6.6 1.4 4.9 1.0 1.6 0.4 2.0
33.8 1.2
16.2 0.5
13.6 8.2 4.4
19.6 2.3
375.6
25.5 15.7
0.9 0.6 1.9
15.9
6.2 2.0 1.8 0.4 1.3 0.3 0.4 0.1 0.5
9.0 0.3 4.3 0.1 3.6 2.2 1.2 5.2 0.6
100.0
a Gross income tax minus income tax credits. b Includes residual advance corporation tax (ACT) repayment of £0.2 billion.
Source: HM Treasury, Financial Statement and Budget Report, 2000 (http://www.hm-treasury.gov.uk/budget2000/fsbr/contents.htm).
3. The tax system
3.1. Income tax Income tax liabilities Over 26 million individuals pay income tax in the UK but not all income is subject to tax. The main kinds of income that are subject to income tax are earnings from employment and self-employment, unemployment benefit, pension payments during retirement, profits from business, income from property, bank and building society

3
interest and dividends on shares. Incomes from certain social security benefits are not liable to income tax, at an estimated cost of about £1.6 billion in 1999–00. Income tax is also not paid on certain savings products such as National Savings Certificates and Individual Savings Accounts.
Allowances and bands Income tax in the UK operates through a system of allowances and bands of income. Each individual has a personal allowance, which is deducted from total income before tax in order to reach taxable income. Taxpayers under 65 years old receive a personal allowance of £4,385, while older people are entitled to higher personal allowances (see Table 2). If income for the over-65s exceeds a certain limit (£17,000), then the allowance becomes subject to a taper of 50% which gradually reduces it to a minimum level equal to the allowance for the under-65s.
Table 2: Allowances and thresholds, 2000–01
Allowance £ p.a. Percentage of average earnings
(%)
Personal: aged under 65 aged 65–74 aged 75 and over Married couples: aged under 65 aged 65–74 aged 75 and over Basic-rate limit Lower-rate limit
4,385 5,790 6,050
n/a 5,185 5,255
28,400 1,520
18.5 24.5 25.6
n/a 21.9 22.2
Note: ‘Average earnings’ refers to the wages of full-time males in April 2000.
Sources: New Earnings Survey 1998; Labour Market Trends, July 2000.
Taxable income is subject to different tax rates depending upon the ‘tax band’ that income falls within. The first £1,520 of taxable income (i.e. income above any personal allowances) is taxed at a lower rate of 10% (prior to April 1999, the lower rate was 20% but applied to a wider band of income). The next £26,880 is subject to the basic rate of 22%. For taxable income above the basic-rate limit of £28,400, that portion of income is taxed at the higher rate of 40%. Table 3 summarises these marginal tax rates and bands.
Table 3: Tax rates and bands, 2000–01
Taxable income per year (£) Rate of tax (%)
0–1,520 (lower-rate band) 1,521–28,400 (basic-rate band) Over 28,400 (higher-rate band)
10 22 40

4
Table 4 shows the income tax liabilities of lower-, basic- and higher-rate taxpayers. Of a total of 26.2 million taxpayers, 12% pay tax at the lower rate, 79% pay at the basic rate and 9% are taxed at the higher rate.
Table 4: Income tax liabilities of lower-, basic- and higher-rate taxpayers, 1999–00a
Taxpayers liable at: No. of taxpayers (000s)
Total amount of tax (£m)
Amount as a percentage of total
(%)
Lower rateb
Basic rate Higher rate Total
3,200
20,800 2,300
26,200
830
46,100 38,700
85,600
1.0
53.9 45.2
100
a Provisional statistics. b Includes savings rate taxpayers (those whose only income above the lower rate limit is from either savings or dividends).
Source: Inland Revenue Statistics 1999 (http://www.inlandrevenue.gov.uk/stats/index.htm).
In the past, in addition to their personal allowances, married couples were entitled to a married couple’s allowance (MCA). In April 2000, the MCA was abolished, although those over 65 and claiming the allowance at that date will continue to be able to do so. In addition, other similar reliefs and allowances worth about the same as the basic MCA have also been abolished. These include the additional personal allowance (APA), which was available for separated and unmarried people with children, and the widow’s bereavement allowance. The revenue from the abolition of these allowances will be used, from 2001–02, to fund a new children’s tax credit. This new credit will be payable to all families with one or more children aged under 16 living with them. It will take the form of an allowance (£4,420 in 2001–02) for which relief is given at 10% against income tax owed. The credit will gradually be withdrawn from higher-rate taxpayers, who will lose £1 of tax credit for every £15 of income above the point at which they start to pay tax at the higher rate, until their entitlement is exhausted.
Another major reform to the allowance system is the introduction of the new working families’ tax credit (WFTC) which replaced family credit from October 1999. A family with children needs to have one adult working 16 hours or more per week in order to qualify for WFTC. The WFTC is made up of several elements. There is a basic tax credit (one per family) of £53.15 per week, various tax credits for each child depending on the age of each child (£25.60 for a child under 16 and £26.35 for a child aged 16–18) and an extra tax credit of £11.25 for working 30 hours or more per week. In addition, there is a childcare tax credit, worth 70% of actual childcare costs up to £150 per week (£100 per week for families with only one child). If a family’s net income exceeds a weekly threshold of £90 per week, then WFTC is subject to a taper of 55% on net income.1
1 For more information, see A. Dilnot and J. McCrae, Family Credit and the Working Families Tax

5
Taxation of charitable giving Prior to April 2000, there were already a number of ways that people could give to charity tax-free — covenants, Gift Aid (and Millennium Gift Aid) and payroll giving schemes.
Individuals (and companies) can set up a covenant committing them to donate a fixed amount to a particular charity each year. As long as the covenant runs for a minimum of three years, covenantors get relief from income or corporation tax on their covenanted donations to charities. The charity claims back basic-rate tax on the gift; higher-rate taxpayers can claim the difference between the basic rate and the higher rate from the Inland Revenue. There is no upper limit on the amounts donated by covenants.
Established in 1990, Gift Aid allows individuals (and companies) to get tax relief on one-off donations above a minimum threshold which was £250 from March 1993. The operation of Gift Aid is very similar to that of a covenant. Donations are made net of basic-rate tax; the charity recovers the basic-rate tax, and higher-rate taxpayers may claim additional tax relief on the grossed-up amount.
Under a payroll giving scheme (Give As You Earn), employees can authorise their employer to deduct amounts from their pay and nominate the charities to which their gifts should go. This requires the employers to contract with an Inland Revenue approved collection agency. The donation is deducted from pay before calculating tax due under PAYE. On its introduction in 1987, gifts made under payroll giving schemes could not exceed £120 a year. The upper limit was raised over time and since April 1996 had been set at £1,200.
These schemes have the disadvantage that they limit tax-free giving to people who are prepared to commit to giving to charity over a reasonably long period through a covenant, people who are able to make a large donation through Gift Aid or people whose employer has set up a payroll giving scheme. A number of changes came into effect in April 2000, designed to provide a boost to charities by extending tax-free giving. Amongst these changes, the Gift Aid threshold was reduced from £250 to zero. In effect, all donations made through the Gift Aid scheme will now be tax-free. Furthermore, donors will now be allowed to join the Gift Aid scheme by telephone or internet. The £1,200 ceiling on annual donations through payroll giving scheme was also abolished. In addition, donations made through payroll giving schemes will receive a 10% government supplement payable for three years. There will also be a new income tax relief for gifts of quoted shares and securities.
Inflation adjustment The bands and allowances of individual income tax are subject to statutory indexation provisions, announced at the time of the annual Budget, unless Parliament intervenes. The increase is in line with the percentage increase in the retail price index in the year to the September preceding the Budget. Changes in allowances have to be rounded up to the nearest multiple of £10 and changes to thresholds and bands to the nearest multiple of £100.
Credit, IFS Briefing Note no. 3, 1999 (http://www.ifs.org.uk/labmarket/wftc.pdf).

6
Payments system Most income tax on earned income is deducted at source by employers. The UK system is cumulative in the sense that total tax payable for a particular financial year depends upon total income in that year. Thus, when calculating tax due each week or month, the employer considers the income not simply for the period in question but for the whole of the tax year to date. The tax due on the total cumulative income is calculated, tax paid thus far is deducted and the remainder is due. For those with stable incomes, this produces a pattern of payments much like that in a non-cumulative system, but for those with volatile incomes, it still achieves the result that at the end of the tax year the correct amount of tax should have been deducted. The Inland Revenue supplies employers with a ‘tax code’, which describes the level of tax allowances or credits available over the year; if individual circumstances change (e.g. because of marriage), the Revenue issues a new code to employers.
This cumulative system allowed relatively few tax returns to be issued, since for those with relatively simple affairs no adjustment to the amount of tax already paid was necessary. In recent years, there has been a move towards greater self-assessment, driven partly by the changing nature of employment, but the majority of employees still have their tax payments collected through the cumulative system and do not fill in tax returns.
Tax returns The cumulative deduction of income tax has meant that, in the past, fewer than 10% of the adult population have filled in tax returns each year, with tax returns concentrated on those with higher incomes and a greater probability of multiple income sources. In 1996–97, the UK began a move towards greater self-assessment, with 9 million tax returns being issued in that first year, covering almost 20% of the adult population. Under the new system, taxpayers can send their returns back to the Inland Revenue by 30 September each year, for the Revenue to calculate the tax owed (given the information on income sources and expenditure provided by the taxpayer). Alternatively, for those wanting to calculate their own tax bills, the deadline is the following 31 January, which is also the deadline for payment of the tax. Fixed penalties and surcharges operate for those failing to make their returns by the deadlines or for underpayment of tax.
The new system indicates a shift in the responsibilities of individual taxpayers, who are expected to calculate the tax owed based on information they have provided (for those filing in January) and to remember to pay on the appropriate dates. It is not clear whether the compliance costs of the new approach will be greater, because of the greater numbers filing returns and the increased responsibilities, or less, because of a certain amount of unification in the assessment of different types of income.
3.2. National Insurance Payment of National Insurance contributions entitles individuals to receipt of certain social security benefits. In practice, payments from and receipts into the fund bear little relation to each other for any individual contributor. In the National Insurance system, current contributions finance current benefits, with the fund merely being a device to prevent cash-flow problems. Officially, the fund should not fall below one-sixth of National Insurance expenditure. Historically, this has been achieved through a grant from central taxation, although during the mid-1980s the high level of economic

7
activity expanded contribution levels, resulting in the grant being abolished in 1990. The subsequent recession reduced contributions and raised the costs of benefits so that the grant had to be reintroduced in 1993–94. It subsequently declined and the fund is now in surplus.
In 2000–01, National Insurance contributions are forecast to raise some £58.8 billion, of which the vast majority is raised by Class 1 contributions. Class 1 contributions are paid by two groups: employees as a tax on their earnings and employers as secondary contributions on those they employ. Since 1975, Class 1 contributions for both employers and employees have been earnings-related, subject to an earnings floor called the lower earnings limit (LEL). Employees only pay National Insurance contributions if their weekly earnings exceed the primary threshold (PT), which in 2000–01 is £76. Those earning above the PT pay a rate of 10% on earnings between the PT and the upper earnings limit (UEL), of £535 in 2000–01. For income above the UEL, no employee contributions are paid. Employers also pay National Insurance contributions for each employee who earns over £84 per week (equal to the income level at which income tax starts to be paid, which is known as the secondary threshold (ST)). Above that level, they pay National Insurance at a rate of 12.2% on the difference between earnings and the ST. Table 5 summarises the Class 1 contribution structure for 2000–01.
Table 5: National Insurance contribution (NIC) rates, 2000–01
Employee NICs Employer NICs Total weekly earnings (£)
Standard rate
Contracted-out rate
Standard rate
Contracted-out rate
<67 (LEL) 0 0 0 0 67–76 (PT) 0 0 0 0 76–84 (ST) 10 8.4 0 0 84–535 (UEL) 10 8.4 12.2 9.2 >535 0 0 12.2 9.2
Notes: Rates shown are marginal rates, and hence apply to the amount of weekly earnings within each range. From April 2001, the PT and the ST will be equalised at £87 and the UEL will increase to £575. Contracted-out rate applies to defined benefit pension schemes, i.e. Contracted-Out Salary-Related Schemes (COSRSs). The rates applying to defined contribution pension schemes — i.e. Contracted-Out Money-Purchase Schemes (COMPSs) — vary according to age.
Source: HM Treasury, Financial Statement and Budget Report, 2000 (http://www.hm-treasury.gov.uk/budget2000/fsbr/contents.htm).
National Insurance contributions are lower for those who have contracted out of the State Earnings-Related Pension Scheme (SERPS) and instead belong to a recognised pension scheme. The reduction depends on the type of pension scheme that an individual has joined. For defined benefit pensions, the percentage levied on earnings between the LEL and the UEL is currently reduced by 1.6 percentage points for employee contributions and by 3 percentage points for employer contributions. The equivalent rebates for those who have opted out into a defined contribution pension depend on their age.
The self-employed pay two different classes of National Insurance contributions — Class 2 and Class 4. Class 2 contributions are paid at a flat rate which for 2000–01 is

8
£2.00 per week. They are paid by those whose income exceeds a small earnings exception, currently £3,825 p.a. Class 4 contributions are payable by self-employed individuals whose profits exceed the lower profits limit, which for 2000–01 is £4,385 p.a. Class 4 contributions are a proportionate profits tax of 7% on that part of profits above the lower profits limit and below the upper profits limit, which for 2000–01 is £27,820 p.a. No further contributions are paid on profits above the upper profits limit.
Class 3 National Insurance contributions are voluntary and are usually made by UK citizens living abroad in order to maintain their entitlement to benefits when they return. Class 3 contributions are £6.55 per week for 2000–01.
3.3. Value added tax (VAT) The standard rate of value added tax in the UK is 17.5%, although since 1994–95 there has also been a reduced rate imposed on domestic fuel, originally 8% but now Table 6: Estimated costs of zero-rated, reduced-rated and exempt goods and services for VAT revenues, 1999–00 Estimated cost (£m) Zero-rated Food Construction of new dwellingsa
Domestic passenger transport International passenger transport Books, newspapers and magazines Children’s clothing Water and sewerage services Drugs and medicines on prescription Supplies to charitiesa
Ships and aircraft above a certain size Vehicles and other supplies to people with disabilities
Reduced-rated Domestic fuel and power Women’s sanitary productsb
VAT-exempt Rent on domestic dwellingsa
Rent on commercial propertiesa
Private education Health servicesa
Postal services Burial and cremation Finance and insurancea
Betting, gaming and lottery Businesses with low turnover
Total
7,800 2,750 1,750 1,800 1,300 1,100
950 650 150 350 200
1,800
35c
2,650 1,650
900 550 400 100 100 900 100
27,950
a Figures for these categories are particularly tentative and subject to a wide margin of error. b From 1 January 2001, women’s sanitary products will be charged VAT at the reduced rate. c Figure for 2001–02.
Source: HM Customs and Excise Annual Report 1998–99.

9
5%. Various categories of goods are either zero-rated or exempt. Zero-rated goods have no VAT levied upon the final good or upon the inputs used in its creation. Exempt goods have no VAT levied on the final good sold to the consumer, but firms cannot reclaim the VAT paid on inputs; thus exempt goods are effectively liable to lower rates of VAT (roughly between 4% and 7% depending upon the firm’s cost structure and the nature of suppliers). Approximately 56% of consumers’ expenditure is taxable at the standard rate and 3% is taxable at the reduced rate. The remaining expenditure is on zero-rated and VAT-exempt items. Table 6 lists the main categories of goods that are zero-rated, exempt and reduced-rated, together with estimates of the revenue forgone by not taxing them at the standard rate.
3.4. Other indirect taxes Excise duties Excise duties are flat-rate taxes (per pint, per litre, per packet etc.) levied upon five major goods: beer, wine, spirits, tobacco and petrol/diesel. Tobacco products are subject to an additional ad valorem tax of 22% on the total retail price, which includes the flat-rate duty and VAT. Since these duties are expressed in cash terms, they must be revalorised (i.e. increased in line with inflation) each year in order to maintain their real value. Table 7 shows the rates of duties levied in 2000–01.2
Table 7: Excise duties, 2000–01 (April 2000 prices)
Good Duty (pence)
Total duty as a
percentage of price (%)
Total tax as a
percentage of price (%)a
Packet of 20 cigarettes: specific duty ad valorem (22% of retail price) Pint of beer Wine (75cl bottle) Spirits (70cl bottle) Petrol (litre) Unleaded petrol (litre) Diesel (litre)
181 87
26
116 548 51 49 49
70.7
14.4 35.5 44.6 70.3 74.8 73.6
88.2
29.3 50.4 59.5 85.2 89.7 88.5
a Includes VAT.
Source: HM Customs and Excise Annual Report 1998–99; retail price index was used to uprate to April 2000 prices.
Vehicle excise duty In addition to VAT and excise duties, revenue is raised through a system of licences. The main licence is vehicle excise duty (VED), which is levied annually at £155 per car, with higher duties for commercial vehicles. A reduced rate of £100 for small cars with engines up to 1,100cc has operated since 1 June 1990, and from 1 March 2001 the reduced rate will be extended to 1,200cc. In March 2001, a system of VED for
2 For more information on the taxation of petrol, see, for example, Z. Smith, The Petrol Tax Debate, IFS Briefing Note no. 8, 2000 (http://www.ifs.org.uk/consume/petrol.pdf).

10
new cars, based primarily on their carbon dioxide emission rates, will be introduced. In 2000–01, VED is estimated to raise about £4.9 billion.
Insurance premium tax Insurance premium tax came into effect in October 1994 and applies to most general insurance where the risk insured is located in the UK (e.g. motor, household, medical, income replacement and travel insurance). It is designed to act as a proxy for VAT, which is not levied directly on financial services such as insurance because of difficulties in implementation. From 1 July 1999, the tax is levied at a standard rate of 5% of the gross premium, and it is forecast to raise around £1.6 billion in 2000–01. Long-term insurance, such as life insurance, is exempt. If, however, a policy is sold as an add-on to another product (e.g. travel insurance when buying a holiday, or mechanical breakdown insurance sold by suppliers of vehicles and domestic appliances), then insurance premium tax is paid at a higher rate of 17.5%. This measure was designed to prevent insurance providers from inflating the value of the insurance element (subject to insurance premium tax at 5%) at the expense of the good or service element (subject to VAT at 17.5%).
Air passenger duty On 1 November 1994, an excise duty on air travel from UK airports came into effect. Called air passenger duty, passengers are charged £10 for flights to UK and European Union destinations and £20 elsewhere. From 1 April 2001, air passenger duty on economy flights within the EU will be halved from £10 to £5, and flights from the Scottish Highlands and Islands will be removed from duty. The rates for those travelling first or club class will remain at £10 for destinations in the EU and will rise from £20 to £40 to other destinations. In 2000–01, air passenger duty is estimated to raise £1 billion.
Landfill tax On 1 October 1996, the landfill tax was introduced. This environmental tax is levied at two rates: £2 per tonne for inactive waste, which does not decay or contaminate land, and a standard rate of £11 per tonne for all other waste. It has been announced that the standard rate will increase by £1 per tonne per year from 1 April 2000 until 1 April 2004, when the government’s waste strategy will be subject to further review.
Climate change levy The climate change levy will come into effect on 1 April 2001. The levy will be charged on industrial and commercial use of electricity, coal, natural gas and liquified petroleum gas, and the tax rate will vary according to the type of fuel used. The levy is designed to help the UK move towards the government’s domestic goal of a 20% reduction in carbon dioxide emissions between 1990 and 2010. Energy-intensive sectors which have concluded climate change agreements that meet the government’s criteria will be charged a reduced rate of climate change levy. This rate is equivalent to 20% of the standard rate. The levy is forecast to raise around £1 billion in 2001–02.
Betting and gaming duties General betting duty is a duty levied on the total money staked on off-course bets made with a bookmaker or the Horserace Totalisator Board (the Tote). The duty is paid by the bookmaker or the Tote and is due when the bet is made, not when the
11
result of the bet is known. The current rate of duty is 6.75%. Pool betting is liable to pool betting duty at the current rate of 17.5%.
Gaming duty, which replaced gaming licence (premises) duty on 1 October 1997, is based on the ‘gross gaming yield’ for each establishment where dutiable gaming takes place. This consists of the total value of the stakes, minus players’ winnings, on games in which the house is the banker, and participation charges, or ‘table money’, exclusive of VAT, on games in which the bank is shared by players. Gaming duty is levied at marginal rates of between 2.5% and 40% according to the amount of gross gaming yield.
Duties on betting and gaming raise around £1.4 billion a year.
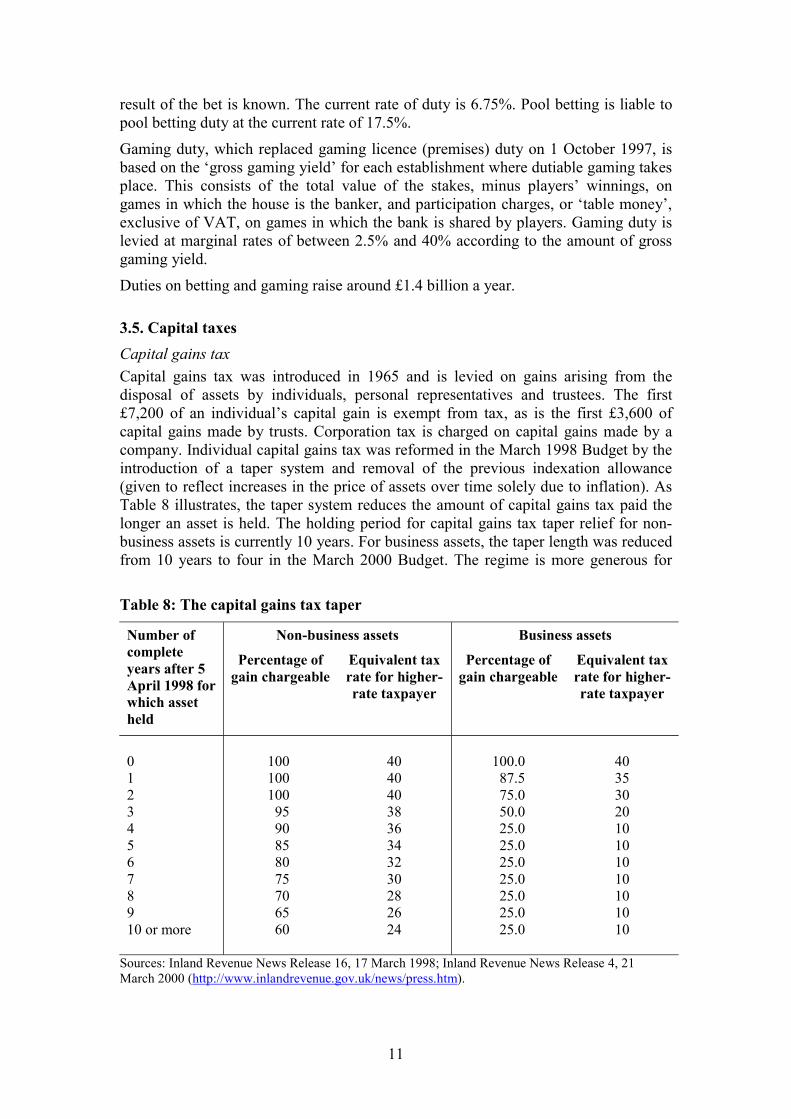
3.5. Capital taxes Capital gains tax Capital gains tax was introduced in 1965 and is levied on gains arising from the disposal of assets by individuals, personal representatives and trustees. The first £7,200 of an individual’s capital gain is exempt from tax, as is the first £3,600 of capital gains made by trusts. Corporation tax is charged on capital gains made by a company. Individual capital gains tax was reformed in the March 1998 Budget by the introduction of a taper system and removal of the previous indexation allowance (given to reflect increases in the price of assets over time solely due to inflation). As Table 8 illustrates, the taper system reduces the amount of capital gains tax paid the longer an asset is held. The holding period for capital gains tax taper relief for non-business assets is currently 10 years. For business assets, the taper length was reduced from 10 years to four in the March 2000 Budget. The regime is more generous for
Table 8: The capital gains tax taper
Non-business assets Business assets Number of complete years after 5 April 1998 for which asset held
Percentage of gain chargeable
Equivalent tax rate for higher-rate taxpayer
Percentage of gain chargeable
Equivalent tax rate for higher-rate taxpayer
0 1 2 3 4 5 6 7 8 9 10 or more
100 100 100
95 90 85 80 75 70 65 60
40 40 40 38 36 34 32 30 28 26 24
100.0 87.5 75.0 50.0 25.0 25.0 25.0 25.0 25.0 25.0 25.0
40 35 30 20 10 10 10 10 10 10 10
Sources: Inland Revenue News Release 16, 17 March 1998; Inland Revenue News Release 4, 21 March 2000 (http://www.inlandrevenue.gov.uk/news/press.htm).

12
business assets (i.e. assets that are used wholly or partly for trading purposes, or shares and securities in a company) than for non-business assets.
Relief from capital gains tax is available for certain types of investment, including investment in business assets, venture capital and investments through the Enterprise Investment Scheme. In addition, some consecutive short-term investments, where the gains are reinvested, can be treated as a single long-term investment for the purposes of taper relief.
It is estimated that in 2000–01 capital gains tax will raise £3.4 billion in revenue. Although this represents only a small proportion of total government receipts, capital gains tax is potentially important as an anti-avoidance measure, for it discourages wealthier individuals from converting a large part of their income into capital gains in order to reduce their tax liability. It is estimated that in 1997–98 there were 172,000 people paying capital gains tax, of whom approximately 144,000 were individuals and 28,000 trustees.
Inheritance tax Inheritance tax was introduced in 1986 and replaced capital transfer tax. The tax is applied to transfers of wealth on or shortly before death that exceed a minimum threshold (£234,000 in 2000–01). The tax is charged at a single rate of 40% on the amount above the threshold for transfers on death, with reductions in this rate if the transfer occurred during the seven-year period before the death of the donor. These reductions for lifetime transfers are shown in Table 9. If the transfer occurred at least seven years before the donor’s death, there is no inheritance tax to be paid. Certain transfers of wealth are exempt from inheritance tax, mainly those between spouses, to charities and to political parties. Certain assets, particularly those associated with farms and small businesses, are eligible for relief. The relief reduces the value of the asset by 50% or 100% according to the type of property transferred, and tax is assessed on the reduced value. The estimated number of taxpaying death estates in 1999–00 was about 19,500, equivalent to around 3% of all deaths. The estimated yield from inheritance tax in 2000–01 is about £2.3 billion.
Table 9: Inheritance tax reductions for transfers before death
Years between transfer and death Reduction in tax rate (%) Actual tax rate (%)
0–3 3–4 4–5 5–6 6–7
0
20 40 60 80
40 32 24 16 8
Source: Tolley’s Inheritance Tax, 1999–00.
Stamp duty Stamp duty is payable on many legal and commercial documents and its payment is indicated by stamps put on the documents following their presentation to the Stamp Office, unless an arrangement operates whereby the document has a printed indication of the amount of duty payable. The main stamp duties are levied on stock and share transactions and on conveyances and transfers of land and property. For land and property transactions, there is a threshold of £60,000 below which no stamp duty is

13
paid. The scale of rates applied to properties priced above £60,000 from March 2000 is given in Table 10. Each rate of duty applies to the whole purchase price, including the part below the threshold. For stocks and shares, there is no threshold and stamp duty is levied at 0.5% on the price of the shares. Stamp duties (including stamp duty reserve tax — see below) are forecast to raise £7.2 billion in 2000–01. In 1998–99, out of total stamp duties revenue of £4.6 billion, about £2.1 billion was raised from sales of land and property and the remaining £2.5 billion from sales of stocks and shares (the bulk of which came from stamp duty reserve tax).
Table 10: Rates of stamp duty, 2000–01
Transaction Rate (%)
Land and buildings Up to £60,000 £60,000–£250,000 £250,000–£500,000 Above £500,000 Stocks and shares
0 1 3 4
0.5
Source: Inland Revenue Press Release 5, 21 March 2000 (http://www.inlandrevenue.gov.uk/news/press.htm).
Stamp duty reserve tax Stamp duty reserve tax (SDRT) was introduced in 1986 and applies to certain transactions in securities that are not liable to stamp duty because there is no physical transfer of ownership, such as the sale of shares held in electronic accounts. In addition, SDRT also applies to the purchase of securities registered in the name of a nominee who acts for both buyer and seller, as well as to the purchase of securities that are resold before they are transferred to the buyer.
3.6. Corporation tax Corporation tax is charged on profits made by UK resident companies, public corporations and unincorporated associations. The profit on which corporation tax is charged is comprised of income from trading and/or investments and capital gains. If a company makes a trading loss, then the loss can be carried back for one year to be set against profits in that period or it may be carried forward indefinitely. The standard rate of corporation tax is currently 30%, and there is a reduced rate of 20% for companies with profits of less than £300,000. For firms with profits between £300,000 and £1,500,000, a system of relief operates, such that an effective marginal rate of 32.5% is levied on profits in excess of £300,000. This acts to increase the average tax rate gradually until it reaches 30%. On 1 April 2000, a new rate of 10% on profits up to £10,000 and an effective marginal rate of 22.5% on profits between £10,000 and £50,000 were introduced. Table 11 presents marginal and average corporation tax rates.
Prior to April 1999, a firm had to make a payment of advance corporation tax (ACT) when it distributed profits to its shareholders in the form of dividends. This could usually then be deducted from the total corporation tax payment. The March 1998

14
Budget announced the abolition of ACT from April 1999 and the introduction of a new payment system for larger companies.3 Under the new scheme, large companies pay their corporation tax in four equal quarterly instalments on the basis of their anticipated liabilities for the accounting period, making the first payment six months into the accounting period. Small and medium-sized companies follow a different payment schedule, paying all of their tax nine months after the end of the accounting period.
Table 11: Rates of corporation tax, 2000–01
Profits (£ p.a.) Marginal tax rate (%) Average tax rate (%)
<10,000 10,001–50,000 50,001–300,000 300,001–1,500,000 >1,500,000
10
22.5 20
32.5 30
10
10–20 20
20–30 30
Relief against corporation tax is given for the depreciation of capital assets. Capital allowances may be claimed in the year that they accrue and any unused capital allowances can be set against future profits or carried back for up to three years. Different classes of capital expenditure reduce taxable profits in different ways. Expenditure on plant and machinery is depreciated on a 25% declining-balance basis, while expenditure on industrial buildings, hotels and some other commercial buildings is depreciated on a straight-line basis of 4% per year.4 In addition, first-year allowances are available for expenditure on plant and machinery by small and medium-sized enterprises at 40%.
It is estimated that corporation tax will raise approximately £33.8 billion in 2000–01.
3.7. Taxation of oil production Petroleum revenue tax Companies involved in the extraction of oil and gas from the UK and its continental shelf (mainly the North Sea) are liable to petroleum revenue tax (PRT) as well as corporation tax. PRT is assessed every six months for each separate oil and gas field and then charged on the cash flow arising in each chargeable period. Since July 1993, the tax rate has been 50% on existing fields, but new fields have been exempt since 15 March 1993. Petroleum revenue tax is forecast to raise £1.2 billion in 2000–01.
Corporation tax The corporation tax regime for companies that operate in the North Sea allows any petroleum revenue tax liability as a deduction against chargeable profits. However,
3 A transitional system operates for companies with surplus ACT (i.e. that ACT not yet offset against profits). 4 The declining-balance method means that for each £100 of investment, £25 is written off in the first year, £18.75 is written off in the second year (25% of the remaining balance of £75) and so on. The straight-line method simply writes off £4 per year for 25 years for each £100 of investment.

15
there are special rules preventing profits from oil and gas production being reduced by losses transferred from other activities. Thus North Sea profits are ‘ring-fenced’ for corporation tax purposes.
Royalties In addition to petroleum revenue tax and corporation tax, royalties are also charged on North Sea oil. They are levied at 12.5% of the value of production less the cost of initial transportation and treatment, for fields approved before 1 April 1982. Royalties payments can be deducted from profits liable to PRT and corporation tax.
3.8. Council tax On 1 April 1993, the community charge system of local taxation, or poll tax, was replaced by the council tax, which is largely a property-based tax rather than an individual-based tax. Properties are banded according to an assessment of their market value (as at 1 April 1991), with local authorities individually determining the rate levels levied on these bands. Table 12 shows the value bands and the distribution of dwellings in England. There are, however, a range of exemptions and reliefs available. For example, there are reductions in the council tax bill for properties with only one resident adult (25% reduction) or if the property is empty (50% reduction).5 Properties that are exempt from council tax include student halls of residence and armed forces barracks. The council tax is estimated to raise some £13.6 billion in 2000–01, providing approximately 20% of local authority revenue.
Table 12: Value bands for England
Band Tax rate relative to band D
England Distribution of dwellings by
band(%) A B C D E F G H
2/3 7/9 8/9 1
12/9 14/9 12/3 2
Up to £40,000
£40,000 to £52,000 £52,000 to £68,000 £68,000 to £88,000
£88,000 to £120,000 £120,000 to £160,000 £160,000 to £320,000
Above £320,000
26.4 19.4 21.6 14.7 9.1 4.8 3.5 0.5
Sources: C. Farrington and M. Lee, Council Tax: Your Guide, IRRV, London, 1993; Department of the Environment, Transport and the Regions (http://www.local.detr.gov.uk/finance/stats/lgfs/chapter5.pdf).
3.9. National non-domestic rates Non-domestic rates, or business rates, were transferred from local control to national control in 1990. Companies pay a tax bill based on the national uniform rate poundage multiplied by the rateable value of the properties they occupy. The rateable value is an official estimate of the market rent for the property. Hence the tax bills paid by businesses with properties of similar value should be the same wherever they 5 For example, if the property is a second home. Some empty properties are entirely exempt from council tax, e.g. those left empty by patients in hospitals and care homes.
16
are located. Business properties are revalued every five years, with the next revaluation scheduled to take place in 2005. Major changes in rate bills resulting from revaluation are generally phased in through a transitional relief scheme. Such schemes operated for the 1990, 1995 and 2000 revaluations. In addition, some types of property qualify for reductions, e.g. unoccupied buildings, small rural shops, and agricultural land and associated buildings. National non-domestic rates are expected to raise £16.2 billion in 2000–01.
4. Summary of recent trends
4.1. How did we get here? In the earlier sections of this paper, we have concentrated on the tax system in the UK as it is now; in this section, we move to a discussion of how it has developed in the last 21 years. We attempt to describe and assess the main trends, taking each major part of the tax system in turn. We begin with a summary of the main changes and a description of the shifting balance of revenue.
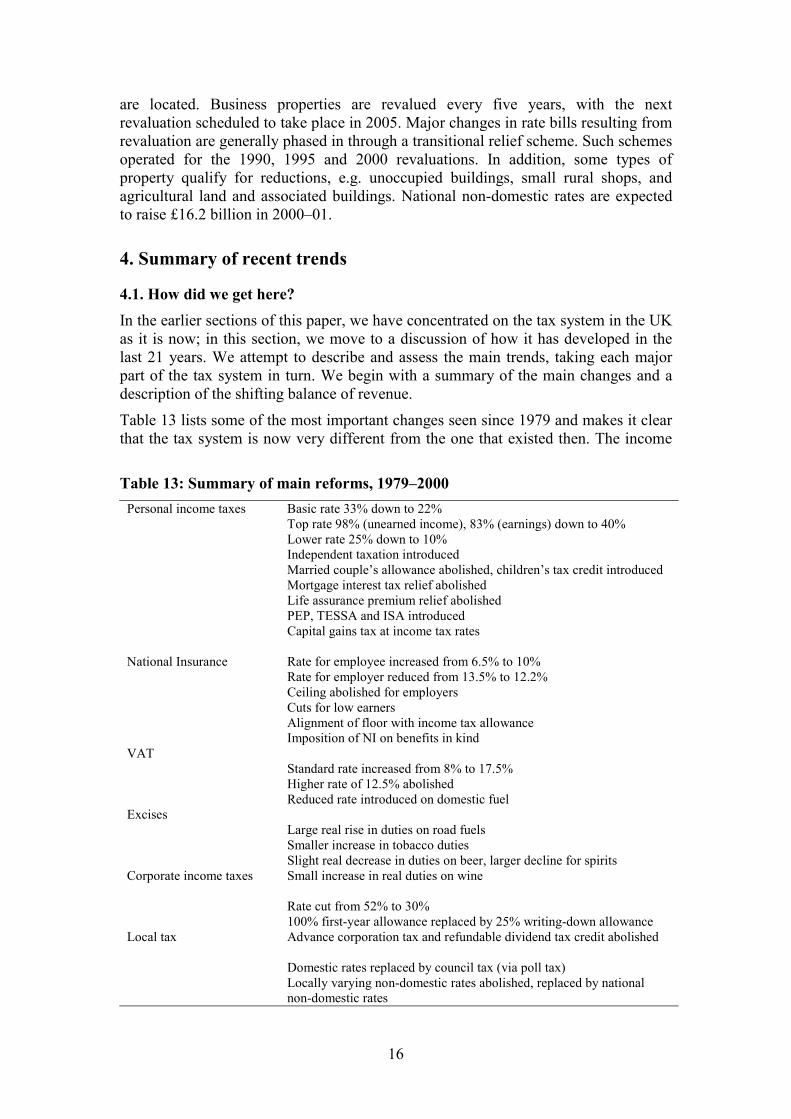
Table 13 lists some of the most important changes seen since 1979 and makes it clear that the tax system is now very different from the one that existed then. The income
Table 13: Summary of main reforms, 1979–2000 Personal income taxes National Insurance VAT Excises Corporate income taxes Local tax
Basic rate 33% down to 22% Top rate 98% (unearned income), 83% (earnings) down to 40% Lower rate 25% down to 10% Independent taxation introduced Married couple’s allowance abolished, children’s tax credit introduced Mortgage interest tax relief abolished Life assurance premium relief abolished PEP, TESSA and ISA introduced Capital gains tax at income tax rates Rate for employee increased from 6.5% to 10% Rate for employer reduced from 13.5% to 12.2% Ceiling abolished for employers Cuts for low earners Alignment of floor with income tax allowance Imposition of NI on benefits in kind Standard rate increased from 8% to 17.5% Higher rate of 12.5% abolished Reduced rate introduced on domestic fuel Large real rise in duties on road fuels Smaller increase in tobacco duties Slight real decrease in duties on beer, larger decline for spirits Small increase in real duties on wine Rate cut from 52% to 30% 100% first-year allowance replaced by 25% writing-down allowance Advance corporation tax and refundable dividend tax credit abolished Domestic rates replaced by council tax (via poll tax) Locally varying non-domestic rates abolished, replaced by national non-domestic rates
17
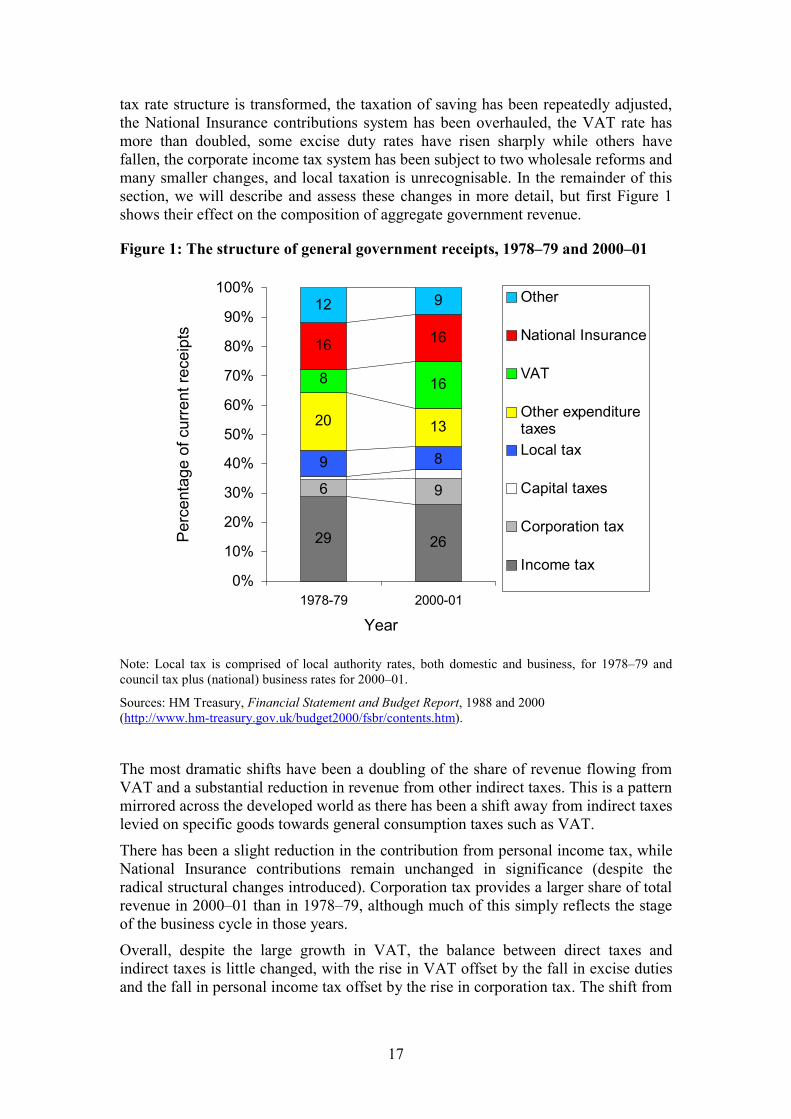
tax rate structure is transformed, the taxation of saving has been repeatedly adjusted, the National Insurance contributions system has been overhauled, the VAT rate has more than doubled, some excise duty rates have risen sharply while others have fallen, the corporate income tax system has been subject to two wholesale reforms and many smaller changes, and local taxation is unrecognisable. In the remainder of this section, we will describe and assess these changes in more detail, but first Figure 1 shows their effect on the composition of aggregate government revenue.
Figure 1: The structure of general government receipts, 1978–79 and 2000–01
29 26
9
9
8 16
16 16
12 9
6
8
1320
0%
10%
20%
30%
40%
50%
60%
70%
80%
90%
100%
1978-79 2000-01
Year
Perc
enta
ge o
f cur
rent
rece
ipts
Other
National Insurance
VAT
Other expendituretaxesLocal tax
Capital taxes
Corporation tax
Income tax
Note: Local tax is comprised of local authority rates, both domestic and business, for 1978–79 and council tax plus (national) business rates for 2000–01.
Sources: HM Treasury, Financial Statement and Budget Report, 1988 and 2000 (http://www.hm-treasury.gov.uk/budget2000/fsbr/contents.htm).
The most dramatic shifts have been a doubling of the share of revenue flowing from VAT and a substantial reduction in revenue from other indirect taxes. This is a pattern mirrored across the developed world as there has been a shift away from indirect taxes levied on specific goods towards general consumption taxes such as VAT.
There has been a slight reduction in the contribution from personal income tax, while National Insurance contributions remain unchanged in significance (despite the radical structural changes introduced). Corporation tax provides a larger share of total revenue in 2000–01 than in 1978–79, although much of this simply reflects the stage of the business cycle in those years.
Overall, despite the large growth in VAT, the balance between direct taxes and indirect taxes is little changed, with the rise in VAT offset by the fall in excise duties and the fall in personal income tax offset by the rise in corporation tax. The shift from

18
direct to indirect tax, which was central to the declared strategy of the 1979–97 Conservative government, seems not to have been achieved.
4.2. Personal income taxes Income tax rate structure There are two principal personal income taxes in the UK: income tax and National Insurance contributions. Capital gains tax, which has existed as a tax separate from income tax since 1965, can also be thought of as a tax on personal income, but it supplies very little revenue compared with income tax or National Insurance (see Table 1).
The most dramatic change to income tax has been the reform of the rate structure, as illustrated in Table 14. In 1978–79, there were a lower rate of 25%, a basic rate of 33% and higher rates ranging from 40% to 83%. In addition, an investment income surcharge of 15% was applied to those with very high investment income, leading to a maximum income tax rate of 98%. In its first Budget, in 1979, the Conservative government reduced the basic rate of income tax to 30% and the top rate on earnings to 60%. In 1980, the lower rate was abolished; in 1984, the investment income surcharge was abolished; and through the mid-1980s, the basic rate of tax was reduced. In 1988, the top rate of tax was cut to 40% and the basic rate to 25%, producing a very simple regime with three effective rates — zero up to the tax allowance, 25% over a range that covered almost 95% of taxpayers and 40% for a small group of those with high incomes.
Table 14: Income tax rates on earned income, 1978–2001
Fiscal years Lower rate Basic rate Higher rates
1978–79 1979–80 1980–81 to 1985–86 1986–87 1987–88 1988–89 to 1991–92 1992–93 to 1995–96 1996–97 1997–98 to 1998–99 1999–00 2000–01
25 25 — — — — 20 20 20 10 10
33 30 30 29 27 25 25 24 23 23 22
40–83 40–60 40–60 40–60 40–60
40 40 40 40 40 40
Note: Prior to 1983–84, an investment income surcharge of 15% was applied to unearned income over £2,250 (1978–79), £5,000 (1979–80), £5,500 (1980–82), £6,250 (1982–83) and £7,100 (1983–84).
Sources: Various Tolley’s Income Tax.
This very simple rate structure was complicated by the reintroduction of a lower rate of tax in 1992 in a pre-election Budget, followed by a further reduction in the lower rate to 10% in 1999 in fulfilment of a pre-election promise made by the Labour Party.
Table 15 gives the number of people affected by these various tax rates. In 1999–00, out of an adult population in the UK of over 40 million, an estimated 26.2 million individuals paid income tax. This is a reminder that attempts to use income tax

19
reductions to help the poorest in the country are likely to fail, since only two-thirds of the adult population have high enough incomes to pay income tax anyway. The total number of income taxpayers has remained fairly constant, but the number of higher-rate taxpayers has grown substantially, from less than 3% of the taxpaying population in 1979–80 to nearly 10% now. Some of this growth reflects periods when the point at which higher-rate tax is due has not been raised in line with price inflation, some reflects the fact that incomes on average have grown more quickly than prices, and some the fact that the dispersion of incomes has grown over the period, with especially rapid increases in the incomes of those already towards the top of the income distribution, pushing more of them into higher-rate income tax liability. Table 16 shows that, over the period as a whole, the basic-rate limit, beyond which higher-rate tax becomes due, has failed to keep pace with price inflation, whilst the personal allowance has risen in real terms, especially in the mid-1980s.
Table 15: Number of income taxpayers (in thousands)
Year Number of individuals paying tax
Number of lower-rate taxpayers
Number of basic-rate taxpayers
Number of higher-rate taxpayers
1979–80 25,900 — a 25,226 a 674 1984–85 23,800 — 22,870 930 1989–90 25,600 — 24,040 1,560 1994–95 25,300 5,180 18,170 2,000 1998–99 26,700 7,300 17,200 2,200 1999–00b
26,200 3,200c 20,800 2,300
a Figure for 1979–80 covers both lower-rate and basic-rate taxpayers. b Provisional. c Includes savings rate taxpayers (those whose only income above the lower rate limit is from either savings or dividends).
Sources: Inland Revenue Statistics, 1990, 1995 and 1999 (http://www.inlandrevenue.gov.uk/stats/index.htm).
Table 16: Personal allowance and basic-rate limit in real terms (1999 prices)
Year Personal allowance (£ p.a.) Basic-rate limit (£ p.a.)
1979–80 1984–85 1989–90 1994–95 1999–00
3,398 3,718 3,999 3,954 4,385
29,171 28,556 29,720 27,203 28,400
Note: 1990 marked the introduction of independent taxation. Prior to that date, the personal allowance was known as the single person’s allowance. For a complete series of allowances in nominal terms, see http://www.ifs.org.uk/taxsystem/personaltime.shtml.
Sources: Various Tolley’s Income Tax; Monthly Digest of Statistics, June 2000.
20
The number of lower-rate taxpayers climbed in the years after 1992 as the width of the lower-rate band was increased, but fell sharply in 1999–00 as the new 10% rate applies over a much narrower range of income than the 20% rate that it replaced.
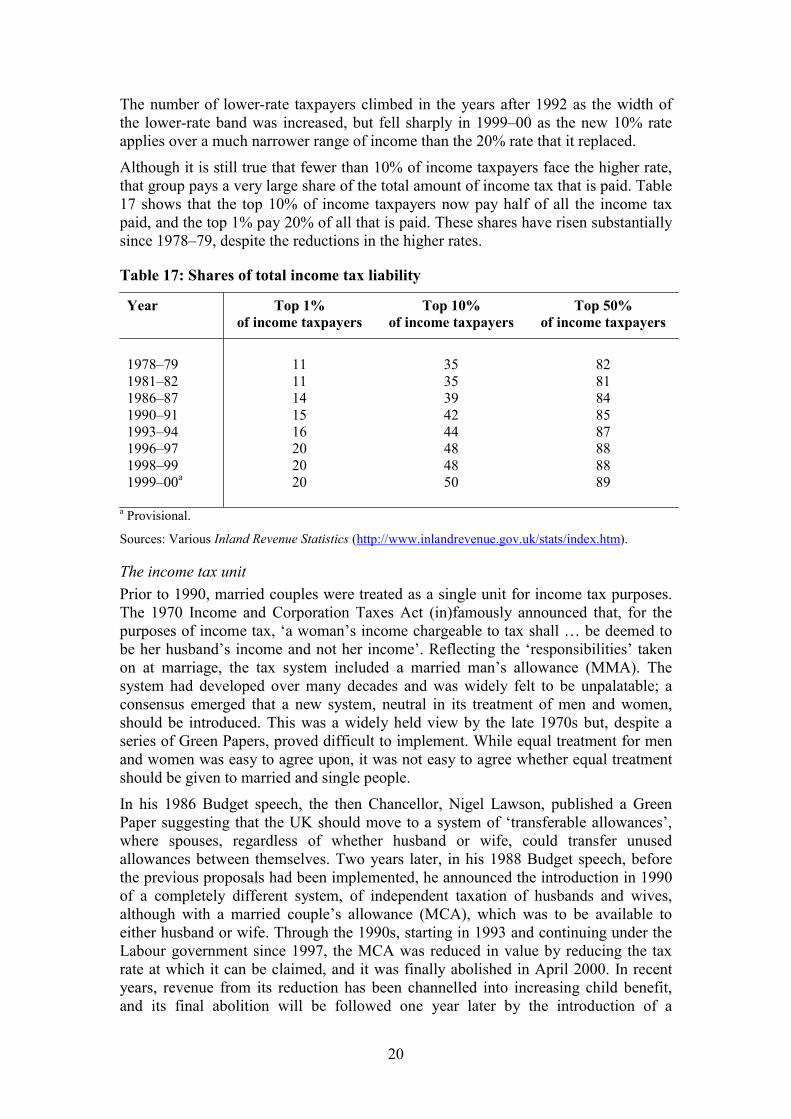
Although it is still true that fewer than 10% of income taxpayers face the higher rate, that group pays a very large share of the total amount of income tax that is paid. Table 17 shows that the top 10% of income taxpayers now pay half of all the income tax paid, and the top 1% pay 20% of all that is paid. These shares have risen substantially since 1978–79, despite the reductions in the higher rates.
Table 17: Shares of total income tax liability
Year Top 1% of income taxpayers
Top 10% of income taxpayers
Top 50% of income taxpayers
1978–79 1981–82 1986–87 1990–91 1993–94 1996–97 1998–99 1999–00a
11 11 14 15 16 20 20 20
35 35 39 42 44 48 48 50
82 81 84 85 87 88 88 89
a Provisional.
Sources: Various Inland Revenue Statistics (http://www.inlandrevenue.gov.uk/stats/index.htm).
The income tax unit Prior to 1990, married couples were treated as a single unit for income tax purposes. The 1970 Income and Corporation Taxes Act (in)famously announced that, for the purposes of income tax, ‘a woman’s income chargeable to tax shall … be deemed to be her husband’s income and not her income’. Reflecting the ‘responsibilities’ taken on at marriage, the tax system included a married man’s allowance (MMA). The system had developed over many decades and was widely felt to be unpalatable; a consensus emerged that a new system, neutral in its treatment of men and women, should be introduced. This was a widely held view by the late 1970s but, despite a series of Green Papers, proved difficult to implement. While equal treatment for men and women was easy to agree upon, it was not easy to agree whether equal treatment should be given to married and single people.
In his 1986 Budget speech, the then Chancellor, Nigel Lawson, published a Green Paper suggesting that the UK should move to a system of ‘transferable allowances’, where spouses, regardless of whether husband or wife, could transfer unused allowances between themselves. Two years later, in his 1988 Budget speech, before the previous proposals had been implemented, he announced the introduction in 1990 of a completely different system, of independent taxation of husbands and wives, although with a married couple’s allowance (MCA), which was to be available to either husband or wife. Through the 1990s, starting in 1993 and continuing under the Labour government since 1997, the MCA was reduced in value by reducing the tax rate at which it can be claimed, and it was finally abolished in April 2000. In recent years, revenue from its reduction has been channelled into increasing child benefit, and its final abolition will be followed one year later by the introduction of a

21
children’s tax credit (CTC), which will provide support for children directly through the tax system. Over a period of a little more than a decade, the UK will have moved from a system that provided financial support to married people to one that provides financial support to those with children.
4.3. Taxation of saving The last 21 years have seen a significant reduction in the extent to which the tax system distorts the return on different savings vehicles. There are three obvious reasons for this. First, one of the most difficult areas in the taxation of saving is the treatment of inflation, and at the levels of inflation seen during the 1970s, and even the 1980s, the distortions created by varying treatment of inflation were very large indeed. At the inflation rates seen in the last decade, this is a far less severe problem, and if rates remain close to the 2.5% target, it will become an even smaller issue. Second, the dispersion of tax rates has fallen, especially in income tax. If a particular form of saving attracted tax relief at, say, 83%, its underlying performance could be quite poor and yet it could still provide an attractive return. As the number of rates of tax has fallen and the highest rates have come down, the distortion caused in the taxation of different savings forms has also fallen. Third, there have been a series of reforms that have reduced the tax advantage of previously highly tax-privileged savings, and others that have removed tax disadvantages of other forms of savings, leading to a general levelling of the tax treatment of saving.
The two most significant tax increases were the abolition of life assurance premium relief in 1984, which had given income tax relief on savings in the form of life assurance, and the steady reduction and final abolition of mortgage interest tax relief (MITR). Until 1974, MITR was available on any size of loan, but in that year a ceiling of £25,000 was imposed. In 1983, this ceiling was increased to £30,000, which was not enough to account for general price inflation and much too little to account for house price inflation. That limit has not increased since 1983, steadily reducing its effective level. From 1991, this erosion of the real value of MITR has been accelerated by restricting the tax rate at which relief could be claimed, to the basic rate of tax in 1991 (25%), 20% in 1994, 15% in 1995 and 10% in 1998, with the eventual abolition of the relief in April 2000.
The main extension of relatively tax-favoured saving came in 1988 with the introduction of personal pensions, which allowed the same tax treatment for individual-based pensions as had been available for employer-based occupational pensions (tax relief on contributions, no tax on fund income, tax on withdrawals apart from a lump sum not exceeding 25% of the accumulated fund). The other main extensions were the Personal Equity Plan (PEP) and the Tax-Exempt Special Savings Account (TESSA) introduced in 1987 and 1991 respectively. The PEP was originally a vehicle for direct holding of equities, but it was reformed to allow holdings of pooled investments such as unit trusts. The TESSA was a vehicle for holding interest-bearing savings accounts. Both PEP and TESSA benefited from almost the reverse tax treatment to that of pensions: saving into a PEP or TESSA was not given any tax relief, there was no tax on income or gains within the fund and there was no tax on withdrawals. The PEP and TESSA have now been superseded by the Individual Savings Account (ISA), which is similar in most important respects.
Housing, pensions and ISAs cover the saving activity of the bulk of the population, and over the last two decades we have moved from an incoherent tax regime for

22
saving to one that seems much more satisfactory. It has rarely been the case that a clear strategy has been evident, but the power of the practical arguments for similar tax treatment of all saving seems to have been great. We now have the situation where, for housing, equities and cash saving, saving is out of taxed income, there is no tax on returns and no tax on withdrawals, while, for pensions, saving is out of untaxed income, fund income is untaxed but withdrawals are taxed. These two regimes produce the same effective tax rate of zero on the real return to saving. The one obvious exception is the existence of the tax-free lump sum in pensions, which makes the effective tax rate on the return to pensions saving negative. In addition, employers’ pension contributions are particularly tax-favoured since they are not subject to either employer or employee National Insurance at the point of contribution or at the point of withdrawal. There is still some way to go to reach a system that is neutral in its effects, but we are far closer to it now than we were even a decade ago.
For those (very few) who can and wish to save more than £7,000 p.a. (the current ISA limit) in addition to any housing or pension saving, capital gains tax (CGT) is still potentially relevant. In 1997–98, 144,000 individuals paid CGT. Prior to 1982, CGT was charged at a flat rate of 30% on capital gains taking no account of inflation. Indexation for inflation was introduced in 1982 and amended in 1985, and then in 1988 the flat rate of tax of 30% was replaced by the individual’s marginal income tax rate. The Budget of 1998 reformed the CGT system, removing indexation and introducing a tapering system, with the declared objective of encouraging longer-term holding of assets.
4.4. National Insurance contributions The National Insurance (NI) system has its roots as far back as 1911, and until 1961 it continued as a (typically) weekly lump-sum payment by employers and employees to cover the cost of certain social security benefits, in particular the flat-rate pension, unemployment benefits and sickness benefits. Since 1961, it has steadily moved closer and closer to being simply another income tax. The link between amount of contributions made and benefit entitlement, which was once close, is now almost entirely gone, and substantial progress has been made in integrating the tax rate structure and the tax base with those of income tax. Most of this progress has come in the last 15 years.
Figure 2 shows the structure of the combined employee and employer NI system before 1985, after the 1985 reforms and as it is in 2000. Prior to the 1985 reform, no NI was due on earnings of £66.99 or below.6 At earnings of £67.00, NI of £13.03 was due, 9% of all earnings from the employee and 10.45% from the employer. It is not surprising that this led to a significant bunching in the labour market at earnings just below the lower earnings limit. The 1985 reform reduced the jump in liability to £6.70 (5% each from employee and employer), and in 1989 the 5% ‘entry’ rate for employers was cut to 2%. The post-1997 government has taken this process further, cutting the entry rate to zero for both employee and employer, thus removing altogether the jump in liability on entering the NI system. For employees no NI contributions are payable on the first £76 p.w. of earnings (compared with the present LEL of £67), while for employers liability does not begin until an employee’s income
6 All figures are given in 2000–01 prices.

23
has reached the personal income tax allowance, which is currently £84 p.w. The two will be equalised at £85 p.w. for employees in 2001.
Figure 2: The changing structure of National Insurance contributions
0
20
40
60
80
100
120
140
0 100 200 300 400 500 600 700 800Gross weekly income
Tota
l wee
kly
NI co
ntrib
utio
ns
Pre-85
1985
2000
Sources: HM Treasury, Tax and Benefit Reference Manual, 1990; HM Treasury, Financial Statement and Budget Report, 2000 (http://www.hm-treasury.gov.uk/budget2000/fsbr/contents.htm).
The other major change in the rate structure is that, although there continues to be an income level (the UEL) beyond which no further employee contributions are due, the UEL for employers was abolished in 1985. The employee’s UEL rose substantially in 2000 to £535 and is set to rise to £575 in 2001 as a way of paying for the reduction in NI liability for those on low earnings.
The self-employed face a very different NI system (see Section 3.2) and typically pay far less than would be paid by employee and employer combined, although some increases are being introduced for them.
Not only is the rate structure of NI moving nearer to that of income tax, but also the NI base is changing so that it matches the income tax base more closely. This can be seen, for example, in the extension of the NI system to cover benefits in kind. The political advantages of having a separate NI system make it likely that it will continue: both the government and the electorate appear to like this separate tax. But the substantial problems of complexity, distortion and horizontal inequity caused by the lack of integration of the two systems have been much reduced, with further progress imminent.
4.5. Personal indirect taxes As we noted earlier, the most dramatic shift in revenue-raising over the last 21 years has been the growth in VAT, which has doubled its share of total tax revenue. The bulk of this change occurred in 1979 when the incoming Conservative government raised the standard rate of VAT from 8% to 15%, to pay for a reduction in the basic

24
rate and higher rates of income tax. The rate was increased from 15% to 17.5% in 1991, to pay for a reduction in another tax, on this occasion the community charge or poll tax. There have been a number of small extensions to the base of VAT and the significant introduction of a reduced rate of VAT on domestic energy.
Two general issues arise in the context of VAT, those of incentives and redistribution. It is frequently suggested that a revenue-neutral shift from direct to indirect taxation, such as that introduced in 1979, will reduce tax-induced disincentives to work. But if the attractiveness of working as opposed to not working, or working an extra hour as opposed to not doing so, is determined by the amount of goods and services that can be bought with the fruits of an hour’s work, a uniform consumption tax and a uniform earnings tax will clearly have very similar effects. Cutting income tax will not increase the attractiveness of work if the price of goods and services rises by an equivalent amount due to the increase in consumption tax. It may be, of course, that the shift proposed will reduce the burden of taxation for one group and raise it for another, and that this redistribution will affect incentives. But if that is the mechanism, it has little to do with the choice between direct and indirect taxes.
Table 18: Total tax as a percentage of retail price
Year Cigarettes Beer Wine Spirits Leaded petrol
Unleaded petrol
Diesel
1979 1980 1981 1982 1983 1984 1985 1986 1987 1988 1989 1990 1991 1992 1993 1994 1995 1996 1997 1998 1999
70 71 74 75 74 75 75 75 74 75 74 74 76 76 76 76 78 78 79 79 79
34 34 38 38 38 36 36 35 34 34 33 32 33 33 33 31 31 31 30 30 30
47 49 51 52 53 46 49 48 47 48 47 47 48 48 49 50 51 51 49 51 51
77 79 78 75 74 73 73 72 71 69 66 66 65 66 64 65 67 65 62 63 61
49 48 54 58 56 55 53 60 64 67 63 64 68 70 71 75 76 77 79 80 86
— — — — — — — — — 63 58 60 64 66 67 71 73 76 75 79 85
49 47 51 50 50 51 48 57 63 63 61 62 65 66 66 68 73 74 74 79 85
Note: Percentages relate to April/May for years up to and including 1993. From 1994, they relate to January each year. ‘Cigarettes’ refers to a packet of 20 king-size cigarettes, ‘beer’ to a pint of beer (bitter) in licensed premises, ‘wine’ to a 75cl bottle of table wine not exceeding 15% abv in a retail outlet, ‘spirits’ to a 70cl bottle of whisky in a retail outlet, and ‘petrol’ and ‘diesel’ refer to a litre of fuel.
Sources: HM Treasury, Tax and Benefit Reference Manual, 1990; HM Customs and Excise Annual Report 1998–99.

25
The second general issue concerning VAT relates to redistribution. As described in Section 3.3, many goods in the UK are zero-rated for VAT, with food, books and children’s clothing being examples. This zero-rating is often defended on distributional grounds, because those with low incomes allocate a large proportion of their expenditure to these items. Although this argument is superficially persuasive, it needs to be balanced by a recognition that, although the better-off spend a smaller proportion of their incomes on these goods, they spend larger amounts of money and are therefore the main cash beneficiaries of zero rates of VAT. Reversing the argument, if we sought the best-targeted way of allocating resources to the needy, identifying goods that absorbed a large share of their spending and then cutting the indirect tax rates for these goods is unlikely to be the most effective form of targeting. Other considerations, such as particular concerns over, say, children’s clothes, may be relevant, but it is important to realise that the distributional argument for zero rates of VAT is not obviously a powerful one.
Table 18 shows the time path of the total indirect tax rate for the principal goods subject to excise duties. The tax rate on cigarettes has shown a fairly steady rise, those on petrol and diesel much sharper rises. Both these commodity groups have been covered by government commitments to substantial annual real increases in excise duty.
The pattern for alcoholic drink is more diverse. There has been a tendency for the rate of tax on spirits to fall, and the tax rate on spirits is now very much lower than it was in 1979. The tax rate on wine has shown relatively little trend, while that on beer has tended to fall since 1983. As shown in Table 19, the implied tax rates per litre of pure alcohol are now much closer together than they were in 1979. Substantial variation persists, and this is hard to explain. A natural starting-point of a tax regime for alcoholic drink would be to impose the same level of tax per unit of alcohol, regardless of the form in which it is consumed. Levying different levels of tax on the different forms might be justified if one form of alcohol were more likely to lead to anti-social behaviour, for example, but such arguments are rarely made. The truth appears to be that the current system is more a product of history than the product of a coherent rationale, and there is obvious merit in reviewing it.
Table 19: Implied tax rates per litre of pure alcohol (January 2000 prices)
Form of alcohol 1979 1989 2000
Beer Winea
Spirits
£9.94
£17.64 £30.67
£12.34 £12.38 £22.83
£11.60 £12.75 £19.36
a Wine of strength 12% abv.
Sources: Monthly Digest of Statistics, May 2000; Economic Trends, June 2000; own calculations.
The existence of relatively high tax rates in the UK on some easily portable commodities could lead to loss of revenue through cross-border shopping. While it is, in principle, possible that the UK tax rates are so high that reductions in those rates would encourage enough additional consumption to produce a net increase in revenue, the available evidence suggests that this is unlikely. Only in the case of spirits is it

26
likely that the current tax rate is close to being high enough for a reduction to have little or no revenue cost.
4.6. Taxes on companies Corporation tax — the principal UK tax on companies — has been through major reform twice in the last 21 years. In 1984, a reform was announced which cut the main corporation tax rate from 52% to 35% (cut further to 33% by 1991–92), while moving from a very generous system of deductions for capital investment (100% first-year allowances for investment in plant and machinery) to a less generous one (25% annual writing-down allowances). The 1984 reform was intended to be broadly revenue-neutral, through its combination of lower overall rates and increased tax base, although it might in fact have raised revenue by bringing many more companies than had been expected into a taxpaying position.
The incoming Labour government in 1997 announced a further reform which abolished advance corporation tax and introduced a new quarterly payments system, while cutting the main tax rate from 33% to 30% (see Section 3.6 for details). The government also changed the way that dividend income was taxed, reducing the tax credit (and tax rates for lower- and basic-rate taxpayers) from 20% to 10%, while no longer allowing certain tax-exempt shareholders, such as pension funds and other companies, to reclaim the value of their dividend tax credit. This had the effect of raising the amount of revenue received from corporate tax, even after the reductions in the main corporation tax rate were taken into account.
The other substantial company tax in the UK system is national non-domestic rates (NNDR). Prior to the local government tax reforms introduced in 1990, the non-domestic rate was under the control of local authorities. Since 1990, the rate has been set at the national level: non-domestic rates is no longer a local tax in any meaningful sense, and it is now more obvious that it is a slightly surprising tax. NNDR is effectively an intermediate tax that bears heavily on productive activities that are property-intensive. As such, it seems ripe for the reformer’s attention, or at least it would be if it attracted a little more public interest.
4.7. Local taxation During the period considered here, local taxation has moved from the rates system, based largely on property values, to the community charge (or poll tax), based on individuals, to the council tax, once again based largely upon property values, but with an individual element. These fluctuations in the approach to local authority taxation have been inspired by attempts to control local expenditure, which was far outstripping local revenue. The result is that the only local tax left — the council tax — provides only 20% of total local spending, which leaves local authorities with little genuine control over their budgets. The removal of explicit capping of local authority expenditure by central government seems unlikely to remove a large degree of implicit and explicit control.
The experience with the poll tax itself provides an interesting lesson in policy-making and implementation. It was introduced in April 1990 in England and Wales after a one-year trial in Scotland, but it was so unpopular that the government quickly announced that it would be replaced. The tax was based on the fact that an individual lived in a particular local authority, rather than on the value of the property occupied

27
or the individual’s ability to pay (subject to some exemptions and reliefs). In the 1991 Budget, the government increased VAT from 15% to 17.5% to pay for a large reduction in the burden of the poll tax, which resulted in a corresponding rise in the level of central government grant to local authorities. The poll tax was abolished in 1993 to be replaced by the council tax, which is based mainly upon the value of the property occupied, with some exemptions and reliefs (outlined in more detail in Section 3.8).
5. Conclusions
Despite clear attempts to reform various aspects of the UK tax system over the last 21 years, some more successful than others, there remain many areas still in need of attention. This paper has tried to set out the many individual features of the current UK tax system, to describe major changes in those features over time and to highlight some of the areas still in need of a reformer’s beady eye.