survey on comparative human resource ...three rounds of the survey in bulgaria (1996, 1999 and...
TRANSCRIPT

Elizabeth Vatchkova
SURVEY ON COMPARATIVE
HUMAN RESOURCE MANAGEMENT
NATIONAL REPORT FOR BULGARIA,
CRANET, 2006
Reviewer: Dr. Iskra Arsenova, Senior Research Fellow
Translator: Vera Georgieva
CONTENTS
Introduction ................................................................................................................................ 6
1. Methodology of the Survey.................................................................................................... 7
2. Characteristics of the Sample................................................................................................. 8
3. General Description of HRM Activities in Organisations ................................................... 10
4. HRM Information Systems .................................................................................................. 19
5. Formation of Staffing Levels ............................................................................................... 22
6. Flexible Working Practices .................................................................................................. 26
7. Appraisal of Employees ....................................................................................................... 30
8. Training and Development of the Staff................................................................................ 33
9. Pay and Benefits................................................................................................................... 41
10. Labour Relations and Communications ............................................................................. 48
11. Summary ............................................................................................................................ 55
References ................................................................................................................................ 58

National Report for Bulgaria, CRANET, 2006 3
Dear readers, The jubilee publication Human Resources Management – the Bulgarian and the
International Experience is dedicated to two major events – Bulgaria’s accession to the European Union and the 10th anniversary of the systematic surveys of human re-source management practices in Bulgarian organisations.
The EU membership provides good opportunities for an in-depth analysis and as-sessment of the global context of HRM in Bulgaria. The accession implies new re-quirements and different dynamic patterns of management processes in this sphere of paramount importance for the competitiveness of the Bulgarian economy. The review of the current condition and the identification of the topical issues are necessary steps towards the development of successful corporate strategies and the integration of the Bulgarian workforce into the European labour market.
This publication includes two research papers – a national report and an interna-tional report prepared within the framework of Cranet, the world’s biggest and most prestigious network for the study of the long-term comparative human resource man-agement. The network was established at the Cranfield University, UK in 1989. Cur-rently, its membership includes prestigious universities and business schools from 34 countries. Bulgaria joined the network in 1996, when the first survey was conducted by Transbusiness-E, the Bulgarian representative in Cranet.
The main objectives of the research within the framework of the Cranfield pro-ject are as follows:
• To develop and maintain a database concerning HRM practices in all sectors of the economy all over the world;
• To conduct international comparative analysis of these practices and to promote the most successful ones;
• To monitor over time the contribution of the increasing “Europeanization” of business to the specific methods of managing people in modern organisa-tions;
• To trace out the changes in the management of people at work, leading to strategic human resource management.
International comparative HRM surveys have a very wide scope and they are very complex. A special methodology is applied to these surveys and it is continuously improved. They constitute a new area in the theory and practice of management. Ini-tially only European, international HRM surveys turn, from year to year, into an in-creasingly global environment for analysis and forecasting of the most important proc-esses of managing people in the labour process.

4 Elizabeth Vatchkova
The findings of these surveys conducted within the network are used when offi-
cial documents of the European Union are drafted. For the time being, they are mainly of research and academic interest in Bulgaria. Therefore one of the objectives of the compendium is to promote them in this country and to apply them on a larger scale in the globalizing Bulgarian management practices.
The National Report for Bulgaria presents the condition and dynamism of human resource management, resulting from the third national survey conducted in 2003.
The International Report summarizes the findings of similar surveys conducted in thirty-two countries all over the world, including Bulgaria, over the period from 2003 to 2005. The team of authors includes representatives of nine countries partici-pating in the network.
It is for the first time that the Bulgarian readers have the opportunity to see such a rich presentation of information from an empirical survey of human resource man-agement in terms of both content and scope. We hope that the compendium will meet the interest in these topical issues, which has been growing over the recent years. It could be useful to students, researchers and practitioners in the field of management. Part of the information is unique and published in Bulgaria for the first time. Another part is familiar to our readers from publications on the previous two surveys in Bul-garia. In all cases, the tracing out of the dynamic patterns of such important indicators as the prerequisites for the development of a knowledge-based economy or the struc-ture of modern motivational packages and instruments is equally useful to both theore-ticians and practitioners.
The preparation of the compendium was completed in the summer of 2006, al-though the findings of the Bulgarian survey were ready and partially published as early as 2004. The submission of the processed data from the surveys in all thirty-two coun-tries took some time but that was the only way to achieve the effect of global compari-sons, which is the most valuable one in our opinion.
I would like to express my special gratitude to all who took part in the survey as interviewers and respondents – students and human resource managers, executives and entrepreneurs, who dedicated not only time and effort to the filling in of questionnaires but also participated in the comments on the results subsequently.
I highly appreciate also the cooperation of my colleagues from the network and I am very grateful for their interest in my country, for the moral support and the meth-odological guidance they have invariably provided, especially during the first survey.
I would like to acknowledge also the substantial contribution of Denitsa Borisova who helped with the technical and graphic layout of the text and systematized the data in tables and diagrams to visualize them better and make them easier to follow.

National Report for Bulgaria, CRANET, 2006 5
To all people interested in this publication I wish to never give up in the efforts to improve their skills of using research results in their day-to-day work related to the human resource management and development and thus to contribute to the develop-ment of the knowledge-based economy.
Elizabeth Vatchkova
6 Elizabeth Vatchkova
Introduction
Bulgaria’s accession to the EU and the fulfillment of the commitments to en-hance the workforce mobility strengthen the need for theoretical and applied research work dedicated to the preparation of the Bulgarian labour market for the integration process. The regular systematic research into the human resource management in Bul-garian organisations is a necessary prerequisite for the development of science-based analysis and proposals for improvement of the approached and methods involved in the formation, development and maintenance of the workforce in this country.
The methods of managing people at work have undergone substantial changes in Bulgaria for the last fifteen years. Some of them have been caused by the replacement of centrally planned management mechanisms by market-based ones. Others are the result of the opening of the national economy and the reinforcement of globalisation processes. Important changes have occurred also due to the improved quality of the sectoral environment, which have been accelerated by:
• the merger of the interests and efforts of the personnel to promote the pro-fessional standards of the people involved in the human resource manage-ment and development (HRMD);
• the introduction and publishing of the National Professional Competence Standards in the HRMD sphere;
• the establishment of the Institute for Certified HRMD Specialists; • the launch of the certification process; • the increased supply of training courses of various duration and type in stra-
tegic management, human resource management and development, includ-ing web-based training of experts.
A specific and very important aspect of the changes in the human resource man-agement sphere is the development of a relatively homogeneous environment for the labour process through the introduction of common EU rules and regulations, as well as through the dissemination of good European HRM practices among Bulgarian busi-nesses. The thrust, speed and content of these changes are the subject-matter of re-search, analysis and summary in the regular Cranet reports on the condition and the convergent and divergent aspects of human resource management in Europe.
The 2006 report for Bulgaria follows the sequence and logic of the international survey.
The first section General Description of HRM Activities in Organisations makes an analysis of the changes in the importance of the HRM function and its role in the management of modern Bulgarian companies, the ways of its implementation, the enti-ties involved in the management of people and their characteristics. Special attention is

National Report for Bulgaria, CRANET, 2006 7
paid to corporate strategies and the participation of HRM in their development and implementation.
The second section HRM Information Systems outlines the types of systems and the dynamic patterns of their use.
The third section Establishment of Staffing Levels traces out the methods of se-lection and recruitment of personnel, the reduction of staffing levels in organisations, and the approaches and practices with regard to problem groups.
The fourth section Flexible Working Arrangements is dedicated to the use of various forms of flexible employment. The dynamic patterns of the common ones are analyzed: shift work, part-time work, temporary employment and flexi-time. The trends in the use of a total of thirteen different forms of “non-conventional employ-ment” are outlined.
The fifth section Appraisal of Employees summarizes the condition and devel-opment of appraisal systems. Special attention is paid to the appraisal of the various categories of staff and the use of the appraisal results.
The sixth section Training and Development of the Staff is dedicated to the in-vestment in human capital. The subject-matter of the survey covers the training needs analysis, the staff development methods, the expenditures involved, the volume of training and the work with the various categories of staff. The dynamism of the inter-est in the various fields of training is traced out and the new challenges are identified in this sphere.
The seventh section Pay and Benefits tackles the decentralization of the decision-making process with regard to the remuneration and additional benefits. The analysis covers the approaches to the establishment of variable pay, the modern incentives for the employees through participation in the profit and ownership by categories of staff.
The eighth section Labour Relations and Communications deals with the change in communication methods and models in modern organisations. It studies the role of trade unions and the representative bodies of the employees in the communication process.
The analysis and recommendations put forward in the last section Summary are intended to facilitate the changes needed for the creation of conditions for rapid and effective integration of Bulgarian companies into the European business environment, as well as for upgrading the quality of the management process in them.
1. Methodology of the Survey
The survey provides representative and comparative data on the human resource management policies and practices monitored on a long-term basis in terms of more than 300 indicators. The Bulgarian survey covers organisations in both the public and

8 Elizabeth Vatchkova
the private sectors in various spheres of activity with staffing levels above 200 em-ployees, which is adequate to the actual representation of economic sectors in Bul-garia. The data has been collected from the most senior HRM managers and experts in organisations representing all branches and activities of the national economy in the private and the public sectors.
In most countries the survey is conducted mainly by mail; some use direct inter-views and recently data has increasingly been collected in an electronic manner. In all three rounds of the survey in Bulgaria (1996, 1999 and 2003), the data was collected by filling in questionnaires in the course of direct interviews. This method turned out to be the most appropriate because in all other forms the percentage of those who reply is too low. The questionnaires were worked out collectively by representatives of the universities and business schools participating in the network in the process of iterative discussions and detailed consultations. The uniform structure of the questionnaire was preserved but the content of some questions changed in each round of the survey to reflect the development of new trends and practices in the individual countries. Some basic questions were retained to trace out trends on a long-term basis and to provide for the comparative analysis of individual countries, regions and groups of countries.
The survey covers the changes in both the form and the content of the human re-source management in Bulgaria over the period from 1996 to 2003 mainly from the following perspectives:
• The need for creation of conditions for rapid and successful integration of Bulgarian organisations in the European business and social environment through the identification of the convergence aspects of HRM practices;
• The need for increased contribution of the human resource management to the development of a knowledge-based economy and the establishment of learning organisations.
2. Characteristics of the Sample
The survey covers companies with over 200 employees. The sample universe in Bulgaria consists of approximately 848 companies, which accounted for 0.3 % of the total number of enterprises in Bulgaria in 2003 (the total number of enterprises in 2003 was 218,136)1.
The survey involved interviews with 157 companies. Due to the very small size of the sample universe (the total number of enterprises with more than 200 employ-ees), the sample covers 19 % of the sample universe, which is further enhances the re-liability of the findings. The comparison between the structure of the sample and
1 NSI.

National Report for Bulgaria, CRANET, 2006 9
the sample universe in terms of various indicators2 can be summarized in terms of the number of employees, the sphere of activity and economic sector, as follows:
Number of Employees
The comparison of the number of employees in the sample and the NSI data from the source quoted comes to show that:
• This survey covers companies with a greater number of employees in the context of its objectives and tasks;
• In the case of big enterprises (over 250 employees) the average number of employees per enterprise is 560 people, whereas in this survey the average number of employees per enterprise is 797 people;
• Although the research scope of the survey reaches companies with over 200 employees, it covers a substantial percentage of the largest companies in the country (measured by the number of employees).
Spheres of Activity
The survey covers big production enterprises and companies operating in con-struction, the banking and financial sector, and transport. Small sectors of the national economy, such as agriculture, health and organisations in the public administration, are also involved (Table 2.1).
Table 2.1. Share of the Organisations Involved in the Survey by Spheres of Activity Sphere of Activity Share
Manufacturing (including food, beverages, tobacco, textiles, garments, printing indus-tries, processing of rubber and plastics, etc.) 22,2%
Production of metals; mechanical and electric engineering, tools manufacturing; office equipment 13,7%
Energy and water 12,4% Chemical and mining industries; processing of non-energy minerals 7,8% Trade and distribution; hotels and restaurants; repair and maintenance works 7,8% Building and civil engineering 7,2% Banking, finance, insurance, business services (including consultancy, public relations and advertising, legal services, etc.) 6,5%
Transport and communications (railways, postal services, telecommunications, etc.) 5,9% Healthcare 2,6% Agriculture, hunting, forestry, fisheries 2,0% Services (radio and television, research, charities, etc.) 1,3% Public administration 1,3% Others 9,2%
Economic Sectors The survey gives an approximately accurate structure of companies by form of
ownership (Table 2.2). It includes 66 % private and 23 % state-owned companies. Ac-
2 Annual Report on the Condition and Development of Small and Medium-sized Enterprises in Bulgaria, 2004,
Statistical Yearbook, 2004.
10 Elizabeth Vatchkova
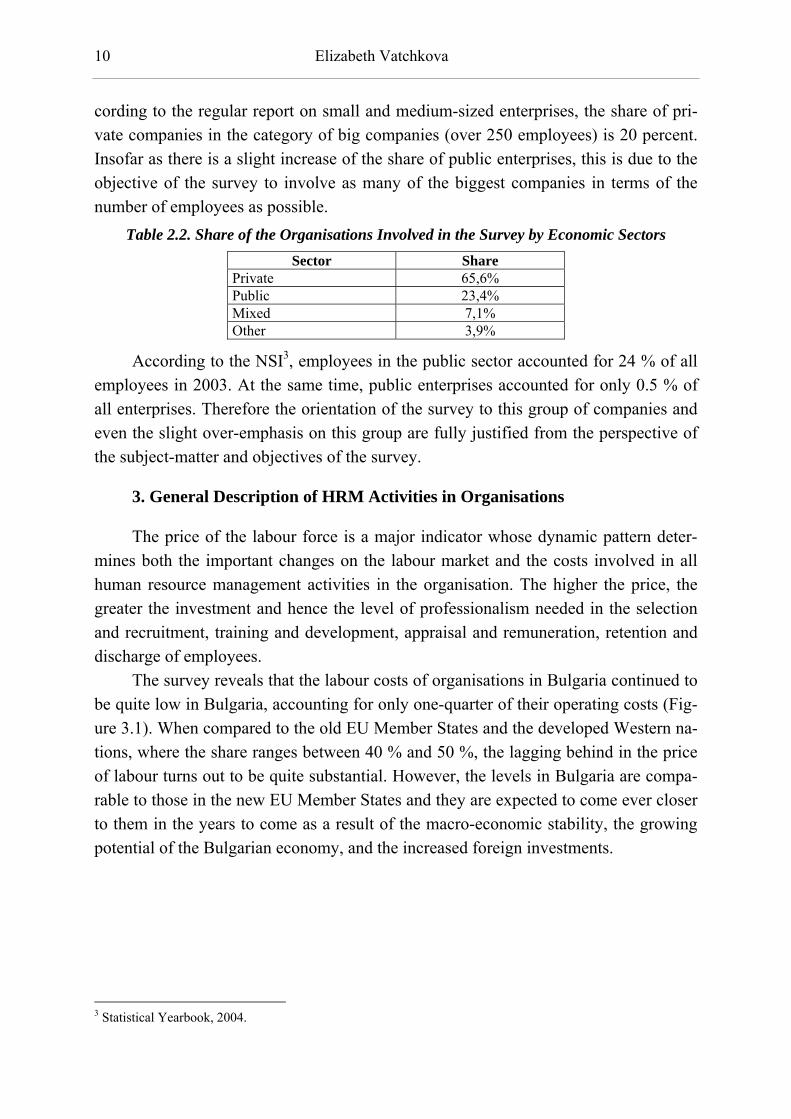
cording to the regular report on small and medium-sized enterprises, the share of pri-vate companies in the category of big companies (over 250 employees) is 20 percent. Insofar as there is a slight increase of the share of public enterprises, this is due to the objective of the survey to involve as many of the biggest companies in terms of the number of employees as possible.
Table 2.2. Share of the Organisations Involved in the Survey by Economic Sectors Sector Share
Private 65,6% Public 23,4% Mixed 7,1% Other 3,9%
According to the NSI3, employees in the public sector accounted for 24 % of all employees in 2003. At the same time, public enterprises accounted for only 0.5 % of all enterprises. Therefore the orientation of the survey to this group of companies and even the slight over-emphasis on this group are fully justified from the perspective of the subject-matter and objectives of the survey.
3. General Description of HRM Activities in Organisations
The price of the labour force is a major indicator whose dynamic pattern deter-mines both the important changes on the labour market and the costs involved in all human resource management activities in the organisation. The higher the price, the greater the investment and hence the level of professionalism needed in the selection and recruitment, training and development, appraisal and remuneration, retention and discharge of employees.
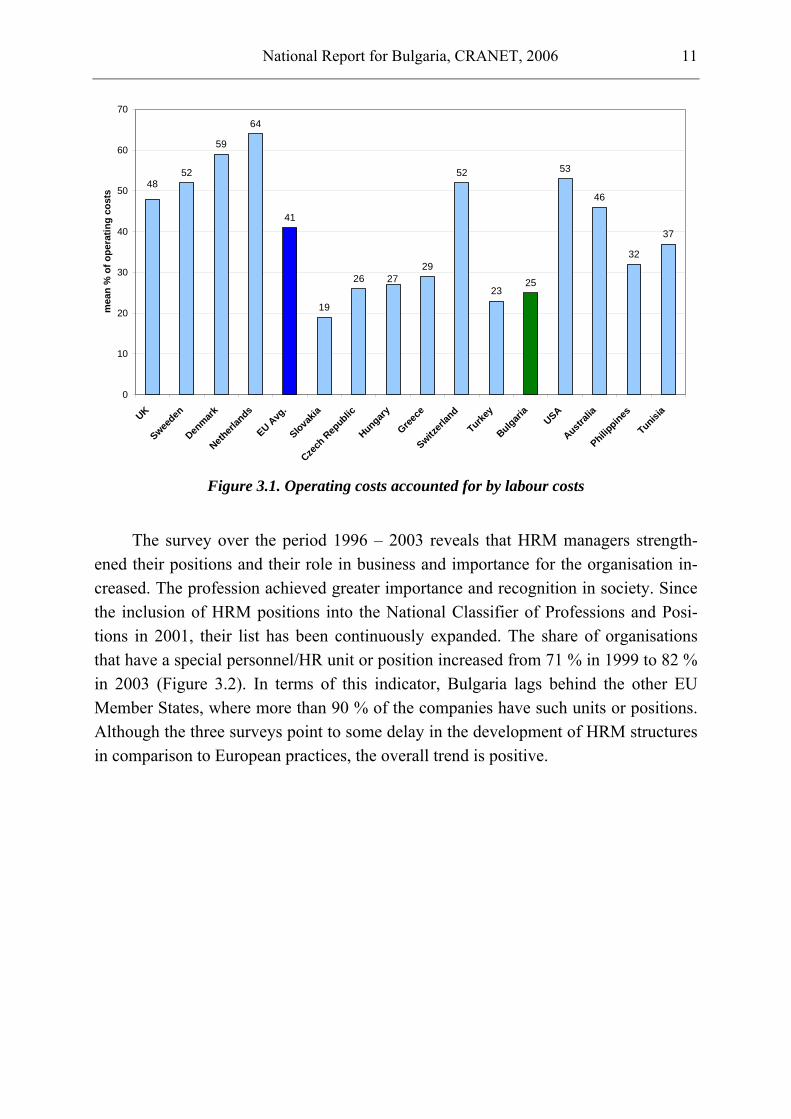
The survey reveals that the labour costs of organisations in Bulgaria continued to be quite low in Bulgaria, accounting for only one-quarter of their operating costs (Fig-ure 3.1). When compared to the old EU Member States and the developed Western na-tions, where the share ranges between 40 % and 50 %, the lagging behind in the price of labour turns out to be quite substantial. However, the levels in Bulgaria are compa-rable to those in the new EU Member States and they are expected to come ever closer to them in the years to come as a result of the macro-economic stability, the growing potential of the Bulgarian economy, and the increased foreign investments.
3 Statistical Yearbook, 2004.
National Report for Bulgaria, CRANET, 2006 11
52
59
64
41
19
2629
52
2325
53
46
32
37
27
48
0
10
20
30
40
50
60
70
UK
Sweeden
Denmark
Netherl
ands
EU Avg
.
Slovakia
Czech
Rep
ublic
Hungary
Greece
Switzerl
and
Turkey
Bulgaria
USA
Australi
a
Philippines
Tunisia
mea
n %
of o
pera
ting
cost
s
Figure 3.1. Operating costs accounted for by labour costs
The survey over the period 1996 – 2003 reveals that HRM managers strength-
ened their positions and their role in business and importance for the organisation in-creased. The profession achieved greater importance and recognition in society. Since the inclusion of HRM positions into the National Classifier of Professions and Posi-tions in 2001, their list has been continuously expanded. The share of organisations that have a special personnel/HR unit or position increased from 71 % in 1999 to 82 % in 2003 (Figure 3.2). In terms of this indicator, Bulgaria lags behind the other EU Member States, where more than 90 % of the companies have such units or positions. Although the three surveys point to some delay in the development of HRM structures in comparison to European practices, the overall trend is positive.

12 Elizabeth Vatchkova
72 71
82
27 28
18
0
10
20
30
40
50
60
70
80
90
Yes No
1996 1999 2003
Figure 3.2. Share of Bulgarian organisations that have personnel / HR department
or position for HR specialist ( %)
From the informal perspective, there is evidence also in support of the strength-
ened position of HRM managers in corporate management affairs. The share of the or-ganisations where HRM managers have a place on the main boards increased from 22 % in 1999 to 40 % in 2003 (Figure 3.3). Nevertheless, companies where HRM is not represented in the Board of Directors or an equivalent body still prevail in Bul-garia. In terms of this indicator, there exists a regional trend in the whole south-Balkan group of Greece, Turkey, the Turkish Cypriot community, and Cyprus. The typical phenomenon in Bulgaria continues to be the representation of HRM in the Board of Directors by managers who perform other key functions. In 1999, those were the ex-ecutive directors in 65 % of the organisations, the administrative directors in 14 % of the cases, and the financial directors in 6 % of the organisations4.
4 Vatchkova, Е. (1999), Price Waterhouse Cranfield project for international strategic human resource man-
agement in Bulgaria.

National Report for Bulgaria, CRANET, 2006 13
91 88
79 76 76
58
44
35 34
25
40
32
0
10
20
30
40
50
60
70
80
90
100
France
Sweden
Belgium
Spain Italy
EU Avg
.
Hungary
Cypru
s
Greece
Turkey
Bulgaria
Turkish
Cyp
riot C
ommunity
Figure 3.3 Share of organisations where the Head of personnel / HR department has a
place on the main Board of Directors or the equivalent ( %)
According to the survey conducted in 2003, HRM directors in Bulgaria are most often selected from among the staff of the Human Resources department of the com-pany, which offers them god opportunities for career development. The previous sur-veys conducted in 1996 and 1999 showed that the position was occupied mainly by external specialists. The fact should be perceived by training companies and consulting firms which provide services in the field of managing people and developing the or-ganisation as an expansion of the training needs in these fields and, above all, as a po-tential market for the new forms of learning based on modern information technologies ensuring the process of continuous learning at work.
Since the early 1990’s the literature in the field of management has asserted the opinion that human resource management is part and parcel of the management strat-egy and business policy of the company, in which it plays a crucial role and to which it contributes substantially5. The participation of HRM managers in the development and implementation of corporate strategies is an essential sign of their role in the manage-ment of the organisation. The survey seeks the answer to the question whether HRM actually turns into a strategic partner and whether this function is vital for the organisa-tion or the administrative aspect prevails. The involvement of HRM managers in the elaboration of corporate strategies from the outset is a precondition for continuity, compatibility and coordination between the corporate strategies and the HRM strate-
5 Beardwel I., Holden L. (1994), Human Resource Management, Pitman.

14 Elizabeth Vatchkova
gies. The early involvement of HRM specialists in the development of strategies is a necessary motivating factor for their consistent, creative and successful implementa-tion. The use of systematic appraisal of the “threshold”, “key” and “unique” compe-tences creates prerequisites for the best use of the capacity of all employees and for the development of new business opportunities based on the strategic competence advan-tages of companies. Thus the HRM unit receives greater opportunities for the prepara-tion and ensuring of their participation in and contribution to the implementation proc-ess6. According to the survey conducted in 2003, HRM specialists in Bulgaria were involved in the development of business strategies right from the outset in 30 % of the organisations (Table 3.1).
Table 3.1. Stage at which HR is involved in development of business strategy (% of organisations)
Country From the outset
Through subse-quent consulta-
tion
On implementa-tion Not consulted
France 73 13 12 2 Finland 70 15 8 7 Italy 69 26 4 1 Hungary 58 7 13 22 Germany 50 21 10 19 Greece 42 22 27 10 Estonia 39 30 20 11 Slovakia 35 37 15 13 EU Avg. 55 22 14 9 Turkey 46 10 35 10 Bulgaria 30 20 39 12 Turkish Cypriot Community 27 6 30 38 USA 53 27 8 12
Still, the greatest share was that of organisations, where HRM departments took part primarily in the implementation of corporate strategies (39 %). That fact puts Bul-garia in the same group with Turkey, the Turkish Cypriot community, Nepal and Tuni-sia. The comparison shows that in Western and Central Europe 50 to 70 percent of the organisations have their HRM departments involved in the development of business strategies right from the outset and, in another 20 to 30 percent they participate in the process of their development through consultation. Hence the strengthening of the real strategic position of HRM managers is an important prospect to be enhanced in future.
Over the last four years, Bulgaria has come closer to the dominating world prac-tices in the development of strategies for the work with people. In 2003, 44 % of the companies already had a written HRM strategy and another 32 % had an unwritten one (Figure 3.4).
6 Vatchkova, Е. (1998), Human Resource Management, European Comparative Surveys, Stopanstvo, Sofia.

National Report for Bulgaria, CRANET, 2006 15
0
10
20
30
40
50
60
70
80
90
Sweden
Czech
Rep
ublic
Denmar
kIta
ly
Greec
eSpa
in
Cypru
s
EU Avg
.
Norway
Turkey
Bulgari
a
Turkish
Cyp
riot C
ommunityUSA
Tunisia
Yes, written Yes, unwritten No
Figure 3.4. HR Strategy (% of organisations)
The expectation for strategic involvement of HRM in the management of the or-ganisation is ill-grounded in cases where the important managerial tools, such as vi-sion, policies and mainly corporate strategies, are not developed and used. In 2003, Bulgaria displayed a marked positive trend towards increasing the strategic orientation of companies. Over the period from 1999 to 2003, the number of companies which had a corporate strategy was doubled to reach 70 %, while the share of the companies with an unwritten strategy increased from 22 % to 28 % (Table 3.2). That could be ex-plained with the opening of Bulgarian business to the European and global business after 1990 and with the aspiration of companies to ensure their long-term survival on the new global markets. In terms of that indicator, Bulgarian organisations outstripped even those in countries like Spain, Italy and Cyprus.
Table 3.2. Business strategy (% of organisations) State Yes, written Yes, unwritten No Slovenia 91 6 3 Sweden 91 5 4 Czech Republic 89 10 1 Denmark 84 9 6 Greece 58 35 5 Spain 53 37 7 Italy 42 30 27 Cyprus 37 24 20 EU Avg. 70 19 8 Turkey 62 32 4 Bulgaria 70 26 2

16 Elizabeth Vatchkova
Unlike that development, Bulgarian companies lagged behind in the development
of missions – only 40 % of the organisations had written missions (ranking Bulgaria last but one among the countries included in the survey). Only 36 % of the respondents had corporate values statements (Table 3.3). Those documents were less popular only in the Turkish Cypriot community, where 16 % of the organisations had corporate val-ues statements and 28 % had written missions. The comparison shows that over 70 % of the companies in the EU Member States and the other countries formulated mis-sions and corporate values. The reasons for that situation could be partially seen in the fact that the market economy did not have long traditions in Bulgaria and therefore those corporate instruments and their importance for the competitiveness of the or-ganisation were still less known and they were even underestimated. Another reason for the weak popularity of missions and values statements is the fact that the develop-ment of projects in the field of corporate culture, codes of conduct and corporate social responsibility programmes has evolved only over the recent years.
Table 3.3 Corporate values statement (% of organisations) State Yes, written Yes, unwritten No Don't know Czech Republic 75,4 13 10,1 1,4 Finland 74 8,3 16,3 1,4 Sweden 67,6 13,4 16,3 2,7 France 52,2 9,7 35,1 3 Netherlands 44,5 13,1 34,3 8,1 Slovakia 43,9 27,8 14,9 13,3 Austria 31,2 11,1 42,3 15,4 Germany 25,9 16,9 47,9 9,3 Cyprus 22,4 23,5 38,8 15,3 Turkey 59,7 22,7 13 4,5 Bulgaria 36,1 33,1 13,5 17,3 Turkish Cypriot Community 15,5 29,6 47,9 7 USA 71,8 8,2 16,9 3,1
The Cranet survey raises one more fundamental question, i.e. who has the major responsibility for the main decision-making process concerning the policy with regard to the various HRM functions: line managers or the HRM units/specialists. The an-swers to these questions reveal the functions and role which HRM specialists and units actually have in Bulgarian organisations. The data collected in 2003 clearly identified the spheres of convergence and divergence in Bulgaria in comparison to the EU Mem-ber States in the pre-accession period and pointed to the guidelines for the further de-velopment of some major HRM functions in Bulgarian companies with a view to the application of good international practices and the integration into the European busi-ness environment.
As far as the recruitment and selection process is concerned, HRM specialists in Bulgaria and in the other countries involved in the survey shared the responsibility

National Report for Bulgaria, CRANET, 2006 17
mainly with the line management whose role was leading in 40 % of the Bulgarian or-ganisations (Table 3.4). Notwithstanding the gradual increase of the functions and re-sponsibilities of HRM units in the recruitment and selection process, it should be noted that they lag behind most of their European counterparts as a leading partner in this field.
Table 3.4. Primary responsibility for recruitment and selection (% of organisations)
Country Line Mgt Line Man with HR
dept
HR dept with line
Mgt
HR dept
France 0,7 35,5 55,8 8,0 Belgium 7,5 35,0 50,0 7,5 Greece 7,1 22,9 48,8 21,2 Italy 3,5 20,0 47,0 29,6 Spain 2,6 26,0 46,8 24,7 Sweden 22,6 54,6 21,0 1,8 Czech Republic 33,8 52,1 14,1 0,0 Finland 34,1 49,3 13,1 3,4 EU Avg. 14,7 38,7 35,6 11,1 Bulgaria 21,1 39,5 27,6 11,8 Turkish Cypriot Community 63,3 29,1 7,6 0 USA 3,5 39,6 43,9 12,9 New Zealand 23,4 41,5 29,4 5,7
The training and development of the staff is also a primary responsibility of the HRM unit, which makes it possible for a systematic approach to be applied to the training process and preconditions to be created for the establishment of learning or-ganisations. This HRM function was most actively supported by external consultants in more than a half of the respondents. In 2003, the allocation of the responsibility for training in Bulgaria was in conformity with international practices. However, the lag-ging behind of the HRM unit as a leading partner of line managers should be noted. There still prevailed the share of the organisations, where line managers made deci-sions on their own as to the training and development of the staff – 23.3 % in Bulgaria compared to 12.7 % for the EU on the average (Table 3.5).
Table 3.5. Primary responsibility for training and development (% of organisations)
Country Line Mgt Line Man with HR dept
HR dept with line Mgt HR dept
1 2 3 4 5 Italy 3,4 18,1 45,7 32,8 Spain 4,5 18,2 53,9 23,4 Greece 4,6 20,1 59,2 16,1 France 4,3 32,6 53,6 9,4 Netherlands 11,4 45,4 36,3 6,9 Denmark 28,9 33,2 29,6 8,3 Finland 25,1 39,9 27,8 7,2 Sweden 22,1 47,9 25,3 4,8 EU Avg. 12,7 32,7 41,6 13,0

18 Elizabeth Vatchkova
1 2 3 4 5
Bulgaria 23,3 29,3 30,7 16,7 Turkish Cypriot Community 64 22,7 10,7 2,7 USA 4,3 22,8 52,4 20,5 Australia 6 29,2 52,8 12
Unlike companies in the EU, Bulgarian organisations still had a weak role of the HRM unit in pay and benefits. Those issues were resolved only by the line manage-ment in 48 % of the organisations, while they made those decisions on their own only in 19 % of the organisations in the EU (Table 3.6).
Table 3.6. Primary responsibility for pay and benefits (% of organisations)
Country Line Mgt Line Man with HR dept
HR dept with line Mgt HR dept
Slovakia 56 25 15 4 Estonia 41 36 21 2 Slovenia 34 39 24 3 Greece 14 24 43 19 UK 6 25 51 18 France 4 31 52 14 Italy 3 18 43 36 EU Avg. 19 32 34 14 Turkey 42 27 24 8 Bulgaria 48 28 16 9 Turkish Cypriot Community 78 14 8 0 USA 4 20 43 33 Israel 10 13 42 35
Strong divergence can be noted also in the field of industrial relations. The role of HRM units and specialists is too weak in Bulgaria, as the line management played the leading role in the development of industrial relations in 60.5 % of the organisa-tions (Table 3.7). More conservative than the Bulgarian organisations were only those in the Turkish Cypriot community in terms of that indicator (Table 3.7).
Table 3.7. Primary responsibility for industrial relations (% of organisations)
Country Line Mgt Line Man with HR dept
HR dept with line Mgt HR dept
Slovakia 40,9 26,6 24,2 8,3 Slovenia 22,3 21 31,2 25,5 Cyprus 23,9 10,4 32,8 32,8 Denmark 22,9 26,4 25,6 25 UK 2,7 17,8 50 29,5 Italy 2,8 6,5 18,7 72 Spain 1,9 7,1 39 51,9 France 0,7 8,6 32,4 58,3 EU Avg. 13,4 20,3 32,4 33,8 Bulgaria 60,5 18,5 11,3 9,7 Turkish Cypriot Community 64 22,7 12 1,3 USA 6,1 14 53,9 36 Australia 3,2 14,7 41,7 40,5

National Report for Bulgaria, CRANET, 2006 19
Respondents pointed out that the responsibility for workforce expan-sion/reduction in Bulgarian organisations was traditionally an obligation of the line management. Still, the gradual involvement of HRM specialists in that function could be noted, as the line management was helped by the HRM departments in the change of workforce in 38 % of the organisations in 2003 and HRM units already played the leading role in that process in another one-quarter of the companies involved in the survey (Table 3.8).
Table 3.8. Primary responsibility for workforce expansion/reduction (% of organisations)
Country Line Mgt Line Man with HR dept
HR dept with line Mgt HR dept
Slovakia 40 35 21 4 Estonia 36 46 16 2 Denmark 37 45 15 3 Netherlands 17 62 19 2 Germany 12 36 32 20 UK 8 51 34 8 France 4 36 42 18 Italy 4 23 39 34 EU Avg. 20 42 27 11 Bulgaria 38 38 18 6 Turkish Cypriot Community 71 24 4 1 USA 5 53 32 10 Philippines 6 55 33 6
4. HRM Information Systems
Information technologies rapidly enter into the HRM sphere and improve the ef-ficiency of the management of people. The market for information systems in Bulgaria is among the most dynamically developing compared to all other countries involved in the survey and their application for HRM purposes is continuously on the growth. In 2003, 42 % of Bulgarian organisations declared that the use of information systems for HRM purposes had increased for the last few years (Figure 4.1).

20 Elizabeth Vatchkova
0
10
20
30
40
50
60
Sweden
Belgium
Italy
Greece
Czech
Rep
Slovakia
Austria
German
y
Turkey
Bulgaria
USA
Australi
a
Tunisia
Increased Same Not Used
Figure 4.1. Change in use of external providers of HR Information Systems
(% of organisations)
The use of external providers of information systems for HRM purposes has be-
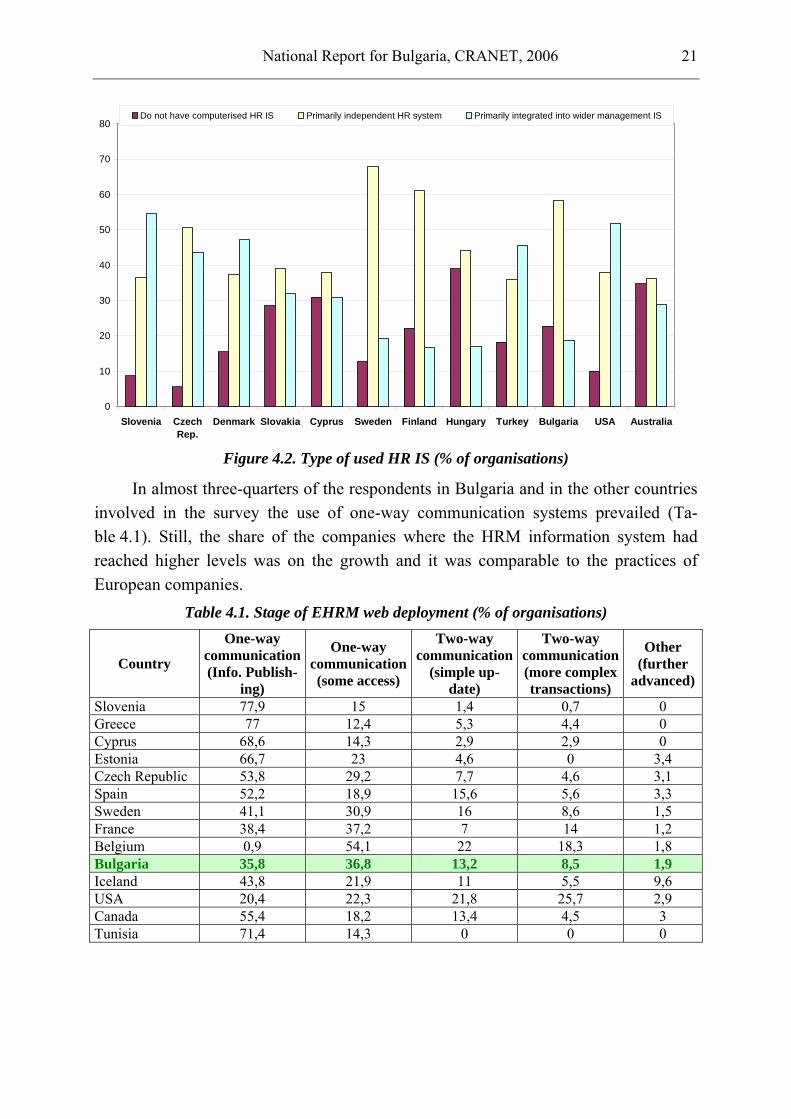
come an increasingly common practice and the share of the companies which could not conceive their work without them has substantially grown for the recent years. The latest Cranet survey indicates that Bulgaria is among the countries, where the introduc-tion of information systems is growing most rapidly. In 2003, 58 % of Bulgarian com-panies used independent HRM software and 19 % had an integrated information sys-tem which included also HRM (Figure 4.2). There was a strong trend of convergence between Bulgarian organisations and European companies. For instance, independent HRM software was used by every other organisation on the average in the EU, while integrated business management systems, including HRM, were applied in 33 % of the European companies.
National Report for Bulgaria, CRANET, 2006 21
0
10
20
30
40
50
60
70
80
Slovenia CzechRep.
Denmark Slovakia Cyprus Sweden Finland Hungary Turkey Bulgaria USA Australia
Do not have computerised HR IS Primarily independent HR system Primarily integrated into wider management IS
Figure 4.2. Type of used HR IS (% of organisations)
In almost three-quarters of the respondents in Bulgaria and in the other countries involved in the survey the use of one-way communication systems prevailed (Ta-ble 4.1). Still, the share of the companies where the HRM information system had reached higher levels was on the growth and it was comparable to the practices of European companies.
Table 4.1. Stage of EHRM web deployment (% of organisations)
Country
One-way communication (Info. Publish-
ing)
One-way communication (some access)
Two-way communication
(simple up-date)
Two-way communication (more complex transactions)
Other (further
advanced)
Slovenia 77,9 15 1,4 0,7 0 Greece 77 12,4 5,3 4,4 0 Cyprus 68,6 14,3 2,9 2,9 0 Estonia 66,7 23 4,6 0 3,4 Czech Republic 53,8 29,2 7,7 4,6 3,1 Spain 52,2 18,9 15,6 5,6 3,3 Sweden 41,1 30,9 16 8,6 1,5 France 38,4 37,2 7 14 1,2 Belgium 0,9 54,1 22 18,3 1,8 Bulgaria 35,8 36,8 13,2 8,5 1,9 Iceland 43,8 21,9 11 5,5 9,6 USA 20,4 22,3 21,8 25,7 2,9 Canada 55,4 18,2 13,4 4,5 3 Tunisia 71,4 14,3 0 0 0
22 Elizabeth Vatchkova
5. Formation of Staffing Levels
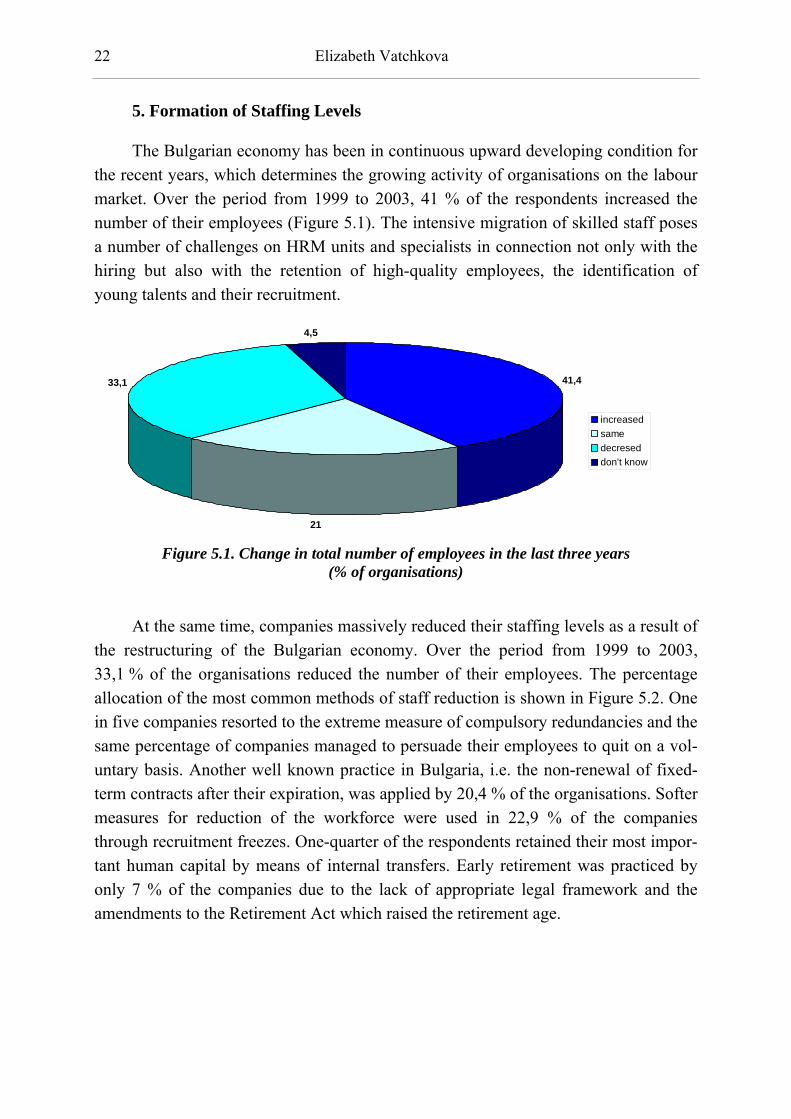
The Bulgarian economy has been in continuous upward developing condition for the recent years, which determines the growing activity of organisations on the labour market. Over the period from 1999 to 2003, 41 % of the respondents increased the number of their employees (Figure 5.1). The intensive migration of skilled staff poses a number of challenges on HRM units and specialists in connection not only with the hiring but also with the retention of high-quality employees, the identification of young talents and their recruitment.
41,4
21
33,1
4,5
increasedsamedecreseddon't know
Figure 5.1. Change in total number of employees in the last three years
(% of organisations)
At the same time, companies massively reduced their staffing levels as a result of
the restructuring of the Bulgarian economy. Over the period from 1999 to 2003, 33,1 % of the organisations reduced the number of their employees. The percentage allocation of the most common methods of staff reduction is shown in Figure 5.2. One in five companies resorted to the extreme measure of compulsory redundancies and the same percentage of companies managed to persuade their employees to quit on a vol-untary basis. Another well known practice in Bulgaria, i.e. the non-renewal of fixed-term contracts after their expiration, was applied by 20,4 % of the organisations. Softer measures for reduction of the workforce were used in 22,9 % of the companies through recruitment freezes. One-quarter of the respondents retained their most impor-tant human capital by means of internal transfers. Early retirement was practiced by only 7 % of the companies due to the lack of appropriate legal framework and the amendments to the Retirement Act which raised the retirement age.

National Report for Bulgaria, CRANET, 2006 23
0 5 10 15 20 25 30
Recruitment freeze
Early retirement
Voluntary reundancies
Compulsory redundancies
Internal transfer(redeployment)
No renewal of fixed term /temporary contracts
Outsourcing
Other
yes no don't know
Figure 5.2. Methods used to reduce the number of employees (% of organisations)
The survey revealed continuation of the trend of 1999 to recruit managers inter-
nally through the promotion of specialists within the organisation. In 2003, more than 55 % of the Bulgarian companies involved in the survey selected their managers in that way. At the same time, recruitment agencies turned into more active intermediar-ies on the labour market for two main reasons: the gradual improvement of the quality of their service and the quickly growing deficit of manpower in many sectors and ac-tivities.
Over a half of the vacancies for specialists, 46,5 % for the clerical staff and 45,5 % for the manual workers in the organisations involved in the survey were an-nounced in the media, while the word of mouth was most common in the recruitment of workers (Figure 5.3). The share of announcements published on the Internet in-creased both on the web-sites of the organisations and on the specialised commercial job web-sites. In 2003, some 20 % of the companies recruited specialists for their va-cancies directly from the universities.

24 Elizabeth Vatchkova
3,8
8,3
14
8,3
30,6
21,7
55,4
22,319,119,7
12,7
52,9
20,4
42,7
10,2
17,817,216,6
46,5
18,5
33,1
14
7,6
12,7
28,7
45,2
17,2
28,7
0
10
20
30
40
50
60
Internally Recruitmentagencies
Advertisement Word of mouth Companywebsite
Commercial jobwebsite
Direct fromeducationalinstitution
Management Professional / Technical Clerical Manual
Figure 5.3. Most frequently used methods to fill vacant positions (% of organisations)
In 2003, the most widely spread method for selection of employees in Bulgaria
was the one-to-one interview which replaced the selection based on application forms that was the leading method according to the surveys conducted in 1996 and 1999. Thus another sphere of convergence with the EU Member States was identified be-cause of the dominance of the recruitment after personal contact with the applicant there (Figure 5.4). One in four companies asked for references, and psychometric tests were held for the selection of 17 % of the managers, 14 % of the professionals, 11,5 % of the clerical staff and 7 % of the manual workers in the organisations involved in the survey. Assessment centres and graphology are still used quite rarely in the selection of staff.

National Report for Bulgaria, CRANET, 2006 25
25,5
64,3
36,3
16,6
7,6
26,8
3,2
20,4
75,8
43,9
14
5,1
28,7
7
16,6
63,7
49
11,5
3,8
27,4
4,4
13,4
44,6
59,9
73,2
15,3
7
0
10
20
30
40
50
60
70
80
Interview panel One-to-oneinterviews
Applicationforms
Psychometrictest
Assesmentcentre
References Grephology andother
Management Professional / Technical Clerical Manual
Figure 5.4. Most frequently used selection methods (% of organisations)
An increasing number of Bulgarian organisations experienced serious difficulties
in the selection of managerial staff, IT specialists and other skilled employees. That was relevant to 32 % of the respondents. Twice less was the number of companies which had difficulties in the retention of workers and the selection of clerical staff cre-ated problems to 7 % of the organisations7.
Problem groups, too, rapidly attract the attention of employers. The survey re-vealed that, in 2003, 26,1 % of the Bulgarian organisations had special programmes for employees with disabilities, 23.5 % for the female employees, 15,1 % for aged workers, and 11.2 % for protection of employees from ethnic minorities (Figure 5.5). The share of these companies will grow in the years to come under the influence of the European anti-discrimination rules and practices and the adoption of the Anti-discrimination Act in Bulgaria.
7 Vatchkova, Е. (1999), Price Waterhouse Cranfield Project for International Strategic Human Resource Devel-
opment in Bulgaria. That question was not asked in 2003.

26 Elizabeth Vatchkova
3,8
23,526,1
15,111,2
63,164,3
72,675,8
0
10
20
30
40
50
60
70
80
Minority ethnics Older workerd (50+) People withdisabilities
Women Other
yes no
Figure 5.5. Existence of action programmes covering special employee groups
(% of organisations)
6. Flexible Working Practices
Since 1990 flexible working arrangements (FWAs) in Bulgaria have been an area of very active research, discussions and debates at nationwide and organizational level from the legal, social and managerial perspective. Official statistics indicates8 that 97,2% of the people employed in 2002 worked on the basis of full-time contracts. Al-though the analysis based on the three Cranet surveys shows a stable tendency of in-crease in flexible working practices, there are various types of difficulties which still hinder their development. In this section we explore the typology, studying the follow-ing types of FWAs9:
1. Working time (part-time work, weekend work, overtime, shift work, compressed working week, annualized hours, flexi-time)
2. Contractual (job sharing, temp/casual work, fixed time employment) 3. Externalised (home-based work, teleworking)
According to the official data of the NSI, 97,2 % of the employees worked full-time in 2002. This analysis is based on the three Cranet surveys (1996, 1999 and 2003), pointing to a steady trend towards an increase of FWAs (Figure 6.1), in spite of all institutional and other difficulties accompanying their development. Quite positive for Bulgarian employees is the fact that the percentage of temporary employment 8 National Statistical Institute, 2002 9 Cranet International Executive report, 2006

National Report for Bulgaria, CRANET, 2006 27
dropped drastically to reach 42,7 % in 2003. This reveals the tendency of Bulgarian organisations to stabilize because the temporary employment form was massively used with regard to full-time employees to be resorted to, if necessary, when quick reduc-tion of staffing levels was needed during the transition to a market economy.
0
10
20
30
40
50
60
70
80
Shift work Annual hourscontract
Part-time work Temporary/casual Homebased work
1996 1999 2003
Figure 6.1. Bulgarian organisations using FWAs (% of organisations by types of FWAs)
The flexible working hours prevailed throughout the period covered by the sur-
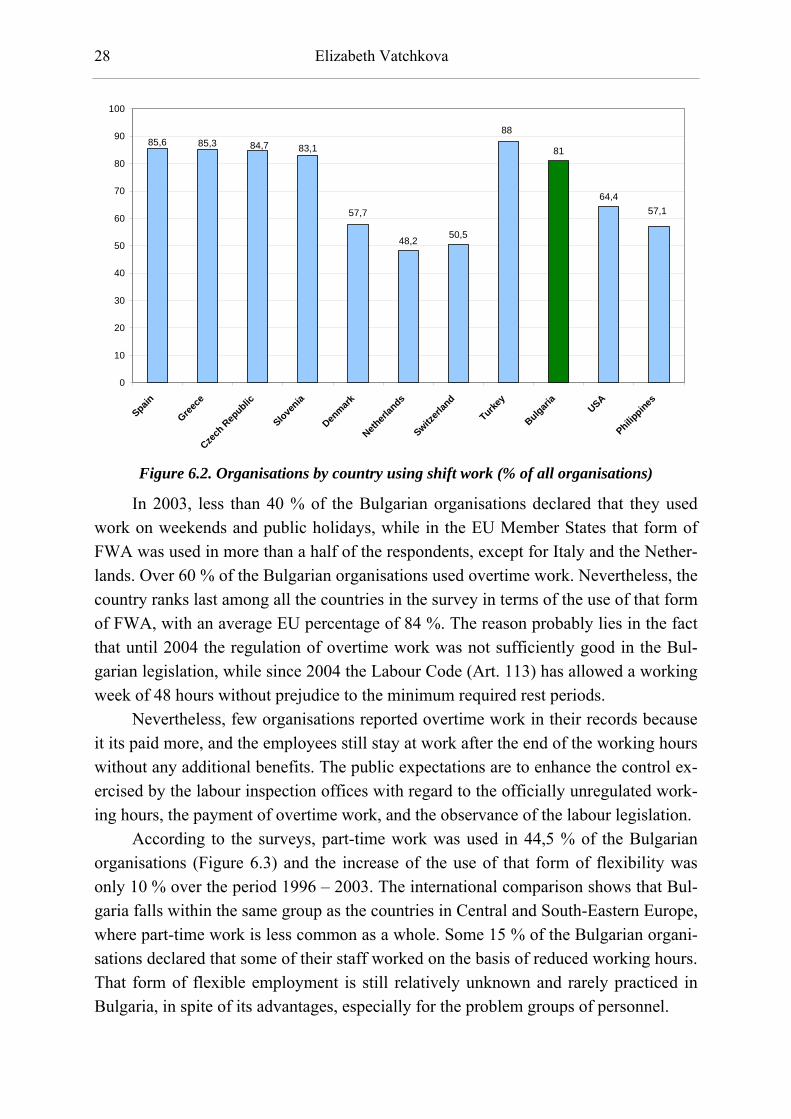
veys. The most widely spread FWA continued to be the shift work used by close to 70 % of the organisations in 2003. In comparison to the other countries involved in the survey, Bulgaria applied the average European levels of shift work (Figure 6.2), al-though it was much more common in many Central and South European countries.
28 Elizabeth Vatchkova
48,2 50,5
81
64,4
88
57,157,7
83,184,785,385,6
0
10
20
30
40
50
60
70
80
90
100
Spain
Greece
Czech
Rep
ublic
Slovenia
Denmark
Netherl
ands
Switzerl
and
Turkey
Bulgaria
USA
Philippines
Figure 6.2. Organisations by country using shift work (% of all organisations)
In 2003, less than 40 % of the Bulgarian organisations declared that they used work on weekends and public holidays, while in the EU Member States that form of FWA was used in more than a half of the respondents, except for Italy and the Nether-lands. Over 60 % of the Bulgarian organisations used overtime work. Nevertheless, the country ranks last among all the countries in the survey in terms of the use of that form of FWA, with an average EU percentage of 84 %. The reason probably lies in the fact that until 2004 the regulation of overtime work was not sufficiently good in the Bul-garian legislation, while since 2004 the Labour Code (Art. 113) has allowed a working week of 48 hours without prejudice to the minimum required rest periods.
Nevertheless, few organisations reported overtime work in their records because it its paid more, and the employees still stay at work after the end of the working hours without any additional benefits. The public expectations are to enhance the control ex-ercised by the labour inspection offices with regard to the officially unregulated work-ing hours, the payment of overtime work, and the observance of the labour legislation.
According to the surveys, part-time work was used in 44,5 % of the Bulgarian organisations (Figure 6.3) and the increase of the use of that form of flexibility was only 10 % over the period 1996 – 2003. The international comparison shows that Bul-garia falls within the same group as the countries in Central and South-Eastern Europe, where part-time work is less common as a whole. Some 15 % of the Bulgarian organi-sations declared that some of their staff worked on the basis of reduced working hours. That form of flexible employment is still relatively unknown and rarely practiced in Bulgaria, in spite of its advantages, especially for the problem groups of personnel.

National Report for Bulgaria, CRANET, 2006 29
98,9 98,7 98,5 98,2
65,2
48,3
12,2
23,6
44,5
92,995,4
55,1
0
20
40
60
80
100
120
Netherl
ands
Sweden
Austria
German
y
Slovenia
Cypru
s
Greece
Slovakia
Switzerl
and
Turkey
Bulgaria
USA
Figure 6.3. Organisations by country using part-time work (% of all organisations)
Bulgaria still lags behind the European practices of using flexible working hours very widely. For example, annual hours contracts were offered by 39,8 % of the Bul-garian companies and flexi-time was used in 30,6 % of them (Figure 6.4). The trend of increasing the use of those two types of flexible employment could be explained with the rapid growth of services and especially the tourist industry.
94,289,8 88,5
82,7
42,7
28,7
10,5
22,1
30,6
80,2
41,745,7
0
10
20
30
40
50
60
70
80
90
100
Sweden Germany Austria Finland Spain Greece France Italy Turkey Bulgaria USA Australia
Figure 6.4. Organisations by country using flexi-time (% of all organisations)

30 Elizabeth Vatchkova
Bulgaria traditionally has very high levels of fixed-term contract employment
(55,5 %) and seasonal/casual work contracts (42,7 %), following the global trends in their use. It still lags behind in the use of the opportunities offered by the “functional” flexibility. In more than a half of the companies involved in the survey, no job/position sharing was used. Home-based work was more widely spread but still on a very lim-ited scale by a meager 4,8 % of the organisations (Figure 6.5). The potential of these forms of flexible employment and teleworking will not be exhausted in the near future.
32,3
22,5
7,5 6,8 6,3 5,6
2,6
36,7
4,8
28,6
23,4
33,5
0
5
10
15
20
25
30
35
40
Sweden UK
Netherl
ands
Belgium
Greece
Hungary
Cypru
s
Slovenia
Spain
Norway
Bulgaria
USA
Figure 6.5. Organisations by country using home-based work (% of all organisations)
In comparison to the EU Member States, flexible employment is slower to pene-
trate into Bulgaria. Very common are flexible arrangements which are socially unat-tractive and more beneficial to the employers than to the employees, while the other forms of more efficient use of working time spread more slowly.
7. Appraisal of Employees
Since the beginning of the surveys of the staff appraisal systems in Bulgaria, a very uncommon phenomenon for Europe and the world has developed in Bulgaria, i.e. the predominance of formal appraisal systems for workers over those for managers. In 1996, managers were appraised in 40 % of the organisations involved in the survey, while workers were appraised in 59 % of them10 (Figure 7.1). That discrepancy was 10 Vatchkova, Е. (1999), Price Waterhouse Cranfield Project for International Strategic Human Resource De-
velopment in Bulgaria.

National Report for Bulgaria, CRANET, 2006 31
gradually leveled out in the following years. In 2003, an average of 60 % of the or-ganisations applied regular appraisal of the staff, while the respective share in the EU and North America was over 75 percent. The latest survey revealed that most of the organisations assessed specialists who were followed by the clerical staff, managers and manual workers.
48,4
34
40
55,454
56
52,9
47
42
47,8
57
59
30
35
40
45
50
55
60
65
1996 1999 2003
Management Prof/Technical Clerical Manual
Figure 7.1. Proportion of the workforce in Bulgaria actually assessed via regular formal
appraisal system (% of organisations)
In 2003, Bulgarian organisations introduced all sources of information about the assessment process in conformity with the best practices in the EU and the world. In 1999, the greatest role in the assessment of the personnel was played by line managers (in 67,3 % of the companies)11, while higher-standing managers were involved in the assessment in 47 % of them. In 2003, those indicators reached 96,7 % and 81,2 % re-spectively. The assessment of customers was used in 44,4 % of the organisations, which was twice higher than the EU average level. Less frequently, appraisal systems involved self-assessment, assessment by subordinates and peer assessment. Self-assessment was applied in 43,5 % of the companies, which was far below the EU av-erage level of 70 percent. Peers were involved in the assessment in one-third of the companies, which was above the EU average (18,2 %). In one-fifth of the cases, ap-praisal systems included as assessment by the subordinates, which was comparable to the EU average level.
11 Vatchkova, Е. (1999), Price Waterhouse Cranfield Project for International Strategic Human Resource De-
velopment in Bulgaria.
32 Elizabeth Vatchkova
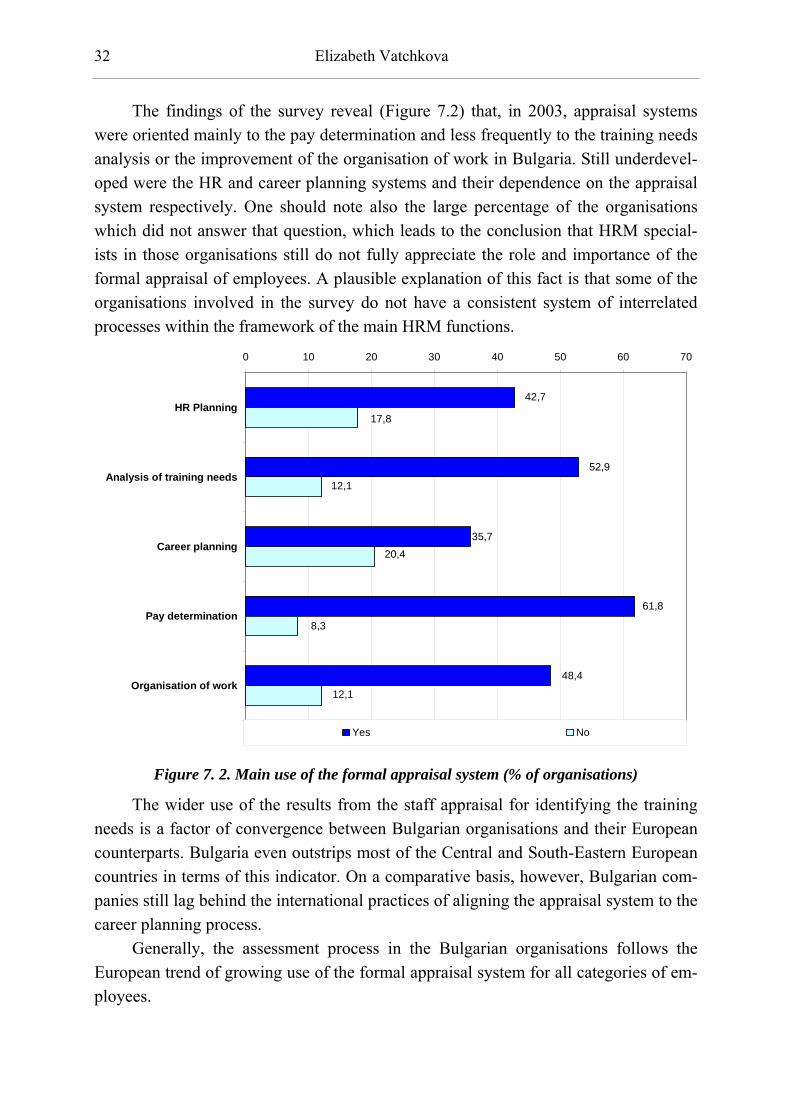
The findings of the survey reveal (Figure 7.2) that, in 2003, appraisal systems
were oriented mainly to the pay determination and less frequently to the training needs analysis or the improvement of the organisation of work in Bulgaria. Still underdevel-oped were the HR and career planning systems and their dependence on the appraisal system respectively. One should note also the large percentage of the organisations which did not answer that question, which leads to the conclusion that HRM special-ists in those organisations still do not fully appreciate the role and importance of the formal appraisal of employees. A plausible explanation of this fact is that some of the organisations involved in the survey do not have a consistent system of interrelated processes within the framework of the main HRM functions.
42,7
52,9
35,7
61,8
48,4
17,8
12,1
20,4
8,3
12,1
0 10 20 30 40 50 60 70
HR Planning
Analysis of training needs
Career planning
Pay determination
Organisation of work
Yes No
Figure 7. 2. Main use of the formal appraisal system (% of organisations)
The wider use of the results from the staff appraisal for identifying the training needs is a factor of convergence between Bulgarian organisations and their European counterparts. Bulgaria even outstrips most of the Central and South-Eastern European countries in terms of this indicator. On a comparative basis, however, Bulgarian com-panies still lag behind the international practices of aligning the appraisal system to the career planning process.
Generally, the assessment process in the Bulgarian organisations follows the European trend of growing use of the formal appraisal system for all categories of em-ployees.

National Report for Bulgaria, CRANET, 2006 33
8. Training and Development of the Staff
In the beginning of the 21st century, against the backdrop of the knowledge-based economy, the increase of the human capital provides an important competitive advan-tage of organisations. There are increasing efforts to improve the training and devel-opment of people at work and to establish learning organisations. The findings of the surveys confirm that HRM departments give an ever greater contribution to the speed-ing up of this process. Bulgarian organisations make growing efforts to develop the knowledge, skills and capabilities of their employees. In 2003, HRM departments played a leading role in the Bulgarian organisations involved in the survey with regard to the training and development of the staff (51 %) but in 69,4 % of them line manag-ers still had the decisive say in identifying the training needs (Figure 8.1). However, the opinion of employees themselves about the training was rarely taken into consid-eration, while trade unions had almost no influence in the process. In conformity with European practices, HRM departments in Bulgaria take over an increasing number of responsibilities for the training and development process from year to year. Over the period from 1996 to 2003, the decisions made by line managers on their own were re-duced from 40 % to 22 %, while the decisions of the HRM departments increased from 9 % to 16 %; in almost 60 % of the organisations they worked together (42 % of the companies in 1996).
1,9
51
5,1
33,1
51
69,4
4,5
20,4
0,6
38,2
1,9
0
10
20
30
40
50
60
70
80
The Individual Line Management HR Dept. Trade Union(s)
Defining training needs Designing training activities Implementing the training activities
Figure 8.1. Influence over training and development activities (% of organisations)
The need for growing efficiency of the training process calls for joint efforts of the whole management team, HRM departments, line managers and individual em-

34 Elizabeth Vatchkova
ployees. It is important to identify their specific duties in the design, implementation and maintenance of training, as well as to fine-tune their contribution to the attainment of tangible results in upgrading the quality of the workforce.
Over the last ten years, all transition countries have accepted the idea of the staff training and development as a major competitive advantage. There is a trend of in-creased investment in the enhancement of the skills and qualifications of the employ-ees in Bulgaria. Furthermore, the efficiency of training is fostered and an increasing number of organisations carry out training needs analysis. Over the period from 1996 to 1999, the number of the latter grew from 42 % to 44 % and the impact of training was measured in 60 % of the companies (compared to 53 % in 1996).
The Cranet survey comes to show that the organisations in the EU Member States spend some 2 % to 4 % of their annual payroll costs for training of the employ-ees12. In terms of this indicator, Bulgaria is ahead of all European and English-speaking nations. Bulgarian companies spent an average of 6,32 % of their annual pay-roll costs for training in 2003 (Figure 8.2). It should be noted that those resources were not so sizeable in absolute terms since the price of labour is low in Bulgarian compa-nies and the actual spending for training of employees is less than the one in the Euro-pean companies. The prevalence of the attitudes to invest mainly in equipment and technologies rapidly gives way to the preparedness to invest in human development.
6,21
10,67
4,32
6,32
1,46
2,192,20
2,99
3,553,654,024,04
0,00
2,00
4,00
6,00
8,00
10,00
12,00
Sweden
Greece
Hungary
Estonia
EU Avg
.
German
y
Slovakia
Cypru
s
Bulgaria
USA
Philippines
Nepal
% o
f ann
ual p
ayro
ll co
sts
Figure 8.2. Proportion of annual payroll costs spent on training
12 Survey on Comparative Human Resource Management (2006) International Executive Report 2005,
CRANET: 54.
National Report for Bulgaria, CRANET, 2006 35
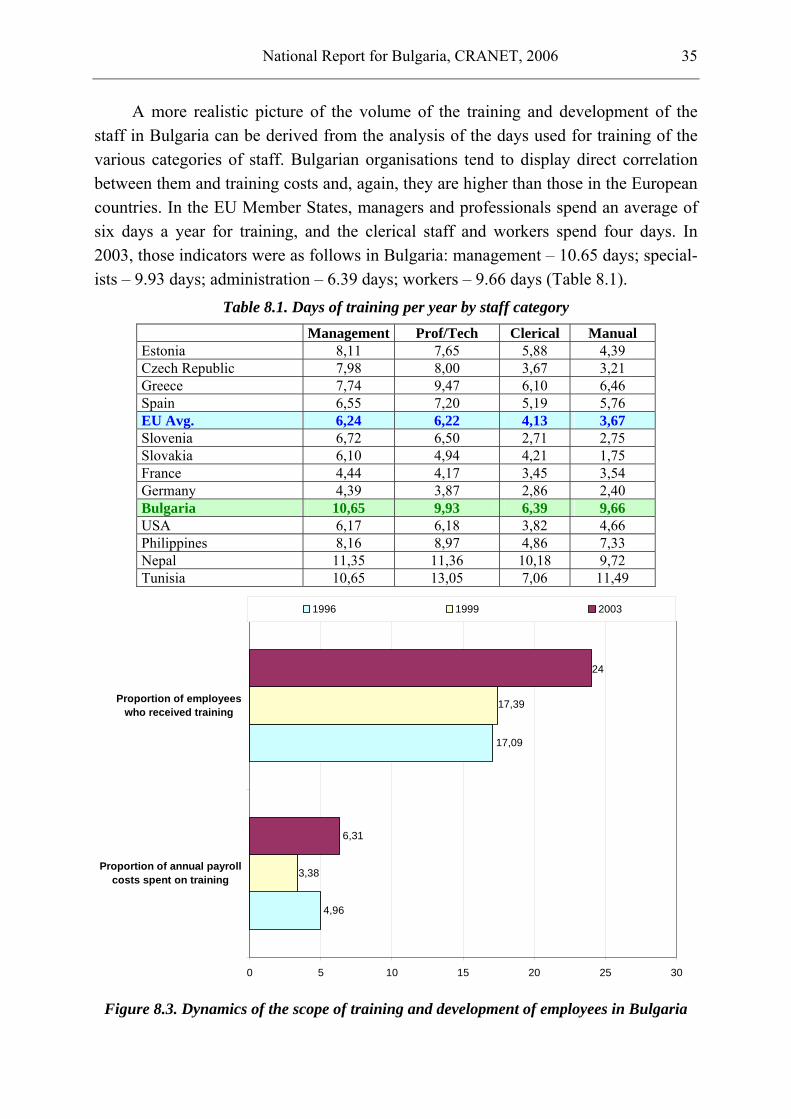
A more realistic picture of the volume of the training and development of the staff in Bulgaria can be derived from the analysis of the days used for training of the various categories of staff. Bulgarian organisations tend to display direct correlation between them and training costs and, again, they are higher than those in the European countries. In the EU Member States, managers and professionals spend an average of six days a year for training, and the clerical staff and workers spend four days. In 2003, those indicators were as follows in Bulgaria: management – 10.65 days; special-ists – 9.93 days; administration – 6.39 days; workers – 9.66 days (Table 8.1).
Table 8.1. Days of training per year by staff category Management Prof/Tech Clerical Manual Estonia 8,11 7,65 5,88 4,39 Czech Republic 7,98 8,00 3,67 3,21 Greece 7,74 9,47 6,10 6,46 Spain 6,55 7,20 5,19 5,76 EU Avg. 6,24 6,22 4,13 3,67 Slovenia 6,72 6,50 2,71 2,75 Slovakia 6,10 4,94 4,21 1,75 France 4,44 4,17 3,45 3,54 Germany 4,39 3,87 2,86 2,40 Bulgaria 10,65 9,93 6,39 9,66 USA 6,17 6,18 3,82 4,66 Philippines 8,16 8,97 4,86 7,33 Nepal 11,35 11,36 10,18 9,72 Tunisia 10,65 13,05 7,06 11,49
4,96
17,09
6,31
3,38
17,39
24
0 5 10 15 20 25 30
Proportion of annual payrollcosts spent on training
Proportion of employeeswho received training
1996 1999 2003
Figure 8.3. Dynamics of the scope of training and development of employees in Bulgaria
36 Elizabeth Vatchkova
The findings of the surveys concerning staff training and development processes
in Bulgarian organisations over the whole seven-year-long period point to the tangible increase of the scope and investments in this important sphere. The proportion of the employees trained did not change substantially between 1996 and 1999 but it greatly increased from 17 % to 24 % in 2003. Equally meaningful, although less in absolute terms, was the growth of the resources spent on training and development.
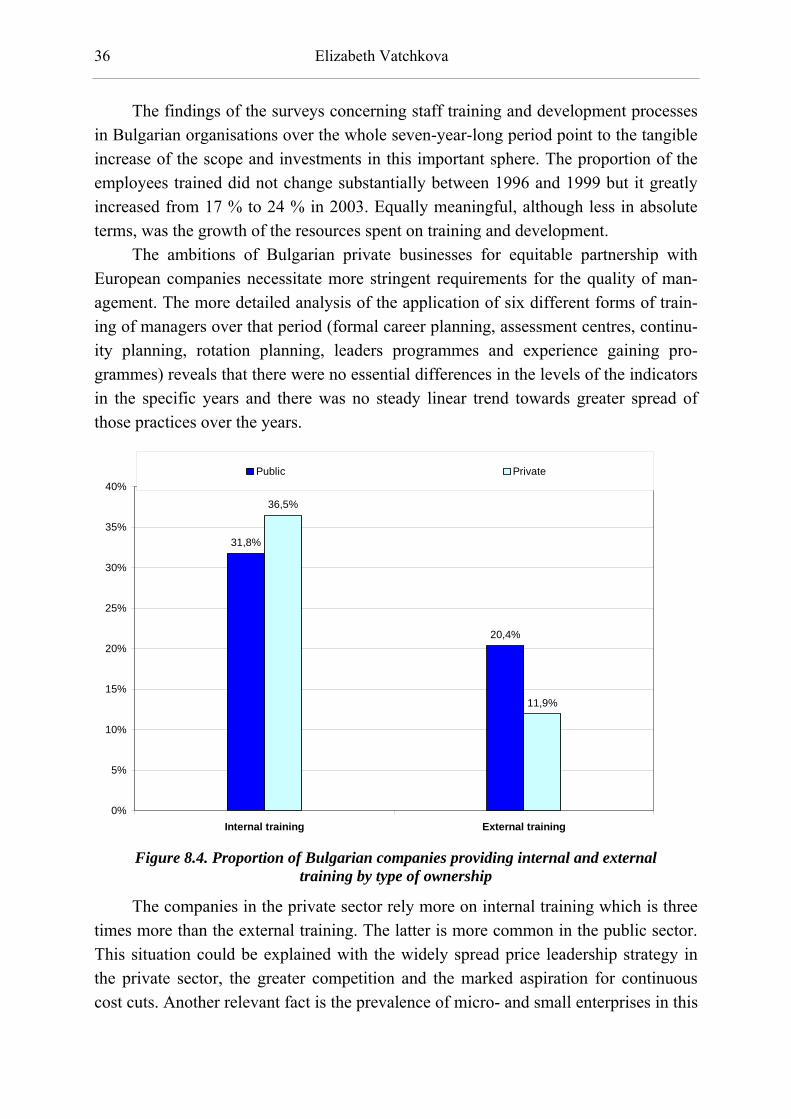
The ambitions of Bulgarian private businesses for equitable partnership with European companies necessitate more stringent requirements for the quality of man-agement. The more detailed analysis of the application of six different forms of train-ing of managers over that period (formal career planning, assessment centres, continu-ity planning, rotation planning, leaders programmes and experience gaining pro-grammes) reveals that there were no essential differences in the levels of the indicators in the specific years and there was no steady linear trend towards greater spread of those practices over the years.
31,8%
20,4%
36,5%
11,9%
0%
5%
10%
15%
20%
25%
30%
35%
40%
Internal training External training
Public Private
Figure 8.4. Proportion of Bulgarian companies providing internal and external
training by type of ownership
The companies in the private sector rely more on internal training which is three times more than the external training. The latter is more common in the public sector. This situation could be explained with the widely spread price leadership strategy in the private sector, the greater competition and the marked aspiration for continuous cost cuts. Another relevant fact is the prevalence of micro- and small enterprises in this

National Report for Bulgaria, CRANET, 2006 37
sector, which makes it difficult to find replacement or to share jobs, which is necessary in the case of external training.
4,4%
5,8%
7,7%
0,0% 1,0% 2,0% 3,0% 4,0% 5,0% 6,0% 7,0% 8,0% 9,0%
Between 200 and 300employees
Between 300 and 600employees
Over 600 employees
Figure 8.5. Proportion of training costs in Bulgaria by organisation size
As expected, the biggest Bulgarian companies, those with over 600 employees,
can afford to spend most on the training of their employees – 7,7 % of the annual pay-roll costs. There is substantial difference as compared to smaller companies but it is interesting to note that than training costs of companies with 300 to 600 employees were lower than those in companies with 200 to 300 employees. There was no distinct linear correlation between the size of the company and training costs. The same con-clusion is drawn also with regard to most companies in the EU.

38 Elizabeth Vatchkova
2,21
2,58
2,55
3,1
2,8
1,73
1,55
2,11
1,33
2,66
2,71
2,11
0 0,5 1 1,5 2 2,5 3 3,5
Production
Construction
Trade
Transportation
Finance
Services
Team projects Cross-organisational projects
Figure 8.6. Proportion of training techniques for managerial staff by sectors
of economy in Bulgaria
The numbers show that the application of team projects and cross-organisational projects as methods of professional development of managers is the greatest in the fi-nance and services sectors. As expected, construction ranks last in terms of these indi-cators, but the relatively low level of the application of these practices in manufactur-ing is quite surprising.
34,6%
41,6%
53%
15%
43%
35%
10%
16%
18%
64%
32%
33%
0% 10% 20% 30% 40% 50% 60% 70% 80% 90%
Production
Construction
Trade
Transportation
Finance
Services
Internal training External training
Figure 8.7. Proportion of employees who received training by types of training
and sectors of economy in Bulgaria
National Report for Bulgaria, CRANET, 2006 39
The internal form of training prevails in all sectors, except for transportation, where the external form dominates. The situation is reversed in trade. Manufacturing is characterized by a rather low level of application of external training. Both forms are equally used in services and finance.
44,0%
32,9%
4,5%
27,5%
7,5%
28,3%
0%
10%
20%
30%
40%
50%
Highly profitable With marginal profit Non-profitable
Internal training External training
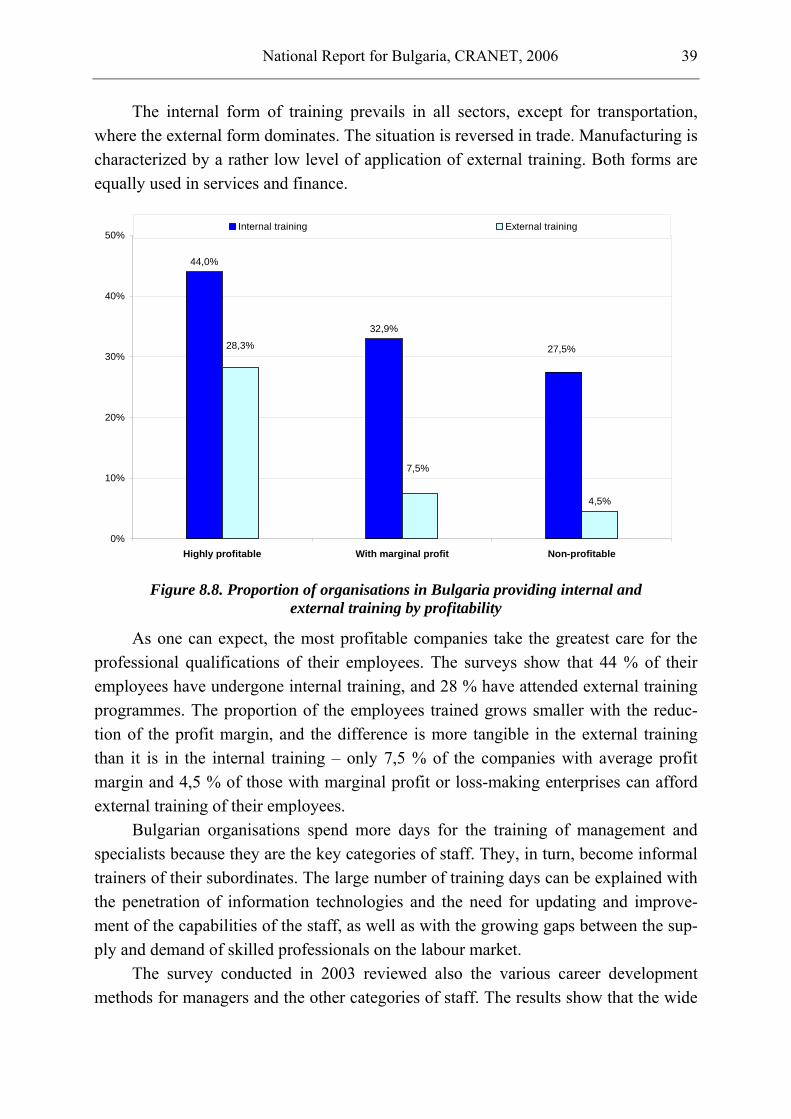
Figure 8.8. Proportion of organisations in Bulgaria providing internal and
external training by profitability
As one can expect, the most profitable companies take the greatest care for the professional qualifications of their employees. The surveys show that 44 % of their employees have undergone internal training, and 28 % have attended external training programmes. The proportion of the employees trained grows smaller with the reduc-tion of the profit margin, and the difference is more tangible in the external training than it is in the internal training – only 7,5 % of the companies with average profit margin and 4,5 % of those with marginal profit or loss-making enterprises can afford external training of their employees.
Bulgarian organisations spend more days for the training of management and specialists because they are the key categories of staff. They, in turn, become informal trainers of their subordinates. The large number of training days can be explained with the penetration of information technologies and the need for updating and improve-ment of the capabilities of the staff, as well as with the growing gaps between the sup-ply and demand of skilled professionals on the labour market.
The survey conducted in 2003 reviewed also the various career development methods for managers and the other categories of staff. The results show that the wide

40 Elizabeth Vatchkova
range of opportunities for career development of both managers (Table 8.2) and non-managers (Figure 8.9) is used in a quite limited manner in Bulgarian organisations.
Table 8.2. Extent to which the following methods for managerial career development are used in Bulgarian organisations (in %)
Training methods To a small extent To a large extent Entirely1. Participation in project team work 31,8 30,6 6,4 2. Experience schemes 28 28 5,7 3. Formal career plans 27,4 5,7 4,5 4. “High flyer” schemes 19,1 8,3 3,8 5. Networking 19,7 22,9 3,8 6. Special projects/tasks to stimulate learning 33,8 17,2 3,2 7. Involvement in cross-organisational (discipli-nary) functional tasks 23,6 15,3 2,5
8. Assessment centres 17,2 4,5 1,9 9. Secondments to other organisations 35,7 15,9 0,6 10. Succession plans 22,9 15,9 0,6 11. Planned job rotation 23,6 12,1 0,6
0
5
10
15
20
25
30
35
40
To a small extent To a large extent Entirely
Special projects/tasks to stimulate learningInvolvement in cross-organisational / disciplinary / functional tasksParticipation in project team workNetworkingExperience schemes
Figure 8.9. Extent to which the following methods for non-managerial career
development are used in Bulgarian organisations (in %)
The most intensively used tool for the career development of both managers and other employees is the participation in project team work practiced in over 60 % of the organisations. Experience schemes were most frequently used for the career develop-ment of employees in the Bulgarian organisations involved in the survey, whereas the

National Report for Bulgaria, CRANET, 2006 41
participation in cross-organisational/disciplinary/functional tasks was used only in one-third of them. Special projects/tasks to stimulate learning and networking are other career development methods familiar to and used by some Bulgarian companies.
In comparison to the organisations in the other countries involved in the survey of 2003, Bulgarian companies still lagged behind their European counterparts in the use of the above mentioned tools for the career development of employees and manag-ers in terms of the extent of their application, as w ell as in terms of the scope and di-versity of the methods used.
Cranet surveys continuously monitor the greatest challenges facing HRM units and specialists. The answers to the question about these challenges and the prioritiza-tion of the major HRM issues to be tackled by the professionals in this sphere, bring valuable information to theoreticians and practitioners, consulting and training compa-nies.
The available data lead to the conclusion that the greatest challenges facing HRM managers in Bulgaria would be the motivation, selection, retention and development of skilled employees over the period 2003 – 2006 (Table 8.3). In comparison to the pre-vious two surveys, where staff reduction and remuneration were the top two issues on the agenda, 2003 saw a shift in the priorities towards introduction and development of the main HRM functions, reiterating the growing role of the human resource manage-ment for the competitiveness of Bulgarian organisations. Table 8.3. Major challenges for personnel / HRM in Bulgarian organisations over the next
3 years (% of responded organisations) Challenges 1999 Challenges 2003
1. Staff reduction/Mergers and ac-quisitions 12,3 1. Motivation 11
2. Staff remuneration 7 2. Recruitment, selection and reten-tion 8,6
3. Motivation 5,3 3. Competencies development 5,9 4. Training and development 5,3 4. Career planning 4,7
5. Restructuring 3,5 5. Organisational culture 6. change management 4,3
9. Pay and Benefits
Reward, compensation and motivation invariably attract the greatest interest of both employees and employers. The major changes in this highly sensitive and con-flicting area of the human resource management are as follows: decentralization of the decision-making process concerning the pay; growing correlation between pay and performance; expanding scope of motivation through ownership and profit sharing schemes. The empirical data reveal a distinct trend of decentralization of the determi-

42 Elizabeth Vatchkova
nation of the basic pay from the national and regional levels to the level of the individ-ual enterprise or individual employee (Figure 9.1).
19,7 20,4 19,7
4,5
29,9
36,333,1
25,5
16,6
30,6
35
39,5
50,3
31,2
25,5
18,5
8,37
8,3
28,7
0
10
20
30
40
50
60
Management Professional/ Technical Clerical Manual
National / industry-wide Regional Company / division Establishment / site Individual
Figure 9.1. Level of determination of basic pay in Bulgarian organisations ( %)
The percentage of the organisations where managers negotiated their salary on an
individual basis grew from only 16 % in 1996 and 29 % in 1999 to 50,3 % in 2003. At the same time, the establishment of the pay for managers at the national level de-creased from 36 % of the organisations involved in the survey in 1996 to 19,7 % in 2003. The salaries of specialists and the clerical staff are typically negotiated at the company or division level (in 36,3 % of the companies in 1996 and 33,1 % in 2003) or individually (31,2 % and 28,7 % respectively). The pay is determined at the enterprise or division level most frequently for workers and most rarely for managers. In com-parison to the other countries involved in the international survey, Bulgaria is in the same group together with the countries from the eastern bloc (Slovenia, the Czech re-public, Hungary and Estonia), where the negotiating of the pay at the com-pany/enterprise level is more widely spread than the individual arrangements in gen-eral.
The alignment of pay to performance has become increasingly common in Bul-garia for the recent years. In 1996, 67 % of the respondents declared that they had in-creased the variable pay element of the remuneration. The same trend continued in 46 % of the companies in 1999, too. In 2003, the payment of all categories of staff var-ied typically in accordance with their individual performance (Figure 9.2).

National Report for Bulgaria, CRANET, 2006 43
49,7
43,9 42,7
26,121,7
17,2
29,928,7
48,4
28,728
46,5
0
10
20
30
40
50
60
Management Professional/ Technical Clerical Manual
Team/department performance Individual performance Company-wide performance
Figure 9.2. Types of determination of variable pay in Bulgarian organisations
by staff category (in %)
In the case of managers’ salaries, 46,5 % of the organisations took into account
the performance of the company. The team performance of the specialists was used in 30 % of the companies and that of managers was considered in 28,7 % of the busi-nesses. In state-owned organisations the flexible pay forms were not common, al-though some of them introduced pilot projects experimenting payment schemes on the basis of the individual or team performance. The additional benefits and non-financial incentives gradually lost the popularity they enjoyed under socialism, although some of them have recently been revived mainly in multi-national companies.
A relatively large portion of Bulgarian organisations have adopted variable pay schemes. The international survey reveals that, in 2003, the most common form was the pay according to the individual performance (in over 28 % of the Bulgarian com-panies) followed by payment according to the company-wide performance (20 %), while the dependence on the team performance was lower, as was the global trend (Figure 9.3). Still, the alignment of the pay to performance was less widely spread than in was in the other Central and Eastern European countries involved in the survey.

44 Elizabeth Vatchkova
0 10 20 30 40 50 60 70 80 90
Sweeden
UK
Germany
Italy
Spain
Slovenia
Hungary
Slovakia
Bulgaria
USA
Australia
Team Individual Collective/ Organization
Figure 9.3. Level of determination of variable pay (% of organisations)
The latest surveys reveal that some new incentives related to the financial par-
ticipation of the employees in the company gradually come to Bulgaria (Table 9.1).
Table 9.1. Proportion of Bulgarian organisations using long-term incentive schemes (%)
Employee share schemes Profit sharing Stock options
1996 1999 2003 1996 1999 2003 1996 1999 2003 Management 11 19 22,9 11 17,3 28,7 - 19,3 19,7 Prof/Tech 7 12 12,7 8 11,3 16,6 - 12 15,3 Clerical 6 11 10,8 5 6 15,3 - 10,7 14,6 Manual 7 10 10,2 3 6 15,9 - 10 13,4
These schemes are more common among managers and specialists and less used as incentives for the clerical staff and manual workers. In 2003, the application of fi-nancial incentive schemes increased for all categories of staff – an average of 14 % of the private organisations in Bulgaria used employee share schemes as additional incen-tives for the staff, 19 % of them motivated their personnel through profit sharing schemes, and 15,75 % offered stock options.

National Report for Bulgaria, CRANET, 2006 45
13,9%
38,9%38,9%
48,5%
55,4%
35,6%
0%
10%
20%
30%
40%
50%
60%
Team performance Individual performance Company performance
Public Private
Figure 9.4. Proportion of Bulgarian organisations offering variable pay by type
of ownership (in %)
The difference between the private and the public sectors in the extent to which
payment varies in accordance with the types of performance is quite meaningful. It is most marked with regard to the dependence on collective performance (applicable in 35,6 % in the private businesses and 13,9 % of the state-owned companies) and the weakest with regard to the dependence on the company-wide performance (applicable to 48,5 % of the private companies and 38,9 % in the state-owned ones). The private and the public sectors differ substantially also in terms of the individual contribution of the employees. Naturally, private business tries to motivate its staff for individual contribution. Private businesses, as a whole, tend more often to align the pay of man-agers to the company-wide performance, the collective performance, or the individual performance of the manager.

46 Elizabeth Vatchkova
22,9%
12,7% 10,8% 10,2%
29,9%
17,2%15,3% 15,3%
18,5%
14,6%14,0% 12,7%
0%
10%
20%
30%
40%
50%
60%
70%
80%
Management Prof/Tech Clerical Manual
Employee share schemes Profit sharing Stock options
Figure 9.5. Proportion of Bulgarian organisations offering long-term incentives
schemes by type of ownership (%)
The difference between the public and the private sectors is even greater with re-gard to the forms of participation in the profit sharing and ownership of the organisa-tion. All three incentive schemes are much more widely spread in the private sector. According to the results of the survey conducted in 2003, one in four companies of-fered stock options to the managers, and one in three companies offered them profit sharing schemes.
39,4%
62,1%
18,8%
44,8%
54,5%
34,4%
0%
10%
20%
30%
40%
50%
60%
70%
Highly profitable Marginally profitable Not profitable
Team performance Individual performance
Figure 9.6. Proportion of Bulgarian organisations by profitability offering variable
pay to the management (in %)

National Report for Bulgaria, CRANET, 2006 47
It is interesting to trace out the behaviour of organisations with different profit-ability and their tendency to reflect the individual or collective performance in the size of the pay of their managers. As expected, the difference between profitable and loss-making companies is obvious. Managers’ salaries vary most strongly in accordance with the collective performance (45 % of the organisations) and the company-wide performance (62 % of the organisations) in the case of highly profitable organisations. Marginally profitable companies exhibit an attitude comparable to that of the rich companies to motivate the managers depending on individual and collective perform-ance. Loss-making or non-profitable companies align managers’ salaries to perform-ance twice less frequently.
19,8%
36,4%
16,7%
33,3%
10%
16,7%
29,1%
36,4%
50%
22,2%
10%
8,3%
22,1%
18,2%
16,7%
11,1%
10%
0% 10% 20% 30% 40% 50% 60% 70% 80% 90% 100%
Production
Construction
Trade
Transportation
Finance
Services
Employee share schemes Profit sharing Stock options
Figure 9.7. Proportion of Bulgarian organisations by economic sectors offering long-term
incentive schemes to the management (in %)
The sectoral practices in motivating the managers through ownership and profit sharing schemes have also been surveyed. Profit sharing schemes are most common in trade and manufacturing. Stock options are most popular in construction and transpor-tation. The right to purchase stock/shares is not used in the sphere of services to moti-vate managers but it is most common in the practices of building companies.
Generally, trade and construction take the lead in the incentive schemes using these methods that are new to Bulgaria.
Construction and trade are among the most rapidly growing sectors in Bulgaria under the conditions of the market economy. Construction suffers from big shortage of staff, especially skilled managers at all levels. This could partially explain the aspira-

48 Elizabeth Vatchkova
tion to use modern incentive schemes for more effective recruitment and retention of managers.
22,1%
36,4%
58,3%
33,3%
60%
16,7%
47,7%
45,5%
66,7%
55,6%
80%
25%
40,7%
45,5%
83,3%
66,7%
60%
50%
0% 50% 100% 150% 200% 250%
Production
Construction
Trade
Transportation
Finance
Services
Team performance Individual performance Company-wide performance
Figure 9.8. Proportion of Bulgarian organisations by economic sectors offering
variable pay (in %)
The extent of dependence of managers’ salaries on the three types of perform-ance reveals that the financial sector takes the leading position in two out of the three practices – incentives depending on the collective and individual performance. 60 % of financial companies pay their managers in accordance with the team performance and 80 % pay according to the individual performance. Trade is the leading sector in terms of the alignment of the managers’ pay to the company-wide performance. Services substantially lag behind the others in terms of the dependence of the pay on the collec-tive and individual performance.
The new forms of motivating the staff are a sign of a general trend in the organi-sation to motivate the staff through the company and its performance – another area of convergence with the EU Member States and the best international practices.
10. Labour Relations and Communications
The introduction of modern models and methods of business communications in the Bulgarian organisations speeds up the modernization of labour relations and cre-ates preconditions for the development of a single European business communication environment. The survey of its development trends in Bulgaria and their comparison to

National Report for Bulgaria, CRANET, 2006 49
the dynamic patterns of European communication practices make it possible to assess the progress of Bulgarian companies in this sphere and the areas of lagging g behind, which would impede the development of a homogeneous European communication environment.
The surveys show that there is a growing trend of long-term orientation to the management of communications in the Bulgarian organisations – unconvincing as it is, there is a growing share of companies which work out communication strategies and policies.
It should be immediately clarified that these strategies and policies as elements of industrial relations have not turned into the subject-matter of management by either the top management or by HRM departments yet, as the predominant practice is in devel-oped European countries. In France, Sweden and Spain, for instance, the main respon-sibility for industrial relations is taken up by the HRM departments in over 50 % of the companies, while in Italy this is the case in 70 % of the companies.
Unlike the EU Member States, Bulgaria, in 2003, had mainly line managers who had the major responsibility for industrial relations in 60 % of the companies. That was the result of the dominant organisational culture in most Bulgarian companies and also of the fact that in many organisations with international participation industrial relations policies are established at the level of their international headquarters and implemented directly under the supervision of the line managers.
The forms of communication used by the Bulgarian companies with more than 200 employees ranked as follows in terms of their spread in 2003 (Table 10.1):
Table 10. 1. Proportion of Bulgarian companies using different forms of communication
with employees in 2003 Types of communication Proportion
Immediate supervisor 74% Suggestion schemes 61% Directly by senior managers 61% Regular workforce meetings 51% Team briefings 47% Union representatives and works council 40% Attitude surveys 35%
The survey reveals that labour relations and communications have undergone a process of substantial dynamism for the last three years (Figure 10.1).

50 Elizabeth Vatchkova
24,2
45,2
19,1
24,2
44,6
31,8
5,17 6 5,7
19,7
10,8
19,7
29,3
12,7
22,3
37,6
22,3
3,2 3,2
0
5
10
15
20
25
30
35
40
45
50
Electroniccommunication
Verbally, direct toemployees
Written, direct toemployees
Team briefings Throughrepresentative staff
bodies
Increased Same Decreased Not used
Figure 10.1. Proportion of Bulgarian organisations where during the last three years has
been a change in communication of major issues to employees (in %)
In practice, however, the quantitative and qualitative changes in business com-
munications are not adequate to the demands of modern times. In 2003, the world saw substantial increase of the use of electronic communication means, while 19,7 % of the Bulgarian organisations did not use them at all (Figure 10.1).
Only one-quarter of the companies increased their communication via the e-mail. The growth of the use of team briefings involved the same proportion of companies. Over the period from 1999 to 2003, Bulgarian organisations relied most heavily on verbal communications. Communications in writing increased much more slowly. The weakest dynamism was observed in the use of the representative bodies of the em-ployees as an organisational communication means.
An important prerequisite for the democratization of labour relations and busi-ness communications is the opportunity for feedback between the employees and the management. The answers to the question how the ways in which employees commu-nicated their opinions and views on major issues of the organisational functioning changed in 2003 are presented in Table 10.2.

National Report for Bulgaria, CRANET, 2006 51
Table 10.2. Change in the way employees communicate their views to the management of Bulgarian organisations in the last three years (in %)
In-creased Same De-
creased Not used
1. Direct to senior manager 19,1 33,1 8,9 25,5 2. Through immediate supervisor 25,5 43,9 4,5 13,4 3. Through trade unions and works council 8,3 22,9 8,9 38,9 4. Team briefings 15,3 17,2 6,4 34,4 5. Trough regular workforce meetings 17,8 22,9 10,2 29,9 6. Suggestion schemes 21,0 31,2 8,9 14,6 7. Attitude surveys 13,4 18,5 3,2 36,3
The dynamic comparison of the answers to this question over the period 1996 – 2003 comes to show that employees communicated their views to their line managers and the top management more rarely. The communication through trade unions and workers’ councils was not used intensively – those two communication channels were never used in 38,9 % of the organisations. Team briefings were generally used in a greater number of organisations in comparison to 1999. The most active growth over the period 1999 – 2003 was noted in the encouragement of suggestions given by the employees and their opinion was polled in two-thirds of the Bulgarian organisations. The wider spread of modern techniques for polling the opinion of the employees about the management of the company is the result of the entry of a greater number of multi-national companies on the Bulgarian market and the aspiration of local organisations to keep abreast with the modern two-way communication methods.
Trade unions are considered to be a traditional communication channel between employers and employees in most countries. The survey makes a review of their roe in the development of a democratic model of organisational communications in Bulgaria. In 2003, in 73,3 % of the Bulgarian organisations most of the employees declared that they were trade union members (Table 10.3). Notwithstanding the lack of long trade union traditions, the employees in the Bulgarian organisations involved in the survey were trade union members more frequently than their peers in Central and Eastern Europe.
Table 10. 3. Approximate proportion of total number of employees who are members of a trade union (in %)
Country 0% 1-10% 11-25% 26-50% 51-75% 76-100%1 2 3 4 5 6 7
Estonia 65,2 13,9 7,8 4,3 2,6 0,9 Slovakia 41,6 5,5 6,3 14,1 14,1 7,8 Greece 32,4 13,3 8,1 11,6 10,4 21,4 Hungary 32,2 8,5 11,9 18,6 18,6 3,4 Cyprus 13,1 2,4 2,4 4,8 6 70,2 Finland 0,3 0,3 1,4 5,2 18,3 67,6 Sweden 0 0,8 2,6 6,1 19,5 66,1 Denmark 0 2,5 4,9 10,7 23,3 53,9

52 Elizabeth Vatchkova
1 2 3 4 5 6 7 EU Avg. 15,5 12,5 10,8 13,4 14,7 20,7 Turkey 49,4 1,3 3,1 5,6 16,9 20,6 Bulgaria 26,7 6,7 8 10,7 18,7 15,3 USA 57 8,2 11,7 9,4 6,6 5,5 Philippines 71,4 10,2 2 8,2 4,1 4,1
Many Bulgarian companies stated that the influence of trade union organisations was reduced or not felt at all in work processes for the last three years (Figure 10.2). Trade unions increased their influence only in 10,2 % of the respondents and kept it unchanged in another one-third of the companies. Nevertheless, the unionization of Bulgarian companies compared to the other European countries was relatively high. In 15 % of the companies it ranged from 1 % to 25 %, and in another 15 % it ranged be-tween 76 % and 100 percent. The most likely reason is that the newly established or-ganisations in the private sector have not adopted this form of association of the em-ployees to protect their collective interests yet, while trade union membership is very common in big companies with long traditions.
10,2
36,3
10,8
33,1
24
51
2118
28
38
11
0
10
20
30
40
50
60
Increased Same Decreased No influence
1996 1999 2003
Figure 10.2. Proportion of Bulgarian organisations by change of Trade Union influence
during the last three years
At the same time, less organisations recognize trade unions as parties to the col-
lective bargaining process; their share dropped from 75 % in 1996 to 49,7 % in 2003 (Figure 10.3). One of the reasons is probably the decentralization and the tendency to apply individual negotiations between employers and employees.

National Report for Bulgaria, CRANET, 2006 53
49,7
22
75
36,9
0
10
20
30
40
50
60
70
80
90
100
Yes No
1996 2003
Figure 10.3. Proportion of Bulgarian organisations recognising Trade Unions
for the purpose of collective bargaining (%)
In comparison to all information exchange forms surveyed, the most substantial decline was observed in the communication through trade unions, which was largely due to the weakening of their role and the fact that Bulgarian employees hardly recog-nized them as a way to protect their interests. Public opinion polls reveal that trade un-ion organisations do not enjoy great credibility among Bulgarian citizens. This is an-other reason for the weakened role of trade unions. The reduced influence of trade un-ions can be explained also with the fact that the share of state-owned companies has decreased in Bulgaria and it is exactly in the public sector where trade unions hold the strongest positions.
The share of the organisations having a joint consultative committee or a work-ers’ council is also much smaller in comparison to most European countries. The share of the organisations having such a body remained almost unchanged over the years: 42 % in 1996, 40 % in 1999 and 42 % in 2003. There was observed certain resistance against their introduction on part of both employers and trade unions in Bulgaria. Some employers are afraid of restriction of their power in the enterprises, while trade unions are concerned with the threat that such bodies would protect the interests of the employers or be preferred by the employees as representatives of their interests13.
The Cranet survey conducted in 2003 included two new questions related to an-other form of democratization of labour relations and communications – the member-
13 Vatchkova, Е. (1998), Human resource Management, European Comparative Surveys: 161.

54 Elizabeth Vatchkova
ship of organisations in employers’ associations and the extent to which those associa-tions protected the interests of the companies14. 51 % of the respondents in Bulgaria were members of various employers’ associations, which was lower than the EU aver-age (67 %) (Figure 10.4). Bulgaria came close to the United Kingdom in terms of the degree of association of employers (48,4 % of the cases) and was ahead of former so-cialist countries like Estonia (40 %), Slovakia (35 %) and Hungary (27 %). Over 90 % of the organisations in Bulgaria pointed out that those associations met their needs fully or to a certain extent, which was probably due to the lower expectations of Bul-garian employers from their activities in comparison to their European counterparts.
88 87,5 87,0
67,7
48,4
40,5
23,7
50,8
78,8
34,535,1
97,4
0
20
40
60
80
100
120
Sweden France Finland Belgium EU Avg. UK Estonia Slovakia Hungary Bulgaria USA Australia
Figure 10.4. Proportion of organisations members of an employers’ association
The survey covered the level of awareness of the employees about the business
strategy and the financial performance of the organisations. It is encouraging to note that the awareness of all categories of staff about the business strategy of the organisa-tions increased in 2003 compared to 1999 (Figure 10.5).
14 Vatchkova, Е. (2003), Cranfield International Strategic Human Resource Management Survey in Bulgaria.

National Report for Bulgaria, CRANET, 2006 55
7881
59
30
17
31
79 78
44
60
21
11
50,3
18,5
47
67
26
48
23,6
49,7
35
47,8
80,384,7
0
10
20
30
40
50
60
70
80
90
Strategy Financialresults
Strategy Financialresults
Strategy Financialresults
Strategy Financialresults
Management Prof/Tech Clerical Manual
1996 1999 2003
Figure 10.5. Proportion of Bulgarian organisations formally briefing employees about
the business strategy and financial results by employee category (in %)
Still, there is significant lagging behind of the management from European prac-tices with regard to the level of awareness of key strategic and financial issues. This fact could be partially explained with the insufficient dissemination of corporate strategies. The lack of information among managers on the financial results in 20 % of the companies is a definite sign of weaknesses in their activity. A half of Bulgarian businesses inform their administration about the financial results of the company and 35 % provide information about the strategy of the organisation.
In closing, we can point out that there is a trend towards greater intensity of com-munication between the management and its subordinates, and taking into account of the opinion of the team becomes an increasingly common practice. However, more efforts are needed on both sides to more effectively use all forms of information ex-change.
11. Summary
The increased competition among organisations in the context of the human re-source management and development in Bulgaria generates a wide range of discus-sions, involving various stakeholders’ groups to an ever greater extent. One of the ma-jor discussion issues, i.e. the replacement of the administrative function of HRM by the strategic one, is shifting from the theoretical plane to the field of practical solu-tions.
56 Elizabeth Vatchkova
There is growing interest in improving the dialogue between the top management
and the staff of human resource management units. Greater importance is attached to the HRM functions to add value, to ensure more effective business partnerships, to de-velop “business-oriented HRM”, to promote internal entrepreneurship, and to foster the competitive advantages of the organisation through people. The rapid change of the profile of the HRM specialist and the continuously changing requirements to this position evoke a new type of conflicts. Problems occur in connection with the under-standing of the scope and specificities of his or her work. The managers of HRM units are assigned tasks that are not related to their job or they have to combine activities which can hardly go together; the expectations from their performance grow unjusti-fiably high. Many companies, which perceive human resource specialists as strategic partners in the management, find it difficult to strike a proper balance between their rights and obligations, as well as between the expected results and the resources allo-cated for their attainment. In fact, this problem explains the increased turnover of HRM managers in Bulgaria.
The surveys reveal that an increasing number of HRM activities used in Europe become day-to-day practices in Bulgaria. Under the influence of the economic changes in the country and the EU membership, more than three-quarters of the Bulgarian or-ganisations had a separate HRM unit, while HRM managers in 30 % of them were members of the Board of Directors or an equivalent management body in 2003.
The strategic orientation of Bulgarian companies is enhanced. More and more organisations work out corporate strategies, business strategies and HRM strategies. However, the HRM units are still insufficiently active in the development of strategic plans.
In 2003, Bulgarian line managers retained their leading positions in determining HRM policies. There was a tendency to increase the shared responsibility with HRM specialists in connection with such basic functions as the selection of employees and the increase or reduction of staffing levels in organisations. Unlike the European and international practices, the role of the HRM units is still very weak with regard to payment issues and to the establishment of industrial relations.
Information technologies penetrate into the HRM sphere in Bulgaria at very high rates; in 2003, over a half of the Bulgarian organisations used independent software for HRM purposes and another one-fifth of them used an integrated management informa-tion system, including HRM.
The opportunities for career development of the staff improve. In 2003, more than a half of the Bulgarian companies recruited their management team internally. The selection and recruitment of young talents is a common practice in 22 % of the organisations, which find highly skilled professionals directly at the universities.

National Report for Bulgaria, CRANET, 2006 57
In 2003, Bulgaria came closer to the European practice of using the individual in-terview as a more common approach than the selection based on documents, which held the leading position until 1999. An increasing number of organisations require references to be produced. Psychometric tests are more widely used but the assessment centres and graphology are not quite familiar yet and they are rarely applied as selec-tion methods.
The most widely spread form of flexible employment in 2003 continued to be the shift work, followed by overtime and part-time work. Fixed-term labour contracts proved to be most popular in Bulgaria among all countries involved in the survey. Home-based work is hardly used and its potential is not likely to be tapped in the near future.
The assessment of employees is more widely spread than it was in 1996. 2003 saw a shift in the Bulgarian practice, which was untypical of Europe and the world, to have workers assessed more frequently than managers. However, the appraisal systems continue to be used primarily for determination of the pay and they are rarely con-nected to the planning of human resources or their career.
The substantial increase of investment in the training and development of the staff is an important proof of the recognition of the human resource significance for the development of a competitive advantage on the European market. In 2003, the in-vestment in those activities accounted for the largest portion of the annual payroll costs, which was two to three times more than the investments in the EU companies but, at the same time, labour costs remained the lowest in Bulgaria. The discrepancy between the training and the supply of skilled staff on the Bulgarian labour market calls for longer training in comparison to the other EU Member States so that to have managers, specialists and workers spend an average of ten days a year for training, and the clerical staff – over six days. Notwithstanding the need for better use of the poten-tial of the available staff, the organisations use the methods of career development to a very limited and insufficient extent.
As far as the payment of the staff is concerned, there has been observed a steady trend towards decentralization in the establishment of the basic pay from the national and regional levels to the company-wide and individual levels for the last few years. The variable component of the pay is increased in accordance with the individual per-formance and also the company-wide performance in the case of managers. The forms of providing incentives through profit sharing and schemes for participation in the ownership, which are quite well-known in Europe, gradually come to Bulgaria, too.
In 2003, trade unions continued to reduce their participation in the collective bar-gaining and their influence was weakened in 42 % of the organisations. Communica-tion methods in Bulgarian companies come closer to the European and international

58 Elizabeth Vatchkova
practice through the wider use of computer systems, as well as team briefings, encour-agement of suggestions and consideration of the employees’ opinion for better and more effective feedback to the management.
References
1. Beardwel, I., Holden L. (1994), Human Resource Management, Pitman. 2. Condition of the Human Resource Management in Bulgaria, Labour Pano-
rama, Nos. 4 - 5, 2006. 3. Hodgetts, R., Kuratko, D. (1986), Management. HBJ. 4. Survey on Comparative Human Resource Management (2006) International
Executive Report 2005, CRANET. 5. Vatchkova, Е. (1996), Price Waterhouse Cranfield Project for International
Strategic Human Resource Management in Bulgaria, IBS Transbusiness - E 6. Vatchkova, Е. (1998), Human Resource Management, European Comparative
Surveys, Stopanstvo University Publishing House. 7. Vatchkova, Е. (1999), Price Waterhouse Cranfield Project for International
Strategic Human Resource Management in Bulgaria, IBS Transbusiness - E 8. Vatchkova, Е. (2003), Cranfield Survey of the International Strategic Human
Resource Management in Bulgaria, IBS Transbusiness - E