surveying livelihoods, service delivery and governance
TRANSCRIPT

Working Paper 30C.W.J. de Milliano, A. Ferf, J. Oude Groeniger and M. MashandaMarch 2015
Surveying livelihoods, service delivery and governance: baseline evidence from the Democratic Republic of Congo
Researching livelihoods and services affected by conflict
Uganda
Burundi
Tanzania
ZambiaAngola
Congo
Gabon
Cameroon
South Sudan
Central AfricanRepublic
DemocraticRepublic ofthe Congo
RwandaBukavuSouthKivu

i
About us
Secure Livelihoods Research Consortium (SLRC) aims to generate a stronger evidence base on how
people in conflict-affected situations (CAS) make a living, access basic services like health care,
education and water, and perceive and engage with governance at local and national levels. Providing
better access to basic services, social protection and support to livelihoods matters for the human
welfare of people affected by conflict, the achievement of development targets such as the Millennium
Development Goals (MDGs) and international efforts at peace building and state building.
At the centre of SLRC’s research are three core themes, developed over the course of an intensive one-
year inception phase:
State legitimacy: experiences, perceptions and expectations of the state and local
governance in conflict-affected situations
State capacity: building effective states that deliver services and social protection in
conflict-affected situations
Livelihood trajectories and economic activity in conflict-affected situations
The Overseas Development Institute (ODI) is the lead organisation. SLRC partners include the
Afghanistan Research and Evaluation Unit (AREU), the Centre for Poverty Analysis (CEPA) in Sri Lanka,
the Feinstein International Center (FIC, Tufts University), Focus1000 in Sierra Leone, the Food and
Agriculture Organization (FAO), Humanitarian Aid and Reconstruction of Wageningen University (WUR) in
the Netherlands, the Nepal Centre for Contemporary Research (NCCR), and the Sustainable
Development Policy Institute (SDPI) in Pakistan.
Secure Livelihoods Research Consortium
Overseas Development Institute
203 Blackfriars Road
London SE1 8NJ, UK
T +44 (0)20 7922 8221
F +44 (0)20 7922 0399
W www.secureliveilhoods.org
Disclaimer: The views presented in this paper are those of the
author(s) and do not necessarily represent the views of DFID,
the EC, Irish Aid, SLRC or our partners, SLRC Working Papers
present information, analysis on issues relating to livelihoods,
basic services and social protection in conflict-affected
situations. This and other SLRC reports are available from
www.securelivelihoods.org. Funded by DFID, the EC and Irish
Aid.
Readers are encouraged to quote or reproduce material from
SLRC Working Papers for their own publications. As copyright
holder, SLRC requests due acknowledgement and a copy of
the publication

ii
Contents
About us i
Tables and figures iii
Acknowledgements iv
Preface v
Acronyms vi
Executive summary viii
1 Introduction 1
2 Background, objectives and analytical frameworks 2 2.1 Situating the survey within the research programme 2 2.2 Objectives of the panel survey 3 2.3 Analytical frameworks 3
3 Research methodology 6 3.1 Design process 6 3.2 Sampling 7 3.3 Basic characteristics of the sample 10
4 Livelihoods 13 4.1 Livelihood activities 13 4.2 Household wealth 15 4.3 Food insecurity 18 4.4 Summary of findings on livelihoods 20
5 Basic services and livelihoods assistance 22 5.1 Water and sanitation services 22 5.2 Health care 24 5.3 Education 29 5.4 Social protection and livelihoods assistance 33 5.5 Who delivers? Perceptions of service providers 35 5.6 Summary of findings on basic services and livelihoods assistance 37
6 Civic participation and perceptions of governance actors 40 6.1 Civic participation 40 6.2 Perceptions of governance actors 43 6.3 Summary of findings on civic participation and perceptions of governance actors 47
7 Conclusions 49 7.1 The survey sample 49 7.2 Livelihood status 49 7.3 Basic services and livelihood assistance 50 7.4 Civic participation and perceptions of governance 51 7.5 Priorities and recommendations for future research 52
Bibliography 53
Annex 55

iii
Tables and figures
Tables
Table 1: Survey locations 8 Table 2: Primary source of livelihood income, by gender of household head 14 Table 3: MSI values, by different sub-populations 18 Table 4: Coping Strategies Index scores, by different sub-populations 19 Table 5: Mean journey time to water source, by different sub-populations 23 Table 6: Mean journey time to health centre, by different sub-populations 26 Table 7: Overall satisfaction with primary school, by different sub-groups 32 Table 8: Community meetings and attendance 41 Table 9: Overview of actors responsible for organising meetings as reported by respondents (%) 41 Table 10: Levels of civic participation, by different sub-populations 42 Table 11: Perceptions of governance actors, by past experience of conflict 44 Table 12: Perceptions of governance actors, by gender of the respondent 45
Figures
Figure 1: Map of South Kivu 9 Figure 2: Share of respondents who experienced a (natural) disaster, daily stress and/or crime between
2010 and 2012 (%) 12 Figure 3: Primary source of household income (% of households) 14 Figure 4: Hectares of land owned (% of households) 16 Figure 5: Assets owned by households (%) 17 Figure 6: Households’ main source of drinking water (%) 23 Figure 7: Distance to health centre (return trip on foot) 25 Figure 8 Distance to hospital (return trip on foot) 25 Figure 9: Households’ use of health services (%) 27 Figure 10: Households’ overall satisfaction with hospitals (%) 27 Figure 11: Respondents’ satisfaction with different aspects of health centres (%) 28 Figure 12: Satisfaction with health centre (combined scale) 29 Figure 13: Mean journey times to primary school, by conflict experience and displacement 30 Figure 14: Regularity with which children go to primary school (%) 30 Figure 15: Overall satisfaction with primary schools (%) 31 Figure 16: Satisfaction with different aspects of primary schools (%) 32 Figure 17: Recipients of social protection and/or livelihood assistance who receive the transfer on time
(% of recipients) 34 Figure 18: Respondents who felt service/aid had helped improve agricultural production/subsistence
(%) 34 Figure 19: Reason for service/aid not being helpful (%) 35 Figure 20: Perception of actors providing access to drinking water (%) 36 Figure 21: Perceptions of management of health centres and primary schools (%) 36 Figure 22: Providers of social protection and livelihoods assistance (as identified by respondents) 37 Figure 23: Reasons for participation in community meetings (%) 42 Figure 24 Perceptions of governance actors (median values) 44 Figure 25: Perceptions of government responsiveness in relation to service provision (%) 45 Figure 26: Trust in government in relation to service provision (%) 45 Figure 27: Perceptions of local government, by satisfaction with primary schools (%) 47

iv
Acknowledgements
The authors would like to extend their gratitude to everyone who contributed to the research and this
report. We would first like to thank ISDR in Bukavu (South Kivu, DRC) for close cooperation and support
during the research. We are very grateful to Professor Pascal Isumbisho Mwapu, Director General of the
ISDR, for his continuous support and interest in the survey. Meschac Bilubi Ulengabo formed a team
with us and was an indispensible support in adapting the survey design to DRC’s realities, training the
enumerators and managing all organisational and logistical issues related to implementation of the
project. Without their contributions, this survey would not have been possible.
Second, we are extremely grateful to the Team Managers, Arthur Nyatemo, John Kaajunga Ngaboyenka,
Alain Bamba Kazunguzibwa and Patrick Milabyo Kyamusugulwa, as well as the enumerators and the
data-processing team, for their inputs into and dedication to the project. Specifically, thanks go to Juste
Aganze Cibembe, Freddy Amani Buraye, Ephrem Bahati Mugisho, Isidore Barhanywerha, Godelive
Batano Kusimwa, Lucette Bikubanya Bashige, Luc Bisimwa Ciza, Germain Bizimana Miderho, Placide
Bwija, Jacques Ishara, Nicaise Katindi Missindo, Christophe Lukole, Adalbert Lumbo Lungimbo,
Raymond Luundo Bin Mubulwa, Espérance Mapendo Bashwira, Augustin Muhindo Kizito, Yeshi Mulme,
André Murhula, Patient Musiwa, Sophie Musiwa Kashibongo, Matthias Nalwage, Alex Nyakabasa,
Charles Serge Nyembo and Patient Pole Pole. Many thanks go out to Alain Binozo of ISDR and Annelies
Claessens and Aimé Mbamba of Cordaid Netherlands (Bukavu Unit) for logistical support.
We are also grateful to all the respondents who participated in the research. Their support and their
contributions, including data, views and answers to the questionnaires and interviews, were essential.
Our gratitude also goes to colleagues at ODI, especially Paul Harvey, Rachel Slater, Jessica Hagen-
Zanker, Richard Mallett, Joseph Wales and Pravat Uprety (Tribhuvan University, Nepal) for their
continuous support and input. Many thanks also go to Georgina Sturge, for statistical assistance and
editorial assistance.
Finally, we would like to thank our colleagues at the University of Wageningen and in particular
Dorothea Hilhorst, Carolien Jacobs, Patrick Milabyo, Eva van den Broek and Koen Leuveld.

v
Preface
As a multi-year, cross-country research programme, one of the overarching aims of the Secure Livelihoods Research
Consortium (SLRC) is to contribute towards a better understanding of what processes of livelihood recovery and state-
building look like following periods of conflict and how positive outcomes are achieved. Understanding socioeconomic
change of this nature is possible only when appropriate evidence exists. This, in turn, requires the availability of reliable
longitudinal data that are able to measure shifts, fluctuations and consistencies in the performance of a given unit of
analysis (an individual, a household, an economy and so on) against a set of outcome indicators between at least two points
in time.
In order to directly address this need for appropriate evidence – evidence that tells us something about processes playing
out over time and in more than a single context – SLRC is carrying out original panel surveys in five countries: the
Democratic Republic of Congo (DRC), Nepal, Pakistan, Sri Lanka and Uganda. Designed to produce information on people’s
livelihoods (income-generating activities, asset portfolios, food security, constraining and enabling factors within the broader
institutional and geographical context), their access to basic services (education, health, water), social protection and
livelihood services and their relationships with governance processes and practices (participation in public meetings,
experience with grievance mechanisms, perceptions of major political actors), the surveys are being implemented twice in
each country. The first round took place in late 2012 to early 2013, and the second round – where we will attempt to re-
interview the same households – will take place in late 2015 to early 2016.
Undertaking a cross-country, comparative panel survey in difficult environments is far from a straightforward exercise. For
purposes of transparency and clarity, we highlight the two major limitations of our baseline analyses and reports below.
The first limitation concerns the methods of statistical analysis used. In order to identify factors that appear to (partially)
determine outcomes of various kinds – for example food security or perceptions of state actors – and compare them across
countries, it was necessary for SLRC researchers to carry out standardised regression analyses of the survey data. If the
analysis were being carried out solely at the country level, what would ordinarily happen is that each country team would
make its own decisions – based on theory, existing knowledge and context – about which dependent and independent
variables to include in each of its regressions and which specific regression methods to use. In an attempt to generate
findings that would usefully tell us something about patterns or discrepancies across countries, it was originally decided that
each country team would include a standardised list of independent variables in each of its regressions and use the same
regression techniques; this would then enable the global survey team to produce a synthesis based on similar-looking
analyses at the country level. Following such an approach, however, creates a trade-off. For instance, including a long list of
comparable independent variables means including certain variables that for some countries may be less relevant or even
co-linear (an undesirable statistical situation that arises when two independent or explanatory variables share a strong
linear relationship). As such, we have tested for multi-co-linearity in all regressions and have re-specified those that were
affected by this problem – at the expense of some cross-country comparability. Other reasons the results are not completely
comparable across countries include low numbers of responses for some questions/variables; and low levels of variation
between responses for some questions/variables (when either situation arose, such variables were not included in the
regression analysis).
The second limitation of the baseline reports is their absence of theory and contextualisation. Indeed, the reports focus
primarily on empirical information generated through the surveys, rather than on a thorough theoretical or grounded
explanation of findings. As such, direct attempts have not been made to reference the findings in relation to other relevant
pieces of research or to provide theoretical explanations of relationships and patterns. This is the result of a choice SLRC
researchers actively made at the outset of the survey process. Rather than allocate additional resources to producing
country reports that offer comprehensive explanations of findings, it was decided that the outputs emerging from the first
survey round would constitute basic, relatively unembellished baseline reports. While still presenting information of interest,
one of the primary purposes of the baseline reports is to provide a clear and solid basis against which the second-round
survey data can be compared and interpreted. It is in those second-round reports that far greater attention will be paid to
embedding the SLRC survey findings – findings that will be of greater value given their longitudinal and panel nature – in
the appropriate theoretical and contextual foundations.

vi
Acronyms
ADF African Development Fund
AfDB African Development Bank
DFID Department for International Development
DRC Democratic Republic of Congo
MSI Morris Score Index
NGO Non-Governmental Organisation
OECD Organisation for Economic Co-operation and Development
OLS Ordinary Least Square
SLRC Secure Livelihoods Research Consortium
UN United Nations
UNDP UN Development Programme


viii
Executive summary
In 2012, the Sustainable Livelihoods Research Consortium (SLRC) implemented the first round of an
original cross-country panel survey in the conflict-affected province of South Kivu in eastern Democratic
Republic of Congo (DRC). The survey was designed to produce information on:
1. People’s livelihoods (income-generating activities, asset portfolios, food security, constraining
and enabling factors within the broader institutional and geographical context);
2. Their access to basic services (education, health, water), social protection and livelihood
services; and
3. Their relationships with governance processes and practices (participation in public meetings,
experience with grievance mechanisms, perceptions of major political actors).
This paper reports on the baseline findings emerging from statistical analysis of the South Kivu first-
round data.
The survey sample
Between September and November 2012, we surveyed a sample population of 1,259 households from
9 villages across South Kivu. This sample, based on a combination of purposive and random sampling,
was designed to capture variation in livelihood activities and ethnicity, to achieve representativeness at
the village level and statistical significance at the groupement, chefferie and territoire level and to
account for possible attrition between now and 2015 when the same households will be re-interviewed.
Within our sample population, the mean household size was 6.7 persons per household, and
households contained a mean of 4.05 persons below 18 years; 34% of respondents had not received
any education. In terms of ethnicity, the majority of households were identified as Shi (69%), followed by
Tembo (24%) and Kilega (5%). A little under one-fifth of households in the sample population (18%) had
been internally displaced owing to conflict at some point, yet more than half of households in the
sample population (53%) reported experiencing conflict in the previous three years. In terms of the
kinds of shocks experienced in the previous three years, the most frequently experienced were daily
stresses, followed by natural hazards and, finally, crimes. A closer look at the data suggests conflict is
just one of the many risks facing households in our South Kivu sample population.
Findings on livelihoods and wellbeing
Our survey asked respondents about their household’s primary livelihood activities and measured both
asset ownership (using the Morris Score Index) and levels of food insecurity (using the Coping
Strategies Index). Three key findings emerge from the analysis.
First, although levels of wealth – as measured by asset ownership – can be considered relatively low
across the sample as a whole, there are important variations between different sub-populations within
the sample. We see female headed-households, less educated households, displaced households and
households that have experienced conflict in the past three years are, on average, considerably worse
off than their relative counterparts. A very similar story emerges when we consider levels of food
security.
Second, regression analyses identify very few factors that appear to influence both food security and
asset ownership within our sample population. In fact, we find no variables that are consistently
associated with better food security and with asset ownership outcomes. We do, however, find two
variables that are consistently associated with worse outcomes: experiencing conflict in the past three

ix
years and being displaced at some point. In addition, while not significantly associated with asset
ownership outcomes, households that have experienced a greater number of either shocks or crimes in
the past three years are also likely to be more food insecure.
Third, if we look only at asset ownership, we see that an expected series of factors are found to be
statistically significant: more educated households, for example, are likely to be wealthier, but female-
headed households and Tembo and Kilega (as opposed to Shi) households are likely to be less well off.
We also find households that have agriculture as a primary income source are more likely to be less
wealthy, perhaps because of the small size of landholdings for most households.
Findings on basic services and livelihoods assistance
Our survey explored households’ access to a range of services and transfers – including health,
education, water and livelihood assistance – as well as levels of respondent satisfaction with the
services they use. Because we covered a large range of services, our survey could only use simple,
blunt proxies for access: in the case of health, education and water, we considered journey times to
health centres and hospitals, primary schools and water sources; for livelihood assistance, we
considered whether households had received any form of support.1 Surveys that focus on, for example,
only a single service, are able to build composite indexes that allow a more precise view of access that
is nuanced to the specific context.
Notwithstanding these limitations, several findings stand out from the analysis.
First, less than half the respondents identify the government as the main actor responsible for the
provision of health and education services. Moreover, the government is not perceived to play any role
in the provision of water or of livelihood services such as seeds and tools, or food, material and
financial aid. In these sectors, international and national non-governmental organisations (NGOs) play a
far greater role. In practice, what in this report is defined as social protection or livelihood assistance
(e.g. food aid or cash transfers) is delivered outside government systems. It has no legislative or policy
framework and has little regularity or predictability (households often receive only a one-off transfer of
some kind). It is more akin to humanitarian assistance than formal social protection or livelihood
support. Formal, government-regulated social assistance does not exist in the DRC.
Second, there are some surprises in people’s access to services – as measured using simple proxies
such as journey times and receipt of a transfer. Most notably, while previously displaced and conflict-
affected households tend to be poorer and more food insecure, they generally appear to have better
access to basic services. This finding is in stark contrast with the findings of the SLRC survey in Uganda,
where displacement and conflict-affectedness result in poorer access to services (Mazurana et al.,
2014). One explanation for this could it be that, in a context where so many of the basic services and so
much of the livelihoods support is delivered by local and international NGOs (along with religious
organisations), services are mostly targeted to areas where displaced people reside. Where service
delivery becomes bound up with humanitarian assistance, its location is likely to mirror the location of
displaced and conflict-affected people.
In terms of gendered comparisons, another surprise is that we do not find any statistically significant
differences in either access to or satisfaction with services between female- and male-headed
households. This is in contrast with livelihood indicators, where female-headed households
demonstrate, on average, worse outcomes.
1 We are aware, however, that access in DRC is not only influenced by journey times but also by financial means, as not all
services are available for free.

x
Third, levels of satisfaction among respondents are relatively high across a range of services. Our data
show that, in the case of their hospital and primary school, 77% and 70% of respondents, respectively,
are either ‘rather satisfied’, ‘satisfied’ or ‘very satisfied’; 77% of respondents agree the drinking water
they access is clean and safe; and the majority of recipients of social protection and livelihood
assistance (such as seeds and tools and food aid) felt the assistance helped them improve their
agricultural productivity/subsistence.2 Given the disruption and volatility that have long affected South
Kivu, these reported levels of satisfaction may seem surprising. It could be argued, however, that
satisfaction is relatively high not in spite of this situation but because of it. People have lived through
years of conflict and before that experienced over 30 years of negligence in which the Mobutu-led
government promoted a comportment of débrouillez-vous (‘make-for-yourself/figure it out’). In this
context, people may well have low expectations regarding service provision, meaning any improvement
in a particular situation is likely to be perceived strongly and positively. In other words, there is every
chance that current levels of satisfaction as reported by service users are heavily determined by their
past experience and associated ‘subjective baseline’, as it were.
Fourth, of all the features of service delivery that might affect use, the cost of accessing basic services
was clearly an issue for many respondents. When asked about specific aspects of health and
education services, reported levels of dissatisfaction were highest when respondents were asked about
the costs involved. For example, more than half of respondents reported being either ‘very dissatisfied’
or ‘dissatisfied’ with the cost of health centres – considerably higher than the proportions of
respondents reporting dissatisfaction with other aspects of the service, such as waiting times and
availability of medicine. We also find respondents who have to pay informal fees to access health care
are less likely to be satisfied with the service. Similarly, of the seven different aspects of primary
schools we asked respondents about, costs had the highest levels of dissatisfaction.
Finally, while there are very few factors that appear to consistently influence people’s access to and
satisfaction with different services and forms of assistance, our regression analyses allows us to
tentatively identify three patterns. The first is the influence of conflict. Regression analyses show
households experiencing conflict in the past three years are more likely to have better access to
health centres, primary schools and water points, as well as to be more likely to receive forms of
social protection and livelihood assistance by humanitarian actors. The story emerging from our
descriptive statistics is consistent with this. We need to beware of seeing this as a simple linear
relationship: of course, conflict does not itself result in better access to services (indeed, the opposite is
generally accepted to be true). More likely, the responses of various agencies, in particular local and
international NGOs, and their attempts to support people affected by conflict are influencing access to
services outcomes. The second tentative pattern relates to the relationship between the way a service
is implemented or run and an individual’s broader perception of the quality of that service. We find, for
example, that dissatisfaction with teacher quality, teacher numbers, class sizes and school
infrastructure are all strongly associated with lower overall levels of satisfaction with primary schools,
and that respondents having to queue for water, those who have to pay for water or those whose water
service is run by an NGO or water committee are less likely to agree their water is clean and safe. Third,
when taken together with the findings from the livelihood section, there is some evidence to suggest
households whose primary income source is agriculture may be in a relatively vulnerable position
compared with other livelihood groups in our sample population. Such households are not only likely to
own fewer assets, as we have already seen, but also less likely to receive both social protection (food
aid) and livelihood assistance (seeds and tools).
2 Our (simple) proxy for satisfaction with water services is that respondents agree water is clean and safe. For social protection
and livelihood assistance, we used a proxy of whether recipients felt the transfer made a significant difference to their lives.

xi
Findings on civic participation and perceptions of governance
Our survey used perception-based questions to explore respondents’ attitudes towards different
governance actors and experience-based questions to measure levels of civic participation. We identify
four key findings in this area.
First, levels of civic participation – proxied by participation in community meetings about services over
the past 12 months – are quite high. On average, respondents from male-headed, wealthy, well-
educated households and households experiencing more than five shocks in the past three years
attend community meetings most often. Although we cannot comment on what exactly drives this
participation (whether it is the result of dissatisfaction with services, for example), we find the majority
of respondents attended such meetings if they were aware of them taking place and were invited to
attend. We should, however, be cautious about assuming attendance implies a social contract of some
kind.
Second, while respondents’ perceptions of customary local, formal local and state governance actors
are generally fairly negative, we find that – broadly speaking – the less ‘local’ the actor, the worse the
perception. On average, respondents have more confidence in, say, the head of their village or mwami
(local king) than they do in the national government or the president. This pattern is consistent across a
number of perception-based questions.
Third, respondents from households that have experienced conflict in the past three years have, on
average, lower levels of trust and confidence in governance actors at all scales, including local
customary and formal authorities and central state actors. In addition, according to results from
multinomial regression analysis, respondents from such households as well as those from households
that have experienced a greater number of crimes in the past three years are less likely to agree local
government decisions reflect their priorities.
Fourth, our regression results suggest respondents from more food-insecure households are likely to
hold more positive perceptions of local governance actors. Our analysis does not give us a satisfactory
explanation for this. It might be related to lower education levels or lower expectations. There is also
some evidence to suggest greater levels of satisfaction with certain services, or with certain aspects of
services, is associated with more positive perceptions of governance actors. For example, respondents
reporting greater satisfaction with the availability of medicine at health clinics were also more likely to
perceive actors at the customary local, formal local and central state levels positively. A similar story
emerges when we look at satisfaction with schools. Broadly speaking, these results are supported by
descriptive statistics, which suggest respondents who are satisfied with services of various kinds are,
on average, more positive in their perceptions of government than the sample population as a whole.
Finally, experiences of insecurity are sometimes found to be associated with worse perceptions of
governance actors, although the overall picture on this is mixed. Further research is needed to explain
these findings.

1
1 Introduction
In 2012/13, the Secure Livelihoods Research Consortium (SLRC) designed and implemented the first
round of a panel survey in five conflict-affected countries, generating cross-country data on livelihoods,
access to and experience of basic services, exposure to shocks and coping strategies and people’s
perceptions of governance. This paper presents the findings of the Democratic Republic of Congo (DRC)
survey, which was delivered to 1,259 respondents (covering in total 8,484 household members)
between September and November 2012. It constitutes, in effect, the DRC baseline report, to be
followed up by a subsequent report in 2015/16 when the second round of the panel survey is
complete. The analysis presented within also informs, together with the four other country papers, the
first round synthesis report.
This baseline report is structured as follows. The next section provides a background to the survey,
situating it in relation to the overarching themes of SLRC’s research programme, outlining the
objectives of the survey and briefly presenting the analytical frameworks and hypotheses used to guide
analysis of the survey data. Section 3 then discusses key aspects of methodology and presents some
basic descriptive information on the nature and composition of the sample. Sections 4-6 constitute the
analytical core of the paper, respectively exploring the livelihood status of households in our sample,
and the factors that influence this; people’s access to and experience with basic services, social
protection and livelihood assistance, and the factors that influence this; and levels of civic participation
and people’s perceptions of governance actors, and the factors that influence this. The final section
concludes by summing up the main findings and presenting suggestions for additional research.

2
2 Background, objectives and analytical
frameworks
This section is split into three parts. The first provides some background to the survey by situating it in
relation to the SLRC’s broader research agenda. The second outlines the objectives of carrying out a
panel survey. The third describes the basic analytical frameworks used to analyse the survey data.
2.1 Situating the survey within the research programme
The cross-country panel survey is directly relevant to the first and third themes of SLRC’s six-year global
research programme:
1 Legitimacy. What are people’s perceptions, expectations and experiences of the state and of
local-level governance? How does the way services are delivered and livelihoods are supported
affect people’s views on the legitimacy of the state?
2 Capacity. How do international actors interact with the state and local-level governance
institutions? How successful are international attempts to build state capacity to deliver social
protection, basic services and support to livelihoods?
3 Livelihood trajectories. What do livelihood trajectories in conflict-affected situations tell us about
the role of governments, aid agencies, markets and the private sector in enabling people to make
a secure living?
Legitimacy: people’s perceptions of governance and the role of service delivery
Establishing, building or strengthening state legitimacy is a major element of state building. The
Organisation for Economic Co-operation and Development (OECD) (2010: 3), for example, notes that,
‘State legitimacy matters because it provides the basis for rule by consent rather than by coercion.’
Indeed, a lack of state legitimacy is seen as a major contributor to state fragility because it undermines
state authority. For donors, while the steps they can take to influence state legitimacy are few, they do
have an interest in developing a clearer understanding of the following: What leads to legitimacy? What,
if anything, can they do to strengthen state–society relations? And, what might be the (unintended)
positive and negative impacts of their programming on state legitimacy if they, for example, route
development funding via bodies other than the formal organs of the state?
Literature reviews carried out during SLRC’s inception year found very little evidence for the frequent
assertion that improving access to services and social protection in conflict-affected situations
contributes to state-building (see, in particular, Carpenter et al., 2012). The relationship between
delivering services and state–society relations remains poorly understood. Given the cited importance
of legitimacy in state-building processes – as the European Report on Development (2009: 93) notes,
‘State-building efforts are bound to fail if, in strengthening institutional capacities, the legitimacy of the
state is not restored’ – it is both surprising and concerning that we have so little robust knowledge
about what leads to state legitimacy.
Despite these gaps, state-building, encompassing both legitimacy and capacity, provides the organising
framework for much international engagement in conflict-affected situations. In tackling this question,
we are thus taking up the OECD’s call for donors to ‘seek a much better understanding – through
perception surveys, research and local networking – of local people’s perceptions and beliefs about
what constitutes legitimate political authority and acceptable behaviour’ (OECD, 2010: 55).

3
Livelihood trajectories: tracking change and identifying determinants
Literature reviews carried out during SLRC’s inception year identified empirical and longitudinal
research on livelihoods in conflict-affected situations as a key evidence gap. Although good in-depth
case studies on livelihood strategies in particular contexts can sometimes be found, these are usually
just snapshots. Qualitative case study approaches are also insufficiently linked to quantitative survey
data. The reviews also revealed a significant gap in any comparative analysis of the effectiveness and
impact of interventions to support livelihoods (see, in particular, Mallett and Slater, 2012). There is
some evaluation and academic literature that examines the impact of particular projects or
programmes, but very little that looks at the overall significance of aid in people’s livelihoods and
compares the impact of different approaches.
SLRC’s research programme aims to fill some of these gaps by building a picture of how people make a
living in particular contexts and tracking how this changes over time.
2.2 Objectives of the panel survey
The panel survey will help us answer parts of our research questions appearing under the first and third
themes of the research programme.
Regarding the first theme, on legitimacy, our approach is centred on documenting and analysing
people’s views of governance in conflict-affected situations. It should be emphasised that we are
interested here not just in the state but rather in a wider collection of governance actors. As such, we
consider people’s perceptions of both local and central government but also customary governance,
which includes the head of a village, the head of a groupement (a number of villages) and the mwami
(the local ‘king’). A cross-country panel survey incorporating perception-based questions enables this,
allowing us to investigate difficult-to-measure, subjective issues such as trust and satisfaction, and
providing both a comparative snapshot and a longitudinal perspective.
Under the third theme (livelihood trajectories), SLRC is undertaking rigorous, longitudinal livelihoods
research. Our aim is to build a picture of how people make a living in particular contexts, to track how
this changes over time and to shed light on what causes change. We want to know whether people are
recovering or starting to build stronger and more secure livelihoods, are stuck in poverty or are sliding
into destitution, and how the broader political, economic and security environment affects this.
Implementing a panel survey that captures both the dynamics and the determinants of people’s
livelihoods enables this.
The SLRC cross-country panel survey therefore combines elements of both perception and livelihoods
surveys, enabling a dual focus on governance and legitimacy, and livelihood trajectories. There are five
points of added value of conducting a hybrid survey of this kind:
1 It generates rare panel data in fragile and conflict-affected contexts.
2 It allows us to identify similarities and differences between different fragile state contexts.
3 It allows us to differentiate between levels of government and different forms of governance.
4 It generates information on livelihoods beyond simple income measures.
2.3 Analytical frameworks
Three basic analytical frameworks emerged from the survey design process, outlined below (and in
greater depth in the synthesis paper; download from here). It should be emphasised that, because this
paper is based on the first round of the survey, the analysis is not geared towards identifying and
explaining changes over time (which is why we talk about livelihood status as opposed to trajectory
throughout the report). Rather, much of the analysis focuses on producing descriptive baseline

4
statistics and identifying possible correlations and relationships between different sets of factors. The
data collected also allow us to explain variations between Congolese households across a range of
outcomes.
1 Livelihood and wellbeing status
Livelihoods and wellbeing are broad concepts and cannot be meaningfully captured by a single
indicator. We have chosen to measure it in two different ways, by looking at:
Household asset ownership (as a proxy for wealth)
Food security (using the Coping Strategies Index)
In the synthesis report (Mallett et al., 2015), we argue that a number of different factors can explain
variations in livelihood status. These include:
1 Household factors. These include demographic characteristics of the household,
religion/ethnicity of the household and education and migration characteristics.
2 Contextual factors. These include location, indicators accounting for the occurrence of
conflict and perceptions of safety in the neighbourhood and in travel (i.e. moving to work),
as well as other indicators of livelihood opportunities/constraints.
3 Shocks experienced by a household. These include natural hazards and economic shocks,
as well as crime and conflict.
4 Differential access to basic services, social protection and livelihood assistance, and the
quality of these services/transfers.
The aim of the quantitative analysis is to estimate if and to what extent the above factors determine the
main outcome (household assets/food insecurity).
2 Access to and experience of services, social protection and livelihood assistance
We are interested in which factors determine access to and experience of services. We measure access
to services in terms of distance in minutes to the closest service provider last used (for health,
education and water) and someone having received a social protection transfer or livelihoods
assistance.
Variations in access to services can be explained by a number of different factors. These include:
1 Individual and household characteristics (as discussed above).
2 Contextual factors (as discussed above).
3 Shocks experienced by the household (as discussed above).
4 Implementation and performance of basic services, social protection and livelihood
assistance. Implementation and performance (e.g. regularity of provision, who provides the
service etc.) may affect access to basic services, social protection and livelihood
assistance.
The aim of the quantitative analysis is to estimate if and to what extent the above factors determine the
main outcome (access/use).
We measure experience in terms of overall satisfaction with the service provided (health and
education), if clean water is being provided for water and self-perceived impact for social protection and
livelihoods assistance.
In the synthesis report (Mallett et al., 2015), we argue that a number of different factors can explain
variations in the experience of services. These include:
1 Individual and household characteristics (as discussed above).
2 Contextual factors (as discussed above).
3 Shocks experienced by the household (as discussed above).
5
4 Access to basic services. We expect that distance to basic services is likely to affect
experience of services.
5 Implementation and performance of basic services, social protection and livelihood
assistance (as discussed above).
The aim of the quantitative analysis is to estimate if and to what extent the above factors determine the
main outcome (satisfaction with the service/transfer).
3 People’s perceptions of governance and the role of service delivery
Analysis of people’s perceptions of governance is more complicated. We propose that perceptions of
governance be determined, as before, by individual and household characteristics, context and shocks
experienced. We have explored governance on multiple levels, from community to national and
including formal and customary governance. We then look specifically at the explanatory role of 1)
access to basic services, social protection and livelihood assistance; 2) experience of using these; and
3) implementation and performance of these.
We therefore propose that the following factors may determine people’s perceptions of governance:
1 Individual and household characteristics (as discussed above).
2 Contextual factors (as discussed above).
3 Shocks experienced by the household (as discussed above).
4 Access to basic services, social protection and livelihood assistance. We expect that access
to services and social protection and livelihood assistance affect perceptions of
governance. In particular, not having access is likely to affect perceptions of certain
governance actors.
5 Experience of using basic services, social protection and livelihood assistance. We expect
that experience in using/receiving services and social protection and livelihood assistance
affects perceptions of governance. In particular, having a negative experience is likely to
affect perceptions of certain governance actors.
6 Implementation and performance of basic services, social protection and livelihood
assistance. Implementation and performance of services and social protection and
livelihood assistance may affect perceptions of governance. Waiting time, regularity and
costs in accessing services and social protection are likely to determine how individuals
perceive state governance, in particular if the transfer is government-provided.
The aim of the quantitative analysis is to estimate if and how much the above factors – in particular
those relating to services – determine the main outcome (perceptions of governance).

6
3 Research methodology
This section is split into three. The first part provides some detail on the design of the survey; the
second discusses sampling; and the third describes some basic characteristics of our sample.
3.1 Design process
A generic survey schedule was developed that was then adjusted to meet the specific research
priorities set by Wageningen University and to fit the DRC context (more detail on the survey design
process can be found in SLRC, 2015). We did not aim to generate a system of universalist rankings
between countries. Instead, the survey was designed to allow us to identify some general trends and
some caveated similarities or differences between our countries. This means we had a number of core
modules (namely, the access to and experience of services modules) and some modules that were
identical in all countries (notably the food security module) to allow for comparability across the
different country studies. A more detailed module on governance and a transport module were added
for DRC.
Panel surveys are particularly rare in fragile and conflict-affected contexts. Part of the reason for this is
that panel surveys are at risk of attrition – that is, when households drop out of subsequent survey
rounds – and it is assumed that, because conflict often results in displacement, attrition is too high in
conflict-affected situations. We substantially increased the sample to account for attrition (see section
on sampling methods and description of sample). The first round of the panel study was conducted in
2012 and the second round will be conducted in 2015.
The SLRC survey incorporates elements of both a livelihoods and a perception survey, which raises a
methodological issue: while the ideal unit of analysis for the livelihoods survey is at the household level,
for the perception survey it is at the individual level. After extensive discussion and consultation, a
decision was reached to combine them in one survey, partly because of logistical and budget
considerations and partly in an active effort to link perceptions more directly to real and measurable
changes in wellbeing.
We opted to sample households, but to specifically seek out a varied range of individuals within
households to avoid a strong bias of male household heads for the perception questions. The wars and
unrest have affected both men and women in eastern DRC. In recent years, a great deal has been
broadcast throughout the world, often on the challenging and often terrible situation of women in
eastern Congo (Douma and Hilhorst, 2012; Gouzou et al., 2009). The conflict between 1996 and 2002
and persisting insecurity in DRC generated increased international attention to often shocking stories
about sexual violence and ‘rape as a weapon of war’ (Douma and Hilhorst, 2012; Lwambo, 2011).
These issues are embedded in a broader context of complex gender relations. Gender refers to the
characteristics and behaviours that societies assign to the supposed biological sexes of men and
women (Lwambo, 2011). The process of ‘gendering’ is infused with power, as it serves to create,
legitimise and reinforce social hierarchies. Masculinities and femininities are situated in specific
geographies, temporalities and ethnographies, and this implies gender roles can be perceived and
enacted differently depending on the social context (Berg and Longhurst, 2003; Lwambo, 2011).
In order to understand livelihood trajectories; access to and experience and satisfaction with basic
services; and perceptions of the legitimacy of the state, it is evident that we must show the reality of
both men and women. Taking into account DRC’s vast territory and its considerable diversity (with 450
different ethnic groups), truly understanding gender difference, even only in the province of South Kivu,
requires a gender-specific study focus. We ensured around half of the respondents were female (56%,

7
N=704 female respondents); moreover, gender was added as an independent variable in all regression
analyses. Cross-tabulations were created, to see if gender differences were identified in the main
variables of the dataset. Findings are reported in a gender-specific manner when statistically significant
differences are identified between men and women. Furthermore, the survey explored perceptions on
the general security situation for women. Interestingly, 69% of respondents felt the security situation of
women in the past three years had improved. Informal conversations with respondents during the
research confirmed that, although respondents felt general security had not improved, the situation for
girls and women had. It is suggested that further qualitative research be performed to obtain a better
understanding about how gender is created, legitimised and reinforced in social hierarchies related to
livelihoods, basic services and governance in South Kivu.
3.2 Sampling
DRC is 2,345,410 km2 (the size of western Europe), with a total population of around 60 million (DFID,
2007). Given the scope of the study and available resources, the survey did not attempt to achieve
representativeness on a national level. Research was conducted in the east of the DRC and specifically
in the conflict-affected province of South Kivu. This area was chosen because in the past two decades
the people of South Kivu have suffered enormous loss of life and livelihoods owing to war and insecurity
(Weijs et al., 2012). Services have deteriorated severely and are provided mostly by non-state actors or
come with high user fees. Since the province is strongly affected by conflict, it has attracted much
attention from international actors. Nonetheless, poverty is widespread (over 70% of people live below
the poverty line), in terms of income, health, education and security, with an exploitative governance
system and a lack of security and transport as the main constraints to livelihood development.
The sampling strategy was designed in order to achieve representativeness at the village level through
random sampling. The study is statistically significant at the territoire (territory), chefferie (chiefdom)
and groupement level and for six of the nine villages, calculated using a 95% confidence level and a
confidence interval of 0.05.3 Other factors taken into account included available budget, logistical and
safety limitations and likelihood of attrition between 2012 and 2015.
We used a combination of purposive and random sampling. More specifically, a clustered sampling
strategy was employed; in the first stage clusters (i.e. villages) were selected and in the second stage
households within those clusters. Since no actual population figures were available, approximate
sample size was calculated using estimated population sizes for different village sizes.4 Households
were randomly selected within villages so the results would be representative and statistically
significant at the village level and so a varied sample was captured.5 The sample was increased by 20%
to account for attrition between 2012 and 2015, so the sample size in 2015 will still be statistically
significant even if a number of households drop out. The overall sample required to achieve the
sampling objectives was 1,128; 1,259 households were interviewed during the fieldwork.
3 Since statistics on exact inhabitants are often not up to date and constantly changing owing to internal displacements,
calculation of exact statistical significance is challenging in the context of DRC. As far as possible, official statistics were used
in order to identify sample sizes. 4 The main source was Sarantakos (2005). 5 Since population data at the village level are not widely available in DRC, village-level population sizes were estimated by
creating village lists with overviews of the households in the village. In each village, a list of the households living in the
community was composed in cooperation with the head of the village and other local leaders. As far as possible, the lists were
cross-checked with lists of village meetings or with other community members. Once the lists were completed, the households
on the list were numbered and thereafter households were randomly selected by using computer-based random selection
tables. These tables identify a list of random numbers, which subsequently corresponded with the numbers of the households
on the household list.

8
South Kivu is estimated to have had a total population of 3.9 million in 2009, and the province has 8
territoires, 23 chefferies and 184 groupements (UNDP, 2009). The following criteria were used to select
these research areas and the related research villages:
Areas reflected as much as possible the variation in livelihoods in the province, different
levels of access to basic services and different ethnic group compositions.
Areas were located in different chefferies and covered more than one territoire.
There was a focus on rural areas, thus areas were chosen that were not part of or very
close to Bukavu or another main town in the province. A total of 78.4% of the population of
South Kivu lives in rural areas (UNDP, 2009).
Areas had to be located at different distances from Bukavu, to reflect variations in
livelihood systems while also providing relevant information to a Department for
International Development (DFID) transport study (Ferf et al., 2014).
The security situation had to allow the field research to take place.
In the end, we surveyed randomly in nine villages, which were in turn located in four groupements
(Karhongo, N=447; Kanyola, N=298; Mulamba, N=136; Kalima, N=282), two chefferies (Ngweshe,
N=881; Buhavu N=378)6 and two territoires (Walungu and Kalehe) (see Table 1 and Figure 1). For
security and ethical reasons, we are withholding information on the specific survey locations.
Table 1: Survey locations
Village Sample size Groupement Chefferie Territoire
Village A1 189 Karhongo Ngweshe Walungu
Village A2 128 Karhongo Ngweshe Walungu
Village A3 130 Karhongo Ngweshe Walungu
Village B1 199 Kanyola Ngweshe Walungu
Village B2 99 Kanyola Ngweshe Walungu
Village B3 136 Mulamba Ngweshe Walungu
Village C1 199 Kalima Buhavu Kabere
Village C2 83 Kalima Buhavu Kabere
Village C3 96 Bitale Buhavu Kabere
6 A few respondents (N=28) were interviewed in a village officially situated in Buloho chefferie. However, given that this borders
and is so close to Buhavu, these were added to Buhavu chefferie.

9
Figure 1: Map of South Kivu
Fieldwork was conducted between September 2012 and November 2012. For the purposes of
transparency, we mention some of the challenges encountered in the implementation of the survey.
The first was translation, which in international (multi-case study) research is a frequently mentioned
problem (Harkness et al., 2003). The survey was translated from English to French and thereafter into
local languages. Although enumerators received training beforehand and the concepts and questions
were explained and discussed in detail, distortions can occur given the varying backgrounds of the
various enumerators and their differing interpretations. One important example relates to how
respondents may have used varying criteria to determine household headship. It is possible, for
example, that respondents identified a male as the de jure household head, when in fact husbands and
fathers may be absent and women are the de facto heads of household.
10
Second, the pragmatic meaning of the research concepts is based on Western understandings of
reality. Pragmatic meaning refers to meaning in context, or what words/concepts/issues mean when
used in a given context for whoever is involved (Harkness et al., 2003). Enumerators had to be
conscious of the interpretations and meanings of the respondents in their context. An example can be
drawn from some of the measurement units used in the survey, such as those used to explore the size
of landholdings. In DRC, land area measurements are expressed differently in different places, and also
depend on land use patterns. Respondents would often not assess the area of their land using square
metres or acres, but instead estimated it by referring to, for example, the number of baskets of seeds
needed for the land. In such cases, the enumerators had to recalculate these findings to fit ‘survey
measurements’. This obviously entails the risk that measurements of landholdings will not always be
perfectly accurate.
Third, although the academic nature of the study was emphasised to respondents, the enumerators
reported that they suspected households of underreporting assets and food intake so as to prevent
themselves from possibly missing out on aid. Years of distribution of humanitarian aid, often targeted at
low-asset and low-income households, could have led to (false) expectations among respondents of our
study.
Finally, in one of the research areas, the population was highly suspicious of the survey and the
enumerators had to be accompanied by a local informant, trusted by the local chief, to convince the
respondents of the scientific nature of the study. Although the enumerators did not observe any impact
on the respondents’ willingness to freely answer the questions, this could have influenced the data.
3.3 Basic characteristics of the sample
Our sample covers 1,259 respondents and 8,484 household members.
In terms of the individual characteristics of respondents, 56% (N=704) were female and the mean age
of respondents was 36.8 years. Households are on average young; since 51% of the population of
South Kivu is below 15 years and life expectancy is low, efforts were made to include younger
respondents (UNDP, 2009; World Bank, in Weijs et al., 2012) The mean age of respondents was 36.8
years, and 23% (N=278) were below 24 years. The majority of respondents were either heads of
household (48%, N=606), partners of heads of household (38%, N=479) or children of the household
(11%, N=137). The majority of respondents were married (66%, N=823), followed by people living
together (13%, N=159) and single people (10%, N=126). In terms of role and status in the community,
the vast majority of respondents were inhabitants with no specific role or status.
Approximately 34% (N=419) of respondents had not received any education, 25% (N=317) had
completed some years of primary education and 4% (N=233) had completed some years of secondary
education. Of the respondents (who were mainly above 16 years), 9% (N=50) were enrolled in an
educational institution at the time of the survey.
On migration status, 44% (N=551) had not lived in the village since birth. Of these respondents 73%
(N=390) were living in the research site (village) for the first time. Identified reasons for in-migration
were conflict (41%, N=224), economic opportunities (19%, N=103), marriage (33%, N=183), availability
of basic services (2%, N=11) and witchcraft (1%, N=4). The findings show 18% (N=224) of households
had been internally displaced owing to conflict at some point. Further analysis shows 14% (N=73) of
male respondents were from households that had been displaced at some point compared with 21%
(N=151) of female respondents.
In terms of household characteristics, the mean household size of those in our sample was 6.7 persons
(SD=2.8). Household sizes correspond with other studies such as Soeters and Kimanuka (2011), who

11
observed a slightly higher average household size of 6.3 (2005), 6.8 (2008) and 7.2 (2011), and the
UN Development Programme (UNDP) (2009), which identified an average household size of 5.8 in
South Kivu and 5.3 in DRC. Of the survey respondents, in total 49% (N=4,171) of household members
were male.7 On average 4.05 persons per household (SD=2.38) were below 18 years (children). A total
of 72% (N=5,904) of household members were below 24 years and 55% were below 15 years.
Households’ religious affiliation and ethnicity were identified. In total, 48% (N=596) of households
identified as Catholic, 43% (N=540) as Protestant, 1% (N=2) as Muslim and 9% (N=118) as other
(Adventists, Jehovah’s Witnesses, Neo-Apostolic, other types of religion or those who do not affiliate with
a religion). These findings are strongly in line with Humphreys’ (2008) survey findings in South Kivu,
which identified 49% of the survey population as affiliated with Catholicism and 44% as affiliated with
Protestantism.8 Ethnicity was explored by identifying the households’ mother tongue. The majority of
households were Shi (69%, N=860), followed by Tembo 24% (N=295) and Kilega (5%, N=66).
In terms of roles and responsibilities in the village, in 5% (N=66) of households one of the members
was a local leader (mwami, head of groupement, head of village, advisor to the head of village).
Moreover, in 8% (N=102) of households one of the members had a formal function (school director,
teacher, public function, priest, witch doctor, member of a government/parent committee/health
committee/health service). Only one household had a member with a relationship close to a local
leader and to someone with a formal function. The vast majority of household members (87%) had no
specific ‘formalised’ function or status.
Around 53% of households had experienced conflict in the previous three years. In terms of types of
shocks experienced in that period, the most frequent were daily stresses, followed by natural hazards
and finally crimes. A closer look at the data reveals a more detailed breakdown of which shocks in
particular households had experienced (see Figure 2).
7 Gender figures correspond roughly with UNDP (2009), which identifies the population make-up as 50.6% male and 49.4%
female. 8 Humphreys (2008) provides baseline information on demographics, welfare and social and political attitudes of communities
in eastern DRC taking part in the International Rescue Committee-led Tuungane community-driven reconstruction programme.
The survey contains information on close to 3,000 respondents, along with their family members, drawn randomly from almost
600 villages throughout the areas of South Kivu, Maniema and North and Haut Katanga. Humphreys et al. (2012) performed a
study on the socioeconomic impacts of the Tuungane programme.

12
Figure 2: Share of respondents who experienced a (natural) disaster, daily stress and/or crime
between 2010 and 2012 (%)
As seen above, the most common shocks were livestock and crop diseases (experienced by 63% of
households), followed by sudden health problems or accidents (44%), inflation and price hikes (38%)
and flooding (36%). This information speaks to the importance of taking into account the wide range of
risks to which local people are exposed, such as diseases, famine, unemployment, insecure land rights
and violence. The occurrence and impacts of multiple hazards is an often-overlooked issue, and the
findings reflect the complexity of multi-risk environments people live in and need to deal with. However,
we should keep in mind that occurrence of a shock is not the same thing as severity of a shock, and
shocks that occur less frequently may be more severe.
63
19
36
16
9
44
28
35 38
9 12
19
29
24
15
0
10
20
30
40
50
60
70
% of
households

13
4 Livelihoods
In order to build a picture of the livelihood status of households in our South Kivu sample population,
data were generated on three key dimensions: 1) livelihood activities; 2) household wealth; and 3)
levels of food insecurity. We present both descriptive statistics and the results of regression analysis.
4.1 Livelihood activities
Having and maintaining a sustainable livelihood in South Kivu is challenging for many households.
Often presented as a typical example of the ‘resource curse’, DRC struggles with the fact that, despite a
wealth of natural resources, its gross domestic income per head is among the lowest in the world
(Vlassenroot et al., 2006). Statistics from existing work highlight that 84.6% of the population in South
Kivu lives below the poverty line (UNDP, 2009). Together with Equateur and Bandundu, South Kivu is
one of the three provinces in DRC with the highest levels of poverty. The Gini co-efficient value of 0.57
in South Kivu is higher than that of DRC as a whole (0.40).
Our survey asked households about the kinds of activities they were engaging in as well as the extent to
which each of these contributed to overall household monetary income. From our data we know 87% of
households received some part of their income from subsistence agriculture (cultivation, livestock or
fishing); 29% from productive agriculture; 25% from casual labour in agriculture; 23% from selling
goods; and 21% from non-agricultural private sector jobs.
The data also allow us to identify which single livelihood activity is reported to make the largest
contribution to household income, for each household in our sample population. For some households
(28%), however, there was no single main source, since household income was split between multiple
sources contributing equal shares (such as 50% agriculture and 50% casual labour). As Figure 3 shows,
for those who could indicate a single primary source, subsistence agriculture constituted the primary
source of income for 47% of households in our sample population. This compares with 4% of
households whose primary income source is commercial farming, 4% whose primary income source is
agricultural casual labour, 5% whose primary income source is selling goods and 5% whose primary
income source is non-agricultural private sector jobs. Overall, around three-quarters of households in
our sample population make most of their income through an agricultural activity, whether subsistence,
commercial or casual.
In Humphreys (2008) too, 49% of household members in the sample were farmers and 47% of
household income was derived from the sale of agricultural products. In our sample, 87% of households
engaged in subsistence farming, and on average across all farming households this contributed 51% of
income; for households in which it was the main income source it made up on average 73% of
household income. Humphreys’ survey also identified as income sources sale of other foodstuff (17%),
small business (6.5%), government jobs (3%), sale of fish (1%), casual labour (4%), sale of wood (1.5%)
and private sector jobs (0.8%) (ibid.).

14
Figure 3: Primary source of household income (% of households)
Note: ‘No single main source’ refers to those households where there was no single main source since household income was
split between multiple sources contributing equal shares.
The primary sources of household livelihood income vary within the sample and between different sub-
populations. As Table 2 shows, there are statistically significant differences (at 1%) between female-
and male-headed households, with proportionally fewer female-headed households earning most of
their income from business or the private sector – indeed, fewer than 1% of female-headed households
engage primarily in the private sector compared with more than 7% of male-headed households. On the
other hand, proportionally more female-headed households in our sample are engaging primarily in
selling goods and casual agricultural labour. That said, the majority of both female- and male-headed
households earn most of their income through subsistence farming activities (60% and 66%,
respectively).
Table 2: Primary source of livelihood income, by gender of household head
Subsistence
agriculture
Commercial
agriculture
Casual
labour
(agriculture)
Casual
labour (non-
agriculture)
Selling
goods
Own
business
Private
sector
Public
sector Remittances
Social
transfers Total
Gender of household head (***)
Female 59.82 6.25 12.5 1.79 10.71 0.89 0.89 0 5.36 1.79 100
Male 65.7 5.03 4.52 5.53 6.53 2.01 7.29 2.14 0.38 0.88 100
Total 64.98 5.18 5.51 5.07 7.05 1.87 6.5 1.87 0.99 0.99 100
47
4 4 4
5
1
5
1 1 1
28
Cultivation of
Livestock/Fishing
Agriculture
Casual Labour (Agriculture)
Casual Labour (Non-
Agriculture)
Selling Goods
Own Business
Private Sector (Non-
Agriculture)
Public Sector
Remittances
Social Transfers
No single main source

15
Note: Asterisks indicate whether the mean for each group is statistically different from the sampled population as a whole (*
significant at 10%; ** significant at 5%; *** significant at 1%).
We also observe differences by the education level of households – with a higher than average
proportion of educated households owning their own business or working in the public sector (see
Annex Table 1) – as well by the number of shocks experienced, with primarily agricultural households
experiencing, on average, the highest number of shocks in the past three years (see Annex Table 2).
4.2 Household wealth
In order to examine levels of household wealth within our sample population, we look at housing, land
ownership and asset ownership.
Housing 4.1.1
Possession of a house and quality of construction materials can be a proxy for household wealth. The
survey data show the majority of households (76%) own their dwelling, followed by those who rent their
dwelling (14%) and those who live without paying for their dwelling (10%). For the last group, it may be
that relatives, employees or landowners have offered them the dwelling. Only 10% of households said
they owned or rented more than one dwelling.
In terms of construction materials, economically less wealthy families generally live in houses with mud
walls and thatched/straw roofs, and better-off households have walls of baked bricks and roofs of iron
sheets or tiles. From the survey it becomes clear that 55% of households have a roof that consists of
metal sheets and 44% have a roof that consists of straw. Moreover, the questionnaire results show the
walls of 64% of households are made from beaten earth (mud), 11% of households have walls made of
bamboo with beaten earth (as shown in the picture below) and 10% of walls are made of unbaked mud
bricks.9 When comparing this survey with the baseline and socioeconomic impact study of Tuungane,
the findings are similar (Humphreys, 2008; Humphreys et al., 2012). These studies show the relatively
high share of households that use mud is typical for South Kivu. Other provinces, such as Maniema,
Haut Katanga and Tanganyika, are more likely to use mud bricks instead of mud. The Tuungane studies
also conclude that the vast majority of respondents use lower-quality materials, which is seen to be an
indication of poverty. They also find an increased use of metallic sheets, which is seen as a higher-
quality material.
In addition to the above, we find firewood is the main source of energy for cooking, as this was
identified by 82% of households. A total of 14% of households use dung-cake, 3.5% agricultural crop
waste or straw and 0.2% kerosene as the principal sources for cooking.
9 The materials included in study were plants/mats, beaten earth, planks, cement blocks, unbaked mud bricks, baked mud
bricks, concrete, bamboo, bamboo and beaten earth.
Two types of dwellings in eastern Congo, October 2012 (de Milliano)

16
Land ownership 4.1.2
Given the importance of agriculture in DRC, insights into land ownership are important. Our survey data
show that, on average, households have access to 2.69 hectares of land. However, two factors
complicate land access. First, the amount of land households actually own is often far less than this
(see Figure 4), raising questions about the extent to which they can securely and regularly access land.
Second, our field team observed serious access constraints to cultivation and grazing land in two of the
three research areas, owing to the dangers of farming at some distance from the village or town.
Insecurity in the east of the country has led to a decrease in production and limitations in access to land
and, as other research notes, markets (Vlassenroot et al., 2006). Scholars emphasise that reduced
access to land in DRC is one of the key constraints to food security (ibid.). A prerequisite for re-
establishing food security and for achieving sustainable peace will lie in addressing some of the land-
related structural factors of poverty.
Figure 4: Hectares of land owned (% of households)
Asset ownership 4.1.3
Following the broader SLRC study design, the Morris Score Index (MSI) was calculated in order to
explore household wealth and expenditures (see Morris et al., 1999). The MSI is a weighted asset
indicator that weighs each durable asset owned by the household by the share of households owning
the asset. For our survey instrument, 21 assets were included to explore the households wealth,
including: mattress, bed, radio, mobile phone, wooden table and chairs, motor, car, bicycle, small
livestock, medium livestock, large livestock, hand tools for digging/weeding, hand tools for cutting,
animal-powered machines and petrol-powered machines. These assets were chosen based on
discussions with academics familiar with household assets in South Kivu. Figure 5 shows which items
were most commonly owned by households within our sample population.
38%
13% 13%
28%
8%
0
5
10
15
20
25
30
35
40
<0.1Ha 0.1-0.5Ha 0.5-1Ha 1-5Ha >5Ha
% of hhs

17
Figure 5: Assets owned by households (%)
The mean MSI score for the sample population as a whole was 30.50 (range 0-1336), but there are
also considerable variations between different groups within the sample. Table 3 illustrates how scores
– that is, levels of wealth as proxied by asset ownership – vary by gender of household head, education
level of household, household displacement status and recent experiences of conflict.10 Variations by
primary source of household income and total number of shocks experienced did not prove to be
statistically significant, and so are excluded. As can be seen, scores tend to be considerably lower for
female-headed households (compared with male-headed households), less educated households
(compared with more educated households), households that have been displaced at some point
(compared with those that have not) and households that have experienced conflict in the past three
years (compared with those that have not).
10 Household displacement status does not necessarily refer to current status, but rather is an indication of whether a
household has been displaced at some point.
49
69
47
25
57
2 2 0 0 0 2
18
45
37
13
86
75
0 0 1 1
0
10
20
30
40
50
60
70
80
90
100
% of hhs

18
Table 3: MSI values, by different sub-populations
Sub-population Mean MSI value
Gender of household head (***)
Male 32.52
Female 15.98
Household education level (**)
None 22.90
Literate 25.78
Any primary 41.28
Any secondary or higher 58.42
Displacement status (***)
Not displaced at any point 33.11
Displaced at some point 18.23
Experience of conflict in past three years (**)
No 34.82
Yes 27.28
Note: Asterisks indicate whether the mean for each group is statistically different from the sampled population as a whole (*
significant at 10%; ** significant at 5%; *** significant at 1%).
Our survey also asked respondents to estimate the total value of the assets they owned. Thus, to cross-
check the MSI score, the total economic value of the same set of assets was explored. The mean of the
total value of the assets owned by households was $183.31.
In order to explore which factors influence the number of assets a household possesses, multiple linear
regressions were performed. A detailed table portraying the main independent variables and results of
the regression analysis can be found in the Annex (Table 3). Based on the regression results, a number
of factors appear to influence household asset ownership. We find that households with higher average
levels of education, that receive a livelihood assistance transfer and whose respondents reported
feeling safe when travelling are also likely to own a greater number of assets (statistically significant at
1%, 5% and 5%, respectively). On the other hand, lower levels of asset ownership appear to be linked to
a higher number of explanatory factors, including experiencing conflict in the past three years (1%)11;
having been displaced (5%); having a female head of household (5%); being Tembo or Kilega rather
than Shi (10%); having agriculture as the primary source of household income (5%); and facing longer
journey times to a water source (1%, but weak effect size). When included in the regression model,
independent variables related to education services (such as satisfaction with local school) do not prove
to be statistically significant (Annex Table 4).
4.3 Food insecurity
The existing literature points to the complex interaction of food insecurity and conflict. Conflict and
institutional variability put existing food systems under stress and can turn them into volatile,
unpredictable and uncontrollable mechanisms. In addition, famine can increase competition for food
and instigate armed struggle (Pingali et al., 2005; Vlassenroot et al., 2006).
For our survey, food insecurity is proxied through a measure based on the Coping Strategies Index (see
Maxwell, 2008). The index is a weighted sum reflecting the frequency with which households adopted
particular behaviours over the course of the previous 30 days. The weights given to these coping
strategies reflect their relative severity as follows (weights in parenthesis):
11 This refers to a level of statistical significance of 1%

19
Had to rely on less preferred and less expensive food (1);
Had to borrow food or rely on help from friends or relatives (2);
Had to limit portion size at meal time (1);
Had to restrict consumption by adults in order for small children to eat (3);
Had to reduce number of meals eaten in a day (1).
Thus, a higher Coping Strategies Index score indicates a higher level of household food insecurity.
Using the Coping Strategies Index to measure levels of food insecurity, we find that the mean score for
our sample is 12.46. We observe the following variations between different sub-populations within the
sample (see Table 4):
Female-headed households are on average more food insecure than male headed-
households (female-headed households are also more likely to be single-parent households,
which may help explain why they are more food insecure).
Households with no education whatsoever are on average more food insecure than
households with any level of education.
Households that have been displaced at some point are on average more food insecure than
households that have never been displaced.
Households that have experienced conflict in the past three years are on average more food
insecure than households that have not.
Less well-off households are on average more food insecure than wealthier households.
Households that have experienced five or more shocks in the past three years are on
average more food insecure than those that have experienced fewer than five.
Scores also vary by primary household income source, with households whose main source was non-
agricultural casual labour exhibiting a lower mean level of food insecurity than households whose main
source was agricultural casual labour or social transfers.
Table 4: Coping Strategies Index scores, by different sub-populations
Sub-population Mean score Gender of household head (*)
Male 12.32
Female 13.45
Household education level (***)
None 12.97
Literate 12.74
Any primary 11.74
Any secondary or higher 10.13
Displacement status (***)
Not displaced at any point 11.67
Displaced at some point 16.20
Experience of conflict in past three years (***)
No 10.24
Yes 14.24
Morris Score Index (***)
Lowest 10% 16.41
Up to median 14.12
Above median 10.75
Highest 10% 8.63
Total number of shocks (***)
None 13.26
Fewer than five 11.08
Five or more 14.64
Primary source of household income (***)
Cultivation/livestock/fishing 12.27
Agriculture 12.33
Casual labour (agriculture) 14.65
Casual labour (non-agriculture) 10.20
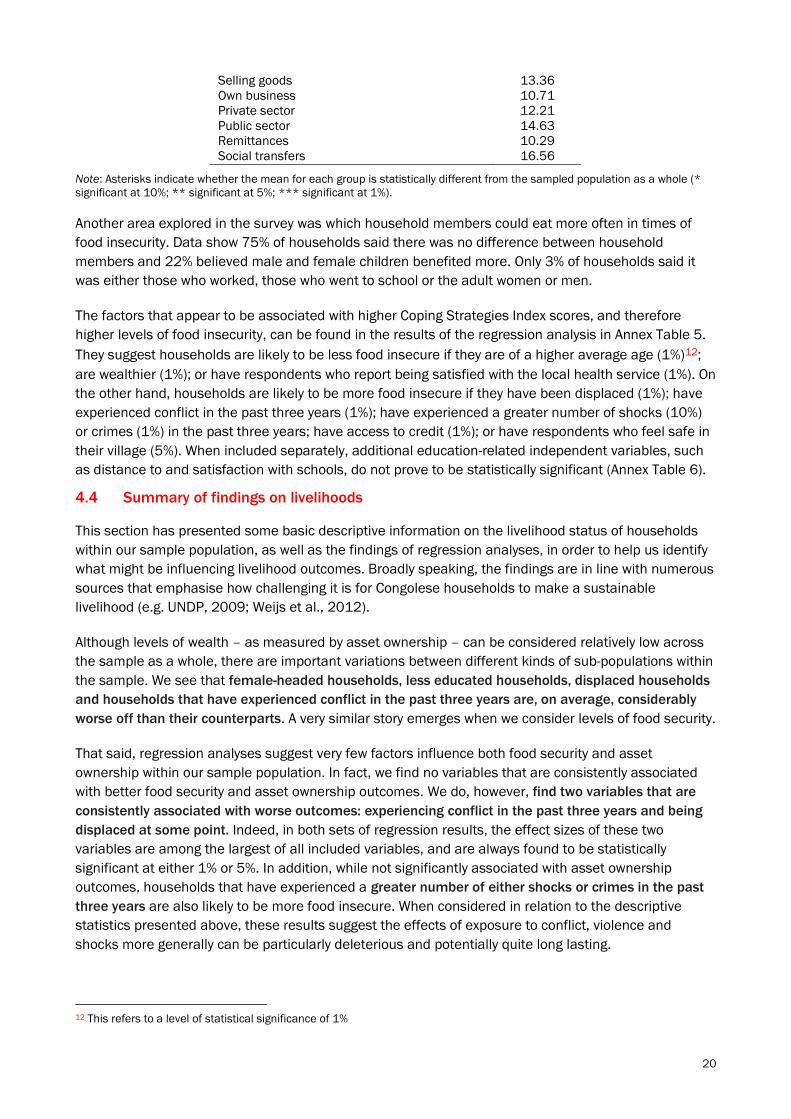
20
Selling goods 13.36
Own business 10.71
Private sector 12.21
Public sector 14.63
Remittances 10.29
Social transfers 16.56
Note: Asterisks indicate whether the mean for each group is statistically different from the sampled population as a whole (*
significant at 10%; ** significant at 5%; *** significant at 1%).
Another area explored in the survey was which household members could eat more often in times of
food insecurity. Data show 75% of households said there was no difference between household
members and 22% believed male and female children benefited more. Only 3% of households said it
was either those who worked, those who went to school or the adult women or men.
The factors that appear to be associated with higher Coping Strategies Index scores, and therefore
higher levels of food insecurity, can be found in the results of the regression analysis in Annex Table 5.
They suggest households are likely to be less food insecure if they are of a higher average age (1%)12;
are wealthier (1%); or have respondents who report being satisfied with the local health service (1%). On
the other hand, households are likely to be more food insecure if they have been displaced (1%); have
experienced conflict in the past three years (1%); have experienced a greater number of shocks (10%)
or crimes (1%) in the past three years; have access to credit (1%); or have respondents who feel safe in
their village (5%). When included separately, additional education-related independent variables, such
as distance to and satisfaction with schools, do not prove to be statistically significant (Annex Table 6).
4.4 Summary of findings on livelihoods
This section has presented some basic descriptive information on the livelihood status of households
within our sample population, as well as the findings of regression analyses, in order to help us identify
what might be influencing livelihood outcomes. Broadly speaking, the findings are in line with numerous
sources that emphasise how challenging it is for Congolese households to make a sustainable
livelihood (e.g. UNDP, 2009; Weijs et al., 2012).
Although levels of wealth – as measured by asset ownership – can be considered relatively low across
the sample as a whole, there are important variations between different kinds of sub-populations within
the sample. We see that female-headed households, less educated households, displaced households
and households that have experienced conflict in the past three years are, on average, considerably
worse off than their counterparts. A very similar story emerges when we consider levels of food security.
That said, regression analyses suggest very few factors influence both food security and asset
ownership within our sample population. In fact, we find no variables that are consistently associated
with better food security and asset ownership outcomes. We do, however, find two variables that are
consistently associated with worse outcomes: experiencing conflict in the past three years and being
displaced at some point. Indeed, in both sets of regression results, the effect sizes of these two
variables are among the largest of all included variables, and are always found to be statistically
significant at either 1% or 5%. In addition, while not significantly associated with asset ownership
outcomes, households that have experienced a greater number of either shocks or crimes in the past
three years are also likely to be more food insecure. When considered in relation to the descriptive
statistics presented above, these results suggest the effects of exposure to conflict, violence and
shocks more generally can be particularly deleterious and potentially quite long lasting.
12 This refers to a level of statistical significance of 1%

21
One possibly surprising finding is that, while respondents who reported feeling safe when travelling
were likely to live in wealthier households, respondents who reported feeling safe within their village
were by contrast likely to live in more food-insecure households. Further research may be needed to
investigate this situation further.
Finally, if we look only at asset ownership, we see that an expected series of factors is found to be
statistically significant: more educated households, for example, are likely to be wealthier, but female-
headed households and Tembo and Kilega (as opposed to Shi) households are likely to be less well off.
Again, these results are supported by the descriptive statistics presented earlier in this section. We also
find that households that have agriculture as a primary income source are more likely to be less
wealthy, perhaps because of the small size of landholdings for most households.

22
5 Basic services and livelihoods assistance
The delivery of basic social and utility services such as health care, education, water, electricity,
transportation and communications is often problematic in conflict-affected situations. The lack or ill
functioning of these services can have negative consequences for people’s health and income-earning
capacity and other crucial aspects of development (Stel et al., 2011). In its second national
development and poverty reduction strategy, the DRC government expresses its intent to provide
access to basic services to the whole Congolese population (Ministère du Plan, 2011). However, as
Weijs et al. (2012) and other authors also point out, basic services such as water, health care,
education, sanitation and transport are weak and insufficient. This can be understood partly by
considering the irregularity of funding and the multiplicity of governmental and non-governmental
institutions, all with overlapping mandates and responsibilities. Weijs et al. explain that this has
resulted in a complex system, in which quality and prices of services are constantly up for negotiation.
The main reason why services such as education and health have not fully collapsed is related to the
role played by church-based structures and non-governmental organisations (NGOs) since the Mobutu
era. Despite international support to service provision, clients often have to pay considerable
contributions, not only for direct costs (such as costs for teachers, educational material, infrastructure),
but also to cover costs for local and provincial administration services.
The aim of this section is two-fold: 1) to describe households’ access to and satisfaction with services;
and 2) to explore through regression analyses which factors appear to influence access and
satisfaction. Simple measures of access are used: in the cases of health, education and water services,
we consider return journey times to health centres/hospitals, primary schools and water sources,
whereas for livelihood assistance we consider whether households were receiving any form of support.
5.1 Water and sanitation services
According to the literature, less than a decade ago only 47% of the population of DRC had access to an
improved water source (Weijs et al., 2012, based on ADF, 2007). The survey provides similar insights
on the use of and access to water in the research areas.
For 43% of the households in our sample population, an open or protected spring (also referred to as a
source) is the main way to access drinking water. For another 43% of households there is a public tap
outside and the remainder use the river, a protected or unprotected well or a tap on their plot. Just 2%
of households have access to a tap inside their own plot (Figure 6). Humphreys’ (2008) survey identifies
a higher share of households with access to a home tap (7%) and to a protected well (27%). The
majority of surveyed households (66%) always had (potable) water available at their principal source;
only 2% indicated that it was often not available. Further, 58% reported that they did not need to queue
for drinking water while 35% of respondents reported having to pay for it.
In terms of sanitary facilities, the findings show 61% of the households have a private toilet that is an
open pit latrine, 17% have an open pit latrine they share with their neighbours, 9% own a private
ventilated improved pit latrine/latrine with a slab and 7% have no toilet. A survey performed by the
Ministry of Health in South Kivu in 2011 reports that, out of 440 households, 11% had a latrine in a
good condition (Soeters and Kimanuka, 2011).

23
Figure 6: Households’ main source of drinking water (%)
Mean journey time to a water source for the sample as a whole is 26 minutes; for 76% of households
potable water is accessible within half an hour’s walk. These figures are lower than those identified in
Humphreys (2008), which gives the mean distance to a water source as 52 minutes’ walk. Descriptive
statistics (Table 5) show households that have recently experienced displacement or conflict face, on
average, a shorter journey time to a water source. We also see that journey times vary considerably by
primary source of household income, with those whose main source was their own business or
agricultural casual labour facing, on average, significantly longer journey times than households for
which social transfers or remittances constituted the main source of income.
Results from regression analysis (see Annex Table 7) suggest households are likely to have much better
access to water if they have to pay official fees for the service (statistically significant at 1%), if they
have experienced conflict in the past three years (1%), if they are Tembo or Kilega rather than Shi (5%)
or if they have been displaced at some point (5%). Greater household wealth is also found to be
associated with slightly better access, or marginally shorter journey times (5%). On the other hand, more
educated households and households that have attended community meetings about water services
are more likely to have worse access to a water source – perhaps because they are seeking to get a
water supply closer to their homes (significant at 5% and 10%, respectively).
Table 5: Mean journey time to water source, by different sub-populations
Sub-population Mean journey time to water source (minutes)
Displacement status (***)
Not displaced at any point 27.19
Displaced at some point 19.44
Experience of conflict in past three years (***)
No 29.39
Yes 23.19
Primary source of household income (***)
Own business 36.47
Casual labour (agriculture) 29.67
Cultivation/livestock/fishing 27.96
Public sector 25.94
Private sector 24.54
Selling goods 21.27
2%
43%
3% 4%
43%
5%
0%
Tap in the plot
Public tap outside
Well (protected)
Well (unprotected)
Spring
River/ lake
Other
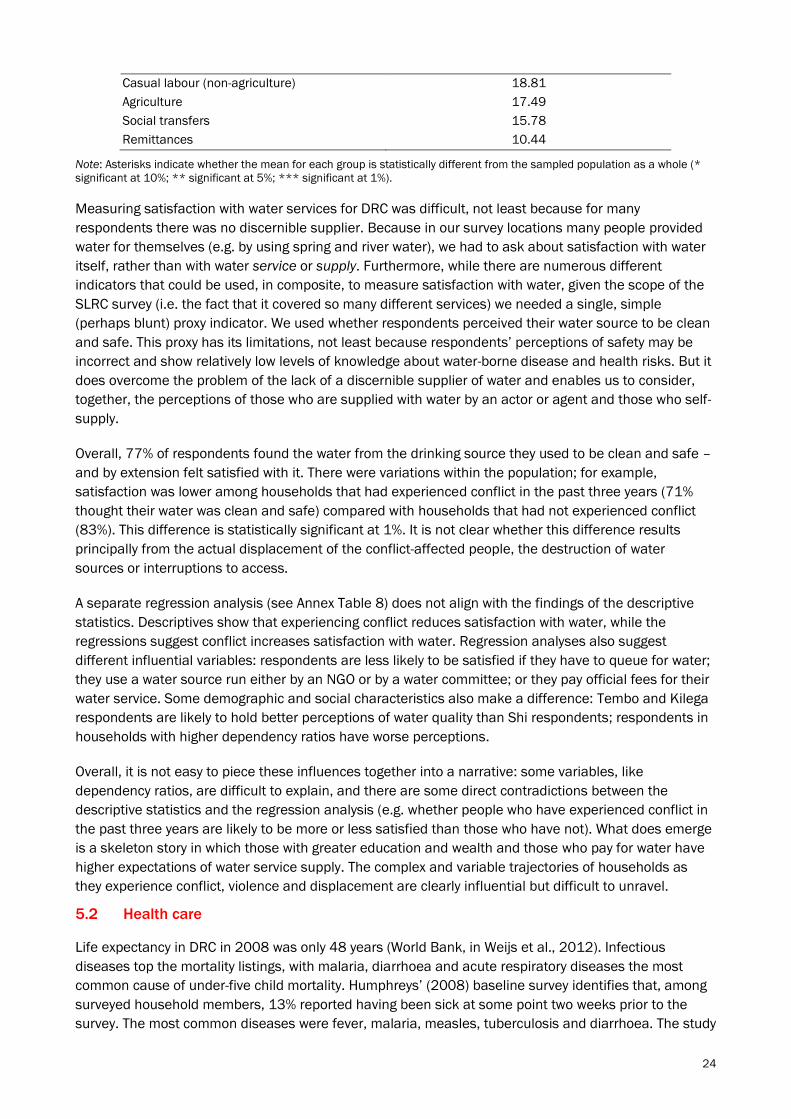
24
Casual labour (non-agriculture) 18.81
Agriculture 17.49
Social transfers 15.78
Remittances 10.44
Note: Asterisks indicate whether the mean for each group is statistically different from the sampled population as a whole (*
significant at 10%; ** significant at 5%; *** significant at 1%).
Measuring satisfaction with water services for DRC was difficult, not least because for many
respondents there was no discernible supplier. Because in our survey locations many people provided
water for themselves (e.g. by using spring and river water), we had to ask about satisfaction with water
itself, rather than with water service or supply. Furthermore, while there are numerous different
indicators that could be used, in composite, to measure satisfaction with water, given the scope of the
SLRC survey (i.e. the fact that it covered so many different services) we needed a single, simple
(perhaps blunt) proxy indicator. We used whether respondents perceived their water source to be clean
and safe. This proxy has its limitations, not least because respondents’ perceptions of safety may be
incorrect and show relatively low levels of knowledge about water-borne disease and health risks. But it
does overcome the problem of the lack of a discernible supplier of water and enables us to consider,
together, the perceptions of those who are supplied with water by an actor or agent and those who self-
supply.
Overall, 77% of respondents found the water from the drinking source they used to be clean and safe –
and by extension felt satisfied with it. There were variations within the population; for example,
satisfaction was lower among households that had experienced conflict in the past three years (71%
thought their water was clean and safe) compared with households that had not experienced conflict
(83%). This difference is statistically significant at 1%. It is not clear whether this difference results
principally from the actual displacement of the conflict-affected people, the destruction of water
sources or interruptions to access.
A separate regression analysis (see Annex Table 8) does not align with the findings of the descriptive
statistics. Descriptives show that experiencing conflict reduces satisfaction with water, while the
regressions suggest conflict increases satisfaction with water. Regression analyses also suggest
different influential variables: respondents are less likely to be satisfied if they have to queue for water;
they use a water source run either by an NGO or by a water committee; or they pay official fees for their
water service. Some demographic and social characteristics also make a difference: Tembo and Kilega
respondents are likely to hold better perceptions of water quality than Shi respondents; respondents in
households with higher dependency ratios have worse perceptions.
Overall, it is not easy to piece these influences together into a narrative: some variables, like
dependency ratios, are difficult to explain, and there are some direct contradictions between the
descriptive statistics and the regression analysis (e.g. whether people who have experienced conflict in
the past three years are likely to be more or less satisfied than those who have not). What does emerge
is a skeleton story in which those with greater education and wealth and those who pay for water have
higher expectations of water service supply. The complex and variable trajectories of households as
they experience conflict, violence and displacement are clearly influential but difficult to unravel.
5.2 Health care
Life expectancy in DRC in 2008 was only 48 years (World Bank, in Weijs et al., 2012). Infectious
diseases top the mortality listings, with malaria, diarrhoea and acute respiratory diseases the most
common cause of under-five child mortality. Humphreys’ (2008) baseline survey identifies that, among
surveyed household members, 13% reported having been sick at some point two weeks prior to the
survey. The most common diseases were fever, malaria, measles, tuberculosis and diarrhoea. The study

25
also found 66% of respondents who had suffered from a serious sickness had been able to access a
health care professional such as a nurse (38%), doctor (7%) or medical assistant (7%).
Our survey asked about households’ access to and use of their local health service. Access was
explored by asking respondents about journey times and how recent their household’s last visit was. A
distinction was drawn between hospitals and health centres/posts, the former being fewer in number
but serving a wider catchment area.
We found that, on average, for the sample as a whole, a return trip by foot to the health centre takes
around 48 minutes and to the hospital nearly 3 hours (164 minutes). There are more health clinics than
hospitals in South Kivu, which is confirmed by the survey data: 52% of respondents identified a health
centre at less than half an hour’s walking distance; 12% said the same for a hospital. In addition, while
nearly 80% of households can reach a health centre within one hour’s walk (return trip by foot), only
25% of households can reach a hospital within one hour on foot (see Figures 7 and 8). In terms of how
these numbers compare with other studies, Humphreys (2008) finds that, on average, a hospital is a
109-minute walk away. Further, UNDP’s (2009) household survey identifies that 44% of households in
South Kivu live 15 minutes from a health post, 73% can reach a health centre within half an hour and
55% live within 60 minutes of a hospital. It must be noted, however, that, given the costs of health care
in DRC, distance to a health service is only one aspect of health care access. This is confirmed by
studies such as Soeters and Kimanuka (2011).
Figure 7: Distance to health centre (return trip on foot)
Figure 8: Distance to hospital (return trip on foot)
We also explored how journey times to health centres varied within the sample. Table 6 shows mean
journey times are lower for households that have been displaced (compared with those that have not),
for households that have experienced conflict in the past three years (compared with those that have
not) and for households that have experienced a higher number of shocks (compared with those that
have experienced fewer or none). The table also shows that, on average, wealthier households face
longer journey times to a health centre, and journey times vary considerably by primary source of
52
31
5 9
4
0
10
20
30
40
50
60
<0.5h 0.5-1h 1-1.5h 1.5-2h >2h
12% 13%
55
23%
47%
0
10
20
30
40
50
<0.5h 0.5-1h 1-1.5h 1.5-2h >2h
% of hhs
% of hhs
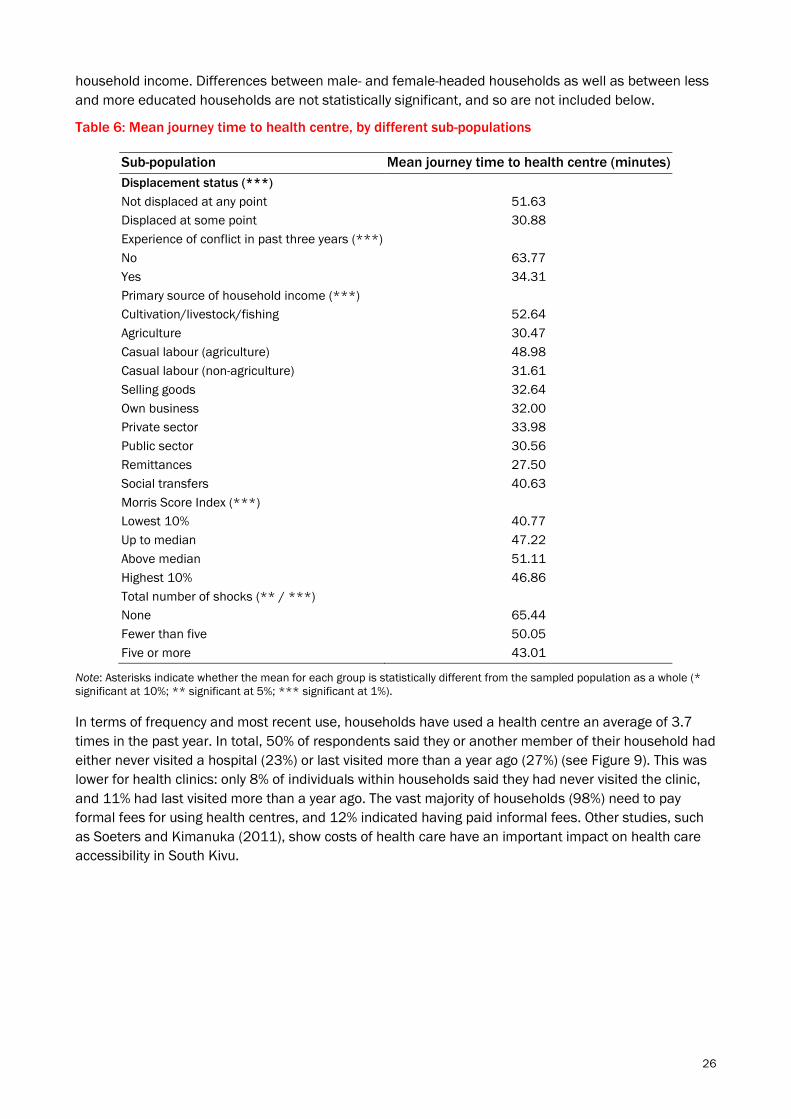
26
household income. Differences between male- and female-headed households as well as between less
and more educated households are not statistically significant, and so are not included below.
Table 6: Mean journey time to health centre, by different sub-populations
Sub-population Mean journey time to health centre (minutes)
Displacement status (***)
Not displaced at any point 51.63
Displaced at some point 30.88
Experience of conflict in past three years (***)
No 63.77
Yes 34.31
Primary source of household income (***)
Cultivation/livestock/fishing 52.64
Agriculture 30.47
Casual labour (agriculture) 48.98
Casual labour (non-agriculture) 31.61
Selling goods 32.64
Own business 32.00
Private sector 33.98
Public sector 30.56
Remittances 27.50
Social transfers 40.63
Morris Score Index (***)
Lowest 10% 40.77
Up to median 47.22
Above median 51.11
Highest 10% 46.86
Total number of shocks (** / ***)
None 65.44
Fewer than five 50.05
Five or more 43.01
Note: Asterisks indicate whether the mean for each group is statistically different from the sampled population as a whole (*
significant at 10%; ** significant at 5%; *** significant at 1%).
In terms of frequency and most recent use, households have used a health centre an average of 3.7
times in the past year. In total, 50% of respondents said they or another member of their household had
either never visited a hospital (23%) or last visited more than a year ago (27%) (see Figure 9). This was
lower for health clinics: only 8% of individuals within households said they had never visited the clinic,
and 11% had last visited more than a year ago. The vast majority of households (98%) need to pay
formal fees for using health centres, and 12% indicated having paid informal fees. Other studies, such
as Soeters and Kimanuka (2011), show costs of health care have an important impact on health care
accessibility in South Kivu.

27
Figure 9: Households’ use of health services (%)
In order to explore which factors appear to affect access to health centres – as proxied by journey times
– we ran a regression analysis using distance to the health centre (in minutes) as the dependent
variable (Annex Table 9). We found only one independent variable to be associated with worse access: if
households have to pay informal fees for their health service (statistically significant at 5%). Several
independent variables are associated with better access: experiencing conflict in the past three years
(1%), perhaps because NGO health services may be targeted to those areas where people have
experienced conflict; higher levels of household education (10%); access to private forms of
transportation (10%); and being satisfied with the length of waiting times at the health centre (10%).
If we look more closely at levels of satisfaction with health services, we observe that, generally
speaking, respondents are perhaps less dissatisfied than might be expected given the volatility that has
characterised South Kivu in recent years. Figure 10 shows the distribution of responses in relation to
overall satisfaction with hospitals. We present more specific satisfaction data in relation to the more
widely used health centres below.
Figure 10: Respondents’ overall satisfaction with hospitals (%)
Our survey data also allow us to look at respondents’ levels of satisfaction with specific features of
health centres, such as waiting times and costs. As Figure 11 shows, quite substantial proportions of
our sample expressed some degree of satisfaction with most features of health clinics. In fact, it was
only in relation to costs that more than 50% of respondents reported being either dissatisfied or very
dissatisfied.
8%
19%
31%
27%
5%
11%
23%
9%
12%
19%
10%
27%
0
5
10
15
20
25
30
35
Never In the past 7
days
In the past 30
days
In the past 6
months
In the past year More than one
year ago
Use of health centre Use of hospital
7%
15%
38% 37%
3%
0
5
10
15
20
25
30
35
40
45
Very unsatisfied Unsatisfied Rather satisfied Satisfied Very satisfied
% of hhs
% of
respondents

28
Figure 11: Respondents’ satisfaction with different aspects of health centres (%)
Soeters and Kimanuka (2011) found even higher satisfaction rates with health services, which were
also increasing over time: 80% of respondents were satisfied with quality in 2008, rising to 93% in
2011. Especially during the war, health services were drastically poor in South Kivu. It is assumed that
high levels of satisfaction with both health centres and hospitals are a result of the low starting level
and improvements to services by the multitude of programmes conducted by many actors in this sector
in the past five or more years: many health centres and hospitals have been rehabilitated or are newly
constructed, drug supplies have become more regular, staff are trained and better paid and supervision
has improved.
However, it must be noted that perception of quality is very different from absolute quality. Interestingly,
Soeters and Kimanuka (2011) found the former differed strongly from health experts’ assessment of
the quality of health services. This highlights that, even if the quality of services is low, satisfaction can
still be high. The large difference between user satisfaction and experts’ opinions requires further study.
What does the relationship between satisfaction and the identity of the health service provider look
like? Over the past 20-30 years, many health services have been provided by church organisations and
NGOs (World Bank, 2005). In the 1980s, DRC maintained slightly better health services than other Sub-
Saharan countries, which can be explained partly by its implementation of the Alma Ata Primary Health
Declaration. This included the creation of heath zones and the participation of communities in primary
health service delivery and management. But from the 1990s onwards, war and the near collapse of
the state caused the country’s health infrastructure and services to deteriorate severely.
Faith-based organisations, especially the Catholic Church, had and still have a strong position in relation
to the state. Since colonial times, they have provided most of the health services in South Kivu under
some degree of authorisation by the provincial health department. Health services are largely financed
by communities, with high user fees. Since the province is strongly affected by conflict, it has attracted
much attention from international actors, who have supported reconstruction and service provision. Aid
organisations have worked mainly on service delivery, including providing infrastructure, equipment,
drugs, staff training and salary supplements (Waldman, 2006).
We explored the relationship between levels of satisfaction and actors responsible for running the
health clinic (Figure 12). A one-way Anova analysis shows respondents who believe a church or religious
organisation is responsible for the clinic (N=433) are significantly more satisfied with it. Respondents
0%
10%
20%
30%
40%
50%
60%
70%
80%
90%
100%
Number of
qualified
personnel
Availability of
medicines
Waiting time Cost Accessibility
Very satisfied
Satisfied
Rather satisfied
Dissatisfied
Very dissatisfied
% of
respondents

29
believing the private sector is responsible (N=53) are significantly less satisfied. There were no
significant differences found between the other groups (those who believe the clinic is run by
government, the community or NGOs).
Figure 12: Satisfaction with health centre (combined scale)
In order to identify which factors appear important in influencing reported levels of overall satisfaction
with health centres, regression analysis was carried out (see Annex Table 10).13 We find that
respondents are more likely to report higher levels of satisfaction if they are from households that have
been displaced at some point (5%) or that have higher dependency ratios (5%). We also find
respondents report higher levels of overall satisfaction when they are satisfied with the number of staff,
quality of medicine and waiting times at the facility (all at 1%). However, they are less likely to do so if
they are Tembo or Kilega (rather than Shi) (5%), if they are from a household whose primary income
source is agriculture (1%), if they have to travel for longer to reach the health centre (1%) or if they have
to pay informal fees in order to access the health service (1%).
5.3 Education
The Congolese national policy on education sets out three objectives: increase access, accessibility,
equity and retention in the various levels of education; improve the quality and relevance of teaching;
and strengthen sector governance (Ministère du Plan, 2011b). The evidence paper of Weijs et al.
(2012) highlights that people in DRC have limited access to educational services. Although the second
national development and poverty reduction strategy intends to promote free and compulsory primary
education, school costs are often pointed out as a key limiting factor (de Herdt and Poncelet, 2010;
Weijs et al., 2012). Soeters and Kimanuka (2011) identify a decrease in the proportion of children of
school-going age who go to school from 81% in 2008 to 69% in 2011. Existing evidence also indicates
that, generally speaking, girls tend to have lower levels of access to education than boys. According to
Gouzou et al. (2009), 28% of Congolese women versus 14% of men have never attended school and, of
those aged 15-49 years, the proportion of women without any instruction is four times higher than that
of men (21% versus 5%). Soeters and Kimanuka (2011) note that, in 2011, 65% of girls and 75% of
boys in South Kivu were going to school.
In terms of distance to schools for households in our sample, the survey data show that a return trip to
a primary school takes around 52 minutes for boys and around 55 minutes for girls (difference not
statistically significant). These findings are not too dissimilar to those in Humphreys’ (2008) survey,
13 The variable ‘satisfaction with health centre’ is based on factor analysis (and reliability analysis). It was created using the
questions on satisfaction with specific aspects of the health clinic service that had the same underlying construct and
continuous scale (that ranges from 1 to 5).
2.97
2.48
3.19 2.88 2.95
0.00
0.50
1.00
1.50
2.00
2.50
3.00
3.50
Government (N=464) Private sector (N=53) Church or religious
organisation (N=433)
Community (N=22) NGO (N=77)
(1=very dissatisfied - 5 = very satisfied)
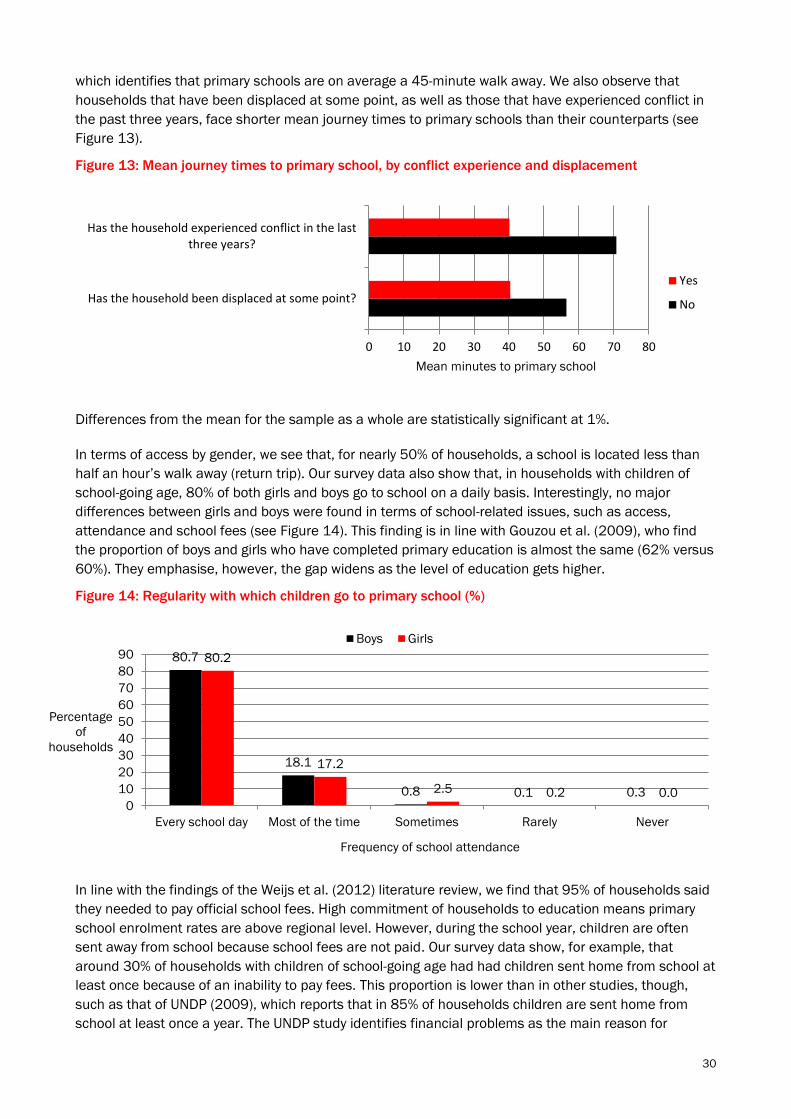
30
which identifies that primary schools are on average a 45-minute walk away. We also observe that
households that have been displaced at some point, as well as those that have experienced conflict in
the past three years, face shorter mean journey times to primary schools than their counterparts (see
Figure 13).
Figure 13: Mean journey times to primary school, by conflict experience and displacement
Differences from the mean for the sample as a whole are statistically significant at 1%.
In terms of access by gender, we see that, for nearly 50% of households, a school is located less than
half an hour’s walk away (return trip). Our survey data also show that, in households with children of
school-going age, 80% of both girls and boys go to school on a daily basis. Interestingly, no major
differences between girls and boys were found in terms of school-related issues, such as access,
attendance and school fees (see Figure 14). This finding is in line with Gouzou et al. (2009), who find
the proportion of boys and girls who have completed primary education is almost the same (62% versus
60%). They emphasise, however, the gap widens as the level of education gets higher.
Figure 14: Regularity with which children go to primary school (%)
In line with the findings of the Weijs et al. (2012) literature review, we find that 95% of households said
they needed to pay official school fees. High commitment of households to education means primary
school enrolment rates are above regional level. However, during the school year, children are often
sent away from school because school fees are not paid. Our survey data show, for example, that
around 30% of households with children of school-going age had had children sent home from school at
least once because of an inability to pay fees. This proportion is lower than in other studies, though,
such as that of UNDP (2009), which reports that in 85% of households children are sent home from
school at least once a year. The UNDP study identifies financial problems as the main reason for
0 10 20 30 40 50 60 70 80
Has the household been displaced at some point?
Has the household experienced conflict in the lastthree years?
Yes
No
80.7
18.1
0.8 0.1 0.3
80.2
17.2
2.5 0.2 0.0 0
10
20
30
40
50
60
70
80
90
Every school day Most of the time Sometimes Rarely Never
Boys Girls
Mean minutes to primary school
Frequency of school attendance
Percentage
of
households

31
stopping education. Soeters and Kimanuka (2011) also find that 82% of households identified high
school fees as the reason for not sending children to school. Gouzou et al. (2009) found households in
their study area paid $2 entry fees and a monthly fee of $1, which families were usually not able to
afford for all their children. During informal discussions, respondents explained that, in mining areas in
particular, boys in secondary school often left schools for financial reasons – to work in the mines – at
the age of 15-16 years.
Regression analysis was used to identify which factors appear to influence access to schools (see
Annex Table 11). Results suggest having agriculture as the main source of household income is
associated with worse access to schools (statistically significant at 5%). On the other hand, we find
better access is associated with experiencing conflict in the past three years (1%). Further, we find two
aspects of the education service itself – satisfaction with the quality of school infrastructure (10%) and
living in a community where a meeting about education has been held (10%) – are also associated with
considerably better access.
Just as in the case of health services, our survey asked about respondents’ levels of satisfaction with
the educational services they use. In addition to being asked about satisfaction with specific indicators
relating to the implementation of the service (e.g. teacher attendance, quality of school infrastructure),
respondents were asked to report an overall level of satisfaction with the quality of the service.
In terms of overall levels of satisfaction with schools, 6% reported being very dissatisfied, 24%
dissatisfied, 38% somewhat satisfied, 29% satisfied and 3% very satisfied (see Figure 15).
Figure 15: Overall satisfaction with primary schools (%)
We do not observe any statistically significant differences in degrees of satisfaction by gender of school-
goer, gender of household head or education level of household, but, as Table 7 shows, there are
significant differences when we split the sample in other ways.
6%
24%
38%
29%
3%
0
5
10
15
20
25
30
35
40
45
Very dissatisfied Dissatisfied Rather satisfied Satifsfied Very satisfied
Overall satisfaction about the quality of the school
% of
respondents

32
Table 7: Overall satisfaction with primary school, by different sub-groups
Very
dissatisfied
Dissatisfied Somewhat
satisfied
Fairly
satisfied
Very
satisfied
For sample as a whole 6 24 38 29 3 100
Displacement (***)
Not displaced 4.18 23.26 40.53 29.25 2.79 100
Displaced at some point 11.9 25.6 28.57 27.98 5.95 100
Morris Score Index (***)
Lowest 10% 9.88 24.69 40.74 17.28 7.41 100
Up to median 7.12 25.52 39.47 23.44 4.45 100
Above median 4.09 20.44 39.24 34.88 1.36 100
Highest 10% 5.61 23.77 38.45 28.81 3.36 100
Experience of conflict in past three years (***)
No 1.61 17.74 43.28 34.68 2.69 100
Yes 8.92 28.66 33.76 24.84 3.82 100
Number of shocks (***)
None 0 19.23 38.46 42.31 0 100
Fewer than five 3.97 21.17 42.53 29.11 3.21 100
Five or more 8.71 28.23 32.43 26.73 3.9 100
Note: Asterisks indicate whether the mean for each group is statistically different from the sampled population as a whole (*
significant at 10%; ** significant at 5%; *** significant at 1%).
On the more specific indicators, as Figure 16 shows, respondents rated the following aspects of the
school: teacher attendance, quality of teaching staff, number of teachers (teacher/child ratio), class
size, quality of school infrastructure, quality of equipment and costs.
Figure 16: Satisfaction with different aspects of primary schools (%)
When asked about different aspects of teacher performance, respondents appeared generally quite
satisfied: the proportions of respondents, for example, reporting dissatisfaction with teacher quality and
teacher attendance were both around the 15% mark. The story is quite different if we look at attitudes
towards quality of equipment and costs of schooling: in both cases, more than half of all respondents
reported being either ‘dissatisfied’ or ‘very dissatisfied’. Relatively high levels of dissatisfaction,
particularly with costs, are perhaps unsurprising. As explained above, previous studies show parents
0%
10%
20%
30%
40%
50%
60%
70%
80%
90%
100%
Number of
teachers
Quality of
teaching staff
Teacher
attendance
Class size Quality of
school
infrastructure
Quality of
equipment
Costs
Very satisfied Satisfied Rather satisfied Dissatisfied Very dissatisfied
% of
respondents

33
often need to pay both formal and informal fees to allow their children to gain access to education. For
example, Soeters and Kimanuka (2011) identify that, in the South Kivu area, school costs per person
per year are $12.70, which is around 8.8% of income per person per year. These fees do not only cover
a very large share of direct school costs (teachers, materials and infrastructure) but also contribute to
the costs of the local and provincial administration (local and provincial inspectors etc.). The same
study highlights differences in school costs per person per year (e.g. $6.72 in Kabare and $21.71 in
Katana).
In order to examine which factors appear to influence respondents’ overall levels of satisfaction with
girls’ and boys’ schools, regression analysis was performed (see Annex Table 12). We found a number
of independent variables relating to specific aspects or features of the service appear important. In
particular, lower overall levels of satisfaction are associated with dissatisfaction with the number of
teachers (statistically significant at 1%), dissatisfaction with the quality of teachers (10%),
dissatisfaction with school infrastructure (1%) and dissatisfaction with the size of classes (5%). We also
find higher overall levels of satisfaction are associated with satisfaction with the quality of school
equipment (1%). Second, we find the more crimes experienced by a household in the past three years,
the less likely the respondent is to report satisfaction with education (1%). Third, we find that, the older
the respondent, the more likely they are to be satisfied (10%).
5.4 Social protection and livelihoods assistance
For the purposes of our survey, social protection refers to food aid, whereas livelihood assistance refers
to seeds and tools, material aid and financial loans (including microfinance). There are no formal social
protection policies and systems in DRC, but there are small projects using social protection instruments,
such as food aid, cash transfers or small public works projects. These are delivered predominantly by
international NGOs and are almost always found under the remit of emergency response or
humanitarian assistance. Livelihood assistance presents a similar picture – with seeds and tools
transfers or extension and training occurring as components of humanitarian action. Because the SLRC
survey will try and understand change over time, and make comparisons, where feasible, between
different country contexts, we still collect and analyse information about social protection and livelihood
assistance receipts. Identifying whether the prevalence and coverage of these programmes changes
between the two rounds of the panel, and whether they influence perceptions of governance actors, will
provide important insights into the role of social protection and livelihood assistance and the timelines
over which change might take place.
Survey data show that 21% of households have received food aid, 12% seeds and tools, 4% material
aid (for construction) and just 2% financial loans (microfinance). Figure 17 gives an overview. The data
also show that, within households that receive some form of livelihood assistance, the member
specifically receiving the support tends to be female. For example, women receive 62% of seeds and
tools, 67% of food aid, 62% of material aid and 48% of financial loans.
Although the differences are not statistically significant, the data show that, of households displaced at
some point, 12% have received seeds and tools, 46% food aid and 15% material aid. For non-displaced
households, 15% have received seeds and tools, 16% food aid and 2% material aid.
Separate regression analyses were performed to identify factors associated with receipt of 1) food aid
and 2) seeds and tools (see Tables 13 and 14 in the Annex). Households that have experienced conflict
in the past three years, that have been displaced at some point and that are Tembo or Kilega (rather
than Shi) are all more likely to receive food aid (at 1%, 5% and 1%, respectively). However, households
whose primary income source is agriculture are less likely to receive it (10%). Conflict-affected and
previously displaced households are also more likely to receive seeds and tools (at 1% and 10%,
respectively), while households whose primary income source is agriculture are – again – less likely to
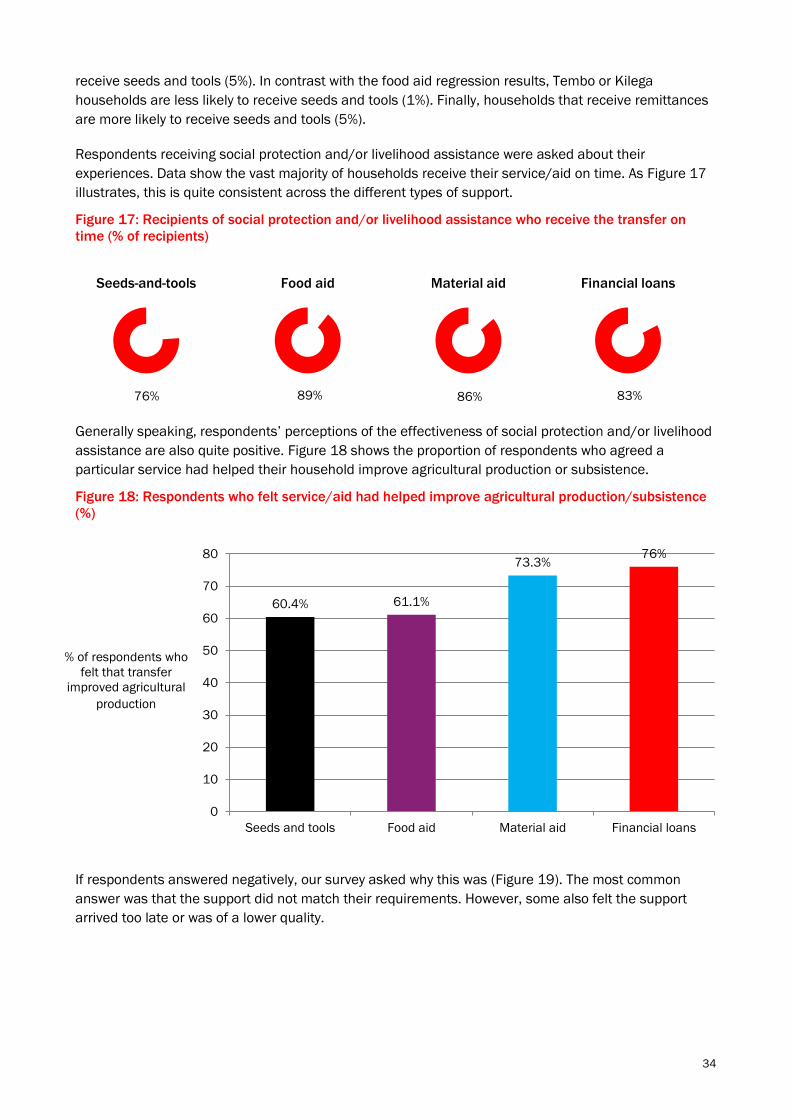
34
Seeds-and-tools Food aid Material aid Financial loans
receive seeds and tools (5%). In contrast with the food aid regression results, Tembo or Kilega
households are less likely to receive seeds and tools (1%). Finally, households that receive remittances
are more likely to receive seeds and tools (5%).
Respondents receiving social protection and/or livelihood assistance were asked about their
experiences. Data show the vast majority of households receive their service/aid on time. As Figure 17
illustrates, this is quite consistent across the different types of support.
Figure 17: Recipients of social protection and/or livelihood assistance who receive the transfer on
time (% of recipients)
Generally speaking, respondents’ perceptions of the effectiveness of social protection and/or livelihood
assistance are also quite positive. Figure 18 shows the proportion of respondents who agreed a
particular service had helped their household improve agricultural production or subsistence.
Figure 18: Respondents who felt service/aid had helped improve agricultural production/subsistence
(%)
If respondents answered negatively, our survey asked why this was (Figure 19). The most common
answer was that the support did not match their requirements. However, some also felt the support
arrived too late or was of a lower quality.
60.4% 61.1%
73.3% 76%
0
10
20
30
40
50
60
70
80
Seeds and tools Food aid Material aid Financial loans
76% 89% 86% 83%
% of respondents who
felt that transfer
improved agricultural
production

35
Figure 19: Reason for service/aid not being helpful (%)
In order to get a sense of what might be influencing respondents’ perceptions of the effectiveness of
social protection and/or livelihood assistance, we carried out regression analysis using perceptions of
food aid as the dependent variable (the most widely received form of livelihood assistance) (see Table
15 in the Annex).14 Three independent variables are statistically significant in a negative way. We first
find that, when food aid is provided by actors other than NGOs, respondents are less likely to perceive
the transfer as effective (5%).15 Second, and somewhat counter-intuitively, we find respondents are less
likely to perceive transfers as effective when the transfer is received on time (1%). Third, Tembo and
Kilega respondents are less likely to perceive the transfers as effective (10%). The only statistically
significant positive relationship is with the number of children in a household (10%).
5.5 Who delivers? Perceptions of service providers
In order to begin exploring the governance of services in our sample locations, we asked respondents
about who they perceived to be managing or providing the various services they were using. Generating
this information also allows us to examine whether the (perceived) identity of the provider has any
influence on perceptions of quality or levels of trust in governance actors.
We first consider water services (see Figure 20). Interestingly, only 4% of respondents believed the
government was responsible for access to drinking water; 34% said an NGO was responsible, followed
by 26% who believed a water committee was responsible; 21% believed nobody was responsible. These
findings reflect the near-total absence of government-run services in rural water supply in South Kivu.
The few public servants of these state services do not have appropriate equipment to leave Bukavu (the
main urban settlement where they are based). The relatively high proportion of respondents reporting
that NGOs provide their water reflects the construction of water supply by NGOs and other development
agencies, while the high score on water committees seems to indicate success in the formation of water
committees by these agencies for operation and maintenance purposes.
14 We were not able to run analysis on the perceived effectiveness of seeds and tools owing to an insufficient number of
observations. 15 This refers to a level of statistical significance of 5%
32%
23% 16%
29%
54%
8%
30%
8%
33% 33%
8%
25% 25%
0% 0%
75%
0
10
20
30
40
50
60
70
80
Support did not match
my requirements
It arrived too late It was of a low quality Other
Seeds and tools Food aid Material aid (for construction) Financial loans (micro finance)
% of
respondents

36
Figure 20: Perception of actors providing access to drinking water (%)
In terms of health and education services, interestingly, respondents mentioned either the
church/religious institution or the government as the main actors delivering health and education. As
Figure 21 shows, a slightly higher proportion perceived the government to be the key actor managing
the health centre; for schools, a higher share of respondents identified the church/religious
organisation. The role of other actors than the state in the provision of basic services is understandable,
since years of local, civil and international conflicts have weakened state institutions, leading to non-
state actors often serving as creators and maintainers of social order and services (Seay, 2013). As
explained previously, the prominence of church/religious organisations is understandable since many
health and educational services in the past 20-30 years have been provided by church organisations or
NGOs (World Bank, 2005). Congolese churches have a long history of involvement in social service
provision throughout DRC (both education and health services), and Catholic schools are widely
regarded as the best in the region (Seay, 2013).
What is interesting about our survey data on perceptions of providers’ identities is they do not seem to
square with existing sources, which show religious organisations are the main health care providers and
government provides only 10% of primary schools (Seay, 2013; Weijs et al., 2012). This might indicate
that many people are not fully aware of who is actually providing their services.
Figure 21: Perceptions of management of health centres and primary schools (%)
4 1
26
34
0
21
1
13
0
5
10
15
20
25
30
35
40
Government Church Water
committee
NGO Private
company
Nobody Myself Other
44%
5%
41%
2% 7%
0%
41%
1%
54%
0% 3%
0% 0
10
20
30
40
50
60
Government Private sector Church/ religious
organisation
Community NGO Other
Health centre School
% of
respondents
% of
respondents

37
As in the case of water services, the government is not perceived as the provider of social protection
and livelihoods assistance. This confirms studies such as Bailey et al. (2011), which emphasise the
small share of people who have access to various kinds of support and the fact that people do not rely
on the government, or expect it to support them. As Figure 22 shows, international NGOs are generally
the most frequently identified providers of livelihood services. The big exception is for financial loans,
which are provided by a more evenly distributed mix of actors (notably including family members,
friends and community-based organisations).16
Figure 22: Providers of social protection and livelihoods assistance (as identified by respondents)
5.6 Summary of findings on basic services and livelihoods assistance
The aim of this section is two-fold: 1) to describe households’ access to and satisfaction with services;
and 2) to explore through regression analyses which factors appear to influence access and
satisfaction.
Our survey recorded data on households’ access to a range of services and transfers – including health,
education, water and livelihood assistance – as well as levels of respondent satisfaction with the
services they use. Because the survey contained generic SLRC parts and covered a large range of
services, our survey could use only simple, blunt proxies for access: in the case of health, education and
water, we considered journey times to health centres and hospitals, primary schools and water sources;
for livelihood assistance, we considered whether households were receiving or had received any form of
support. Surveys that focus on only a single service are better able to build composite indexes that
allow a more precise and nuanced view of access in a specific context.
Notwithstanding these limitations, several findings stand out from the analysis.
First, less than half the respondents identify the government as the main actor responsible for the
provision of health and education services. Moreover, the government is not perceived to play any role
in the provision of water or of livelihood services such as seeds and tools, or food, material and
financial aid. In these sectors, the international and national NGOs play a far greater role. In practice,
what is defined here as social protection or livelihood support (e.g. food aid or cash transfers), delivered
as it is outside government systems, with no legislative or policy framework and with little regularity or
16 It should be noted that only 21 households in our sample received financial loans.
0% 20% 40% 60% 80% 100%
Financial loans
Material aid
Food aid
Seeds and tools
Government
National NGO
International NGO
Religious organisation
Community-based organisation
Family member
Friend
Neighbour
Other
% of respondents identifying provider

38
predictability (households often receive only a one-off transfer of some kind), is more akin to
humanitarian assistance than formal social protection or livelihoods support.
Second, there are some surprises in people’s access to services – as measured using simple proxies
such as journey times and receipt of a transfer. Most notably, while previously displaced and conflict-
affected households tend to be poorer and more food insecure, they generally appear to have better
access to basic services. This finding is in stark contrast with the findings of the SLRC survey in Uganda,
where displacement and conflict-affectedness result in poorer access to services (Mazurana et al.,
2014). One explanation for this could be that, in a context where local and international NGOs (along
with religious organisations) deliver so many of the basic services and so much of the livelihood
support, services are mostly targeted to areas where displaced people reside. Where service delivery
becomes bound up with humanitarian assistance, its location is likely to mirror the location of displaced
and conflict-affected people. Another hypothesis – namely that people tend to seek refuge in more
densely populated villages and towns as they feel more protected there and that access to services is
easier in these more urbanised places – is not borne out by the analysis.
In terms of gendered comparisons, another surprise is that (notwithstanding the comments above
about the challenges of identifying household headship) we do not find any statistically significant
differences in either access to or satisfaction with services between female- and male-headed
households. This is in contrast with livelihood indicators, where female-headed households
demonstrate, on average, worse outcomes.
Third, levels of satisfaction among respondents are relatively high across a range of services. Our data
show that, in the case of their hospital and primary school, respectively, only 22% and 30% of
respondents report being either ‘dissatisfied’ or ‘very dissatisfied’; 77% of respondents agree the
drinking water they access is clean and safe; and the majority of recipients of social protection and
livelihood assistance (such as seeds and tools and food aid) felt the assistance helped them improve
their agricultural productivity or subsistence.17 Given the disruption and volatility that have long
affected South Kivu, these reported levels of satisfaction might seem quite surprising. However, it could
plausibly be argued that satisfaction is relatively high not in spite of this situation but because of it.
People have lived through years of conflict and before that experienced over 30 years of negligence in
which the Mobutu-led government promoted a comportment of débrouillez-vous (‘make-for-
yourself/figure it out’). In this context, people may well have low expectations regarding service
provision, meaning any improvement in the situation is likely to be perceived strongly and positively.
Fourth, of all the features of service delivery that might affect use, the cost of accessing basic services
was clearly an issue for many respondents. When asked about specific aspects of health and
education services, reported levels of dissatisfaction were highest when respondents were asked about
the costs involved. For example, more than half of respondents reported being either ‘very dissatisfied’
or ‘dissatisfied’ with the cost of health centres – considerably higher than the proportions of
respondents reporting dissatisfaction with other aspects of the service, such as waiting times and
availability of medicine. We also find that respondents who have to pay informal fees to access health
care are less likely to be satisfied with the service. Similarly, of the seven different aspects of primary
schools asked about, costs had the highest levels of dissatisfaction.
Finally, while there are very few factors that appear to consistently influence people’s access to and
satisfaction with different services and forms of assistance, our regression analyses allows us to
17 Our (simple) proxy for satisfaction with water services is that respondents agree water is clean and safe. For social
protection and livelihood assistance, we used a proxy of whether recipients felt the transfer made a significant difference to
their lives.

39
tentatively identify three patterns. The first is the influence of conflict. Regression analyses show
households experiencing conflict in the past three years are more likely to face shorter journey times
to health centres, primary schools and water points, as well as to be more likely to receive social
protection and livelihood assistance. The story emerging from our descriptive statistics is consistent
with this. We need to beware of seeing this as a simple linear relationship: of course, conflict does not
itself result in better access to services (indeed the opposite is generally accepted to be true). More
likely, access to service outcomes are being influenced by the attempts by various agencies (in
particular local and international NGOs) to support people affected by conflict, and displaced people are
moving to larger villages where services are better. The second pattern relates to the relationship
between the way a service is implemented or run and an individual’s broader perception of the quality
of that service. We find, for example, that dissatisfaction with teacher quality, teacher numbers, class
sizes and school infrastructure are all strongly associated with lower overall levels of satisfaction with
primary schools, and that respondents having to queue for water, those who have to pay for water or
those whose water service is run by an NGO or water committee are less likely to agree their water is
clean and safe. This is important because it tells us the features of the service itself (rather than
another variable like the popularity of a local leader, or stories about the service in the media) are
influencing people’s perceptions. Third, when taken together with the findings from the livelihoods
section, there is some evidence to suggest households whose primary income source is agriculture
may be in a relatively vulnerable position compared with other livelihood groups in our sample
population. Such households are not only likely to own fewer assets, as we have already seen, but also
less likely to receive both social protection (food aid) and livelihood assistance (seeds and tools).

40
6 Civic participation and perceptions of
governance actors
‘L’état est moribond, mais pas mort’ (Trefon, 2004, in Vlassenroot and Raeymakers, 2008).
While DRC is described as a weak or a fragile state, with limited governance capacity and presence
outside of the capital Kinshasa (Vlassenroot et al., 2006), the current functioning of its state structures
and governance cannot be understood without acknowledging the country’s historical legacy. DRC’s
political situation is a result not only of the First and Second Congo Wars but also of economic
downturn, institutional deterioration and loss of national assets dating back to the first decades after
independence in 1960 (Weijs et al., 2012). The country’s history is described as one of ‘extractive
colonisation, continual human rights abuse, dictatorship and conflict – a history of governance for elites
and suffering for the people’ (DFID, 2007). After 2006, however, national and provincial governments
were elected, and national policies started emerging. The hallmark of the Constitution of the Third
Republic, adopted by referendum on 18 February 2006, was that it enshrined the decentralised
organisation of institutions (AfDB and ADF, 2009).
The 25 provinces are the political and administrative components of DRC’s territory and are recognised
as a legal entities managed by state authorities. Decentralisation, as laid down in the 2006
Constitution, has been partially realised; although provincial authorities are in place, local traditional
kings and chiefs still maintain dominant positions, especially in rural areas in the eastern provinces
(Weijs et al., 2012). The local elections that have been pending since 2010 are supposed to add an
additional layer of state governance below the province level: ‘territorial decentralised entities’ that
roughly overlap with the territoires. Electing state authorities to lead these structures might limit
customary powers.
Apart from the president and the national and provincial government, the administrative hierarchy of
political subdivisions in rural areas (territorial) is as follows: a district is led by a district commissioner,
and includes territoires (led by territory administrators) and chefferies (led by chiefs) (AfDB and ADF,
2009). The latter are divided into groupements and villages, led by local leaders.
In this section, we explore two different aspects of governance within our sample population: levels of
civic participation and perceptions of governance actors.
6.1 Civic participation
In order to investigate levels of civic participation, our survey looked at community meetings in relation
to health, education, water, security and other community issues (i.e. youth groups, farmers’ groups,
women’s groups). More specifically, respondents were asked if a community meeting in these sectors
had been held in the past 12 months and whether they had attended. Table 8 presents the numbers on
this.

41
Table 8: Community meetings and attendance
Service No. of respondents reporting a
community meeting on service had taken
place in past 12 months
No. of those respondents who had
attended meeting
Health 322 177
Education 774 603
Water 465 302
Security 455 345
Other 364 216
What these numbers indicate are relatively high levels of participation in community meetings about
various services if individuals are aware they are taking place. Specific participation rates are as
follows:
55% for community meetings about health;
78% for community meetings about education;
65% for community meetings about water;
76% for community meetings about security;
59% for community meetings about other service-related issues.
Our survey data suggest the main actor responsible for organising a community meeting is sector-
specific, but the village head was the most frequently mentioned. Table 9 presents, by sector, the actors
perceived to have organised meetings.
Table 9: Overview of actors responsible for organising meetings as reported by respondents (%)
Main topic Main actors responsible for organising meetings
Health Health committee
43%
NGO
17%
Head of village
14%
Health agent
12%
Education Director of school
75%
Prefect
15%
Parent committee
7%
Water Head of village
30%
Hygiene service
19%
Community group
15%
NGO
8%
Community issues Community group
35%
Head of village
26%
Local leader
13%
Security Head of village
26%
Other
12%
Local leader
10%
The survey also explored reasons for attending community meetings of this nature. As Figure 23 shows,
respondents’ main reason for participating was often simply because they were invited. Other reasons
include because they are members of a certain group; because they are interested; or because they
want to be informed. Around 20% reported participating because it was in the interests of their
community or household. Examples of these interests (which are not easy to identify using our survey
data) include the cost of school fees, which are set at parent meetings: parents are often keen to
influence this process by attending. It is important not to assume participation in community meetings
indicates a lively and active civil society but instead to recognise that, since the Mobutu era,
participation has been a critical way of getting support (e.g. food aid): attending meetings in the hope of
receiving support has become embedded in community life.
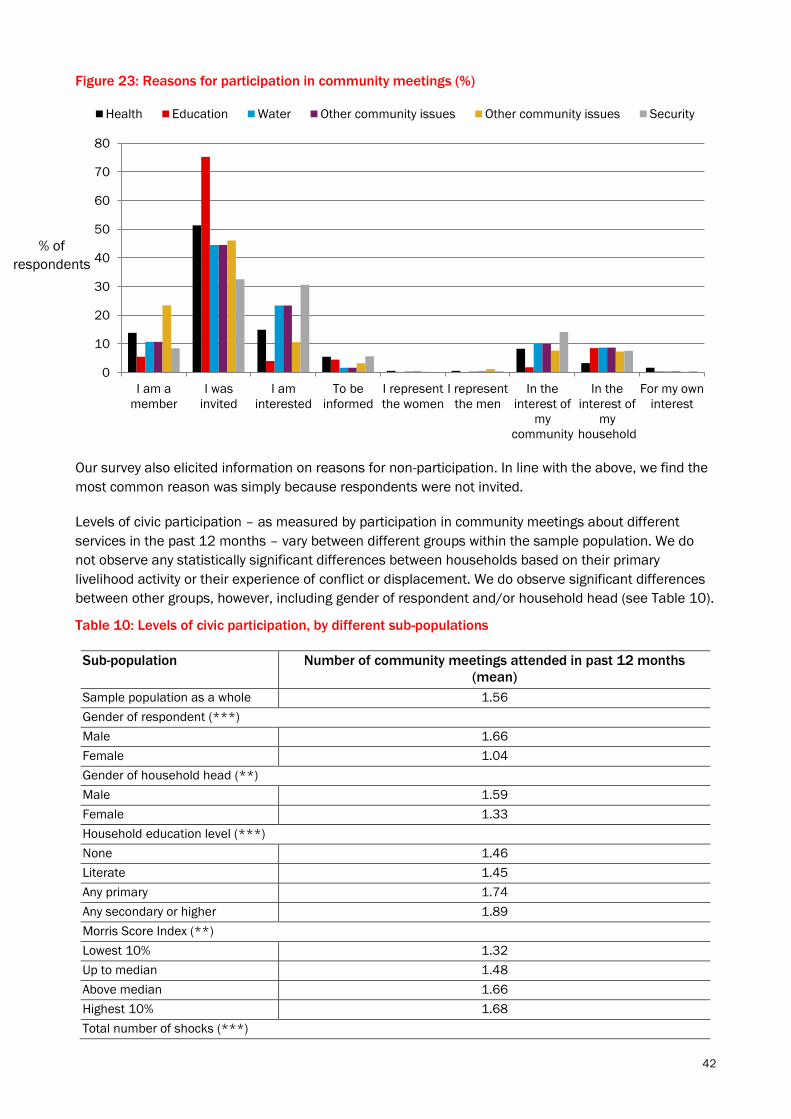
42
Figure 23: Reasons for participation in community meetings (%)
Our survey also elicited information on reasons for non-participation. In line with the above, we find the
most common reason was simply because respondents were not invited.
Levels of civic participation – as measured by participation in community meetings about different
services in the past 12 months – vary between different groups within the sample population. We do
not observe any statistically significant differences between households based on their primary
livelihood activity or their experience of conflict or displacement. We do observe significant differences
between other groups, however, including gender of respondent and/or household head (see Table 10).
Table 10: Levels of civic participation, by different sub-populations
Sub-population Number of community meetings attended in past 12 months
(mean)
Sample population as a whole 1.56
Gender of respondent (***)
Male 1.66
Female 1.04
Gender of household head (**)
Male 1.59
Female 1.33
Household education level (***)
None 1.46
Literate 1.45
Any primary 1.74
Any secondary or higher 1.89
Morris Score Index (**)
Lowest 10% 1.32
Up to median 1.48
Above median 1.66
Highest 10% 1.68
Total number of shocks (***)
0
10
20
30
40
50
60
70
80
I am a
member
I was
invited
I am
interested
To be
informed
I represent
the women
I represent
the men
In the
interest of
my
community
In the
interest of
my
household
For my own
interest
Health Education Water Other community issues Other community issues Security
% of
respondents
43
None 1.48
Fewer than five 1.44
Five or more 1.74
Note: Asterisks indicate whether the mean for each group is statistically different from the sampled population as a whole (*
significant at 10%; ** significant at 5%; *** significant at 1%).
From Table 10 it is clear that, on average, respondents from male-headed households attended more
community meetings than those from female-headed ones; respondents from more educated
households attended more community meetings than those from households with no education;
respondents from the wealthiest households attended more meetings than those from the least wealthy
households; and respondents from households experiencing more than five shocks in the past three
years attended more community meetings than those from households not experiencing any. It is also
clear that male respondents attended, on average, a higher number of meetings compared with female
respondents.
6.2 Perceptions of governance actors
In addition to exploring levels of civic participation, our survey also asked respondents about attitudes
towards different governance actors. More specifically, we asked a series of questions about the extent
to which respondents felt different actors acted in their interests, cared about their opinions, reflected
their priorities and contributed to making improvements in access to services. In terms of actors,
questions were asked about (in order of ‘proximity’ or ‘local-ness’) the head of the village, the head of
the groupement, the mwami (local king), formal local government, provincial government, national
government and the president. We group these seven governance actors into three groups of
governance actors:
Customary local governance (village head, head of groupement, mwami);
Formal local governance (formal local government agents and organisations);
State governance (provincial government, national government, president).18
Generally speaking, our survey data suggest those in the sample population have most trust and
confidence in customary local governance (mean=2.65), followed by formal local governance
(mean=2.02), and least in state-level governance (mean=1.80). The mean values indicate that,
generally speaking, levels of trust and confidence in all levels of governance are fairly low.19 The
relatively positive perceptions of the village head and mwami confirm Humphreys’ (2008) study findings
on governance in eastern Congo (including South Kivu), which found respondents saw decision-making
power in their communities to be largely in the hands of the village chief or traditional chiefs.
What is particularly striking about the data presented in Figure 24 is that governance actors who are
physically closest or more local to the respondents tend to be those who are granted most confidence
and trust: note, for example, the relatively high levels of trust in the head of the village and lack of trust
in the president. That said, it is also interesting to note that the figure is considerably ‘flatter’ in terms of
respondents’ perceptions of the different actors’ contributions to improving access to health, education
and transport (see Annex, Table 48). In line with the finding that these services are largely provided by
other non-state institutions, there does not appear to be much difference between the various actors in
relation to health, education and transport.
18 This grouping is based on theoretical considerations as well as results from a principal component analysis (and
subsequently a reliability analysis), which revealed three different components. 19 The scale chosen for the research was: 1=never, 2=almost never, 3=only in some areas, 4=to a large extent, 5=completely.

44
Figure 24: Perceptions of governance actors (median values)
To compare how perceptions vary between different sub-groups within our overall sample population,
we constructed combined scale perception variables based on respondents’ answers to the five
questions in Figure 24. Descriptive statistics show, on average, respondents from households that have
experienced conflict in the past three years think worse of all three levels of governance – customary
local, formal local and state – than respondents from households that have not (Table 11).
Table 11: Perceptions of governance actors, by past experience of conflict
Household experienced conflict in past three
years?
Customary local
(***)
Formal local
(***)
State
(**)
No 2.96 2.16 1.85
Yes 2.35 1.87 1.75
Sample as a whole 2.64 2.00 1.80
Note: Asterisks indicate whether the mean for each group is statistically different from the sampled population as a whole (*
significant at 10%; ** significant at 5%; *** significant at 1%).
While we also observe some statistically significant differences between other sub-populations, these
tend to be in relation to only one set of governance actors. For example, while respondents from
households experiencing more than five shocks in the past three years hold, on average, worse
perceptions of each level of governance compared with households not experiencing any, the only
difference proving statistically significant is in relation to formal local governance (Annex Table 16). That
said, when asked whether they feel the government cares about their opinion, the perceptions of
female respondents are on average significantly lower than those of male respondents for both formal
local and central government (see Table 12).
0.00
0.50
1.00
1.50
2.00
2.50
3.00
3.50
4.00
4.50
5.00
Confidence in actor Actors acts in your
interest
Actor cares about
your opinion
Actors decisions
reflect your priorities
Actors contributes to
improving access to
health, education
and transport
Head of village Head of groupment The Mwami Local government
Provincial government National government The president
Survey question asked to respondents
(Scale: 1= never - 5= completely)
Median value
of perceptions
of government
actors

45
Table 12: Perceptions of governance actors, by gender of the respondent
Sex of respondent Formal local government cares
about opinions (%)
Central government cares about opinions
(%)
Male 17.16*** 16.79***
Female 11.02*** 11.58***
Total 13.66 13.82
Note: Asterisks indicate whether the mean for each group is statistically different from the sampled population as a whole (*
significant at 10%; ** significant at 5%; *** significant at 1%).
In addition to this, we asked about people’s perceptions of the government particularly in relation to
provision of health and education services. Figure 25 shows the distribution of responses to two sets of
questions, the first around whether respondents think the government is doing everything it can to
improve either the school or the health clinic, the second around whether problems with the school or
health clinic reduce respondents’ trust in the government. The data show that, generally speaking,
respondents do not feel the government does everything it can to improve the quality of health services
and education. Although differences are very small, respondents are slightly less negative in relation to
health services as compared with education. Moreover, a slightly higher share of respondents feel
problems with education lead to a reduction in their confidence in the government as opposed to health
services.
Figure 25: Perceptions of government
responsiveness in relation to service provision (%)
Figure 26: Trust in government in relation to
service provision (%)
In order to examine what factors might be driving variations in respondents’ perceptions of governance
actors – including customary local actors, formal local actors and central state actors – we carried out a
series of Ordinary Least Square (OLS) regression analyses (see Tables 17 to 19 in the Annex).20
20 The dependent variable for each of the regressions was created by combining responses to four separate perception-based
questions, all of which were designed using the same underlying constructs.
0%
10%
20%
30%
40%
50%
60%
70%
80%
90%
100%
The government does
everything they can do
to improve the quality
of the health clinic
The government does
everything they can do
to improve the quality
of the school
Strongly agree Agree Neutral
Disagree Strongly disagree
Survey questions asked
% o
f re
sp
on
de
nts
0%
10%
20%
30%
40%
50%
60%
70%
80%
90%
100%
Problems with the
health clinic reduce
my trust/ confidence
in the government
Problems with the
school reduce my
trust/ confidence in
the government
Strongly agree Agree Neutral
Disagree Strongly disagree
Survey questions asked
% o
f re
sp
on
de
nts

46
A number of variables appear important in explaining variation. First, we find the higher a household’s
level of food insecurity, the more positive a respondent was likely to feel about both customary local
and formal local actors (at 5% and 1% significance, respectively). We are not sure why this is the case,
but there are two possible explanations. It may be related to action taken by such governance actors in
response to food insecurity, although the receipt of livelihood assistance is not found to be statistically
significant in any of the regressions. It may also be linked to lower education levels of food-insecure
households – we see across all the regressions that more highly educated respondents have worse
perceptions (though it is mostly insignificant).
Second, we find satisfaction with certain services or certain aspects of services is associated with more
positive perceptions of governance actors. For example, the more satisfied a respondent was with the
availability of medicine at the health clinic, the more positively they were likely to feel about customary
local, formal local and central state actors (at 5%, 5% and 10% significance, respectively). In separate
regressions including education variables, we find respondents reporting satisfaction with schools were
more likely to feel positively about customary local and formal local actors (at 5% and 5% significance,
respectively), and, while we do not find a similar relationship vis-à-vis central state actors, we do find
that respondents reporting satisfaction with the quality of school equipment were more likely to feel
positively about actors at this level (at 10% significance) (see Tables 20-22 in the Annex). However, it
should be noted that positive and statistically significant associations are not found between
perceptions of governance actors and levels of satisfaction with all services, suggesting a more
nuanced relationship than is sometimes assumed. A similar story emerges when we consider the role of
official fees: although having to pay fees for water is associated with more positive perceptions of
customary local and central state actors, having to pay official fees for schooling is associated with
more negative views of local customary actors (but more positive views of central state actors) (see
Tables 17-22 in the Annex).
Third, there is some evidence that respondents experiencing insecurity hold worse perceptions of
governance actors – but only in some respects. For example, respondents from households that had
experienced conflict in the past three years or been displaced at some point were more likely to hold
negative perceptions of customary local actors (at 5% and 10% significance, respectively). We also find
the greater the number of crimes experienced in the past three years, the worse a respondent’s
perception of formal local actors was likely to be (at 10%). On the other hand, number of shocks is at
the same time associated with more positive perceptions of formal local actors (at 5%). Further,
respondents who reported feeling safe when travelling were less likely to hold positive perceptions of
local customary and formal actors (at 10% and 10% significance, respectively). Thus, while there is
some evidence that experiences of insecurity are associated with worse perceptions of governance
actors, it is not clear the effect is consistent or linear.
As part of the broader SLRC study, we are also particularly interested in the relationship between
people’s experiences with service delivery and their perceptions of governance. In order to explore
whether any kind of pattern emerges, we ran a series of cross-tabulations to show how perceptions of
local/central government vary depending on respondents’ satisfaction with various services. We find
several statistically significant differences. For example, we find that, among those that were
dissatisfied with primary schools, only 11% agree with the statement that local government cares about
their opinions. On the other hand, 18% of those reporting satisfaction with schools agree with the same
statement. The differences are statistically significant at 5% (see Figure 27). We find a similar story if
we tabulate perceptions with satisfaction with various aspects of both education and health services
(see Annex Table 23 and 24).

47
Figure 27: Perceptions of local government, by satisfaction with primary schools (%)
Note: Differences between groups are statistically significant at 5%.
Thus, when compared with those who are dissatisfied, a higher proportion of respondents who are
satisfied with many aspects of services agree both local and central government care about their
opinions.
6.3 Summary of findings on civic participation and perceptions of governance actors
Based on interpretation of the descriptive statistics and regression results, we can identify four key
findings in relation to levels of civic participation and perceptions of governance within our sample
population.
First, levels of civic participation – proxied by participation in community meetings about services over
the past 12 months – are quite high. On average, respondents from male-headed, wealthy, well-
educated households and households experiencing more than five shocks in the past three years
attend community meetings most often. We find the majority of respondents attended such meetings if
they were aware of them taking place and if they were invited. Participation rates (i.e., the proportion of
respondents who attended a meeting if they knew about it) are 55% for community meetings about
health; 78% for community meetings about education; 65% for community meetings about water; 76%
for community meetings about security; and 59% for community meetings about other service-related
issues.
Second, while respondents’ perceptions of customary local, formal local and state governance actors
are generally fairly negative, we find that – broadly speaking – the less ‘local’ the actor, the worse the
perception. On average, respondents have more confidence in, say, the head of their village or mwami
than they do in the national government or the president. This pattern is consistent across a range of
perception-based questions.
Third, respondents from households that have experienced conflict in the past three years have, on
average, lower levels of trust and confidence in governance actors at all scales, including local
customary actors, local formal actors and central state actors. In addition, according to results from
multinomial regression analysis, respondents from such households as well as those from households
that have experienced a greater number of crimes in the past three years are less likely to agree local
government decisions reflect their priorities.
11
14
18
0
5
10
15
20
25
Dissatisfied Neutral Satisfied
Level of overall satisfaction with primary school
% of respondents
agreeing with the
statement that local
government cares
about their opinion

48
Fourth, our regression results suggest respondents from more food-insecure households are likely to
hold more positive perceptions of local governance actors. More research is needed to unpack this
association. There is also some evidence to suggest greater levels of satisfaction with certain services,
or with certain aspects of services, is associated with more positive perceptions of governance actors.
For example, respondents reporting greater satisfaction with the availability of medicine at health clinics
were also more likely to perceive actors at the customary local, formal local and central state levels
positively. A similar story emerges when we look at satisfaction with schools. Broadly speaking, these
results are supported by descriptive statistics, which suggest respondents who are satisfied with
services of various kinds are, on average, more positive in their perceptions of government than the
sample population as a whole. Finally, experiences of insecurity are sometimes found to be associated
with worse perceptions of governance actors, although the overall picture on this is mixed: for example,
respondents experiencing a greater number of crimes were less likely to feel positively about local
formal actors, while respondents experiencing a greater number of shocks were more likely to feel
positively about local formal actors.

49
7 Conclusions
In 2012, SLRC implemented the first round of an original cross-country panel survey in the conflict-
affected province of South Kivu in eastern DRC. The survey was designed to produce information on:
People’s livelihoods (income-generating activities, asset portfolios, food security,
constraining and enabling factors within the broader institutional and geographical context);
Their access to basic services (education, health, water), social protection and livelihood
services;
Their relationships with governance processes and practices (participation in public
meetings, perceptions of major political actors).
This paper has reported on the baseline findings emerging from statistical analysis of the South Kivu
first-round data. We now provide a recap of those findings. For reasons of ease and accessibility, we
split this section into five: the first sub-section provides some basic detail on the sample; the second to
fourth revisit key findings on livelihoods, basic services and governance, respectively; and the fifth
identifies research priorities to take forwards.
7.1 The survey sample
Between September and November 2012, we surveyed a sample population of 1,259 households from
9 villages across South Kivu. This sample, based on a combination of purposive and random sampling,
was designed to capture variation in livelihood activities and ethnicity, to achieve representativeness at
the village level and statistical significance at the territoire, chefferie and groupement level and to
account for possible attrition between now and 2015 when the same households will be re-interviewed.
Within our sample population, the mean household size was 6.7 persons per household, and
households contained a mean of 4.05 persons below 18 years; 34% of respondents had not received
any education. In terms of ethnicity, the majority of households were identified as Shi (69%), followed by
Tembo (24%) and Kilega (5%). A little under one-fifth of households in the sample population (18%) had
been internally displaced owing to conflict at some point, yet more than half of households in the
sample population (53%) reported experiencing conflict in the previous three years. In terms of the
kinds of shocks experienced in the previous three years, the most frequently experienced were daily
stresses, followed by natural hazards and finally crimes. A closer look at the data suggests conflict is
just one of the many risks facing households in our South Kivu sample population.
7.2 Livelihood status
Our survey asked respondents about their household’s primary livelihood activities and measured both
asset ownership (using the Morris Score Index) and levels of food insecurity (using the Coping
Strategies Index). Three key findings emerge from the analysis.
First, although levels of wealth – as measured by asset ownership – can be considered relatively low
across the sample as a whole, there are important variations between different sub-populations within
the sample. We see that female-headed households, less educated households, displaced households
and households that have experienced conflict in the past three years are, on average, considerably
worse off than their relative counterparts. A very similar story emerges when we consider levels of food
security.
Second, regression analyses identify very few factors that appear to influence both food security and
asset ownership within our sample population. In fact, we find no variables that are consistently
associated with better food security and asset ownership outcomes. We do, however, find two variables
that are consistently associated with worse outcomes: experiencing conflict in the past three years

50
and being displaced at some point. In addition, while not significantly associated with asset ownership
outcomes, households that have experienced a greater number of either shocks or crimes in the past
three years are also likely to be more food insecure.
Third, if we look only at asset ownership, we see an expected series of factors are found to be
statistically significant: more educated households, for example, are likely to be wealthier, but female-
headed households and Tembo or Kilega households are likely to be less well off. We also find
households that have agriculture as a primary income source are more likely to be less wealthy,
perhaps because of the small size of landholdings for most households.
7.3 Basic services and livelihood assistance
Our survey explored households’ access to a range of services and transfers – including health,
education, water and livelihood assistance – as well as levels of respondent satisfaction with the
services they use. Simple measures of access were used: in the cases of health, education and water
services, we considered return journey times to health centres and hospitals, primary schools and water
sources; for livelihood assistance we considered whether households were receiving any form of
support. Five findings stand out from the descriptive statistics and regression analyses.
First, access to services – as measured by journey times and receipt of a transfer – is not
homogeneous across the sample. We find several statistically significant differences in access between
different sub-groups. In particular, it seems households that have been displaced at some point tend to
have considerably better access to health centres, water sources and primary schools compared with
non-displaced households. The same goes for households that have experienced conflict in the past
three years compared with those that have not. Thus, while previously displaced and conflict-affected
households tend to be poorer (in terms of asset ownership) and more food insecure, at the same time
they generally appear to live closer to basic services. Specifically in terms of gendered comparisons, it is
worth pointing out we do not find any statistically significant differences in both access to and
satisfaction with services between female- and male-headed households. This is in contrast with
livelihood indicators, where female-headed households demonstrate, on average, worse outcomes.
Second, levels of satisfaction among respondents are relatively strong across a range of services. Our
data show 77% of respondents agree the drinking water they access is clean and safe; only 22% and
30% of respondents report being either ‘dissatisfied’ or ‘very dissatisfied’ with their hospital and primary
school, respectively; and the majority of recipients of livelihood assistance (such as seeds and tools and
food aid) felt the assistance helped them improve their agricultural productivity/subsistence.
Third, the cost of accessing basic services is clearly an issue for many respondents. When asked about
specific aspects of health and education services, reported levels of dissatisfaction were highest when
respondents were asked about the costs involved. For example, more than 50% of respondents
reported being either ‘very dissatisfied’ or ‘dissatisfied’ with the cost of health centres – considerably
higher than the proportions of respondents reporting dissatisfaction with other aspects of the service,
such as waiting times and availability of medicine. We also find respondents who have to pay informal
fees to access health care are less likely to be satisfied with the service.
Fourth, while there are very few factors that appear to consistently influence people’s access to and
satisfaction with different services and forms of assistance, we can tentatively identify three patterns.
The first is the influence of conflict: regression analyses show households experiencing conflict in the
past three years are more likely to face shorter journey times to health centres, primary schools and
water points, as well as to be more likely to receive social protection and livelihood assistance. The
second relates to the relationship between the way a service is implemented or run and an individual’s
broader perception of the quality of that service. We find, for example, that dissatisfaction with teacher

51
quality, teacher numbers, class sizes and school infrastructure are all strongly associated with lower
overall levels of satisfaction with primary schools, and respondents having to queue for water, those
having to pay for water and those whose water service is run by an NGO or water committee are less
likely to agree their water is clean and safe. Third, when taken together with the findings from the
livelihoods section, there is some evidence to suggest households whose primary income source is
agriculture may be in a relatively vulnerable position compared with other livelihood groups in our
sample population. Such households are not only likely to own fewer assets, but also less likely to
receive social protection and livelihoods assistance.
Fifth, less than half of respondents identify the government as the main actor responsible for the
provision of health and educational services. Moreover, the government is not perceived to play any role
in the provision of water or in the provision of livelihood support services such as seeds and tools or
food, material and financial aid. In these sectors, international and national NGOs are seen to play a far
greater (or at least a far more visible) role.
7.4 Civic participation and perceptions of governance
Our survey used perception-based questions to explore respondents’ attitudes towards different
governance actors and experience-based questions to measure levels of civic participation. We identify
four key findings in this area.
First, levels of civic participation – proxied by participation in community meetings about services over
the past 12 months – are quite high. We find the majority of respondents attended such meetings if
they were aware of them taking place and were invited, although we should avoid assuming that
attendance implies a lively and active civil society or social contract of some kind.
Second, while respondents’ perceptions of all governance actors are generally fairly negative, we find
that – broadly speaking – the less ‘local’ the actor, the worse the perception. On average, respondents
have more confidence in, say, their head of village or mwami than they do in the national government or
the president. This pattern is consistent across a range of perception-based questions.
Third, respondents from households that have experienced conflict in the past three years have, on
average, lower levels of trust and confidence in governance actors at all scales, including local
customary actors, local formal actors and central state actors. In addition, according to results from
multinomial regression analysis, respondents from such households as well as those from households
that have experienced a greater number of crimes in the past three years are less likely to agree local
government decisions reflect their priorities.
Fourth, our regression results suggest respondents from more food-insecure households are likely to
hold more positive perceptions of local governance actors – possibly because of lower education
levels. There is also some evidence to suggest greater levels of satisfaction with certain services, or
with certain aspects of services, are associated with more positive perceptions of governance actors.
For example, respondents reporting greater satisfaction with the availability of medicine at health clinics
were also more likely to perceive actors at the customary local, formal local and central state levels
positively. A similar story emerges when we look at satisfaction with schools. Broadly speaking, these
results are supported by descriptive statistics, which suggest respondents who are satisfied with
services of various kinds are, on average, more positive in their perceptions of government than the
sample population as a whole. We find few noteworthy gender differences. Finally, experiences of
insecurity are sometimes found to be associated with worse perceptions of governance actors,
although the overall picture on this is mixed.

52
7.5 Priorities and recommendations for future research
Based on the findings of this study, a number of recommendations and suggestions for further study
can be developed.
First, future research should explore the relative impact of the different shocks, how
households in South Kivu experience and deal with the full spectrum of present and future
risks and how they set priorities as they live in these ‘multi-risk’ environments.
Second, our data suggest some basic (Western) assumptions should be revised critically and
not taken for granted. In particular, the assumed relationship between service delivery and
perceptions of legitimacy seems not to be as linear, consistent and straightforward as some
suggest. As our findings indicate, perceptions of the legitimacy of governance actors may be
influenced more strongly by other factors in South Kivu.
Third, further study of the concept and influence of civic participation in South Kivu is
recommended. Relatively high levels of participation were identified, and we identified some
associations between participation in community meetings and service satisfaction or
governance outcomes. Additional in-depth research on the topic – particularly in relation to
the experience and meaning of participating in such meetings – could bring insights into the
reasons for this.
The study can be concluded by emphasising that, although increased insights have been gained on
relationships between delivering services and state–society relations in South Kivu, the period between
the two surveys should be used for further in-depth qualitative research to better understand the
mechanisms and dynamics linking these different variables.

53
Bibliography
AfDB (African Development Bank) and ADF (African Development Fund) (2009) 'Democratic Republic of
Congo. Economic and Sector Work. Regional Economic Development in Bas Congo in the Context of
Decentralization in the Democratic Republic of Congo (DRC)'. Tunis: AfDB and ADF.
Bailey, S., Pereznieto, P. and Jones, N. (2011) 'Child-sensitive Social Protection in DRC: Diagnostic
Study'. London: ODI.
Berg, L.D. and Longhurst, R. (2003) 'Placing Masculinities and Geography'. Gender, Place and Culture
10(4): 351-360.
Carpenter, S., Slater, R. and Mallett, R. (2012) 'Social Protection and Basic Services in Conflict-affected
Situations: What Do We Know?' London: ODI.
de Herdt and Poncelet, (2010) Enjeux et acteurs autour de la réduction des frais scolaires en RDC:
Rapport final, Antwerp: IOB.
DFID (Department for International Development) (2007) 'Country Governance Analysis for Democratic
Republic of Congo'. London: DFID.
Douma, N. and Hilhorst, D. (2012) 'Fond de Commerce? Sexual Violence Assistance in the Democratic
Republic of Congo'. Wageningen: Wageningen University.
European Report on Development (2009) Overcoming fragility in Africa: Forging a new European
approach. San Domenico di Fiesole: Robert Schuman Centre for Advanced Studies.
Ferf, A., Hilhorst, D. and Mashanda, M. (2014) 'Rural Road (Re)construction: Transport and Rural
Livelihoods in the Conflict-Affected and Fragile State Environment of South Kivu'. SLRC Report 2.
London and Wageningen: ODI and Wageningen University.
Gouzou, J., Eriksson-Baaz, M. and Olsson, A.M. (2009) 'The Democratic Republic of Congo (DRC).
Country Gender Profile'. Stockholm: Sida.
Harkness, J.A., van de Vijver, F. and Mohler, P. (2003) Cross-cultural Survey Methods. Hoboke, NJ:
Wiley-Interscience.
Humphreys, M. (2008) 'Community-Driven Reconstruction in the Democratic Republic of Congo'. New
York: Columbia University.
Humphreys, M., Sanchez de la Sierra, R. and van de Windt, P. (2012) 'Social and Economic Impacts of
Tuungane. Final Report on the Effects of a Community Driven Reconstruction Program in Eastern
Democratic Republic of Congo'. New York: Columbia University.
Lwambo, D. (2011) '“Before the War I was a Man”: Men and Masculinities in the Eastern DR Congo'.
Goma: HEAL Africa.
Mallett, R., Hagen-Zanker, J., Slater, R. and Sturge., G (2015)’Surveying livelihoods, service delivery and
governance: baseline evidence from DRC, Nepal, Pakistan, Sri Lanka and Uganda’. London: SLRC
Mallett, R. and Slater, R. (2012) 'Growth and Livelihoods in Fragile and Conflict-Affected Situations'.
London: SLRC.
Mazurana, D., Marshak, A., Opio, J., Gordon, R. and Atim, T. (2014) 'Surveying Livelihoods, Service
Delivery and Governance: Baseline Evidence from Uganda'. London: SLRC.

54
Ministère du Plan (2011) 'Document de Stratégie de Croissance et de Réduction de la Pauvreté
(DSCRP) 2'. Draft 3. Kinshasa: Ministère du Plan.
OECD (Organisation for Economic Cooperation and Development) (2010) The state’s legitimacy in
fragile situations: unpacking complexity. Paris: OECD
Pingali, P., Alinovi, L. and Sutton, J. (2005) 'Food Security in Complex Emergencies: Enhancing Food
System Resilience'. Disasters 29(s1): S5-S24.
Sarantakos, S. (2005) Social Research. 3rd Ed. New York: Palgrave MacMillan.
Seay, L. (2013) 'Effective Responses: Protestants, Catholics and the Provision of Health Care in the
Post-war Kivus'. Review of African Political Economy 40(135): 83-97.
SLRC (2015) ‘The first round of the SLRC Panel Survey: The Process Paper’. London: SLRC.
Soeters, R. and Kimanuka, C. (2011) 'Résultats de l’Enquête Ménage, l’Enquête Qualité, et l’Enquête
Infirmiers Titulaires, Sud Kivu, DR Congo: République Démocratique du Congo'. Kinshasa: Inspection
Provincial, AAP Sud Kivu and Cordaid.
Stel, N., de Boer, D. and Hilhorst, D. (2011) 'Multi-Stakeholder Processes, Service Delivery and State
Institutions. Service Provision and the Legitimacy of State Institutions in Situations of Conflict and
Fragility. Experiences from Burundi, DR Congo, Nepal and the Palestinian Territories'. Clingendael:
Peace, Security and Development Network.
UNDP (UN Development Programme) (2009) 'Profil Resume Pauvrete de Sud Kivu 2009'. Kinshasa:
UNDP.
Vlassenroot, K. and Raeymaekers, T. (2008) 'New Political Order in the DR Congo? The Transformation
of Regulation'. Afrika Focus 21(2): 39-52.
Vlassenroot, K., Ntububa, S. and Raeymaekers, T. (2006) 'Food Security Responses to Protracted Crisis
Context of the Democratic Republic of the Congo'. Ghent: FAO.
Waldman, R. (2006) 'Health in Fragile States, Country Case Study: Democratic Republic of Congo'.
Arlington, VA: Basic Support for Institutionalizing Child Survival.
Weijs, B., Hilhorst, D. and Ferf, A. (2012) 'Livelihoods, Basic Services and Social Protection in the
Democratic Republic of the Congo - Country Evidence Paper'. London: SLRC.
World Bank (2005) 'Health Nutrition and Population Country Status Report, DRC'. Kinshasa: World Bank
and Ministry of Health.