survival of airborne ms2 bacteriophage ge nerated from...
TRANSCRIPT

1
1 Survival of Airborne MS2 Bacteriophage Generated from Human Saliva, Artificial 2
Saliva, and Cell Culture Medium 3
4
Zhili Zuo1#, Thomas H. Kuehn1, Aschalew Z Bekele2, Sunil K. Mor2, Harsha Verma2, 5
Sagar M. Goyal2, Peter C. Raynor3, and David Y. H. Pui1 6
7
1Department of Mechanical Engineering, College of Science and Engineering, University of 8
Minnesota, 111 Church Street SE, Minneapolis, MN 55455, USA 9
2Department of Veterinary Population Medicine, College of Veterinary Medicine, University of 10
Minnesota, 1333 Gortner Avenue, Saint Paul, MN 55108, USA 11
3Division of Environmental Health Sciences, School of Public Health, University of Minnesota, 12
1260 Mayo, 420 Delaware Street SE, Minneapolis, MN55455, USA 13
14
#Corresponding author: Department of Mechanical Engineering, College of Science and 15
Engineering, University of Minnesota, 111 Church Street SE, Minneapolis, MN 55455, USA; 16
Tel: +1-612-625-1510; E-mail: [email protected] 17
Running title: Virus survival in saliva aerosol 18
19
AEM Accepts, published online ahead of print on 21 February 2014Appl. Environ. Microbiol. doi:10.1128/AEM.00056-14Copyright © 2014, American Society for Microbiology. All Rights Reserved.
on July 13, 2018 by guesthttp://aem
.asm.org/
Dow
nloaded from

2
ABSTRACT 20
Laboratory studies of virus aerosols have been criticized for generating airborne viruses from 21
artificial nebulizer suspensions (e.g. cell culture media), which do not mimic the natural release 22
of viruses (e.g. from human saliva). The objectives of this study were to determine the effect of 23
human saliva on the infectivity and survival of airborne virus and to compare it with artificial 24
saliva and cell culture medium. Stock of MS2 bacteriophage was diluted in one of three 25
nebulizer suspensions, aerosolized, size-selected (100-450 nm) using a differential mobility 26
analyzer, and collected onto gelatin filters. Uranine was used as a particle tracer. The resulting 27
particle size distribution was measured using a scanning mobility particle sizer. The amounts of 28
infectious virus, total virus, and fluorescence in the collected samples were determined by 29
infectivity assays, quantitative RT-PCR, and spectrofluorometry, respectively. For all nebulizer 30
suspensions, the virus content generally followed a particle volume distribution rather than a 31
number distribution. The survival of airborne MS2 was independent of particle size but was 32
strongly affected by the type of nebulizer suspension. Human saliva was found to be much less 33
protective than cell culture medium (i.e. 3% tryptic soy broth) and artificial saliva. These results 34
indicate the need for caution when extrapolating laboratory results, which often use artificial 35
nebulizer suspensions. To better assess the risk of airborne transmission of viral diseases in real 36
life situations, the use of natural suspensions such as saliva or respiratory mucus is 37
recommended.38
on July 13, 2018 by guesthttp://aem
.asm.org/
Dow
nloaded from

3
INTRODUCTION 39
The potential involvement of virus aerosols in the transmission of human respiratory diseases, 40
although still under considerable debate, has led to increased public concern. Several studies 41
have found that a variety of respiratory viruses including influenza virus and severe acute 42
respiratory syndrome (SARS) coronavirus could be present at high concentrations in human 43
saliva and respiratory mucus (1-3). When infected individuals cough, sneeze, speak, or simply 44
breathe, particles of saliva and/or respiratory mucus that carry viruses can be easily generated (4, 45
5), resulting in an increased risk of viral infection by aerosols. 46
In an effort to understand and control transmission of viral diseases via aerosols, researchers 47
have generated airborne viruses in laboratories to study their infectivity and survival (i.e. the 48
ability to remain infectious) since the 1930s. Laboratory-generated virus aerosols are commonly 49
produced from liquid suspensions using pneumatic nebulizers such as Collison nebulizers, as the 50
wet dispersion technique simulates many dispersion processes of viruses in the natural 51
environment (6). However, the composition of liquid suspensions from which virus aerosols are 52
generated (also known as nebulizer suspensions) is known to affect the infectivity/survival of 53
airborne viruses (7, 8). Given that many laboratory studies use artificial nebulizer suspensions 54
(e.g. cell culture media) that do not mimic natural release of virus aerosols from body secretions 55
(e.g. human saliva), it has been suggested that survival of airborne viruses determined in 56
laboratories may not represent real life situations (9). 57
To better simulate the generation of virus aerosols from human saliva, several researchers have 58
developed a recipe for making artificial saliva and have used it as a nebulizer suspension (10-13). 59
The same artificial saliva was later adopted by ASTM to evaluate decontamination efficacy of 60
air-permeable materials and surfaces challenged with bioaerosols (14, 15). MS2 bacteriophage 61
on July 13, 2018 by guesthttp://aem
.asm.org/
Dow
nloaded from
4
aerosolized from artificial saliva has been found to survive better than that from DI water, but no 62
better than that from 0.25% tryptone solution or 0.3% beef extract (10, 13), suggesting that 63
indeed artificial saliva may affect the survival of airborne viruses differently from other 64
commonly used artificial nebulizer suspensions. However, it remains unclear how closely 65
artificial saliva could represent human saliva in terms of preserving airborne virus infectivity. 66
The literature on the effect of human saliva on airborne viruses and comparison with other 67
nebulizer suspensions is limited. In one study (16), survival of airborne bacteriophage T3 from 68
saliva and 0.1% peptone was found to be similar at relative humidity (RH) ranging from 20% to 69
80%, but lower than that from 0.1 M NaCl at low to mid RH. At high RH, highest survival was 70
observed using saliva, followed by peptone and salt. In another study (17), saliva was found to 71
offer less protection to airborne encephalomyocarditis virus than Hanks balanced salt solution 72
over a wide range of RH and the virus decay in saliva was even larger than in water below 40% 73
RH. These results indicate that saliva may not necessarily be more effective in maintaining 74
airborne virus infectivity than artificial nebulizer suspensions, depending on RH. However, in 75
both studies, spray guns were used to produce micrometer-sized particles and the virus aerosols 76
were collected by liquid impingers. One limitation of liquid impingers is that they can only 77
provide particle size-integrated results. As demonstrated previously, particle size can 78
significantly affect survival of airborne viruses (18) as well as their removal by filtration (19). 79
Therefore, it would be interesting to explore how human saliva affects virus in aerosols as a 80
function of particle size. In addition, liquid impingers are inefficient in collecting 81
submicrometer-sized particles (20). Consequently, the reported infectivity and survival results 82
mainly represent those of micrometer-sized particles. What happens to virus aerosol particles of 83
<0.5 µm, the size of most respiratory particles (21, 22), remains unclear. 84
on July 13, 2018 by guesthttp://aem
.asm.org/
Dow
nloaded from
5
The objective of this study was to determine how human saliva could affect the infectivity and 85
survival of airborne MS2 bacteriophage in the submicrometer size range and to compare the use 86
of human saliva with artificial saliva and cell culture medium. Due to its non-pathogenicity and 87
ease of propagation, MS2 is one of the most popular surrogates for human-pathogenic viruses 88
and has been extensively used in various virus aerosol studies including investigation of aerosol 89
generation techniques (23), sampler evaluation (20, 24), virus survival (10, 18), virus 90
inactivation (12, 25), and virus filtration (26). For these reasons, MS2 was selected in this study. 91
92
MATERIALS AND METHODS 93
Virus stock. MS2 bacteriophage is a small (27 nm), tailless, non-enveloped, single-stranded 94
RNA coliphage. MS2 bacteriophage (ATCC 15597-B1) was propagated and titrated using E. coli 95
famp (ATCC 700891) as host cells. Briefly, 1 mL of virus stock was mixed with 100 mL of log-96
phase E. coli grown in 3% (w/v) tryptic soy broth (TSB). After incubation at 37oC for 20 hours 97
with shaking at 60 RPM, the culture was centrifuged at 6000 × g for 15 minutes and the 98
supernatant was filtered through a 0.45 µm cellulose acetate filter (Vanguard International, 99
Neptune, NJ). The resulting virus stock was aliquoted in 2 mL vials and stored at -80oC until 100
used. 101
Nebulizer suspensions. Three types of nebulizer suspensions were evaluated, including 102
human saliva (HS), artificial saliva (AS), and artificial saliva with no mucin (ASNM). ASNM 103
was tested to further evaluate the effect of mucin on the survival of airborne MS2. (i) Whole 104
human saliva was collected from a subject under unstimulated conditions, at least two hours after 105
eating and drinking, using the spitting method (27). The subject first rinsed the mouth thoroughly 106
using DI water and sat upright with the head slightly tilted forward and the eyes open. Saliva was 107
on July 13, 2018 by guesthttp://aem
.asm.org/
Dow
nloaded from

6
then allowed to accumulate in the mouth and the subject spitted it out every 1 min into a 50 mL 108
tube until ~45 mL of saliva was collected. The collected saliva was treated with 455 μg/mL 109
streptomycin and 1.5μg/mL fungizone to inhibit microbial growth. Since the composition of 110
saliva varies on a daily basis (28) and is also affected by freezing and thawing (e.g. formation of 111
white precipitates) (29), saliva collected on different days was pooled together, well mixed, 112
aliquoted into 50 mL tubes, and stored at 4oC until used (within seven days of collection). (ii) 113
Artificial saliva was prepared using the same recipe as described elsewhere (11). It consisted of 114
~0.3% various salts and 0.3% mucin from porcine stomach (M1778, Sigma Chemical Co., St. 115
Louis, MO) to simulate the electrolytes and mucus in human saliva (HS), respectively. Mucin-116
free artificial saliva was prepared using the salts only. On each day of testing, 4.5 mL of thawed 117
MS2 stock was diluted in 40.5 mL of one the three nebulizer suspensions supplemented with 2 118
mL of uranine (0.625 g/mL, Fluka, Buchs, Swizerland) and 0.1 mL of antifoam Y-204 (Sigma). 119
Uranine was used as a fluorescent particle tracer (18, 24, 30), which allowed the quantitation of 120
particle transport loss in the test system. The titer of freshly prepared nebulizer suspensions 121
ranged from 2×10⁸ to 6×10⁸ PFU/mL. 122
Experimental setup and test procedure. The experimental setup schematically shown in 123
Figure 1 has been described elsewhere (18). The main element is a one-pass vertical aerosol test 124
tunnel, which has been used in different virus aerosol studies (18, 19, 24, 31, 32). Before each 125
experiment, the tunnel was first purged using HEPA-filtered air at 92 L/min for 15 min to 126
remove any residual particles. MS2 bacteriophage was then aerosolized from one of the 127
nebulizer suspensions using a six-jet Collison nebulizer (Model CN25, BGI Inc., Waltham, MA) 128
operated at 10 psig. The generated MS2 aerosol was mixed and diluted with humidity-controlled 129
and HEPA-filtered room air, entering the tunnel at a flow rate of 92 L/min. The virus aerosol was 130
on July 13, 2018 by guesthttp://aem
.asm.org/
Dow
nloaded from

7
sampled by a scanning mobility particle sizer (SMPS, Model 3034, TSI, Inc., Shoreview, MN) at 131
1 L/min to measure the particle number distribution from 10 nm to 470 nm. Meanwhile, the 132
aerosol was charge-equilibrated to the Boltzmann distribution using a polonium-210 neutralizer. 133
Particles with size of 100, 200, 300, 400, and 450 nm were selected by a differential mobility 134
analyzer (DMA, Model 3071, TSI), one size at a time. The size-classified virus aerosol particles 135
were then collected by a 25 mm diameter gelatin filter (SKC, Inc., Eighty Four, PA) held in a 136
stainless steel holder (Millipore Corp., Bedford, MA) at 1.0 L/min for 15 min. Gelatin filters 137
have very high collection efficiency for MS2 aerosol (33). The sampling time was limited to 15 138
min in order to minimize desiccation, which adversely affects the infectivity of the collected 139
virus. Immediately after sampling, the gelatin filter was broken apart using a sterile forceps and 140
dissolved in 1 mL of 1.5% beef extract-0.05 M glycine solution (pH 7.2), followed by vortexing 141
(American Scientific Products, McGaw Park, IL) at maximum speed for ~10 sec, six times at 1 142
min intervals. Any unsampled virus aerosol was removed by a HEPA filter located at the outlet 143
of the tunnel. 144
The experiments were performed at RH of 45±5% and temperature of 22-24oC with three 145
replicates for each nebulizer suspension. All equipment including nebulizer, filter holders, and 146
forceps were sterilized prior to testing. The entire setup was enclosed by secondary containment 147
with exhaust ventilation to prevent the release of aerosols into the surrounding environment. 148
Sample analysis. Before and after each experiment, a 1 mL sample of nebulizer suspension 149
was collected. Each nebulizer suspension sample and gelatin filter sample was split into three 150
portions. The first portion was diluted in 0.01 mol/L NaOH and the concentration of fluorescence 151
was measured by a spectrofluorometer (Model RF-5201PC, Shimadzu Scientific Instruments, 152
Columbia, MD) at excitation and emission wavelengths of 485 nm and 515 nm, respectively. 153
on July 13, 2018 by guesthttp://aem
.asm.org/
Dow
nloaded from

8
The remaining two portions were stored at –80oC until used in analysis of infectious and total 154
virus. 155
Infectious virus was enumerated using a double agar layer plaque assay (34). Briefly, serially 156
diluted samples in phosphate buffered saline were added to 4 mL of 0.75% tryptic soy agar 157
(TSA) maintained at 48oC along with 0.1 mL of log-phase E. coli. This “top agar” was poured 158
onto pre-prepared 1.5% TSA “bottom agar” plates and allowed to solidify. The plates were then 159
inverted, incubated at 37oC for 18 hours, and examined for the production of viral plaques. The 160
plaques were counted and viral titers were expressed as PFU/mL. 161
Total virus was quantified by qRT-PCR, as described elsewhere (18). Since qRT-PCR 162
measures both infectious and non-infectious virus, the results are referred to as total virus. 163
Briefly, viral RNA was extracted from 140 µL of each sample and eluted in 40 µL of elution 164
buffer using the QIAamp viral RNA kit (Qiagen, Valencia, CA). The extracted viral RNA (3 µL) 165
was mixed with specific primers and probe (35) and One Step RT-PCR kit (Qiagen) to a final 166
volume of 20 µL. qRT-PCR was then performed in duplicate in a Mastercycler ep Realplex2 167
thermocycler (Epperdorf, Hamburg, Germany). Viral RNA extracted from the virus stock of a 168
known titer was serially diluted in RNase-free water and used to construct standard curves, 169
which translated Ct-values into projected titers in PFU/mL. Similar standard curves were 170
obtained by serially diluting MS2 stock in 3% TSB, HS, and AS followed by RNA extraction, 171
suggesting little RNA degradation due to different nebulizer suspensions. 172
Data analysis. To evaluate the effect of nebulization on the stability of virus infectivity and 173
viral RNA in the nebulizer suspensions, two parameters, γIV and γTV, were calculated: 174
, / ,, / , , / ,, / , , (1) 175
on July 13, 2018 by guesthttp://aem
.asm.org/
Dow
nloaded from

9
which compare the concentration ratio of infectious (CIV,neb) or total virus (CTV,neb) to 176
fluorescence intensity (CF,neb) in the nebulizer suspension before (b) and after (a) nebulization. 177
The inclusion of CF,neb in the equations takes into account the possible artificial increase of virus 178
concentration due to water evaporation from the suspensions during nebulization (18, 24). 179
To understand how viral content (either infectious or total virus) was distributed among 180
various particle sizes, we defined the virus size distribution, dCV(Dp)/dlog10Dp, a size 181
distribution function particularly for particles carrying virus (18, 20): 182
, ∆ , (2) 183
where CV,gel is the concentration of infectious virus or total virus recovered from the gelatin filter 184
at certain particle size Dp, Vgel is the volume of gelatin filter sample, Qgel and t are the gelatin 185
filter sampling flow rate and sampling time, Δlog10Dp is the logarithm of the width of the size 186
interval of the DMA, f+1 is the fraction of singly positively charged particles (36), and P is the 187
penetration of particles through the DMA (37). 188
The amount of infectious or total virus carried per particle, v(Dp), was calculated as the ratio of 189
the total amount of virus collected by the gelatin filter to the total number of particles measured 190
by the SMPS at a given particle size: 191
, ∆ , , (3) 192
where ΔCn,SMPS is particle number concentration measured by the SMPS within a size interval 193
with geometric mean diameter Dp. 194
To quantify how efficiently infectious virus was recovered, relative recovery of infectious 195
virus (RRIV) was calculated: 196
, / ,, / , , (4) 197
on July 13, 2018 by guesthttp://aem
.asm.org/
Dow
nloaded from
10
where CIV,neb and CF,neb were the averaged values before and after nebulization. The infectious 198
virus concentrations are normalized by fluorescence concentrations to take into account any 199
artificial loss of virus infectivity due to the transport loss of particles (e.g. sedimentation and 200
deposition) in the test system. If there is no inactivation of virus (i.e. 100% survival), then RRIV 201
= 1, assuming no measurement error. Therefore, RRIV represents the fraction of infectious virus 202
recovered relative to the fluorescence recovered and it serves as an indication of the survival of 203
airborne virus (18, 24). Similarly, we also calculated relative recovery of total virus (RRTV): 204
, / ,, / , . (5) 205
One method to quantify the survival of airborne virus is to compare the ratio of infectious 206
virus to total (both infectious and non-infectious) virus (10, 13, 18, 38, 39). The lower the ratio, 207
the poorer the survival is. Here, the infectious to total virus ratio (ITR) in the aerosol sample was 208
normalized by the same ratio in the nebulizer suspensions: 209
, / ,, / , , (6) 210
where CIV,neb and CTV,neb were the averaged values before and after nebulization. 211
Data obtained for different nebulizer suspensions at different particle sizes were statistically 212
analyzed using one-way or multi-way analysis of variance (ANOVA) in MATLAB R2010b. A 213
p-value of ≤0.05 was considered statistically significant. 214
215
RESULTS 216
In a previous study (18), we measured MS2 bacteriohage aerosolized from a cell culture 217
medium (i.e. 3% TSB), supplemented with the same amount of uranine and antifoam as in this 218
study. Therefore, those results are also presented here for comparison purposes. 219
on July 13, 2018 by guesthttp://aem
.asm.org/
Dow
nloaded from

11
Stability of virus in nebulizer suspensions. Table 1 shows the geometric mean and 95% 220
confidence interval of γIV and γTV for the four nebulizer suspensions. Neither γIV nor γTV was 221
significantly different from unity, suggesting that the composition of nebulizer suspension, along 222
with uranine and antifoam, did not inactivate the virus. In addition, one-way ANOVA showed 223
that there was no statistically significantly difference in γIV (p = 0.429) or γTV (p = 0.142) among 224
the four nebulizer suspensions. 225
Particle size distributions. Typical SMPS-measured particle number distributions of virus 226
aerosols generated from the four nebulizer suspensions and their particle statistics are shown in 227
Figure S1 (supplemental information available online). The size distributions of TSB and ASNM 228
were lognormal with a count median diameter of 76.5 and 64.3 nm, respectively. However, the 229
size of particles generated from HS was bimodally distributed. The primary mode at ~50 nm had 230
a magnitude almost twice that of the secondary mode at ~80 nm. Unlike the three nebulizer 231
suspensions above, the particle size distribution of AS measured before, during, and after the 232
experiment were multimodal and all different (Figure S1). During a nebulization period of ~90 233
min, the two peaks at 15 and 33 nm continued to diminish (with a decrease in number 234
concentration by 62% and 25%, respectively) while a third peak at ~110 nm gradually appeared 235
(with an increase in number concentration by 53%). This large variation with time indicates an 236
unstable output of the Collison nebulizer when AS was nebulized. 237
Virus size distributions. Figure 2 and Figure S2 (supplemental information available online) 238
present the infectious virus and total virus size distributions for the four nebulizer suspensions. 239
The concentration of airborne virus generally increased with particle size and the maximum 240
mean concentration of infectious virus (at 400 or 450 nm) was 3600, 25, 220, and 33 PFU/cm3 241
for TSB, HS, AS, and ASNM, respectively, which was several orders of magnitude lower than 242
on July 13, 2018 by guesthttp://aem
.asm.org/
Dow
nloaded from
12
particle number concentration (Figure S1). For all four nebulizer suspensions, the infectious 243
virus and total virus size distributions followed the particle volume distribution better than the 244
particle number distribution, despite the large error bars. 245
Virus carried per particle. As shown in Figure 3 and Figure S3 (supplemental information 246
available online), the amount of infectious virus (iv) and total virus (tv) carried per particle 247
increased with particle size for each of the four nebulizer suspensions. Results of curve fitting 248
suggest that the association of iv and tv with particle size reasonably followed a power law, 249
where the power was not significantly different from 3. However, even for the largest particles 250
(450 nm), iv and tv were much lower than 1 PFU/particle. 251
Relative recovery of infectious virus. RRIV was plotted in Figure 4 as a function of particle 252
size for the four nebulizer suspensions. Two-way ANOVA showed that RRIV was independent of 253
particle size (p = 0.168), but significantly depended on the type of nebulizer suspension (p < 254
0.001). TSB and AS had similar RRIV, much higher than that of HS and ASNM. Particle size-255
averaged RRIV was 0.285, 0.032, 0.218, and 0.024 for TSB, HS, AS and ASNM, respectively. 256
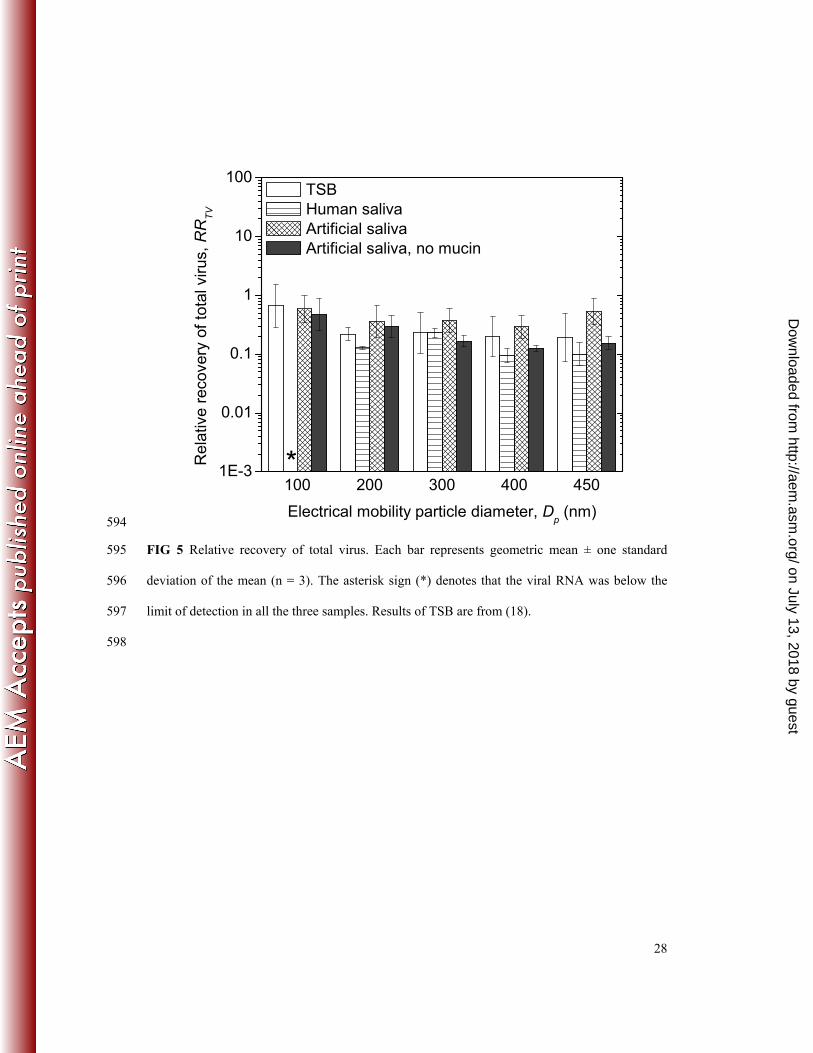
Relative recovery of total virus. Similar to RRIV, RRTV (Figure 5) was also independent of 257
particle size (two-way ANOVA, p = 0.853). Particle size-averaged RRTV was 0.265, 0.130, 258
0.414, and 0.215 for TSB, HS, AS and ASNM, respectively. Therefore, RRTV was generally 259
comparable between the four nebulizer suspensions, as confirmed by statistical analysis (two-260
way ANOVA, p = 0.053). 261
Infectious-to-total virus ratio. Figure 6 shows ITR for the four nebulizer suspensions at 262
different particle sizes. Similar to RRIV and RRTV, particle size had little effect on ITR (two-way 263
ANOVA, p = 0.399). However, ITR was strongly affected by the type of nebulizer suspension 264
on July 13, 2018 by guesthttp://aem
.asm.org/
Dow
nloaded from

13
(two-way ANOVA, p < 0.001). TSB gave the highest particle size averaged ITR (0.915), 265
followed by AS (0.527), HS (0.242), and ASNM (0.114). 266
267
DISCUSSION 268
Effect of nebulization and sampling on virus survival. The high shear stress during 269
nebulization often substantially reduces the viability of bacteria (40). However, values of γIV and 270
γTV (Table 1) indicate that neither infectivity nor viral RNA of MS2 bacteriophage was affected 271
by the nebulization stress. This finding is consistent with the literature, where both enveloped 272
and non-enveloped viruses were aerosolized from cell culture media (18, 24, 30, 31). The four 273
nebulizer suspensions gave similar γ, suggesting that the insensitivity of virus to nebulization 274
stress is not unique for cell culture media, but occurs for other suspensions also. One possible 275
reason for the insensitivity could be the small physical size and inertia of the virus, which makes 276
it experience lower nebulization stress than bacteria (31). 277
Filters are usually not recommended for collecting infectious virus aerosols, because of the 278
detrimental effect of desiccation during sampling (41). To evaluate whether gelatin filters would 279
impose sampling stress on the collected virus, an additional experiment was designed and 280
repeated in triplicate by running two gelatin filters in parallel. After sampling airborne MS2 for 3 281
min, one filter was immediately analyzed by plaque assay, while the other was exposed to 282
HEPA-filtered air for 15 min (to simulate the level of desiccation experienced by the virus) and 283
then analyzed. One-way ANOVA suggested that there was no significant difference (p = 0.737) 284
between exposed (7.4±1.1×10⁵ PFU/mL) and unexposed samples (7.7±0.9 × 10⁵ PFU/mL). 285
These results are similar to what has been reported elsewhere (25) and further confirm that 286
on July 13, 2018 by guesthttp://aem
.asm.org/
Dow
nloaded from
14
gelatin filters caused minimum sampling stress, which may be attributed to the high moisture 287
content of the gelatin. 288
As there was little nebulization and sampling stress, the loss of virus infectivity in the present 289
experiments seems to occur primarily in the aerosol phase. 290
Particle size distribution. The particle size distributions generated from the four nebulizer 291
suspensions did not reflect the physical size of the virus itself (Figure S1). Instead, they were 292
primarily determined by the composition of the nebulizer suspensions. Due to the higher volume 293
fraction of solid material (solute) in the nebulizer suspension, the size distribution of TSB gave a 294
mean diameter larger than that of ASNM. Interestingly, the size distribution of HS was bimodal, 295
indicating two different sources of particles. One source was certainly the various chemicals (e.g. 296
salts and uranine) dissolved in the suspension, similar to TSB and ASNM. The other source 297
might come from salivary micelles. As revealed by electron microscopy, salivary micelles are 298
multi-component protein complexes in HS with globular structures (42). They are often in the 299
form of individual particles or aggregates, ranging from 50-400 nm (42, 43), with mean size 300
close to the second mode of the bimodal distribution. The addition of mucin to ASNM changed 301
the size distribution from lognormal to multimodal (Figure S1). Mucins are large glycoproteins 302
with long-chain structures that tend to be entangled with each other (44). Due to the high 303
recirculation rate of the suspension during nebulization (e.g. once every 6 sec) (45), shear stress 304
might gradually break up these entanglements, thus causing unstable output from the nebulizer. 305
Virus size distribution and virus carried per particle. Similar to TSB (18), HS, AS, and 306
ASNM produced infectious and total virus size distributions that were generally represented by 307
the particle volume distribution (Figure 2 and S2), suggesting that the amount of virus carried per 308
particle was proportional to particle volume. This finding is further supported by the curve fitting 309
on July 13, 2018 by guesthttp://aem
.asm.org/
Dow
nloaded from

15
results for iv and tv (Figure 3 and S3), which showed a power of ~3. A similar trend was also 310
observed for various animal viruses aerosolized from cell culture media in the submicron (18) 311
and micron size range (24, 30). Assuming that one PFU represents one infectious virus, values 312
much lower than 1 PFU/particle for iv and tv (Figure 3 and S3) indicate that only a small fraction 313
of the generated particles actually carried virus. This is because conventional Collison nebulizers 314
inevitably generate many virus-free residual particles, even if suspensions with high virus titers 315
are used, as explained earlier (18).Therefore, compared with cell culture medium, the use of non-316
cell culture medium did not change how virus was distributed among or carried by particles of 317
different sizes. 318
Effect of nebulizer suspensions on virus survival. Virus survival was a strong function of the 319
type of nebulizer suspension. Survival of airborne MS2 was highest for TSB and AS, moderate 320
for HS, and lowest for ASNM, as indicated by the values of RRIV (Figure 4) and ITR (Figure 6). 321
Although it is well known that the composition of nebulizer suspension plays a significant role in 322
survival of airborne viruses (7, 8), how it preserves or reduces virus infectivity is less understood. 323
Multiple inactivation mechanisms have been proposed and reviewed regarding the effect of 324
nebulizer suspension composition (46, 47). However, for MS2 bacteriophage, the loss of its 325
survival (RRIV< 1 and ITR <1) could be most plausibly explained by the exposure to an air-water 326
interface (AWI), where the virus experiences “deforming forces”, which causes irreversible 327
folding and rearrangement of virus protein molecules and thus inactivates the virus (48, 49). 328
Considering the moderate RH used during the experiments and the highly hygroscopic nature of 329
uranine (50) and other salts (e.g. NaCl) used in the nebulizer suspensions, the generated particles 330
might carry substantial water content rather than being completely dried, thus creating AWI. 331
MS2 bacteriophage, though non-enveloped, is very hydrophobic (51) and thus tends to 332
on July 13, 2018 by guesthttp://aem
.asm.org/
Dow
nloaded from

16
accumulate at the AWI. The increased concentration of salts in the generated droplets due to 333
water evaporation decreases the size of the virus double layer, further promoting virus adsorption 334
at the AWI (49, 51). All these observations suggest that inactivation of MS2 in the aerosol phase 335
could be a combined result of exposure to AWI and the hygroscopic nature of the particles. 336
The addition of proteins to liquid suspensions may reduce the solution surface tension, which 337
makes it more difficult for the virus to reach the AWI, thereby reducing virus inactivation (49, 338
51). This may be the reason why MS2 nebulized from protein-rich TSB survived much better 339
than that from salt-dominant ASNM. Other proteinacious solutions such as peptone were also 340
reported to increase the survival of airborne MS2 (48, 52). 341
The use of mucin significantly enhanced virus survival (Figure 4 and 6). Woo et al. (12) 342
showed that the cross-linking network of mucin forms a thin layer to encapsulate virus in 343
aerosols. This layer may reduce virus exposure to AWI and thus boost survival. However, the 344
protection level offered by mucin may not monotonically increase with its concentration. For 345
example, Schoenbaum et al. (53) recovered much less infectious pseudorabies virus when mucin 346
concentration increased from 1% to 2%. HS, although it also contains mucin, gave a much lower 347
survival than AS, suggesting that exposure to AWI was probably not the only inactivation 348
mechanism. Airborne foot-and-mouth disease virus has been found particularly sensitive to an 349
undefined organic molecule present in bovine salivary fluid (54). A similar situation may also 350
exist for HS and MS2, especially considering the numerous trace components in HS (28) and 351
many of them possess antiviral activities (55). 352
Instability of viral RNA in aerosol. RRTV<1 (Figure 5) suggests that viral RNA was not fully 353
preserved in the aerosol. The average (1-RRTV)/(1-RRIV) (i.e. the fraction of virus inactivation 354
due to viral RNA damage) was 0.97, 0.89, 0.72, and 0.76 for TSB, HS, AS, and ASNM, 355
on July 13, 2018 by guesthttp://aem
.asm.org/
Dow
nloaded from

17
respectively, suggesting that inactivation of airborne MS2 was largely due to its damaged viral 356
RNA. Inactivation of several enveloped viruses, however, has been shown to result mainly from 357
their damaged viral capsid and/or envelope proteins (18). Perhaps a virus envelope could protect 358
viral RNA more effectively than viral capsid in aerosol. The exact inactivation mechanisms 359
could be potentially determined using the promising methods described by Wigginton et al. (56). 360
The instability of viral RNA also raises the question of using viral nucleic acids as a particle 361
tracer for virus aerosol studies. If viral nucleic acids degrade in aerosol, then infectious to total 362
virus ratio (ITR), which is often used in the literature (10, 13, 18, 38, 39) as an indicator for 363
airborne virus survival, may underestimate it. An ideal particle tracer must be highly stable in 364
aerosol and easily quantifiable so that the tracer concentration is directly proportional to virus 365
concentration. From this viewpoint, uranine is still the most reliable particle tracer (30, 41). 366
Effect of particle size on survival. Airborne MS2 survival was a weak function of particle 367
size (Figures 4 and 6). However, large particle size has been found to increase virus survival due 368
to the shielding effect (12, 18) of other material. It is possible that the size of particles sampled 369
(100-450 nm) was already much larger than the physical size of MS2 (27 nm), so further 370
increase in particle size did not enhance survival. Woo (13) extended the measurement of MS2 371
down to 30-230 nm and did observe an increase of survival with increased particle size. 372
Use of natural nebulizer suspensions for risk assessment. To assess the risk of airborne 373
transmission of viral diseases, information on survival of viruses in aerosol is of critical 374
importance. However, as clearly demonstrated in this study, artificial nebulizer suspensions, 375
even artificial saliva, did not produce the same effect as human saliva on the infectivity and 376
survival of airborne MS2 bacteriophage. Significant difference in the survival of several 377
veterinary viruses between cell culture media and animal salivary fluid was also reported (54, 378
on July 13, 2018 by guesthttp://aem
.asm.org/
Dow
nloaded from
18
57-59). These findings strongly suggest that the use of artificial nebulizer suspensions may over- 379
or underestimate the survival of airborne viruses in real life situations, and therefore negatively 380
impact risk assessment. To increase the clinical or epidemiological values of a study, the use of 381
natural nebulizer suspensions is recommended. However, we should be cautious about 1) the 382
potential unstable aerosol output from nebulizers (e.g. AS in our study), particularly when 383
aerosol has to be sampled for a prolonged time period and 2) the possible PCR inhibition by 384
natural suspensions, as shown elsewhere (60). 385
Limitations. One of the main limitations is that the saliva used in this study came from only 386
one subject. Given that there exists large inter-subject variation in terms of salivary components 387
and antiviral properties of saliva (28, 55, 61), saliva from multiple donors should be tested in the 388
future to determine variation in the population and to allow intra-study comparison. In addition, 389
MS2 has been found to be a poor surrogate for certain human and animal viruses in the aerosol 390
phase (18, 24) and the effect of nebulizer suspensions generally varies for different viruses (7). 391
Therefore, it is difficult to predict the effect of human saliva and artificial suspensions on 392
airborne human viruses based on the results of MS2. It would be interesting to test better 393
surrogate viruses aerosolized from human saliva. Also, only one value of RH was tested in these 394
experiments. Several studies (54, 57-59) have found that RH affects how cell culture media and 395
natural fluids protect airborne viruses. Moreover, although uranine was used as a particle tracer, 396
it changed the composition of the nebulizer suspensions and could have potentially affected virus 397
survival. For example, uranine has been shown to be toxic to airborne virus (62). The effect of 398
RH and uranine on the survival of airborne viruses warrants further investigation. 399
400
ACKNOWLEDGEMENTS 401
on July 13, 2018 by guesthttp://aem
.asm.org/
Dow
nloaded from

19
This study was funded by a grant from CDC-NIOSH (SR01OH009288-03). The contents of 402
this publication are solely the responsibility of the authors and do not necessarily represent the 403
official views of CDC-NIOSH. We are also grateful to the support from the Center for Filtration 404
Research at the University of Minnesota. 405
406
on July 13, 2018 by guesthttp://aem
.asm.org/
Dow
nloaded from

20
REFERENCES 407
1. Wang W, Chen S, Liu I. 2004. Detection of SARS-associated coronavirus in throat 408 wash and saliva in early diagnosis. Emerg. Infect. Dis. 10:1213–1219. 409
2. Robinson J, Lee B, Kothapalli S, Craig W, Fox J. 2008. Use of throat swab or saliva 410 specimens for detection of respiratory viruses in children. Clin. Infect. Dis. 46:e61–64. 411
3. Slots J, Slots H. 2011. Bacterial and viral pathogens in saliva: disease relationship and 412 infectious risk. Periodontol. 2000 55:48–69. 413
4. Fabian P, McDevitt JJ, DeHaan WH, Fung ROP, Cowling BJ, Chan KH, Leung 414 GM, Milton DK. 2008. Influenza virus in human exhaled breath: an observational study. 415 PLoS One 3:e2691. 416
5. Stelzer-braid S, Oliver BG, Blazey AJ, Argent E, Newsome TP, Rawlinson WD, 417 Tovey ER. 2009. Exhalation of respiratory viruses by breathing, coughing, and talking. J. 418 Med. Virol. 81:1674–1679. 419
6. Reponen T, Willeke K, Ulevicius V, Grinshpun SA, Donnelly J. 1997. Techniques for 420 dispersion of microorganisms into air. Aerosol Sci. Technol. 27:405–421. 421
7. Sattar S, Ijaz MK, Gerba C. 1987. Spread of viral infections by aerosols. Crit. Rev. 422 Environ. Sci. Technol. 17:89–131. 423
8. Sobsey MD, Meschke JS. 2003. Virus survival in the environment with special attention 424 to survival in sewage droplets and other environmental media of fecal or respiratory 425 origin. Available at http://www.iapmo.org/common/pdf/ISS-426 Rome/Sobsey_Environ_Report.pdf. 427
9. Snider DE, Bridges CB, Weissman DN. 2010. Meeting summary of the workshop 428 “Approaches to Better Understand Human Influenza Transmission.” Available at 429 http://www.cdc.gov/influenzatransmissionworkshop2010/pdf/Influenza_Transmission_W430 orkshop_Summary_508.pdf. 431
10. Lee J-H. 2009. Ph.D. thesis. University of Florida, Gainesville, FL. 432 11. Woo M-H, Hsu Y-M, Wu C-Y, Heimbuch B, Wander J. 2010. Method for 433
contamination of filtering facepiece respirators by deposition of MS2 viral aerosols. J. 434 Aerosol Sci. 41:944–952. 435
12. Woo M-H, Grippin A, Anwar D, Smith T, Wu C-Y, Wander JD. 2012. Effects of 436 relative humidity and spraying medium on uv decontamination of filters loaded with viral 437 aerosols. Appl. Environ. Microbiol. 78:5781–7. 438
13. Woo M-H. 2012. Ph.D. thesis. University of Florida, Gainesville, FL. 439 14. ASTM. 2011. Standard test method for evaluation of effectiveness of decontamination 440
procedures for surfaces when challenged with droplets containing human pathogenic 441 viruses. ASTM Standard E2721 – 10. 442
15. ASTM. 2011. Standard test method for evaluation of effectiveness of decontamination 443 procedures for air-permeable materials when challenged with biological aerosols 444 containing human pathogenic viruses. ASTM Standard E2720 – 10. 445
16. Trouwborst T, Kuyper S. 1974. Inactivation of bacteriophage T3 in aerosols: effect of 446 prehumidification on survival after spraying from solutions of salt, peptone, and saliva. 447 Appl. Microbiol. 27:834–7. 448
17. de Jong JC, Harmsen M, Trouwborst T. 1975. Factors in the inactivation of 449 Encephalomyocarditis virus in aerosols. Infect. Immun. 12:29–35. 450
on July 13, 2018 by guesthttp://aem
.asm.org/
Dow
nloaded from
21
18. Zuo Z, Kuehn TH, Verma H, Kumar S, Goyal SM, Appert J, Raynor PC, Ge S, Pui 451 DYH. 2013. Association of airborne virus infectivity and survivability with its carrier 452 particle size. Aerosol Sci. Technol. 47:373–382. 453
19. Zuo Z, Kuehn TH, Pui DYH. 2013. Performance evaluation of filtering facepiece 454 respirators using virus aerosols. Am. J. Infect. Control 41:80–82. 455
20. Hogan CJ, Kettleson EM, Lee M-H, Ramaswami B, Angenent LT, Biswas P. 2005. 456 Sampling methodologies and dosage assessment techniques for submicrometre and 457 ultrafine virus aerosol particles. J. Appl. Microbiol. 99:1422–34. 458
21. Haslbeck K, Schwarz K, Hohlfeld JM, Seume JR, Koch W. 2010. Submicron droplet 459 formation in the human lung. J. Aerosol Sci. 41:429–438. 460
22. Holmgren H, Ljungström E, Almstrand A-C, Bake B, Olin A-C. 2010. Size 461 distribution of exhaled particles in the range from 0.01 to 2.0μm. J. Aerosol Sci. 41:439–462 446. 463
23. Eninger RM, Hogan CJ, Biswas P, Adhikari A, Reponen T, Grinshpun SA. 2009. 464 Electrospray versus nebulization for aerosolization and filter testing with bacteriophage 465 particles. Aerosol Sci. Technol. 43:298–304. 466
24. Appert J, Raynor PC, Abin M, Chander Y, Guarino H, Goyal SM, Zuo Z, Ge S, 467 Kuehn TH. 2012. Influence of suspending liquid, impactor type, and substrate on size-468 selective sampling of ms2 and adenovirus aerosols. Aerosol Sci. Technol. 46:249–257. 469
25. Grinshpun SA, Adhikari A, Honda T, Kim KY, Toivola M, Rao KSR, Reponen T. 470 2007. Control of aerosol contaminants in indoor air: combining the particle concentration 471 reduction with microbial inactivation. Environ. Sci. Technol. 41:606–12. 472
26. Eninger RM, Adhikari A, Reponen T, Grinshpun SA. 2008. Differentiating Between 473 Physical and Viable Penetrations When Challenging Respirator Filters with Bioaerosols. 474 CLEAN. 36:615–621. 475
27. Navazesh M. 1993. Methods for collecting saliva. Ann. New York Acd Sci 694:72–77. 476 28. Humphrey SP, Williamson RT. 2001. A review of saliva: normal composition, flow, 477
and function. J. Prosthet. Dent. 85:162–9. 478 29. Schipper RG, Silletti E, Vingerhoeds MH. 2007. Saliva as research material: 479
biochemical, physicochemical and practical aspects. Arch. Oral Biol. 52:1114–35. 480 30. Ijaz MK, Karim YG, Sattar SA, Johnson-Lussenburg CM. 1987. Development of 481
methods to study the survival of airborne viruses. J. Virol. Methods 18:87–106. 482 31. Kim SW, Ramakrishnan MA, Raynor PC, Goyal SM. 2007. Effects of humidity and 483
other factors on the generation and sampling of a coronavirus aerosol. Aerobiologia. 484 23:239–248. 485
32. Zuo Z, de Abin M, Chander Y, Kuehn TH, Goyal SM, Pui DYH. 2013. Comparison 486 of spike and aerosol challenge tests for the recovery of viable influenza virus from non-487 woven fabrics. Influenza Other Respi. Viruses 7:637–644. 488
33. Burton NC, Grinshpun SA, Reponen T. 2007. Physical collection efficiency of filter 489 materials for bacteria and viruses. Ann. Occup. Hyg. 51:143–51. 490
34. U.S. Environmental Protection Agency. 2001. Method 1601: male specific (F1) and 491 somatic coliphage in water by two-step enrichment procedure. 492
35. O’Connell KP, Bucher JR, Anderson PE, Cao CJ, Khan AS, Gostomski MV, Valdes 493 JJ. 2006. Real-time fluorogenic reverse transcription-pcr assays for detection of 494 bacteriophage MS2. Appl. Env. Microbiol. 72:478–483. 495
on July 13, 2018 by guesthttp://aem
.asm.org/
Dow
nloaded from

22
36. Wiedensohler A. 1988. An approximation of the bipolar charge distribution for particles 496 in the submicron size range. J. Aerosol Sci 19:387–389. 497
37. Reineking A., Porstendörfer J. 1986. Measurements of particle loss functions in a 498 differential mobility analyzer (TSI, model 3071) for different flow rates. Aerosol Sci. 499 Technol. 5:483–486. 500
38. Fabian P, McDevitt JJ, Houseman E a, Milton DK. 2009. Airborne influenza virus 501 detection with four aerosol samplers using molecular and infectivity assays: 502 considerations for a new infectious virus aerosol sampler. Indoor Air 19:433–41. 503
39. McDevitt JJ, Koutrakis P, Ferguson ST, Wolfson JM, Fabian MP, Martins M, 504 Pantelic J, Milton DK. 2013. Development and performance evaluation of an exhaled-505 breath bioaerosol collector for infl uenza virus. Aerosol Sci. Technol. 47:444–451. 506
40. Griffiths WD, DeCosemo GAL. 1994. The assessment of bioaerosols: a critical review. 507 J. Aerosol Sci. 25:1425–1458. 508
41. Verreault D, Moineau S, Duchaine C. 2008. Methods for sampling of airborne viruses. 509 Microbiol. Mol. Biol. Rev. 72:413–44. 510
42. Rykke M, Smistad G, Rölla G, Karlsen J. 1995. Micelle-like structures in human 511 saliva. Colloids Surfaces B 4:33–44. 512
43. Soares RV, Lin T, Siqueira CC, Bruno LS, Li X, Oppenheim FG, Offner G, Troxler 513 RF. 2004. Salivary micelles: identification of complexes containing MG2, sIgA, 514 lactoferrin, amylase, glycosylated proline-rich protein and lysozyme. Arch. Oral Biol. 515 49:337–43. 516
44. Bansil R, Turner BS. 2006. Mucin structure, aggregation, physiological functions and 517 biomedical applications. Curr. Opin. Colloid Interface Sci. 11:164–170. 518
45. May KR. 1973. The Collison nebulizer: description, performance and application. 519 Aerosol Sci. 4:235–243. 520
46. De Jong JC, Winkler KC. 1968. The inactivation of poliovirus in aerosols. J. Hyg. 521 (Lond). 66:557–65. 522
47. Yang W, Marr LC. 2012. Mechanisms by which ambient humidity may affect viruses in 523 aerosols. Appl. Environ. Microbiol. 78:6781–8. 524
48. Trouwborst T, de Jong JC. 1973. Interaction of some factors in the mechanism of 525 inactivation of bacteriophage MS2 in aerosols. Appl. Microbiol. 26:252–7. 526
49. Trouwborst T, Kuyper S, de Jong JC, Plantinga AD. 1974. Inactivation of some 527 bacterial and animal viruses by exposure to liquid-air interfaces. J. Gen. Virol. 24:155–528 65. 529
50. Chan C, Kwok C, Chow A. 1997. Study of hygroscopic properties of aqueous mixtures 530 of disodium fluorescein and sodium chloride using an electrodynamic balance. Pharm. 531 Res. 14:1171–1175. 532
51. Thompson SS, Yates MV. 1999. Bacteriophage Inactivation at the Air-Water-Solid 533 Interface in Dynamic Batch Systems. Appl Env. Microbiol 65:1186–1190. 534
52. Dubovi EJ, Akers TG. 1970. Airborne stability of tailless bacterial viruses S-13 and 535 MS-2. Appl. Microbiol. 19:624–628. 536
53. Schoenbaum M, Zimmerman J, Beran S, Murphy D. 1990. Survival of pseudorabies 537 virus in aerosol. Am. J. Vet. Res. 51:331–333. 538
54. Barlow DF, Donaldson AI. 1973. Comparison of the aerosol stabilities of foot-and-539 mouth disease virus suspended in cell culture fluid or natural fluids. J. Gen. Virol. 540 20:311–8. 541
on July 13, 2018 by guesthttp://aem
.asm.org/
Dow
nloaded from
23
55. Malamud D, Abrams WR, Barber C a, Weissman D, Rehtanz M, Golub E. 2011. 542 Antiviral activities in human saliva. Adv. Dent. Res. 23:34–7. 543
56. Wigginton KR, Pecson BM, Sigstam T, Bosshard F, Kohn T. 2012. Virus inactivation 544 mechanisms: impact of disinfectants on virus function and structural integrity. Environ. 545 Sci. Technol. 46:12069–78. 546
57. Elazhary MA, Derbyshire JB. 1979. Effect of temperature, relative humidity and 547 medium on the aerosol stability of infectious bovine rhinotracheitis virus. Can. J. Comp. 548 Med. 43:158–67. 549
58. Elazhary MA, Derbyshire JB. 1979. Aerosol stability of bovine parainfluenza type 3 550 virus. Can. J. Comp. Med. 43:295–304. 551
59. Elazhary MA, Derbyshire JB. 1979. Aerosol stability of bovine adenovirus type 3. Can. 552 J. Comp. Med. 43:305–312. 553
60. Detmer SE, Patnayak DP, Jiang Y, Gramer MR, Goyal SM. 2011. Detection of 554 Influenza a Virus in Porcine Oral Fluid Samples. J. Vet. Diagnostic Investig. 23:241–555 247. 556
61. White MR, Helmerhorst EJ, Ligtenberg A, Karpel M, Tecle T, Siqueira WL, 557 Oppenheim FG, Hartshorn KL. 2009. Multiple components contribute to ability of 558 saliva to inhibit influenza viruses. Oral Microbiol. Immunol. 24:18–24. 559
62. Berendt RF, Dorsey EL. 1971. Effect of simulated solar radiation and sodium 560 fluorescein on the recovery of Venezuelan equine encephalomyelitis virus from aerosols. 561 Appl. Microbiol. 21:447–450. 562
563
564
565
on July 13, 2018 by guesthttp://aem
.asm.org/
Dow
nloaded from

24
566
567
FIG 1 Schematic diagram of the experimental setup for the measurement of virus aerosol. 568
569
1.0
L/m
in
on July 13, 2018 by guesthttp://aem
.asm.org/
Dow
nloaded from

25
570
571
FIG 2 Normalized particle number, particle volume, infectious virus, and total virus size 572
distributions for human saliva aerosol. Virus size distributions and particle size distributions 573
were normalized by their highest values and superimposed for easy comparison. Values are 574
means ± one standard deviation (n = 3). Data points of infectious virus and total virus size 575
distributions at 100 nm were not plotted since no virus was recovered. Similar plots for cell 576
culture medium (i.e. 3% TSB), artificial saliva, and artificial saliva without mucin are available 577
online (Figure S2). 578
579
10 100 10000.0
0.4
0.8
1.2
1.6
No
rma
lize
d d
istr
ibu
tion
Electrical mobility particle diameter, Dp (nm)
Particle number Particle volume Infectious virus Total virus
Human saliva
on July 13, 2018 by guesthttp://aem
.asm.org/
Dow
nloaded from

26
580
FIG 3 Amount of infectious and total virus carried per particle as a function of particle size for 581
human saliva aerosol. Also shown are the curve-fitting results with R-square values and 95% 582
confident interval (CI) of the slopes, where x represents particle size in nm and y represents virus 583
carried per particle in PFU/particle. Data points at 100 nm were not plotted since no virus was 584
recovered. Similar plots for cell culture medium (i.e. 3% TSB), artificial saliva, and artificial 585
saliva without mucin are available online (Figure S3). 586
587
200 300 400 5001E-7
1E-6
1E-5
1E-4
1E-3
0.01
0.1
1Human saliva
y=1.63E-11x2.97
R2=0.83CI: 2.0-3.9
Viru
s ca
rrie
d pe
r pa
rtic
le (
PF
U/p
artic
le)
Electrical mobility particle size, Dp (nm)
Infectious virus Total virus Power-law fit, infectious virus Power-law fit, total virus
y=1.55E-13x3.41
R2=0.70CI: 1.7-5.1
on July 13, 2018 by guesthttp://aem
.asm.org/
Dow
nloaded from

27
588
FIG 4 Relative recovery of infectious virus. Each bar represents geometric mean ± one standard 589
deviation of the mean (n = 3). The asterisk sign (*) denotes that infectious virus was below the 590
limit of detection in all the three samples. The pound sign (#) denotes that infectious virus was 591
recovered in only two of the three samples. Results of TSB are from (18). 592
593
100 200 300 400 4501E-3
0.01
0.1
1
10
100
#
Rel
ativ
e re
cove
ry o
f in
fect
iou
s vi
rus,
RRIV
Electrical mobility particle diameter, Dp (nm)
TSB Human saliva Artificial saliva Artificial saliva, no mucin
*
on July 13, 2018 by guesthttp://aem
.asm.org/
Dow
nloaded from
28
594
FIG 5 Relative recovery of total virus. Each bar represents geometric mean ± one standard 595
deviation of the mean (n = 3). The asterisk sign (*) denotes that the viral RNA was below the 596
limit of detection in all the three samples. Results of TSB are from (18). 597
598
100 200 300 400 4501E-3
0.01
0.1
1
10
100
*Rel
ativ
e r
ecov
ery
of t
otal
vir
us, RRTV
Electrical mobility particle diameter, Dp (nm)
TSB Human saliva Artificial saliva Artificial saliva, no mucin
on July 13, 2018 by guesthttp://aem
.asm.org/
Dow
nloaded from

29
599
FIG 6 Infectious-to-total ratio. Each bar represents geometric mean ± one standard deviation of 600
the mean (n = 3). The asterisk sign (*) denotes that infectious virus and viral RNA were below 601
the limit of detection in all three samples. The pound sign (#) denotes that infectious virus was 602
recovered in only two of the three samples. Results of TSB are from (18). 603
604
605
606
100 200 300 400 4501E-3
0.01
0.1
1
10
100
*
#
Infe
ctio
us
viru
s to
to
tal v
irus
rat
io, ITR
Electrical mobility particle diameter, Dp (nm)
TSB Human saliva Artificial saliva Artificial saliva, no mucin
on July 13, 2018 by guesthttp://aem
.asm.org/
Dow
nloaded from

30
Table 1 Geometric mean (with 95% lower and upper confidence interval) of γIV and γTV for the 607
four nebulizer suspensions. 608
Nebulizer suspension γIV γTV Cell culture medium (i.e. 3% TSB)a 1.07 (0.44, 2.62) 0.96 (0.48, 1.93) Human saliva 0.86 (0.63, 1.18) 0.87 (0.41, 1.87) Artificial saliva 1.08 (0.95, 1.21) 0.66 (0.36, 1.19) Artificial saliva no mucin 1.13 (0.79, 1.61) 1.12 (0.90, 1.41)
a Data from (18) 609
610
611
612
on July 13, 2018 by guesthttp://aem
.asm.org/
Dow
nloaded from