survival rates in a paediatric / neonatal intensive care … · dedicated paediatric intensive care...
TRANSCRIPT

For peer review only
SURVIVAL RATES IN A PAEDIATRIC / NEONATAL
INTENSIVE CARE UNIT
Journal: BMJ Open
Manuscript ID bmjopen-2015-010850
Article Type: Research
Date Submitted by the Author: 15-Dec-2015
Complete List of Authors: Ballot, Daynia E.; Univ Witwatersrand, Paediatrics and Child Health Davies, Victor; University of the Witwatersrand, Paediatrics and Child Health Cooper, Peter; University of the Witwatersrand, Paediatrics and Child Health Chirwa, Tobias; University of the Witwatersrand, School of Public Health Argent, Andrew; Red Cross War Memorial Childrens Hospital, Paediatric Intensive Care Unit
Mer, Mervyn; University of the Witwatersrand, Internal Medicine
<b>Primary Subject Heading</b>:
Paediatrics
Secondary Subject Heading: Intensive care, Epidemiology
Keywords: Paediatric intensive & critical care < PAEDIATRICS, NEONATOLOGY, HEALTH SERVICES ADMINISTRATION & MANAGEMENT
For peer review only - http://bmjopen.bmj.com/site/about/guidelines.xhtml
BMJ Open on June 5, 2020 by guest. P
rotected by copyright.http://bm
jopen.bmj.com
/B
MJ O
pen: first published as 10.1136/bmjopen-2015-010850 on 3 June 2016. D
ownloaded from

For peer review only
1
SURVIVAL RATES IN A PAEDIATRIC / NEONATAL INTENSIVE CARE
UNIT
Daynia E Ballot1, 4*
Victor A Davies1
Peter A Cooper 1
Tobias Chirwa 2
Andrew Argent3
Mervyn Mer4, 5
1. Department of Paediatrics and Child Health, Faculty of Health Sciences, University of the
Witwatersrand, Johannesburg, South Africa
2. Division of Epidemiology and Biostatistics, School of Public Health, Faculty of Health
Sciences, University of the Witwatersrand, Johannesburg, South Africa
3. School of Child and Adolescent Health, Faculty of Health Sciences, University of Cape Town,
Cape Town, South Africa
4. Wits- UQ Critical care Infection Collaboration, Johannesburg South Africa
5. Department of Internal Medicine, Division of Critical Care and Pulmonology Faculty of Health
Sciences, University of the Witwatersrand, Johannesburg, South Africa
∗ Corresponding author
Postal address
Private Bag X 39
Johannesburg
2000
Email: [email protected]
Keywords
Page 1 of 25
For peer review only - http://bmjopen.bmj.com/site/about/guidelines.xhtml
BMJ Open
123456789101112131415161718192021222324252627282930313233343536373839404142434445464748495051525354555657585960
on June 5, 2020 by guest. Protected by copyright.
http://bmjopen.bm
j.com/
BM
J Open: first published as 10.1136/bm
jopen-2015-010850 on 3 June 2016. Dow
nloaded from

For peer review only
2
Intensive care units, neonatal; Intensive care units, paediatric; Critical Care; South Africa
Word count: 2494
Page 2 of 25
For peer review only - http://bmjopen.bmj.com/site/about/guidelines.xhtml
BMJ Open
123456789101112131415161718192021222324252627282930313233343536373839404142434445464748495051525354555657585960
on June 5, 2020 by guest. Protected by copyright.
http://bmjopen.bm
j.com/
BM
J Open: first published as 10.1136/bm
jopen-2015-010850 on 3 June 2016. Dow
nloaded from

For peer review only
3
Contributorship statement
• DE Ballot conceptualised the study, collected and analysed the data and wrote up the
manuscript
• VA Davies assisted with the concept, data collection and reviewed the write up of the
manuscript.
• PA Cooper assisted with the study concept and review of the write up of the manuscript
• T Chirwa assisted with data analysis and review of the write up of the manuscript
• A Argent provided advice and input into the final write up of the manuscript.
• M Mer provided advice and input into the final write up of the manuscript.
Data sharing statement
No additional data is available.
Conflict of interest
The authors declare that they have no conflicts of interest
Funding
There was no funding for the study reported in this article
Acknowledgements
The authors gratefully acknowledge the help of Dr Debbie White, Dr Edgar Kalimba, Dr Priya
Wallabh, Dr Lea Chirwa, Dr Tanusha Ramdin, Dr David Raketsoane and Dr Faustine Agaba with data
collection, and Mr Lebogang Rapola , Miss Patricia Hanrahan and Mr Milton Reinecke with data
management.
Page 3 of 25
For peer review only - http://bmjopen.bmj.com/site/about/guidelines.xhtml
BMJ Open
123456789101112131415161718192021222324252627282930313233343536373839404142434445464748495051525354555657585960
on June 5, 2020 by guest. Protected by copyright.
http://bmjopen.bm
j.com/
BM
J Open: first published as 10.1136/bm
jopen-2015-010850 on 3 June 2016. Dow
nloaded from

For peer review only
4
ABSTRACT
Objective
Dedicated paediatric intensive care unit (PICU) facilities are frequently unavailable in low to middle
income countries. This study aimed to report on the survival to discharge of children admitted to a
combined paediatric / neonatal ICU in Johannesburg, South Africa.
Design and setting
This was a cross-sectional review of admissions to a combined paediatric / neonatal intensive care
unit in a single tertiary hospital in South Africa.
Participants
The study included all admissions (both paediatric and neonatal) to the unit between 1 January 2013
and 30 June 2015.
Outcome measures
Survival to discharge was the primary outcome variable. Severity of illness was not scored during the
study period.
Results
There were a total of 1,454 admissions, of which 182 records of admissions were not traceable,
leaving 1,272 admissions for review. Overall mortality rate was 25.7% (327/1272) There were
statistically significant differences in mortality in different age groups, with the mortality rate being
41.4% (121/292) (95% CI 35.8-47.1) for very low birth weight babies, 26.6% (120/451) (95%CI 22.5-
30.5) for bigger babies and 16.2% (86/529) (95%CI 13.1-19.3)for paediatric patients.
Conclusions
The mortality rate for both neonatal and paediatric age groups in this unit is high. Efforts should be
made to improve paediatric intensive care in combined ICU facilities.
Page 4 of 25
For peer review only - http://bmjopen.bmj.com/site/about/guidelines.xhtml
BMJ Open
123456789101112131415161718192021222324252627282930313233343536373839404142434445464748495051525354555657585960
on June 5, 2020 by guest. Protected by copyright.
http://bmjopen.bm
j.com/
BM
J Open: first published as 10.1136/bm
jopen-2015-010850 on 3 June 2016. Dow
nloaded from

For peer review only
5
ARTICLE SUMMARY
• Many critically ill children are not cared for by dedicated paediatric intensivists, even in a
tertiary hospital in a middle income country.
• The mortality of both critically ill neonates and older children is higher in a combined
paediatric/neonatal ICU than in a dedicated unit.
• Paediatric ICU admissions are often at the expense of critically ill neonates
• Severity of illness scoring was not available during the study period, so only unadjusted
mortality rates are reported.
• This was a retrospective analysis of a computerised database, so not all records were
available for inclusion.
Page 5 of 25
For peer review only - http://bmjopen.bmj.com/site/about/guidelines.xhtml
BMJ Open
123456789101112131415161718192021222324252627282930313233343536373839404142434445464748495051525354555657585960
on June 5, 2020 by guest. Protected by copyright.
http://bmjopen.bm
j.com/
BM
J Open: first published as 10.1136/bm
jopen-2015-010850 on 3 June 2016. Dow
nloaded from
For peer review only
6
BACKGROUND
Provision of both paediatric and neonatal intensive care in a low to middle income country (LMIC) is
challenging.[1] Difficulties include lack of medical and nursing staff, insufficient medication and
equipment and inadequate diagnostic facilities.[1,2] Identifying the optimal use of PICU beds in a
resource-limited situation is difficult. The use of ICU admission criteria attempt to ensure that the
limited facilities benefit those who will gain most; children without a reasonable chance of
functional recovery are not routinely admitted to PICU.[1,3] Argent et al discussed an approach to
optimising the use of limited PICU facilities at the Red Cross War Memorial Children’s Hospital
(RCWMCH) in Cape Town, South Africa, stating that hospitals need to develop “explicit policies for
utilisation of PICU resources” using “a reasonable process for fair and equitable utilisation of scarce
resources… that may extend beyond the priorities of individual patients”.[3]
Mortality and infection rates in PICU in developing countries are influenced by the income level of
the country.[4] The average PICU mortality rate in Latin American countries was 13.39% compared
to 5.4% in European countries.[5] The mean PICU mortality rate in Turkey was reported to be
14.6%.[2] PICU mortality at the RCWMCH in Cape Town, however, has declined from 10.6% in 2006
to 9% in 2010.[3,6] The mortality rate of children admitted to general ICU facilities in other African
countries is far higher than the RCWMCH experience, ranging from 36% to 40%.[7,8,9]
Children admitted to a centralised dedicated paediatric ICU have better survival rates than those
treated in general or shared ICU facilities, even in developing countries.[10,11] Dedicated PICU
facilities are uncommon in South Africa. Critical care beds in South Africa are concentrated in the
more affluent provinces (Gauteng, Kwa-Zulu Natal and the Western Cape) and in the private
sector.[12,13] Only 19.6% of the total ICU beds were for paediatric and neonatal intensive care, and
mixed surgical and medical units admit children in most hospitals.[12] Lack of dedicated PICU
facilities is common in many other African countries. In Uganda, for example, there is one general
ICU bed per million people.[9]
Page 6 of 25
For peer review only - http://bmjopen.bmj.com/site/about/guidelines.xhtml
BMJ Open
123456789101112131415161718192021222324252627282930313233343536373839404142434445464748495051525354555657585960
on June 5, 2020 by guest. Protected by copyright.
http://bmjopen.bm
j.com/
BM
J Open: first published as 10.1136/bm
jopen-2015-010850 on 3 June 2016. Dow
nloaded from

For peer review only
7
Charlotte Maxeke Johannesburg Academic Hospital (CMJAH) is a quaternary referral hospital with a
single combined paediatric / neonatal ICU (PNICU) with 14 ventilator beds. This unit serves
neonates, general paediatrics, paediatric sub-specialities and paediatric surgery; renal dialysis and
high frequency ventilation are available. The age of admission ranges from birth to 14 years. . It is
often not possible to admit patients because of a lack of available beds. The unit has no dedicated
paediatric intensivist, but is run by other subspecialists, mainly neonatologists. Nasal continuous
positive airways pressure (NCPAP) is the first line of ventilatory support for neonates with
respiratory failure.[14] Patients who require “high care” observation or treatment are not routinely
admitted; the PNICU essentially functions as a ventilator unit. Additional information regarding the
CMJAH PNICU is provided in the supplementary file, available online. There is a lack of information
on admissions to the CMJAH PNICU. This study therefore aimed to review the survival to discharge
of patients admitted to the unit. Secondary objectives included comparing the survival rate between
paediatric and neonatal patients, determining the disease profile of patients, establishing predictors
of death and evaluating the impact on bed availability of the use of NCPAP.
SUBJECTS AND METHODS
This was a retrospective cross-sectional record review of all patients admitted to the CMJAH PNICU
between 1 January 2013 and 30 June 2015. Patients were admitted and cared for at the discretion of
the attending physician, using age-related norms and treatment protocols. Patient charts were
reviewed on discharge from PNICU and demographic, clinical and outcome data were captured.
Variables were recorded as positive if there had been any occurrence during their time in the PNICU.
Detailed definitions of the variables used in the study are provided in the supplementary file
available online.
Patient data were entered into computerised databases for clinical audit and quality improvement.
These databases are managed by Research Electronic Data Capture (REDCAP) hosted by the
University of the Witwatersrand.[15] The data were de-identified and entered into IBM SPSS (version
22) for the purposes of analysis. Ethical clearance for the study was obtained from the Human
Page 7 of 25
For peer review only - http://bmjopen.bmj.com/site/about/guidelines.xhtml
BMJ Open
123456789101112131415161718192021222324252627282930313233343536373839404142434445464748495051525354555657585960
on June 5, 2020 by guest. Protected by copyright.
http://bmjopen.bm
j.com/
BM
J Open: first published as 10.1136/bm
jopen-2015-010850 on 3 June 2016. Dow
nloaded from
For peer review only
8
Research Ethics Committee of the University of the Witwatersrand. Patients with no retrievable
information were excluded from the study.
Definitions of patient categories
Neonates were classified as those < 28 days of age who had never been discharged home, and who
had been admitted directly to PNICU from other hospitals or the neonatal nursery at CMJAH.
Neonates who had been discharged home and then readmitted to PNICU were classified as
paediatric patients. Neonates were further divided into very low birth weight (VLBW) infants (< 1500
grams birthweight) and bigger babies (> 1500 grams birthweight). Children older than 14 years were
usually admitted to the adult ICU. All neonates admitted to PNICU in this study were intubated and
ventilated; some paediatric patients were not intubated but admitted for high care treatment.
Statistical analysis
Continuous variables such as age at admission were described using mean and standard deviation
(SD) or median with inter-quartile range (IQR), depending on whether the data were normally
distributed. Categorical variables were described as frequencies and percentages. Survival to
discharge from ICU was considered the primary outcome variable for comparison.
Univariate analysis comparing different characteristics between survivors and non-survivors used an
independent t-test for normally-distributed data and the Mann-Whitney U-test for skewed data. A
Chi-square test was used to compare differences in survival for categorical variables. A p value of <
0.05 was considered to be statistically significant. Variables with a p value < 0.05 in the univariate
analysis were entered into a multiple stepwise logistic regression model to establish determinants of
survival to PNICU discharge. Neonates and older paediatric patients have different disease profiles
and different risk factors for mortality. Data were therefore analysed separately for VLBW, bigger
babies and paediatric patients.
.RESULTS
A total of 1,454 patients were admitted to the PNICU during the study period. Records could not be
retrieved for 182 patients, so the study included 1,272 patients. There were 292 VLBW babies
Page 8 of 25
For peer review only - http://bmjopen.bmj.com/site/about/guidelines.xhtml
BMJ Open
123456789101112131415161718192021222324252627282930313233343536373839404142434445464748495051525354555657585960
on June 5, 2020 by guest. Protected by copyright.
http://bmjopen.bm
j.com/
BM
J Open: first published as 10.1136/bm
jopen-2015-010850 on 3 June 2016. Dow
nloaded from

For peer review only
9
(22.9%), 451 bigger babies (35.4%) and 529 paediatric (41.5%) admissions. The overall proportion
dying was 25.7% (327 /1272). There was a statistically significant difference in the proportion of
deaths between patients of different ages, with the death rate being 41.4% (95% CI 35.8-47.1) in
VLBW babies, 26.6% (95% CI 22.5-30.5) in bigger babies and 16.2% (95% CI 13.1-19.3) in paediatric
patients (p < 0.0001).
Non-invasive ventilatory support in the form of NCPAP was provided to an additional 395 bigger
babies and 651 VLBW babies. A total of 2,318 patients therefore received ventilatory support during
the study period (846 bigger babies, 943 VLBW babies and 529 paediatric patients). Almost half
(43.7%, 1,015/2,318) of the patients who received ventilatory support were treated successfully with
NCPAP without requiring admission to PNICU. The overall mortality rate for babies who received any
ventilatory support was 20.8% (483/2318), or 28.1 % (265/943) for the VLBW babies and 15.6%
(132/846) for the bigger babies (see Figure 1).
Paediatric ICU admissions
Details of the 529 paediatric admissions are shown in Table 1. The median age at admission was 8.7
months (IQR 46.5). There was no statistically significant difference in the median age of admissions
between survivors and non-survivors [10.5 months (IQR 50.7) vs 7.3 months (IQR 35.7); p=0.412].
Similarly, the median duration of ICU stay was not significantly different for survivors and non-
survivors (approximately 3 days in both groups) (p=0.540). The majority of patients (471/529; 89%)
were intubated and ventilated. More than half (305/529; 57.7%) of the paediatric patients were
surgical admissions. The most common problem in medical paediatric patients was lower respiratory
tract illness (191/529; 36.1%).
Page 9 of 25
For peer review only - http://bmjopen.bmj.com/site/about/guidelines.xhtml
BMJ Open
123456789101112131415161718192021222324252627282930313233343536373839404142434445464748495051525354555657585960
on June 5, 2020 by guest. Protected by copyright.
http://bmjopen.bm
j.com/
BM
J Open: first published as 10.1136/bm
jopen-2015-010850 on 3 June 2016. Dow
nloaded from

For peer review only
10
Table 1
Factors associated with survival in the 529 paediatric patients admitted to CMJAH PNICU between 1
January 2013 and 30 June 2015
Variable Children with the
condition (%)
Percentage of
children with the
condition that died
(95% CI)
Percentage of
children without
the condition that
died (95% CI)
P Value
Male 292 (55.2) 16.1 (11.9–20.3) 17.4 (12.3–22.5) 0.477
HIV exposed* 106 (20)
30.2 (21.5–38.9)
12.2 (9.1–16.1)
< 0.001
HIV PCR positive* 30 (5.7) 30 (13.6–46.4) 15.4 (12.2–18.6) 0.036
Recurrent
admission
52 (9.8) 11.5 (2.8–20.1) 16.8 (13.4–20.2) 0.604
Post cardiac arrest* 34 (6.4) 47 (30.2–63.8) 13.4 (10.4–16.4) < 0.001
Intubated and
ventilated
471 (89) 17.2 (13.8–20.6) 8.6 (1.3-15.8) 0.095
Surgical patients* 305 (57.7) 9.8 (6.3–13.3) 25.0 (19.3–30.7) < 0.001
Post-operative* 239 (45.2) 7.5 (4.2–10.8) 23.6 (18.7–28.6) < 0.001
Trauma 75 (14.2) 18.6 (9.8–27.4) 15.8 (12.4–19.2) 0.542
Inotropic support* 53 (10.0) 60.4 (47.2–73.6) 11.2 (8.3–14.1) < 0.001
Upper respiratory
tract*
61 (11.5) 6.5 (0.3–12.7) 17.5 (14.6–20.9) 0.029
Lower respiratory
tract*
191 (36.1) 25.6 (19.4–31.8) 10.9 (7.6–14.2) < 0.001
Cardiovascular* 97 (18.3) 28.9 (19.9–37.9) 13.4 (10.2–16.6) < 0.001
Page 10 of 25
For peer review only - http://bmjopen.bmj.com/site/about/guidelines.xhtml
BMJ Open
123456789101112131415161718192021222324252627282930313233343536373839404142434445464748495051525354555657585960
on June 5, 2020 by guest. Protected by copyright.
http://bmjopen.bm
j.com/
BM
J Open: first published as 10.1136/bm
jopen-2015-010850 on 3 June 2016. Dow
nloaded from
For peer review only
11
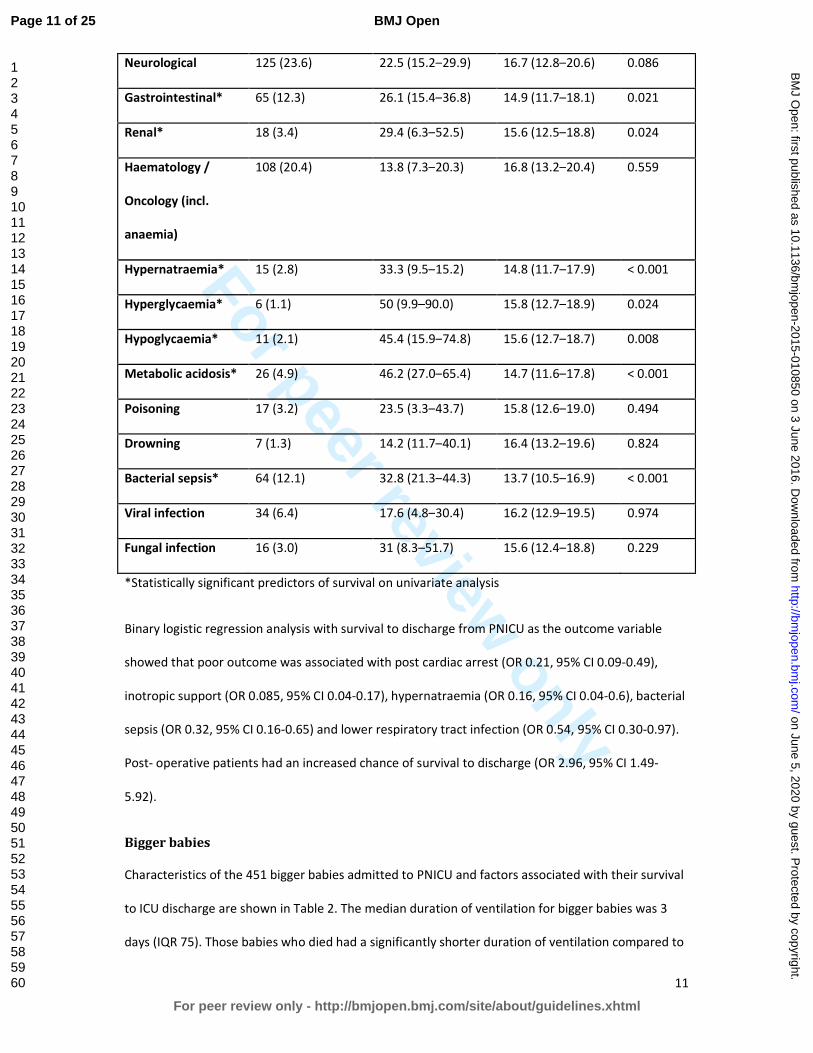
*Statistically significant predictors of survival on univariate analysis
Binary logistic regression analysis with survival to discharge from PNICU as the outcome variable
showed that poor outcome was associated with post cardiac arrest (OR 0.21, 95% CI 0.09-0.49),
inotropic support (OR 0.085, 95% CI 0.04-0.17), hypernatraemia (OR 0.16, 95% CI 0.04-0.6), bacterial
sepsis (OR 0.32, 95% CI 0.16-0.65) and lower respiratory tract infection (OR 0.54, 95% CI 0.30-0.97).
Post- operative patients had an increased chance of survival to discharge (OR 2.96, 95% CI 1.49-
5.92).
Bigger babies
Characteristics of the 451 bigger babies admitted to PNICU and factors associated with their survival
to ICU discharge are shown in Table 2. The median duration of ventilation for bigger babies was 3
days (IQR 75). Those babies who died had a significantly shorter duration of ventilation compared to
Neurological 125 (23.6) 22.5 (15.2–29.9) 16.7 (12.8–20.6) 0.086
Gastrointestinal* 65 (12.3) 26.1 (15.4–36.8) 14.9 (11.7–18.1) 0.021
Renal* 18 (3.4) 29.4 (6.3–52.5) 15.6 (12.5–18.8) 0.024
Haematology /
Oncology (incl.
anaemia)
108 (20.4) 13.8 (7.3–20.3) 16.8 (13.2–20.4) 0.559
Hypernatraemia* 15 (2.8) 33.3 (9.5–15.2) 14.8 (11.7–17.9) < 0.001
Hyperglycaemia* 6 (1.1) 50 (9.9–90.0) 15.8 (12.7–18.9) 0.024
Hypoglycaemia* 11 (2.1) 45.4 (15.9–74.8) 15.6 (12.7–18.7) 0.008
Metabolic acidosis* 26 (4.9) 46.2 (27.0–65.4) 14.7 (11.6–17.8) < 0.001
Poisoning 17 (3.2) 23.5 (3.3–43.7) 15.8 (12.6–19.0) 0.494
Drowning 7 (1.3) 14.2 (11.7–40.1) 16.4 (13.2–19.6) 0.824
Bacterial sepsis* 64 (12.1) 32.8 (21.3–44.3) 13.7 (10.5–16.9) < 0.001
Viral infection 34 (6.4) 17.6 (4.8–30.4) 16.2 (12.9–19.5) 0.974
Fungal infection 16 (3.0) 31 (8.3–51.7) 15.6 (12.4–18.8) 0.229
Page 11 of 25
For peer review only - http://bmjopen.bmj.com/site/about/guidelines.xhtml
BMJ Open
123456789101112131415161718192021222324252627282930313233343536373839404142434445464748495051525354555657585960
on June 5, 2020 by guest. Protected by copyright.
http://bmjopen.bm
j.com/
BM
J Open: first published as 10.1136/bm
jopen-2015-010850 on 3 June 2016. Dow
nloaded from

For peer review only
12
survivors (2 days (IQR 6) vs 4 days (IQ R6); p < 0.001). The mean gestational age of bigger babies
admitted to PNICU was 36.97 ± 3.6 weeks and mean birth weight was 2,603 ± 736 grams. There
were no statistically significant differences between survivors and non-survivors in gestational age
(36.89 ± 3.6 weeks vs 37.23 ± 3.5 weeks; p = 0.404) or birth weight (2,617 ± 763 grams vs 2,576 ±
663 grams; p = 0.615). Just over one third of bigger babies (34.3%) were surgical patients.
Table 2
Characteristics and predictors of survival in 451 bigger babies admitted to CMJAH PNICU between
1 January 2013 and 30 June 2015
Variable Number of children
Percentage of
babies with the
condition that died
(95% CI)
Percentage of
babies without
the condition that
died (95% CI)
p value
Place of birth:
Another unit
Before arrival
CMJAH
220 (48.7)
14 (3.1)
186 (41.2)
34.1 (27.8–40.4)
28.6 (4.9 – 52.3)
30.1 (23.5 – 36.7)
0.577
Antenatal care 302 (67) 27.2 (22.2–32.2) 26.8 (18.0–35.6) 0.827
Maternal HIV 127 (28.2) 32.3 (24.2-40.4) 24.9 (20.0-29.9) 0.231
Caesarean section 169 (37.4) 23.6 (17.0–30.2) 32.9 (25.9–40.0) 0.31
Male 274 (60.8) 27.7 (22.4–33.0) 25.3 (18.8–31.8) 0.491
Resuscitated at birth 98 (21.7) 28.6 (19.7–37.6) 26.1 (21.5–30.7) 0.619
Early onset sepsis 20 (4.4) 20 (2.5–37.5) 27.1 (22.8–31.4) 0.664
Meconium aspiration 75 (16.6) 25.3 (15.5–35.1) 26.9 (22.4–31.4) 0.784
Hyaline membrane
disease*
89 (19.7) 16.9 (9.1–24.7) 29.0 (24.3–33.7) 0.02
Page 12 of 25
For peer review only - http://bmjopen.bmj.com/site/about/guidelines.xhtml
BMJ Open
123456789101112131415161718192021222324252627282930313233343536373839404142434445464748495051525354555657585960
on June 5, 2020 by guest. Protected by copyright.
http://bmjopen.bm
j.com/
BM
J Open: first published as 10.1136/bm
jopen-2015-010850 on 3 June 2016. Dow
nloaded from

For peer review only
13
PPHN1*
45 (10.0) 46.7 (32.1–61.3) 24.4 (20.2–28.6) 0.002
Surfactant therapy 108 (23.9) 21.3 (13.4–29.0) 28.7 (13.4–29.0) 0.518
Hypotension requiring
inotropes*
55 (12.2) 54.5 (41.3–67.7) 22.7 (18.6–26.8) < 0.001
CHD2* 37 (8.2) 54.1 (38.0–70.2) 25.3 (21.1–29.5) <0.001
NEC3 43 (9.5) 37.2 (22.8–51.7) 25.3 (21.1–29.5) 0.35
Surgery (excluding
NEC)
129 (28.6) 23.3 (16.0–30.6) 28.0 (23.1–32.9) 0.395
Hyperglycaemia* 46 (10.2) 41.3 (27.1–55.5) 24.9 (20.7–29.1) 0.017
Metabolic acidosis* 48 (10.6) 56.3 (42.3–70.3) 23.1 (19.0–27.2) < 0.001
Late onset sepsis 119 (26.4) 29.4 (21.2–37.6) 25.6 (20.9–30.3) 0.420
Major birth defect* 146 (32.4) 36.3 (28.5–44.1) 22.0 (17.4–26.7) 0.002
*Statistically significant predictors of survival on univariate analysis
1. PPHN Persistent pulmonary hypertension of the neonate
2. CHD congenital heart disease
3. NEC necrotising enterocolitis
Binary logistic regression analysis for factors associated with survival in bigger babies showed major
birth defects (OR 0.44, 95%CI 0.26-0.74), PPHN (OR 0.44, 95% CI 0.21–0.91) metabolic acidosis (OR
0.23, 95% CI 0.12–0.74), inotropic support (OR 0.23, 95% CI 0.12–0.45) and CHD (OR 0.29, 95% CI
0.13–0.62) were all predictive of poor survival.
Very low birth weight babies
Characteristics of the 292 VLBW babies admitted to the PNICU are shown in Table 3. The mean birth
weight was 1,133.2 ± 182 grams and mean gestational age 28.95 ± 8.17 weeks. There were no
statistically significant differences between survivors and non-survivors in mean birth weight (1,149
± 182 vs 1,109 ± 180 grams; p = 0.063) or gestational age (29.01 ± 2.1 vs 28.86 ± 2.1 weeks; p
Page 13 of 25
For peer review only - http://bmjopen.bmj.com/site/about/guidelines.xhtml
BMJ Open
123456789101112131415161718192021222324252627282930313233343536373839404142434445464748495051525354555657585960
on June 5, 2020 by guest. Protected by copyright.
http://bmjopen.bm
j.com/
BM
J Open: first published as 10.1136/bm
jopen-2015-010850 on 3 June 2016. Dow
nloaded from

For peer review only
14
=0.540). The median duration of ventilation was 5 days (IQR 8). The duration of ventilation was
significantly shorter in VLBW babies who died (4 days (IQR 10) vs 6 days (IQR 7); p < 0.001).
Table 3
Characteristics and predictors of survival for 292 VLBW babies admitted to the CMJAH PNICU
between 1 January 2013 and 30 June 2015
Variable
Number of babies
with the condition
Percentage of
babies with the
condition that
died (95% CI)
Percentage of
babies without
the condition that
died (95% CI)
p value
Place of birth*
Born before arrival
Born at another unit
Born at CMJAH
19 (6.5)
97 (33.2)
176 (60.3)
68.4 (47.5–89.3)
32.0 (22.7–41.3)
43.8 (36.5–51.1)
0.008
Antenatal care 171 (58.6) 39.8 (32.5–47.1) 43.8 (35.0–52.6) 0.49
Antenatal steroids 86 (29.5) 43.0 (32.5–53.5) 40.8 (34.1–47.5) 0.722
Maternal HIV 98 (33.6) 49.0 (39.1–58.9) 37.6 (30.8–44.4) 0.063
Caesarean section 124 (42.5) 39.5 (30.9–48.1) 44.2 (35.7–52.7) 0.817
Male 164 (56.2) 42.7 (35.1–50.3) 40.2 (31.7–48.7) 0.638
Resuscitated at birth 112 (38.4) 50.9 (41.6–60.2) 35.6 (28.6–42.6) 0.099
Early onset sepsis 10 (3.4) 60 (29.6–90.4) 39.8 (33.9–45.7) 0.358
IVH1 ¾* 32 (10.9) 53.1 (35.8–70.4) 33.3 (26.6–40.0) < 0.001
Hyaline membrane disease 268 (91.8) 41.4 (35.5–47.3) 41.6 (21.9–61.3) 0.981
Surfactant 228 (78.1) 39.9 (33.5–46.3) 46.9 (34.7–59.1) 0.318
Patent ductus arteriosus* 83 (28.4) 26.5 (17.0–36.0) 47.3 (40.5–54.1) < 0.001
NEC2* 72 (24.7) 62.5 (51.3–73.7) 34.5 (28.2–40.8) < 0.001
Page 14 of 25
For peer review only - http://bmjopen.bmj.com/site/about/guidelines.xhtml
BMJ Open
123456789101112131415161718192021222324252627282930313233343536373839404142434445464748495051525354555657585960
on June 5, 2020 by guest. Protected by copyright.
http://bmjopen.bm
j.com/
BM
J Open: first published as 10.1136/bm
jopen-2015-010850 on 3 June 2016. Dow
nloaded from

For peer review only
15
NEC surgery* 39 (13.4) 56.4 (40.8–72.0) 39.1 (33.1–45.1) 0.041
Other surgery 36 (12.3) 50 (33.7–66.3) 40.2 (34.2–46.2) 0.265
Blood transfusion 88 (30.1) 38.7 (32.0–45.4) 47.7 (37.3–58.1) 0.152
Hyperglycaemia 68 (22.3) 51.5 (39.6–63.4) 38.4 (32.0–44.8) 0.055
Hypoglycaemia 38 (13.0) 42.1 (26.4–57.8) 41.3 (35.2–47.4) 0.929
Hypernatraemia 22 (7.5) 40.9 (20.4–61.4) 41.5 (35.6–47.4) 0.958
Metabolic acidosis* 39 (13.4) 19.2 (54.7–83.7) 37.2 (31.2-43.2) < 0.001
Late onset sepsis 142 (48.6) 39.3 (31.5–47.1) 43.7 (35.5–51.9) 0.453
Major birth defect 19 (6.5) 42.1 (19.9–64.3) 41.4 (36.4–46.4) 0.951
*Statistically significant predictors of survival on univariate analysis
1. IVH intraventricular haemorrhage
2. NEC necrotising enterocolitis
Binary logistic regression showed that the following factors were associated with reduced survival in
VLBW babies: birthweight (OR 0.997, 95% CI 0.995–0.999), born before arrival (OR 0.21, 95%CI 0.05–
0.84), maternal HIV exposure (OR 0.54, 95%CI 0.30–0.99), resuscitation at birth (OR 0.49, 95% CI
0.25–0.94), metabolic acidosis (OR 0.25, 95% CI 0.10–0.60) and NEC (OR 0.23, 95% CI 0.12–0.46).
DISCUSSION
This review of admissions to a combined PNICU shows an overall mortality rate of 25.7%. The
paediatric mortality rate was 16.2%, which is higher than the mortality rate at the dedicated
paediatric ICU at Red Cross Children’s Hospital[3], but lower than that reported for children
admitted to general ICUs in other African countries.[7,8,9]
Possible reasons for the high mortality rate in this study may lie outside the PNICU, such as late
referral and inadequate resuscitation, or within, such as insufficient beds and inadequate staffing.
The lack of a paediatric intensivist may contribute to the mortality rate; dedicated paediatric
intensivists reduce the mortality rate of children in ICU and improve the utilisation of beds.[16] The
Page 15 of 25
For peer review only - http://bmjopen.bmj.com/site/about/guidelines.xhtml
BMJ Open
123456789101112131415161718192021222324252627282930313233343536373839404142434445464748495051525354555657585960
on June 5, 2020 by guest. Protected by copyright.
http://bmjopen.bm
j.com/
BM
J Open: first published as 10.1136/bm
jopen-2015-010850 on 3 June 2016. Dow
nloaded from

For peer review only
16
PNICU in this study was run mainly as a ventilator unit, with very few high care admissions, so a
sicker cohort of children may have been admitted to the CMJAH PNICU compared with other PICUs.
Mortality risk scores such as the PIM allow proper comparisons between different units.[17]
Although PIM data were not collected during the study period, predictors of poor outcome were
similar to the PIM, including post cardiac arrest, inotropic support and metabolic acidosis.[17]
The mortality was higher in neonates than paediatric patients. Mortality of ventilated neonates was
similar to that reported from units in India.[18] The very high mortality of the VLBW group in the
PNICU is not surprising as these patients had failed initial NCPAP and were therefore very sick
babies; the mortality rate of VLBW infants was similar to that reported for ventilated VLBW babies in
a study in China.[19] Birthweight, the strongest predictor of outcome in VLBW infants in our setting
[20], remained a significant factor associated with survival in the ventilated VLBW babies.
Both HIV infection and HIV exposure were significant predictors of outcome in the univariate
analysis, but not in the logistic regression. There is, however, selection bias, as only those HIV-
exposed infants who were expected to recover were admitted to the PNICU.
There were some apparent anomalies in our data. The low incidence of viral infections and
hyperglycaemia may reflect lack of active surveillance for these conditions. The low number of
fungal isolates may be explained by the fact that fungal organisms are difficult to isolate on
paediatric low volume blood cultures.
We found that the use of NCPAP had a big impact on the need for ventilator beds in the unit. An
additional 1,046 babies were treated successfully with NCPAP in a neonatal ward without requiring
admission to PNICU. We therefore recommend that the use of non-invasive ventilation provided in a
general ward, such as NCPAP, should be expanded to older children.
This study raises the issue of children’s rights to healthcare. A report from 2007 showed that only a
fraction of ICU beds in South Africa are dedicated to the care of children.[12] Our study raises the
issue of balancing the rights of older children and neonates in a combined unit. Only the very sickest
Page 16 of 25
For peer review only - http://bmjopen.bmj.com/site/about/guidelines.xhtml
BMJ Open
123456789101112131415161718192021222324252627282930313233343536373839404142434445464748495051525354555657585960
on June 5, 2020 by guest. Protected by copyright.
http://bmjopen.bm
j.com/
BM
J Open: first published as 10.1136/bm
jopen-2015-010850 on 3 June 2016. Dow
nloaded from

For peer review only
17
neonates were admitted to the PNICU, which may be a form of discrimination. There are no easy
ways to identify which patients to admit to PNICU, especially in a resource-limited setting.[1,3]
Children must not come to ICU to die, yet many who are critically ill, with an increased risk of death,
may have a better chance of recovery if treated in ICU. We found that post-operative patients had
good outcomes, which may reflect the optimal use of ventilator beds in this unit, or may indicate
that many of these patients did not require ICU. Increasing the number of “high care” admissions,
would decrease the PNICU mortality rate, but this would often be at the expense of a sicker child
requiring ventilation.
This study had several limitations. The raw proportion of deaths in the CMJAH PNICU is higher than
other units, but may reflect a different level of severity of illness. As with all retrospective analysis,
not all information was available for inclusion in the study. The use of a standardised illness code
such as the ANZPIC system would have been preferable.[21]
CONCLUSIONS AND RECOMMENDATIONS
The unadjusted mortality rate of children admitted to this PNICU is higher than that reported in a
dedicated PICU in the same country.[3] Incorporation of a paediatric intensivist, even in poorer
countries, improves the outcome for children, both in terms of mortality and length of stay. [10,16]
Ongoing PICU training for all paediatric registrars, general paediatricians and other subspecialists is
recommended. Future clinical audit is should include a severity of illness score such as the PIM [21],
hospital paediatric mortality rate and the number of children denied admission to PNICU, together
with outcome data.
Page 17 of 25
For peer review only - http://bmjopen.bmj.com/site/about/guidelines.xhtml
BMJ Open
123456789101112131415161718192021222324252627282930313233343536373839404142434445464748495051525354555657585960
on June 5, 2020 by guest. Protected by copyright.
http://bmjopen.bm
j.com/
BM
J Open: first published as 10.1136/bm
jopen-2015-010850 on 3 June 2016. Dow
nloaded from

For peer review only
18
References
1. Basnet S, Adhikari N, Koirala J. Challenges in setting up pediatric and neonatal intensive care units
in a resource-limited country. Pediatrics 2011;128(4):e986-92 doi: 10.1542/peds.2010-
3657[published Online First: Epub Date]|.
2. Koroglu TF, Atasever S, Duman M. A survey of pediatric intensive care services in Turkey. Turk J
Pediatr 2008;50(1):12-7
3. Argent AC, Ahrens J, Morrow BM, et al. Pediatric intensive care in South Africa: an account of
making optimum use of limited resources at the Red Cross War Memorial Children's
Hospital. Pediatr Crit Care Med 2014;15(1):7-14 doi:
10.1097/pcc.0000000000000029[published Online First: Epub Date]|.
4. Rosenthal VD, Jarvis WR, Jamulitrat S, et al. Socioeconomic impact on device-associated infections
in pediatric intensive care units of 16 limited-resource countries: international Nosocomial
Infection Control Consortium findings. Pediatr Crit Care Med 2012;13(4):399-406 doi:
10.1097/PCC.0b013e318238b260[published Online First: Epub Date]|.
5. Campos-Mino S, Sasbon JS, von Dessauer B. [Pediatric intensive care in Latin America]. Medicina
intensiva 2012;36(1):3-10 doi: 10.1016/j.medin.2011.07.004[published Online First: Epub
Date]|.
6. Ghani AS, Morrow BM, Hardie DR, et al. An investigation into the prevalence and outcome of
patients admitted to a pediatric intensive care unit with viral respiratory tract infections in
Cape Town, South Africa. Pediatr Crit Care Med 2012;13(5):e275-81 doi:
10.1097/PCC.0b013e3182417848[published Online First: Epub Date]|.
7. Embu HY, Yiltok SJ, Isamade ES, et al. Paediatric admissions and outcome in a general intensive
care unit. Afr J Paediatr Surg 2011;8(1):57-61 doi: 10.4103/0189-6725.78670[published
Online First: Epub Date]|.
8. El-Nawawy A. Evaluation of the outcome of patients admitted to the pediatric intensive care unit
in Alexandria using the pediatric risk of mortality (PRISM) score. J Trop Pediatr
2003;49(2):109-14
9. Kwizera A, Dunser M, Nakibuuka J. National intensive care unit bed capacity and ICU patient
characteristics in a low income country. BMC Res Notes 2012;5:475 doi: 10.1186/1756-0500-
5-475[published Online First: Epub Date]|.
10. Pearson G, Shann F, Barry P, et al. Should paediatric intensive care be centralised? Trent versus
Victoria. Lancet 1997;349(9060):1213-7 doi: 10.1016/s0140-6736(96)12396-5[published
Online First: Epub Date]|.
11. Goh AY, Lum LC, Abdel-Latif ME. Impact of 24 hour critical care physician staffing on case-mix
adjusted mortality in paediatric intensive care. Lancet 2001;357(9254):445-6 doi:
10.1016/s0140-6736(00)04014-9[published Online First: Epub Date]|.
12. Bhagwanjee S, Scribante J. National audit of critical care resources in South Africa - unit and bed
distribution. S Afr Med J 2007;97(12 Pt 3):1311-4
13. Naidoo K, Singh J, Lalloo U. A critical analysis of ICU/HC beds in South Africa: 2008-2009. S Afr
Med J 2013;103(10):751-3 doi: 10.7196/samj.6415[published Online First: Epub Date]|.
14. Jardine C, Ballot DE. The use of nasal CPAP at Charlotte Maxeke Johannesburg Academic
Hospital. S Afr J Child Health 2015;9(1):4
15. Harris PA, Taylor R, Thielke R, et al. Research electronic data capture (REDCap)—A metadata-
driven methodology and workflow process for providing translational research informatics
support. J Biomed Inform 2009;42(2):377-81 doi:
http://dx.doi.org/10.1016/j.jbi.2008.08.010[published Online First: Epub Date]|.
16. Pollack MM, Katz RW, Ruttimann UE, et al. Improving the outcome and efficiency of intensive
care: the impact of an intensivist. Crit Care Med 1988;16(1):11-7
17. Straney L, Clements A, Parslow RC, et al. Paediatric index of mortality 3: an updated model for
predicting mortality in pediatric intensive care*. Pediatr Crit Care Med 2013;14(7):673-81
doi: 10.1097/PCC.0b013e31829760cf[published Online First: Epub Date]|.
Page 18 of 25
For peer review only - http://bmjopen.bmj.com/site/about/guidelines.xhtml
BMJ Open
123456789101112131415161718192021222324252627282930313233343536373839404142434445464748495051525354555657585960
on June 5, 2020 by guest. Protected by copyright.
http://bmjopen.bm
j.com/
BM
J Open: first published as 10.1136/bm
jopen-2015-010850 on 3 June 2016. Dow
nloaded from

For peer review only
19
18. Iqbal Q, Younus MM, Ahmed A, et al. Neonatal mechanical ventilation: Indications and outcome.
Ind J Crit Care Med 2015;19(9):523-7 doi: 10.4103/0972-5229.164800[published Online First:
Epub Date]|.
19. Ma L, Liu CQ, Meng LZ, et al. [Prospective study on in-hospital mortality and its risk factors in
very low birth weight infants requring mechanical ventilation]. Zhongguo Dang Dai Er Ke Za
Zhi 2012;14(10):737-41
20. Ballot DE, Chirwa T, Ramdin T, et al. Comparison of morbidity and mortality of very low birth
weight infants in a Central Hospital in Johannesburg between 2006/2007 and 2013. BMC
Pediatr 2015;15:20 doi: 10.1186/s12887-015-0337-4[published Online First: Epub Date]|.
21. Slater A, Shann F, McEniery J. The ANZPIC registry diagnostic codes: a system for coding reasons
for admitting children to intensive care. Intensive Care Med 2003;29(2):271-7 doi:
10.1007/s00134-002-1600-3[published Online First: Epub Date]|.
Page 19 of 25
For peer review only - http://bmjopen.bmj.com/site/about/guidelines.xhtml
BMJ Open
123456789101112131415161718192021222324252627282930313233343536373839404142434445464748495051525354555657585960
on June 5, 2020 by guest. Protected by copyright.
http://bmjopen.bm
j.com/
BM
J Open: first published as 10.1136/bm
jopen-2015-010850 on 3 June 2016. Dow
nloaded from
For peer review only
20
Figure 1
Ventilatory support in neonates admitted to CMJAH between 1 January 2013 and 30 June 2015
Key: NCPAP nasal continuous positive airways pressure; IPPV intermittent positive pressure
ventilation
Page 20 of 25
For peer review only - http://bmjopen.bmj.com/site/about/guidelines.xhtml
BMJ Open
123456789101112131415161718192021222324252627282930313233343536373839404142434445464748495051525354555657585960
on June 5, 2020 by guest. Protected by copyright.
http://bmjopen.bm
j.com/
BM
J Open: first published as 10.1136/bm
jopen-2015-010850 on 3 June 2016. Dow
nloaded from

For peer review only
Figure 1
Ventilatory support in neonates admitted to CMJAH between 1 January 2013 and 30 June 2015
Key: NCPAP nasal continuous positive airways pressure; IPPV intermittent positive pressure ventilation
127x76mm (150 x 150 DPI)
Page 21 of 25
For peer review only - http://bmjopen.bmj.com/site/about/guidelines.xhtml
BMJ Open
123456789101112131415161718192021222324252627282930313233343536373839404142434445464748495051525354555657585960
on June 5, 2020 by guest. Protected by copyright.
http://bmjopen.bm
j.com/
BM
J Open: first published as 10.1136/bm
jopen-2015-010850 on 3 June 2016. Dow
nloaded from

For peer review only
Paediatric ICU in South Africa
There are many challenges with the provision of paediatric intensive care in South Africa.
Inadequate funding may result in insufficient or poorly maintained equipment, lack of adequately
trained staff and limited supplies of expensive medicines. Patients are often severely ill, present late
and suffer from multi-system diseases. Regional hospitals frequently do not have ICU facilities, so
tertiary centres receive referrals from a wide geographic area.
Severity of illness scores have been developed using predictors of poor outcome such as metabolic
acidosis and cardiac arrest. Two such scores are the Paediatric Risk of Mortality (PRISM)[10] and
Paediatric Index of Mortality (PIM)[11]. These scores are not designed for triage but are useful for
quality control, health planning and comparing the performance of different units[12]. These
severity of illness scores were developed in richer countries and standardised on the basis of data
from these countries. LMICs may have a different profile of patients and different outcomes. In a
recent study, however, Solomon et al [13] demonstrated that the PIM2 score was both accurate and
well calibrated in a South African PICU.
The HIV epidemic in South Africa has further complicated the question of admission criteria to PICU.
Both HIV exposure and infection are predictive of increased mortality in PICU [6]. Kitchin et al [14]
reported a case fatality rate of 30% for HIV-exposed children ventilated for respiratory failure.
Cytomegalovirus co-infection seemed to confer a worse outcome, although the mechanism of this is
unclear. In 2007, children with established HIV infection and “whose lives are in danger from AIDS-
related disease” had a poor prognosis and were not admitted to PICU.[3] Children established on
antiretroviral therapy and with an unrelated reason for PICU admission were, however suitable for
admission. More recently, with the advent of readily available antiretroviral therapy for children, this
approach may no longer be appropriate.
The PNICU was staffed by a PNICU consultant on call; the resident staff included two paediatric
registrars and a medical officer. After hours, a resident registrar and medical officer cover PNICU and
the whole neonatal service. Nurse to patient ratios follow neonatal norms – of 1 nurse to 2 patients.
Hypernatraemia was defined as 150 mmol/l, but most patients who died with the condition had
much higher levels of sodium. Congenital heart disease associated with mortality included
hypoplastic left heart syndrome and various complex congenital heart defects.
Comment [M1]: This statement also needs a
reference.
Comment [M2]: Again, this statement needs a
reference.
Comment [M3]: This statement also needs a
reference.
Comment [M4]: In your abstract, you mention
that you did not use severity of illness scores during
the study. You could, therefore, delete this
paragraph to reduce the word count.
Comment [M5]: Again, this paragraph could be
reduced to reduce word count. You might consider
online-only content discussing ‘Admission criteria to
PICU in African countries’ or similar.
Page 22 of 25
For peer review only - http://bmjopen.bmj.com/site/about/guidelines.xhtml
BMJ Open
123456789101112131415161718192021222324252627282930313233343536373839404142434445464748495051525354555657585960
on June 5, 2020 by guest. Protected by copyright.
http://bmjopen.bm
j.com/
BM
J Open: first published as 10.1136/bm
jopen-2015-010850 on 3 June 2016. Dow
nloaded from

For peer review only
Children who had a poor chance of survival or risk of severe neurological handicap were not
routinely admitted to the PNICU. HIV-exposed children not in multi-organ failure were admitted to
the PICU during the study period. Neonates weighing less than 900 grams at birth were not
routinely admitted to PNICU during the study period.
Page 23 of 25
For peer review only - http://bmjopen.bmj.com/site/about/guidelines.xhtml
BMJ Open
123456789101112131415161718192021222324252627282930313233343536373839404142434445464748495051525354555657585960
on June 5, 2020 by guest. Protected by copyright.
http://bmjopen.bm
j.com/
BM
J Open: first published as 10.1136/bm
jopen-2015-010850 on 3 June 2016. Dow
nloaded from

For peer review only
1
STROBE Statement—Checklist of items that should be included in reports of cross-sectional studies
Item
No Recommendation
Page
Title and abstract 1 (a) Indicate the study’s design with a commonly used term in the title or the
abstract
4
(b) Provide in the abstract an informative and balanced summary of what was
done and what was found
4
Introduction
Background/rationale 2 Explain the scientific background and rationale for the investigation being
reported
6,7
Objectives 3 State specific objectives, including any prespecified hypotheses 7
Methods
Study design 4 Present key elements of study design early in the paper 7
Setting 5 Describe the setting, locations, and relevant dates, including periods of
recruitment, exposure, follow-up, and data collection
7
Participants 6 (a) Give the eligibility criteria, and the sources and methods of selection of
participants
7
Variables 7 Clearly define all outcomes, exposures, predictors, potential confounders,
and effect modifiers. Give diagnostic criteria, if applicable
7
Data sources/
measurement
8* For each variable of interest, give sources of data and details of methods of
assessment (measurement). Describe comparability of assessment methods if
there is more than one group
Supplementary
file
Bias 9 Describe any efforts to address potential sources of bias
Study size 10 Explain how the study size was arrived at 7
Quantitative
variables
11 Explain how quantitative variables were handled in the analyses. If
applicable, describe which groupings were chosen and why
8
Statistical methods 12 (a) Describe all statistical methods, including those used to control for
confounding
8
(b) Describe any methods used to examine subgroups and interactions
(c) Explain how missing data were addressed
(d) If applicable, describe analytical methods taking account of sampling
strategy
(e) Describe any sensitivity analyses
Results 9 to 14
Participants 13* (a) Report numbers of individuals at each stage of study—eg numbers
potentially eligible, examined for eligibility, confirmed eligible, included in
the study, completing follow-up, and analysed
(b) Give reasons for non-participation at each stage
(c) Consider use of a flow diagram
Descriptive data 14* (a) Give characteristics of study participants (eg demographic, clinical,
social) and information on exposures and potential confounders
(b) Indicate number of participants with missing data for each variable of
interest
Outcome data 15* Report numbers of outcome events or summary measures
Main results 16 (a) Give unadjusted estimates and, if applicable, confounder-adjusted
estimates and their precision (eg, 95% confidence interval). Make clear
which confounders were adjusted for and why they were included
Page 24 of 25
For peer review only - http://bmjopen.bmj.com/site/about/guidelines.xhtml
BMJ Open
123456789101112131415161718192021222324252627282930313233343536373839404142434445464748495051525354555657585960
on June 5, 2020 by guest. Protected by copyright.
http://bmjopen.bm
j.com/
BM
J Open: first published as 10.1136/bm
jopen-2015-010850 on 3 June 2016. Dow
nloaded from

For peer review only
2
(b) Report category boundaries when continuous variables were categorized
(c) If relevant, consider translating estimates of relative risk into absolute risk
for a meaningful time period
Other analyses 17 Report other analyses done—eg analyses of subgroups and interactions, and
sensitivity analyses
Discussion
Key results 18 Summarise key results with reference to study objectives 15
Limitations 19 Discuss limitations of the study, taking into account sources of potential bias
or imprecision. Discuss both direction and magnitude of any potential bias
17
Interpretation 20 Give a cautious overall interpretation of results considering objectives,
limitations, multiplicity of analyses, results from similar studies, and other
relevant evidence
17
Generalisability 21 Discuss the generalisability (external validity) of the study results
Other information
Funding 22 Give the source of funding and the role of the funders for the present study
and, if applicable, for the original study on which the present article is based
2
*Give information separately for exposed and unexposed groups.
Note: An Explanation and Elaboration article discusses each checklist item and gives methodological background and
published examples of transparent reporting. The STROBE checklist is best used in conjunction with this article (freely
available on the Web sites of PLoS Medicine at http://www.plosmedicine.org/, Annals of Internal Medicine at
http://www.annals.org/, and Epidemiology at http://www.epidem.com/). Information on the STROBE Initiative is
available at www.strobe-statement.org.
Page 25 of 25
For peer review only - http://bmjopen.bmj.com/site/about/guidelines.xhtml
BMJ Open
123456789101112131415161718192021222324252627282930313233343536373839404142434445464748495051525354555657585960
on June 5, 2020 by guest. Protected by copyright.
http://bmjopen.bm
j.com/
BM
J Open: first published as 10.1136/bm
jopen-2015-010850 on 3 June 2016. Dow
nloaded from

For peer review only
A RETROSPECTIVE CROSS SECTIONAL REVIEW OF
SURVIVAL RATES IN CRITICALLY ILL CHILDREN ADMITTED
TO A COMBINED PAEDIATRIC / NEONATAL INTENSIVE CARE
UNIT IN JOHANNESBURG, SOUTH AFRICA, 2013-2015
Journal: BMJ Open
Manuscript ID bmjopen-2015-010850.R1
Article Type: Research
Date Submitted by the Author: 19-Feb-2016
Complete List of Authors: Ballot, Daynia E.; Univ Witwatersrand, Paediatrics and Child Health Davies, Victor; University of the Witwatersrand, Paediatrics and Child Health Cooper, Peter; University of the Witwatersrand, Paediatrics and Child Health Chirwa, Tobias; University of the Witwatersrand, School of Public Health Argent, Andrew; Red Cross War Memorial Childrens Hospital, Paediatric Intensive Care Unit Mer, Mervyn; University of the Witwatersrand, Internal Medicine
<b>Primary Subject
Heading</b>: Paediatrics
Secondary Subject Heading: Intensive care, Epidemiology
Keywords: Paediatric intensive & critical care < PAEDIATRICS, NEONATOLOGY, HEALTH SERVICES ADMINISTRATION & MANAGEMENT
For peer review only - http://bmjopen.bmj.com/site/about/guidelines.xhtml
BMJ Open on June 5, 2020 by guest. P
rotected by copyright.http://bm
jopen.bmj.com
/B
MJ O
pen: first published as 10.1136/bmjopen-2015-010850 on 3 June 2016. D
ownloaded from

For peer review only
1
A RETROSPECTIVE CROSS SECTIONAL REVIEW OF SURVIVAL RATES IN
CRITICALLY ILL CHILDREN ADMITTED TO A COMBINED PAEDIATRIC /
NEONATAL INTENSIVE CARE UNIT IN JOHANNESBURG, SOUTH AFRICA,
2013-2015
Daynia E Ballot1, 4*
Victor A Davies1
Peter A Cooper 1
Tobias Chirwa 2
Andrew Argent3
Mervyn Mer4, 5
1. Department of Paediatrics and Child Health, Faculty of Health Sciences, University of the
Witwatersrand, Johannesburg, South Africa
2. Division of Epidemiology and Biostatistics, School of Public Health, Faculty of Health
Sciences, University of the Witwatersrand, Johannesburg, South Africa
3. School of Child and Adolescent Health, Faculty of Health Sciences, University of Cape Town,
Cape Town, South Africa
4. Wits- UQ Critical Care Infection Collaboration, Johannesburg South Africa
5. Department of Internal Medicine, Division of Critical Care and Pulmonology Faculty of Health
Sciences, University of the Witwatersrand, Johannesburg, South Africa
∗ Corresponding author
Postal address
Private Bag X 39
Johannesburg
Page 1 of 26
For peer review only - http://bmjopen.bmj.com/site/about/guidelines.xhtml
BMJ Open
123456789101112131415161718192021222324252627282930313233343536373839404142434445464748495051525354555657585960
on June 5, 2020 by guest. Protected by copyright.
http://bmjopen.bm
j.com/
BM
J Open: first published as 10.1136/bm
jopen-2015-010850 on 3 June 2016. Dow
nloaded from

For peer review only
2
2000
Email: [email protected]
Keywords
Intensive care units, neonatal; Intensive care units, paediatric; Critical Care; South Africa
Word count: 2689
Page 2 of 26
For peer review only - http://bmjopen.bmj.com/site/about/guidelines.xhtml
BMJ Open
123456789101112131415161718192021222324252627282930313233343536373839404142434445464748495051525354555657585960
on June 5, 2020 by guest. Protected by copyright.
http://bmjopen.bm
j.com/
BM
J Open: first published as 10.1136/bm
jopen-2015-010850 on 3 June 2016. Dow
nloaded from

For peer review only
3
Contributorship statement
• DE Ballot conceptualised the study, collected and analysed the data and wrote up the
manuscript
• VA Davies assisted with the concept, data collection and reviewed the write up of the
manuscript.
• PA Cooper assisted with the study concept and review of the write up of the manuscript
• T Chirwa assisted with data analysis and review of the write up of the manuscript
• A Argent provided advice and input into the final write up of the manuscript.
• M Mer provided advice and input into the final write up of the manuscript.
Data sharing statement
No additional data is available.
Conflict of interest
The authors declare that they have no conflicts of interest
Funding
There was no funding for the study reported in this article
Acknowledgements
The authors gratefully acknowledge the help of Dr Debbie White, Dr Edgar Kalimba, Dr Priya
Wallabh, Dr Lea Chirwa, Dr Tanusha Ramdin, Dr David Raketsoane and Dr Faustine Agaba with data
collection, and Mr Lebogang Rapola , Miss Patricia Hanrahan and Mr Milton Reinecke with data
management.
Page 3 of 26
For peer review only - http://bmjopen.bmj.com/site/about/guidelines.xhtml
BMJ Open
123456789101112131415161718192021222324252627282930313233343536373839404142434445464748495051525354555657585960
on June 5, 2020 by guest. Protected by copyright.
http://bmjopen.bm
j.com/
BM
J Open: first published as 10.1136/bm
jopen-2015-010850 on 3 June 2016. Dow
nloaded from

For peer review only
4
ABSTRACT
Objective:
Report on survival to discharge of children in a combined paediatric / neonatal intensive care unit
(PNICU)
Design and setting:
Retrospective cross-sectional record review
Participants:
All children (both medical and surgical patients) admitted to PNICU between 1 January 2013 and 30
June 2015.
Outcome measures:
Primary outcome - Survival to discharge.
Secondary outcomes – disease profiles and predictors of mortality in different age categories.
Results
There were 1,454 admissions, 182 missing records, leaving 1,272 admissions for review. Overall
mortality rate was 25.7% (327/1272). Mortality rate was 41.4% (121/292) (95% CI: 35.8-47.1) for
very low birth weight (VLBW) babies, 26.6% (120/451) (95% CI: 22.5-30.5) for bigger babies and
16.2% (86/529) (95%CI 13.1-19.3) for paediatric patients. Risk factors for a reduced chance of
survival to discharge in paediatric patients included post cardiac arrest (OR 0.21 95% CI: 0.09 – 0.49),
inotropic support (OR 0.085, 95% CI: 0.04 – 0.17), hypernatraemia (OR 0.16, 95% CI: 0.04 – 0.6),
bacterial sepsis (OR 0.32, 95% CI: 0.16 – 0.65) and lower respiratory tract infection (OR 0.54, 95% CI:
0.30-0.97). Major birth defects (OR 0.44, 95% CI: 0.26 – 0.74), persistent pulmonary hypertension of
the new born (OR 0.44, 95% CI: 0.21 – 0.91), metabolic acidosis (OR 0.23, 95% CI: 0.12 – 0.74),
inotropic support (OR 0.23, 95% CI: 0.12 – 0.45) and congenital heart defects (OR 0.29, 95% CI: 0.13
Page 4 of 26
For peer review only - http://bmjopen.bmj.com/site/about/guidelines.xhtml
BMJ Open
123456789101112131415161718192021222324252627282930313233343536373839404142434445464748495051525354555657585960
on June 5, 2020 by guest. Protected by copyright.
http://bmjopen.bm
j.com/
BM
J Open: first published as 10.1136/bm
jopen-2015-010850 on 3 June 2016. Dow
nloaded from

For peer review only
5
and 0.62) predicted decreased survival in bigger babies. Birthweight (OR 0.997, 95% CI: 0.995 –
0.999), birth outside the hospital (OR 0.21, 95% CI: 0.05 – 0.84), HIV exposure (OR 0.54, 95% CI: 0.30
– 0.99), resuscitation at birth (OR 0.49, 95% CI 0.25 – 0.94), metabolic acidosis (OR 0.25, 95% CI: 0.10
– 0.60) and necrotising enterocolitis (OR 0.23, 95% CI: 0.12 – 0.46) predicted poor survival in VLBW
babies.
Conclusions
Ongoing mortality review is essential to improve provision of paediatric critical care.
Strengths and limitations of the study
• This is a cross sectional retrospective review of a large sample of critically ill children cared
for in a predominantly neonatal intensive care unit.
• The study adds information about the outcome of critically ill children in sub-Saharan Africa.
• Predictors of mortality are reported for different age categories.
• Severity of illness scoring was not available during the study period, so only unadjusted
mortality rates are reported.
• This was a retrospective analysis of a computerised database, so not all records were
available for inclusion.
Page 5 of 26
For peer review only - http://bmjopen.bmj.com/site/about/guidelines.xhtml
BMJ Open
123456789101112131415161718192021222324252627282930313233343536373839404142434445464748495051525354555657585960
on June 5, 2020 by guest. Protected by copyright.
http://bmjopen.bm
j.com/
BM
J Open: first published as 10.1136/bm
jopen-2015-010850 on 3 June 2016. Dow
nloaded from

For peer review only
6
•
BACKGROUND
The World Health Organisation reports that 5.9 million children under the age of 5 years died in
2015, 75% of whom were infants (under the age of 1 year) and most infants who died were from the
WHO African region.[1] The outcome of critically ill children may be improved by adequate intensive
care. Provision of both paediatric and neonatal intensive care in a low to middle income country
(LMIC) is challenging.[2] Difficulties include lack of medical and nursing staff, insufficient medication
and equipment and inadequate diagnostic facilities.[2, 3] Identifying the optimal use of PICU beds in
a resource-limited situation is difficult. The use of ICU admission criteria attempt to ensure that the
limited facilities benefit those who will gain most; children without a reasonable chance of
functional recovery are not routinely admitted to PICU.[2, 4] Argent et al discussed an approach to
optimising the use of limited PICU facilities at the Red Cross War Memorial Children’s Hospital
(RCWMCH) in Cape Town, South Africa, stating that hospitals need to develop “explicit policies for
utilisation of PICU resources” using “a reasonable process for fair and equitable utilisation of scarce
resources… that may extend beyond the priorities of individual patients”.[4]
Mortality and infection rates in PICU in developing countries are influenced by the income level of
the country.[5] The average PICU mortality rate in Latin American countries was 13.39% compared
to 5.4% in European countries.[6] The mean PICU mortality rate in Turkey was reported to be
14.6%.[3] PICU mortality at the RCWMCH in Cape Town, however, has declined from 10.6% in 2006
to 9% in 2010.[4, 7] The mortality rate of children admitted to general ICU facilities in other African
countries is far higher than the RCWMCH experience, ranging from 36% to 40%.[8-10]
Children admitted to a centralised dedicated paediatric ICU have better survival rates than those
treated in general or shared ICU facilities, even in developing countries.[11, 12] Dedicated PICU
facilities are uncommon in South Africa. Critical care beds in South Africa are concentrated in the
more affluent provinces (Gauteng, Kwa-Zulu Natal and the Western Cape) and in the private
sector.[13, 14] Only 19.6% of the total ICU beds were for paediatric and neonatal intensive care, and
Page 6 of 26
For peer review only - http://bmjopen.bmj.com/site/about/guidelines.xhtml
BMJ Open
123456789101112131415161718192021222324252627282930313233343536373839404142434445464748495051525354555657585960
on June 5, 2020 by guest. Protected by copyright.
http://bmjopen.bm
j.com/
BM
J Open: first published as 10.1136/bm
jopen-2015-010850 on 3 June 2016. Dow
nloaded from

For peer review only
7
mixed surgical and medical units admit children in most hospitals.[13] Lack of dedicated PICU
facilities is common in many other African countries. In Uganda, for example, there is one general
ICU bed per million people.[10]
Charlotte Maxeke Johannesburg Academic Hospital (CMJAH) is a quaternary referral hospital with a
single combined paediatric / neonatal ICU (PNICU) with 14 ventilator beds. This unit serves
neonates, general paediatrics, paediatric sub-specialities and paediatric surgery; renal dialysis and
high frequency ventilation are available. The age of admission ranges from birth to 14 years. It is
often not possible to admit patients because of a lack of available beds. The unit has no dedicated
paediatric intensivist, but is run by other subspecialists, mainly neonatologists. Nasal continuous
positive airways pressure (NCPAP) is the first line of ventilatory support for neonates with
respiratory failure.[15] Patients who require “high care” observation or treatment are not routinely
admitted; the PNICU essentially functions as a ventilator unit. Additional information regarding the
CMJAH PNICU is provided in the supplementary file, available online. There is a lack of information
on admissions to the CMJAH PNICU. This study therefore aimed to review the survival to discharge
of patients admitted to the unit. Secondary objectives included comparing the survival rate between
paediatric and neonatal patients, determining the disease profile of patients and establishing
predictors or factors associated with poor survival.
SUBJECTS AND METHODS
This was a retrospective cross-sectional record review of all patients admitted to the CMJAH PNICU
between 1 January 2013 and 30 June 2015. The PNICU admitted both neonates and older children
who suffered from medical or surgical conditions. Patients were admitted and cared for at the
discretion of the attending physician, using age-related norms and treatment protocols. Owing to
limited availability of PNICU beds, patients with an anticipated poor outcome, including those with
advanced HIV related disease, were not routinely ventilated. Similarly, neonates below 900 grams
birth weight were not usually offered mechanical ventilation. Exposure to HIV alone was not a
reason for exclusion from PNICU.
Page 7 of 26
For peer review only - http://bmjopen.bmj.com/site/about/guidelines.xhtml
BMJ Open
123456789101112131415161718192021222324252627282930313233343536373839404142434445464748495051525354555657585960
on June 5, 2020 by guest. Protected by copyright.
http://bmjopen.bm
j.com/
BM
J Open: first published as 10.1136/bm
jopen-2015-010850 on 3 June 2016. Dow
nloaded from
For peer review only
8
Patient charts were reviewed on discharge from PNICU and demographic, clinical and outcome data
were captured. Variables were recorded as positive if there had been any occurrence during their
time in the PNICU. Detailed definitions of the variables used in the study are provided in the
supplementary file available online.
Patient data were entered into computerised databases for clinical audit and quality improvement.
These databases are managed by Research Electronic Data Capture (REDCAP) hosted by the
University of the Witwatersrand.[16] The data were de-identified and entered into IBM SPSS (version
22) for the purposes of analysis. Ethical clearance for the study was obtained from the Human
Research Ethics Committee of the University of the Witwatersrand. Patients with no retrievable
information were excluded from the study.
Definitions of patient categories
The group of patients was divided into paediatric patients (> 28 days of age) and neonates. Neonates
were classified as those < 28 days of age who had never been discharged home, and who had been
admitted directly to PNICU from other hospitals or the neonatal nursery at CMJAH. Neonates who
had been discharged home and then readmitted to PNICU were classified as paediatric patients.
Neonates were further divided into very low birth weight (VLBW) infants (< 1500 grams birthweight)
and bigger babies (> 1500 grams birthweight). Children older than 14 years were usually admitted to
the adult ICU. All neonates admitted to PNICU in this study were intubated and ventilated; some
paediatric patients were not intubated but admitted for high care treatment.
Surgical patients were defined as all children who had a surgical condition as their presenting
complaint. Post-operative admissions were defined those surgical patients who were electively
admitted to PNICU post- surgery.
Statistical analysis
Continuous variables such as age at admission were described using mean and standard deviation
(SD) or median with inter-quartile range (IQR), depending on whether the data were normally
Page 8 of 26
For peer review only - http://bmjopen.bmj.com/site/about/guidelines.xhtml
BMJ Open
123456789101112131415161718192021222324252627282930313233343536373839404142434445464748495051525354555657585960
on June 5, 2020 by guest. Protected by copyright.
http://bmjopen.bm
j.com/
BM
J Open: first published as 10.1136/bm
jopen-2015-010850 on 3 June 2016. Dow
nloaded from

For peer review only
9
distributed. Categorical variables were described as frequencies and percentages. Survival to
discharge from ICU was considered the primary outcome variable for comparison.
Univariate analysis comparing different characteristics between survivors and non-survivors used an
independent t-test for normally-distributed data and the Mann-Whitney U-test for skewed data. A
Chi-square test was used to compare differences in survival for categorical variables. A p value of <
0.05 was considered to be statistically significant. Variables with a p value < 0.05 in the univariate
analysis were entered into a multiple stepwise logistic regression model to establish determinants of
survival to PNICU discharge. Neonates and older paediatric patients have different disease profiles
and different risk factors for mortality. Data were therefore analysed separately for VLBW, bigger
babies and paediatric patients.
RESULTS
A total of 1,454 patients were admitted to the PNICU during the study period. Records could not be
retrieved for 182 patients, so the study included 1,272 patients. There were 292 VLBW babies
(22.9%), 451 bigger babies (35.4%) and 529 paediatric (41.5%) admissions. The overall proportion
dying was 25.7% (327 /1272). There was a statistically significant difference in the proportion of
deaths between patients of different ages, with the death rate being 41.4% (121/292) (95% CI: 35.8-
47.1) in VLBW babies, 26.6% (120/451) (95% CI: 22.5-30.5) in bigger babies and 16.2% (86/529) (95%
CI: 13.1-19.3) in paediatric patients (p < 0.0001).
Paediatric ICU admissions
Details of the 529 paediatric admissions are shown in Table 1. The median age at admission was 8.7
months (IQR = 46.5). There was no statistically significant difference in the median age of admissions
between survivors and non-survivors [10.5 months (IQR = 50.7) vs 7.3 months (IQR = 35.7); p=0.412].
Similarly, the median duration of ICU stay was not significantly different for survivors and non-
survivors (approximately 3 days in both groups) (p=0.540). The majority of patients (471/529; 89%)
were intubated and ventilated. More than half (305/529; 57.7%) of the paediatric patients were
Page 9 of 26
For peer review only - http://bmjopen.bmj.com/site/about/guidelines.xhtml
BMJ Open
123456789101112131415161718192021222324252627282930313233343536373839404142434445464748495051525354555657585960
on June 5, 2020 by guest. Protected by copyright.
http://bmjopen.bm
j.com/
BM
J Open: first published as 10.1136/bm
jopen-2015-010850 on 3 June 2016. Dow
nloaded from

For peer review only
10
surgical admissions. The most common problem in medical paediatric patients was lower respiratory
tract illness (191/529; 36.1%).
Table 1
Factors associated with survival in the 529 paediatric patients admitted to CMJAH PNICU between 1
January 2013 and 30 June 2015
Variable Children with the
condition (%)
Percentage of
children with the
condition that died
(95% CI)
Percentage of
children without
the condition that
died (95% CI)
P Value
Male 292 (55.2) 16.1 (11.9–20.3) 17.4 (12.3–22.5) 0.477
HIV exposed* 106 (20)
30.2 (21.5–38.9)
12.2 (9.1–16.1)
< 0.001
HIV PCR positive* 30 (5.7) 30 (13.6–46.4) 15.4 (12.2–18.6) 0.036
Recurrent
admission
52 (9.8) 11.5 (2.8–20.1) 16.8 (13.4–20.2) 0.604
Post cardiac arrest* 34 (6.4) 47 (30.2–63.8) 13.4 (10.4–16.4) < 0.001
Intubated and
ventilated
471 (89) 17.2 (13.8–20.6) 8.6 (1.3-15.8) 0.095
Surgical patients* 305 (57.7) 9.8 (6.3–13.3) 25.0 (19.3–30.7) < 0.001
Post-operative* 239 (45.2) 7.5 (4.2–10.8) 23.6 (18.7–28.6) < 0.001
Trauma 75 (14.2) 18.6 (9.8–27.4) 15.8 (12.4–19.2) 0.542
Inotropic support* 53 (10.0) 60.4 (47.2–73.6) 11.2 (8.3–14.1) < 0.001
Upper respiratory
tract*
61 (11.5) 6.5 (0.3–12.7) 17.5 (14.6–20.9) 0.029
Lower respiratory 191 (36.1) 25.6 (19.4–31.8) 10.9 (7.6–14.2) < 0.001
Page 10 of 26
For peer review only - http://bmjopen.bmj.com/site/about/guidelines.xhtml
BMJ Open
123456789101112131415161718192021222324252627282930313233343536373839404142434445464748495051525354555657585960
on June 5, 2020 by guest. Protected by copyright.
http://bmjopen.bm
j.com/
BM
J Open: first published as 10.1136/bm
jopen-2015-010850 on 3 June 2016. Dow
nloaded from

For peer review only
11
*Statistically significant predictors of survival on univariate analysis
Binary logistic regression analysis with survival to discharge from PNICU as the outcome variable
showed that poor outcome was associated with post cardiac arrest (OR 0.21, 95% CI: 0.09-0.49),
inotropic support (OR 0.085, 95% CI: 0.04-0.17), hypernatraemia (OR 0.16, 95% CI: 0.04-0.6),
bacterial sepsis (OR 0.32, 95% CI: 0.16-0.65) and lower respiratory tract infection (OR 0.54, 95% CI:
0.30-0.97). Post- operative patients were very unlikely to die during the PNICU admission (OR 2.96,
95% CI: 1.49-5.92).
tract*
Cardiovascular* 97 (18.3) 28.9 (19.9–37.9) 13.4 (10.2–16.6) < 0.001
Neurological 125 (23.6) 22.5 (15.2–29.9) 16.7 (12.8–20.6) 0.086
Gastrointestinal* 65 (12.3) 26.1 (15.4–36.8) 14.9 (11.7–18.1) 0.021
Renal* 18 (3.4) 29.4 (6.3–52.5) 15.6 (12.5–18.8) 0.024
Haematology /
Oncology (incl.
anaemia)
108 (20.4) 13.8 (7.3–20.3) 16.8 (13.2–20.4) 0.559
Hypernatraemia* 15 (2.8) 33.3 (9.5–15.2) 14.8 (11.7–17.9) < 0.001
Hyperglycaemia* 6 (1.1) 50 (9.9–90.0) 15.8 (12.7–18.9) 0.024
Hypoglycaemia* 11 (2.1) 45.4 (15.9–74.8) 15.6 (12.7–18.7) 0.008
Metabolic acidosis* 26 (4.9) 46.2 (27.0–65.4) 14.7 (11.6–17.8) < 0.001
Poisoning 17 (3.2) 23.5 (3.3–43.7) 15.8 (12.6–19.0) 0.494
Drowning 7 (1.3) 14.2 (11.7–40.1) 16.4 (13.2–19.6) 0.824
Bacterial sepsis* 64 (12.1) 32.8 (21.3–44.3) 13.7 (10.5–16.9) < 0.001
Viral infection 34 (6.4) 17.6 (4.8–30.4) 16.2 (12.9–19.5) 0.974
Fungal infection 16 (3.0) 31 (8.3–51.7) 15.6 (12.4–18.8) 0.229
Page 11 of 26
For peer review only - http://bmjopen.bmj.com/site/about/guidelines.xhtml
BMJ Open
123456789101112131415161718192021222324252627282930313233343536373839404142434445464748495051525354555657585960
on June 5, 2020 by guest. Protected by copyright.
http://bmjopen.bm
j.com/
BM
J Open: first published as 10.1136/bm
jopen-2015-010850 on 3 June 2016. Dow
nloaded from

For peer review only
12
Bigger babies
Characteristics of the 451 bigger babies admitted to PNICU and factors associated with their survival
to ICU discharge are shown in Table 2. The median duration of ventilation for bigger babies was 3
days (IQR = 75). Those babies who died had a significantly shorter duration of ventilation compared
to survivors (2 days (IQR = 6) vs 4 days (IQR = 6); p < 0.001). The mean gestational age of bigger
babies admitted to PNICU was 36.97 ± 3.6 weeks and mean birth weight was 2,603 ± 736 grams.
There were no statistically significant differences between survivors and non-survivors in gestational
age (36.89 ± 3.6 weeks vs 37.23 ± 3.5 weeks; p = 0.404) or birth weight (2,617 ± 763 grams vs 2,576
± 663 grams; p = 0.615). Binary logistic regression showed that birthweight did not influence
survival in this sub category (p=0.614). Just over one third of bigger babies (34.3%) were surgical
patients.
Table 2
Characteristics and predictors of survival in 451 bigger babies admitted to CMJAH PNICU between
1 January 2013 and 30 June 2015
Variable
Children with
condition (%)
Percentage of
babies with the
condition that died
(95% CI)
Percentage of
babies without
the condition that
died (95% CI)
p value
Place of birth:
Another unit
Born outside health
facility
CMJAH
220 (48.7)
14 (3.1)
186 (41.2)
34.1 (27.8–40.4)
28.6 (4.9 – 52.3)
30.1 (23.5 – 36.7)
0.577
Antenatal care 302 (67) 27.2 (22.2–32.2) 26.8 (18.0–35.6) 0.827
Maternal HIV 127 (28.2) 32.3 (24.2-40.4) 24.9 (20.0-29.9) 0.231
Page 12 of 26
For peer review only - http://bmjopen.bmj.com/site/about/guidelines.xhtml
BMJ Open
123456789101112131415161718192021222324252627282930313233343536373839404142434445464748495051525354555657585960
on June 5, 2020 by guest. Protected by copyright.
http://bmjopen.bm
j.com/
BM
J Open: first published as 10.1136/bm
jopen-2015-010850 on 3 June 2016. Dow
nloaded from

For peer review only
13
Caesarean section 169 (37.4) 23.6 (17.0–30.2) 32.9 (25.9–40.0) 0.31
Male 274 (60.8) 27.7 (22.4–33.0) 25.3 (18.8–31.8) 0.491
Resuscitated at birth 98 (21.7) 28.6 (19.7–37.6) 26.1 (21.5–30.7) 0.619
Early onset sepsis 20 (4.4) 20 (2.5–37.5) 27.1 (22.8–31.4) 0.664
Meconium aspiration 75 (16.6) 25.3 (15.5–35.1) 26.9 (22.4–31.4) 0.784
Hyaline membrane
disease*
89 (19.7) 16.9 (9.1–24.7) 29.0 (24.3–33.7) 0.02
PPHN1*
45 (10.0) 46.7 (32.1–61.3) 24.4 (20.2–28.6) 0.002
Surfactant therapy 108 (23.9) 21.3 (13.4–29.0) 28.7 (13.4–29.0) 0.518
Hypotension requiring
inotropes*
55 (12.2) 54.5 (41.3–67.7) 22.7 (18.6–26.8) < 0.001
CHD2* 37 (8.2) 54.1 (38.0–70.2) 25.3 (21.1–29.5) <0.001
NEC3 43 (9.5) 37.2 (22.8–51.7) 25.3 (21.1–29.5) 0.35
Surgery (excluding
NEC)
129 (28.6) 23.3 (16.0–30.6) 28.0 (23.1–32.9) 0.395
Hyperglycaemia* 46 (10.2) 41.3 (27.1–55.5) 24.9 (20.7–29.1) 0.017
Metabolic acidosis* 48 (10.6) 56.3 (42.3–70.3) 23.1 (19.0–27.2) < 0.001
Late onset sepsis 119 (26.4) 29.4 (21.2–37.6) 25.6 (20.9–30.3) 0.420
Major birth defect* 146 (32.4) 36.3 (28.5–44.1) 22.0 (17.4–26.7) 0.002
*Statistically significant predictors of survival on univariate analysis
1. PPHN Persistent pulmonary hypertension of the neonate
2. CHD congenital heart disease
3. NEC necrotising enterocolitis
Binary logistic regression analysis for factors associated with survival in bigger babies showed major
birth defects (OR 0.44, 95%CI 0.26-0.74), PPHN (OR 0.44, 95% CI: 0.21–0.91) metabolic acidosis (OR
0.23, 95% CI: 0.12–0.74), inotropic support (OR 0.23, 95% CI: 0.12–0.45) and CHD (OR 0.29, 95% CI:
0.13–0.62) were all predictive of poor survival.
Page 13 of 26
For peer review only - http://bmjopen.bmj.com/site/about/guidelines.xhtml
BMJ Open
123456789101112131415161718192021222324252627282930313233343536373839404142434445464748495051525354555657585960
on June 5, 2020 by guest. Protected by copyright.
http://bmjopen.bm
j.com/
BM
J Open: first published as 10.1136/bm
jopen-2015-010850 on 3 June 2016. Dow
nloaded from

For peer review only
14
Very low birth weight babies
Characteristics of the 292 VLBW babies admitted to the PNICU are shown in Table 3. The mean birth
weight was 1,133.2 ± 182 grams and mean gestational age 28.95 ± 8.17 weeks. There were no
statistically significant differences between survivors and non-survivors in mean birth weight (1,149
± 182 vs 1,109 ± 180 grams; p = 0.063) or gestational age (29.01 ± 2.1 vs 28.86 ± 2.1 weeks; p
=0.540). The median duration of ventilation was 5 days (IQR = 8). The duration of ventilation was
significantly shorter in VLBW babies who died (4 days (IQR = 10) vs 6 days (IQR = 7); p < 0.001).
Table 3
Characteristics and predictors of survival for 292 VLBW babies admitted to the CMJAH PNICU
between 1 January 2013 and 30 June 2015
Variable
Babies with the
condition (%)
Percentage of
babies with the
condition that
died (95% CI)
Percentage of
babies without
the condition that
died (95% CI)
p value
Place of birth*
Born outside health facility
Born at another unit
Born at CMJAH
19 (6.5)
97 (33.2)
176 (60.3)
68.4 (47.5–89.3)
32.0 (22.7–41.3)
43.8 (36.5–51.1)
0.008
Antenatal care 171 (58.6) 39.8 (32.5–47.1) 43.8 (35.0–52.6) 0.49
Antenatal steroids 86 (29.5) 43.0 (32.5–53.5) 40.8 (34.1–47.5) 0.722
Maternal HIV 98 (33.6) 49.0 (39.1–58.9) 37.6 (30.8–44.4) 0.063
Caesarean section 124 (42.5) 39.5 (30.9–48.1) 44.2 (35.7–52.7) 0.817
Male 164 (56.2) 42.7 (35.1–50.3) 40.2 (31.7–48.7) 0.638
Resuscitated at birth 112 (38.4) 50.9 (41.6–60.2) 35.6 (28.6–42.6) 0.099
Early onset sepsis 10 (3.4) 60 (29.6–90.4) 39.8 (33.9–45.7) 0.358
Page 14 of 26
For peer review only - http://bmjopen.bmj.com/site/about/guidelines.xhtml
BMJ Open
123456789101112131415161718192021222324252627282930313233343536373839404142434445464748495051525354555657585960
on June 5, 2020 by guest. Protected by copyright.
http://bmjopen.bm
j.com/
BM
J Open: first published as 10.1136/bm
jopen-2015-010850 on 3 June 2016. Dow
nloaded from
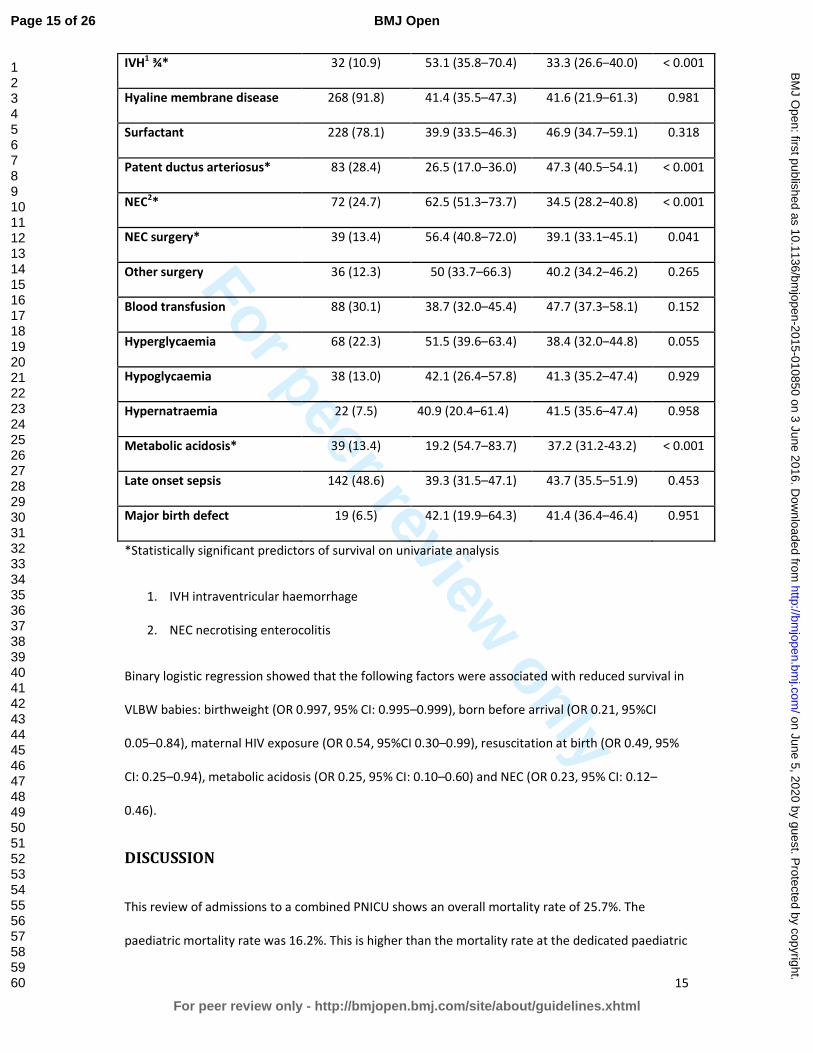
For peer review only
15
IVH1 ¾* 32 (10.9) 53.1 (35.8–70.4) 33.3 (26.6–40.0) < 0.001
Hyaline membrane disease 268 (91.8) 41.4 (35.5–47.3) 41.6 (21.9–61.3) 0.981
Surfactant 228 (78.1) 39.9 (33.5–46.3) 46.9 (34.7–59.1) 0.318
Patent ductus arteriosus* 83 (28.4) 26.5 (17.0–36.0) 47.3 (40.5–54.1) < 0.001
NEC2* 72 (24.7) 62.5 (51.3–73.7) 34.5 (28.2–40.8) < 0.001
NEC surgery* 39 (13.4) 56.4 (40.8–72.0) 39.1 (33.1–45.1) 0.041
Other surgery 36 (12.3) 50 (33.7–66.3) 40.2 (34.2–46.2) 0.265
Blood transfusion 88 (30.1) 38.7 (32.0–45.4) 47.7 (37.3–58.1) 0.152
Hyperglycaemia 68 (22.3) 51.5 (39.6–63.4) 38.4 (32.0–44.8) 0.055
Hypoglycaemia 38 (13.0) 42.1 (26.4–57.8) 41.3 (35.2–47.4) 0.929
Hypernatraemia 22 (7.5) 40.9 (20.4–61.4) 41.5 (35.6–47.4) 0.958
Metabolic acidosis* 39 (13.4) 19.2 (54.7–83.7) 37.2 (31.2-43.2) < 0.001
Late onset sepsis 142 (48.6) 39.3 (31.5–47.1) 43.7 (35.5–51.9) 0.453
Major birth defect 19 (6.5) 42.1 (19.9–64.3) 41.4 (36.4–46.4) 0.951
*Statistically significant predictors of survival on univariate analysis
1. IVH intraventricular haemorrhage
2. NEC necrotising enterocolitis
Binary logistic regression showed that the following factors were associated with reduced survival in
VLBW babies: birthweight (OR 0.997, 95% CI: 0.995–0.999), born before arrival (OR 0.21, 95%CI
0.05–0.84), maternal HIV exposure (OR 0.54, 95%CI 0.30–0.99), resuscitation at birth (OR 0.49, 95%
CI: 0.25–0.94), metabolic acidosis (OR 0.25, 95% CI: 0.10–0.60) and NEC (OR 0.23, 95% CI: 0.12–
0.46).
DISCUSSION
This review of admissions to a combined PNICU shows an overall mortality rate of 25.7%. The
paediatric mortality rate was 16.2%. This is higher than the mortality rate at the dedicated paediatric
Page 15 of 26
For peer review only - http://bmjopen.bmj.com/site/about/guidelines.xhtml
BMJ Open
123456789101112131415161718192021222324252627282930313233343536373839404142434445464748495051525354555657585960
on June 5, 2020 by guest. Protected by copyright.
http://bmjopen.bm
j.com/
BM
J Open: first published as 10.1136/bm
jopen-2015-010850 on 3 June 2016. Dow
nloaded from
For peer review only
16
ICU at Red Cross Children’s Hospital, [4] but lower than that reported for children admitted to
general ICUs in other African countries.[8-10]
Possible reasons for the high mortality rate in this study may lie outside the PNICU, such as late
referral and inadequate resuscitation, or within, such as insufficient beds and inadequate staffing.
The lack of a paediatric intensivist may partly contribute to the mortality rate; dedicated paediatric
intensivists have been shown to reduce the mortality rate of children in ICU and improve bed
utilisation.[17] This PNICU was run mainly as an invasive ventilator unit, with limited high
dependency care admissions; 89% of paediatric patients and all neonates admitted to PNICU were
intubated and ventilated. Therefore this may represent a sicker cohort of children compared with
other PICUs. Mortality prediction risk scores such as the PIM allow objective comparisons between
different units.[18] Although PIM data was not collected during the study period, the predictors of
poor outcome in the current study were similar to the PIM, including post cardiac arrest, inotropic
support and metabolic acidosis.
The mortality was higher in neonates than paediatric patients. Mortality of ventilated neonates was
similar to that reported from units in India.[19] The very high mortality of the VLBW group in the
PNICU is not surprising as these patients had failed initial NCPAP and were therefore very sick babies
The mortality rate of ventilated VLBW infants was similar to that reported in a study in China.[20]
Birthweight, the strongest predictor of outcome in VLBW infants in our setting, [21] remained a
significant factor associated with survival in the ventilated VLBW babies.
Both HIV infection and HIV exposure were significant predictors of outcome in the univariate
analysis, but not in the logistic regression. There is, however, selection bias, as only those HIV-
exposed infants who were expected to recover were admitted to the PNICU.
Other potential sources of bias were considered. The age of paediatric patients was skewed towards
younger children who would be expected to have a higher mortality than their older counterparts.
There was a slight preponderance of infants (<1 year of age) in the paediatric age group (274/529
(51.8%). However, there was no significant difference in the number of deaths between infants and
Page 16 of 26
For peer review only - http://bmjopen.bmj.com/site/about/guidelines.xhtml
BMJ Open
123456789101112131415161718192021222324252627282930313233343536373839404142434445464748495051525354555657585960
on June 5, 2020 by guest. Protected by copyright.
http://bmjopen.bm
j.com/
BM
J Open: first published as 10.1136/bm
jopen-2015-010850 on 3 June 2016. Dow
nloaded from
For peer review only
17
older children (53/274 (19.3%) vs 33/245 (13.5%) p =0.077). Similarly, neonates weighing above
2500 grams are expected to have a different disease profile and mortality rate to those weighing less
than 2500 grams. Babies > 2500 grams could therefore have been another source of bias in the
category of bigger babies, however, binary logistic regression showed that birthweight did not
influence survival in this category (p=0.614).
There were some apparent anomalies in our data. The low incidence of viral infections and
hyperglycaemia may reflect lack of active surveillance for these conditions. The low number of
fungal isolates may be explained by the fact that fungal organisms are difficult to isolate on
paediatric low volume blood cultures.
.
This study raises the issue of children’s rights to healthcare. A report from 2007 showed that only
19.6% of ICU beds in South Africa are dedicated to the care of children.[13] Our study raises the
issue of balancing the rights of older children against those of neonates in a combined paediatric /
neonatal ICU. Only the very sickest neonates (those who failed NCPAP) were admitted to the PNICU,
which may be a form of discrimination. There are no easy ways to identify which patients to admit to
PNICU, especially in a resource-limited setting.[2, 4] Children must not come to ICU to die, yet many
who are critically ill, with an increased risk of death, may have a better chance of recovery if treated
in ICU. We found that post-operative patients had good outcomes, which may reflect the optimal
use of ventilator beds in this unit, or may indicate that many of these patients did not require ICU.
Increasing the number of “high care” admissions would decrease the PNICU mortality rate, but this
would often be at the expense of a sicker child requiring ventilation.
This study had several limitations. The raw proportion of deaths in the CMJAH PNICU is higher than
other units, but may reflect a different level of severity of illness. As may be the case with
retrospective analyses, not all information was available for inclusion in the study. The use of a
standardised illness code such as the ANZPIC system may have been preferable.[22]
Page 17 of 26
For peer review only - http://bmjopen.bmj.com/site/about/guidelines.xhtml
BMJ Open
123456789101112131415161718192021222324252627282930313233343536373839404142434445464748495051525354555657585960
on June 5, 2020 by guest. Protected by copyright.
http://bmjopen.bm
j.com/
BM
J Open: first published as 10.1136/bm
jopen-2015-010850 on 3 June 2016. Dow
nloaded from

For peer review only
18
CONCLUSIONS AND RECOMMENDATIONS
The unadjusted mortality rate of children admitted to this combined PNICU is higher than that
reported in a dedicated PICU in the same country.[4] Incorporation of a paediatric intensivist, even
in poorer countries, improves the outcome for children, both in terms of mortality and length of
stay.[11, 17] Ongoing training in the stabilisation and management of critically ill children is
essential for all paediatric registrars, general paediatricians and other sub-specialists. Future clinical
audits should include a severity of illness score such as the PIM,[22] hospital paediatric mortality
rate and the number of children denied admission to PNICU, together with outcome data.
Page 18 of 26
For peer review only - http://bmjopen.bmj.com/site/about/guidelines.xhtml
BMJ Open
123456789101112131415161718192021222324252627282930313233343536373839404142434445464748495051525354555657585960
on June 5, 2020 by guest. Protected by copyright.
http://bmjopen.bm
j.com/
BM
J Open: first published as 10.1136/bm
jopen-2015-010850 on 3 June 2016. Dow
nloaded from

For peer review only
19
References
1. WHO. Global Health Observatory Data. 2015 [cited 2016 27 January]; Available from:
http://www.who.int/gho/child_health/mortality/neonatal_infant_text/en/.
2. Basnet, S., N. Adhikari, and J. Koirala, Challenges in setting up pediatric and neonatal
intensive care units in a resource-limited country. Pediatrics, 2011. 128(4): p. e986-92.
3. Koroglu, T.F., S. Atasever, and M. Duman, A survey of pediatric intensive care services in
Turkey. Turk J Pediatr, 2008. 50(1): p. 12-7.
4. Argent, A.C., et al., Pediatric intensive care in South Africa: an account of making optimum
use of limited resources at the Red Cross War Memorial Children's Hospital*. Pediatr Crit
Care Med, 2014. 15(1): p. 7-14.
5. Rosenthal, V.D., et al., Socioeconomic impact on device-associated infections in pediatric
intensive care units of 16 limited-resource countries: international Nosocomial Infection
Control Consortium findings. Pediatr Crit Care Med, 2012. 13(4): p. 399-406.
6. Campos-Mino, S., J.S. Sasbon, and B. von Dessauer, [Pediatric intensive care in Latin
America]. Med Intensiva, 2012. 36(1): p. 3-10.
7. Ghani, A.S., et al., An investigation into the prevalence and outcome of patients admitted to
a pediatric intensive care unit with viral respiratory tract infections in Cape Town, South
Africa. Pediatr Crit Care Med, 2012. 13(5): p. e275-81.
8. Embu, H.Y., et al., Paediatric admissions and outcome in a general intensive care unit. Afr J
Paediatr Surg, 2011. 8(1): p. 57-61.
9. El-Nawawy, A., Evaluation of the outcome of patients admitted to the pediatric intensive care
unit in Alexandria using the pediatric risk of mortality (PRISM) score. J Trop Pediatr, 2003.
49(2): p. 109-14.
10. Kwizera, A., M. Dunser, and J. Nakibuuka, National intensive care unit bed capacity and ICU
patient characteristics in a low income country. BMC Res Notes, 2012. 5: p. 475.
11. Pearson, G., et al., Should paediatric intensive care be centralised? Trent versus Victoria.
Lancet, 1997. 349(9060): p. 1213-7.
12. Goh, A.Y., L.C. Lum, and M.E. Abdel-Latif, Impact of 24 hour critical care physician staffing on
case-mix adjusted mortality in paediatric intensive care. Lancet, 2001. 357(9254): p. 445-6.
13. Bhagwanjee, S. and J. Scribante, National audit of critical care resources in South Africa - unit
and bed distribution. S Afr Med J, 2007. 97(12 Pt 3): p. 1311-4.
14. Naidoo, K., J. Singh, and U. Lalloo, A critical analysis of ICU/HC beds in South Africa: 2008-
2009. S Afr Med J, 2013. 103(10): p. 751-3.
15. Jardine, C. and D.E. Ballot, The use of nasal CPAP at Charlotte Maxeke Johannesburg
Academic Hospital. S Afr J Child Health, 2015. 9(1): p. 4.
16. Harris, P.A., et al., Research electronic data capture (REDCap)--a metadata-driven
methodology and workflow process for providing translational research informatics support.
J Biomed Inform, 2009. 42(2): p. 377-81.
17. Pollack, M.M., et al., Improving the outcome and efficiency of intensive care: the impact of
an intensivist. Crit Care Med, 1988. 16(1): p. 11-7.
18. Straney, L., et al., Paediatric index of mortality 3: an updated model for predicting mortality
in pediatric intensive care*. Pediatr Crit Care Med, 2013. 14(7): p. 673-81.
19. Iqbal, Q., et al., Neonatal mechanical ventilation: Indications and outcome. Indian J Crit Care
Med, 2015. 19(9): p. 523-7.
20. Ma, L., et al., [Prospective study on in-hospital mortality and its risk factors in very low birth
weight infants requring mechanical ventilation]. Zhongguo Dang Dai Er Ke Za Zhi, 2012.
14(10): p. 737-41.
Page 19 of 26
For peer review only - http://bmjopen.bmj.com/site/about/guidelines.xhtml
BMJ Open
123456789101112131415161718192021222324252627282930313233343536373839404142434445464748495051525354555657585960
on June 5, 2020 by guest. Protected by copyright.
http://bmjopen.bm
j.com/
BM
J Open: first published as 10.1136/bm
jopen-2015-010850 on 3 June 2016. Dow
nloaded from

For peer review only
20
21. Ballot, D.E., et al., Comparison of morbidity and mortality of very low birth weight infants in a
Central Hospital in Johannesburg between 2006/2007 and 2013. BMC Pediatr, 2015. 15: p.
20.
22. Slater, A., F. Shann, and J. McEniery, The ANZPIC registry diagnostic codes: a system for
coding reasons for admitting children to intensive care. Intensive Care Med, 2003. 29(2): p.
271-7.
Page 20 of 26
For peer review only - http://bmjopen.bmj.com/site/about/guidelines.xhtml
BMJ Open
123456789101112131415161718192021222324252627282930313233343536373839404142434445464748495051525354555657585960
on June 5, 2020 by guest. Protected by copyright.
http://bmjopen.bm
j.com/
BM
J Open: first published as 10.1136/bm
jopen-2015-010850 on 3 June 2016. Dow
nloaded from

For peer review only
1
STROBE Statement—Checklist of items that should be included in reports of cross-sectional studies
Item
No Recommendation
Page
Title and abstract 1 (a) Indicate the study’s design with a commonly used term in the title or the
abstract
4
(b) Provide in the abstract an informative and balanced summary of what was
done and what was found
4
Introduction
Background/rationale 2 Explain the scientific background and rationale for the investigation being
reported
6,7
Objectives 3 State specific objectives, including any prespecified hypotheses 7
Methods
Study design 4 Present key elements of study design early in the paper 7
Setting 5 Describe the setting, locations, and relevant dates, including periods of
recruitment, exposure, follow-up, and data collection
7
Participants 6 (a) Give the eligibility criteria, and the sources and methods of selection of
participants
7
Variables 7 Clearly define all outcomes, exposures, predictors, potential confounders,
and effect modifiers. Give diagnostic criteria, if applicable
7
Data sources/
measurement
8* For each variable of interest, give sources of data and details of methods of
assessment (measurement). Describe comparability of assessment methods if
there is more than one group
Supplementary
file
Bias 9 Describe any efforts to address potential sources of bias
Study size 10 Explain how the study size was arrived at 7
Quantitative
variables
11 Explain how quantitative variables were handled in the analyses. If
applicable, describe which groupings were chosen and why
8
Statistical methods 12 (a) Describe all statistical methods, including those used to control for
confounding
8
(b) Describe any methods used to examine subgroups and interactions
(c) Explain how missing data were addressed
(d) If applicable, describe analytical methods taking account of sampling
strategy
(e) Describe any sensitivity analyses
Results 9 to 14
Participants 13* (a) Report numbers of individuals at each stage of study—eg numbers
potentially eligible, examined for eligibility, confirmed eligible, included in
the study, completing follow-up, and analysed
(b) Give reasons for non-participation at each stage
(c) Consider use of a flow diagram
Descriptive data 14* (a) Give characteristics of study participants (eg demographic, clinical,
social) and information on exposures and potential confounders
(b) Indicate number of participants with missing data for each variable of
interest
Outcome data 15* Report numbers of outcome events or summary measures
Main results 16 (a) Give unadjusted estimates and, if applicable, confounder-adjusted
estimates and their precision (eg, 95% confidence interval). Make clear
which confounders were adjusted for and why they were included
Page 21 of 26
For peer review only - http://bmjopen.bmj.com/site/about/guidelines.xhtml
BMJ Open
123456789101112131415161718192021222324252627282930313233343536373839404142434445464748495051525354555657585960
on June 5, 2020 by guest. Protected by copyright.
http://bmjopen.bm
j.com/
BM
J Open: first published as 10.1136/bm
jopen-2015-010850 on 3 June 2016. Dow
nloaded from

For peer review only
2
(b) Report category boundaries when continuous variables were categorized
(c) If relevant, consider translating estimates of relative risk into absolute risk
for a meaningful time period
Other analyses 17 Report other analyses done—eg analyses of subgroups and interactions, and
sensitivity analyses
Discussion
Key results 18 Summarise key results with reference to study objectives 15
Limitations 19 Discuss limitations of the study, taking into account sources of potential bias
or imprecision. Discuss both direction and magnitude of any potential bias
17
Interpretation 20 Give a cautious overall interpretation of results considering objectives,
limitations, multiplicity of analyses, results from similar studies, and other
relevant evidence
17
Generalisability 21 Discuss the generalisability (external validity) of the study results
Other information
Funding 22 Give the source of funding and the role of the funders for the present study
and, if applicable, for the original study on which the present article is based
2
*Give information separately for exposed and unexposed groups.
Note: An Explanation and Elaboration article discusses each checklist item and gives methodological background and
published examples of transparent reporting. The STROBE checklist is best used in conjunction with this article (freely
available on the Web sites of PLoS Medicine at http://www.plosmedicine.org/, Annals of Internal Medicine at
http://www.annals.org/, and Epidemiology at http://www.epidem.com/). Information on the STROBE Initiative is
available at www.strobe-statement.org.
Page 22 of 26
For peer review only - http://bmjopen.bmj.com/site/about/guidelines.xhtml
BMJ Open
123456789101112131415161718192021222324252627282930313233343536373839404142434445464748495051525354555657585960
on June 5, 2020 by guest. Protected by copyright.
http://bmjopen.bm
j.com/
BM
J Open: first published as 10.1136/bm
jopen-2015-010850 on 3 June 2016. Dow
nloaded from
For peer review only
Paediatric ICU at CMJAH
There is a combined paediatric/neonatal ICU (PNICU) which serves the general paediatric
population, the neonatal service, all sub-specialities and paediatric surgery. Cardiothoracic patients
are managed in a separate ICU. CMJAH Inadequate funding may result in insufficient or poorly
maintained equipment, lack of adequately trained staff and limited supplies of expensive medicines.
Patients are often severely ill, present late and suffer from multi-system diseases. Regional hospitals
frequently do not have ICU facilities, so the CMJAH PNICU receives referrals from a wide geographic
area, including neighbouring states. Children who have a poor chance of survival or risk of severe
neurological handicap are not routinely admitted to the PNICU. HIV-exposed children not in multi-
organ failure were admitted to the PICU during the study period. Neonates weighing less than 900
grams at birth were not routinely admitted to PNICU during the study period. Ventilatory support in
the form of nasal CPAP was provided in the neonatal wards to babies between 750 and 900 grams
birth weight.
The HIV epidemic in South Africa has further complicated the question of admission criteria to PICU.
Both HIV exposure and infection are predictive of increased mortality in PICU [1]. Kitchin et al [2]
reported a case fatality rate of 30% for HIV-exposed children ventilated for respiratory failure.
Cytomegalovirus co-infection seemed to confer a worse outcome, although the mechanism of this is
unclear. In 2007, children with established HIV infection and “whose lives are in danger from AIDS-
related disease” had a poor prognosis and were not admitted to PICU.[3] Children established on
antiretroviral therapy and with an unrelated reason for PICU admission were, however suitable for
admission. More recently, with the advent of readily available antiretroviral therapy for children, this
approach may no longer be appropriate.
Severity of illness scores have been developed using predictors of poor outcome such as metabolic
acidosis and cardiac arrest. Two such scores are the Paediatric Risk of Mortality (PRISM)[3] and
Paediatric Index of Mortality (PIM)[4]. These scores are not designed for triage but are useful for
quality control, health planning and comparing the performance of different units[5]. These severity
of illness scores were developed in richer countries and standardised on the basis of data from these
countries. LMICs may have a different profile of patients and different outcomes. In a recent study,
however, Solomon et al [6] demonstrated that the PIM2 score was both accurate and well calibrated
in a South African PICU.
The PNICU was staffed by a PNICU consultant on call; the resident staff included two paediatric
registrars and a medical officer. After hours, a resident registrar and medical officer cover PNICU and
Page 23 of 26
For peer review only - http://bmjopen.bmj.com/site/about/guidelines.xhtml
BMJ Open
123456789101112131415161718192021222324252627282930313233343536373839404142434445464748495051525354555657585960
on June 5, 2020 by guest. Protected by copyright.
http://bmjopen.bm
j.com/
BM
J Open: first published as 10.1136/bm
jopen-2015-010850 on 3 June 2016. Dow
nloaded from

For peer review only
the whole neonatal service, including labour ward, the transitional nursery and 75 neonatal patients.
Nurse to patient ratios follow neonatal norms – of 1 nurse to 2 patients.
Definitions used in the study are shown in Table 1. Hypernatraemia was defined as 150 mmol/l, but
most patients who died with the condition had much higher levels of sodium. Congenital heart
disease associated with mortality included hypoplastic left heart syndrome and various complex
congenital heart defects.
Table 1
Definitions of illnesses used in the study
Variable Definition
Hypotension The need for inotropic support to maintain a
normal blood pressure
Hypoglycaemia Blood sugar < 2.6 mmol/l
Hyperglycaemia Blood sugar > 7 mmol/l
Hypernatraemia Serum sodium > 150 mmol/l; neonates > 155
mmol/l
Metabolic acidosis Base Excess > -16 mmol/l
Bacterial / fungal sepsis Bacterial/fungal organisms isolated on blood
culture
Diagnosis Major organ systems involved. A patient could
be classified in two categories e.g. a child with
bronchopneumonia and anaemia would be
lower respiratory tract and haematology
Cardiovascular Shock, arrhythmias, cardiac failure and
anatomical cardiac lesions
Page 24 of 26
For peer review only - http://bmjopen.bmj.com/site/about/guidelines.xhtml
BMJ Open
123456789101112131415161718192021222324252627282930313233343536373839404142434445464748495051525354555657585960
on June 5, 2020 by guest. Protected by copyright.
http://bmjopen.bm
j.com/
BM
J Open: first published as 10.1136/bm
jopen-2015-010850 on 3 June 2016. Dow
nloaded from

For peer review only
Surgical patients Post-operative, trauma and patients admitted
from the surgical wards for other indications.
The majority of post-operative admissions were
elective (Personal communication DEB) but this
information was not recorded during the study
period.
Upper respiratory tract Upper airway obstruction including croup,
foreign body, retropharyngeal abscess, subglottic
stenosis
Lower respiratory tract Pneumonia, pneumonitis, asthma, bronchiolitis,
non-cardiogenic pulmonary oedema, empyema,
effusion, pneumothorax
Haematology oncology Malignancies, blood dyscrasias and anaemia
requiring blood transfusion
Renal Renal failure, dialysis, renal transplant
Gastrointestinal Liver pathology, gastroenteritis
Neurological Seizure disorders, meningitis, apnoea, paralysis
References
1. Ghani AS, Morrow BM, Hardie DR, et al. An investigation into the prevalence and outcome of
patients admitted to a pediatric intensive care unit with viral respiratory tract infections in
Cape Town, South Africa. Pediatr Crit Care Med 2012;13(5):e275-81 doi:
10.1097/PCC.0b013e3182417848[published Online First: Epub Date]|.
2. Kitchin OP, Masekela R, Becker P, et al. Outcome of human immunodeficiency virus-exposed and -
infected children admitted to a pediatric intensive care unit for respiratory failure. Pediatr
Crit Care Med 2012;13(5):516-9 doi: 10.1097/PCC.0b013e31824ea143[published Online
First: Epub Date]|.
3. Pollack MM, Ruttimann UE, Getson PR. Pediatric risk of mortality (PRISM) score. Crit Care Med
1988;16(11):1110-6
Page 25 of 26
For peer review only - http://bmjopen.bmj.com/site/about/guidelines.xhtml
BMJ Open
123456789101112131415161718192021222324252627282930313233343536373839404142434445464748495051525354555657585960
on June 5, 2020 by guest. Protected by copyright.
http://bmjopen.bm
j.com/
BM
J Open: first published as 10.1136/bm
jopen-2015-010850 on 3 June 2016. Dow
nloaded from

For peer review only
4. Straney L, Clements A, Parslow RC, et al. Paediatric index of mortality 3: an updated model for
predicting mortality in pediatric intensive care*. Pediatr Crit Care Med 2013;14(7):673-81
doi: 10.1097/PCC.0b013e31829760cf[published Online First: Epub Date]|.
5. Costa GA, Delgado AF, Ferraro A, et al. Application of the pediatric risk of mortality (PRISM) score
and determination of mortality risk factors in a tertiary pediatric intensive care unit. Clinics
(Sao Paulo, Brazil) 2010;65(11):1087-92
6. Solomon LJM, B. M.; Argent, A. Paediatric Index of Mortality scores: An evaluation of function in
the paediatric intensive care unit of the Red Cross War Memorial Children’s Hospital. South
African Journal of Critical Care 2014;30(1):5 doi: DOI:10.7196/SAJCC.166[published Online
First: Epub Date]|.
Page 26 of 26
For peer review only - http://bmjopen.bmj.com/site/about/guidelines.xhtml
BMJ Open
123456789101112131415161718192021222324252627282930313233343536373839404142434445464748495051525354555657585960
on June 5, 2020 by guest. Protected by copyright.
http://bmjopen.bm
j.com/
BM
J Open: first published as 10.1136/bm
jopen-2015-010850 on 3 June 2016. Dow
nloaded from