susan brower, minnesota state demographer feb …€¦ · northeast minnesota workforce solutions...
TRANSCRIPT

Northeast Minnesota Workforce Solutions Series
SUSAN BROWER, MINNESOTA STATE DEMOGRAPHERFeb 13, 2018

2010-2015
Majority of the growth (88%) occurred in Twin Cities 7-county metro
•MN grew by 179,000
•Hennepin and Ramsey added 98,000 jointly
•Northeast Minnesota 7-county region lost about 700 people during that same time period

Minnesota’s labor force growth is projected to slow furtherover the next 10 years
40,000
54,000
34,000
21,000
7,000 6,000 6,000 9,000
13,000 15,000 15,000
-
10,000
20,000
30,000
40,000
50,000
60,000
19
80
-19
90
19
90
-20
00
20
00
-20
10
20
10
-20
15
20
15
-20
20
20
20
-20
25
20
25
-20
30
20
30
-20
35
20
35
-20
40
20
40
-20
45
20
45
-20
50
Source: U.S. Census Bureau (1980—2015) & MN State Demographic Center Projections (2015-2045)

8
Minnesota poised to fare better than many Midwest and Northeast states
Working-age population (25-54) in MN projected to grow, though relatively slowly
Source: University of Virginia Demographic Research Group
Minnesota is not alone:Many other states will experience a shrinking workforce

250000 150000 50000 50000 150000 250000
Under 5 5 to 9
10 to 14 15 to 19 20 to 24 25 to 29 30 to 34 35 to 39 40 to 44 45 to 49 50 to 54 55 to 59 60 to 64 65 to 69 70 to 74 75 to 79 80 to 84 85 to 89
90+
Population by age and sexMinnesota, 2015
Baby Boomers
GenX
Millennials
Source: MN State Demographic Center Projections
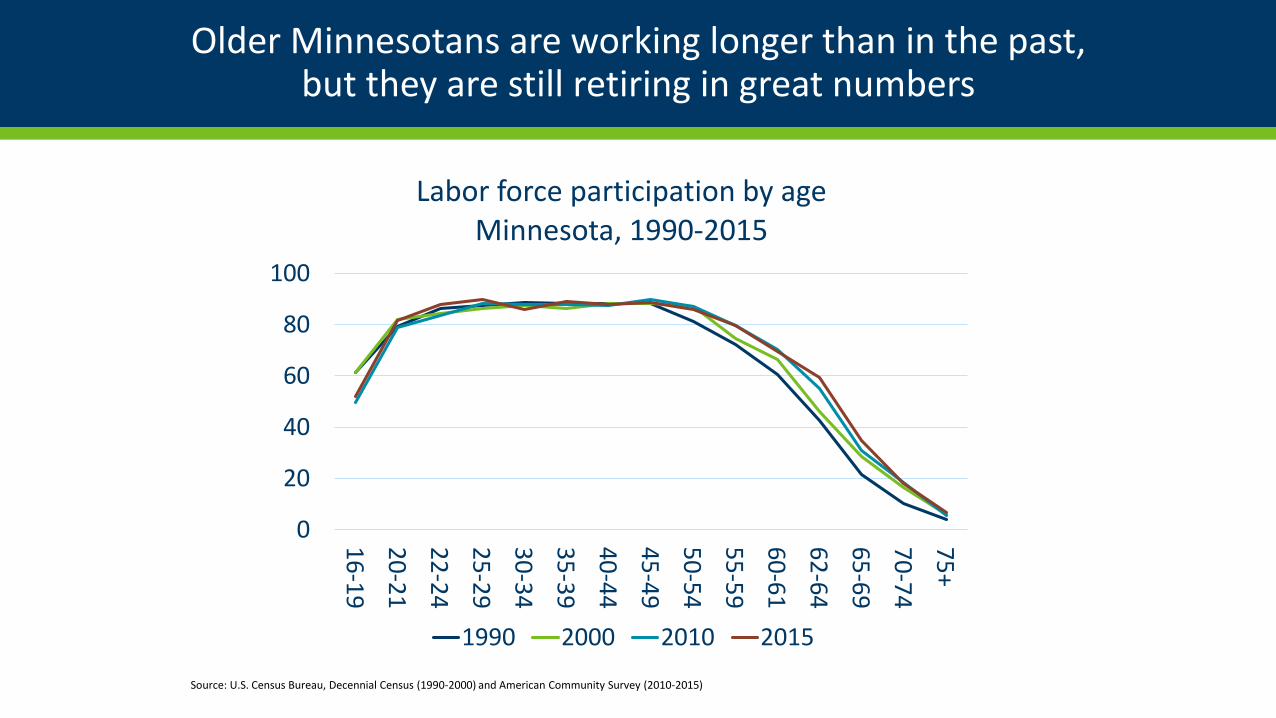
Older Minnesotans are working longer than in the past,but they are still retiring in great numbers
Source: U.S. Census Bureau, Decennial Census (1990-2000) and American Community Survey (2010-2015)
0
20
40
60
80
100
16
-19
20
-21
22
-24
25
-29
30
-34
35
-39
40
-44
45
-49
50
-54
55
-59
60
-61
62
-64
65
-69
70
-74
75
+
Labor force participation by ageMinnesota, 1990-2015
1990 2000 2010 2015

Gains from migration statewide have come almost entirely from international migration since the early 2000s
-15,000
-10,000
-5,000
0
5,000
10,000
15,000
20,000
25,000
30,000
19
91
19
93
19
95
19
97
19
99
20
01
20
03
20
05
20
07
20
09
20
11
20
13
20
15
20
17
International Net Domestic Net Total Net Migration

Midwestern states tend to lose residents to other states on net—but gain residents from abroad
Net Migration
Total International Domestic
North Dakota 56,271 9,475 46,796Minnesota 42,028 80,206 -38,178Iowa 24,643 35,326 -10,683South Dakota 21,072 9,563 11,509Nebraska 14,572 24,303 -9,731Indiana 4,511 63,671 -59,160Missouri -6,804 51,332 -58,136Wisconsin -20,083 43,853 -63,936Kansas -34,632 35,867 -70,499Ohio -70,390 112,592 -182,982Michigan -87,519 128,353 -215,872Illinois -361,646 178,520 -540,166
Net Migration for Midwestern States April 2010-July 2016 (Cumulative)
Source: U.S. Census Bureau, 2016 Population Estimates7

The number of job openings recently surpassed the number of people looking for work

Increasing reports of labor shortages & of employers’ response

The Northeast has been stable for the last couple of decades
1990, 311,342
2016, 325,082
-
50,000
100,000
150,000
200,000
250,000
300,000
350,000
400,000
1910 1920 1930 1940 1950 1960 1970 1980 1990 2000 2010 2016
Total PopulationNortheast Minnesota Region, 1910-2016
Source: U.S. Census Bureau, Decennial Censuses and Population Estimates Program (2016)

Labor Force Decline in Northeast Minnesota
163,000
159,000
154,000
150,000
2015 2020 2025 2030

Greater Minnesota will likely continue to be impacted by labor force shortages
-10000
0
10000
20000
30000
40000
50000
60000
70000
Projected Change in Labor Force (Age 16+) by MN Planning Areas, 2015-2030
2015-2020 2020-2025 2025-2030
Source: Minnesota State Demographic Center Projections

Population losses are not primarily because people are moving away
(15,000)
(10,000)
(5,000)
-
5,000
10,000
15,000
Aitkin Carlton Cook Itasca Koochiching Lake St. Louis
How Northeast MN's Population Changed 2010-2016
Births Deaths International Migration Domestic Migration
Source: U.S. Census Bureau, Population Estimates Program

(1,000)
(500)
-
500
1,000
1,500
Aitkin Carlton Cook Itasca Koochiching Lake St. Louis
Migration between 2010 and 2016
International Migration Domestic Migration
Source: U.S. Census Bureau, Population Estimates Program
Focus on Migration: Counties in Northeast MN have mixed migration stories as of late

Growing Number of Job Vacancies and Declining Number of Unemployed
Source: MN DEED, Job Vacancies Survey and LAUS data
0
5,000
10,000
15,000
20,000
2008 2009 2010 2011 2012 2013 2014 2015 2016 2017
Northeast Minnesota (7-county)
Unemployed (Annual Avg.) Job Vacancies (Q2)

Implications of a seller’s labor market
• Industries compete for workers.
• Some positions go unfilled.
• Job-seekers/switchers can be picky.
• Employers adopt productivity-enhancing technology, training, approaches.
• Employers seek new ways to attract and retain workers.
• Pressure for compensation to increase.

Implications of a seller’s labor market, con’t.
•Focus shifts from jobs to people
• In-migration may increase as opportunities grow, especially from outside the U.S.

Big, inevitable demographic changes ahead.
Our job is to realignourselves to this new reality.