sustainability - amazon web...
TRANSCRIPT

i
SUSTAINABILITY
SUSTAINABILITY REPORT
MAY 2015
2014
Measuring VTA’sEnvironmental Progress

Executive Summary 1
About VTA 2
Report Purpose and Scope 3
Purpose . . . . . . . . . . . . . . . . . . . . . . . . . . . . . . . . . 3
Scope . . . . . . . . . . . . . . . . . . . . . . . . . . . . . . . . . . 3
Sustainability Program Overview 4
Introduction . . . . . . . . . . . . . . . . . . . . . . . . . . . . . . . 4
Sustainability Commitment /Team . . . . . . . . . . . . . . . . . . . . . . 4
Environmental Performance 5
Fuel . . . . . . . . . . . . . . . . . . . . . . . . . . . . . . . . . . 5
Energy . . . . . . . . . . . . . . . . . . . . . . . . . . . . . . . . 5
Electricity Usage and Costs . . . . . . . . . . . . . . . . . . . . . . . . 5
Solar Production . . . . . . . . . . . . . . . . . . . . . . . . . . . . 6
Natural Gas Usage and Costs . . . . . . . . . . . . . . . . . . . . . . . 6
Water . . . . . . . . . . . . . . . . . . . . . . . . . . . . . . . . . 6
Waste . . . . . . . . . . . . . . . . . . . . . . . . . . . . . . . . . 7
Projects 8
Current and Ongoing Projects . . . . . . . . . . . . . . . . . . . . . . . . 8
Recycled Water Connection . . . . . . . . . . . . . . . . . . . . . . . 8
Vehicle Replacement . . . . . . . . . . . . . . . . . . . . . . . . . . 8
Utility Management Software . . . . . . . . . . . . . . . . . . . . . . . 8
Lighting Retrofits . . . . . . . . . . . . . . . . . . . . . . . . . . . . 9
Office Paper Reduction and Document Management . . . . . . . . . . . . . 9
Environmental Management System Institute . . . . . . . . . . . . . . . 10
Electrical Vehicle Charging Stations . . . . . . . . . . . . . . . . . . . 10
Waste Reduction and Recycling . . . . . . . . . . . . . . . . . . . . . 10
Silicon Valley Berryessa Extension . . . . . . . . . . . . . . . . . . . . . 11
Outreach and Education . . . . . . . . . . . . . . . . . . . . . . . . . 11
Completed Projects . . . . . . . . . . . . . . . . . . . . . . . . . . . 12
Energy Conservation . . . . . . . . . . . . . . . . . . . . . . . . . . 12
Water Conservation . . . . . . . . . . . . . . . . . . . . . . . . . . 12
Other Completed Projects . . . . . . . . . . . . . . . . . . . . . . . 12
Future Projects and Goals . . . . . . . . . . . . . . . . . . . . . . . . 13
TABLE OF CONTENTS
1
Executive SummaryAnnual reporting was adopted as part of
VTA’s Sustainability Program in February
2008 . This is VTA’s seventh annual sustain-
ability report . The report documents our
progress toward meeting sustainability
objectives and targets .
In comparison to the previous reporting year
(2013), VTA reduced electricity usage by
2 percent, natural gas usage by 23 percent,
and hazardous waste by 37 percent . Solid
waste generation stayed consistent . Water
use increased by 4 percent primarily due to
higher levels of irrigation as a result of ongo-
ing dry conditions .
2014 is marked with several achievements
including:
• Arecycledwaterconnectiontothebus
wash facility at Chaboya Bus Division
• AnewSustainableFleetPolicyto
reduce emissions and pollutants from
vehicle operations and maintenance
• Utilizationofanewutilitymanagement
software to monitor usage and costs at
our facilities
• ReplacementoffluorescentandHigh
Pressure Sodium light fixtures with
LEDs at light rail station platforms and
operating divisions
• Initiationofapartnerprojectwith
Information Technology to manage toner
and printing supplies, reduce office
paper use, and remove underutilized
equipment
• ParticipationinaFederalTransit
Administration Program designed to help
agencies implement an Environmental
Management System, using the
14001 Standard of the International
Organization for Standardization
• Electricvehiclechargingstationpilot
program at River Oaks
• Initiationofapilotprogramtoreplace
traditional open-air trash cans with solar-
powered trash and recycling compacters
• Extensivecoordinationtomeetsustain-
ability design and construction goals
for VTA’s BART Silicon Valley Berryessa
Extension Project .
Future projects include conducting an inven-
tory of greenhouse gas emissions and expand-
ing lighting retrofit projects to additional
facilities .
To learn more about VTA’s Sustainability
Program, visit www.vta.org/sustainability .

2
About VTAThe Santa Clara Valley
Transportation Authority (VTA) is
an independent special district that
provides bus, light rail, and paratran-
sit services, as well as participates
as a funding partner in regional rail
service . As Santa Clara County’s
congestion management agency,
VTA is responsible for countywide
transportation planning, including
congestion management, design and
construction of specific highway,
pedestrian, and bicycle improvement
projects, as well as promotion of
transit-oriented development .
VTA Facts
Total Ridership FY’14 . . . . . . . . . . . . . . . . . . . . . 43,428,492
Service Area . . . . . . . . . . . . . . . . . . . . . . . 346 square miles
Total County Population . . . . . . . . . . . . . . . . . . . . 1 .8 million
Bus Ridership (avg weekday FY’14) . . . . . . . . . . . .105,969
Light Rail Ridership (avg weekday FY’14) . . . . . . . . 35,012
# of Buses . . . . . . . . . . . . . . . . . . . . . . . . . . . . . . . . . . . . . 505
# of Light Rail Cars . . . . . . . . . . . . . . . . . . . . . . . . . . . . . . 99
Bus Routes . . . . . . . . . . . . . . . . . . . . . . . . . . . . . . . . . . . . . . 70
Bus Stops . . . . . . . . . . . . . . . . . . . . . . . . . . . . . . . . . . . . .3,832
Light Rail Lines . . . . . . . . . . . . . . . . . . . . . . . . . . . . . . . . . . . .3
Light Rail Stations . . . . . . . . . . . . . . . . . . . . . . . . . . . . . . . 62
Miles of Bus Routes (round trip) . . . . . . . . . . . . . . . . . 1,236
Miles of Light Rail Track . . . . . . . . . . . . . . . . . . . . . . . . .42 .2
Total Operating Budget . . . . . . . . . . . . . . . . . . $380 million
Total Capital Program Budget . . . . . . . . . . . . . .$4 .5 billion
# of Employees . . . . . . . . . .2,100 (70% are in Operations)
On Time Performance . . . . . .86% (Bus), 85% (Light Rail)
3
Report Purpose and Scope
Purpose
The purpose of this report is to measure, track,
and effectively manage current and future
sustainability program initiatives . Annual report-
ing was adopted as part of VTA’s Sustainability
Program in February 2008 . The strategy is
stated as follows: “Establish benchmarks to
measure the progress and performance of VTA’s
Sustainability Program and report back to the
VTA Board of Directors on an annual basis .
Among other actions, this report will involve
reassessing VTA’s fuel, electrical, and water
usage on a regular basis .”
Scope
The scope of this report is limited to the follow-
ing main facilities: Cerone Bus Division (North
San Jose), Chaboya Bus Division (South San
Jose), North Bus Division (Mountain View),
Guadalupe Light Rail Division (Downtown San
Jose), and River Oaks Administrative Division
(North San Jose) .
VTA’s Cerone facility includes the Cerone Bus
Operating Division, the Overhaul and Repair
(O&R) Division, and the Distribution Center .
Cerone Minor Maintenance serves as a base for
operations, fueling, servicing, detailing, running
repair, and preventive maintenance . The O&R
facility provides a centralized major maintenance
program for the entire VTA bus fleet, includ-
ing paint and body repair, upholstery, fare-
box repair, transmission and small component
rebuild, engine overhaul, and heavy repair and
maintenance associated with major component
removal . This facility also supports steam clean-
ing and a water treatment plant to treat waste-
water from cleaning operations . The Distribution
Center is responsible for the distribution of parts
to support all bus operating divisions .
Chaboya Division is VTA’s largest-capacity bus
operations and maintenance facility . The facil-
ity includes a maintenance shop, fueling facility,
two bus washers, transit operations, bus opera-
tor training, a maintenance training building, a
facilities maintenance building, steam cleaning
equipment, and a water treatment plant to treat
wastewater from cleaning operations .
North Division is the smallest of VTA’s bus oper-
ating facilities and includes a maintenance shop,
fueling facility, bus wash, transit operations,
steam cleaning equipment, and a water treat-
ment plant .
Guadalupe Division is responsible for all light rail
operations and maintenance functions, including
major vehicle overhaul, historic trolley mainte-
nance, and light rail operator and maintenance
training . This facility is also home to the Way,
Power and Signal Department, which is respon-
sible for preventive maintenance and repair of
wayside facilities including substations and over-
head contact systems, light rail signals, tracks,
stations, and park & ride lots . The Operations
Control Center, a communication and emergency
response hub for coordinating and directing all
Bus and Light Rail Transit Operations, is also
located here .
River Oaks Division includes VTA’s administrative
offices and Office of the General Manager .
4
Sustainability Program Overview
IntroductionThe Sustainability Program was approved by
the VTA Board of Directors in February 2008 .
The goal of the Sustainability Program is to
strengthen VTA’s commitment to the environ-
ment by reducing the consumption of natural
resources, the creation of greenhouse gases, and
the generation of pollution in the provision of
public transportation services . The strategies to
achieve this goal include educational programs
and outreach, transit-oriented development,
increasing sustainability at existing facilities,
incorporating green building practices in new
facilities, developing environmental prefer-
able procurement strategies, and establish-
ing a means of measuring the progress of the
Sustainability Program .
Sustainability CommitmentOur sustainability mission is inherently linked
to providing the public with a safe and efficient
countywide transportation system . Those who
choose to ride public transportation reduce their
carbon footprint and conserve energy by elimi-
nating travel that would have otherwise been
made in a private vehicle . The result is fewer
vehicle miles of travel and reduced emissions .
According to a 2010 report by the Federal Transit
Administration (FTA), public transportation
reduces U .S . travel by an estimated 102 .2 billion
in vehicle miles traveled each year .
In 2009, VTA became a founding signatory of
the American Public Transportation Association
(APTA) Sustainability Commitment . The
Commitment sets out common sustainabil-
ity principles, an action plan, and a course for
progress . VTA is currently at the Bronze level,
but could move up to Silver, Gold or Platinum
as we achieve our goals . Under Bronze, VTA is
committed to reduction targets of 2 percent over
the baseline within two years . These reduction
targets have been met for VTA’s five main oper-
ating divisions and are being explored for other
facilities .
There is no dedicated source of funds for the
Sustainability Program . Funding is dependent on
the two-year budget process . In FY 14/15, VTA
budgeted $1 .2 million for the program . Future
funding would enable VTA to continue current
and planned projects .
Sustainability TeamA Sustainability Team of 8-12 employees meets
bimonthly to plan projects and monitor the prog-
ress of VTA’s Sustainability Program . Members of
the Sustainability Team represent VTA’s diverse
array of responsibilities and functions including
Operations, Facilities Maintenance, Engineering,
Construction, Fiscal Resources, and Planning
and Program Development . In addition, approxi-
mately five employees allocate a portion of their
time to support the program .

5
EnvironmentalPerformance
Fuel
Most of the bus fleet uses ultra-low sulfur
diesel fuel (15 parts per million) . Community
buses and non-revenue vehicles use gasoline .
Community buses began revenue service in
2007 . In 2009, VTA introduced biodiesel and
started to replace older buses with diesel-
electric hybrids . The vehicle fleet breakdown by
fuel type in 2014 is 91 percent diesel, 3 percent
biodiesel, and 6 percent gasoline .
In 2014, VTA spent approximately $13 .9 million
and used 4 .3 million gallons of fuel . Graph 1
shows the change in fuel economy of the diesel
bus fleet . Miles per gallon was calculated using
the total service miles driven and diesel fuel
consumed for each fiscal year . Fuel economy
increased by 12 percent since the baseline year .
In 2014, diesel-electric hybrids made up 18 per-
cent of the total fleet .
Energy
VTA’s electricity and natural gas is supplied by
Pacific Gas and Electric (PG&E), City of Palo
Alto, Silicon Valley Power (City of Santa Clara),
and Solar Star . At Cerone Division, VTA uses
propane for heating .
Electricity Usage and Costs
In 2014, total electricity use for our main divi-
sions and traction power, which operates the
light rail system, was 30 .1 million kilowatt hours
(kWh), enough to power 2,500 homes . This is
approximately 5 percent lower than the previ-
ous year and 22 percent lower than the 2007
baseline year . The reduction in usage since the
baseline year is primarily a result of implement-
ing best practices for traction power, which is
the largest user of electricity . These practices
include optimizing the number of cars per train
and turning off auxiliary power systems for
trains parked at the light rail division .
The electricity use at VTA’s main operating divi-
sions, excluding light rail, is shown in Graph 2 .
Electricity use is lower at Chaboya North, and
Cerone where solar panels are installed . Since
the 2007 baseline year, VTA’s electricity use
has decreased by 10 percent . Usage decreased
by 2 percent compared to the previous year .
Despite the reduction in usage, electrical costs
increased by 11 percent . In 2014, VTA spent $1 .2
million on electricity, excluding traction power .
The total cost of electricity in 2014 with traction
power was $4 .57 million .
0
2000000
4000000
6000000
8000000
10000000River OaksCeroneNorthChaboya
201420132007
3.5
4.5
4
2008
3.803.96 3.95
4.11 4.104.29 4.26
2009 2010 2011 2012 2013 2014
0
300000
600000
900000
1200000
1500000
NorthChaboyaCerone
Utility UsageSolar Usage
0
500
1000
1500
2000
2500
3000
TrashRecyclables
201420132007
0
1000000
2000000
3000000
4000000
5000000
NorthChaboyaCerone
1,444,996.51
1,445,950.00
1,604,908.00
816,730.52
873,342.00
771,699.00
899,217.69
1,059,786.00
1,074,793.00
201420132012
0
30000
60000
90000
120000
150000
201420132007
GuadalupeRiver OaksNorthChaboya
0
5000000
10000000
15000000
20000000
25000000
30000000GuadalupeRiver OaksCeroneNorthChaboya
201420132007
0
100000
200000
300000
400000
500000
600000
700000
800000
ScannedPrinted
ColorBlack and White
0
500
1000
1500
2000Energy (kWh)
Ener
gy (k
Wh)
Februa
ry '15
Januar
y '15
December
'14
November
'14
October
'14
Septem
ber '1
4
August
'14
July '1
4
June '1
4
May '14
April '1
4
March '
14
Februa
ry '14
Januar
y '14
December
'13
November
'13
October
'13
Septem
ber '1
3
August
'13
July '1
3
June '1
3
May '13
0
5
10
15
20Accumulated (MWh)
Accumulated (MWh)
Graph 1: Miles per gallon (diesel fuel)
from FY2008-FY2014
0
2000000
4000000
6000000
8000000
10000000River OaksCeroneNorthChaboya
201420132007
3.5
4.5
4
2008
3.803.96 3.95
4.11 4.104.29 4.26
2009 2010 2011 2012 2013 2014
0
300000
600000
900000
1200000
1500000
NorthChaboyaCerone
Utility UsageSolar Usage
0
500
1000
1500
2000
2500
3000
TrashRecyclables
201420132007
0
1000000
2000000
3000000
4000000
5000000
NorthChaboyaCerone
1,444,996.51
1,445,950.00
1,604,908.00
816,730.52
873,342.00
771,699.00
899,217.69
1,059,786.00
1,074,793.00
201420132012
0
30000
60000
90000
120000
150000
201420132007
GuadalupeRiver OaksNorthChaboya
0
5000000
10000000
15000000
20000000
25000000
30000000GuadalupeRiver OaksCeroneNorthChaboya
201420132007
0
100000
200000
300000
400000
500000
600000
700000
800000
ScannedPrinted
ColorBlack and White
0
500
1000
1500
2000Energy (kWh)
Ener
gy (k
Wh)
Februa
ry '15
Januar
y '15
December
'14
November
'14
October
'14
Septem
ber '1
4
August
'14
July '1
4
June '1
4
May '14
April '1
4
March '
14
Februa
ry '14
Januar
y '14
December
'13
November
'13
October
'13
Septem
ber '1
3
August
'13
July '1
3
June '1
3
May '13
0
5
10
15
20Accumulated (MWh)
Accumulated (MWh)
Graph 2: Electrical Usage at
VTA’s Main Operating Divisions
6
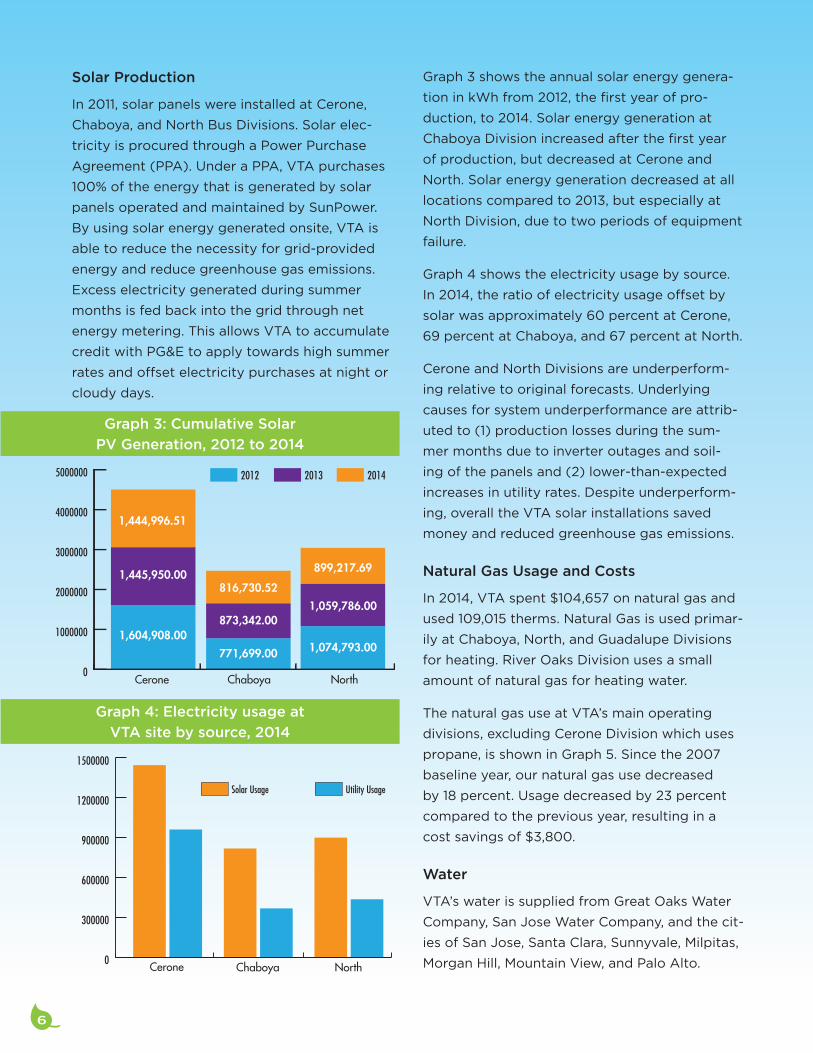
Solar Production
In 2011, solar panels were installed at Cerone,
Chaboya, and North Bus Divisions . Solar elec-
tricity is procured through a Power Purchase
Agreement (PPA) . Under a PPA, VTA purchases
100% of the energy that is generated by solar
panels operated and maintained by SunPower .
By using solar energy generated onsite, VTA is
able to reduce the necessity for grid-provided
energy and reduce greenhouse gas emissions .
Excess electricity generated during summer
months is fed back into the grid through net
energy metering . This allows VTA to accumulate
credit with PG&E to apply towards high summer
rates and offset electricity purchases at night or
cloudy days .
Graph 3 shows the annual solar energy genera-
tion in kWh from 2012, the first year of pro-
duction, to 2014 . Solar energy generation at
Chaboya Division increased after the first year
of production, but decreased at Cerone and
North . Solar energy generation decreased at all
locations compared to 2013, but especially at
North Division, due to two periods of equipment
failure .
Graph 4 shows the electricity usage by source .
In 2014, the ratio of electricity usage offset by
solar was approximately 60 percent at Cerone,
69 percent at Chaboya, and 67 percent at North .
Cerone and North Divisions are underperform-
ing relative to original forecasts . Underlying
causes for system underperformance are attrib-
uted to (1) production losses during the sum-
mer months due to inverter outages and soil-
ing of the panels and (2) lower-than-expected
increases in utility rates . Despite underperform-
ing, overall the VTA solar installations saved
money and reduced greenhouse gas emissions .
Natural Gas Usage and Costs
In 2014, VTA spent $104,657 on natural gas and
used 109,015 therms . Natural Gas is used primar-
ily at Chaboya, North, and Guadalupe Divisions
for heating . River Oaks Division uses a small
amount of natural gas for heating water .
The natural gas use at VTA’s main operating
divisions, excluding Cerone Division which uses
propane, is shown in Graph 5 . Since the 2007
baseline year, our natural gas use decreased
by 18 percent . Usage decreased by 23 percent
compared to the previous year, resulting in a
cost savings of $3,800 .
Water
VTA’s water is supplied from Great Oaks Water
Company, San Jose Water Company, and the cit-
ies of San Jose, Santa Clara, Sunnyvale, Milpitas,
MorganHill,MountainView,andPaloAlto.
0
2000000
4000000
6000000
8000000
10000000River OaksCeroneNorthChaboya
201420132007
3.5
4.5
4
2008
3.803.96 3.95
4.11 4.104.29 4.26
2009 2010 2011 2012 2013 2014
0
300000
600000
900000
1200000
1500000
NorthChaboyaCerone
Utility UsageSolar Usage
0
500
1000
1500
2000
2500
3000
TrashRecyclables
201420132007
0
1000000
2000000
3000000
4000000
5000000
NorthChaboyaCerone
1,444,996.51
1,445,950.00
1,604,908.00
816,730.52
873,342.00
771,699.00
899,217.69
1,059,786.00
1,074,793.00
201420132012
0
30000
60000
90000
120000
150000
201420132007
GuadalupeRiver OaksNorthChaboya
0
5000000
10000000
15000000
20000000
25000000
30000000GuadalupeRiver OaksCeroneNorthChaboya
201420132007
0
100000
200000
300000
400000
500000
600000
700000
800000
ScannedPrinted
ColorBlack and White
0
500
1000
1500
2000Energy (kWh)
Ener
gy (k
Wh)
Februa
ry '15
Januar
y '15
December
'14
November
'14
October
'14
Septem
ber '1
4
August
'14
July '1
4
June '1
4
May '14
April '1
4
March '
14
Februa
ry '14
Januar
y '14
December
'13
November
'13
October
'13
Septem
ber '1
3
August
'13
July '1
3
June '1
3
May '13
0
5
10
15
20Accumulated (MWh)
Accumulated (MWh)
0
2000000
4000000
6000000
8000000
10000000River OaksCeroneNorthChaboya
201420132007
3.5
4.5
4
2008
3.803.96 3.95
4.11 4.104.29 4.26
2009 2010 2011 2012 2013 2014
0
300000
600000
900000
1200000
1500000
NorthChaboyaCerone
Utility UsageSolar Usage
0
500
1000
1500
2000
2500
3000
TrashRecyclables
201420132007
0
1000000
2000000
3000000
4000000
5000000
NorthChaboyaCerone
1,444,996.51
1,445,950.00
1,604,908.00
816,730.52
873,342.00
771,699.00
899,217.69
1,059,786.00
1,074,793.00
201420132012
0
30000
60000
90000
120000
150000
201420132007
GuadalupeRiver OaksNorthChaboya
0
5000000
10000000
15000000
20000000
25000000
30000000GuadalupeRiver OaksCeroneNorthChaboya
201420132007
0
100000
200000
300000
400000
500000
600000
700000
800000
ScannedPrinted
ColorBlack and White
0
500
1000
1500
2000Energy (kWh)
Ener
gy (k
Wh)
Februa
ry '15
Januar
y '15
December
'14
November
'14
October
'14
Septem
ber '1
4
August
'14
July '1
4
June '1
4
May '14
April '1
4
March '
14
Februa
ry '14
Januar
y '14
December
'13
November
'13
October
'13
Septem
ber '1
3
August
'13
July '1
3
June '1
3
May '13
0
5
10
15
20Accumulated (MWh)
Accumulated (MWh)
Graph 3: Cumulative Solar
PV Generation, 2012 to 2014
Graph 4: Electricity usage at
VTA site by source, 2014

7
The water use at VTA’s main operating divisions
is shown in Graph 6 . Since the 2007 baseline
year, our water use increased by 10 percent .
Overall, VTA spent $133,104 and consumed 26 .1
million gallons of water in 2014, enough to fill 39
Olympic-sized swimming pools . Usage increased
by 4 percent compared to the previous year . The
increase in usage is a result of the drought and
vehicle washing . River Oaks Division consistently
uses more water than the other divisions due to
irrigation.Higherwaterusein2014isattributed
to water line breaks at Cerone and River Oaks
and problems with back flushing at a bus wash
facility . These issues have been resolved and part
of the irrigation system at River Oaks is being
capped to prevent future leaks .
Waste
VTA’s solid waste and recycling providers are
Republic Services and the City of Mountain View .
Graph 7 shows the annual waste and recycling
generation at VTA’s main operating divisions .
Waste and recycling fluctuates seasonally and
from year-to-year based on operations . In 2014,
approximately 530 tons of materials (mixed
paper, plastic, aluminum, glass, wood, and metal)
were recycled and 1,193 tons of waste were col-
lected by VTA’s solid waste providers, represent-
ing a waste diversion rate of 31 percent . Overall,
waste has been reduced 40 percent since 2007 .
Waste levels have stayed consistent compared to
the previous year .
HazardouswasteisgeneratedatChaboya,North,
Cerone, and Guadalupe Divisions . Waste streams
include steam cleaner and bus wash sump
interceptor waste and absorbent pads used to
remove oil and grease and clean small spills . In
comparison to the 2006 baseline year (attributed
to a four year reporting cycle), hazardous waste
decreased by 184 tons . In 2014, we generated 81
tons of waste, a 37 percent reduction compared
to the previous year . The reduction in waste
results from fluctuations in maintenance activi-
ties, improvements in waste management, and
increased employee education and awareness .
0
2000000
4000000
6000000
8000000
10000000River OaksCeroneNorthChaboya
201420132007
3.5
4.5
4
2008
3.803.96 3.95
4.11 4.104.29 4.26
2009 2010 2011 2012 2013 2014
0
300000
600000
900000
1200000
1500000
NorthChaboyaCerone
Utility UsageSolar Usage
0
500
1000
1500
2000
2500
3000
TrashRecyclables
201420132007
0
1000000
2000000
3000000
4000000
5000000
NorthChaboyaCerone
1,444,996.51
1,445,950.00
1,604,908.00
816,730.52
873,342.00
771,699.00
899,217.69
1,059,786.00
1,074,793.00
201420132012
0
30000
60000
90000
120000
150000
201420132007
GuadalupeRiver OaksNorthChaboya
0
5000000
10000000
15000000
20000000
25000000
30000000GuadalupeRiver OaksCeroneNorthChaboya
201420132007
0
100000
200000
300000
400000
500000
600000
700000
800000
ScannedPrinted
ColorBlack and White
0
500
1000
1500
2000Energy (kWh)
Ener
gy (k
Wh)
Februa
ry '15
Januar
y '15
December
'14
November
'14
October
'14
Septem
ber '1
4
August
'14
July '1
4
June '1
4
May '14
April '1
4
March '
14
Februa
ry '14
Januar
y '14
December
'13
November
'13
October
'13
Septem
ber '1
3
August
'13
July '1
3
June '1
3
May '13
0
5
10
15
20Accumulated (MWh)
Accumulated (MWh)
0
2000000
4000000
6000000
8000000
10000000River OaksCeroneNorthChaboya
201420132007
3.5
4.5
4
2008
3.803.96 3.95
4.11 4.104.29 4.26
2009 2010 2011 2012 2013 2014
0
300000
600000
900000
1200000
1500000
NorthChaboyaCerone
Utility UsageSolar Usage
0
500
1000
1500
2000
2500
3000
TrashRecyclables
201420132007
0
1000000
2000000
3000000
4000000
5000000
NorthChaboyaCerone
1,444,996.51
1,445,950.00
1,604,908.00
816,730.52
873,342.00
771,699.00
899,217.69
1,059,786.00
1,074,793.00
201420132012
0
30000
60000
90000
120000
150000
201420132007
GuadalupeRiver OaksNorthChaboya
0
5000000
10000000
15000000
20000000
25000000
30000000GuadalupeRiver OaksCeroneNorthChaboya
201420132007
0
100000
200000
300000
400000
500000
600000
700000
800000
ScannedPrinted
ColorBlack and White
0
500
1000
1500
2000Energy (kWh)
Ener
gy (k
Wh)
Februa
ry '15
Januar
y '15
December
'14
November
'14
October
'14
Septem
ber '1
4
August
'14
July '1
4
June '1
4
May '14
April '1
4
March '
14
Februa
ry '14
Januar
y '14
December
'13
November
'13
October
'13
Septem
ber '1
3
August
'13
July '1
3
June '1
3
May '13
0
5
10
15
20Accumulated (MWh)
Accumulated (MWh)
Graph 5: Natural Gas Usage at
VTA’s Main Operating Divisions
Graph 7: Solid Waste Levels at
VTA’s Main Operating Divisions
Graph 6: Water Usage at
VTA’s Main Operating Divisions
8
Projects
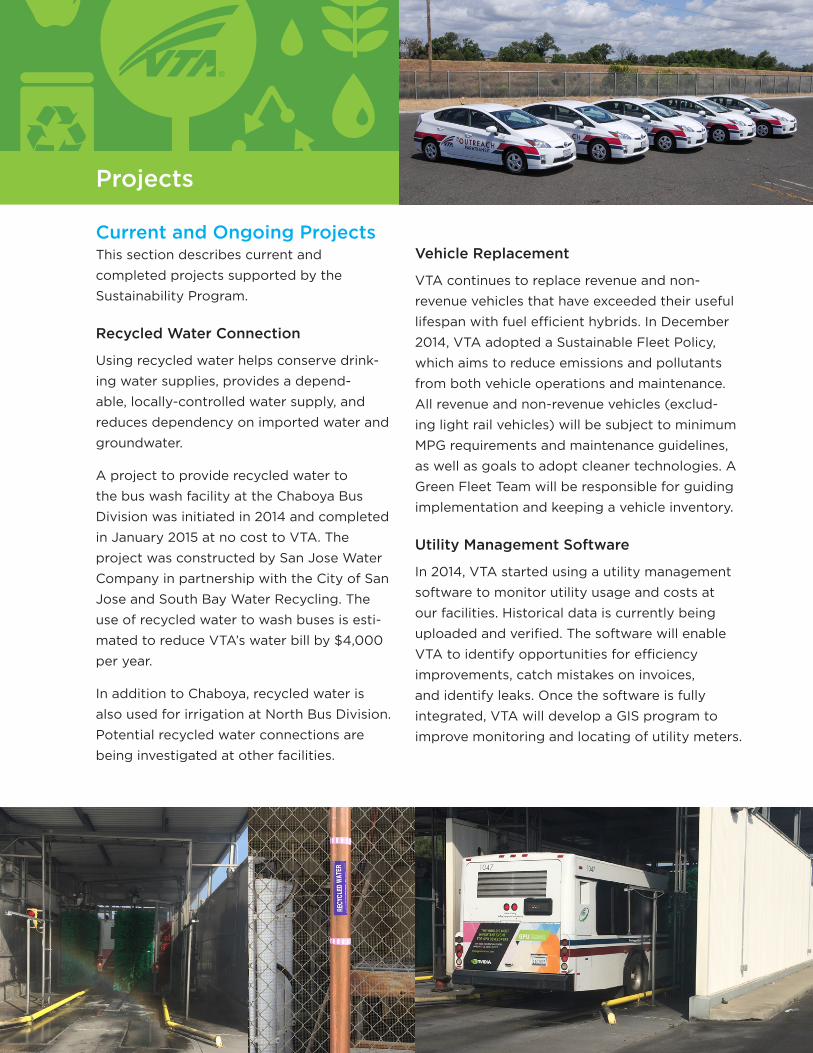
Current and Ongoing ProjectsThis section describes current and
completed projects supported by the
Sustainability Program .
Recycled Water Connection
Using recycled water helps conserve drink-
ing water supplies, provides a depend-
able, locally-controlled water supply, and
reduces dependency on imported water and
groundwater .
A project to provide recycled water to
the bus wash facility at the Chaboya Bus
Division was initiated in 2014 and completed
in January 2015 at no cost to VTA . The
project was constructed by San Jose Water
Company in partnership with the City of San
Jose and South Bay Water Recycling . The
use of recycled water to wash buses is esti-
mated to reduce VTA’s water bill by $4,000
per year .
In addition to Chaboya, recycled water is
also used for irrigation at North Bus Division .
Potential recycled water connections are
being investigated at other facilities .
Vehicle Replacement
VTA continues to replace revenue and non-
revenue vehicles that have exceeded their useful
lifespan with fuel efficient hybrids . In December
2014, VTA adopted a Sustainable Fleet Policy,
which aims to reduce emissions and pollutants
from both vehicle operations and maintenance .
All revenue and non-revenue vehicles (exclud-
ing light rail vehicles) will be subject to minimum
MPG requirements and maintenance guidelines,
as well as goals to adopt cleaner technologies . A
Green Fleet Team will be responsible for guiding
implementation and keeping a vehicle inventory .
Utility Management Software
In 2014, VTA started using a utility management
software to monitor utility usage and costs at
ourfacilities.Historicaldataiscurrentlybeing
uploaded and verified . The software will enable
VTA to identify opportunities for efficiency
improvements, catch mistakes on invoices,
and identify leaks . Once the software is fully
integrated, VTA will develop a GIS program to
improve monitoring and locating of utility meters .
9
Lighting Retrofits
FluorescentandHighPressureSodiumlightfix-
tures are being replaced with LED fixtures . The
LED fixtures contain no hazardous material and
are manufactured in the USA . The benefits of
LED lighting include: lower wattage and energy
use, better quality lighting, and lower mainte-
nance costs .
In 2014, VTA retrofitted 139 light fixtures at
the following light rail station platforms: Civic
Center, Children’s Discovery Museum, Gish,
Metro, Karina, Component, Bonaventura,
Orchard, River Oaks, and Tasman . The light rail
station retrofits are estimated to save $11,000
per year with a return on investment period of
less than 3 years . The lighting retrofits conserve
enough energy to power 5 homes for one year
and reduce greenhouse gas emissions by 39 .6
metric tons . Light fixtures at VTA’s main operat-
ing divisions are being retrofitted on an ongoing
basis . To date, over 3,200 fixtures have been
replaced mostly at Cerone, Chaboya, Guadalupe,
and North Divisions . There are opportunities
to conserve energy at the River Oaks Division
through additional lighting retrofits and convert-
ing to natural gas for heating .
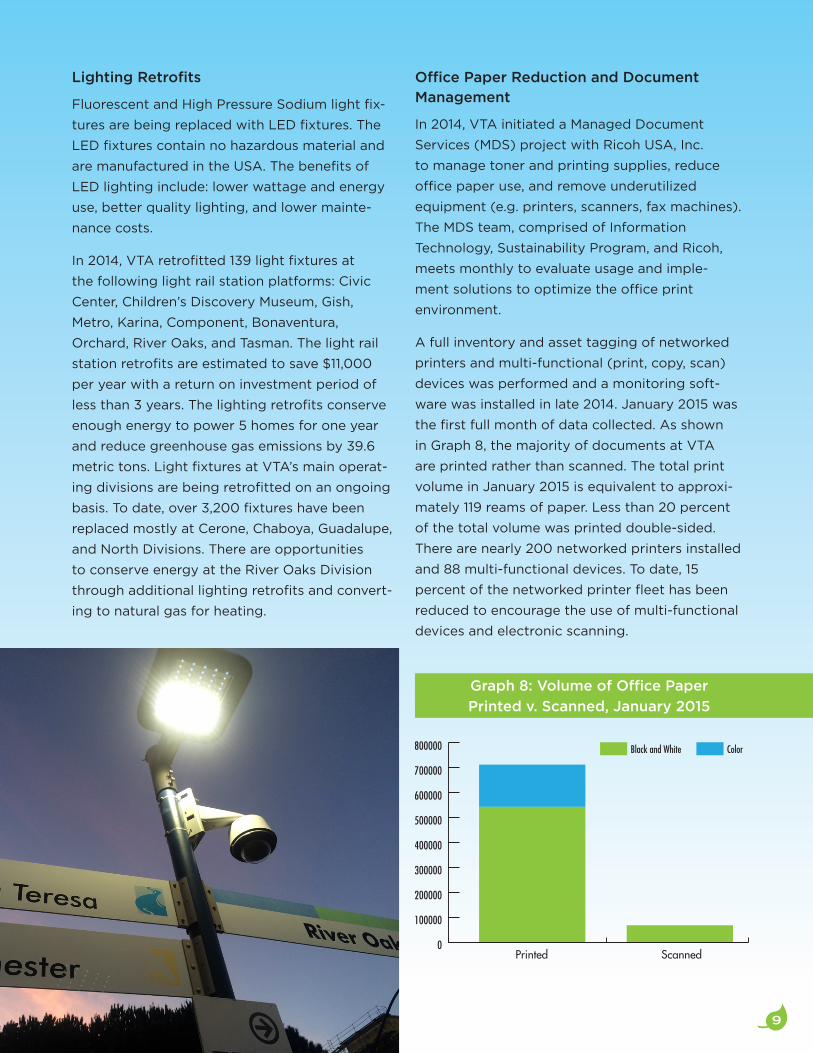
Office Paper Reduction and Document Management
In 2014, VTA initiated a Managed Document
Services (MDS) project with Ricoh USA, Inc .
to manage toner and printing supplies, reduce
office paper use, and remove underutilized
equipment (e .g . printers, scanners, fax machines) .
The MDS team, comprised of Information
Technology, Sustainability Program, and Ricoh,
meets monthly to evaluate usage and imple-
ment solutions to optimize the office print
environment .
A full inventory and asset tagging of networked
printers and multi-functional (print, copy, scan)
devices was performed and a monitoring soft-
ware was installed in late 2014 . January 2015 was
the first full month of data collected . As shown
in Graph 8, the majority of documents at VTA
are printed rather than scanned . The total print
volume in January 2015 is equivalent to approxi-
mately 119 reams of paper . Less than 20 percent
of the total volume was printed double-sided .
There are nearly 200 networked printers installed
and 88 multi-functional devices . To date, 15
percent of the networked printer fleet has been
reduced to encourage the use of multi-functional
devices and electronic scanning .
0
2000000
4000000
6000000
8000000
10000000River OaksCeroneNorthChaboya
201420132007
3.5
4.5
4
2008
3.803.96 3.95
4.11 4.104.29 4.26
2009 2010 2011 2012 2013 2014
0
300000
600000
900000
1200000
1500000
NorthChaboyaCerone
Utility UsageSolar Usage
0
500
1000
1500
2000
2500
3000
TrashRecyclables
201420132007
0
1000000
2000000
3000000
4000000
5000000
NorthChaboyaCerone
1,444,996.51
1,445,950.00
1,604,908.00
816,730.52
873,342.00
771,699.00
899,217.69
1,059,786.00
1,074,793.00
201420132012
0
30000
60000
90000
120000
150000
201420132007
GuadalupeRiver OaksNorthChaboya
0
5000000
10000000
15000000
20000000
25000000
30000000GuadalupeRiver OaksCeroneNorthChaboya
201420132007
0
100000
200000
300000
400000
500000
600000
700000
800000
ScannedPrinted
ColorBlack and White
0
500
1000
1500
2000Energy (kWh)
Ener
gy (k
Wh)
Februa
ry '15
Januar
y '15
December
'14
November
'14
October
'14
Septem
ber '1
4
August
'14
July '1
4
June '1
4
May '14
April '1
4
March '
14
Februa
ry '14
Januar
y '14
December
'13
November
'13
October
'13
Septem
ber '1
3
August
'13
July '1
3
June '1
3
May '13
0
5
10
15
20Accumulated (MWh)
Accumulated (MWh)
Graph 8: Volume of Office Paper
Printed v Scanned, January 2015

10
Environmental Management System Institute
In 2013, VTA was accepted into the Federal
Transit Administration’s (FTA) fourth round of
Environmental Management Systems (EMS) train-
ing and technical assistance for public trans-
portation agencies . FTA’s 18-month program is
designed to help agencies develop and imple-
ment an EMS, using the 14001 Standard of the
International Organization for Standardization
(ISO) .
In 2014, a pilot EMS was implemented at Cerone
Bus Division . The primary benefits include
improved employee awareness of potential
environmental impacts of work activities and
improved record keeping of corrective actions .
VTA’s EMS Core Team meets monthly and
engages management in its progress towards
continual improvement and pollution prevention .
Electric Vehicle Charging Stations
In 2013, VTA received
a free electric vehicle
(EV) charging station
from ChargePoint and
purchased a second
charging station,
which were installed
at River Oaks Division
under an initial pilot
program . The pair of
stations provide the
ability to charge four
EVs simultaneously
and are open to the
public and employ-
ees for a cost of $1 .25
per hour . Graph 9 shows the usage from 2013 to
date . The average number of sessions was 120
per month, at an average length of 2 .5 hours per
session . Given the high demand, we are evaluat-
ing the feasibility of installing charging stations
at other facilities .
Waste Reduction and Recycling
Continual improvements have been made to
VTA’s recycling programs and services to reduce
waste . In 2008, battery recycling was expanded
to administrative offices . In 2009, compost con-
tainers were added to the employee cafeteria
to collect food scraps . Between 2010 and 2013,
recycling posters and containers were updated to
reflect changes in our waste contract .
In 2014, we began a pilot program to replace tra-
ditional open-air trash cans with solar-powered
trash and recycling compacters . The high-tech
trash eaters, called Big Belly trash cans, hold 5
times the amount of waste thanks to the on-site
0
2000000
4000000
6000000
8000000
10000000River OaksCeroneNorthChaboya
201420132007
3.5
4.5
4
2008
3.803.96 3.95
4.11 4.104.29 4.26
2009 2010 2011 2012 2013 2014
0
300000
600000
900000
1200000
1500000
NorthChaboyaCerone
Utility UsageSolar Usage
0
500
1000
1500
2000
2500
3000
TrashRecyclables
201420132007
0
1000000
2000000
3000000
4000000
5000000
NorthChaboyaCerone
1,444,996.51
1,445,950.00
1,604,908.00
816,730.52
873,342.00
771,699.00
899,217.69
1,059,786.00
1,074,793.00
201420132012
0
30000
60000
90000
120000
150000
201420132007
GuadalupeRiver OaksNorthChaboya
0
5000000
10000000
15000000
20000000
25000000
30000000GuadalupeRiver OaksCeroneNorthChaboya
201420132007
0
100000
200000
300000
400000
500000
600000
700000
800000
ScannedPrinted
ColorBlack and White
0
500
1000
1500
2000Energy (kWh)
Ener
gy (k
Wh)
Februa
ry '15
Januar
y '15
December
'14
November
'14
October
'14
Septem
ber '1
4
August
'14
July '1
4
June '1
4
May '14
April '1
4
March '
14
Februa
ry '14
Januar
y '14
December
'13
November
'13
October
'13
Septem
ber '1
3
August
'13
July '1
3
June '1
3
May '13
0
5
10
15
20Accumulated (MWh)
Accumulated (MWh)
Graph 9: EV Charger Usage

11
compaction . The compactor, sensors, and wire-
less card are powered by a solar panel on the
roof of the unit . When the trash reaches the
height level of the sensor, the compactor acti-
vates . Those sensors also track the unit’s fullness
level and identify mechanical problems—send-
ing status updates wirelessly to our Bus Stop
Maintenance Department . The extra capacity
has the potential to reduce pickups from 7 to 2
times per week, thus saving VTA money in labor
and fuel . The pilot program is currently in place
at Great Mall Transit Center with estimated cost
savings of $3,000 per month .
Silicon Valley Berryessa Extension
Sustainability is a key component for VTA’s
10-mile BART Silicon Valley Berryessa Extension
Project . Aggressive waste diversion goals, pota-
ble water reduction, recycled content in concrete,
and a project-wide “carbon footprint” analysis
are required during construction . Sustainable
design features include using LED lighting, sky-
lights, photovoltaics in parking structures, native
and/or drought-tolerant plants, reclaimed water
for landscaping, and low-flow fixtures, when
possible .
Stations are designed with amenities such as
pedestrian walkways, bike paths, bicycle storage
rooms, bus-only lanes, bus transfer centers, pri-
vate shuttle areas, and a direct connection to the
existing Montague Light Rail Station in Milpitas
to encourage station access by modes other than
single-occupant vehicles . Projected daily BART
ridership for the Project will reduce regional traf-
fic congestion and greenhouse gas emissions by
over 3,400 tons per year . This is equivalent to
over 1,100 full-grown elephants weighing an aver-
age of 3 tons each, or 1,700 households’ annual
municipal garbage .
Outreach and Education
One of VTA’s ongoing goals is to increase envi-
ronmental awareness and promote environ-
mental stewardship in the workplace and in the
local community . Ongoing outreach and educa-
tion to employees include introduction of the
Sustainability Program at each New Employee
Orientation, Bike to Work Day competitions,
Spare the Air Alert messages when a Bay Area
Spare the Air Day is issued, and annual Earth Day
events .
In addition, VTA’s Sustainability Program works
collaboratively with Sustainable Silicon Valley,
Joint Venture Silicon Valley, and local agencies
to combat climate change and promote environ-
mental stewardship . For example, VTA is a task
force member for the Silicon Valley 2 .0 Project,
a regional effort, managed by the Santa Clara
County Office of Sustainability and funded by the
Strategic Growth Council, to minimize the antici-
pated impacts of climate change and reduce the
generation of local greenhouse gas emissions .
12
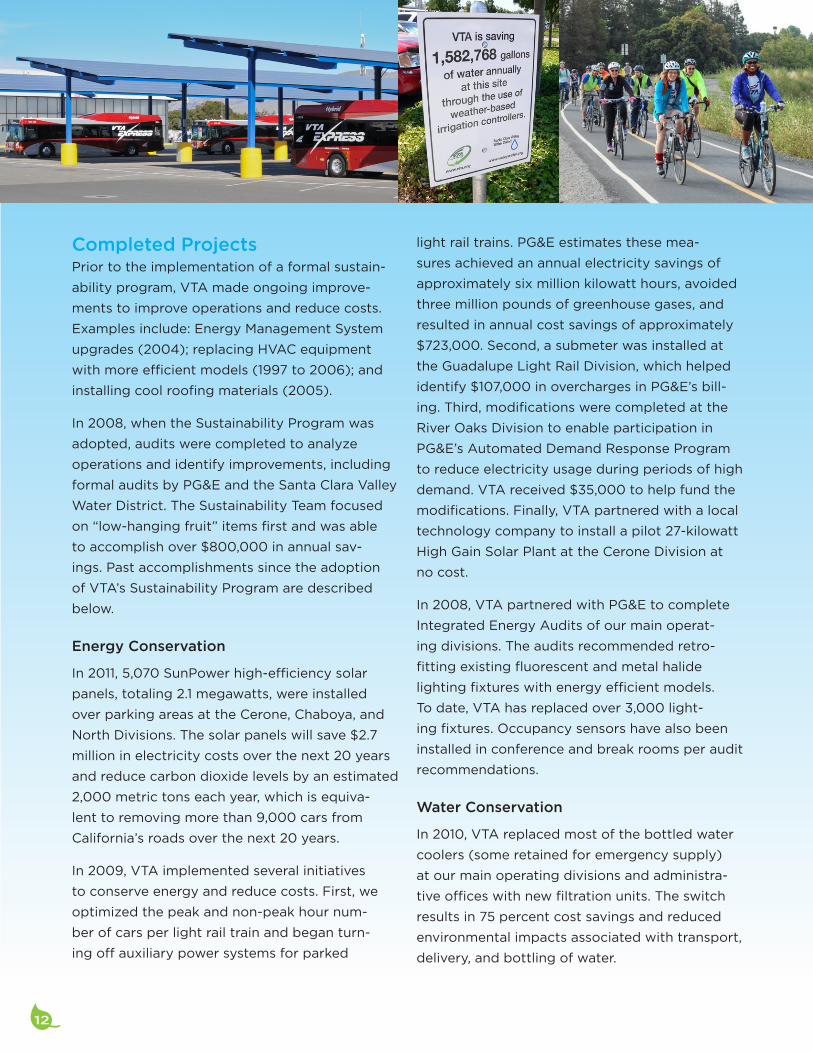
Completed ProjectsPrior to the implementation of a formal sustain-
ability program, VTA made ongoing improve-
ments to improve operations and reduce costs .
Examples include: Energy Management System
upgrades(2004);replacingHVACequipment
with more efficient models (1997 to 2006); and
installing cool roofing materials (2005) .
In 2008, when the Sustainability Program was
adopted, audits were completed to analyze
operations and identify improvements, including
formal audits by PG&E and the Santa Clara Valley
Water District . The Sustainability Team focused
on “low-hanging fruit” items first and was able
to accomplish over $800,000 in annual sav-
ings . Past accomplishments since the adoption
of VTA’s Sustainability Program are described
below .
Energy Conservation
In 2011, 5,070 SunPower high-efficiency solar
panels, totaling 2 .1 megawatts, were installed
over parking areas at the Cerone, Chaboya, and
North Divisions . The solar panels will save $2 .7
million in electricity costs over the next 20 years
and reduce carbon dioxide levels by an estimated
2,000 metric tons each year, which is equiva-
lent to removing more than 9,000 cars from
California’s roads over the next 20 years .
In 2009, VTA implemented several initiatives
to conserve energy and reduce costs . First, we
optimized the peak and non-peak hour num-
ber of cars per light rail train and began turn-
ing off auxiliary power systems for parked
light rail trains . PG&E estimates these mea-
sures achieved an annual electricity savings of
approximately six million kilowatt hours, avoided
three million pounds of greenhouse gases, and
resulted in annual cost savings of approximately
$723,000 . Second, a submeter was installed at
the Guadalupe Light Rail Division, which helped
identify $107,000 in overcharges in PG&E’s bill-
ing . Third, modifications were completed at the
River Oaks Division to enable participation in
PG&E’s Automated Demand Response Program
to reduce electricity usage during periods of high
demand . VTA received $35,000 to help fund the
modifications . Finally, VTA partnered with a local
technology company to install a pilot 27-kilowatt
HighGainSolarPlantattheCeroneDivisionat
no cost .
In 2008, VTA partnered with PG&E to complete
Integrated Energy Audits of our main operat-
ing divisions . The audits recommended retro-
fitting existing fluorescent and metal halide
lighting fixtures with energy efficient models .
To date, VTA has replaced over 3,000 light-
ing fixtures . Occupancy sensors have also been
installed in conference and break rooms per audit
recommendations .
Water Conservation
In 2010, VTA replaced most of the bottled water
coolers (some retained for emergency supply)
at our main operating divisions and administra-
tive offices with new filtration units . The switch
results in 75 percent cost savings and reduced
environmental impacts associated with transport,
delivery, and bottling of water .
13
In 2008, Water Use Surveys were conducted in
partnership with the Santa Clara Valley Water
District to identify indoor and outdoor water use
savings . As a result, VTA installed over 90 bath-
room fixtures with low-flow equipment, includ-
ingHighEfficiencyToiletsthatuseonethirdless
water per flush . The following improvements
were also made to irrigation systems:
• Installedautomaticshutoff-flowsensorson
backflow preventers at five park-and-ride lots
(Great Mall, Penitencia, I-880 Milpitas, Evelyn
andHostetter)tomonitorabnormallyhighor
low flows and automatically shut off flow to
avoid unnecessary water usage .
• Installedweather-basedirrigationcontrol-
lers at 21 facilities to manage irrigation and
configure watering schedules remotely, which
results in potential savings of 12 million gal-
lons of water and $37,000 per year .
• Replacedsprinklernozzleswithmoreeffi-
cient MP Rotators at 4 park-and-ride lots
(PenitenciaCreek,Hostetter,GreatMall,and
River Oaks) .
Other Completed Projects
In 2009, VTA’s Sustainability Program funded
projects to update bike lockers and purchase
fuel efficient non-revenue vehicles . The funding
assisted with the conversion of 110 bike lock-
ers across 12 transit centers, to utilize BikeLink
smart cards . The BikeLink smart cards enable
on-demand bike parking to facilitate a greater
number of users . In addition, 15 fuel-efficient
hybrids were purchased to retire older vehicles
in the non-revenue fleet .
Cerone Division was grazed by a herd of goats
and sheep between 2009 and 2012 . The ani-
mals were managed by Living Systems Land
Management and offered a natural and cost-
effective solution to weed and grass mowing .
However,thegrazingwasdiscontinueddueto
potential impact to burrowing owls .
Future Projects and GoalsIn 2015, VTA will continue to make progress on
current projects including implementing a utility
management software, installing additional EV
charging stations, reducing waste, and others as
described above . Since water use has increased
over the past year, particular attention will be
focused on reducing irrigation use, enforcing
our existing Sustainable Landscaping Policy,
and studying opportunities for recycled water
connections .
Future projects include conducting an inventory
of greenhouse gas emissions and expanding
lighting retrofit projects to additional facilities .
Conductingagreenhousegas(GHG)inventoryis
important to VTA because public transportation
is part of the solution to the growing problem
of climate change . Transportation is the single
largest consumer of energy in the United States,
accountingfornearlyone-thirdoftotalU.S.GHG
emissions.ForVTA,GHGemissionsproduced
by buses, light rail trains, and the operation of
facilitiesisoffsetbythedisplacementofGHG
emissions by taking cars off the road, reduc-
ing congestion, and supporting transit-oriented
development . VTA seeks to quantify its emis-
sions using APTA methodology . Finally, VTA will
explore opportunities to retrofit existing light fix-
tures at little or no cost . While we have already
made significant progress in reducing our energy
use, additional retrofits are needed to com-
pletely convert our lighting to LED technology .
141503-0002
Santa Clara Valley Transportation Authority
3331 North First Street
San Jose, CA 95134-1927
vta.org/sustainability
(408) 321-7575 • TTY (408) 321-2330