sustainability assessment of formic acid ...jultika.oulu.fi/files/nbnfioulu-201308281647.pdfcarbon...
TRANSCRIPT

FACULTY OF TECHNOLOGY
SUSTAINABILITY ASSESSMENT OF FORMIC ACID PRODUCTION: COMPARISON OF CO2 BASED AND CONVENTIONAL PROCESSES
Linda Omodara, B.Sc.
Master’s Thesis
Master’s Degree Programme (BCBU) in Environmental Engineering
26th June 2013

UNIVERSITY OF OULU THESIS ABSTRACT
Faculty of Technology
Department
Dept. of Process and Environmental Engineering
Degree Programme
Master’s Degree Programme (BCBU) in Environmental
Engineering Author
Linda Omodara
Supervisor
Riitta Keiski, Prof. Title of the thesis
SUSTAINABILITY ASSESSMENT OF FORMIC ACID PRODUCTION: COMPARISON OF CO2 BASED
AND CONVENTIONAL PROCESSES Study Option
Clean Production
Type of thesis
Master’s Thesis
Submission date
26th June 2013
Number of pages
93 p, 2 appendices Abstract
Sustainability can be described as a developmental approach whose focus is to integrate economic activity with social security and environmental protection. Sustainability of chemical process involves the use of sustainable practices in the chemical industry. Sustainability assessment describes the methods used for achieving sustainability in industries, it is needed because unsustainable practices can be tracked and corrected and also to track progress made by the company in achieving sustainability. The aim of this thesis was to use a green chemistry based sustainability assessment tool to compare one conventional and two CO2 utilization routes in order to find the more sustainable way of producing formic acid and to suggest methods for improving the tool. The three routes considered in this work were the conventional route, which was done on a commercial scale. This method of producing formic acid is via methyl formate hydrolysis. The experimental route and the BP patented routes represented CO2 utilization routes on laboratory scale setting and commercial setting respectively. These methods for producing formic acid involved the hydrogenation of CO2. Another aim of this thesis was to review some currently used assessment tools related to sustainability. Six currently utilized assessment tools related to sustainability were compared based on their strengths and weaknesses and evaluated. Sustainability assessment was conducted on the three formic acid production routes based on the green chemistry assessment tool using the most important features. Sustainability assessment questionnaire based on the twelve green chemistry principles was used to assess the three formic acid production routes. The strengths and weakness of the green chemistry tool were discussed and recommendations for improving the tool were suggested. One way of improving the tool is to merge it with LCA in order to assess every stage of a product’s life cycle from cradle to grave. The results from the assessment showed that the conventional route was harmful to the environment while the CO2 utilization routes were beneficial to the environment. The social section of the result showed that both the conventional and CO2 utilization routes were socially unsustainable and the economic section of the results showed that the conventional and the CO2 utilization routes were economically viable but the CO2 utilization routes were more economically viable than the conventional route. Overall, the experimental CO2 utilization route is the most sustainable way to produce formic acid. It is important that more research will be done on CO2 utilization method of producing formic acid in order for it to fulfill its potential as a sustainable method. Additional information

TABLE OF CONTENTS
ABSTRACT PREFACE ABBREVIATIONS AND SYMBOLS 1. INTRODUCTION ................................................................................................. 8
THEORETICAL PART .............................................................................................. 10
2. SUSTAINABILITY............................................................................................. 11
2.1 Framework for sustainable development ....................................................... 12
2.2 Sustainability in industries ............................................................................ 15
3. ASSESSMENT TOOLS RELATED TO SUSTAINABILITY ............................. 18
3.1 Pollution prevention ...................................................................................... 18
3.2 Green Chemistry ........................................................................................... 20
3.2.1 Atom economy ...................................................................................... 22
3.3 Institution of Chemical Engineers (IChemE) Sustainability Matrices ............ 23
3.4 American Institute of Chemical Engineers (AIChE) Sustainability Index ...... 24
3.5 Life Cycle Assessment (LCA) ...................................................................... 25
3.6 The Natural Step principles ........................................................................... 26
3.7 Review of the tools ....................................................................................... 28
4. REDUCING THE ENVIRONMENTAL IMPACTS OF CHEMICAL INDUSTRY ................................................................................................................................. 32
4.1 Benefits of chemical industry ........................................................................ 32
4.2 Drawbacks of chemical industry ................................................................... 32
4.3 Reducing the carbon footprint of chemical industry: Chemical Utilization of CO2 33
4.4 REACH regulation........................................................................................ 35
5. FORMIC ACID ................................................................................................... 37
5.1 Physical properties of formic acid ................................................................. 37
5.2 Production of formic acid.............................................................................. 38
5.2.1 Methyl formate hydrolysis ..................................................................... 39
5.2.2 Kemira-Leonard Process (Commercial) ................................................. 39
5.2.3 Hydrogenation of carbon dioxide (CO2) using ruthenium hydroxide catalyst (Laboratory Scale)................................................................................... 41
5.2.4 BP patented process for hydrogenation of CO2 (Commercial) ................ 42
5.2.5 Hydrogenation of carbon dioxide via ionic liquids (Laboratory Scale) ... 42
EXPERIMENTAL PART ........................................................................................... 45

6. AIM AND METHODS IN THE EXPERIMENTAL PART ................................. 46
6.1 Aim .............................................................................................................. 46
6.2 Methods ........................................................................................................ 46
6.2.1 Aspen Plus ............................................................................................. 47
6.2.2 Sustainability assessment questionnaire ................................................. 47
7. MATERIAL AND ENERGY BALANCES ......................................................... 48
7.1 Material and energy balances of the conventional route ................................ 48
7.2 Material and energy balances of the hydrogenation of CO2 route (Experimental and BP routes) ......................................................................................................... 49
8. SUSTAINABILITY ASSESSMENT ................................................................... 52
8.1 Sustainability Assessment Questionnaire ...................................................... 55
9. DISCUSSION...................................................................................................... 70
10. CONCLUSION ................................................................................................ 75
11. REFERENCES ................................................................................................ 78
APPENDIX 1 APPENDIX 2

Preface
This work was part of the project “Sustainable Catalytic Syntheses of Chemicals Using
Carbon Dioxide as feedstock” (GreenCatCO2) and “Carbon Capture Storage Program”
(CCSP). The research work was conducted in the Mass and Heat Transfer Process
Laboratory of the Department of Process and Environmental Engineering, University of
Oulu between the periods of 17th September – 20th December 2012 and 16th May 2013 –
26th June 2013.
First of all, I want to thank my supervisor Riitta Keiski for her excellent support and
guidance. I also want to thank my outstanding advisors Eva Pongrácz, Paula
Saavalainen and Esa Turpeinen for their help, understanding, guidance, patience,
meetings and kind words, their knowledge about sustainability issues were invaluable
to me! Big thanks to my workmates Kirsi, Matti, Maria and Anastasia for motivating
work environment and many happy moments. Special thanks to Esa Muurinen for
creating an enabling work environment for me.
Huge thanks to my friends Ihuoma, Uba, Chinwe, Megan, Segun and Dapo for
encouraging and positive attitude and also for cheering me on. Thanks to all other
friends and well-wishers for your support as well.
My greatest and deepest thanks once again to my loving and caring family both in
Finland and Nigeria. To my husband Gbotemi: thanks for the mental and physical
support and for all the loving. To my son Gabriel: for being such a patient and adorable
sweet baby. To my parents Mr and Mrs M.O Ojeiduma: for their love and words of
encouragement. To my sister and brothers: Vivian, Aideloje, Ohimai, Ahonkhai and
Oise: Thanks for being there for me. Finally my sincere and heartfelt gratitude goes to
God Almighty who saw me through it all.
Linda Omodara
26TH June 2013
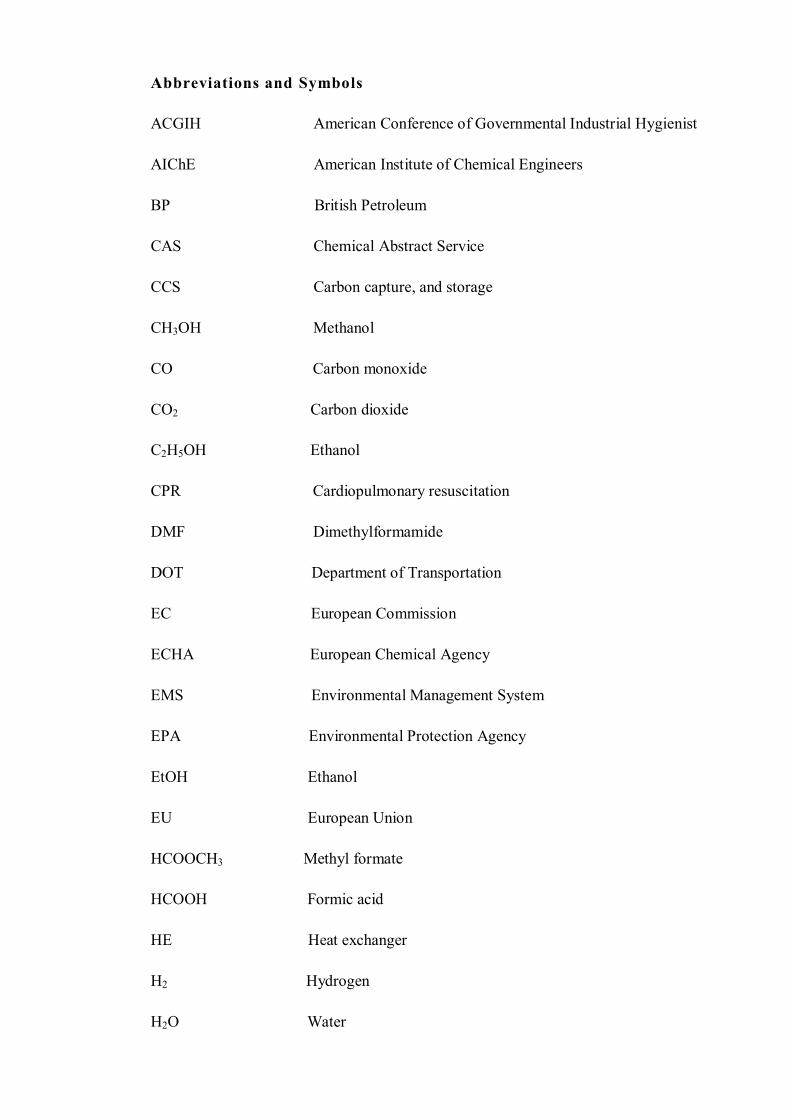
Abbreviations and Symbols
ACGIH American Conference of Governmental Industrial Hygienist
AIChE American Institute of Chemical Engineers
BP British Petroleum
CAS Chemical Abstract Service
CCS Carbon capture, and storage
CH3OH Methanol
CO Carbon monoxide
CO2 Carbon dioxide
C2H5OH Ethanol
CPR Cardiopulmonary resuscitation
DMF Dimethylformamide
DOT Department of Transportation
EC European Commission
ECHA European Chemical Agency
EMS Environmental Management System
EPA Environmental Protection Agency
EtOH Ethanol
EU European Union
HCOOCH3 Methyl formate
HCOOH Formic acid
HE Heat exchanger
H2 Hydrogen
H2O Water

IARC International Agency for Research on Cancer
IChemE Institution of Chemical Engineers
IDLH Immediately Dangerous to Life or Health
ISO International Organization for Standardization
IV Four
LCA Life Cycle Assessment
MSDS Material Safety Data Sheet
m.w. Molecular Weight
NA Not Applicable
NFPA National Fire Protection Association
N(C2H5)3 Triethylamine
OSHA Occupational Safety and Health Administration
ppm Parts per million
REACH Registration, Evaluation, Authorization and Restriction of
Chemicals
RTK Right to Know
SVHC Substances of Very High Concern
t/a Tons per Annum
TBL Triple Bottom Line
V Five
-Al2O3 Aluminum oxide

8
1. INTRODUCTION
Global focus has shifted towards sustainability. Sustainable development gained
popularity after the Rio de Janerio Earth Summit which took place in 1992. In this
summit a series of action points for sustainable development was agreed upon, these
points which also had the backing of the government became known as Agenda 21
which meant the agenda for the 21st century concerning sustainable development. For
the action points to be applied in real life, the summit authorized the United Nations to
set up a set of ‘indicators of sustainable development’ with the purpose of monitoring
progress made. Till this day, the use of indicators and tools for sustainable development
has gained grounds (Bell & Morse, 2008).
Sustainability assessment has gained popularity as a decision-making tool, with an
intent to predict the sustainability implications of intended actions. Sustainability
assessment can be described as the process by which decision making is directed
towards sustainability. It is usually linked with derivation of indicators which is useful
in determining the current level of social, economic and environmental factors (Bond &
Morrison-Saunders, 2011).
Carbon capture, storage and utilization are regarded as one way of reducing the
atmospheric loading of CO2. CO2 utilization can be described as a win-win technology
to both the producers/generators of CO2 and the environment; the producers can sell it
to make profit, while the environment can to an extent be rid of it. In the environment,
stringent climate targets are met as it is not left as an atmospheric green house gas but
converted for use in chemical processes which in most cases is usually cheaper than
conventional methods (Koornneef et al., 2012). Green Chemistry can be described has a
design tool that seeks to re-create materials required and used by the society in order to
reduce their adverse impacts on human health and the environment (Manley et al.,
2008).
The aim of the theoretical part of this work was to critically evaluate six currently used
assessment tools related to sustainability; to review sustainability in the chemical
industry; and to evaluate three routes of formic acid production, the conventional route
(methyl formate hydrolysis) and two CO2 utilization routes via hydrogenation of CO2
(experimental route and BP patented route). Chapter 2 highlights the framework of
sustainable development and sustainability in industries, Chapter 3 describes six
assessment tools related to sustainability including; pollution prevention, Green
9
Chemistry, IChemE, AIChE, LCA and the Natural Step principles. Chapter 4 briefly
describes the environmental impacts of chemical industries; its benefits and drawbacks,
REACH regulation of substances, and on the chemical utilization of CO2. Chapter 5
describes formic acid and focuses on three main routes of formic acid production both
industrial and laboratory scale processes.
The aim of the experimental part of this work was to perform sustainability assessment
of three case studies of formic acid production via a conventional route (methyl formate
hydrolysis) and a CO2 utilization route (hydrogenation of CO2) one for laboratory and
the other for commercial scale; and to use a sustainability assessment questionnaire
based on the Green Chemistry design tool. Chapter 6 describes the aim and methods
used in the experimental section. The methods used include; Aspen Plus simulation tool
and sustainability assessment questionnaire based on the twelve principles of Green
Chemistry. Chapter 7 and 8 describes the material and energy balances; and performed
sustainability assessment based on three case studies (Conventional, hydrogenation of
CO2 in laboratory scaled, and BP patented process for hydrogenation of CO2) of the two
formic acid production routes considered. Sustainability assessment questionnaire based
on the twelve principles of Green Chemistry and their score on the three case studies is
presented. In chapter 9 and 10 discussions and conclusions are made on both the
theoretical and experimental part.

10
THEORETICAL PART
11
2. SUSTAINABILITY
The term sustainability often used interchangeably with sustainable development is used
to close the gap between growth, development, social-cultural values and the
environment. Sustainability was adapted because of growing trends of unsustainable
practices worldwide which led to poverty in some countries and environmental
degradation around the world (Rogers et al., 2008).
Sustainability was brought about by the desire of mankind to improve ecological
conditions while maintaining development and growth pace, having realized that
continuing in the present trend can create a great decline and may lead to the collapse of
the ecosystem and consequently hindering future generations from meeting their needs.
There are many definitions of sustainable development owing to the broad nature of its
concept. The definition that was readily accepted and embraced by the international
scientific community was coined from the Brudtland commission report on global
environment and development in 1987, this commission was established by the United
Nations and part of its responsibility included coming up with environmental strategies.
The Brudtland commission report was tagged ‘Our common future’ and defined
sustainable development as “development that meets the needs of the present without
compromising the ability of future generations to meet their own needs”. This
definition is today used as a reference point on any discussion involving sustainability.
(United Nations, 1987).
Within this definition of sustainable development are two key concepts (United Nations,
1987):
The first is the concepts of ‘needs’, in particular the basic needs of the world’s
poor whom the first major concern is to be given.
The second is based on the idea of limitations set by the state of technology and
social organization on the ability of the environment to meet both present and
future needs.
Soubbotina (2004) has defined sustainability as “equality of opportunities for well-
being, as well as about comprehensiveness of objectives.” These objectives are grouped
under the three areas of sustainable development, examples of these objectives are:
Economic objectives include; growth, efficiency and stability; Social objectives include;
full employment, equity, security, education, health and cultural identity;

12
Environmental objectives include; conservation of non renewable natural resources,
rational use of renewable natural resource and healthy environment for humans. It is to
be noted that mankind is the center of interest for sustainable development; they deserve
to live a worthwhile and healthy life in one accord with the nature. Sustainable
development can also be termed “equitable and balanced”; this means that for
development to always be in continuous motion, it must simultaneously cut across the
three area of sustainability - environmental, social and economic. Nowadays in most
countries of the world both developed and developing countries sustainability has been
included in their national planning and has defined sustainable development within their
various national contexts (Azapagic, & Perdan, 2011).
2.1 Framework for sustainable development
Sustainable development framework implies change; change from unsustainable
practices (Azapagic, & Perdan, 2011). Sustainable development has three aspects; the
economic, ecological (biological) and social aspect. The sustainable development
framework is depicted in Figure 1. The main aim of sustainable development within the
scope of this framework is to maximise its goals across its three aspects. Sustainability
is the intersection of these three aspects (Elliott, 2009).
Figure 1. Objectives of sustainable development (Elliott, 2009).
Figure 1 shows the framework of sustainable development often referred to as “the three
pillars or corners of a triangle”. This framework shows that for sustainable development
to be practiced in the real world there would be some form of trade-offs at some point

13
depending on the groups involved, their goals and interests. The objective here is to
ensure that there is goal maximization across the three pillars (Elliott, 2009).
The economic aspect involves, maintaining or increasing current production trends
while maximizing profits. It deals with minimizing operating costs which can be
achieved through systematic management, labor productivity and research and
development expenditures. The ecological aspect of sustainable development involves
the protection, overall stability of the earth’s ecosystem, sustainable use of natural
resources without degradation and pollution, and waste prevention or minimization to
the barest minimum. It covers the impact of production process, product and services on
human health and the environment. The social cultural aspect of sustainability seeks to
maintain the stability of social and cultural systems. It entails an established and
thriving society whereby the population has access to good quality life. It covers
occupational health and safety, labor right and human right issues (Munasinghe, 2009,
Seow et al., 2006).
Figure 2. Sustainable development concept (Gavrilescu, 2011).

14
Transition to a more sustainable society will involve reducing materials and energy
throughput in the economy and satisfying needs by increasing efficiency and
effectiveness, reusing and recycling of materials and by the use of sustainable
technologies. True sustainability entails guarantying a fulfilling quality of life for
humans (Azapagic, & Perdan, 2011).
A very important concept in sustainable development is the “triple-bottom-line” (TBL)
concept, simply put is “planet, people and profit” which represent the environmental,
social and economic aspects of sustainable development. Triple bottom line summarizes
the overall impact of the industry (Coffman & Umemoto, 2010). Figure 2 illustrates the
TBL concept.
The TBL concept was originated in 1998 by Elkington. In Elkington’s book titled
“cannibals with fork”, TBL in its broadest term “ is used to capture the whole set of
values, issues and processes that companies must address in order to maximize the
positive impacts of their activities and generate added economic, social and
environmental value”. Elkington mentioned that sustainability in industries should
incorporate environmental and social aspects along with its economic/financial aspect;
this puts together a new meaning in the whole concept of sustainable development and
also suggested that the TBL concept be applicable to both small and large scaled
industry and businesses. TBL in industries is a measure of how well the three
dimensions (economic, environmental, social aspects) of sustainability are managed and
balanced (Seow et al., 2006, Coffman & Umemoto, 2010).
The TBL concept is employed to encapsulate processes, issues and values which
industries must consider in order to reduce any side effects resulting from their actions
and to bring about economic, social and environmental values (Sheate, 2010). Triple
bottom line is also seen as a method used to create a balance between industrial
processes, activities and the economic, social and environmental aspects of
sustainability (Vanclay, 2010). The environmental, social and economic aspects in TBL
should be considered individually in practice and then synchronized to form a system,
only then can true sustainability be achieved. TBL is used as a benchmark in evaluating
sustainability (Lee et al., 2012). In industries, equal consideration should be given to
people, planet and profits whereby; people represent the social consequences of
industrial actions; planet represents the environmental consequences of industrial

15
actions and; profits represent the economic profits of industries (Harmsen & Powell,
2010).
2.2 Sustainability in industries
Sustainability in industries refers to its ability to promote and stabilize on the long run a
positive economic, environmental and social performance. Industries play a very
important role in issues regarding sustainability; its responsibility is ensuring that there
is a balance between its business strategies that generate profits, the environment and
society (Orecchini et al., 2012).
The need for sustainability in industries arises because they have high environmental,
social and economic impact. In industry, sustainable development creates guidelines for
designing new production processes and establishes new aims for existing ones in order
to improve quality of life in a sustainable manner. The sustainable guidelines are put in
place to address the issues of unsustainable practices in industries. Unsustainable
practices are addressed by first identifying the affected areas in the industry, redesigning
the products and processes involved in these areas, and then showing definitively
progress brought about by the redesigning of products and processes (Ruiz-Mercado et
al., 2013). Sustainability is needed in all industrial sectors because economic systems do
not accurately show their true cost; neither do they fully take into consideration the
environmental and social impacts of their production processes (Harmsen &Powell,
2010).
Recall that sustainability has three dimensions; economic, environmental and social. In
industries, the economic dimension deals with financial viability. It covers matters
related to competitiveness, profitability, job creation and market. Long term goals
involving all participants raging from the manufacturers, consumers and policy makers
should be developed and implemented to ensure that sustainability is achieved. As the
world population is increasing, it is expected that demands for industrial products also
increase. It has been predicted that over a 40 year time frame industrial products are
anticipated to double or triple its present amount. The increased world population can
be viewed in two different ways, negative and positive. It is positive from an industrial
viewpoint because increased population naturally would lead to increased customer base
which in turn would lead to market expansion and more returns on investment. On the
other hand it is negative because it would lead to scarcity of resources needed; there

16
would be increased pressure on the environment due to the industries increased level of
production to match demands (Orecchini et al., 2012).
Sustainability started in chemical industry as a conciliatory approach to all stakeholders.
Sustainability has both offensive and defensive sides. The offensive side is intended to
optimize competitive benefits through regulations; on the other hand the defensive side
is intended to improve industry’s unfavorable image and to prevent liabilities. In
chemical industry, there are three main functions to sustainability; they include
(Johnson, 2012):
A “stakeholder” approach to communications and external relations
Recognizing not only the cost of social and environmental protection but also
the opportunities
Rebranding of risk management and regulatory compliance while emphasizing
on their advantage to stakeholders.
Application of the TBL by industrial businesses has gained popularity among top
decision makers. Industrial businesses that apply the TBL concept can be said to have
integrated economic success with environmental quality and social justice hence making
it sustainable.
Table 1 illustrates that with reference to John Elkington (1998) work, TBL can be
applied in industries in seven dimensions namely markets, transparency, time context,
life-cycle technology, corporate governance, partnerships and values (Orecchini et al.,
2012).
Table 1. Triple bottom line (TBL) dimensions (Orecchini et al., 2012).
Drivers Old Paradigm New Paradigm
1. Markets Compliance Competition
2. Values Hard Soft
3. Transparency Closed Open
4. Life-cycle technology Product Function
5. Patnerships Subversion Symbiosis
6. Time Wider Longer
7. Corporate governance Exclusive Inclusive

17
Sustainable practice in industry can be achieved by the right amount of processes, raw
materials, quality human resources as well as energy. Industries have management
processes which can further be sub-dived into an environmental management system
and a quality management system. The overall goal of these systems is the efficient
utilization of resources either human or material which accomplish sustainability in
industry. The goal of environmental management in industry is cleaner production
which leads to minimized production cost, reduced waste, less emissions and profit
maximization. By adapting this process sustainability can be achieved (Fresner and
Sage, 2010). Cleaner production is a term used to portray prevention oriented strategy
whose role is to reduce environmental loadings or products and processes in industry
(Hoof & Lyon 2013). Cleaner production processes also helps to reduce production
impact on the environment by using prevention strategies. (Fresner and Sage, 2010).
According to Fresner and Sage (2010), the following points illustrate examples of
cleaner production options in industry:
Documentation of actual consumption
Use of indicators and control to identify losses from poor planning, poor
education and training, mistakes
Substitution of raw materials and auxiliary materials (especially renewable
materials and energy)
Increase in the useful life of auxiliary materials and process liquids by avoiding
drag-in, drag-out, contamination
Improved automation and control
Reuse of waste (internal or external)
New low-waste processes and technologies.
18
3. ASSESSMENT TOOLS RELATED TO SUSTAINABILITY
Assessment tools related to sustainability are needed to enable the human population to
move to a more sustainable society. These assessment tools should be all encompassing,
unambiguous, efficient, effective, comprehensive and reliable. Assessment tools related
to sustainability are used to evaluate the environmental, economic and social impacts of
industry’s product and production processes. Sustainability assessment has been defined
as “a tool that can help decision-makers and policy-makers decide which actions they
should or should not take in an attempt to make society more sustainable.” Its main
objective is that of guidance. It guides both decision and policy makers in ensuring that
sustainability is achieved in the society (Buytaert et al., 2011).
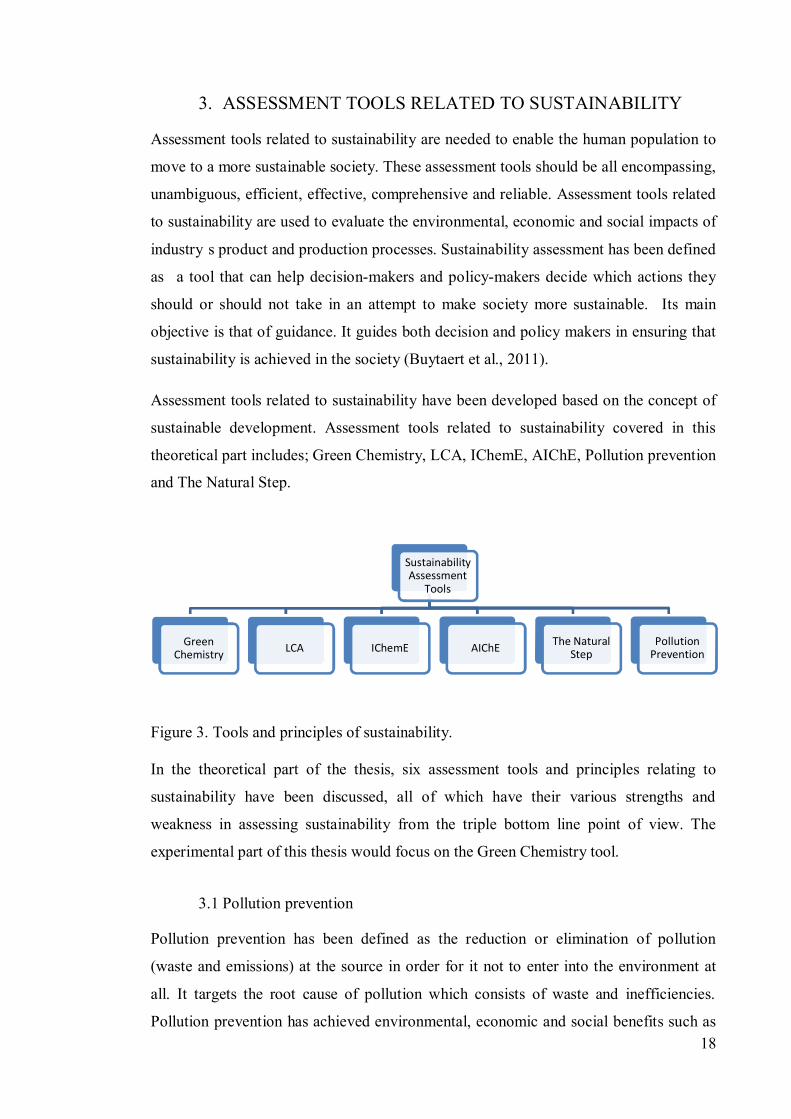
Assessment tools related to sustainability have been developed based on the concept of
sustainable development. Assessment tools related to sustainability covered in this
theoretical part includes; Green Chemistry, LCA, IChemE, AIChE, Pollution prevention
and The Natural Step.
Figure 3. Tools and principles of sustainability.
In the theoretical part of the thesis, six assessment tools and principles relating to
sustainability have been discussed, all of which have their various strengths and
weakness in assessing sustainability from the triple bottom line point of view. The
experimental part of this thesis would focus on the Green Chemistry tool.
3.1 Pollution prevention
Pollution prevention has been defined as the reduction or elimination of pollution
(waste and emissions) at the source in order for it not to enter into the environment at
all. It targets the root cause of pollution which consists of waste and inefficiencies.
Pollution prevention has achieved environmental, economic and social benefits such as
Sustainability Assessment
Tools
Green Chemistry LCA IChemE AIChE The Natural
StepPollution
Prevention

19
reduced amount of solid waste to landfills, cleaner air, water and soil, less emissions,
more efficient use of natural resources, safe working environment, efficiency in
industry, reduced cost, increased profits and competitiveness (PPRC, 2012). Pollution
prevention can be carried out based on five approaches (Figure 4) (Hanrahan, 2012).
Figure 4. Five approaches of pollution prevention with desirability decreasing as it moves toward the pinnacle of the pyramid (Hanrahan, 2012).
Pollution prevention is a form of sustainability solution. Pollution prevention guarantees
the continual efficiency and profitability in industries. It helps to protect both humans
and their environment. It is well recognized in today’s world and has gained grounds in
industries both locally and internationally (Ngwakwe, 2011, Kathuria, 2009).
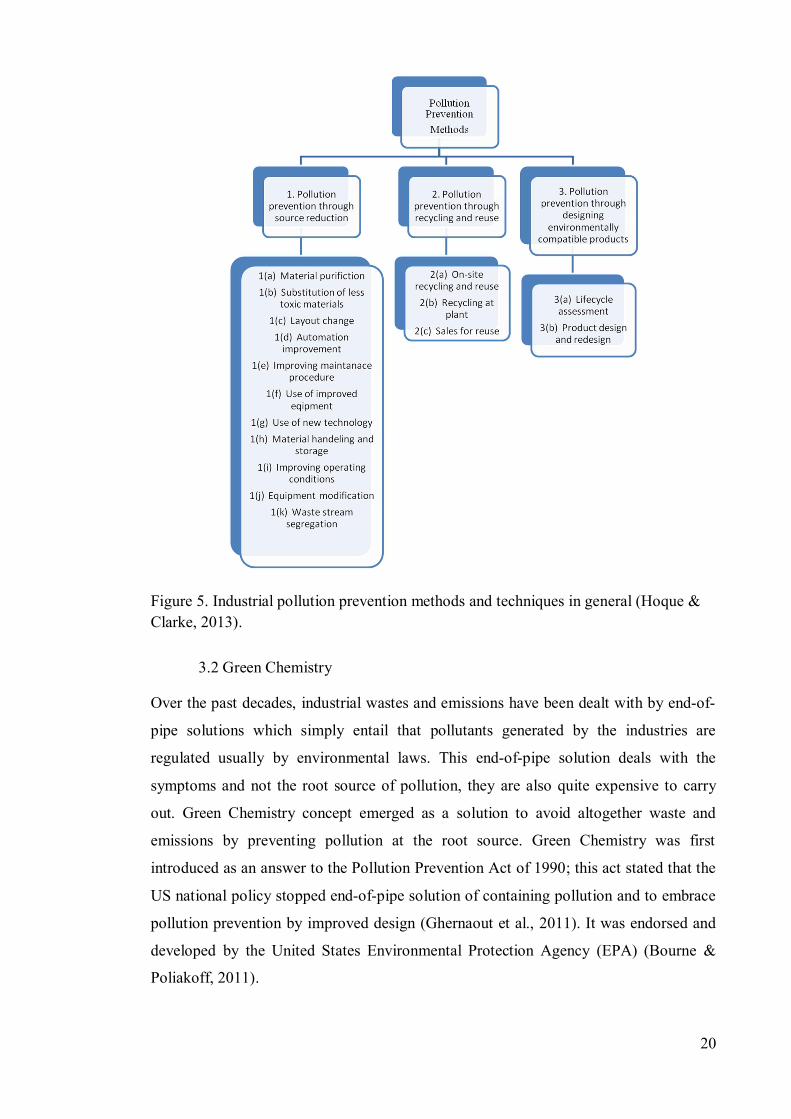
Pollution prevention (Figure 5) has the ability to completely eliminate or minimize to
the barest minimum environmental risks which can in turn bring about social and
environmental advantages of safeguarding the environment. In ensuring that wastes are
reduced or eliminated, pollution prevention strategies alter manufacturing processes and
employ the use of non toxic, non hazardous materials and chemicals. If industries
comply with their strategies, it is a win-win situation for the industry, the people and the
environment (Mungu a et al., 2010, MolinaAzorin et al., 2009).
20
Figure 5. Industrial pollution prevention methods and techniques in general (Hoque & Clarke, 2013).
3.2 Green Chemistry
Over the past decades, industrial wastes and emissions have been dealt with by end-of-
pipe solutions which simply entail that pollutants generated by the industries are
regulated usually by environmental laws. This end-of-pipe solution deals with the
symptoms and not the root source of pollution, they are also quite expensive to carry
out. Green Chemistry concept emerged as a solution to avoid altogether waste and
emissions by preventing pollution at the root source. Green Chemistry was first
introduced as an answer to the Pollution Prevention Act of 1990; this act stated that the
US national policy stopped end-of-pipe solution of containing pollution and to embrace
pollution prevention by improved design (Ghernaout et al., 2011). It was endorsed and
developed by the United States Environmental Protection Agency (EPA) (Bourne &
Poliakoff, 2011).

21
Anastas & Warner (2000) defined Green Chemistry as “the utilization of a set of
principles that reduces or eliminates the use or generation of hazardous substances in
the design, manufacture, and application of chemical products”. Green chemistry
requires as its goal absolute perfection albeit recognizing that in reality there is always
some discrete risk involved while trying to achieve its set goal. Green chemistry in its
simplest form can be described as a form of pollution prevention. It entails discovering
various ways to find solutions to environmental problems by the continuous process of
designing chemical synthesis and products. It achieves pollution prevention by the
application and utilization of chemical principles and methods for source reduction. As
an assessment tool related to sustainability, the green chemistry can be used as a design
tool. There are twelve principles of Green Chemistry; these twelve principles are
spearheaded by pollution prevention which is its primary goal. The Green Chemistry
principles were established to redesign industrial practices to be more sustainable.
Green Chemistry principles focus on safe guarding human health and the environment
while still maintaining the efficacy of the products. It also encourages the use of
renewable raw materials as feedstock and is instrumental in the creation of
biodegradable products in chemical industries (Anastas & Warner, 2000).
Table 2. The twelve principles of Green Chemistry (Anastas and Warner, 2000).
Principle 1. Prevent waste: Design chemical syntheses to prevent waste
Principle 2. Maximize atom economy: Design syntheses so that the end
product contains the maximum proportion of the starting materials (few
wasted atoms!)
Principle 3. Design less hazardous chemical syntheses: Design syntheses
to use and generate substances with minimal environmental toxicity;
Principle 4. Design safer chemicals and products: Design chemical
products that have minimal environmental toxicity;
Principle 5. Use safer solvents/reaction conditions: The goal of avoiding
solvents, separation agents, or other auxiliary chemicals at all costs. If
unavoidable, use innocuous chemicals;
Principle 6. Increase energy efficiency: Attempt to run reactions at
ambient temperature and pressure whenever possible;
Principle 7. Use renewable feedstock: Attempt to use raw materials and
feedstock (starting materials) that are renewable rather than depleting

22
Principle 8. Avoid chemical derivatives: Attempt to avoid using blocking
or protecting groups or any temporary modi cations whenever possible;
Principle 9. Use catalysts, not stoichiometric reagents: Try to minimize
waste by using catalytic reactions that can carry out a single reaction
multiple times;
Principle 10. Design chemicals and products that degrade after use: The
design of chemical products that break down to innocuous substances
upon use by the consumer or industrial process;
Principle 11. Analyze in real time to prevent pollution: Use and
encourage the use of in-process real-time monitoring and control during
syntheses. This minimizes or eliminates byproducts;
Principle 12. Minimize the potential for accidents: Design chemicals to
minimize the potential for chemical accidents including explosions, fires,
and environmental releases
Principle 5 of the Green Chemistry states that solvents if at all used in a chemical
process should be innocuous, green solvents are best used to achieve this. According to
Capello et al. (2007), there are four aspects by which green solvents can be identified.
The first is the substitution of hazardous solvents with ones that show better
environmental, health and safety characteristics such as increased biodegradability. The
second aspect involves the use of ‘bio-solvents’ which means solvents that are
manufactured using renewable resources like ethanol. The third aspect entails the
substitution of organic solvents with environmentally non hazardous supercritical fluids.
The fourth aspect makes use of the substitution of organic solvents with ionic liquids
that have low pressure which leads to reduced emissions to the air.
3.2.1 Atom economy Atom economy, one of the Green Chemistry principles is a measure of how well each of
the reactants in a chemical process is included in the final product. Atom economy is
said to be 100% when all of the reactants in the process are completely included in the
final product. Atom economy is a method used to determine whether or not a chemical
process design is green (Anastas & Warner, 2000).
Wang et al. (2011) has proposed a way for calculating the atom economy in a chemical
reaction.

23
= 100
In this calculation, only the reactants used are considered, intermediates made in one
stage and used up in the next stage are always ignored. Atom economy is calculated
without taking into account side reactions or the true yield of the reaction.
Three assumptions are usually made in the calculation of atom economy;
• All substances not occurring in the equation of reaction are overlooked
• The quantity of raw materials is stoichiometric
• The yield is 100%.
In reality, it is feasible that the true yield can be a lot lower than 100% because there is
no separation or reuse of the unreacted part of raw materials and at the same time a
synthetic route can have 100% atom economy.
3.3 Institution of Chemical Engineers (IChemE) Sustainability Matrices
IChemE can be described as a set of indicators used to measure industry’s sustainability
performance. For this assessment tool, key indicators of the three sustainability aspects
(economic, environmental, and social) must be taken in to consideration in order for
there to be a balanced sustainability performance view. It is possible to select ratio
indicators for this tool; this can be used as a measure of impact which is not dependent
on the scale of operation. It can also be used to measure cost against benefit and
sometimes as a basis for comparison between different operations. IChemE
sustainability matrices are usually presented in three groups; environmental indicators,
economic indicators and social indicators which reflects the three sustainable
development aspects. Environmental indicators give an equivalent view of the inputs
(raw materials and resource usage) and outputs (effluents, wastes and emissions) of
environmental impacts. Economic indicators deal with financial reporting with respect
to value and wealth creation and also in the reinvestment of an industry’s future growth.
For this indicator, both human and financial capitals are given due consideration.
Examples of this indicator include; profit, value and tax, investment. Social indicators
are concerned with industry’s attitude towards the society, its employees, customers and
contractors. A good social performance is usually strived for. Examples of social
24
indicators include; workplace (employment situation, health and safety at work), and
society (IChemE, 2010).
3.4 American Institute of Chemical Engineers (AIChE) Sustainability Index
Cobb et al. (2009) has described the AIChE sustainability index as one that uses easily
accessible public data to evaluate the sustainability performance of representative
companies in the chemical industry with respect to the following; strategic commitment,
safety performance, social responsibility, value chain management, sustainability
innovation, product stewardship, and environmental performance. The unique feature of
AIChE is that it enables industries to compare, measure and track their sustainability
performance within the industry and with other similar industries. The AIChE
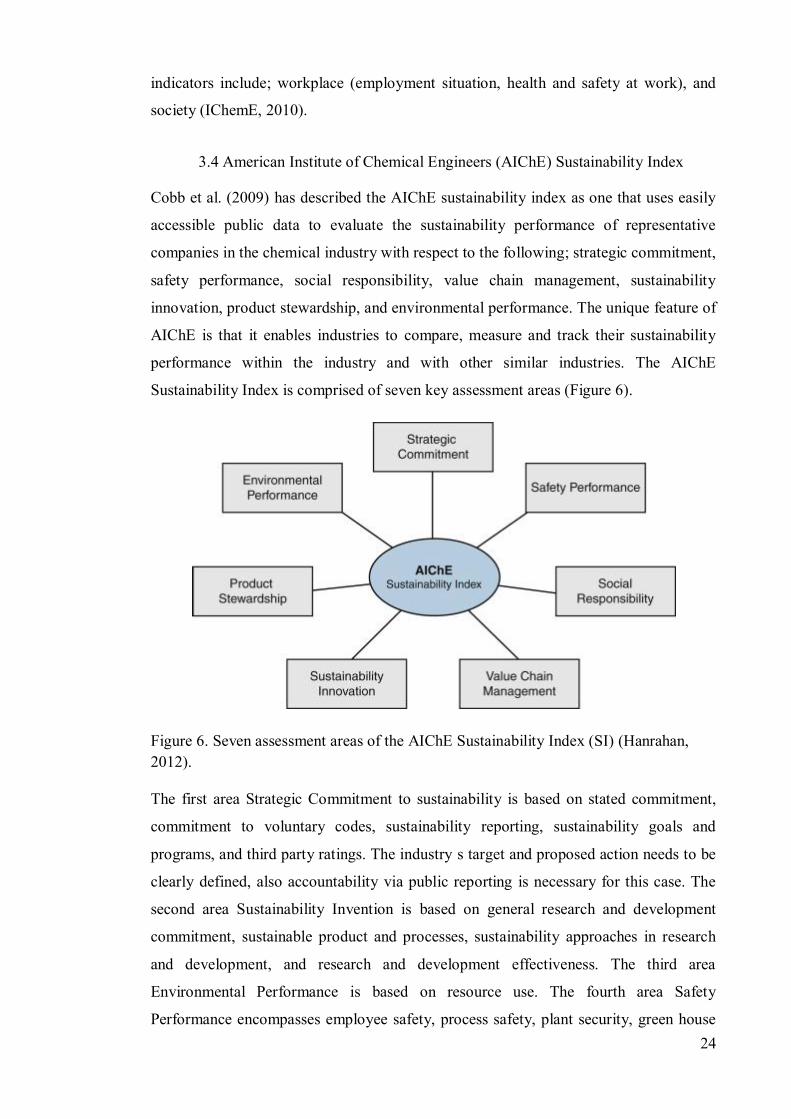
Sustainability Index is comprised of seven key assessment areas (Figure 6).
Figure 6. Seven assessment areas of the AIChE Sustainability Index (SI) (Hanrahan, 2012).
The first area Strategic Commitment to sustainability is based on stated commitment,
commitment to voluntary codes, sustainability reporting, sustainability goals and
programs, and third party ratings. The industry’s target and proposed action needs to be
clearly defined, also accountability via public reporting is necessary for this case. The
second area Sustainability Invention is based on general research and development
commitment, sustainable product and processes, sustainability approaches in research
and development, and research and development effectiveness. The third area
Environmental Performance is based on resource use. The fourth area Safety
Performance encompasses employee safety, process safety, plant security, green house

25
gas emissions, other emissions, and compliance management. The fifth area Product
Stewardship consists of assurance system, risk communication, and legal proceedings.
The sixth area Social Responsibility relates to stakeholder partnerships, social
investment, and image in the community. The seventh and final area of the AIChE
sustainability index, Value Chain Management comprises of environmental
management system (EMS) and supply chain management (Cobb et al., 2009).
3.5 Life Cycle Assessment (LCA)
Over the last 35 years, Life-Cycle Assessment (LCA) tool has been used to measure the
environmental impacts of a product throughout its life cycle. In order to use this tool,
there are certain guidelines and principles set in place by International Standards
Organization (ISO) that must be adhered to (Buytaert et al., 2011).
ISO 14044:2006 has defined Life-Cycle Assessment (LCA) as a ‘technique that
addresses the environmental aspects and potential environmental impacts (e.g. use of
resources and environmental consequences of releases) throughout a product’s life
cycle from raw material acquisition through production, use, recycling and final
disposal (i.e. cradle -to-grave)’. It follows the guidelines of ISO 14040 Environmental
Management System. ISO standards give a description of four steps which includes;
goal and scope definition, impact assessment, inventory analysis and interpretation
(Buytaert et al., 2011).
Figure 7. Overview of LCA effort according to ISO (Sørensen, 2011).

26
From Figure 7 it can be seen that for LCA, material and energy balances are necessary
in all stages of the product life cycle. ‘Cradle-to-grave’ LCA approach is usually used to
evaluate industrial systems. ‘Cradle-to-grave’ in this case starts with product creation by
raw materials accumulation and ends at the recycling/reused or disposal phase. LCA
covers the environmental aspect of a product by including its impact throughout the
product life cycle. Sustainability is attained when impacts are minimized or eliminated
(Hanrahan, 2012). Figure 8 illustrates a systematic view point for analyzing the
input/output flows of energy and materials alongside the environmental impacts of the
product throughout its life cycle.
Figure 8. Chemical product life cycle considered in the life cycle assessment (LCA). (Hanrahan, 2012).
Energy flows into (input) each phase of the chemical product life cycle excluding the
pre-manufacturing phase where no energy is required, and waste flows out (output) in
the raw material, chemical manufacturing and the end-of-life phase. Also in the end-of-
life phase, waste disposal and reuse/recycling of materials flows out (output) of the
phase while energy flows into the process (Hanrahan, 2012).
3.6 The Natural Step principles
The Natural Step has its origins in Sweden and is known as a ‘Framework for Strategic
Sustainable Development’. It is a world renowned framework which helps industries

27
and individual alike to move towards sustainability. The Natural Step framework is
usually applicable to complex systems whereby careful planning and organizing is
needed. The Natural Step framework consists of four system conditions which can also
be expressed as the principles of sustainability. Mankind activities for some centuries
have been unsustainable and this has had an adverse effect on the earth. It is believed
that if this trend continues unchecked it could lead to a complete degradation of the
ecosystem. A team of international scientists came up with four basic conditions that
must be satisfied to ensure that environmental, social and economic aspects of
sustainability are satisfied (The Natural Step, 2013), (Phdungsilp, 2011). Table 3 depicts
the four system conditions that must be satisfied to bring about sustainability.
Table 3. The Four Systems Conditions (The Natural Step, 2013).
The Four System Conditions Reworded as the Four Principles of
Sustainability
In a sustainable society, nature is not
subject to systematically increasing
To become a sustainable society, we must
eliminate our contribution to
1. Concentrations of substances
extracted from the earth’s crust
1. The systematic increase of
concentrations of substances
extracted from the Earth’s crust
2. Concentrations of substances
produced by society
2. The systematic increase of
concentrations of substances
produced by society
3. Degradation by physical means 3. The systematic physical
degradation of nature and natural
processes
4. People are not subject to
conditions that systematically
undermine their capacity to meet
their needs in the society
4. Conditions that systematically
undermine people’s capacity to
meet their basic human needs
The Natural Step framework makes use of the ‘backcasting’ concept to achieve
sustainability. Simply put backcasting can be described as a process of defining a
desirable future and planning presently on how to attain that desired future, whilst

28
visualizing success. Strategic sustainable development makes use of the backcasting
concept from the principles of sustainable development (The Natural Step, 2013).
Figure 9. The ABCD method (The Natural Step, 2013).
Figure 9 show that the backcasting concept applies a method known as A-B-C-D
method to The Natural Step Framework to help industries to attain sustainability. A
stands for ‘Awareness and Visioning’; Here sustainability concept and its application in
an industry is clearly defined and understood. B stands for ‘Baseline Mapping’; In this
case a comparison is made between industry’s current activities and practices and the
four sustainability principles. This gives an opportunity to the industry to identify its
major sustainability shortcomings and hence creates an opportunity for improvement. C
stands for ‘Creative Solutions’; Creative Solutions calls for brainstorming to the
sustainability shortcomings in the industry identified in the baseline mapping.
Backcasting may be employed in this case. D stands for ‘Decide on Priorities’; In this
case an action plan is carried out based on ‘C’ and a step-by-step implementation of the
creative solution is implemented to ensure the quick move of the industry towards the
direction of sustainability (The Natural Step, 2013).
3.7 Review of the tools
The six assessment tools related to sustainability considered in this thesis are Green
Chemistry, LCA, the Natural Step, AIChE, IChemE and pollution prevention. These
29
tools were carefully chosen because they are all applicable to the chemical industry
which is the primary focus of this thesis.
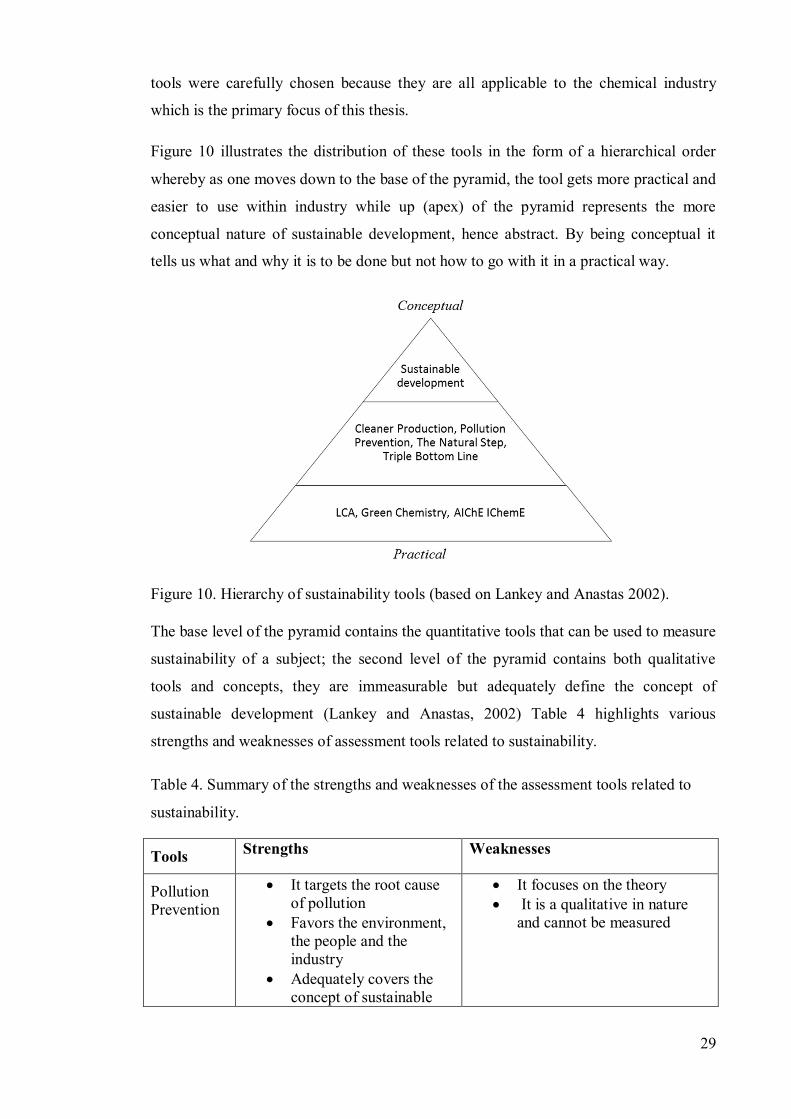
Figure 10 illustrates the distribution of these tools in the form of a hierarchical order
whereby as one moves down to the base of the pyramid, the tool gets more practical and
easier to use within industry while up (apex) of the pyramid represents the more
conceptual nature of sustainable development, hence abstract. By being conceptual it
tells us what and why it is to be done but not how to go with it in a practical way.
Figure 10. Hierarchy of sustainability tools (based on Lankey and Anastas 2002).
The base level of the pyramid contains the quantitative tools that can be used to measure
sustainability of a subject; the second level of the pyramid contains both qualitative
tools and concepts, they are immeasurable but adequately define the concept of
sustainable development (Lankey and Anastas, 2002) Table 4 highlights various
strengths and weaknesses of assessment tools related to sustainability.
Table 4. Summary of the strengths and weaknesses of the assessment tools related to
sustainability.
Tools Strengths Weaknesses
Pollution Prevention
It targets the root cause of pollution
Favors the environment, the people and the industry
Adequately covers the concept of sustainable
It focuses on the theory It is a qualitative in nature
and cannot be measured
30
development
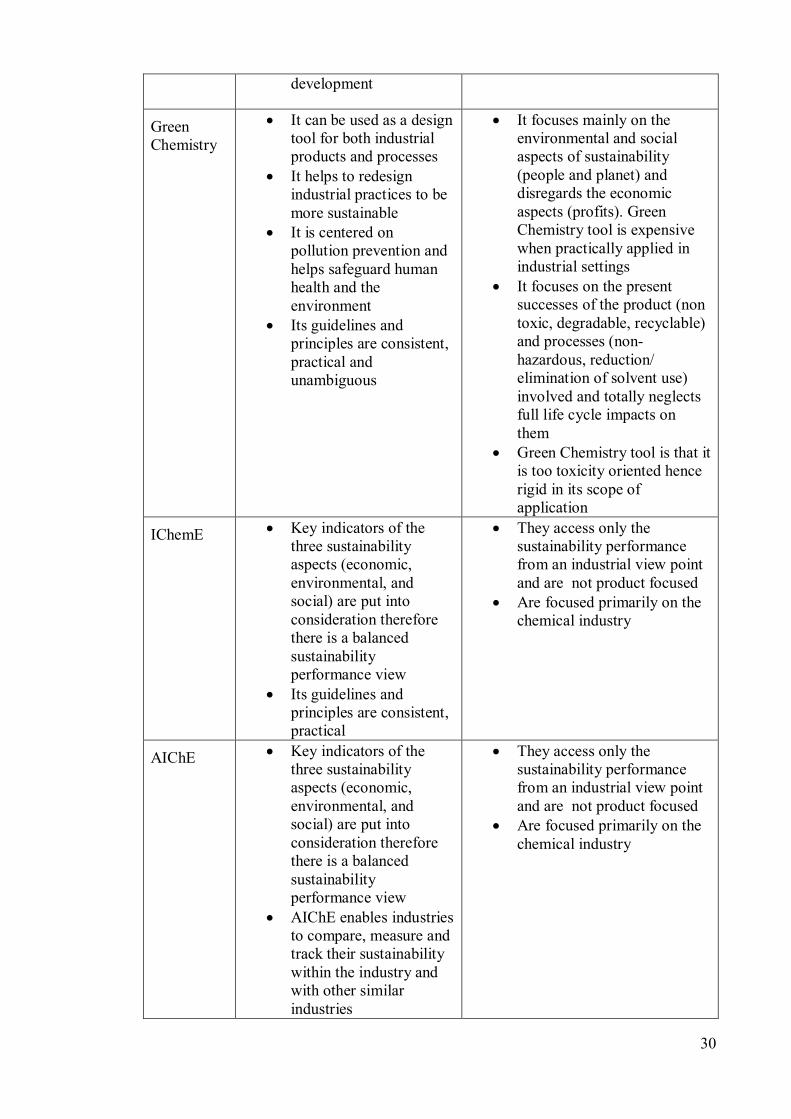
Green Chemistry
It can be used as a design tool for both industrial products and processes
It helps to redesign industrial practices to be more sustainable
It is centered on pollution prevention and helps safeguard human health and the environment
Its guidelines and principles are consistent, practical and unambiguous
It focuses mainly on the environmental and social aspects of sustainability (people and planet) and disregards the economic aspects (profits). Green Chemistry tool is expensive when practically applied in industrial settings
It focuses on the present successes of the product (non toxic, degradable, recyclable) and processes (non- hazardous, reduction/ elimination of solvent use) involved and totally neglects full life cycle impacts on them
Green Chemistry tool is that it is too toxicity oriented hence rigid in its scope of application
IChemE Key indicators of the three sustainability aspects (economic, environmental, and social) are put into consideration therefore there is a balanced sustainability performance view
Its guidelines and principles are consistent, practical
They access only the sustainability performance from an industrial view point and are not product focused
Are focused primarily on the chemical industry
AIChE Key indicators of the three sustainability aspects (economic, environmental, and social) are put into consideration therefore there is a balanced sustainability performance view
AIChE enables industries to compare, measure and track their sustainability within the industry and with other similar industries
They access only the sustainability performance from an industrial view point and are not product focused
Are focused primarily on the chemical industry

31
Its guidelines and principles are consistent, practical
LCA Is the only sustainability tool that takes into account various stages of the entire product life cycle from cradle to end-of-life
Its principles are applicable to both products and processes in any sector or type of industry
It is a flexible and interdisciplinary tool
It can be tailor-made towards the assessment of a desired matrix
It gives a more precise picture of true environmental impact
LCA is bulky, data intensive, and time consuming (it takes a lot of time to select data)
LCA is a complex and expensive tool hence economically prohibitive
It gives room for assumptions to be made which might be subjective, hence the results of two LCA on one particular subject may be different
LCA’s results is geographically dependent, an LCA conducted on a subject in Europe would be different from the one conducted in the US
Its accuracy depends on the availability of the relevant data
The Natural Step
It satisfies the three aspects of sustainable development
Is applicable to complex systems whereby careful planning and organizing is needed
It applies a backcasting concept which is a strong point for economic growth and development
It focuses on the theory It is too abstract and cannot
be practically used
It is qualitative in nature and cannot be measured
Using the assessment tools related to sustainability presented in this thesis, it is
extremely difficult to measure sustainability in industry as each of these tools
individually have their strengths and weaknesses highlighted above. None of these tools
can adequately stand alone as a true test of sustainability tool, but by combining all the
strong points of these tools a new hybrid tool emerges which adequately represents and
covers the three aspects of sustainable development in its entirety.

32
4. REDUCING THE ENVIRONMENTAL IMPACTS OF CHEMICAL INDUSTRY
Chemical industry is responsible for the manufacturing of different products brought
about by the conversion of natural and mineral raw materials, animals and vegetables
into the different products often utilized in industries and households. The produced
products are of immense importance in our today’s world. Chemical industry has the
ability to improve the quality of life of a population. Chemical industry has a great
impact on sustainability as both its production methods and processes are very crucial in
ensuring that the criteria for sustainability are met. In recent times, there has been a
great advancement in chemical industry; one of such advancements is the creation and
adoption of the Green Chemistry principles which has ‘pollution prevention’ as its
watchword (Garcia, 2009).
4.1 Benefits of chemical industry
Chemical industry contributes greatly to itself; an example of such contributions is in
the manufacturing of catalysts used to speed up chemical reactions. It has also
contributed to other industries like the food industry where it helps to produce additives
and preservatives and in agricultural industry as it is the basis for which fertilizers,
insecticides and herbicides which help in improving agricultural yield are produced. The
industry also plays a vital role in pharmaceuticals industry because of its usefulness in
the production of drugs. In addition; chemical industry is also useful in the
manufacturing of various household items, textiles and plastics. Its role in nations has
significantly boosted the economy and improved the social status of the population. The
environment itself also benefits from chemical industry; the industry produces catalysts
which help in the reduction of e.g. air pollution. It has also developed chemical
processes which enable the use of renewable form of energy an example of such energy
is the biomass, and in some cases improved energy efficiency (Garcia, 2009).
4.2 Drawbacks of chemical industry
Despite the numerous benefits realized by the chemical industry, it also has its
downsides. Over the last five decades, chemical industry’s image has been badly
damaged. There have been conflicts between chemical industry and the general public
over the industry’s environmental impacts and overall safety (Johnson, 2012). The
industry has been blamed for both land pollution and invasion of natural resources. It

33
has also been accused of creating numerous social problems stemming from rapid
industrialization and the exploitation of weak nations for commercial gains (Hall &
Howe, 2010). Figure 11. shows the general public view in the UK the trends in
chemical industry between the periods of 1979 and 2000. As the year progressed (1979-
2000) the public view on chemical industry became less favorable and more
unfavorable (Johnson, 2012).
Figure 11. Public opinion in the UK on chemical industry, 1979-2002 (Johnson, 2012).
However, in recent times most chemical industries have embraced sustainability as a
kind of peace offering in order to satisfy all stakeholders (Johnson, 2012).
4.3 Reducing the carbon footprint of chemical industry: Chemical Utilization of
CO2
CO2 has been discovered to be a primary contributor to the effects of green house gases
in the atmosphere which has overtime led to global warming. In order to reduce global
warming, the utilization of CO2 in the production of chemicals and other industrial
commodities has been the primary focus of many researches (Zhao & Joo, 2011).
The utilization of CO2 as a raw material can be described as both a sustainable and an
inexpensive process; it is a safe raw material, non- toxic, non-flammable. The reduction
of atmospheric loading, has led to the replacement of toxic chemicals that are harmful to
human health and environment. CO2 can be used as feedstock in chemical processes.

34
Hydrogenation of CO2 can yield in e.g. the production of formic acid and methanol
(Raudaskoski et al., 2009).
Figure 12. Chemical utilization of CO2 fulfilling environmental, economic and social concerns, the three facets of sustainability (Raudaskoski et al., 2009).
Figure 12 illustrates how sustainable practices involving the use of CO2 combines the
three facets of sustainability namely; economic, social and environmental often
expressed as people planet and profit. It is shown that the three facets of sustainability
are well represented (Raudaskoski et al., 2009). Figure 13 shows some of the most
commonly used CO2 reactions and their resulting products.
Figure 13. Direct and Indirect use of CO2 (modified from Raudaskoski et al., 2009).

35
CO2 can be used directly and indirectly. Some areas involving the indirect use of CO2
particularly in the laboratory scale are still under research, efforts are being made to
scale-up the laboratory scale production of CO2 utilization chemicals to commercial
scale (Raudaskoski et al., 2009). Formic acid falls under the indirect use of CO2 and its
production process is still under research.
4.4 REACH regulation
REACH is an acronym for Registration, Evaluation, Authorization and Restriction of
Chemicals. It was enforced in the year 2007. The aims of REACH includes; ensuring
maximum protection of human health and the environment from chemicals associated
with risks, the advancement of better testing methods, encouragement of innovations,
and ensuring that there is a free distribution of substances on the internal market.
REACH ensures that industries are responsible for both the assessing and management
of chemically imposed risks and to give adequate information regarding safety to their
users (European Commission, 2013).
REACH covers all chemical substances used in industrial processes and in humans’
everyday life. REACH regulation is impacted in industries across the EU. In order for
industries to abide by the regulation, they must be able to recognize and control risks
associated with the substances they produce and market in the EU. If risks cannot be
controlled, the responsible authorities would limit the harmful substances used.
Substances of Very High Concern (SVHC) require some specific legal commitment for
producers, suppliers and importers of an object containing such substance. REACH is
keeping a list of chemicals that are registered under it and also an exception list of
chemicals (ECHA- European Chemical Agency, 2013). Annexes IV and V of REACH
exceptions from the necessity to register is in accordance with articles 2(7) (a) and 2(7)
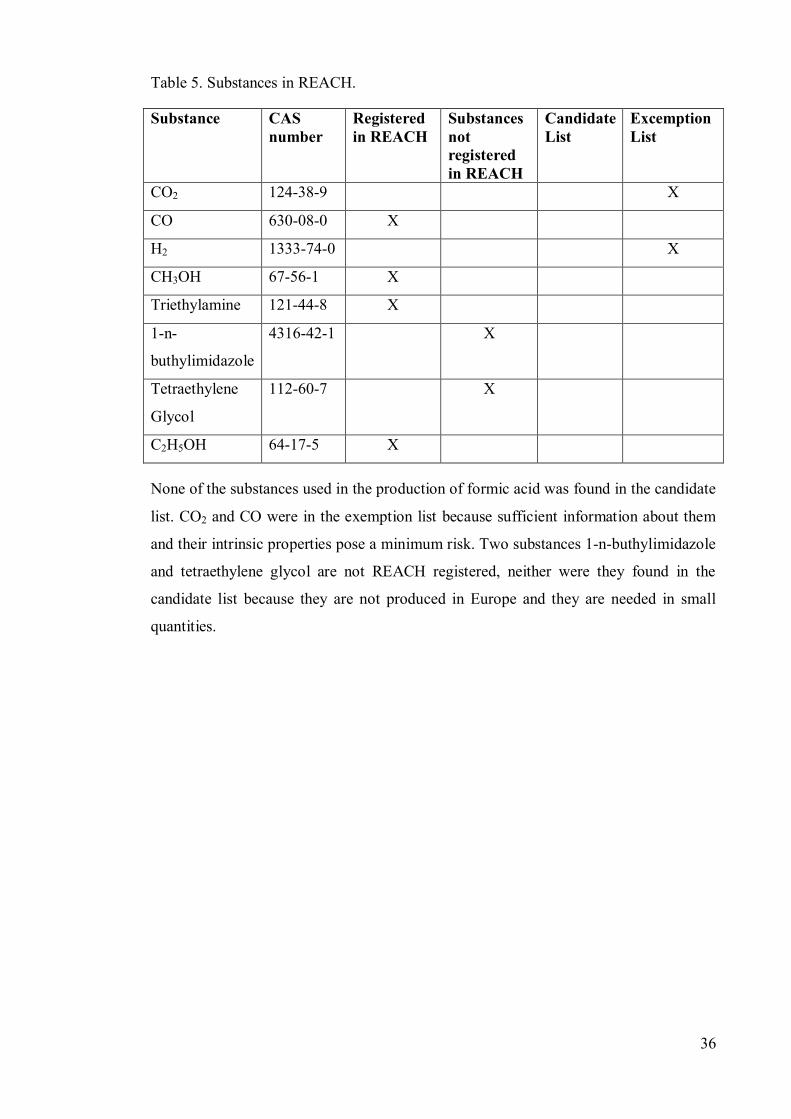
(b) (Official Journal of the European, 2008). Table 5 indicates all substances in REACH
that were included in this thesis.
36
Table 5. Substances in REACH.
Substance CAS number
Registered in REACH
Substances not registered in REACH
Candidate List
Excemption List
CO2 124-38-9 X
CO 630-08-0 X
H2 1333-74-0 X
CH3OH 67-56-1 X
Triethylamine 121-44-8 X
1-n-
buthylimidazole
4316-42-1 X
Tetraethylene
Glycol
112-60-7 X
C2H5OH 64-17-5 X
None of the substances used in the production of formic acid was found in the candidate
list. CO2 and CO were in the exemption list because sufficient information about them
and their intrinsic properties pose a minimum risk. Two substances 1-n-buthylimidazole
and tetraethylene glycol are not REACH registered, neither were they found in the
candidate list because they are not produced in Europe and they are needed in small
quantities.
37
5. FORMIC ACID
Formic acid (HCOOH) is an alkyl carboxylic acid also known as methanoic acid. It is a
colorless liquid that has a high pungent odor. It has a CAS number of 64-18-6 and a
molecular mass of 46.03. Formic acid is miscible with water but with hydrocarbons it is
miscible only to a certain degree. Formic acid is utilized in industries that produce
pesticides, rubber, textile, silage additive, leather and dyeing (Ullmann, 2011).
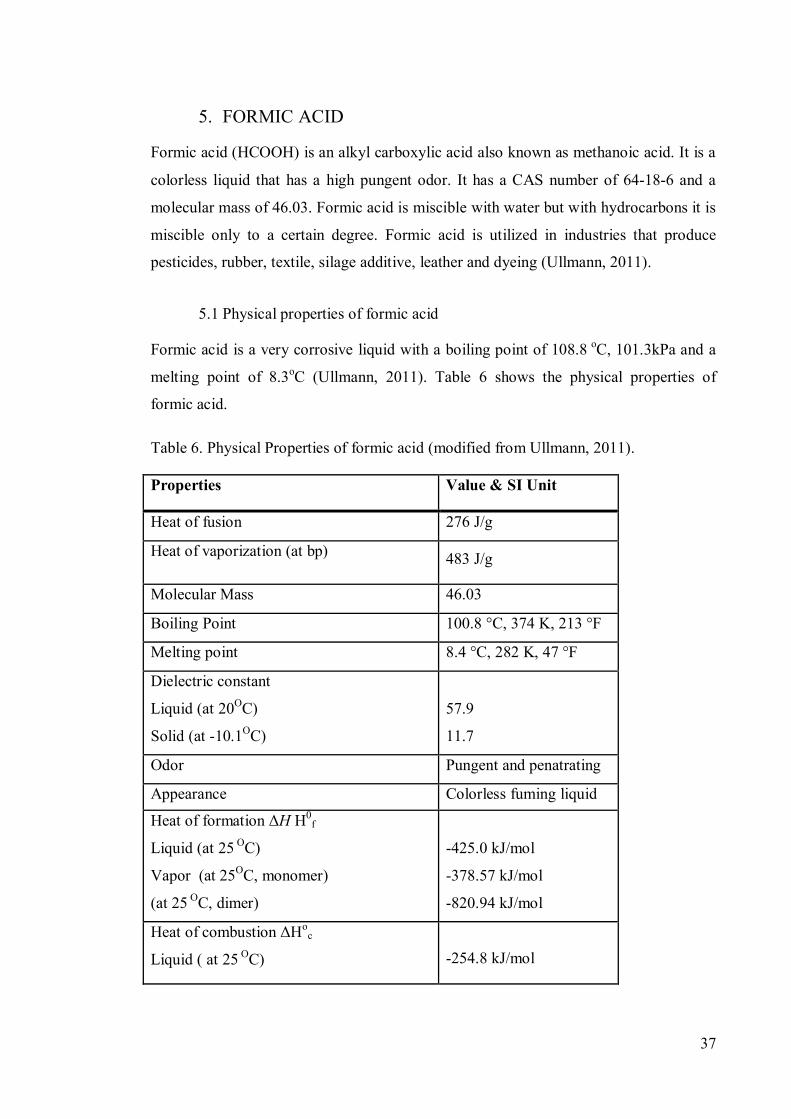
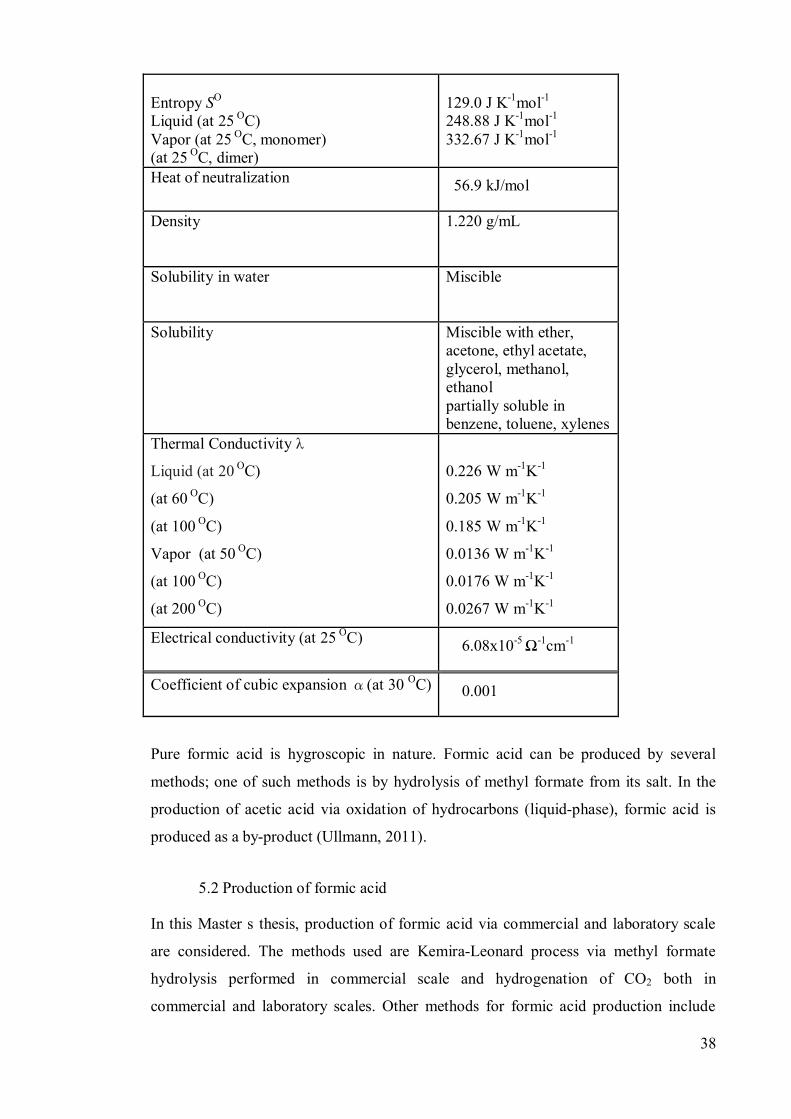
5.1 Physical properties of formic acid
Formic acid is a very corrosive liquid with a boiling point of 108.8 oC, 101.3kPa and a
melting point of 8.3oC (Ullmann, 2011). Table 6 shows the physical properties of
formic acid.
Table 6. Physical Properties of formic acid (modified from Ullmann, 2011).
Properties Value & SI Unit
Heat of fusion 276 J/g
Heat of vaporization (at bp) 483 J/g
Molecular Mass 46.03
Boiling Point 100.8 °C, 374 K, 213 °F
Melting point 8.4 °C, 282 K, 47 °F
Dielectric constant
Liquid (at 20OC)
Solid (at -10.1OC)
57.9
11.7
Odor Pungent and penatrating
Appearance Colorless fuming liquid
Heat of formation H H0f
Liquid (at 25 OC)
Vapor (at 25OC, monomer)
(at 25 OC, dimer)
-425.0 kJ/mol
-378.57 kJ/mol
-820.94 kJ/mol
Heat of combustion Hoc
Liquid ( at 25 OC)
-254.8 kJ/mol
38
Entropy SO
Liquid (at 25 OC) Vapor (at 25 OC, monomer) (at 25 OC, dimer)
129.0 J K-1mol-1 248.88 J K-1mol-1
332.67 J K-1mol-1
Heat of neutralization 56.9 kJ/mol
Density 1.220 g/mL
Solubility in water Miscible
Solubility Miscible with ether, acetone, ethyl acetate, glycerol, methanol, ethanol partially soluble in benzene, toluene, xylenes
Thermal Conductivity
Liquid (at 20 OC)
(at 60 OC)
(at 100 OC)
Vapor (at 50 OC)
(at 100 OC)
(at 200 OC)
0.226 W m-1K-1
0.205 W m-1K-1
0.185 W m-1K-1
0.0136 W m-1K-1
0.0176 W m-1K-1
0.0267 W m-1K-1
Electrical conductivity (at 25 OC) 6.08x10⁻⁵ -1cm-1
Coefficient of cubic expansion (at 30 OC) 0.001
Pure formic acid is hygroscopic in nature. Formic acid can be produced by several
methods; one of such methods is by hydrolysis of methyl formate from its salt. In the
production of acetic acid via oxidation of hydrocarbons (liquid-phase), formic acid is
produced as a by-product (Ullmann, 2011).
5.2 Production of formic acid
In this Master’s thesis, production of formic acid via commercial and laboratory scale
are considered. The methods used are Kemira-Leonard process via methyl formate
hydrolysis performed in commercial scale and hydrogenation of CO2 both in
commercial and laboratory scales. Other methods for formic acid production include
39
oxidation of hydrocarbons, preparation of free formic acid from formates and hydrolysis
of formamide (Ullmann, 2011).
5.2.1 Methyl formate hydrolysis
Methyl formate hydrolysis is one popular method for producing formic acid in
commercial scale. Methyl formate hydrolysis basically involves the synthesis of formic
acid via a two stage process. The first stage entails methanol (CH3OH) being
carbonylated with carbon monoxide (CO). In the second stage formic acid (HCOOH)
and methanol (CH3OH) are derived from hydrolyzed methyl formate (CH3OOCH). In
this process, methanol is recycled back to the first stage.
The reaction route for the production of formic acid is: CH3OH+CO HCOOCH3 (1) CH3OOCH+H2O CH3OH (2)
The heat of reaction HoR is -29 kJ/mol for Equation (1) and the heat of reaction Ho
R is
16.3 kJ/mol for Equation (2). The reaction is catalyzed by strong acids (Ullmann, 2011).
Ullmann (2011) stated that the two-stage industrial method of methyl formate
hydrolysis in the production of formic acid was mainly anchored by the following
company; the Leonard process company, located in the United States; the Scientific
Research Institute for the Chlorine Industry of the Ministry of Chemical Industry
located in the former Soviet Union and BASF located in Germany. The carbonylation of
methanol stage involves carbon monoxide reacting with liquid phase methanol. The
catalyst employed for this process is a basic catalyst.
The problems associated with the methyl formate hydrolysis are that it has unfavorable
hydrolysis equilibrium and methyl formate is a highly volatile chemical. These
problems are eliminated in the Kemira-Leonard process using two hydrolysis reactors
placed in series to each other after which a flash distillation is carried out in order to
take away very quickly unconverted ester and to perform the distillation in a column of
low residence time (Kirk-Othmer, 1993).
5.2.2 Kemira-Leonard Process (Commercial)
In the Kemira-Leonard process of methyl formate hydrolysis, the temperature and
pressure of the methyl formate and carbonylation were about 80oC and 4 MPa,
respectively. The catalyst used was alkoxides. Hydrolysis involved the use of the two
reactors both of which differ in their operating conditions. In the main reactor,

40
hydrolysis occurred at a temperature and pressure of 120oC and 0.9 MPa, respectively.
In this reactor, hydrolysis was catalyzed by the formic acid. Formic acid obtained in this
process is usually dehydrated via distillation to achieve high concentration. Very high
concentration of formic acid up to about 98% can be achieved by employing additional
dehydration column under atmospheric pressure (Ullmann, 2011).
a) Methyl formate reactor; b) Methyl formate column; c) Preliminary reactor; d) Main reactor; e) Flash tank;
f) Recycle column; g) Acid separation column; h) First product column; i) Second product column
Figure 14. Schematic process flow sheet of formic acid production (Kemira-Leonard process) (Ullmann, 2011).
In the methyl formate reactor (a), compressed carbon monoxide, methanol and catalyst
were fed into the reactor and converted into methyl formate. In the methyl formate
column (b), discharge from the methyl formate reactor was fed into it and methyl
formate was obtained as a distillate. Methanol and dissolved catalyst were recycled back
to the reactor. Inactivated catalyst was purged out of the process. In the preliminary
reactor (c), off gas and waste gas from the methyl formate column and the methyl
formate reactor respectively were burned. In this preliminary reactor, methyl formate
reacted with water partially. In the main reactor (d), discharges from the preliminary
reactor (methanol, water and methyl formate) were fed into it (main reactor). In the
flash tank (e) formic acid in small quantities methanol and methyl formate was recycled
back into the main reactor. In the acid separation column (g), it distilled in a vacuum
methanol and methyl formate. In the recycle column (f), methanol and methyl formate
were gotten from the separation column of the distillate. In the first product column (h),
distillation of water took place. In the second product column (i), further concentration

41
of bottom product took place and formic acid with a high concentration of
approximately 98% by weight is gotten off as a distillate (Ullmann, 2011).
5.2.3 Hydrogenation of carbon dioxide (CO2) using ruthenium hydroxide
catalyst (Laboratory Scale)
Formic acid is produced in laboratory scale by means of hydrogenation of carbon
dioxide (CO2). In the utilization of CO2 for chemical processes or reaction, efficient
catalysts are required because CO2 is known to be thermodynamically very stable.
Commercial scale production of formic acid such as the hydrolysis of methyl formate is
known to generate hazardous waste and it is energy intensive. The reaction route for the
hydrogenation of CO2 is as follows:
CO2 + H2 HCOOH (3)
For this process the best and most effective catalysts used to achieve a reasonably good
conversion of CO2 and yield of formic acid are ruthenium and rhodium usually in
combination with hydrides and halides. Although a homogenous catalyst is used in
some cases, heterogeneous catalysts are usually preferred for this process so that there
would be easy separation of formic acid from the used catalyst and base (Hao et al.,
2011).
How et al. (2011) have produced formic acid in laboratory scale. In this process, a
ruthenium hydroxide catalyst was used because of its high selectivity and activity and it
could also be recycled back to the process via filtration or centrifugation. The reaction
was performed over a -Al2O3 supported 2.0 wt% ruthenium hydroxide catalyst. CO2
hydrogenation was performed in an autoclave that had a magnetic stirrer and a capacity
of 100 ml. 15 ml of ethanol (solvent) was placed in an autoclave along with 0.1mmol of
ruthenium hydroxide (catalyst) and 5 ml of triethylamine. Excess air was generated and
this was removed using H2 three times to flush it away. The autoclave was heated to a
temperature of 353 k followed by the reactor being pressurized by H2 to 5.0 MPa. After
this, stirring of the mixture took place for 5 minutes. Cooled CO2 (about -5oC) was then
introduced into the process. Total pressure of the reaction was 13.5 Mpa and the overall
reaction temperature was 80oC. It was observed that maximum yield of formic acid was
obtained at 80oC. The yield obtained in this process was represented by turnover
number (TON) of formic acid which means moles of produced formic acid per mole of
ruthenium used. At the reactor outlet only the two gases (CO2 and H2) were collected.
42
5.2.4 BP patented process for hydrogenation of CO2 (Commercial)
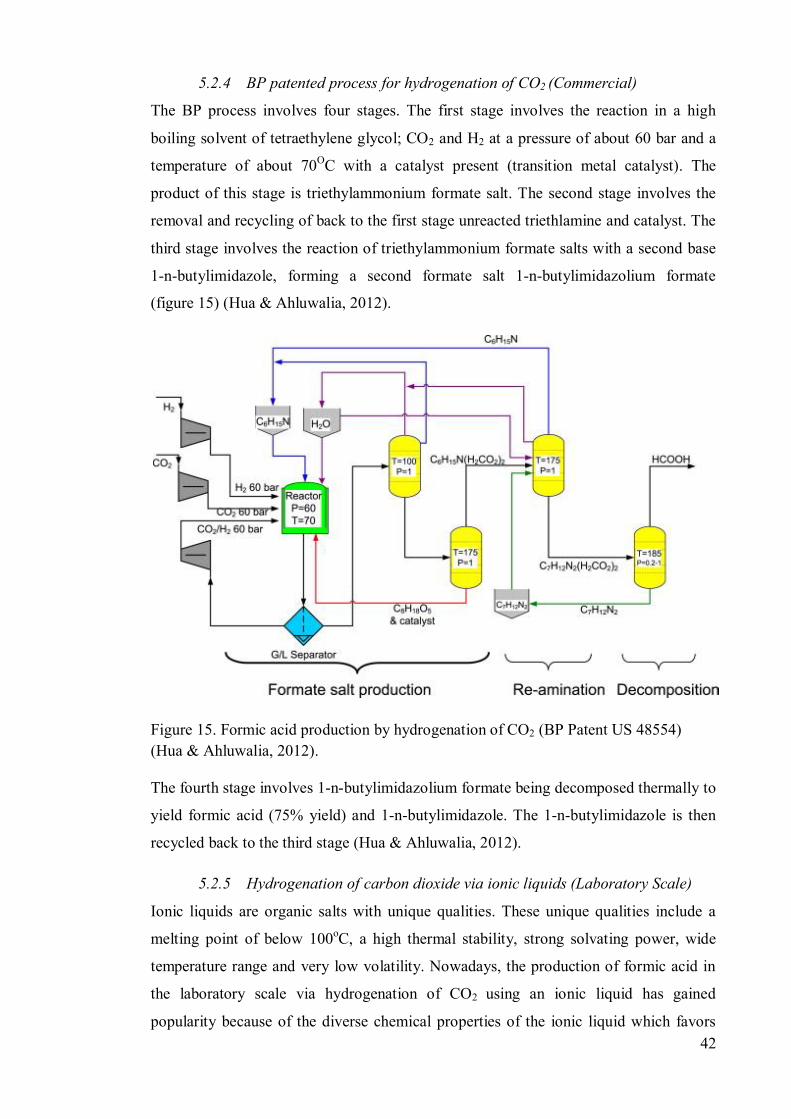
The BP process involves four stages. The first stage involves the reaction in a high
boiling solvent of tetraethylene glycol; CO2 and H2 at a pressure of about 60 bar and a
temperature of about 70OC with a catalyst present (transition metal catalyst). The
product of this stage is triethylammonium formate salt. The second stage involves the
removal and recycling of back to the first stage unreacted triethlamine and catalyst. The
third stage involves the reaction of triethylammonium formate salts with a second base
1-n-butylimidazole, forming a second formate salt 1-n-butylimidazolium formate
(figure 15) (Hua & Ahluwalia, 2012).
Figure 15. Formic acid production by hydrogenation of CO2 (BP Patent US 48554) (Hua & Ahluwalia, 2012).
The fourth stage involves 1-n-butylimidazolium formate being decomposed thermally to
yield formic acid (75% yield) and 1-n-butylimidazole. The 1-n-butylimidazole is then
recycled back to the third stage (Hua & Ahluwalia, 2012).
5.2.5 Hydrogenation of carbon dioxide via ionic liquids (Laboratory Scale)
Ionic liquids are organic salts with unique qualities. These unique qualities include a
melting point of below 100oC, a high thermal stability, strong solvating power, wide
temperature range and very low volatility. Nowadays, the production of formic acid in
the laboratory scale via hydrogenation of CO2 using an ionic liquid has gained
popularity because of the diverse chemical properties of the ionic liquid which favors

43
the reaction (Zhang et al., 2009). Ionic liquids are also characterized as having a high
polarity, resistant to chemicals and very low pressure. They can be adapted to specific
operation by the right combination of anions and cations (Andanson et al., 2012).
Zhang et al. (2008) have reported the use of ionic liquids as a base in the hydrogenation
of CO2. The catalyst used for this process was a ruthenium immobilized on silica (a
heterogeneous catalyst). During this reaction, the catalyst was distributed in an ionic
aqueous solution. The catalytic system has a high selectivity and activity. Formic acid
produced by this process is easy to retrieve. The catalyst and the ionic liquid can
effortlessly be separated via filtration and evaporation respectively, and reused. The
ease of the reaction and separation of the catalyst is shown in Figure 16.
Figure 16. Hydrogenation of CO2 and recovery of formic acid, catalyst and ionic liquid (Zhang et al., 2008).
At a temperature of 130oC the separation of formic acid from ionic liquid takes place;
here formic acid is evaporated from the ionic liquid by the means of a nitrogen flow.
The ionic liquid used for this process is a basic ionic liquid with a tertiary amino group
(N(CH3)2) on the cation namely 1-(N,N-dimethylaminoethyl)-2,3-dimethylimidazolium
trifluoromethanesulfonate ([mammim][TfO], 3). (Zhang et al., 2008).
Zhang et al. (2009) have gone a step further and reported on the use of a diamine
functionalized ionic liquid for the production of formic acid via the hydrogenation of
CO2. The reaction standard free energy is positive ( G0298= 32.9 kJ mol-1). To obtain an
equilibrium reaction to bring about an acceptable conversion, it is necessary to add a
base. When compared to a task specific ionic liquid, a diamine functionalized ionic
liquid the efficiency of CO2 hydrogenation is expected to be higher. 1,3-di(N,N-
dimethylaminoethyl)-2-methylimidazolium trifluoromethanesulfonate ionic liquid
which contained two tertiary amino groups on the cation was synthesized in the
reaction. Using this basic ionic liquid, it is shown that in one reaction cycle one mole of
the ionic liquid can produce two moles of formic acid. Formic acid with a high
selectivity and activity was produced from the reaction of CO2 and H2 in the presence of
the ionic liquid ([DAMI][TfO]) and heterogeneous catalyst “Si”- (CH2)3 NH(CSCH3)-

44
{RUCl3(PPh3)}. The ionic liquid and the catalyst can be reused after separation. The
catalyst was recovered from the solution by filtration after which the solution was
heated and water was expelled out by means of evaporation. Nitrogen flow at 130 OC
was used to recover the formic acid from the ionic liquid. Table 7 shows the
experimental results of formic acid production by the hydrogenation of CO2 (Zhang et
al., 2009).
Table 7. Hydrogenation of CO2 to formic acid in ([DAMI][TfO]).[a] (Zhang et al., 2009).
In this reaction, different quantities of water was added which led to an increase in
turnover frequency in entries 1-4 (Zhang et al., 2009).

45
EXPERIMENTAL PART
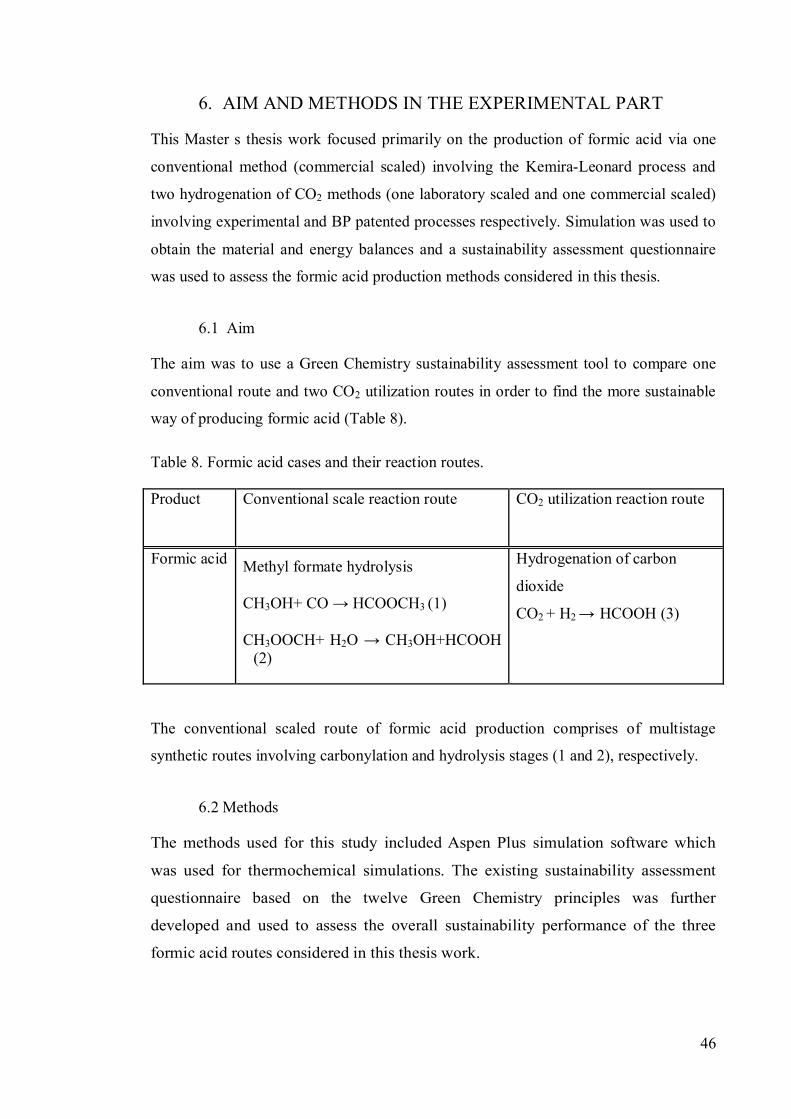
46
6. AIM AND METHODS IN THE EXPERIMENTAL PART
This Master’s thesis work focused primarily on the production of formic acid via one
conventional method (commercial scaled) involving the Kemira-Leonard process and
two hydrogenation of CO2 methods (one laboratory scaled and one commercial scaled)
involving experimental and BP patented processes respectively. Simulation was used to
obtain the material and energy balances and a sustainability assessment questionnaire
was used to assess the formic acid production methods considered in this thesis.
6.1 Aim
The aim was to use a Green Chemistry sustainability assessment tool to compare one
conventional route and two CO2 utilization routes in order to find the more sustainable
way of producing formic acid (Table 8).
Table 8. Formic acid cases and their reaction routes.
Product Conventional scale reaction route CO2 utilization reaction route
Formic acid
Methyl formate hydrolysis
CH3OH+ CO HCOOCH3 (1)
CH3OOCH+ H2O CH3OH+HCOOH (2)
Hydrogenation of carbon
dioxide
CO2 + H2 HCOOH (3)
The conventional scaled route of formic acid production comprises of multistage
synthetic routes involving carbonylation and hydrolysis stages (1 and 2), respectively.
6.2 Methods
The methods used for this study included Aspen Plus simulation software which
was used for thermochemical simulations. The existing sustainability assessment
questionnaire based on the twelve Green Chemistry principles was further
developed and used to assess the overall sustainability performance of the three
formic acid routes considered in this thesis work.

47
6.2.1 Aspen Plus
Aspen Plus can be described as a comprehensive chemical process modeling system
created to enable the user to design and improve process plants. It does this by
beginning with a process flowsheet followed by the specification of chemical
components to be used as well as the operating conditions, it then simulates. The
purpose of the simulation is to predict the behavior of the system. Aspen plus is mainly
used by chemical organizations, academics and related industry (Aspentech, 2013).
6.2.2 Sustainability assessment questionnaire
Sustainability assessment questionnaire already in existence (Saavalainen, 2012) was
further developed based on the twelve principles of Green Chemistry. The Green
Chemistry tool was used in this work because it is a qualitative design tool and extended
to include all three aspects of sustainability. The questionnaire was designed to help
engineers and chemists to consider the sustainability aspects of products and processes
in the design phase.

48
7. MATERIAL AND ENERGY BALANCES
Material and energy balances of formic acid production via the conventional route have
been simulated with the Aspen plus software.
7.1 Material and energy balances of the conventional route
The purpose of the material balance is to determine the product flow composition, while
the purpose of the energy balance is to determine the total amount of energy used up in
the reaction process. Figure 17 shows the flowsheet of the conventional route simulated
using Aspen Plus.
Figure 17. Flowsheet of the conventional route.
The process consists of two equilibrium reactors (Carbonyl and Hydrol, modeled as
RGiggs in AspenPlus) and a heat exchanger (HE). Methanol and CO were introduced
into the first reactor where carbonylation took place. The process conditions
temperature and pressure were found from the literature. Water and the products (flow
1) from the carbonylation stage were introduced into the second reactor and hydrolysis
took place. Water, methanol, carbon monoxide, methyl formate and formic acid (flow 2)
from the second reactor was passed through the heat exchanger and the final product
obtained were formic acid, water, carbon monoxide, methyl formate and methanol.
H2O, CO, CH3OOCH and CH3OH were recycled back to the process. Aspen Plus was
used to simulate the process conditions and to obtain the material balance and energy
consumption of the Conventional route (Table 9 & 10).

49
Table 9. Process conditions of the conventional route
Process conditions
Feed
flow
Flow 1 H2O Flow 2
Products
Temperature [ºC] 20.00 80.00 20.00 120.00 20.00
Pressure [bar] 1.00 40.00 1.00 9.00 1.00
Total flow [kmol/hr] 2.00 1.82 2.00 3.00 3.00
Total flow [kg/hr] 60.05 78.07 60.05 78.07 78.07
Total flow [l/min] 459.41 22.25 459.41 181.04 470.07
Table 10. Material balance and energy consumption of the conventional route.
Material balance [kmol] Energy consumption [MJ]
Feed
Products
CH3OH 1.00 0.20 Reactor (1 & 2) 29.44 19.57
CO 1.00 0.00 Heat exchanger -80.32
H2O 0.00 0.80 Total -31.31
HCOOCH3
0.00 0.80 Per kmol of
HCOOH
produced
-155.37
HCOOH 0.00 0.20
7.2 Material and energy balances of the hydrogenation of CO2 route
(Experimental and BP routes)
Material and energy balances for the formic acid production via the hydrogenation of
CO2 route have been simulated with the Aspen plus software. The purpose of the
material balance was to determine the flow composition. The purpose of the energy
balance was to determine the total amount of energy used in the process. Figure 18
illustrates the flowsheet of the hydrogenation of CO2 route simulated using Aspen Plus.

50
Figure 18. Flowsheet of the hydrogenation of CO2 route (Experimental and BP routes).
The process consists of an equilibrium reactor (modeled as RGiggs in AspenPlus) and a
heat exchanger (HE). In this case only one reactor was required and used. Here CO2 and
H2 were introduced into the reactor and the flow (1) consisting of hydrogen, carbon
dioxide and formic acid was passed through a heat exchanger and formic acid and some
amount of hydrogen and carbon dioxide were obtained as the final product. CO2 and H2
were recycled back into the process. Aspen Plus was used to simulate the process
conditions and to obtain the material balance and energy consumption of both the BP
and Experimental hydrogenation of CO2 routes (Table 11, 12, 13 & 14).
Table 11. Process conditions of Hydrogenation of CO2 (Experimental route).
Process conditions Feed Flow 1 Products
Temperature [ºC] 20.00 80.00 20.00
Pressure [bar] 1.00 135.00 1.00
Total Flow [kmol/hr] 2.00 2.00 2.00
Total Flow [kg/hr] 46.02 46.02 46.02
Total Flow [l/min] 801.82 7.25 801.82
Table 12. Process conditions of Hydrogenation of CO2 (BP route).
Process conditions Feed Flow 1 Products
Temperature [ºC] 20.00 70.00 20.00
Pressure [bar] 60.00 1.00 1.00
Total Flow [kmol/hr] 2.00 2.00 2.00
Total Flow [kg/hr] 46.03 46.03 46.03
Total Flow [l/min] 801.82 15.85 801.82

51
The initial temperature and pressure used in this process were gotten from the
theoretical part of this work.
Table 13. Material balance and energy consumption in the hydrogenation of CO2
(Experimental route).
Material balance [kmol] Energy consumption [MJ]
Component Feed Products Reactor 6.83
CO2 1.00 1.00 Heat exchanger -6.17
H2
1.00
1.00
Total 6.23 *10-
5
Formic acid
0.00
4.15 * 10-6
Per kmol of HCOOH
produced
15.00
Table 14. Material balance and energy consumption in the Hydrogenation of CO2 (BP
route).
Material balance [kmol] Energy consumption [MJ]
Component Feed Products Reactor 3.35
CO2 1.00 1.00 Heat exchanger -3.35
H2
1.00
1.00
Total 2.41 *10-
5
Formic acid
0.00
1.61 * 10-6
Per kmol of HCOOH
produced
15.02
Comparing Tables 10, 13 and 14, it can be seen that while the conventional route
releases energy (exothermic process), both CO2 routes consume approximately the same
amount of energy (endothermic process).

52
8. SUSTAINABILITY ASSESSMENT
The sustainability assessments for three formic acid production processes are shown in
Table 15, some facts and assumptions have been made on each process.
Table 15. Sustainability assessment facts and assumption for the conventional and
hydrogenation of carbon dioxide routes for the production of formic acid.
(based on: Ullmann 2011, Kirk-Othmer 1993, Hao et al. 2011 , Zhang et al. 2009,
Hua, T.Q & Ahluwalia R.K. 2012 , Wang et al. 2011, The Linde Group 2012,
Methanex Corporation 2011, Air Products 2012)
Features Case A: Conventional route
Case B: Experimental route
Case C: BP route
Raw Materials CH3OH and CO H2 and CO2 H2 and CO2 Reaction Route CH3OH+CO
HCOOCH3 CH3OOCH+H2O CH3OH+HCOOH
CO2 + H2 HCOOH
CO2 + H2 HCOOH
Main Products HCOOH HCOOH HCOOH Side Products CH3OH was formed
and recycled back to the process
H2 and CO2 was formed and recycled back to the process
The reaction yielded along with the formic acid, H2 and CO2 which was recycled back to the process
Waste/ Emission Unreacted methyl formate and inactivated catalyst
No emissions/waste No emissions/waste
Atom Economy (theoretical)
59% 100%
100%
Yield High yield, exact amount not specified
5.17% (calculated based on Hao et al., 2011)
75%
Process Conditions
Temperature=80 OC Pressure= 4 MPa
Temperature=80 OC Pressure= 13.5 MPa
Reactor Temperature=70 OC Reactor Pressure= 6 MPa
Energy Consumption (calculated based on thermodynamics)
-155.37MJ per kmol of HCOOH
15.00 MJ per kmol of HCOOH
15.02 MJ per kmol of HCOOH
Solvents and Auxiliary
Water was used in the process
15 mL of ethanol was used as a
Tetraethylene glycol was used as a solvent
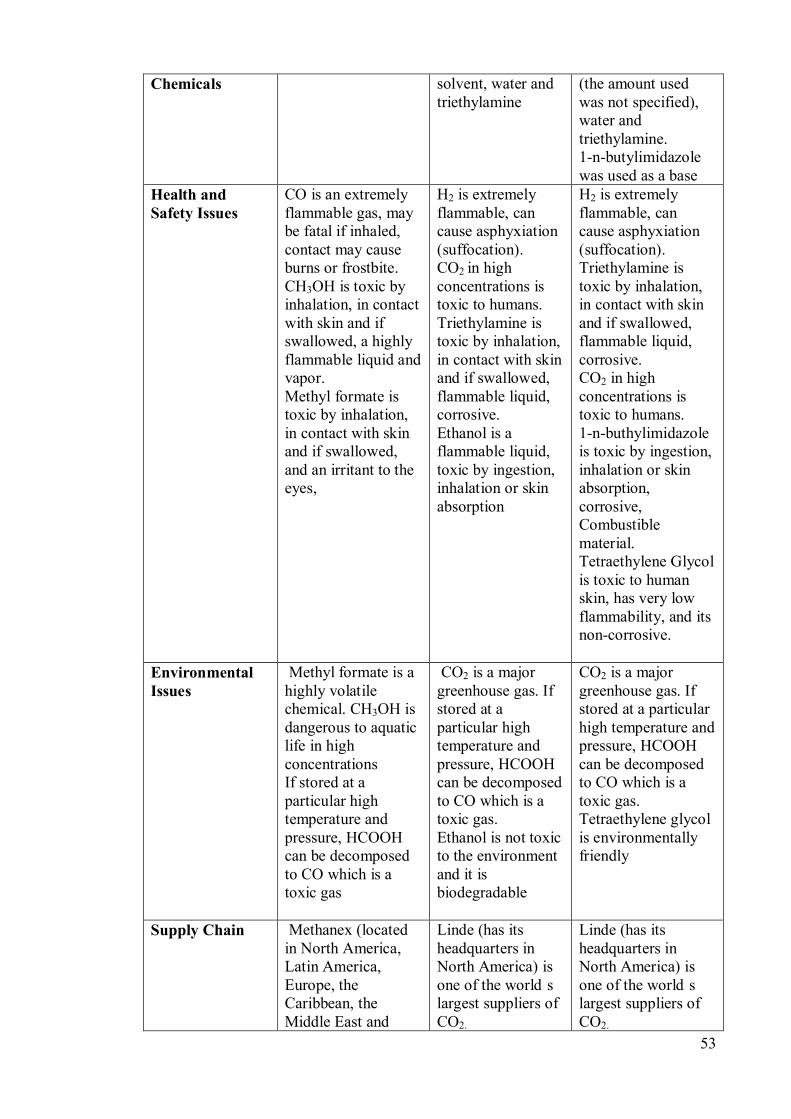
53
Chemicals solvent, water and triethylamine
(the amount used was not specified), water and triethylamine. 1-n-butylimidazole was used as a base
Health and Safety Issues
CO is an extremely flammable gas, may be fatal if inhaled, contact may cause burns or frostbite. CH3OH is toxic by inhalation, in contact with skin and if swallowed, a highly flammable liquid and vapor. Methyl formate is toxic by inhalation, in contact with skin and if swallowed, and an irritant to the eyes,
H2 is extremely flammable, can cause asphyxiation (suffocation). CO2 in high concentrations is toxic to humans. Triethylamine is toxic by inhalation, in contact with skin and if swallowed, flammable liquid, corrosive. Ethanol is a flammable liquid, toxic by ingestion, inhalation or skin absorption
H2 is extremely flammable, can cause asphyxiation (suffocation). Triethylamine is toxic by inhalation, in contact with skin and if swallowed, flammable liquid, corrosive. CO2 in high concentrations is toxic to humans. 1-n-buthylimidazole is toxic by ingestion, inhalation or skin absorption, corrosive, Combustible material. Tetraethylene Glycol is toxic to human skin, has very low flammability, and its non-corrosive.
Environmental Issues
Methyl formate is a highly volatile chemical. CH3OH is dangerous to aquatic life in high concentrations If stored at a particular high temperature and pressure, HCOOH can be decomposed to CO which is a toxic gas
CO2 is a major greenhouse gas. If stored at a particular high temperature and pressure, HCOOH can be decomposed to CO which is a toxic gas. Ethanol is not toxic to the environment and it is biodegradable
CO2 is a major greenhouse gas. If stored at a particular high temperature and pressure, HCOOH can be decomposed to CO which is a toxic gas. Tetraethylene glycol is environmentally friendly
Supply Chain Methanex (located in North America, Latin America, Europe, the Caribbean, the Middle East and
Linde (has its headquarters in North America) is one of the world’s largest suppliers of CO2.
Linde (has its headquarters in North America) is one of the world’s largest suppliers of CO2.

54
throughout the Asia Pacific region) is the world’s largest supplier of methanol to international markets. Air products (has its headquarters in the United States) is one of the world’s largest suppliers of CO
Air products are one of the world’s largest suppliers of hydrogen. BASF is the world’s largest producer of formic acid with plants located in Ludwigshafen, Germany, and Nanjing, China.
Air products are one of the world’s largest suppliers of hydrogen. BASF is the world’s largest producer of formic acid with plants located in Ludwigshafen, Germany, and Nanjing, China.
Alternative Options
Hydrogenation of Carbon dioxide, Oxidation of hydrocarbons, hydrolysis of formide and by-product of Acetic acid production
Methyl formate hydrolysis, Oxidation of hydrocarbons, hydrolysis of formide and by-product of Acetic acid production
Methyl Formate hydrolysis, Oxidation of hydrocarbons, hydrolysis of formide and by-product of Acetic acid production
Catalyst Used Additive-containing alkoxides-sodium methoxide(CH3ONa)
Ruthenium hydroxide heterogeneous catalyst Ru(OH)
Ruthenium complex transition metal catalyst e.g RuCl2(PPh3)2, Ru(PPh3)2C12(4-vinyl-py)2 and Ru(PPh3)2C12(4-Me-py)2, (R)-C3-tunePhos-ruthenium complex. heterogeneous catalyst
Treatment/ Disposal of Waste Cost
Waste gas and deactivated catalyst were purged out of the process
None, there was no waste to be treated or disposed of
None, there was no waste to be treated or disposed of
Product Selectivity
High selectivity of the alkoxides catalyst to the production of HCOOH
High selectivity of ruthenium hydroxide catalyst to the production of HCOOH
Moderate selectivity
Product Quality Formic acid of 98% purity was obtained as distillate
Formic acid of high purity was obtained from this process
Formic acid of high purity was obtained from this process
Product Acceptability
Formic acid is readily acceptable as it has wide range of uses both in
Formic acid is readily acceptable as it has wide range of uses both in
Formic acid is readily acceptable as it has wide range of uses both in

55
agricultural, industrial and household level. CO and CH3OH has safety, health and environmental issues hence the raw materials used to produce HCOOH is not readily acceptable
agricultural, industrial and household level. Ethanol and triethylamine has health and safety issues. Hydrogen has safety issues
agricultural, industrial and household level. 1-n-buthylimidazole and triethylamine has safety and health issues. Hydrogen has safety issues
Chemicals registerd in REACH
CO and CH3OH CO2, H2, triethylamine, ethanol
CO2, H2, triethylamine
Atom economy was calculated based on the equation of reaction of each case. Energy
demand was simulated using Aspen Plus and the simulations were done using the
process conditions gotten from the literature. It was assumed that all the feed substances
were obtained from a renewable source.
8.1 Sustainability Assessment Questionnaire
In this questionnaire, scores of -1, 0, and 1 were allocated to each question based on the
assumption that a chemical product or a production process either has a positive, zero or
a negative effect on the environment, the economy and the people. Some of the
questions that were not applicable (NA) or had simultaneous negative and positive
points (± 1) were given the score of zero (0) as well. Case A represents the conventional
methyl formate hydrolysis process; Case B represents hydrogenation of CO2 using a
ruthenium hydroxide catalyst (the experimental route); and Case C represents the BP
patented process of the Hydrogenation of CO2 (BP route).
Table 16. Sustainability Assessment Questionnaire.
Green Chemistry Principle 1
CASE A
CASE B
CASE C
Waste Prevention
Environmental
Does the process produce waste? -1 1 1
Methyl formate hydrolysis (Case A) produces as waste deactivated catalyst. Case B and C do not produce waste
Is the waste -1 0 0 The unreacted catalyst purged out from

56
hazardous? case A is a hazardous waste. Not applicable to Case B and C
Does the process produce harmful emissions? -1 1 1
Purge gas from case A contains harmful emissions. Case B and C do not produce harmful emissions
Does your process produce wastewater? -1 1 1
Case A produces wastewater which is distilled and recycled. Case B and C do not produce wastewater
Does the wastewater need special treatment? -1 0 0
In case A, the wastewater produced is purified and recycled thus requires special treatment. Not applicable to Case B and C
Can the wastewater be re-used? 1 0 0
Yes, wastewater is reused in case A. Not applicable to Case B and C
Does the process produce by-products and are these by-products utilized 0 0 0
None of the cases produces by-products, but Case A, B and C have intermediates.
Are there in the supply chain of the raw materials significant amounts of waste produced? 0 -1 -1
In case A, production of CH3OH and CO do not lead to wastes. In case B and C, H2 and CO2 do not produce waste, but triethylamine production releases emissions and effluents
Social Are there any health and safety issues related to the harmful nature or amount of waste/ emissions? -1 1 1
Emissions in case A contain some CO and unreacted methyl formate which are harmful. In Case B and C there are no harmful emissions or waste
Economic Is there a significant cost related to the treatment and disposal of the waste -1 0 0
In case A, the catalysts waste needs to be treated and this would incur costs. Not applicable to case B and C
Can profit be derived from waste or by-products 0 0 0
Case A, B and C have intermediates and no by- products.
Green Chemistry Principle 2
CASE A
CASE B
CASE C Atom economy
Economic Does the synthetic process have high yield 1 -1 1
Cases A and C have high yields, In Case B the yield is very low
What is the selectivity to the desired product 1 1 0
Cases A and B have high selectivities, Case C has moderate selectivity
What is the atom economy of possible reaction routes (< 60=-1/ >90=1) -1 1 1
In Case A the theoretical atom economy is 59%, In Case B and C the theoretical atom economy is 100%
Green Chemistry Principle 3
CASE A
CASE B
CASE C Design the synthesis less hazardous

57
Environmental Does the process use or generate materials that are potentially harmful? -1 -1 -1
In case A, CO and CH3OH are both harmful. 1-n-butylimidazole (Case C) is harmful. Triethylamine (Case B & Case C) is toxic
Social Are there any health and safety issues related to the harmful nature of chemicals used or generated in the process? -1 -1 -1
CH3OH (Case A), 1-n-butylimidazole (Case C), Triethylamine (Case B & Case C), ethanol (Case B) and tetraethylene glycol (Case C) have health and safety issues
Green Chemistry Principle 4
CASE A
CASE B
CASE C Design safer chemicals and products
Environmental
Does the use of product lead to harmful emissions? 0 0 0
HCOOH decomposes to CO when left for a long time but it being harmful is volume dependant especially when high volumes are involved.
Do the products produced contain harmful or hazardous materials (take into notice also the side products)? -1 -1 -1
HCOOH is toxic and corrosive in high concentrations
Economic Is there any significant cost related to the harmful nature of the chemicals in the product? 1 1 1 No significant cost Social Are there any health and safety issues related to harmful nature of the product? -1 -1 -1
Yes, formic acid is toxic by inhalation and in contact to the skin
Green Chemistry Principle 5
CASE A
CASE B
CASE C
Considerations of safer solvents and reaction conditions in the design phase
Environmental
Are the feedstock and/or other auxiliary chemicals that are used in processes considered toxic or hazardous? -1 -1 -1
H2O is used as an auxiliary chemical in Case A and is non toxic, Ethanol as a solvent in Case B and is slightly toxic, Tetraethylene Glycol as a solvent , and 1-n butylimidazole as a base in Case C and are both slightly toxic to humans. Methanol (Case A) is toxic to humans
Do the used solvents generate harmful emissions during 1 1 1 No in all three cases

58
processing?
Social Are there any health and safety issues related to the harmful nature of solvents, separation agents, or other auxiliary chemicals? 1 -1 -1
Yes, ethanol (Case B) and 1-n-butylimidazole (Case C) has safety and health issues. Water (Case A) has no issue
Does the quality of solvents necessitate the use of protective gear? 1 -1 -1
Ethanol and tetraethylene glycol (Case B) require it
Economic Cost of chemicals -1 1 1
Case A cost 35.21 €/kmol, Case B and Case C cost 13.99 €/kmol
Green Chemistry Principle 6
CASE A
CASE B
CASE C Energy efficiency of the process
Environmental Do the processes require large deviation from ambient temperature? 1 1 1
No, the temperature in all three cases are only slightly higher than the ambient temperature
Is the process energy intensive? 1 -1 -1
Case B and Case C consume more energy than Case A
Do the processes require large deviation from ambient pressure? -1 -1 -1
Yes, the pressure in all three cases are much higher than the ambient pressure
Economic Does the energy consumption add substantially to the cost 1 -1 -1
The amount of energy consumed in Cases B and C leads to increased cost, in Case B no, In Case A the cost is reasonable
Green Chemistry Principle 7
CASE A
CASE B
CASE C Utilize renewable (or benign?) feedstock
Environmental Are the materials used renewable or non-renewable? (mixed carbon source = 0) Methyl Formate Hydrolysis (-1/0/1) CH3OH -1
CH3OH is produced from non-renewable sources
CO -1 CO is gotten from non-renewable source Hydrogenation of

59
CO2 H2 1 1 H2 is renewable CO2 1 1 CO2 is renewable
Triethylamine 1 1
Triethylamine is produced by reacting ammonia with ethanol ( ethanol can be produced from corn hence renewable, ammonia can be produced from renewables)
Are these materials readily available? 1 1 1
All the raw materials used as feedstock in all cases are readily available
Could these materials be derived from waste streams 1 0
In Case A, it is possible to derive CO from the purge gas
Economic Does the use of renewables increase cost? 1 1 1
Use of renewables leads to a reduction in cost
Green Chemistry Principle 8
CASE A
CASE B
CASE C
To design a chemical process to avoid unnecessary derivatization
Environmental Are there multistage synthetic routes involving blocking and/or protecting groups in the process? -1 1 -1
Methyl formate hydrolysis (Case A) has a two stage synthetic route, BP hydrogenation of CO2 (Case C) has a four stage synthetic route
Do these stages lead to the generation of additional quantities of unwanted by-products and waste? 1 0 1
No in Cases A and B because the stages do not lead to unwanted by-products. Not applicable to case B
Green Chemistry Principle 9
CASE A
CASE B
CASE C
Considerations of catalyst usage in the design phase
Environmental Does the process use catalysts? 1 1 1 All three cases makes use of catalysts Does the process make use of noble/rare earth metal catalyst 1 -1 -1
Ruthenium hydroxide catalyst in Case B and ruthenium complex catalyst in Case C are noble metal catalysts. Case A do not make use of such catalyst
Does the catalyst have a high activity and selectivity
0 1 1
Catalyst used in Case A has high activity only, In Case B the ruthenium hydroxide catalyst used has a high activity and selectivity, Case C has high selectivity and activity
Social Is there any health, safety or environmental issues related to the used catalytic materials? -1 -1 1
CH3ONa used in Case A is toxic and corrosive, Ruthenium on alumina in Case B is toxic to the skin, Ruthenium complex in Case C has negligible health, safety and environmental effects

60
Green Chemistry Principle 10
CASE A
CASE B
CASE C
How to design chemicals and products to degrade after use
Environmental Is the product degradable or non degradable? 1 1 1 Formic acid is a degradable chemical Does the product have a high environmental impact at the-end-of life (take into notice also the side products)? 1 1 -1
Formic acid and methanol decompose easily in the environment. 1-n-butylimidazole is harmful to ground water, water course and sewage system
Green Chemistry Principle 11
CASE A
CASE B
CASE C
Process monitoring and analysis in the design phase
Environmental
Is the process especially sensitive to changes in process condition
-1 -1 -1
In Case A, the reaction rate can be raised by an increase in temperature, CO partial pressure and the catalyst concentration. In Case B optimal yield of formic acid was observed at temperature of 80OC, lower temperature leads to lower yields. In Case C, changes in process conditions directly affect the HCOOH yield.
Social Are there any health and safety issues related to the changes in process conditions -1 -1 -1
An increase in pressure in the reactor could lead to explosion in Cases A, B and C.
Green Chemistry Principle 12
CASE A
CASE B
CASE C
How the potential for accidents could be minimized
Environmental Are there hazards related to the designed process (synthetic and formulation activities, involved operations or reaction conditions)? -1 1 -1
Yes, CO is hazardous if a leakage occurs, the reaction pressures are far above the ambient pressure for Cases A and C.
Social Do the safety procedures lead to improved quality of working conditions? 1 1 1
Yes in all three cases, according to the material safety data sheet
Is there a need for advanced training related to the health and safety issues on used chemicals 1 1 1
CO is an extremely poisonous gas, H2 is highly flammable, therefore advanced training is needed to equip people with knowledge on how to prevent the harmful effect of chemicals

61
This questionnaire comprises of a total of 41 questions. Environmental part has 32
questions; social and economic parts have 9 questions each. Table 17 shows the
composite score sheet of the sustainability assessment questionnaire. It is the sum of all
principles of the conventional, experimental and BP routes under the three sustainability
aspect (environmental, social and economic).
Table 17. Composite score sheet.
Green Chemistry CONVENTIONAL EXPERIMENTAL BP Env Soc Econ Env Soc Econ Env Soc Econ
Principle 1 -4 -1 -1 2 1 0 2 1 0 Principle 2 - - 1 - - 1 - - 2 Principle 3 -1 -1 - -1 -1 - -1 -1 - Principle 4 -1 -1 1 -1 -1 1 -1 -1 1 Principle 5 0 2 -1 0 -2 1 0 -2 1 Principle 6 1 - 1 -1 - -1 -1 - -1 Principle 7 4 - 1 4 - 1 4 - 1 Principle 8 0 - - 1 - - 0 - - Principle 9 2 -1 - 1 -1 - 1 1 - Principle 10 2 - - 2 - - 0 - - Principle 11 -1 -1 - -1 -1 - -1 -1 - Principle 12 -1 2 - 1 2 - -1 2 - TOTAL SCORE -3 -1 2 7 -3 3 2 -1 4
Figure 19 illustrates the composite score chart of the sustainability assessment
questionnaire based on the composite score sheet results.
Figure 19. Composite score chart.
-4
-2
0
2
4
6
8
ENV SOC ECON
COMPOSITE SCORE SHEET
CASE A
CASE B
CASE C
62
From the composite score sheet of the sustainability assessment questionnaire, the
conventional route had a composite score of -2 which was the lowest of the three cases;
The experimental route had a composite score of 7 which was the highest of all three
cases while the BP route had a composite score of 5 which was the second highest of
the three cases. In the composite score chart, it can be seen that in the environmental
part, the conventional route had a value of (-3) which was the lowest of all cases, the
experimental route had a positive value of (7) which was the highest of all the cases,
while BP route score was (2), the second highest score. In the social part of the chart,
the conventional, experimental and BP routes all had negative values of (-1, -3 and -1)
respectively. In the economic part of the chart, the conventional route had a score of (2),
the experimental and BP routes both had positive scores of (3 and 4) respectively; the
BP route being the highest of the three. Figures 20-22 depict spider charts showing
individual sustainability aspect of each case with respect to the twelve principles of
green chemistry and based on the composite score sheet results.

63
Figure 20. Environmental assessment charts.
-4-3-2-101234
Waste Prevention
Atom Economy
Less Hazardous…
Design Safer Chemicals
Safer Solvents
Energy Efficiency Design
Renewable Feedstock
Reduce Derivatives
Catalysis
Design for Degradation
Real Time Analysis
Inherently Safer…
CASE A
-4-3-2-101234
Waste PreventionAtom Economy
Less Hazardous…
Design Safer Chemicals
Safer Solvents
Energy Efficiency DesignRenewable Feedstock
Reduce Derivatives
Catalysis
Design for Degradation
Real Time Analysis
Inherently Safer…
CASE B
-4-3-2-101234
Waste Prevention
Atom Economy
Less Hazardous Chemicals
Design Safer Chemicals
Safer Solvents
Energy Efficiency Design
Renewable Feedstock
Reduce Derivatives
Catalysis
Design for Degradation
Real Time Analysis
Inherently Safer Chemistry
BP
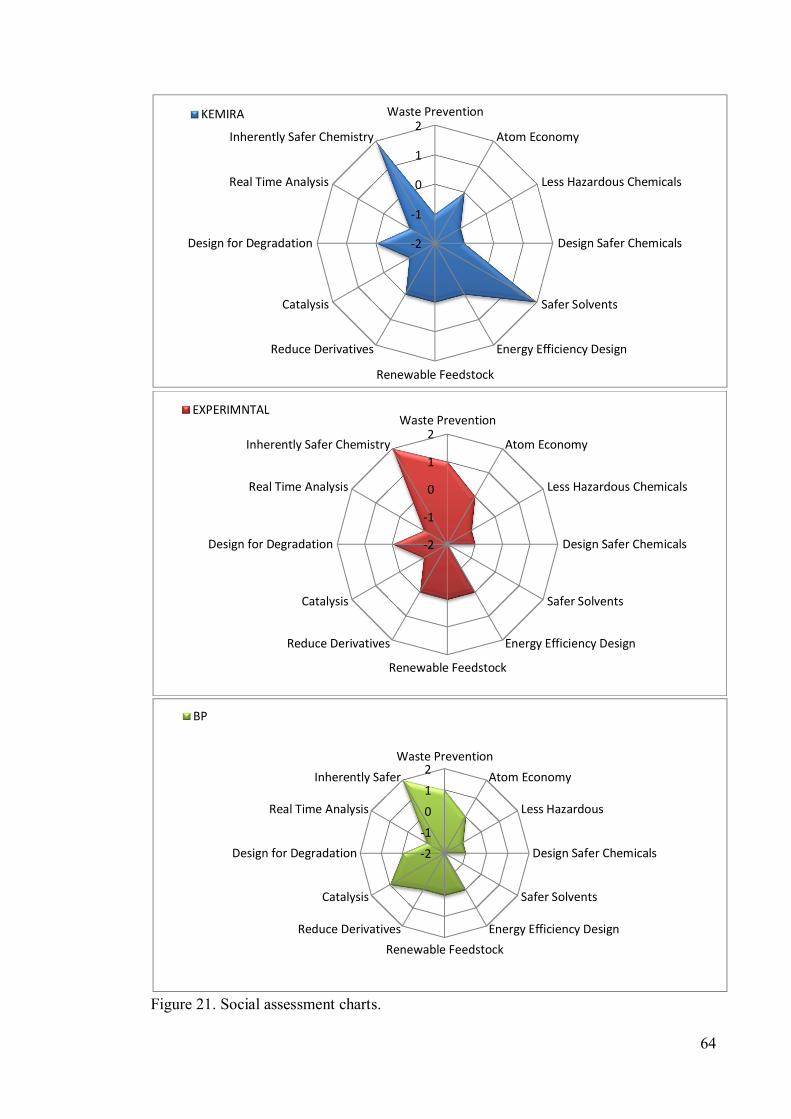
64
Figure 21. Social assessment charts.
-2
-1
0
1
2Waste Prevention
Atom Economy
Less Hazardous Chemicals
Design Safer Chemicals
Safer Solvents
Energy Efficiency Design
Renewable Feedstock
Reduce Derivatives
Catalysis
Design for Degradation
Real Time Analysis
Inherently Safer Chemistry
KEMIRA
-2
-1
0
1
2Waste Prevention
Atom Economy
Less Hazardous Chemicals
Design Safer Chemicals
Safer Solvents
Energy Efficiency Design
Renewable Feedstock
Reduce Derivatives
Catalysis
Design for Degradation
Real Time Analysis
Inherently Safer Chemistry
EXPERIMNTAL
-2-1012
Waste PreventionAtom Economy
Less Hazardous…
Design Safer Chemicals
Safer Solvents
Energy Efficiency DesignRenewable Feedstock
Reduce Derivatives
Catalysis
Design for Degradation
Real Time Analysis
Inherently Safer…
BP

65
Figure 22. Economic assessment charts.
-3-2-1012
Waste Prevention
Atom Economy
Less Hazardous Chemicals
Design Safer Chemicals
Safer Solvents
Energy Efficiency Design
Renewable Feedstock
Reduce Derivatives
Catalysis
Design for Degradation
Real Time Analysis
Inherently Safer Chemistry
KEMIRA
-3-2-1012
Waste Prevention
Atom Economy
Less Hazardous Chemicals
Design Safer Chemicals
Safer Solvents
Energy Efficiency Design
Renewable Feedstock
Reduce Derivatives
Catalysis
Design for Degradation
Real Time Analysis
Inherently Safer Chemistry
EXPERIMENTAL
-3-2-1012
Waste Prevention
Atom Economy
Less Hazardous Chemicals
Design Safer Chemicals
Safer Solvents
Energy Efficiency Design
Renewable Feedstock
Reduce Derivatives
Catalysis
Design for Degradation
Real Time Analysis
Inherently Safer Chemistry
BP

66
The spider charts were used in this study for the purpose of comparison. The strengths
and weaknesses of the twelve Green Chemistry principles on each formic acid
production route with reference to each aspect of sustainability were compared. The
spider charts were grouped under environmental, social and economic parts and each of
these parts consisted of the three formic acid production routes (conventional,
experimental and BP).
In the environmental assessments charts, a scale of -4 to 4 was used. Comparing the
environmental assessment charts; in the waste prevention principle of the chart, the
experimental route and the BP route were the strongest and they were on exactly the
same level while there was a sharp decline in the conventional route which was the
weakest of the three routes, the reason for this is because the conventional route
generated much more waste and emissions than the others. Looking at the atom
economy principle of the chart, the three routes the conventional, experimental and BP
routes were on the same level and the reason being that there were no atom economy
questions covered under the environmental section of the sustainability assessment
questionnaire. In the less hazardous chemicals principle, the three routes were on the
same level and all of them were weak with regards to this principle, the reason being
that all three routes had some amount of harmful substances contained in them. In the
design of the safer chemicals principle, the three routes were on the same level and all
of them weak with regards to this principle and the reason was because their resulting
product (formic acid) is toxic when used in large concentrations. In the safer solvents
principle, the three routes were on the same level and all of them were on the borderline
between strong and weak with regards to this principle, the reason for this was because
the negative and positive scores obtained in the questionnaire neutralized themselves
out. In the energy efficiency design principle, the three routes were all on the same level
and slightly strong. In the renewable feedstock design principle, the conventional route
was neutral because it is on the borderline between strong and weak routes while the BP
and experimental routes were strong and on the same level with regards to this
principle, the reason being that the feed sources in the BP and experimental routes were
obtained from renewable sources while that of the conventional route was obtained from
non renewable sources. In the reduce derivative principle, the conventional route and
BP routes were both on the same level and neutral because it is on the borderline
between strong and weak, on the other hand the experimental route had a slight
variation from them and was strong, the reason being that the conventional and BP

67
routes both on commercial scale had multiple synthetic routes, while the experimental
route was laboratory scaled and had no multiple synthetic routes. In the catalysis
principle, all three routes were strong but the conventional route was slightly stronger
than the experimental and BP routes which was both on the same level in terms of
strength, the reason for this is that the experimental and BP route made use of noble
metal catalysts. In the design for degradation principle, the conventional and
experimental routes were the strongest and on the same level whereas the BP route was
neutral, the reason for this is that one of the substances used in the BP route is harmful
to ground water. In the real time analysis principle the chart shows that all three routes
were weak and on the same level, the reason being that all three routes were sensitive to
changes in process conditions. In the inherently safer chemistry principle, the
conventional and BP routes were weak and on the same level while the experimental
route had a slight variation from the conventional and BP routes and was strong, the
reason for this is that accident can occur during the production process and harmful
substances can escape.
In the social assessments charts, a scale of -2 to 2 was used. Comparing the social
assessment charts. In the waste prevention principle of the chart, the experimental and
BP routes were the strongest and were on exactly the same level while there was a slight
decrease in the conventional route hence the weakest of the three routes, the reason for
this is because the conventional route’s process generated waste and emissions that are
harmful to the human health while the others do not. Looking at the atom economy
principle of the chart, the three routes were on the same level and the reason being that
there was no atom economy questions covered under the social section of the
sustainability assessment questionnaire. In the less hazardous chemicals principle, the
three routes were on the same level and all of them weak with regards to this principle,
the reason being that all three routes had some amount of harmful substances contained
or generated by them that were dangerous to the health and safety of people. In the
design of the safer chemicals principle, the three routes were on the same level and all
of them weak with regards to this principle and the reason was because their resulting
product was toxic in large concentrations and is dangerous to the health and safety of
people. In the safer solvents principle, the conventional route was the strongest whereas
the experimental and BP routes were on the same level and the weakest, the reason for
this was that the conventional route made use of no harmful solvent or auxiliary
chemicals while the experimental and BP routes made use of these. In the energy

68
efficiency design principle, renewable feedstock design principle and reduce derivative
principle, all three routes were all on the same level because they contained no
questions under the social section of the sustainability assessment questionnaire. In the
catalysis principle, the conventional route was strong while the experimental and BP
routes were weak, the reason for this was because the catalyst used in the BP and
experimental routes are toxic to humans.
In the design for the degradation principle, the three routes were on the same level
because no question was asked relating to the social aspect of sustainability. In the real
time analysis principle the chart showed that all three routes were weak and on the same
level, the reason being that an increased pressure in the reactor could lead to explosion
which could be detrimental to the health and safety of people. In the inherently safer
chemistry principle, the three routes were all strong and on the same level, the main
reason being that safety procedures applied in these routes lead to improved quality of
working conditions.
In the economic assessments charts, a scale of -3 to 2 was used. In the waste prevention
principle of the chart, the conventional route was the weakest and there was a very
slight increase in the experimental and BP routes both on the same level and on the
borderline between the strongest and the weakest. The reason for this is because in the
conventional route, the catalyst waste would have to be treated and this would incur
costs. Looking at the atom economy principle of the chart, the three routes were all
strong but the BP route was slightly stronger than the conventional and experimental
routes which were on the same level and equal in strength, the reason for this was
because of the differences in their yield, selectivity and atom economy. In the less
hazardous chemicals principle, the conventional, experimental and BP routes were all
on the same level because no question was asked relating to the social aspect of
sustainability. In the design of safer chemicals principle, all three routes were on the
same level and all of them strong with regards to this principle and the reason was
because there was no significant cost related to the harmful nature of the chemicals in
formic acid. In the safer solvents principle, the conventional route was weak, while
there was a slight increase in the experimental and BP route were on the same level
strong with regards to this principle, the reason for this was because the cost of
chemicals used in the conventional route was much higher in comparison to the
experimental and BP routes. In the energy efficiency design principle, the conventional
route was the strongest while the experimental and BP routes were the weakest, both the

69
experimental and BP routes were on the same level on the assessment chart, the reason
being that the amount of energy consumed in these routes lead to an increased cost. In
the renewable feedstock design principle, all three routes were strong and on the same
level with regards to this principle, the reason for this is because all three routes made
use of renewables which lead to a reduction in cost.

70
9. DISCUSSION
From the results of the sustainability assessment questionnaire, charts were plotted in
the form of bar charts and spider charts to visually represent in a clear way the results of
the questionnaire and for easy interpretation of data. For the sake of simplicity and
comprehension Case A will be referred to as the conventional route, Case B will be
referred to as the experimental route and Case C as the BP route.
From the composite score chart, the environmental section of the chart, the conventional
route is not beneficial to the environment and the reason for this is mainly because of
the waste and emissions generated by the process and the harmful nature of the feed
used. Environmental aspect of sustainability entails safeguarding the environment from
harmful practices and the prevention of waste. The conventional route does not
sufficiently satisfy this; hence it is environmentally less sustainable than the other
routes. In the hydrogenation of CO2 routes (BP and experimental) the charts reveals that
both contributes to the environment positively mainly because they make use of CO2
which reduces atmospheric loadings of the gas, also a significant less amount of waste
and emissions is generated. This makes the hydrogenation of CO2 route an
environmentally sustainable way of producing formic acid. The major difference
between the two CO2 utilization routes is that the BP route is done in a commercial
scale while the experimental route is done in a laboratory scale, also the solvents,
auxiliary chemicals and catalysts used are different, the yield also was different and
these had effects on the result chart. The social aspect of sustainability entails access to
occupational health and safety and also a good quality of life for the population.
From the composite score charts, the resulting social section indicated that both the
conventional route and the CO2 utilization route of formic acid production are socially
unsustainable and a major reason for this are the harmful nature of solvents, auxiliary
chemicals and the process conditions used in them. Economical aspect of sustainability
entails maintaining or increasing production trends while maximizing profits. The
economic section of the composite score chart shows that the conventional route has a
slight benefit on the economy whereas the effect of the experimental and BP routes on
the economy was more positive than that of the conventional route, the BP route being
better than the experimental route. The reasons for this are; cost of raw materials/feed,
cost of treatment and disposal of waste, energy requirement and atom economy. Judging
by the chart, it can be said that the CO2 utilization route is more economically viable
71
than the conventional route. Based on this analysis, hydrogenation of CO2 is a more
sustainable way to produce formic acid than the conventional process. The overall best
route in terms of the three sustainability aspects is the experimental route followed by
the BP route and the worst route is the conventional route.
Analyzing the spider charts; the overall best route under the environmental assessment
charts is the experimental route followed by the BP route and the conventional route.
This means that the experimental route’s substances and the production process would
provide the most protection to the environment closely followed by the BP route’s
substances and the production process which will also protect the environment but not
as strongly as the experimental route. The conventional route’s substances and
production process has a more negative effect on the environment than the BP and
experimental routes. The overall best route under the social assessment charts is the
conventional and BP routes which were exactly equal and least by the experimental
route which was the worst. This means that in the conventional and BP routes the
chemicals and production process will provide the most protection to the health and
safety of the people while it is the opposite for the experimental route. The substances
and the production process used in the experimental route pose the greatest threat and
risks to the health and safety of humans. The overall best route under the economic
assessment charts is the BP route followed by the experimental route and least by the
conventional route which was the worst. This means that the BP route’s substances and
the production process would give the most economic gain closely followed by the
experimental route’s substances and the production process which will also give
economic gain but slightly lower than that of the BP route. The conventional route’s
substances and production process have slight economic benefits.
It should be taken into account that this sustainability assessment questionnaire is a raw
assessment questionnaire and still in its development stage so to an extent the graphical
illustrations (charts) and composite score results do not form any definite pattern. A
major problem in these assessment charts stems from the fact that there were not
enough questions asked in the questionnaire and these have affected the results. A wider
variety of questions that adequately represent the sustainability requirement of the
industry would have affected the result in a different way. Another problem encountered
was that there was an unequal distribution of questions asked under the three aspects of
sustainability, environmental aspects which had a total number of 32 questions had the
most questions asked followed by the social aspect and the economic aspect which both

72
had a total number 9 questions, and this too affected the results. Another problem was
that in some principles some sustainability aspects were not covered, these principles
include; atom economy, design the synthesis to be less hazardous, energy efficiency,
utilization of renewable feedstock, reduction of derivatives, catalysis, design for
degradation, real time analysis and inherently safer chemistry principles. The
questionnaire also had some conflicting issues regarding how to score the qualitative
questions in them, for instance in the second question asked under this principle 2
regarding high selectivity and moderate selectivity both are relative terms and hence
difficult to quantify using the numbers (-1 and 1). This has particularly affected the
social section of the composite score chart. In the design less hazardous principle it is
very difficult in this case to quantify the exact level of hazards of the chemicals and the
process because some chemicals are more hazardous than others. Also in the atom
economy principle section of the questionnaire, all the questions covered under this
principle had quantitative data which were difficult to quantify using the numbers (-1
and 1) hence the scoring system used here is not feasible. Another problem of the
sustainability assessment questionnaire is that the Green Chemistry tool was designed to
focus mainly on the toxicity and the hazardous nature of chemicals and processes.
Because of this most of the questions were centered on toxicity and its effects on
humans and the environment. Another important problem that affected the results was
that there was no information as regards to the actual atom economy of the processes;
the atom economy was calculated based only on the reaction equation. Also the yield of
the conventional process was not known and that of the BP route and the experimental
routes was based on assumptions. This also has affected the results of the questionnaire
and also the charts. In Table 17 all the various benefits and drawbacks of the three
formic acid routes are highlighted and organized based on the three sustainability
aspects i.e. economic, social and environmental.
Table 17. Benefit and drawbacks of the conventional, experimental and BP routes.
FORMIC ACID ROUTES
BENEFITS DRAWBACKS
CONVENTIONAL ROUTE
ENVIRONMENTAL Makes use of a catalyst
Utilizes renewable materials
Generates wastes and emissions
Harmful nature of feed used
Uses non renewable materials

73
Generates wastewater
SOCIAL Does not use any harmful solvent or auxiliary chemical
Emissions produced are harmful to humans
ECONOMIC Reaction is exothermic
Process has high yield
Has high selectivity
Treatment and disposal of waste incurs cost
Low atom economy High cost of
chemicals used EXPERIMENTAL ROUTE
ENVIRONMENTAL Utilizes CO2 thereby reducing the atmospheric loadings of the gas
Utilizes renewable materials
No waste or emission is produced
Utilizes a catalyst
It utilizes a great amount of energy
SOCIAL More acceptable since CO2 is used
Solvent used is harmful to humans
ECONOMIC Has high selectivity High atom
economy Low cost of
chemicals used
Process has low yield
Energy used is endothermic which incurs cost
BP ROUTE ENVIRONMENTAL Utilizes CO2
thereby reducing the atmospheric loadings of the gas
Utilizes renewable materials
No waste or emission is produced
Utilizes catalyst
It utilizes a great amount of energy
SOCIAL More acceptable since CO2 is used
Harmful nature of solvents and auxiliary chemicals used
ECONOMIC Process has high yield
High atom
Energy used is endothermic which incurs cost

74
economy Low cost of
chemicals used
Has low selectivity
75
10. CONCLUSION
The aim of the theoretical part of this work was to critically evaluate six currently used
assessment tools related to sustainability; to review sustainability in industries in
general and in particular the chemical industry; and to evaluate and compare three
routes of formic acid production via a conventional route (methyl formate hydrolysis)
and two CO2 utilization routes (hydrogenation of CO2). For this, the six very important
assessment tools related to sustainability that are applicable to the chemical industry
were examined and their various strengths and weaknesses were highlighted. The
Natural Step is abstract in its nature and focuses on the theoretical approach hence it
cannot be practically applied in industries though its guidelines and principles can be
adhered to. AIChE and IChemE are not product focused methods; hence they cannot be
used to access chemicals. Pollution prevention like the Natural Step focuses on the
theoretical hence has a conceptual nature. The LCA is bulky, data intensive and on its
own not ideal for use as a design tool. Out of all these tools, the Green Chemistry tool is
the only one that can be used as a qualitative design tool based on its twelve principles.
An existing sustainability assessment questionnaire was further developed and centered
on the environmental, social and economic aspects of sustainable development.
However the Green Chemistry tool has its own share of shortcomings one major one is
that its principles, all twelve of them focuses too much on the harmful nature of
substances which favors greatly the environmental and social aspects far more than the
economic aspects of sustainability and therefore there is a tilt in the balance of
sustainability when it is used as an assessment tool in industrial settings.
Carbon Capture and Storage (CCS) is a key method used to reduce the atmospheric
loadings of CO2 and to utilize the gas. A lot of research focus is tilted to the direction of
its use in chemical processes. In this work, a conventional method and a CO2 utilization
method of formic acid production were considered. The conventional process involving
methyl formate hydrolysis was considered because it is one of the most common
methods of producing formic acid but considered unsustainable because of the waste
generated by the process and the harmful nature of the feed used. Its benefit includes
very high purity of formic acid produced. Hydrogenation of CO2 was the CO2 utilization
method considered here both in laboratory and commercial scales. This method is still
in its infancy stage and further research still needs to be done on it for it to go into full
scale production.

76
The aim of the experimental part of this work was to perform sustainability assessment
on three routes of formic acid production which included the conventional route and
two CO2 utilization routes (hydrogenation of CO2) one laboratory and one commercial
scaled process; to further develop the sustainability assessment questionnaire based on
Green Chemistry design tool already in existence and to use the results obtained in the
questionnaire to compare the three routes of formic acid considered in this thesis. The
features used for the sustainability assessment were selected based on their importance
and their adaptability to the Green Chemistry principles. Facts and assumptions were
gathered for the data used in the sustainability assessment from literature, and Aspen
Plus was used to obtain the material and energy balances of the formic acid production
routes. The questionnaire contained questions covering all the twelve principles of
Green Chemistry and was applicable to the chemical processes and products considered
here. All these were based on Green Chemistry principles and from this sustainability
assessment answers were found to the sustainability assessment questionnaire.
Enhancing this tool would require some modifications, perhaps some questions should
be weighted more than others because they should be the main determinant of how the
results of the questionnaire should be. Such questions should be centered on important
assessment parameters like atom economy, energy demand, yield, process conditions,
raw materials and catalyst used. Exact information regarding these important
assessment parameters is essential in order to obtain a more accurate result. Questions
that contain quantitative and qualitative data should be scaled and the resulting
sustainability points should be allocated based on that scale. There should also be a
balance to the number of questions asks and it should cover the three aspects of
sustainability on every principle. Enhancing this tool would also mean that data for
important assessment parameters should be known. To completely address the
shortcomings of the Green Chemistry tool, it is recommended that a hybrid tool could
be developed adapted to address the sustainability needs of industries. The hybrid tool
would combine the strong points of Green Chemistry, pollution prevention, IChemE,
LCA, AIChE and the Natural Step principles. Merging Green Chemistry with LCA
would facilitate environmental improvements at every stage of a product’s life cycle
from the extraction, manufacturing, packaging, transportation and distribution,
consumer use, to the end of life stage. The Natural Step principle, IChemE and AIChE
when combined to the already merged LCA and Green Chemistry would facilitate the
economic growth and profitability of an industry. With this hybrid tool a wider range of

77
sustainability assessment questions would be generated that would create a balance in
the three sustainability aspects.
Based on the results of the sustainability assessment questionnaire and the resulting
assessment charts, it is recommended that the CO2 utilization route should be the main
method of formic acid production because it is more sustainable than the conventional
route. More research needs to be done to improve the yield and energy demand in order
for it to go into full scale production worldwide. The conventional process could be
better if the feed CO could be obtained from a company that generates CO as waste; say
for example metallurgical industry. Currently the conventional process generates CO by
the partial oxidation of heavy oil which is unsustainable because heavy oil is non
renewable. It is recommended that a more environmentally sustainable means for
metallurgical industry to deal with their waste CO gas is to sell it to the conventional
process that will in turn use it for their formic acid production which uses CO and
methanol as its primary feed. For industry to improve the negative part of the charts the
following should be done: from the environmental angle; to improve its weaknesses, it
is important that the design of production processes is done to prevent pollution/waste
and to utilize any waste generated to replace the use of harmful chemicals, solvents and
auxiliaries to human and environmentally friendly ones. From the social angle, it is
important that substances and production processes that could endanger life and pose
risks to the health and safety of humans should be avoided entirely or minimized. From
the economic angle; cost of production, cost of chemicals and energy consumption
should be reduced in order to increase the profit.

78
11. REFERENCES
Airgas (2010). Material Safety Data Sheet: Carbon Monoxide. Available:
http://www.airgas.com/documents/pdf/001014.pdf. Last accessed 31st Oct 2012.
Airgas (2010). Material Safety Data Sheet: Ethanol. Available:
http://www.airgas.com/documents/pdf/001114.pdf. Last accessed 1st Nov 2012.
Airgas. (2010). Material Safety Data Sheet: Flammable Liquid Mixture: Diethylene
Glycol / Tetraethylene Glycol / Triethylene Glycol / Water. Available:
http://www.airgas.com/documents/pdf/009709.pdf. Last accessed 10th Feb 2013.
Airgas. (2010). Material Safety Data Sheet: Hydrogen. Available:
http://www.airgas.com/documents/pdf/001026.pdf. Last accessed 31st Oct 2012.
Airgas. (2010). Material Safety Data Sheet: Methanol. Available:
http://www.airgas.com/documents/pdf/001065.pdf. Last accessed 10th Feb 2013.
Air Products. (2012). Hydrogen Energy. Available:
http://www.airproducts.com/industries/energy/hydrogen-energy.aspx. Last accessed
30th Oct 2012.
Alfa Aesar. (2012). 1-(n-Butyl)imidazole. Available:
http://www.alfa.com/en/gp100w.pgm?dsstk=L07793. Last accessed 13th Nov 2012.
Alfa Aesar. (2012). Sodium methoxide. Available:
http://www.alfa.com/en/GP100w.pgm?DSSTK=L05673. Last accessed 6th Dec 2012.
Anastas, P. & Warner, J (2000). Green chemistry: Theory and practice. New York:
Oxford University Press.
Andanson, J. Marx, S. & Baikr, A. (2012). Selective hydrogenation of cyclohexeone on
iron-ruthenium nano particles suspended in ionic liquids and CO2-expanded ionic
liquids. Catalysis Science & Technology, 2, 1403-1409.
Aspentech. (2013). Optimize Chemical Processes with Aspen Plus. Available:
http://www.aspentech.com/products/aspen-plus.aspx. Last accessed 2nd March 2013.
Azapagic, A. & Perdan S. (2011). Sustainable development in practice: Case studies for
engineers and scientists. 2nd ed. UK: WILEY-BLACKWELL.

79
BASF: The Chemical Company. (2012). Formic Acid. Available:
http://www.basf.com/group/corporate/en/brand/FORMIC_ACID. Last accessed 6th Nov
2012.
Bell, S. & Morse, S (2008). Sustainability indicators: Measuring the immeasurable. 2nd
ed. London: Earthscan.
Bond, A. & Morrison-Saunders, A. (2011). Re-evaluating sustainability assessment:
Aligning the vision and the practice. Environmental Impact Assessment Review, 31 (1),
1-7.
Bourne, R. & Poliakoff, M. (2011). Green chemistry: what is the way forward?
Mendeleev Communications. 21, p235–238.
Bureau of Energy Efficiency. (?). Material and energy balance. Available:
http://www.scribd.com/doc/20888457/1-4-Material-and-Energy-Balance. Last accessed
15th April 2013.
Buytaert, V., Muys, B., Devriendt N., Pelkmans, L., Kretzschmarc, J., & Samson, R.
(2011). Towards integrated sustainability assessment for energetic use of biomass: A
state of the art evaluation of assessment tools. Renewable and Sustainable Energy
Reviews, 15 (8), 3918–3933
Capello, C. Fischer, U. & Hungerbühler, K. (2007). What is a green solvent? A
comprehensive framework for the environmental assessment of solvents. Green
Chemistry, 9, 927-934
Chemical Book. (2008). Butylimidazole (4316-42-1). Available:
http://www.chemicalbook.com/ProductChemicalPropertiesCB6330927_EN.htm. Last
accessed 1st Nov 2011.
Cobb, C. Schuster, D. Beloff, B. Tanzil, D. (2009). The AIChE Sustainability Index:
The Factors in Detail. American Institute of Chemical Engineers (AIChE), 60-63.
Coffman, M & Umemoto, K. (2010). The triple-bottom-line: framing of trade-offs in
sustainability planning practice. Environment, Development and Sustainability, 12 (5),
597-610.

80
ECHA- European Chemicals Agency. (2013). Candidate List substances in
articles. Available: http://echa.europa.eu/web/guest/regulations/reach/candidate-list-
substances-in-articles. Last accessed 20th Feb 2013
ECHA- European Chemical Agency. (2013). Registered Substances. Available:
http://echa.europa.eu/web/guest/information-on-chemicals/registered-substances. Last
accessed 30th March 2013.
ECHA- European Chemicals Agency. (2013). Understanding REACH. Available:
http://echa.europa.eu/web/guest/regulations/reach/understanding-reach. Last accessed
20th Feb 2013
Elkington, J. (1998). Cannibals With Forks: The Triple Bottom Line of 21st Century
Business. British Columbia Canada: New Society Publishers. 3-409.
Elliott, J.A. (2009). Sustainability. International Encyclopedia of Human Geography.
University of Brighton, Brighton, UK, 117–131.
European Commission. (2013). REACH. Available:
http://ec.europa.eu/environment/chemicals/reach/reach_intro.htm. Last accessed 20th
Feb 2013
Fisher Scientific. (2012). Material Safety Data Sheet. Available:
http://www.fishersci.com/ecomm/servlet/msdsproxy?productName=BP616500&produc
tDescription=TRIETHYLAMINE+500ML&catNo=BP616-
500&vendorId=VN00033897&storeId=10652. Last accessed 1st Nov 2012
Fresner J. and Sage, J. (2010). Implementation of Sustainable Strategies in Small and
Medium- Sized Enterprises Based on the Concept of Cleaner Production. In: Harmsen J.
and Powell J. Sustainable Development in the Process Industries: Cases and Impact.
John Wiley & Sons, Inc. 219-229.
Garcia, V. (2009). Reclamation of VOCS, N-Butanol and Dichloromethane, from
Sodium Chloride containing Mixtures by Per Vaporation: Towards Efficient Use of
Resources in the Chemical Industry. ACTA Universitatis Ouluensi. C 341.
Gavrilescu, M. (2011). Sustainability. Engineering Fundamentals of Biotechnology. 2 ,
905–923.

81
Ghernaout, D. Ghernaout, B. & Naceur, M. (2011). Embodying the chemical water
treatment in the green chemistry—A review. Desalination, 271 , 1-10.
Hall, G. & Howe, J. (2010). Sustainability of the chemical manufacturing industry-
Towards a new paradigm. Education for Chemical Engineers, 5, 100-107.
Hanrahan, G. (2012). Chapter 10 – Green Chemistry and Sustainable Chemical
Processes. In: Key Concepts in Environmental Chemistry. USA: Elsevier. 297–319.
Hao, C. Wang, S. Li, M. Kang, L. & Ma, X. (2011). Hydrogenation of CO2 to formic
acid on supported ruthenium catalysts. Catalysts Today. 160, 184-190.
Harmsen, J. & Powell, J. (2010). Sustainable Development in the Process Industries:
CASES AND IMPACT. New Jersey: John Wiley & Sons, Inc. 6-19.
Hoof, B. & Lyon, T. (2013). Cleaner production in small firms taking part in Mexico's
Sustainable Supplier Program. Journal of Cleaner Production, 41 (1), 270–282.
Hoque, A. & Clarke, A. (2013). Greening of industries in Bangladesh: pollution
prevention practices. Journal of Cleaner Production, 51, 47-56.
Hua, T.Q & Ahluwalia R.K. (2012). Off-board regeneration of ammonia borane for use
as a hydrogen carrier for automotive fuel cells. International Journal of Hydrogen
Energy, 37 (19), 14382–14392.
IChemE. (2010). Sustainable Development Progress Metrics: Recommended for use in
the Process Industries. Institution of Chemical Engineers, 4-28.
ISO 14044:2006 (2006) .Environmental Management – Life Cycle Assessment –
Requirements and Guidelines. International Organization for Standardization. Geneva,
Switzerland.
Jan Harmsen & Joseph B. Powell (2010). Sustainable Development in the process
Industries: Cases and Impact. USA: John Wily & Sons, Inc.
Johnson, E (2012). Sustainability in the Chemical Industry. New York: Springer. 25-60.
Kathuria, V., 2009. Public disclosures: using information to reduce pollution in
developing countries. Environment, development and sustainability, 11 (5), 955-970

82
Kirk-Othmer (1993). Encyclopedia of Chemical Technology, vol. 11. John Wiley &
Sons, New York 951–959
Koornneef, J. van Breevoort, P. Hamelinck, C. Hendriks, C. Hoogwijk, M. Koop, K.
Koper, M. Dixon, T. & Camps, A. (2012). Global potential for biomass and carbon
dioxide capture, transport and storage up to 2050. International Journal of Greenhouse
Gas Control, 11 (1), 117–132.
Lankey, R. & Anastas, P. (2002). Life-cycle approaches for assessing Green Chemistry
technologies. Industrial & Engineering Chemistry Research, 41 (1), 4498-4502.
Lee, S. Geum, Y. Lee, H & Park, Y. (2012). Dynamic and multidimensional
measurement of product-service system (PSS) sustainability: a triple bottom line (TBL)-
based system dynamics approach. Journal of Cleaner Production, 32, 173-182.
Manley, J. Anastas, P & Cue Jr, B. (2008). Frontiers in Green Chemistry: meeting the
grand challenges for sustainability in R&D and manufacturing. Journal of Cleaner
Production, 16 (6), 743–750.
Methanex Corporation. (2011). Our Company. Available:
http://www.methanex.com/ourcompany/index.html. Last accessed 31st Oct 2012.
Molina-Azorin, J. Claver-Corties, E. Lopez-Gamero, M. & Tari, J. (2009). Green
management and nancial performance: a literature review. Management Decision. 47
(7), 1080-1100
Mungu a, N. Zavala, A. & Marin, A. (2010). Identifying pollution prevention
opportunities in the Mexican auto re nishing industry. Management of environmental
quality: An International Journal. 21 (3), 324-335
Munasinghe, M (2009). SUSTAINABLE DEVELOPMENT IN PRACTICE
Sustainomics Methodology and Applications. Cambridge: Cambridge University Press.
34-46.
Ngwakwe, C. (2011). Waste costing as a catalyst in pollution prevention investment
decisions. Industrial Ecology, 15 (6), 951-966
Official Journal of the European. (2008). COMMISSION REGULATION (EC) No
987/2008.Available:http://eurlex.europa.eu/LexUriServ/LexUriServ.do?uri=OJ:L:2008:
268:0014:0019:en:PDF. Last accessed 30th March 2013.

83
Orecchini, F. Valitutti, V. & Vitali, G. (2012). Industry and academia for a transition
towards sustainability: advancing sustainability science through university–business
collaborations. Sustainability Science, 7 (1), 57-73.
Phdungsilp, A. (2011). Futures studies’ backcasting method used for strategic
sustainable city planning. Futures, 43 (7), 707–714.
PPRC. (2012). What is Pollution Prevention (P2)?. Available:
http://pprc.org/index.php/what-is-p2/. Last accessed 22nd Dec 2012.
Raudaskoski, R. Turpeinen, E. Lenkkeri, R. Pongrácz, E. & Keiski, R.L. (2009).
Catalytic activation of CO2: Use of secondary CO2 for the production of synthesis gas
and for methanol synthesis over copper-based zirconia-containing catalysts. Catalysis
Today, 144 (1), 318-323.
Rogers, P. Jalal K. & Boyd, J. (2008). An Introduction to Sustainable Development.
London: Earthscan. 22-23.
Ruiz-Mercado,G. Gonzalez,M. & Smith, R. (2013). Sustainability Indicators for
Chemical Processes: III. Biodiesel Case Study . Industrial and Engineering Chemistry
Research, 2-30.
Saavalainen, P. (2012). Sustainability Assessment Questionnaire. Personal
Communication.
Seider, W. Seader, J. & Lewin, D (2003). Product & Process Design Principles:
Synthesis, Analysis & Evaluation. 2nd ed. Indian: John Wiley & Sons, Inc.. 76-83.
Seow, C. Hillary, R. & Wilson, S (2006). Managing Business Processes for Corporate
Sustainability . Bradford: Emerald Group Publishing Ltd . 122-126.
Sheate, W. (2010). Sustainability. London: World Scientific Publishing Co. Pte. Ltd.
19-103.
Sigma-Aldrich. (2012). 1-Butylimidazole. Available:
http://www.sigmaaldrich.com/catalog/product/aldrich/348414?lang=en®ion=US. Last
accessed 5th Dec 2012.

84
Sigma-Aldrich. (2012). Carbon dioxide. Available:
http://www.sigmaaldrich.com/catalog/product/aldrich/295108?lang=en®ion=US. Last
accessed 5th Dec 2012.
Sigma-Aldrich. (2012). Carbon monoxide. Available:
http://www.sigmaaldrich.com/catalog/product/aldrich/295116?lang=en®ion=US. Last
accessed 5th Dec 2012.
Sigma-Aldrich. (2012). Ethanol. Available:
http://www.sigmaaldrich.com/catalog/product/sial/e7023?lang=en®ion=US. Last
accessed 5th Dec 2012.
Sigma-Aldrich. (2012). Methanol. Available:
http://www.sigmaaldrich.com/catalog/product/sial/34860?lang=en®ion=US. Last
accessed 5th Dec 2012.
Sigma-Aldrich. (2012). (R)-C3-TunePhos-ruthenium complex. Available:
http://www.sigmaaldrich.com/MSDS/MSDS/DisplayMSDSPage.do?country=US&lang
uage=en&productNumber=659711&brand=ALDRICH&PageToGoToURL=http%3A%
2F%2Fwww.sigmaaldrich.com%2Fcatalog%2Fproduct%2Faldrich%2F65971. Last
accessed 6th Dec 2012.
Sigma-Aldrich. (2012). Ruthenium on alumina. Available:
http://www.sigmaaldrich.com/catalog/product/aldrich/439916?lang=en®ion=US. Last
accessed 6th Dec 2012.
Sigma-Aldrich. (2012). Sodium Methoxide Solution. Available:
http://www.sigmaaldrich.com/catalog/product/fluka/71748?lang=en®ion=US. Last
accessed 6th Dec 2012.
Sigma-Aldrich. (2012). Tetraethylene glycol. Available:
http://www.sigmaaldrich.com/catalog/product/aldrich/110175?lang=en®ion=US. Last
accessed 5th Dec 2012.
Sigma-Aldrich. (2012). Triethylamine . Available:
http://www.sigmaaldrich.com/catalog/product/sial/471283?lang=en®ion=US. Last
accessed 5th Dec 2012.

85
Soubbotina, T.P (2004). Beyond Economic Growth : An Introduction to Sustainable
Development. 2nd ed. Washington, DC, USA : World Bank Publications . 7-12.
Sørensen, B (2011). Life-Cycle Analysis of Energy Systems: From Methodology to
Applications. Cambridge: Royal Society of Chemistry, p9-37.
The Linde Group. (2012). R744 (Carbon dioxide). Available:
http://www.lindeus.com/en/products_and_supply/refrigerants/natural_refrigerants/r744_
carbondioxide.html. Last accessed 31th Oct 2012.
The NATURAL STEP. (2013). The Framework for Strategic Sustainable Development.
Available: http://www.naturalstep.org/en/our-approach. Last accessed 10th Feb 2013.
Ullmann, F. (2011). Formic Acid. In: Wiley-VCH ULLMANN'S Encyclopedia of
Industrial Chemistry. 7th ed. John Wiley and Sons. 14-27.
United Nations. (1987). Report of the World Commission on Environment and
Development: Our Common Future. Available: http://www.un-documents.net/our-
common-future.pdf. Last accessed 28th Sep 2012.
Vanclay, F. (2010). The Triple Bottom Line and Impact Assessment: How do TBL,
EIA, SIA, SEA and EMS Relate with Each Other. In: Sheate, W. Tools, Techniques &
Approaches for Sustainability: Collected Writings in Environmental Assessment Policy
and Management. World Scientific Publishing Co. Pte. Ltd. 101-102
Wang, W. Lü, J. Zhang, L. & Li, Z.. (2011). Real atom economy and its application for
evaluation the green degree of a process. Frontiers of Chemical Science and
Engineering, 5 (3), 349-354.
Zhang, Z. Hu, S. Song, J. Li, W. Yang, G. & Han, B. (2009). Hydrogenation of CO2 to
formic acid promoted by a diamine-functionalized ionic liquid. ChemSusChem, 2, 234-
238
Zhang, Z. Xie, Y. Li, W. Hu, S. Song, J. Jiang, T. & Han, B.. (2008). Hydrogenation of
carbon dioxide is promoted by a task-specific ionic liquid. Angewandte Chemie, 47,
1127-1129.
Zhao, G & Joo F. (2011). Free formic acid by hydrogenation of carbon dioxide in
sodium formate solutions. Catalysis Communications, 14 , 74-76.

86
Appendix 1. Toxicity and health information on all chemicals used for formic acid production via conventional route, experimental route and BP patented route
Table 1. Toxicity and Health Information (Airgas, 2010), (Sigma-Aldrich, 2012).
Chemical Toxicity Data Health Effect Methanol
IDLH: 6000ppm Chronic effects on humans: May cause damage to the following organs: gastrointestinal tract, upper respiratory tract, skin, eyes, central nervous system (CNS) Other toxic effects on humans: No specific information is available in the database regarding the other toxic effects of this material to humans Carcinogenic effects: No known significant effects or critical hazards Mutagenic effects: No known significant effects or critical hazards Reproduction Toxicity: No known significant effects or critical hazards
May cause eye irritation May cause skin irritation Inhalation and Ingestion: No known significant effects or critical hazards Potential chronic health effect: Carcinogenic effects: Not available. Mutagenic effects: Not available. Teratogenic effects: Not available Medical conditions aggravated by over- exposure: Pre-existing disorders involving any target organs mentioned in this MSDS as being at risk may be aggravated by over-exposure to this product
Carbon Monoxide
IDLH: 1200 ppm Chronic effects on humans: Teratogenic: Classified 1 by European Union. May cause damage to the following organs: blood, lungs, the nervous system, heart, cardiovascular system, central nervous system (CNS). Other toxic effects on humans: No specific information is available in the
Contact with rapidly expanding gas may cause burns or frostbite to the eyes and skin Inhalation and Ingestion: Toxic by inhalation. Ingestion is not a normal route of exposure to gases. Potential chronic health effect: May cause target organ damage, based on animal data. May cause damage to the following organs: blood, lungs, the nervous system, heart, cardiovascular system,

87
database regarding the other toxic effects of this material to humans Carcinogenic effects: No known significant effects or critical hazards Mutagenic effects: No known significant effects or critical hazards Reproduction Toxicity: No known significant effects or critical hazards
central nervous system (CNS). Pre-existing disorders involving any target organs mentioned in this MSDS as being at risk may be aggravated by over-exposure to this product.
Hydrogen Chronic effects on humans: May cause damage to the following organs: lungs. Other toxic effects on humans: No specific information is available in the database regarding the other toxic effects of this material to humans. Carcinogenic effects: No known significant effects or critical hazards Mutagenic effects: No known significant effects or critical hazards Reproduction Toxicity: No known significant effects or critical hazards
Contact with rapidly expanding gas may cause burns or frostbite. Contact with cryogenic liquid can cause frostbite and cryogenic burns to the eyes and skin. Inhalation and Ingestion: Acts as a simple asphyxiant Ingestion is not a normal route of exposure to gases. Potential chronic health effect: May cause target organ damage, based on animal data May cause damage to the following organs: lungs Pre-existing disorders involving any target organs mentioned in this MSDS as being at risk may be aggravated by over-exposure to this product.
Carbon dioxide
IDLH: 40000 ppm Chronic effects on humans: May cause damage to the following organs: lungs. Other toxic effects on humans: No specific information is available in the database regarding the other toxic effects of this material to humans. Carcinogenic effects: No known significant effects or critical hazards
Contact with rapidly expanding gas may cause burns or frostbite. Contact with cryogenic liquid can cause frostbite and cryogenic burns to the eyes and skin. Inhalation and Ingestion: Moderately irritating to the respiratory system. Ingestion is not a normal route of exposure to gases. Potential chronic health effect: May cause target organ damage, based on animal data. May cause damage to the following organs: lungs.

88
Mutagenic effects: No known significant effects or critical hazards Reproduction Toxicity: No known significant effects or critical hazards
Pre-existing disorders involving any target organs mentioned in this MSDS as being at risk may be aggravated by over-exposure to this product.
Triethylamine
Chronic effects on humans: Classified A4 (Not classifiable for humans or animals.) by ACGIH [acetonitrile]. Classified A4 (Not classifiable for humans or animals.) by ACGIH [diethylamine]. Classified A4 (Not classifiable for humans or animals.) by ACGIH [triethylamine]. Contains material which may cause damage to the following organs: lungs, upper respiratory tract, skin, eyes. Other toxic effects on humans: No specific information is available in the database regarding the other toxic effects of this material to humans. Carcinogenic effects: No known significant effects or critical hazards Mutagenic effects: No known significant effects or critical hazards Reproduction Toxicity: No known significant effects or critical hazards
Severely corrosive to the eyes. Causes severe burns. Toxic in contact with skin Contact with rapidly expanding gas may cause burns or frostbite to the eyes and skin. Inhalation and Ingestion: Toxic by inhalation. Severely corrosive to the respiratory system. Ingestion is not a normal route of exposure for gases. Potential chronic health effect: Carcinogenic effects : Classified A4 (Not classifiable for humans or animals.) by ACGIH [acetonitrile]. Classified A4 (Not classifiable for humans or animals.) by ACGIH [diethylamine]. Classified A4 (Not classifiable for humans or animals.) by ACGIH [triethylamine]. Mutagenic effects : Not available. Teratogenic effects : Not available. Medical conditions aggravated by over- exposure: Pre-existing disorders involving any target organs mentioned in this MSDS as being at risk may be aggravated by over-exposure to this product.
Tetraethylene Glycol
Chronic effects on humans: Contains material which may cause damage to the following organs: kidneys, liver, skin, eye, lens or cornea. Other toxic effects on humans: No specific information is available in the
May cause irritation to the eyes and skin. Inhalation and Ingestion: No known significant effects or critical hazards. Potential chronic health effect: Carcinogenic effects : Not available. Mutagenic effects: Not available.

89
database regarding the other toxic effects of this material to humans. Carcinogenic effects: No known significant effects or critical hazards Mutagenic effects: No known significant effects or critical hazards Reproduction Toxicity: No known significant effects or critical hazards
Teratogenic effects : Not available. Medical conditions aggravated by over-exposure: Pre-existing disorders involving any target organs mentioned in this MSDS as being at risk may be aggravated by over-exposure to this product.
Ethanol IDLH: 3300 ppm Chronic effects on humans: CARCINOGENIC EFFECTS : Classified 1 (Proven for humans.) by IARC. Classified A3 (Proven for animals.) by ACGIH. May cause damage to the following organs: blood, the reproductive system, liver, upper respiratory tract, skin, eyes, central nervous system (CNS). Other toxic effects on humans: No specific information is available in the database regarding the other toxic effects of this material to humans. Carcinogenic effects: Can cause cancer. Risk of cancer depends on duration and level of exposure. Mutagenic effects: No known significant effects or critical hazards Reproduction Toxicity: No known significant effects or critical hazards
Irritating to the eyes and skin. Inhalation and Ingestion: Irritating to respiratory system. No known significant effects or critical hazards if ingested. Potential chronic health effect: Carcinogenic effects : Classified 1 (Proven for humans.) by IARC. Classified A3 (Proven for animals.) by ACGIH. Mutagenic effects : Not available. Teratogenic effects : Not available Medical conditions aggravated by over-exposure: Pre-existing disorders involving any target organs mentioned in this MSDS as being at risk may be aggravated by over-exposure to this product.
1-n-butylimidazole
Carcinogenicity IARC: No components of this product
May be harmful if absorbed through skin. Causes skin and eye irritation.

90
present at levels greater than or equal to 0.1% is identified as probable, possible or confirmed human carcinogen by IARC. ACGIH: No components of this product present at levels greater than or equal to 0.1% is identified as a carcinogen or potential carcinogen by ACGIH. Specific target organ toxicity -single exposure(Globally Harmonized System) Inhalation: May cause respiratory irritation
Inhalation and Ingestion: May be harmful if inhaled. Causes respiratory tract irritation. May be harmful if swallowed.
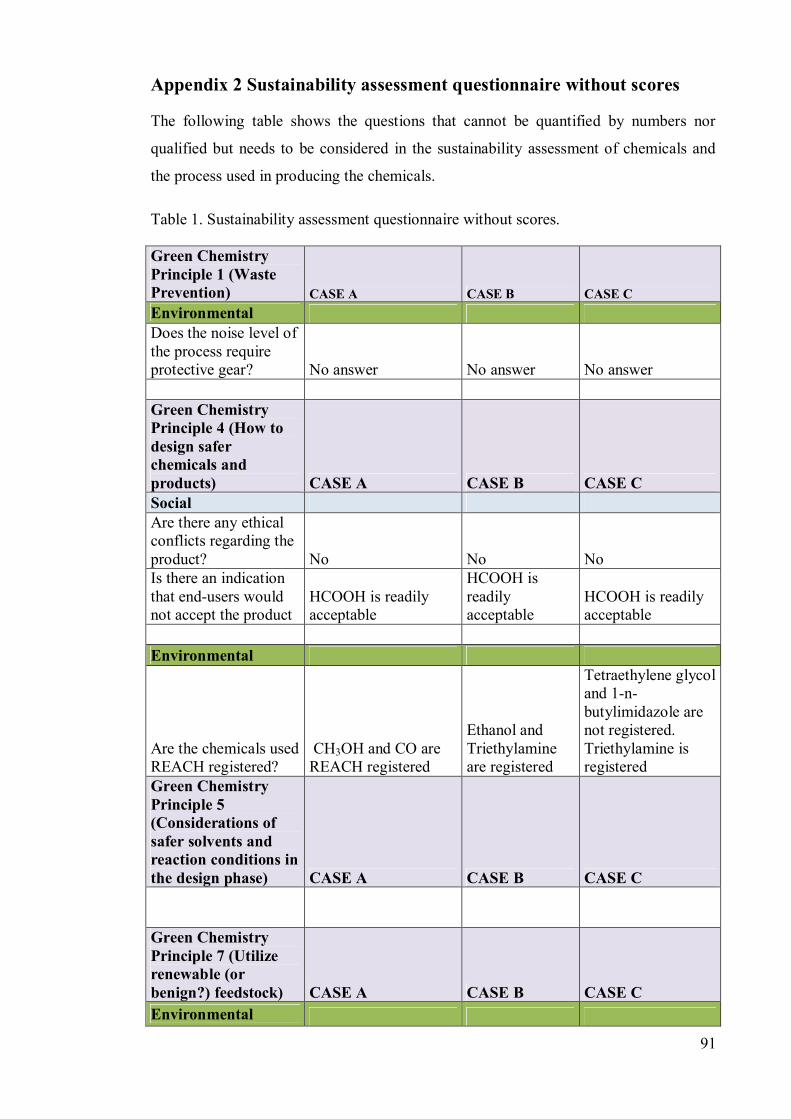
91
Appendix 2 Sustainability assessment questionnaire without scores
The following table shows the questions that cannot be quantified by numbers nor
qualified but needs to be considered in the sustainability assessment of chemicals and
the process used in producing the chemicals.
Table 1. Sustainability assessment questionnaire without scores.
Green Chemistry Principle 1 (Waste Prevention) CASE A CASE B CASE C Environmental Does the noise level of the process require protective gear? No answer No answer No answer Green Chemistry Principle 4 (How to design safer chemicals and products) CASE A CASE B CASE C Social Are there any ethical conflicts regarding the product? No No No Is there an indication that end-users would not accept the product
HCOOH is readily acceptable
HCOOH is readily acceptable
HCOOH is readily acceptable
Environmental
Are the chemicals used REACH registered?
CH3OH and CO are REACH registered
Ethanol and Triethylamine are registered
Tetraethylene glycol and 1-n-butylimidazole are not registered. Triethylamine is registered
Green Chemistry Principle 5 (Considerations of safer solvents and reaction conditions in the design phase) CASE A CASE B CASE C
Green Chemistry Principle 7 (Utilize renewable (or benign?) feedstock) CASE A CASE B CASE C Environmental

92
Has the feedstock been acquired from high-carbon stock land (cf. RED Directive)
Information not available
Information not available
Information not available
If water is used in the process, is its amount high?
A large amount of water is needed to obtain an economically worthwhile methyl formate conversion No No
Green Chemistry Principle 8 (To design a chemical process to avoid unnecessary derivatization) CASE A CASE B CASE C Economic Are your raw materials produced by multistage synthetic routes in the supply chain? Yes No No Green Chemistry Principle 9 (Considerations of catalyst usage in the design phase) CASE A CASE B CASE C Environmental Are the catalysts heterogeneous or homogeneous, soluble or liquid
Homogenous and soluble Heterogenous No answer
Social Do the need for noble and/or rare earth metal catalysts lead to conflicts? No answer
No answer
No answer
Do the use of noble and/or rare earth metal catalysts lead to social insecurity? No answer
No answer
No answer
Economic Is the use of noble and/or rare earth metal catalysts entail excess costs Not applicable Yes Yes What is the cost of the catalyst $24.50/100g $153.50/25g $365.00/500mg

93
Green Chemistry Principle 10 (How to design chemicals and products to degrade after use) CASE A CASE B CASE C Environmental Does the degradation process generate harmful emissions?
Yes, it decomposes to CO and H2O
Yes, it decomposes to CO and H2O
Yes, it decomposes to CO and H2O
Green Chemistry Principle 12 (How the potential for accidents could be minimized) CASE A CASE B CASE C Social
Does the potential for accidents hinder occupational health and safety?
No, occupational health and safety guidelines are followed
No, occupational health and safety guidelines are followed
No, occupational health and safety guidelines are followed
Economic
Advanced training needed?
Yes, because of the nature of raw materials used, and unfavorable equilibrium position of water-to-methyl formate ratio
Training needed, not necessarily advanced
Training needed, not necessarily advanced
Does the necessary accident prevention activity lead to excess costs? (e.g. protective equipment or gear?) Yes No No