sustainable agribusiness + agroenergy = brazil
TRANSCRIPT

The Agribusiness MAgAzine froM fgV
Special Edition
issn 0100-4298
The Agribusiness MAgAzine froM fgV
Special Edition
SuStainable agribuSineSS+
agroenergy=
brazil

4 Special EditionAgroanalysisSpecial Edition
Institution of technical-scientific, educational and philanthropic character, created on December 20, 1944 as a legal entity of private law with the objective to act, broadly, in all subjects of scientific character, with emphasis on social sciences: administration, law and economics, contributing for the socioeconomical development of the country. Headquarters: Praia de Botafogo, 190, Rio de Janeiro - RJ, CEP 22253-900 or Postal Code 62.591 - CEP 22257-970, Tel.: (21) 2559 6000, www.fgv.brFirst President and Fouder: Luiz Simões LopesPresident: Carlos Ivan Simonsen LealVice-presidents: Francisco Oswaldo Neves Dornelles, Marcos Cintra Cavalcanti de Albuquerque, Sergio Franklin QuintellaBoard of DirectorsPresident: Carlos Ivan Simonsen LealVice-presidents: Francisco Oswaldo Neves Dornelles, Marcos Cintra Cavalcanti de Albuquerque, Sergio Franklin QuintellaVoting Members: Armando Klabin, Carlos Alberto Pires de Carvalho e Albuquerque, Ernane Galvêas, José Luiz Miranda, Lindolpho de Carvalho Dias, Manoel Pio Corrêa Jr., Marcílio Marques Moreira, Roberto Paulo Cezar de AndradeDeputies: Antonio Monteiro de Castro Filho, Cristiano Buarque Franco Neto, Eduardo Baptista Vianna, Gilberto Duarte Prado, Jacob Palis Júnior, José Ermírio de Moraes Neto, Marcelo José Basílio de Souza Marinho, Mauricio Matos PeixotoBoard of TrusteesPresident: Carlos Alberto Lenz César ProtásioVice-president: João Alfredo Dias Lins (Klabin Irmãos & Cia.)Voting Members: Alexandre Koch Torres de Assis, Angélica Moreira da Silva (Federação Brasileira de Bancos), Ary Oswaldo Mattos Filho, Carlos Moacyr Gomes de Almeida, Andrea Martini (Souza Cruz S/A), Eduardo M. Krieger, Estado do Rio Grande do Sul, Heitor Chagas de Oliveira, Jaques Wagner (Estado da Bahia), Luiz Chor (Chozil Engenharia Ltda), Marcelo Serfaty, Marcio João de Andrade Fortes, Pedro Henrique Mariani Bittencourt (Banco BBM S.A), Orlando dos Santos Marques (Publicis Brasil Comunicação Ltda), Raul Calfat (Votorantim Participações S.A), Leonardo André Paixão (IRB-Brasil Resseguros S.A), Ronaldo Vilela (Sindicato das Empresas de Seguros Privados, de Previdência Complementar e de Capitalização nos Estados do Rio de Janeiro e do Espírito Santo), Sandoval Carneiro JuniorDeputies: Aldo Floris, José Carlos Schmidt Murta Ribeiro, Luiz Ildefonso Simões Lopes (Brookfield Brasil Ltda), Luiz Roberto Nascimento Silva, Manoel Fernando Thompson Motta Filho, Nilson Teixeira (Banco de Investimentos Crédit Suisse S.A), Olavo Monteiro de Carvalho (Monteiro Aranha Participações S.A), Patrick de Larragoiti Lucas (Sul América Companhia Nacional de Seguros), Roberto Castello Branco (VALE S.A.), Rui Barreto (Café Solúvel Brasília S.A), Sergio Lins Andrade (Andrade Gutierrez S.A.), Victório Carlos De MarchiDean of FGV-EESP: Yoshiaki NakanoDirector of FGV Projetos: Cesar Cunha CamposDean of FGV-IBRE: Luiz Guilherme Schymura de OliveiraDean of FGV-SP: Prof. Francisco S. MazzuccaDean of FGV-EAESP: Maria Tereza Leme Fleury
Agribusiness periodical publication of FGV’s Agribusiness Center
Editorial Board: Luiz Carlos Corrêa Carvalho, Ivan Wedekin, Luis Carlos Guedes Pinto, Luiz Guilherme Schymura de Oliveira,Roberto Rodrigues and Yoshiaki NakanoEditor in Chief: Antônio Carlos Kfouri AidarExecutive Editor: Evandro Jacóia FaulinCollaboration: Bruno Benzaquen Perosa and Felippe Cauê Serigati Founders: Julian M. Chacel and Paulo Rabello de CastroPR and Marketing Coordinator: Melina BandeiraGraphic Design: Patricia Werner and Camila SennaRevision: Manuela Fantinato and David del VecchioTranslation: Amy HerszenhornPhotos: ShutterstockSecretariat and Administration: Viviane de CarvalhoEditorial Production Coordinator: Evandro Jacóia FaulinAdvertising/Comercial/Subscriptions: Viviane de Carvalho Av. Paulista, 1.294, 15o andar, Tel.: (11) 3799-4104, Fax: (11) [email protected]/agroanalysis
FgV ProJetoS
Director: Cesar Cunha CamposTechnical Director: Ricardo SimonsenDirector of Control: Antônio Carlos Kfouri AidarDirector of Quality: Francisco Eduardo Torres de SáMarket Director: Sidnei GonzalezDeputy Market Directors: Carlos Augusto Costa and José Bento Carlos Amaral
gV agro
Coordinator: Roberto RodriguesManager: Cecília Fagan CostaCollaboration: Roberto Perosa Junior, Angelo Costa Gurgel and Felippe Cauê SerigatiAssistant: Raquel Magossi Rodrigues and Michele de Moraes Joaquim
The Agribusiness Magazine from fgV

Special Edition Agroanalysis 5Special Edition
Editorial 6 CESAR CuNHA CAMPOS
Outlook of Brazilian Agribusiness15 ROBERTO RODRIGuES | CHALLENGES AND OPPORTuNITIES IN BRAzILIAN AGRIBuSINESS
19 BRAzILIAN DATA
42 LEADING THE WAY FOR A SuSTAINABLE GROWTH OF THE GLOBAL PALM OIL INDuSTRY
Articles
15 CHALENGES AND OPPORTuNITIES IN BRAzILIAN AGRIBuSINESS
Outlook
6 EDITORIAL
Special Edition
Articles22 BRuNO PEROSA | DEFORESTATION OF THE AMAzON REGION: IS IT POSSIBLE TO BLAME AGRICuLTuRE AND CATTLE BREEDING?
30 ANTôNIO AIDAR AND FELIPPE SERIGATI | THE PROFITABILITY OF THE SuGAR AND ETHANOL SECTOR DEPENDS ON PETROBRAS
36 OTáVIO MIELNIK | SHALE OIL AND SuBSIDIES FOR CORN ETHANOL PRODuCTION IN THE uNITED STATES
42 RALF LEVERMANN AND JuLIANO PAuLO MENDES DE SOuzA | LEADING THE WAY FOR A SuSTAINABLE GROWTH OF THE GLOBAL PALM OIL INDuSTRY

6 Special EditionAgroanalysis
EDITORIAlCesar Cunha Campos*
First launched by FGV Foundation 33 years ago, agroanalysis is a magazine devoted to offering the main in-
formation needed to make decisions in agribusiness. The im-partiality and seriousness with which the information is dealt with, as well as the quality of its team of specialists, make this magazine one of the most important opinion leaders in the sec-tor in Brazil.
This edition was drafted specially for the 161st Session of the Committee for Agriculture of the OECD, with the goal of debating relevant issues for the agricultural economy of Brazil that were not covered in the regular session. At the technological forefront in the production of food and en-ergy in tropical regions, Brazil has achieved new records in production and productivity, year after year. In the last 21 years, the area cultivated with grains in the country grew by 40%, while the volume produced increased by 220%. If the productivity that existed 21 years ago had been maintained, it would be necessary to have an additional 66 million hect-ares, in addition to the 53 million cultivated at present, to collect what was harvested in the 2012. Positive results have also been observed in other production chains, such as meat, pulp and paper, and agro-energy, among others.
Other themes broached in this edition refer to the analysis of: the deforestation of the Amazon Rainforest; the poor re-cent performance of the sugar and alcohol sector in Brazil, set off by the policies for inflation control adopted by the government; the effect of shale oil production on subsidies to the production of corn in the United States; and the ad-vance in the palm oil industry. To inaugurate this issue and explain the context for readers, we have drafted a panorama of Brazilian agribusiness.
It is of particular importance to mention the case of eth-anol produced from sugar cane, which has contributed to the reduction in CO2 emissions. When added to gasoline, for example, CO2 emissions are reduced by 89%. In the country, all of the gasoline consumed contains 25% etha-nol, as well as diesel, which as part of its blend contains 5% biodiesel.
In addition to the successive technological advances, what has also contributed to the healthy results of agribusiness are environmental policies to streamline the mechanized fleet and increase agricultural credit at low interest rates. Notwithstanding the fact that this scenario is positive, its continuance is compromised by a series of bottlenecks that need to be overcome as quickly as possible, including:
• Insufficient infrastructure to service the sector’s needs;• A passive commercial policy that results in a lack of
bilateral agreements and policies directed to increas-ing the value of the raw materials produced in the country, and
• The lack of an efficient revenue policy for the field, translated into a system of rural insurance that is more encompassing, and a less bureaucratic rural credit, fa-cilitating access for all.
The issue of devastation of tropical rainforests around the globe began to draw the attention of worldwide pub-lic opinion beginning in the 1980s, due to high and rapid deforestation rates. During that same decade, the Brazilian government sought to strengthen its environmental policies, concerned with the situation of the Amazon Rainforest, called by many the “lungs of the world”. The Constitution of 1988 consolidated the environmental regulatory frame-work and subsequently, there were investments made in mechanisms for monitoring deforestation through satellite imaging. The result was a drop of 84% in the deforestation rate beginning in 2004. It is important to highlight that this reduction occurred during the period of agricultural expan-sion, stimulated by the high price of commodities in the in-ternational market.
Recently released data point to an increase of 28% in the deforestation rate between 2012 and 2013. Some issues were immediately raised regarding the responsibility of ag-ricultural and cattle breeding production in these figures. In this sense, the analysis of the recent deforestation of the Amazon region emphasizes that the main causes are invest-ments in infrastructure of the forest regions. Highway and hydroelectric plant construction, for example, tends to cause a direct impact on the native forest. Indirectly, infrastructure
Editorial

Special Edition Agroanalysis 7
projects increase the value of land, and, in its turn, stimulate human settlements and further deforestation.
When the issue is renewal energy, ethanol is the main flag raised by Brazil in the international market. Despite this, the low economic growth of the country in recent years and the discovery of the pre-salt oil have made this fuel drop out of center stage and no longer be the main item in Brazilian energy policies. In addition to the domestic problems faced with the break in the 2011/12 harvest and the lack of re-sources for plants to invest in the renewal of sugar planting, the profitability of hydrated ethanol has also been hampered by the increasingly attractive prices of sugar in the interna-tional market, and the gasoline price readjustment policy practiced by Petrobras.
To maintain inflation within the parameters set forth and thus avoid an increase in interest rates, the government took the decision to not readjust gasoline prices and those of diesel oil. Although it has helped to control inflation, this measure has brought about an imbalance in economy, as well as losses for Petrobras itself and for the sugar and alcohol sector.
An analysis carried out by FGV shows that if the price of gasoline were to accompany the variation in oil quotations in the international market, a liter of gasoline in the states of São Paulo and Paraná would, on average, be sold at BRL 4.21. Considering that for ethanol to be attractive for the end user its price should be at least 30% lower than that of gasoline, a liter of ethanol would be sold, on average, at BRL 2.95 in those states, 61% higher than current prices. The good news for the sugar energy sector is that Petrobras should be changing its price readjustment policy for gasoline and diesel oil. A new readjustment policy would be funda-mental to restore the profitability of ethanol.
In the United States, the production of shale oil began only in 2006, and has achieved substantial energy savings. The volume of oil and oil by-products imported by the United States (main importer worldwide) was reduced by at least 30%, from 2007 to 2013. Projections indicate that shale ex-ploitation will allow the country to expand its autonomy in terms of oil and oil by-product availability, as well as in natural gas and natural gas liquids.
Nevertheless, everything points to the fact that not only shale oil production, but production of corn ethanol that could be threatened by shale, should become priorities, guaranteeing a sustainable fuel supply. With the purpose of adjusting the ethanol supply for the 2013-2022 period to the new demand for liquid fuel and difficulties in the implemen-tation of pulp ethanol, the volumes sets forth initially in the mandate instituted by the Energy Independence and Security Act, in 2007, will have to be revised. The mandate specifies corn ethanol volumes, those of pulp and imported ethanol, in addition to those of biodiesel that should be consumed by the country. However, this measure is not expected to have a significant impact on corn production.
Finally, the product that has led to impressive growth in the last few years is palm oil. Although it occupies less than 10% of the total area planted with oil seed crops in the world, this product accounts for 1/3 of the vegetable oil produced in the world.
Palm oil is widely known for its nutritional characteristics and its versatility of application. Broadly used in the man-ufacture of food, it is also used by other sectors in industry, such as the production of cosmetics, cleansing products and biofuel. More than 80% of the palm oil consumed in the world is used by the food industry. Despite this, the growth in demand for biofuels will also become a potential scenario for the increase in demand for this oil.
Brazil meets all the conditions necessary to become one of the main worldwide producers of palm oil in the not-so-distant future. We have the ideal soil and climate conditions, large extensions of degraded areas that could be used for cultivation, clear environmental legislation regarding the use of land, and availability of labor.
By including these issues in our agenda, we follow our mission of stimulating fundamental discussions for the national agenda, placing ourselves at the forefront of the production and dissemination of knowledge regarding agribusiness in Brazil.
Editorial
* Director of FGV Projetos

8 Special EditionAgroanalysis
BASED ON an admirable tropical te-chnology, the Brazilian rural sector is
making both qualitative and quantitative leaps, breaking production and produc-tivity records year after year. The plan-ted area in the last 21 years with grains grew 40%, while the volume produced increased 220%. This figure alone is al-ready spectacular, but underlying this is an even more remarkable phenomenon: if today we had the same productivity per hectare that we had 21 years ago, we would need 66 million additional hecta-res, in addition to the 53 million cultiva-ted today with grains, to match the 2012 harvest. in other words, these 66 million have been preserved. Thanks to the grea-ter productivity per cultivated area, cer-rados and forests were not deforested in this total number.
Evidently it was not just technolo-gy that led to this impressive advance. Other public policies have been of great help, especially the Moderfro-ta, an official program that is a little over ten years old and funded the exchange of the completely scrapped mechanized fleet from Brazilian farms. This factor contributed to an increase in productivity, perhaps thanks to the reduction in waste, much greater with the older harvesters now replaced
with state-of-the–art technology in the developed world.
The increase in resources and de-crease in interest rates for rural credit over the last twenty years has played an important role in this production change in Brazilian agribusiness.
This did not affect grains only. The growth of meat production was also considerable, as can be observed in the graphs; poultry production alone grew by 458% during the same period.
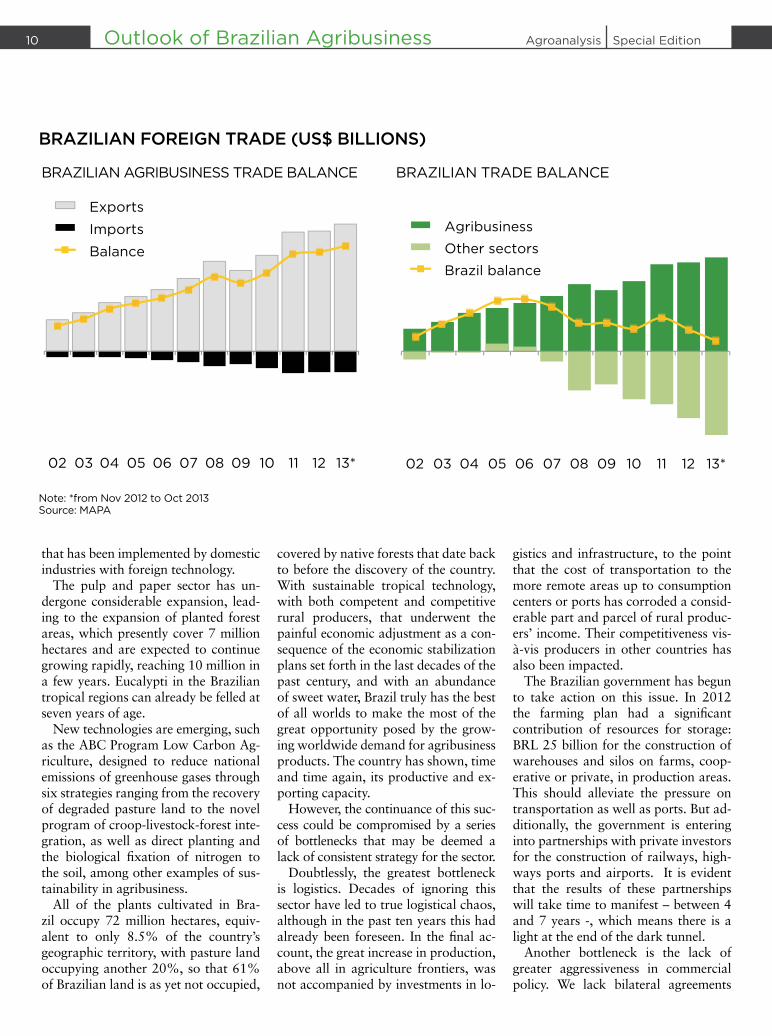
With this production performance, agro became quite competitive, ad-vancing not only in terms of domestic supply but also exports. The Brazilian agribusiness trade balance has been increasingly positive, reaching US$ 79 billion in 2012, compared to a total balance for the country of US$ 19 bil-lion. Everything points to the fact that in 2013 the balance of agribusiness will be even greater, and that of the country lower.
What is most interesting is that this growth in exports has been greater for developing countries, where popula-tion growth rates are higher and per capita income grows more rapidly than in wealthier countries. This is the great opportunity offered to us: demand from developing countries will contin-ue to grow, opening up the chance for
Brazil to become a great food supplier, as well as of fibers and energy for the near future. Chinese demand continues to increase, with the next greatest im-porter India, followed by other Asian countries that do not have sufficient land to keep up with the growing, non-stop consumption. Recent data pro-duced by the FAO and OECD show that by 2020 the worldwide produc-tion of food will have to grow by 20% and, for this to happen, Brazil must in-crease production by 40%.
Agro-energy is another promising sector: The National Alcohol Plan launched in 1975 was the largest pro-gram to date that sought an alternative to gasoline, after the terrible oil shocks in the 1970s. Ethanol produced based on sugar cane reduces CO2 emissions of gasoline by 89%, a significant con-tribution to reducing global warming. We are now heading to the second gen-eration of ethanol, using sugar cane bagasse to make ethanol, or then bio-electricity, through burning in power-ful boilers. The biodiesel program is moving forward and nowadays, as all of the gasoline consumed in Brazil con-tains 25% ethanol, all diesel contains 5% biodiesel. Bio-refineries using eth-anol as raw material for oil by-prod-uct substitutes are another opportunity
Outlook of Brazilian Agribusiness
CHAllEnGES AnD OPPORTunITIES In BRAzIlIAn AGRIBuSInESSRoberto Rodrigues*

Special Edition Agroanalysis 9
BRAzIl: MEAT PRODuCTIOn (MIllIOnS OF TOnS)
“DEMAnD FROM DEVElOPInG COunTRIES
wIll COnTInuE TO GROw, OPEnInG uP THE
CHAnCE FOR BRAzIl TO BECOME A GREAT
FOOD SuPPlIER, AS wEll AS OF FIBERS
AnD EnERGy FOR THE nEAR FuTuRE”
Outlook of Brazilian Agribusiness
BRAzIl: GRAIn PRODuCTIOn
Source: Conab
Source: CNPC, ABIEC, uBABEF, ABIPECS, uSDA.
10 Special EditionAgroanalysis
that has been implemented by domestic industries with foreign technology.
The pulp and paper sector has un-dergone considerable expansion, lead-ing to the expansion of planted forest areas, which presently cover 7 million hectares and are expected to continue growing rapidly, reaching 10 million in a few years. Eucalypti in the Brazilian tropical regions can already be felled at seven years of age.
New technologies are emerging, such as the ABC Program Low Carbon Ag-riculture, designed to reduce national emissions of greenhouse gases through six strategies ranging from the recovery of degraded pasture land to the novel program of croop-livestock-forest inte-gration, as well as direct planting and the biological fixation of nitrogen to the soil, among other examples of sus-tainability in agribusiness.
All of the plants cultivated in Bra-zil occupy 72 million hectares, equiv-alent to only 8.5% of the country’s geographic territory, with pasture land occupying another 20%, so that 61% of Brazilian land is as yet not occupied,
covered by native forests that date back to before the discovery of the country. With sustainable tropical technology, with both competent and competitive rural producers, that underwent the painful economic adjustment as a con-sequence of the economic stabilization plans set forth in the last decades of the past century, and with an abundance of sweet water, Brazil truly has the best of all worlds to make the most of the great opportunity posed by the grow-ing worldwide demand for agribusiness products. The country has shown, time and time again, its productive and ex-porting capacity.
However, the continuance of this suc-cess could be compromised by a series of bottlenecks that may be deemed a lack of consistent strategy for the sector.
Doubtlessly, the greatest bottleneck is logistics. Decades of ignoring this sector have led to true logistical chaos, although in the past ten years this had already been foreseen. In the final ac-count, the great increase in production, above all in agriculture frontiers, was not accompanied by investments in lo-
gistics and infrastructure, to the point that the cost of transportation to the more remote areas up to consumption centers or ports has corroded a consid-erable part and parcel of rural produc-ers’ income. Their competitiveness vis-à-vis producers in other countries has also been impacted.
The Brazilian government has begun to take action on this issue. In 2012 the farming plan had a significant contribution of resources for storage: BRL 25 billion for the construction of warehouses and silos on farms, coop-erative or private, in production areas. This should alleviate the pressure on transportation as well as ports. But ad-ditionally, the government is entering into partnerships with private investors for the construction of railways, high-ways ports and airports. It is evident that the results of these partnerships will take time to manifest – between 4 and 7 years -, which means there is a light at the end of the dark tunnel.
Another bottleneck is the lack of greater aggressiveness in commercial policy. We lack bilateral agreements
BRAzIlIAn FOREIGn TRADE (uS$ BIllIOnS)
Note: *from Nov 2012 to Oct 2013Source: MAPA
BRAzILIAN AGRIBuSINESS TRADE BALANCE BRAzILIAN TRADE BALANCE
Outlook of Brazilian Agribusiness

Special Edition Agroanalysis 11
and policies geared to adding value to our raw material. This is a recurrent theme that rural leadership has debat-ed with government with a great deal of emphasis: in fact, 40% of interna-tional trade of food products takes place within bilateral or multilateral agreements, on the margin of the WTO rules, with reduced tariffs or steeper quotas. It is clear that without simi-lar policies, we will end up losing the markets we had conquered over the past few years. In the year 2002, agri-business exports totaled US$ 25 billion and, ten years later, in 2012, US$ 96 billion. This growth cannot be inter-rupted for lack of a commercial policy, as the Doha Rounds have practically come to a standstill.
Another issue debated at large by the Brazilian government without result is the revenue policy for fields, so pow-erful in developed nations. This year, rural insurance only covered 6% of the cultivated area in the country, very little indeed. Despite the fact that rural credit has a breadth of resources, it is still burdened by red tape. Banco do Brasil is seeking to modernize that and better results are expected very soon.
Many aspects of legislation need to be altered, including those pertaining to labor (which needs to become more flexible), the environment, fiscal and taxation issues, and laws for access to land. All of this will depend on actions negotiated with Congress, where an expressive group of rural producers at-tempts to move forward in these issues in the face of great difficulty.
More resources for R&D is essen-tial. We are trying to build partnerships with public research agencies, permit-ted presently under the Technical In-novation Law. As part of this chapter we have some core issues, such as the strong dependence on imported fertil-izers (over half of what we use comes from abroad), the registration of new molecules for agricultural fertilizers, which takes very long due to bureau-cratic issues, and animal sanitary de-fense issues, among others.
Producer organizations have made great strides, especially through agri-cultural cooperatives, which are today responsible for 50% of the value of do-mestic agriculture and cattle raising.
Finally, we have formidable oppor-tunities, along with challenges that
are equally monumental, especially as regards non-existing public policies or, even worse, ones that hamper the rural development of Brazil.
However, there is an interesting nov-elty coming up in 2014: the elections for the Presidency of the Republic. For the first time in several decades, the official candidates – who number three so far – are seeking out leaders in agribusiness to discuss fundamental strategies for the sector. This is unheard of. In the last 40 years, it was the ru-ral leaders who sought out candidates to set forth actions to favor the sector, although with scant results. Presently it seems that things are changing, per-haps because society has a better un-derstanding of the role of agriculture in Brazil’s development. In the final account, agribusiness already accounts for more than 22% of GDP, generates one-fourth of all employment, and has a spectacular weight in the trade bal-ance. There is strong hope that this time around, the opportunities will outweigh the challenges and these will be overcome. We’ll see.
Outlook of Brazilian Agribusiness
“61% OF BRAzIlIAn lAnD IS AS yET
nOT OCCuPIED, COVERED By nATIVE
FORESTS THAT DATE BACk TO BEFORE
THE DISCOVERy OF THE COunTRy”
* Coordinator of the FGV Foundation Agribusiness Center (GV Agro) and FAO Special Ambassador for Cooperatives

12 Special EditionAgroanalysis
BRAzIlIAn DATASuGAR CANE CROP AREAS:
AGRO-ECOLOGIC zONING (zAE-CANA)
The Zae-cana is the result of stu-dies carried out under the leadership
of eMBraPa by several federal agencies (Ministry of the environment, cOnaB, iBGe, among others) and universities (cePaGri/unicaMP). The plan was to use satellite images to map the parts of Brazil best suited for sugar cane plan-ting. The methodology developed for the Zae-cana called for a complete survey of Brazil’s territory, taking into account, in addition to soil and climate charts, an in-tegrated analysis of the land’s vegetation, hydrography, and areas under environ-mental protection.
What is being examined is not only the production potential of each re-gion, to be considered in the design of agricultural policies, but also the social and environmental risks which may come about from this sugar cane ex-pansion process, thus serving as a ba-sis for the conceiving of environmental policies and for the fight against hunger and poverty. In this way, what becomes possible is the integration of agricul-tural, environmental, and anti-poverty policies, to maximize the effectiveness of public resources, with the aim of fostering growth in the sugar energy sector in Brazil in a rational and sus-tainable fashion.
As a result of the ZAE-Cana, sug-ar cane plantations are restricted in 81,5% of the Brazilian territory, com-pletely excluding the Amazon, Pantanal and Alto Paraguai biomes. If we con-sider those areas where planting is not recommended, that excludes 92.5% of Brazil’s territory. All in all, the study shows that there is still a huge potential for the expansion of sugar cane in areas presently occupied by pasture land for cattle breeding. Of the 64 million hect-ares considered suitable for sugar cane planting, 37 million were occupied by pastures in 2002.
Institutionally, the ZAE-Cana was approved via a decree from President Lula in 2009, but this decree never be-came a law, which reduces the possibil-ity of using legal enforcement mecha-nisms. Restricted access to subsidized rural credit lines is recognized by spe-cialists as an important form of incen-tives, so that zoning can have a more effective impact¬ on the sugar-alcohol sector.
Outlook of Brazilian Agribusiness

Special Edition Agroanalysis 13Outlook of Brazilian Agribusiness
RAInFOREST AnD PAnTAnAl: nO SuGAR CAnE
legends:
Source: Embrapa
BRAZIL: ZAE - SUGARCANE
BRAzIL: zAE - CANA
Amazon Biome
Pantanal Biome
Alto Paraguai Basin
State Limit
HIGHLY aptitude - presently with pasturelands
MEDIuM aptitude - presently with pasturelands
LOW aptitude – presently with pasturelands
HIGH aptitude - presently with cattle breeding and agriculture
MEDIuM aptitude
LOW aptitude
HIGH aptitude - presently with agriculture
MEDIuM aptitude - presently with agriculture
LOW aptitude - presently with agriculture
Inept areas
The class for Agriculture and cattle breeding use represents areas covered with agriculture plantations or cultivated pasturelands. These are cases where an interpretation through the Landsat satellite images was not possible

14 Special EditionAgroanalysis
BRAzIlIAn POSITIOn AS A PRODuCER COMPARED TO THE wORlD MARkET (2013/14 HARVEST)
BRAzIlIAn POSITIOn AS A ExPORTER COMPARED TO THE wORlD MARkET (2013/14 HARVEST)
Source: usdaNote: *2012/2013
Source: usdaNote: *2012/2013
Outlook of Brazilian Agribusiness

Special Edition Agroanalysis 15
“GREAT PRODuCERAnD ExPORTER”
Outlook of Brazilian Agribusiness

16 Special EditionAgroanalysis
MAIn DESTInIES OF BRAzIlIAn AGRIBuSInESS ExPORTS, In 2012 (%)
BRAzIlIAn TRADE BAlAnCE EVOluTIOn (uS$ BIllIOn)
Source: Secex
Source: SecexNote: *Jan - Oct 2013
Outlook of Brazilian Agribusiness

Special Edition Agroanalysis 17
MAIn DESTInIES OF BRAzIlIAn AGRIBuSInESS ExPORTS, In 2012 (%) “HuGE COnTRIBuTIOn TO THE TRADE BAlAnCE”
Outlook of Brazilian Agribusiness

18 Special EditionAgroanalysis
BRAzIlIAn CulTIVATED AREA wITH GRAInS, PRODuCTIOn AnD yIElD
Source: ConabNote: *Nov 2013
“PRODuCTIVITy InCREASE:
MORE FOOD PER HECTARE”
Outlook of Brazilian Agribusiness
Yie
ld

Special Edition Agroanalysis 19
BRAzIlIAn GRAIn PRODuCTIOn, PER PRODuCT (THOuSAnD T)
BRAzIlIAn CuTIVATED AREA wITH GRAInS, PER PRODuCT (THOuSAnD HA)
Source: ConabNote: *Nov 2013
Source: ConabNote: *Nov 2013
Outlook of Brazilian Agribusiness
20 Special EditionAgroanalysis
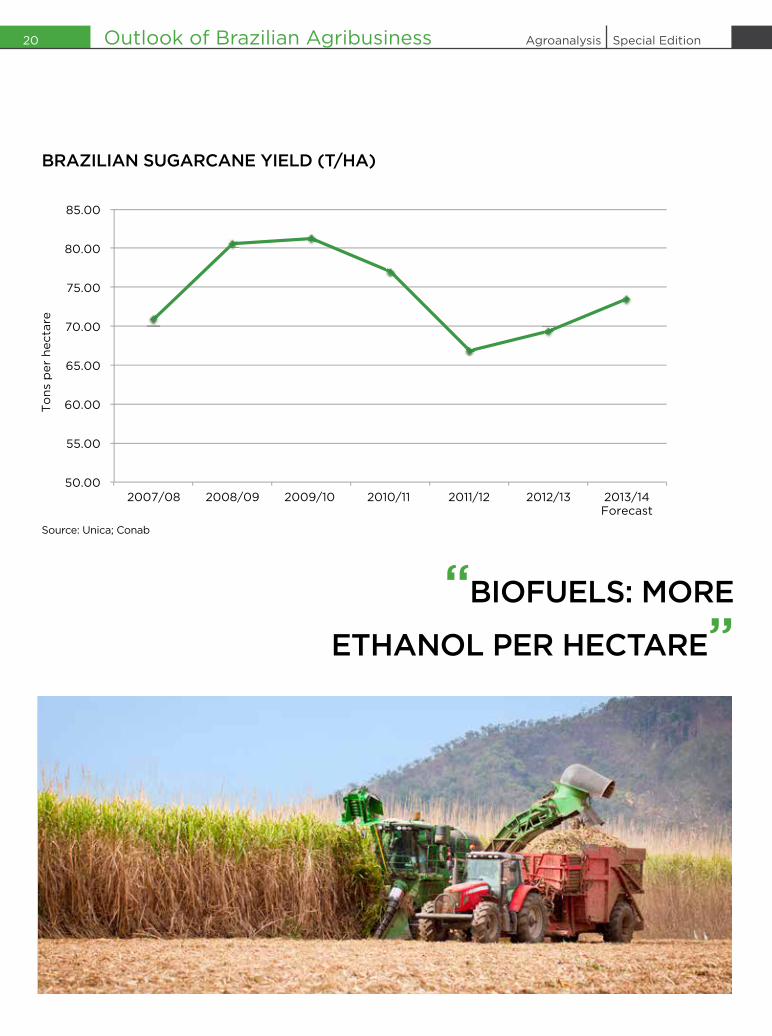
BRAzIlIAn SuGARCAnE yIElD (T/HA)
“BIOFuElS: MORE
ETHAnOl PER HECTARE”
Source: unica; Conab
Outlook of Brazilian Agribusiness

Special Edition Agroanalysis 21
BRAzIl: SuGAR AnD ETHAnOl PRODuCTIOn
BRAzIl: SuGAR CAnE AREA AnD PRODuCTIOn
Source: unica
Source: unica; Conab
Outlook of Brazilian Agribusiness

22 Special EditionAgroanalysis
lARGEST PRODuCERS OF SuGAR, In 2012/13 HARVEST (THOuSAnD T)
BRAzIl: ElECTRIC EnERGy SuPPly MATRIx, In 2012
Source: unica
Source: MME
Outlook of Brazilian Agribusiness

Special Edition Agroanalysis 23
BRAzIlIAn ElECTRIC EnERGy SuPPly MATRIx, In 2012 (MIllIOn TOnnES OF OIl EQuIVAlEnT)
Source: MME
Outlook of Brazilian Agribusiness

24 Special EditionAgroanalysis
BRAzIlIAn CulTIVATED AREA wITH COFFEE, PRODuCTIOn AnD yIElD
BRAzIl: BOVInE MEAT PRODuCTIOn(THOuSAnD TOnS OF CARCASS-wEIGHT EQuIVAlEnT)
Source: Conab
Source: uSDA
Outlook of Brazilian Agribusiness
Yie
ld

Special Edition Agroanalysis 25
BRAzIl: POulTRy MEAT PRODuCTIOn (THOuSAnD T)
BRAzIl: PORk MEAT PRODuCTIOn (THOuSAnD TOnS OF CARCASS-wEIGHT EQuIVAlEnT)
Source: uSDA
Source: uSDA
Outlook of Brazilian Agribusiness

26 Special EditionAgroanalysis
BeGinninG in the 1980s, the at-tention of the world focused on the
rapid deforestation of tropical forests and their effect on the terrestrial ecosystem. in this context, the amazon region, de-scribed as being the “lungs of the world”, began to be considered the main exam-ple of deforestation, caused by the lack of stringent environmental legislation or government supervision.
Over the last three decades, the Bra-zilian government has sought to re-dress such problems and strengthen its environmental policies. In 1988, the new Constitution dealt with this issue, consolidating the environmental reg-ulatory framework, which up to that time had been diffuse, in several iso-lated laws, such as the Forestry Code of 1965. Based on this new regulatory framework, the Brazilian Institute for the Environment (Instituto Brasile-iro do Meio Ambiente - IBAMA) was created in 1989, and continues to play an important role in the protection of Brazilian flora and fauna. The Con-stitution also strengthened the role of the Federal Public Ministry, which has made fundamental contributions to en-vironmental monitoring in Brazil.
Another important set of policies ad-opted were geared to mechanisms for monitoring deforestation by means of
satellite images. In this sense, the Na-tional Institute for Space Research (In-stituto Nacional de Pesquisas Espaciais - INPE) has been generating data every year with the deforestation rates of the legal Amazon Region since 1988, con-sidering each of the Federation Units that make up the region.
By considering a historical series in deforestation rates, what can be ob-served is that beginning in 2004 there is a marked trend for reduction (a drop of 84%), with the exception of the years 2008 and 2013. This data is remark-able when we consider that the defor-estation reduction rate occurred during a period of considerable growth in agribusiness, nurtured by the increase in prices of the main commodities ex-ported by Brazil.
This inverse relationship between growth in agriculture and cattle breed-ing and the decline in deforestation is evidence of the efficacy of environmen-tal policies in containing pressure aris-ing from agribusiness. Notwithstand-ing this, the data announced in 2013 showing a 28% rise in deforestation rate compared to 2012 brought back questions regarding the efficacy of na-tional environmental policy and what would be the impact of agribusiness in these figures.
To be able to understand how this rate has been falling and what could explain its rise in the last year, it is im-portant to analyze the main causes and forms of deforestation observed in the Amazon Region, as well as some of the policies that have been set forth by the Brazilian government with the intent of overseeing the deforestation process.
Main drivers and dynamic of deforestation in the Amazon Region
The large majority of studies that ad-dress deforestation focus on economic activities, such as cattle breeding, agri-culture, forest exploitation or the ex-pansion of infrastructure, as the main causes of this process. The way that each of these factors affects deforesta-tion is complex and, generally, these activities occur in a complementary or sequential way.
Cattle breeding, for example, is gen-erally mentioned as an important factor causing deforestation. All in all, more in-depth studies show that this would be one more consequence of deforestation, allowing for the occupation of deforest-ed land for other economic uses (such as the sale of timber or the occupation
DEFORESTATIOn OF THE AMAzOn REGIOn: IS ITPOSSIBlE TO BlAME AGRICulTuRE AnD CATTlE BREEDInG? Bruno Perosa*
Articles

Special Edition Agroanalysis 27Articles
of land which might have its value in-creased in the future). Thus, these ille-gal squatters or deed-falsifiers and other illegal loggers occupy pasturelands and carry out extensive cattle breeding as a means to maintain the property to be able, in the future, to enjoy the profit from the sale of land or make another economic use of such land.
Agriculture would purportedly come at a later stage, after occupation with cattle breeding, when property rights are more guaranteed. In the same way, crops that are initially temporary are cultivated with low adoption of tech-nology, explained by the risk of losing the investment through potential con-testation of the property rights obtained illegally. It is only after some years that the deforested land is deemed apt for agricultural activity, one not requiring high investments, such as the produc-tion of commodities or technologically intensive cattle breeding.
The diverse phases of this process seek to generate income and legitimate occupation of land, keeping in mind future profits that may be had. This relatively long cycle of deforestation creates a time lag between the moment of deforestation and the use of the land for agribusiness. Therefore, the greater demand of land for agribusiness does
not immediately affect the incentives of illegal loggers. The expectation for the expansion of the agricultural frontier could lead to the expectation of future profit for these loggers.
It can further be argued that the ex-pansion of the agricultural frontier creates an effect of displacement of the more rudimentary agricultural and cat-tle breeding activities (low investments and use of technology) that would grant space for agribusiness in regions that are already consolidated (deforest-ed more than 15 years). The so-called “indirect effects”, such as the displace-ment mentioned, are much more com-plex, and there is a broad debate on its magnitude. Recently, the Environmen-tal Protection Agency (EPA), with the aim of measuring the indirect effects of sugar cane crops in ethanol production in the Brazilian central south, created a calculation methodology for the indi-rect effects, and no great impacts were found on the Amazon Region and oth-er sensitive ecosystems.
Studies analyzing the background of deforestation of the Amazon region show that this dynamic is strongly in-fluenced by the change of infrastruc-ture in forest regions. The construction of highways and plants, for example, tends to cause direct impacts on the na-
tive vegetation of those regions. These effects also tend to be exacerbated by indirect effects, such as human occupa-tions in these areas, as became evident in the construction of the Transamazonic highway in the 1970s, in which defor-estation was observed in large areas sur-rounding this highway. More recently the construction of a hydroelectric plant in Belo Monte, close to Altamira in Pará, has also been causing an unhalted process of land occupation.
Indirectly, the construction of high-ways and infrastructure work leads to a process of valuation of lands, which is an incentive for deforestation. Great-er access to highways makes these lands more propitious for other eco-nomic activities, such as cattle breeding and agriculture, given the greater ease of receiving and moving raw material. Thus, infrastructure work ends up be-ing an incentive for deforestation, due to the future value the lands may have, because of real estate valuation, and also because of the greater potential for production that this land takes on once infrastructure has been installed. In all cases, there is the expectation of future value for the land, which increases the incentive for deforestation.
When observing this vicious cy-cle of deforestation, it is possible to
“[BEGInnInG In 2004] THE DEFORESTATIOn
REDuCTIOn RATE OCCuRRED DuRInG A PERIOD
OF COnSIDERABlE GROwTH In AGRIBuSInESS…”

28 Special EditionAgroanalysis
identify several factors that have an impact on the deforestation rate. Ob-viously the growth in agriculture and cattle breeding directly and indirectly affects this process, but all in all, oth-er elements, such as construction of infrastructure work and development projects close to the forests, also im-pact this process, perhaps even lever-aging the expansion of agriculture in the region for coming years.
Command and Control Policies to avoid Deforestation
After considering the incentives for deforestation, it is necessary to ana-lyze the disincentives and penalties that have been applied by the Brazil-ian government through monitoring mechanisms. The policies in this field can be divided into command policies (penalties) and control mechanisms (monitoring).
In the first group, punitive measures, including fines, and environmental criminalization actions can be consid-ered, as well as incentive mechanisms,
as for example a restriction to subsi-dized credit for crops cultivated on deforested land. These mechanisms are the result of a lengthy construction process for the Brazilian regulatory framework, kicked off with the cre-ation of the National Council on the Environment (CONAMA) in 1981. It was based on this that the Constitution of 1988 attempted to develop the main punitive mechanisms, particularly through the strengthening of the Public Ministry (MP) in themes relating to en-vironmental preservation.
Subsequently, with the passing of the Act on Environmental Crimes (1998), the MP intensified its actions and reduced incentives for illegal de-forestation. One of the resolutions of the CONAMA (237/97) set forth the need for environmental and forestry licensing by IBAMA to set up any cat-tle breeding or agricultural production. Without the license, a producer will not be able to have access to any type of agricultural policy made available by the Brazilian government, which will directly affect competitiveness.
More recently, the Brazilian gov-ernment has been carrying out new agro-ecologic zoning practices, so as to restrict not only the potential for productivity of certain areas (deemed to be climate risks) and adjustment of production conditions but also some environmental risks that are inherent in them. In this sense, the Agro-ecologic Zoning for Sugar Cane stands out for considering sensitive biomes such as the Pantanal and the Amazon Region as inappropriate areas for the planting of sugar cane crops. Based on this zon-ing, what is sought is greater integra-tion of agricultural and environmental policies to create incentives for rural producers regarding the zoning.
The second group of environmental policies can be deemed to be monitor-ing and control measures for deforesta-tion, leading to a more effective action on the part of the state. In addition to the Program to Calculate Deforestation in the Amazon Forest (PRODES) creat-ed in 1988 by the National Institute for Space Research (INPE) aimed at pro-viding annual data on the deforesta-tion of the Amazon Region, in 2004
BRAzIlIAn AnnuAl DEFORESTATIOn RATES (kM2/yEAR)
Source: Prodes/INPE
Articles

Special Edition Agroanalysis 29
a mechanism was created for more immediate monitoring, the Real Time Deforestation Detection (DETER). DE-TER allows IBAMA to consider forest felling in areas that are greater than 25 hectares, making it possible to take action in areas of great deforestation. This is the way that had led to an inten-sification of the action of IBAMA that presently carries out expeditions to fine loggers.
Another important measure refers to the registry of municipalities with de-forestation levels greater than 110km2 in one year. Such municipalities are subject to more intensive supervision on the part of IBAMA. This allows for greater focus of public resources on the monitoring and challenging of defor-estation in the more critical areas.
Very generally, the command and control measures implemented by the Brazilian government have been con-sidered as effective by international experts. In a recent publication in SCI-ENCE, a group of scientists led by Mat-thew C. Hansen that looked at satellite images taken between 2000 and 2012, emphasized Brazilian efforts to contain deforestation in the Amazon Region, and found that this is not matched by other countries such as Indonesia and Malaysia, where deforestation rates have grown considerably in the last de-cade. Some countries in Latin America, such as Bolivia and Paraguay, are also part of the list of countries increasing their deforestation rates.
understanding deforestation rates in the Amazon Region in the last years
As explained previously, the declin-ing trend in deforestation in the last few years is seen as the result of more active command and control policies on the part of the Brazilian govern-ment. Despite this, the 28% increase in the deforestation rate between 2012 and 2013 sounds a warning regard-ing the maintenance of these declining trends for coming years. It is obvious that more in-depth analysis would be needed to see if this trend will be sus-tained.
Despite having been disseminated recently, and although there has been no careful analysis on the part of sci-entists, several explanations have been ventured to explain this reversion in deforestation rates. Specialists point to a “structural” change in the type of deforestation that has occurred more recently, which would reduce the ef-fectiveness of public policies that had previously led to good results.
This “hard core” of illegal defor-estation would be more complex to contain. Upon observing the satellite images, what can be verified is that over 60% of the deforested areas take place in areas that total less than 25 hectares, the minimum limit set forth in the Brazilian government’s monitor-ing program. Thus, loggers would be
Articles
“learning” how to deforest without be-ing detected by the IBAMA radar.
Another interesting element refers to the fact that the deforestation points or hot spots are concentrated in the State of Para, more specifically in the surroundings of Highways BR-163, especially in the region of Belo Mon-te, in the municipalities of Altamira and Novo Progresso, and around the BR-319 Highway that interconnects Manaus to Porto Velho. This data cor-roborates the impact that infrastruc-ture projects have when carried out in regions that have economic incentives for deforestation, so-called “specula-tive” deforestation”.
Because of all this, it is difficult to state that this new outbreak of defor-estation is due to the search for new agricultural land. So-called specula-tive deforestation, in which individ-ual deforesting because of the profit the sale of this land may bring in the future, proves to be more plausible in this case. Given that the majority of the punitive long term mechanisms applied by environmental policies are aimed at containing the agricultural use of land (access to rural credit, for example), these policies become innoc-uous under this form of deforestation. In this case, the only way to contain this practice would be through the di-rect punishment of loggers.
“STuDIES AnAlyzInG THE BACkGROunD
OF DEFORESTATIOn OF THE AMAzOn
REGIOn SHOw THAT THIS DynAMIC IS
STROnGly InFluEnCED By THE CHAnGE OF
InFRASTRuCTuRE In FOREST REGIOnS.”
* Professor at the Institute of Economics at the Federal university of uberlândia and researcher of AlcScens Project (uNICAMP / FAPESP)

30 Special EditionAgroanalysis
Until recentlY, ethanol was the main component of Brazilian ener-
gy policy. due to the limited economic growth of the country and the discovery of pre-salt oil, this biofuel is no longer a priority. along with this downgrading, the sugar energy sector has undergone a downturn and found itself in a stag-nation period. Petrobras may be a key agent in the sector’s recovery and a new policy to readjust gasoline prices could be decisive in restoring the profitability of ethanol.
A period of favorable winds
The sugar energy sector benefitted considerably from the introduction of flex-fuel engines in the Brazilian au-tomotive market, beginning in 2003. Through that, the consumer could decide which fuel to fill the car with, observing the relationship between eth-anol and gasoline; as long as the price of the former was lower than 70% of the price of the latter, it was worth it to fill the car with ethanol.
A recent survey commissioned by the Brazilian Sugarcane Industry Asso-ciation states that if ethanol had the same relative price as gasoline – which is to say, the same cost per mile driven
–, most of the Brazilian flex car owners would choose gasoline: 50% of drivers only choose ethanol if it is cheaper.1
In addition to this innovation, the sector further benefitted from the growing concern with the negative con-sequences of the emission of gases that contribute to the so-called greenhouse effect on global warming. Fossil fuels, with a special focus on oil by-products, were signaled out as the main villains. In this context, ethanol was presented as a sustainable economic and environ-mental alternative to gasoline. Due in part to this, Brazilian exports of this biofuel increased considerably up until the 2008/2009 harvest.
With the expectation of ever growing demand in the near future, the Brazilian sugar energy sector sought out funding and made heavy investments in:
• The expansion of the raw mate-rial supply (sugar cane);
• The introduction of new technol-ogies (for example, to accelerate the process for the elimination of sugar cane burning); and
• The creation of more efficient logistics: carrying out improve-ments in production.
In addition to making the sugar ener-gy chain more efficient, the sector has also invested heavily to be able to un-
dergo a concentration process, through which smaller or bolder groups were incorporated by others with greater financial stamina or a greater appetite for risk. This bonanza period was in-terrupted by a disastrous combination of factors, initiating a process of crisis; as of today, it is still unclear whether or not it has been overcome.
The ethanol crisis
After taking on a considerable amount of debt to carry out major in-vestments, the sector was surprised by a harvest break (2011/12) that derailed its growth. With a lower supply of sug-ar cane, the cost of raw materials went up and many plants began to operate below their milling capacity. Faced with this situation, companies in the sector that were facing difficulties were forced to prioritize cash recovery, post-poning the beginning of a new cycle for the renewal of sugar crops.
Like a vicious circle, without the re-newal of sugar plantations, sugar cane supply was compromised in the medi-um run. Because of this, these plants had to operate with idle operating ca-pacity above adequate levels, leading to a reduction in profitability. With cash
THE PROFITABIlITy OF THE SuGAR AnD ETHAnOl SECTOR DEPEnDS On PETROBRAS Antônio Carlos Kfouri Aidar*
Felippe Serigati**
1 The results of the survey were published by Valor Econômico (www.valor.com.br)
Articles

Special Edition Agroanalysis 31Articles
BRAzIlIAn ETHAnOl ExPORTS (BIllIOnS OF lITERS)
Source: uNICA
BRAzIlIAn SuGAR CAnE PRODuCTIOn (MIllIOnS OF TOnS)
Source: uNICA

32 Special EditionAgroanalysis
AnnuAl ACCRuED InFlATIOn: GEnERAl InDEx (IPCA) VS. GASOlInE AnD DIESEl OIl
* Accumulated up to October of 2013Source: IBGE
EVOluTIOn OF VHP SuGAR PRICES AnD HyDRATED ETHAnOl, BOTH In SP (BASE 100 = JAn/06)
Articles
Source: CEPEA

Special Edition Agroanalysis 33
flow still hampered and a steep stock of debt, several groups were excessively leveraged and were unable to obtain re-sources to carry out a new round of in-vestments, thus prolonging their crisis.
In addition to the sector’s internal problems, the profitability of hydrated ethanol was also negatively impacted due to the relatively more attractive sugar prices in the international market and the price readjustment policy ad-opted by Petrobras.
Petrobras and its gasoline price readjustment policy
Since 2010, Brazilian inflation has operated persistently at an interval be-tween the center of the target (4.5% p.a.) and its upper limit (6.5% p.a.). To avoid a rise in interest rates, the gov-ernment resorted to other alternatives to attenuate price expansion. Among other instruments, worth highlight-ing is the price adjustment policy for some of Petrobras’ products. Those oil by-products that have a greater weight in the IPCA (Brazilian Broadened Con-sumer Price), such as diesel oil and mainly gasoline, had their prices con-trolled. Other products, such as naph-tha and kerosene for aviation, which have lower weight in inflation, under-went more frequent readjustments.
As any modification in Petrobras’s product prices depends on the approv-al of the board of directors, and as the federal government is the company´s controlling shareholder, gasoline and diesel oil price adjustments were grant-ed in accordance with inflation; if it became necessary to hold back prices
to contain inflation, there was to be no adjustment. Although this policy has helped keep the evolution of the IPCA in check, the decision not to adjust pric-es for gasoline and diesel oil brought a variety of imbalances to the economy and to Petrobras itself:
• Cash deterioration at Petrobras due to incentives offered to the automotive industry, and an ac-cumulated growth of 35% in vehicle sales between 2009 and 2012. With a greater number of vehicles circulating, fuel demand consequently increased. As Petrobras had no authorization to readjust prices for part of its products, the company was un-able to expand investments and production.
• It was unable to expand invest-ments and production sufficient-ly to comply with this expanding demand. The solution found was to import gasoline to fulfill inter-nal consumption. Due to the lim-itation in price adjustments, the price of gasoline was lagging be-hind when compared to oil price variations in the international market. With this, Petrobras had to pay a higher price for the imported fuel, a price at which it could not sell the fuel in the domestic market. This mismatch negatively affected the compa-ny’s profitability.
• Loss of Petrobras market val-ue: leading to reduced company profitability, their shares lost a great deal of their value. In April 2010 Petrobras shares were traded at more than US$ 40.00
each in the New York Stock Ex-change; by the end of October, the share price had dropped to less than US$ 17.00. This loss in market value has compromised several investments, including those that would be necessary to make the oil pre-salt a reality for Petrobras;
• Deficit in the trade balance: due to a mixture of growing fuel im-ports and the decreased value of Brazilian exports, Brazil has recorded a deficit in its trade balance throughout 2013. In other words, the decision not to adequately adjust gasoline and diesel oil prices has contributed decisively to making the balance of payments a very fragile one in Brazil. This situation is especial-ly uncomfortable at a time when the expectation is to change the policy of the weak dollar, which will lead to a consequent flight of capital;
• Loss of profitability in hydrated ethanol: Petrobras’ decision to not readjust gasoline prices has also hampered the sugar energy sector. As hydrated ethanol is fuel that replaces gasoline, and the price of the latter has remained below international levels, etha-nol has stopped being a competi-tive alternative to gasoline. With the impossibility of selling etha-nol at a higher price, once again due to the decision to maintain gasoline price at levels below the worldwide market, this biofu-el will no longer be competitive and lose profitability.
Articles
“IF ETHAnOl HAD THE SAME RElATIVE PRICE
AS GASOlInE… MOST OF THE BRAzIlIAn FlEx
CAR OwnERS wOulD CHOOSE GASOlInE”

34 Special EditionAgroanalysis
OIl PRICE EVOluTIOn In THE InTERnATIOnAl MARkET (CORRECTED By THE ExCHAnGE RATE) AnD GASOlInE In THE ETHAnOl PRODuCInG REGIOnS (BASE 100 = JAn/06)
Source: IMF and ANP
Articles

Special Edition Agroanalysis 35
PRODuCTIOn EVOluTIOn AnD GASOlInE COnSuMPTIOn By BRAzIlIAnS (In MIllIOnS OF M3)
Source: ANP
PETROBRAS SHARES PRICE EVOluTIOn (PBR.A) In THE nEw yORk STOCk ExCHAnGE (nySE)
Source: NYSE
Articles

36 Special EditionAgroanalysis
In the case Petrobras has maintained the policy since 2006, there is a direct relationship between (i) the price of gasoline in the domestic market and (ii) variations of oil quotations in the international market, controlled by variations in the exchange rate, then on average a liter of gasoline would be sold in the Traditional Region at BRL 4.21 and in the Expansion Region at BRL 4.44. Assuming that the ratio of 0.7 between the ethanol and gasoline prices operates in these markets, a liter of ethanol would be sold, on average, at BRL 2.95 and BRL 3.11 respective-ly, in each region, that is, at 61% and 56% higher than occurred. These re-sults clearly suggest, on the one hand, that the contention policy for gasoline price readjustments has contributed to contain inflation but severely ham-pered the sugar energy sector.
The influence of gasoline price controls on ethanol prices
The simulations below will be pre-sented to evaluate the impact of the Petrobras price policy on ethanol prices.
Simulation 1: What would have been the price of gasoline that would allow the production of hydrated ethanol to be economically viable, considering the economic relationship of 70%?
Based on production costs compiled by PECEGE (Program of Continuing Education in Economics and Man-agement) from ESALQ/USP (Luiz de Queiroz College of Agriculture, from the University of São Paulo), it became possible to simulate what would be the sales price for gasoline at the pump of a gas station that would make the price of hydrated ethanol become econom-
ically viable. Based on data from the 2012/13 Harvest, this analysis was car-ried out in those states where ethanol production is the most traditional (São Paulo and Parana), as well as for areas for the expansion of this crop (Minas Gerais, Goiás, Mato Grosso do Sul and Mato Grosso).
According to the simulation results, for it to be economically feasible to market ethanol, on average, a liter of gasoline would have to be sold for BRL 2.81 in São Paulo and in Parana (Tra-ditional Region), and at BRL 3.10 in the Expansion Region. These values suggest that the price of ethanol is off by BRL 0.14 and by BRL 0.18 per liter in both regions, respectively.
Simulation 2: What would be the price of hydrated ethanol if the price of gasoline followed the price varia-tion for oil in the international market, and if Petrobras were not used to fight against inflation?
SIMulATIOn OF GASOlInE AnD ETHAnOl PRICES (BRl/lITER) BASED On THE 2012/13 HARVEST DATA (SIMulATIOn 1)
PRICE SIMulATIOn PRESuPPOSInG THAT GASOlInE wOulD HAVE Fully ACCOMPAnIED OIl PRICE VARIATIOnS AnD THE BRAzIlIAn ExCHAnGE RATE (SIMulATIOn 2)
*Source: PECEGE** Source: ANP
Source: ANP, Central Bank and IMF
REGIOnOperating
CostEconomic
Cost*Distribution
CostEcon. Viable
Gasoline PriceEcon Viable
Gasoline PriceEtanol price in 12/13 Harvest**
Gasoline Price in 12/13 Harvest**
Traditional $1.10 $1.30 $0.67 $1.97 $2.81 $1.83 $2.67
Expansion $1.07 $1.27 $0.90 $2.17 $3.10 $1.99 $2.83
Period
Traditional Area Expansion Area
Gasoline Ethanol Gasoline Ethanol
Observed Price
Simulated Price
Observed Price
Simulated Price
Observed Price
Simulated Price
Observed Price
Simulated Price
Sep-06 $2.44 $2.26 $1.32 $1.58 $2.58 $2.38 $1.71 $1.67
Sep-07 $2.40 $2.44 $1.11 $1.71 $2.45 $2.57 $1.41 $1.80
Sep-08 $2.41 $2.65 $1.29 $1.86 $2.51 $2.79 $1.59 $1.95
Sep-09 $2.39 $2.22 $1.32 $1.55 $2.47 $2.34 $1.53 $1.64
Sep-10 $2.46 $2.22 $1.44 $1.56 $2.53 $2.34 $1.62 $1.64
Sep-11 $2.67 $3.23 $1.89 $2.26 $2.84 $3.40 $2.00 $2.38
Sep-12 $2.63 $3.82 $1.77 $2.68 $2.80 $4.03 $1.93 $2.82
Sep-13 $2.72 $4.21 $1.75 $2.95 $2.89 $4.44 $1.95 $3.11
Articles

Special Edition Agroanalysis 37Articles
A new policy for price readjust-ments?
So far, The Board of Petrobras has kept control of the price of gasoline. But it will have to change, even if only after next year presidential election. This could represent good news for the sugar energy sector, especially if under this new arrangement, prices for these two fuels become more associated to variations of:
• Oil prices in the international market;
• The exchange rate; and• The anhydrous ethanol price.For this to become feasible, it is also
necessary that this price adjustment come about periodically, and especial-ly that there no longer be the need for prior approval by the company’s man-agement board, of which the federal government is the controlling partner. This condition, in addition to restoring the profitability of ethanol, would ease the burden on Petrobras’ cash flows and help it to recover its market value.
PRICE SIMulATIOn PRESuPPOSInG THAT GASOlInE wOulD HAVE Fully ACCOMPAnIED OIl PRICE VARIATIOnS AnD THE BRAzIlIAn ExCHAnGE RATE (SIMulATIOn 2) “THE PROFITABIlITy OF HyDRATED ETHAnOl
wAS AlSO nEGATIVEly IMPACTED DuE TO THE
RElATIVEly MORE ATTRACTIVE SuGAR PRICES
In THE InTERnATIOnAl MARkET AnD THE PRICE
READJuSTMEnT POlICy ADOPTED By PETROBRAS.”
* Director of Control at FGV Projetos
** Professor and researcher at FGV

38 Special EditionAgroanalysis
Recent increases in gas and shale oil production in the united
states had a significant effect on the ener-gy market, with substantial impact on the oil and natural gas exporting coun-tries forced to revise their strategies, ne-gotiating power and expected revenues. imports of these energy products by the united states, the world’s largest im-porter, were reduced by more than 30% between 2007 and 2013. having started 2006 at practically zero, by the end of 2012 general production was more than 1.5 million barrels per day. internally the effects were no less important, including (1) reduced prices for natural gas and its unlinking from oil prices, (2) a broade-ning in the share of natural gas in power generation, (3) exports of carbon sur-pluses to the european union, and (4) reductions in the cost of energy and the consequent enhancement of the compe-titiveness of the united states economy.
The outlook for the coming decade is that the existing shale formations in the country will make it possible to increase the autonomy of the United States regarding availability of oil and oil by-products, natural gas, and nat-ural gas liquids. United Sates energy security will be enhanced by decreased dependence on imported oil and natu-
ral gas, in the same way that techno-logical advances associated with the development of gas and shale oil will bolster new exploration potential, go-ing beyond the existing frontiers of oil and natural gas production.
Expanding the liquid fuel supply and reducing its cost in the United States means that the production of shale oil also has an impact on biofuel, especial-ly on the supply of corn ethanol. Eth-anol1 became a significant part of the country’s supply of liquid fuel begin-ning in 1980, when it began to receive subsidies to become more competitive vis-à-vis oil by-products due to (1) its relatively benign impact on the envi-ronment, (2) positive externalities re-garding employment and income gen-eration, and (3) its power to enhance energy security, reducing the country’s dependency on oil imports. Initially, the expansion of the liquid fuel supply thanks to shale oil would be expected to strengthen opposition to continuing subsidies to corn ethanol. Notwith-standing this, the complementariness of these two sources will tend to be priori-tized and gain importance in the frame-work of a solution of adaptation that will allow for sustainable evolution of energy policy in the United States.
Gas and shale oil emergence
Gas and shale oil are extracted from rocky formations rich in hy-drocarbons. Shale gas is dry natural gas made up mainly of methane (in a proportion greater than 90%), but in some formations there is wet natural gas. Shale oil is light conventional oil, with a low sulfur content, trapped in non-conventional formations, the re-duced porosity of which makes it diffi-cult to extract the hydrocarbons. The low permeability of shale leads to hav-ing it classified as a non-conventional reservoir for the production of gas or oil.
The economic feasibility of pro-ducing gas and shale oil in the United States resulted in the coming togeth-er of technological advances and in evolution in the market conditions for natural gas. The related progress of technologies for horizontal drilling and hydraulic fracturing made feasible the production base for the extraction of natural gas and petroleum from shale formations. At the same time, as an economic condition, the volatility observed in natural gas prices reached US$ 13 per million BTU in 2008.
SHAlE OIl AnD SuBSIDIES FOR CORn ETHAnOl PRODuCTIOn In THE unITED STATES Otavio Mielnik*
1 Throughout this article, ethanol refers to corn ethanol, unless otherwise specified.
Articles

Special Edition Agroanalysis 39Articles
Horizontal drilling allows for a broader reservoir exposure of a forma-tion compared with a vertical well, and is preferred as it is more profitable and has a smaller impact on the environ-ment. For the sake of comparison, 6 to 8 wells drilled horizontally have access to a volume that would be attainable by 15 vertical wells. A vertical well can cost up to US$ 800,000 (not includ-ing infrastructure), while a horizontal well can cost up to US$ 2.5 million or more (not including infrastructure). The structure for the production of natural gas and shale oil in the United States is fragmented, with over 2,000 oil and gas producers and 10,000 horizontal wells drilled.
Hydraulic fracturing, which stimu-lates production and creates additional permeability in shale formation corre-sponds to pumping a fracturing fluid, made up primarily of water, with addi-tives that help inject sand proppant in the fractures of a shale formation, under high pressure, so that the natural gas or oil will come out of the shale in eco-nomically feasible amounts. Hydraulic fracturing requires a large volume of water, using anywhere from 8 to 15 mil-lion liters of water per well, making it appropriate to warrant the water supply without competing with other purpos-
es. Part of that water will return to the surface along with the natural gas ex-traction, and is treated and recycled for a diversity of applications.
The main difference between the development of shale gas and the de-velopment of conventional gas is the extensive use of horizontal drilling and the steep volume of hydraulic fractur-ing. Hydraulic fracturing tends to have a broader impact, introducing a mech-anism for broader recovery of oil from conventional oil fields, which have been in decline throughout the world.
The decrease that each new well faces in the production of gas and oil during the first months of activity makes the production of shale gas and oil in the United States dependent on the intro-duction of the largest possible number of wells, due to this dramatic reduction. Drilling intensity is therefore a funda-mental characteristic for understanding the real evolution of shale gas and oil production in the United States, as well as its flexibility, i.e., its ability to adapt rapidly to changing circumstances. This is an aspect that is specific to the insti-tutional and entrepreneurial conditions of the United States, making the expan-sion of shale gas and oil development less probable in other parts of the world in the short run. However, even in the
United States, current levels of drilling may be difficult to maintain due to high prices and environmental opposition in densely populated areas. The concept of well density (given by the distance be-tween wells) also evolves and should re-main at a level that will not compromise productivity as a whole.
The United States accounts for 60% of the world’s horizontal drilling (which is more profitable than vertical drill-ing) and hydraulic fracturing necessary to release shale resources. In 2012, the number of wells that became productive in shale formations (higher than 4,000) exceeded the number of new oil and natural gas wells that same year in the rest of the world (excluding Canada).
Albeit with a small volume production since the beginning of the natural gas supply in the United States (where the first well in shale formation was drilled in 1821), shale gas was not deemed to be economically viable. In the 1980s there was a great expansion, especially in the Barnett Shale formation (Texas), with the use of horizontal drilling and hydraulic fracturing technologies. The specific development of these two tech-nologies at Barnett Shale was decisive for their application, later on, in other shale gas formations in the United States and Canada.

40 Special EditionAgroanalysis
In 2007, significant drilling activity began in part of the Bakken formations (North Dakota and Montana) in the United States and, in 2011, the Bakken production surprised experts with its production and the shale formations of Eagle Ford and Permian Basin began to emerge as participants in the unex-pected shale oil boom. Bakken, Eagle Ford and Permian Basin are the so called “Big Three” shale oil formations in the United States, although there is no precise assessment of their real size and effective recovery rate due to (1) the extremely low porosity of these for-mations and (2) the decline rates after the first months of production in each shale well.
All in all, the assessment of resourc-es and reserves is a dynamic process that is constantly changing, along with knowledge and technological develop-
ment. The Bakken formation reserves in 1995 were estimated at 151 million barrels, reaching in 2008 a volume of 3 to 4.3 billion barrels, and in 2013, 7.4 billion barrels. It is estimated that the potential of the Big Three shale for-mations is 100,000 producing wells. Considering this potential, the limit of drilling intensity will be reached in the second half of 2020.
In the United States, shale gas devel-opment and production are governed by the same system of federal, state and municipal laws that govern all aspects referring to exploitation, production and operation for conventional oil and gas. There are specific federal laws (for example, the Clean Water Act that deals on water quality) that address the environmental aspects for the develop-ment of shale gas.
“[GAS AnD SHAlE OIl
PRODuCTIOn In uSA
HAD A] IMPACT On THE
OIl AnD nATuRAl GAS
ExPORTInG COunTRIES
FORCED TO REVISE
THEIR STRATEGIES,
nEGOTIATInG POwER
AnD ExPECTED
REVEnuES.”
Articles

Special Edition Agroanalysis 41
Support for corn ethanol
The issue of subsidies for corn eth-anol has a history dating back to the 1980s, with support to corn ethanol producers US$ 0.54/gallon (US$ 0.142/liter) in the form of an import duty, which has the effect of reducing com-petitiveness in sugar cane ethanol im-ports from Brazil. At the beginning of 2004, fuel blenders for transportation received tax exemptions for each liter blended with gasoline, to offset anoth-er tax exemption applied to ethanol re-gardless of the country of origin. The Caribbean Basin Initiative (a reference for ethanol imported from countries in Central America and the Caribbean) corresponded to a 2.5% exemption in the import duty, provided that the volume of imports from such countries did not exceed 7% of ethanol con-sumption in the United States market the previous year. Ethanol is required to be dehydrated before being exported to the United States, which can be done in Jamaica, Costa Rica and El Salvador, where there are dehydrating plants.
Up until 2011, blenders received exemptions of US$ 0.45/gallon (US$ 0.12/liter), small producers received an additional exemption of US$ 0.10/gallon (US$ 0.03/liter) on the first 57 million liters (15 million gallons), and ethanol and pulp producers received an exemption of up to US$ 0.27/liter (US$ 1.01/gallon). It is estimated that in 2009, tax exemptions reduced fed-eral revenues by approximately US$ 6 billion, of which corn ethanol account-ed for US$ 5.16 billion and pulp etha-nol for US$ 50 million.
In 2005, the Energy Policy Act in-troduced the Renewable Fuel Standard (RFS), to be managed by the Envi-ronmental Protection Agency (EPA), setting forth indicative goals for the introduction of minimum ethanol consumption volumes. In the United States, the biofuel volume – the major-ity of which was ethanol blended with gasoline – should have reached 28.4 billion liters in 2012.
Articles
In December of 2007, the Energy Independence and Security Act (EISA) expanded the Renewable Fuel Stan-dard, specifying that consumption reach 136 billion liters of ethanol in 2022 and setting forth a purchase man-date for four categories of ethanol – 57 billion liters of corn ethanol, 16 billion liters of cellulosic ethanol, 11 billion liters of imported ethanol and 7.6 bil-lion liters of biodiesel, to be consumed annually over 15 years (up to 2022), in a blend acquired by the oil companies (refineries). To ensure compliance with the Renewable Fuel Standard, the EPA assigned an identification number (Re-newable Identification Number-RIN) to each gallon of biofuel, aimed at fol-lowing up on its production and mar-keting. Based on the volume of RINs, the quota for each company that re-fines, imports or blends biofuels with fossil fuels can be monitored by the EPA. In fact, the RFS is a system under which the parties involved must present credit to cover their obligations. These credits are the RINs, which operate like commodities that can be bought or sold like any other commodity. Each gallon of biofuel in the RFS generates an RIN, valid during the year it was generated as well as the following year. Although they are commercialized in private con-tracts, there are also markets for the RINs in which, since the beginning of 2013, there was a significant rise in the RIN price, which went from about US$ 0.0185/liter (US$ 0.07/gallon) at the beginning of January to over US$ 0.26/liter (US$ 1.00/gallon) at the beginning of July, indicating (1) the insufficiency of ethanol geared to blending with gas-oline, to comply with the mandate set forth by the EISA for 2013, and (2) possible speculation in the RIN mar-kets.
All in all, to comply with the man-date set forth by the EISA, oil compa-nies in the United States must acquire a volume of corn ethanol that is high-er (13.8 billion gallons) than would be necessary (13.4 billion gallons) to fulfill the levels of technical blends re-
quired by vehicle standards, reaching a limit or barrier in the blend (blend wall). Ethanol producers understand that they could overcome the differ-ence (400 million gallons) by alternat-ing the proportion of ethanol blend to fuel from 10% to 15%. This, neverthe-less, would cause harm to the engines. The refineries prefer to comply with the quotas laid out by the RFS, buy-ing the RIN credits from companies that have used more ethanol than the mandate established. As there were not that many RIN credits, their price went up triggering a rise in fuel prices in the country. Ethanol producers maintain that this increase is not related to the cost of ethanol.
The year 2008 was a landmark in the evolution of the liquid fuel supply in the United States. That year, ethanol production in the United States was the highest in the world, reaching 28.9 billion liters. Consumption was 30.4 billion liters, split between ethanol consumed in vehicles E85 (85% etha-nol and 15% gasoline) and the ethanol consumed as an additive to gasoline, to substitute for the chemical compound MTBE (methyl-tert-butyl-ether), used for the oxygenation of gasoline, and which was banned in 25 U.S. states for contaminating groundwater in sites where the water is collected for domes-tic use.
In 2013, there will be an estimated 52 billion liters (13.8 billion gallons) that could be purchased and blended with fuels by oil companies, a number expected to reach 57 billion liters (15 billion gallons) in 2015, at which time the volume of corn ethanol will have reached its limit under the Renewable Fuel Standard and remain constant up to 2022. The additional supply would eventually be integrated with cellulos-ic ethanol volumes, produced from a variety of forms of biomass (such as wood, vegetable residues, among oth-ers), along with advanced biofuels and biodiesel.
The 2008 global crisis nonetheless brought with it a break in the standard

42 Special EditionAgroanalysis
of use of individual automobiles in the United States. This change has had an impact on (1) production conditions in the country’s automotive industry and (2) a demand for fuel on the part of consumers. The entrance of compact and ever more efficient models made by German, Japanese and South Ko-rean companies led the United States automotive industry to proceed to a restructuring and to the eventual in-troduction of their own, more fuel-ef-ficient models. This fact alone, along with decreased use of automobiles in
the country, led to lower fuel consump-tion in 2013.
A drop in oil prices is not expect-ed in coming years, due in part to in-creased demand from Asia, while there is a strengthening of the sustainability trend in the automotive market, valu-ing efficiency in the new automobile models. This has enhanced or increased opposition to the EISA mandate, es-pecially in light of the difficulties that cellulosic ethanol has in attaining eco-nomic feasibility, as is expected to hap-pen between 2012 and 2017.
PRODuCTIOn OF CORn ETHAnOl In THE unITED STATES
Source: Energy Information Administration
Articles

Special Edition Agroanalysis 43
As a result, everything points to the fact that there will be a review of the vol-umes initially set forth in the mandate instituted by the Energy Independence and Security Act (EISA), in December of 2007, with the aim of adjusting the new supply of ethanol determined for the 2013-2022 period to the new demand for liquid fuels and the difficulties in the commercial implementation of cellulos-ic ethanol, without a greater impact on corn production.
Sustainability in shale oil production
The growing autonomy of the United States in the international oil and nat-ural gas market is linked to the growth of shale oil and gas production. The expectation is that the U.S. will become one of the main world oil producers and thus guarantee its energy security, with an impact on the development of alternatives that, in part, had the goal of fulfilling this need. Among the fun-damentals that have strengthened the
granting of subsidies and support to corn ethanol was the need to expand the country’s energy security. Notwith-standing this, environmental security is also a priority as part of those fun-damentals and ethanol continues to be relevant, for that purpose, in the supply of liquid fuel. It is worth emphasizing that the drilling intensity, a crucial con-dition to guarantee the levels of shale oil and natural gas production, may meet up with a limit in shale forma-tions that are presently under develop-ment in the United States.
An additional possible limit to sus-tainability in shale gas is related to its profitability, due to the indication that its production cost would be about US$ 6.00 to US$ 8.00 per million BTU, much higher than the present mar-ket value for natural gas in the Unit-ed States, which is around US$ 4.00 per million BTU. This strengthens the assumption that the supply of shale gas would be funded through the sale of natural gas liquids, extracted from shale gas and linked to oil prices.
Articles
“EVERyTHInG POInTS TO THE FACT THAT THERE wIll BE A
REVIEw OF THE VOluMES InITIAlly SET FORTH In THE MAnDATE
InSTITuTED By THE EnERGy InDEPEnDEnCE AnD SECuRITy ACT
(EISA), In DECEMBER OF 2007, wITH THE AIM OF ADJuSTInG THE
nEw SuPPly OF ETHAnOl DETERMInED FOR THE 2013-2022 PERIOD
TO THE nEw DEMAnD FOR lIQuID FuElS AnD THE DIFFICulTIES
In THE COMMERCIAl IMPlEMEnTATIOn OF CEllulOSIC ETHAnOl,
wITHOuT A GREATER IMPACT On CORn PRODuCTIOn.”
* Coordinator at FGV Projetos
Development of cellulosic ethanol
The fact that the economic feasibil-ity of cellulosic ethanol has not been reached within the term foreseen can-not become a decisive argument that plays against support for ethanol, due to the role that it could play in terms of environmental security, in the supply of liquid fuel. In addition to the tech-nological advances involved in its con-solidation, there is an economic, com-mercial and geopolitical advantage to be gained from developing it at a large scale, guaranteeing an additional mar-ket in the supply of clean energy.

44 Special EditionAgroanalysis
The world’s number 1 Vegetable Oil: Palm Oil
The Oil palm (elaeis Guineensis) has its ancient roots in africa, where
it grows wild in West africa and equa-torial africa. The oil-bearing fruits have been used as a food and energy source for millennia by ancient egyptians, and the peoples of africa through the ages. Palm oil is widely recognized as a versa-tile and nutritious vegetable oil, trans-fat free with a rich content of vitamins and antioxidants.
The oil palm fruit is unique in pro-ducing two oils: palm oil, a well-bal-anced healthy edible oil, is obtained from the fleshy mesocarp, and palm kernel oil comes from the seed. Palm oil can be used as cooking oil, marga-rine, milk fat replacer, soaps, plastics, candles, lotions, body oils, shampoos, skin care products, cleaning products, as a diesel substitute, and for many other food and industrial applications.
From the mid-1970s to the present day, palm oil has undergone a remark-able progress – from a relatively minor crop focused on local demand to the most widely grown fruit crop in the world and the most important vegeta-ble oil - worth approximately US$ 45 billion in annual sales to producers. Of the 17 major vegetable oils traded on
the international market, palm oil is the world’s leading traded and consumed edible oil. The palm oil complex (crude palm oil and palm kernel oil) account for more than 60% of the world’s net exported oils and fats (2011), up from just about 30% in the 1980s.
Total global oil palm production is expected to reach about 58 million tons by 2013/2014 (USDA estimate, November 2013). On around 8% of the land allocated to oil seed crops globally, oil palms provide almost one-third of the world’s total vegetable oil production. Palm oil is by far more efficient when compared to other veg-etable oils such as the second largest source of edible oils - soybeans. Palm oil trees are able to produce the same quantity of oil on just about 10% of the area required/planted for soybeans. Global soybean oil production is ex-pected to increase significantly during the 2013/2014 season. Planted on around 112 million hectares, global production should reach 48mn tons (FAO, November 2013).
The Top Players
Despite the dramatic growth seen in the worldwide palm oil industry over the past three decades, there has been very little change in the structure of
the top producers globally. For most of the 1970s and 1980s Malaysia was the biggest supplier of Crude Palm Oil (CPO), producing more than half of the world’s CPO output. Malay-sia’s production more than doubled between 1980 and 1990, while Indo-nesia started an unparalleled planta-tion expansion rally. From just 0.7mn tons of CPO produced in the 1980s, Indonesia overtook Malaysia to be-came the world’s top producer, and is expected to produce around 31 mil-lion tons in 2013/2014 (or 52% of global output). Today, both nations account for about 86% of world crude palm oil production.
Thailand, the third largest produc-er, increased its production base from just around 13,000 tons in 1980 to more than 1.6 million tons in 2012. Thailand is followed by Colom-bia with around 1mn tons (2012), and Nigeria with about 0.9mn tons (Source: FAO, November 2013).
The only CPO producing region where production has not seen any significant change has been in Africa. Nigeria, the biggest producer in the region, where smallholders account for more than 80% of total produc-tion, produces about 50% of its total annual consumption.
lEADInG THE wAy FOR SuSTAInABlE GROwTH OF THEGlOBAl PAlM OIl InDuSTRy Ralf A. Levermann*Juliano Paulo Mendes de Souza**
Articles

Special Edition Agroanalysis 45
In South America, where Colom-bia and Ecuador have recorded huge increases in output, Brazil remains a “palm oil” laggard. Although this na-tion of 200 million people offers mil-lions of hectares of degraded land, available for sustainable palm oil pro-duction, Brazil has barely increased lo-cal production over the past decades. The country’s current consumption vastly outstrips local supply (with an-nual consumption of 550,000 tons vs. production of 320,000 tons per an-num).
With almost 8 million tons of annual oil and fat (vegetable, marine and ani-mal) consumption, Brazil’s pent-up de-mand for palm oil is estimated to be at least one million tons once ample local palm oil supply is available.
Growth Industry
Global palm oil consumption is sup-ported by population growth and an increase in disposable income. The world’s population has risen by about 60%, to more than 7 billion people, since 1980. Over the same 30-year pe-riod, demand for edible palm oils has stimulated a more than tenfold increase in palm oil supply, to its current level of 58 million tons. Palm oil is poised
for major growth in the decades ahead. According to the United Nations, addi-tional global population growth of up to two billion people by 2050 is pos-sible (almost all of which would come from today’s so-called emerging mar-ket countries).
Demand for vegetable oils and fats is constantly growing due to rising in-come and population, particularly in populous countries such as India, Chi-na, Indonesia, Bangladesh, Pakistan, Nigeria, and Egypt, where it is predom-inately used in cooking. Emerging mar-kets in general already consume more than 75% of total global palm oil pro-duction. India and China, the two top consuming countries, account for more than one-third of total global palm oil imports.
More than 80% of global palm oil production is consumed in the food industry today. Rising food demand, coupled with growing demand for non-food uses, is likely to sustain the continued rapid growth in demand for palm oil in the foreseeable future. Global biofuel mandates and ener-gy-mix targets have developed into a new and second relevant force for further palm oil demand growth. The European Union’s Renewable Energy Directive (RED) alone mandates that “first generation” biofuels should have
6% renewable content (the target was recently reduced from the previous target of 10% in September 2013) in the final energy consumption in trans-port by 2020 - across the entire EU-27 membership zone. (In 2012, biofuels accounted for about 4.7 percent of transportation fuel within the EU, with biodiesel making up the lion’s share).
Palm oil is today a vitally important global commodity as a dietary com-ponent, as industrial material, and as biofuel.
Food & (Bio-)Fuel
Crude palm oil is orange-red in col-or before turning golden after being refined, bleached and deodorized. Nat-urally semi-solid, the oil is fractionated into a liquid olein and solid stearin to increase its versatility in food applica-tions. Olein is mostly used as cooking and frying oil. Stearin finds many ap-plications in solid fat formulations and is extensively used in food processing. Palm kernel oil is used to make special-ty fats for various food products. It is also an important raw material for the oleochemical industry:
Food Products: Palm Oil, Palm Ole-in, Palm Stearin, Palm Kernel Oil, Palm Kernel Stearin.
Articles
“DEMAnD FOR VEGETABlE OIlS AnD FATS IS
COnSTAnTly GROwInG DuE TO RISInG InCOME
AnD POPulATIOn, PARTICulARly In POPulOuS
COunTRIES SuCH AS InDIA, CHInA, InDOnESIA,
BAnGlADESH, PAkISTAn, nIGERIA, AnD EGyPT (...)”

46 Special EditionAgroanalysisArticles

Special Edition Agroanalysis 47
Non-Food Products: Palm Oil, Palm Olein.
About 80% of all oil palm product is used for food applications, while the other 20% is used in non-food appli-cations. Because of the higher market value of these non-food derived palm products, the non-food category is ex-pected to grow in importance. The non-food uses of palm oil and palm kernel oil can be classified into two categories; using the oils directly, or by processing them into oleo-chemicals (chemicals derived from oils or fats).
A High Efficiency Crop
On less than 10% of the land allo-cated to oil seed crops globally, the oil palm provides more than one-third of the entire global production of vegeta-ble oil. Gross margins per hectare are the highest in their class and no other crop in the oil seed complex provides so much revenue per hectare or can be produced more economically. Com-pared to other oil-bearing crops, such as soybeans, canola or sunflower, the oil palm has the lowest requirement for inputs of fuel, fertilizers and pesticides per ton of production.
The “natural” Growth Barrier
The best growing conditions for palm oil trees are to be found within a tight band around the equator, where more than 15 million hectares are cur-rently planted. The major plantation region is to be found in Southeast Asia, where further expansion might be-come more challenging in the future. Agricultural land availability in the established plantation areas of South-east Asia (where more than 90% of the past global palm plantation expansion took place) are rapidly diminishing (as in Malaysia) or at least appear to slow down in expansion rates (as in Indone-sia). In contrast, huge untapped and
degraded low-yielding land areas can be found in Africa but also in Brazil. The State of Pará alone, in the North of Brazil, offers approximately 4 million hectares of degraded and low yielding land areas that are highly suitable for sustainable large-scale palm oil devel-opments.
FGV Projetos estimates world palm oil consumption to increase to approx-imately 71 million tons by 2020, and about 81 million tons by 2025. (Source: FGV Projetos, November 2013, global palm oil demand, baseline assumptions for 2001-2010: +5.3% p.a., 2011 – 2020: +3.25% p.a., and 2021 – 2025: +2.75% p.a.)
According to FGV projections, an additional 3 million hectares would be required for future palm oil plantations by 2020, and about 5 million hectares by 2025 (equivalent to Malaysia’s cur-rent total palm oil plantations). The av-erage area for new palm oil plantations over the projected period (2013/2014 to 2025) would require an expansion rate of around 450.000 hectares an-nually. In contrast, if the increased de-mand were to be satisfied by the second most important oil bearing crop, soy-bean, an additional 50 million hectares of land would need to be cultivated by 2025.
Social Impact: A powerful Job Machine
Palm oil is among the most produc-tive and profitable of tropical crops and became an important commodity in furthering economic development as well as in securing a rising standard of living for the rural poor. “Booming commodity prices in recent years have trickled up through this labor-inten-sive system, helping to lift millions out of poverty,” a recent report by WWF on the palm oil industry found – with Malaysia and Indonesia providing the evidence. The palm oil sector in both countries directly employs an estimat-
ed 4.3 million workers. The industry also helped to create significant indi-rect employment along the palm oil supply chain. The “multiplier effect” is estimated to vary between 1-4 indirect jobs for every direct job created.
In Brazil, planted on degraded land that abounds in the State of Pará, oil palm could generate significantly more jobs and higher incomes for the rural population than the current dominant form of land use of low intensity cattle farming. Modern and fully integrat-ed large-scale palm oil undertakings should be able to create one direct worker job (for harvesting, plantation maintenance, etc.), plus two indirect jobs along the supply chain for every 7-10 hectares of palm oil trees plant-ed. This compares to other agricultural sub-sectors such as industrialized high tech soy production (one worker for every 200 hectares) or cattle ranching (one worker for every 350 hectares).
The palm oil industry offers enor-mous potential to create new jobs and wealth. With today’s palm oil prices, a 10-hectare family farmer, integrated into a modern palm oil agro-industrial cluster, could yield a net income worth more than 3,000 BRL (Brazilian Reais) per month, far more than the current minimum salary of 700 BRL common-ly paid in rural Pará State. In a region with above-average unemployment rates, an oil palm “family farmer” could move from low income into the middle class (measured by local stan-dards) within just six to eight years.
Sustainability: The Environment
Since the beginning of the Industri-al Revolution, the burning of non-re-newable fossil fuels that took millions of years to form contributed to the in-crease in the concentration of carbon dioxide in the world’s atmosphere. Fossil fuels being used right now are re-serves which are being depleted and are expected to run out one day.
Articles

48 Special EditionAgroanalysis
Palm oil is a renewable fuel resource and could become 100% carbon neu-tral. Unlike fossil fuels, the combustion of palm oil bio-fuels does not increase the level of carbon dioxide in the atmo-sphere as the palm oil is merely return-ing the same amount of carbon dioxide obtained earlier from the atmosphere through photosynthesis and the re-lease of oxygen to the atmosphere. The quantity of oxygen released by an oil palm, a perennial crop, far exceeds that produced by annual crops such as soy-bean or rapeseed.
No other crop in the world has such strict criteria for “sustainability” such as palm oil and the associated oil palm tree plantations. Brazil established one of the world’s strictest rural land use regulations. Companies aiming to de-velop new oil palm plantations, for ex-ample in the State of Pará, are required to compensate with one hectare of land planted for every one hectare of native forests for protection. All new oil palm plantations in Brazil must be developed on degraded land. The rehabilitation of degraded land offers significant carbon sequestration potential. Cultivating palm trees on degraded land means that they will massively absorb carbon dioxide during photosynthesis when forming its biomass throughout their life spans of 30-40 years or more.
Brazil: Potential to Lead the Way for a Sustainable Growth of the Global Palm Oil Industry.
The Brazilian government took sev-eral steps to foster the sustainable de-velopment of the Brazilian palm oil industry. With the introduction of tai-lor-made loans to family farmers (with
low interest rates and long amortiza-tion periods), the completion of the agro-ecological zoning for sustainable palm oil production, and the imple-mentation of “The Program for the Sustainable Production of Palm Oil” in May 2010, Brazil has set the stage for a new chapter in the development of the Brazilian palm oil sector and to reverse the current palm oil production deficit.
The worldwide unmatched frame-work of the new program seeks to of-fer to the local population a sustainable economic alternative to deforestation, preserve the native vegetation, and pro-mote the recovery of deforested and de-graded regions. New palm oil develop-ments are now prohibited on 96.3% of Brazil’s mainland and the clearance of native forests for palm oil plantations is now explicitly illegal. The develop-ment of new palm oil plantations are now restricted to the anthropized but zoned areas.
Ideal edaphoclimatic conditions, large extensions of degraded areas, strict but environment-friendly land use regulations and the availability of skilled labour and agricultural work-ers in general, could turn Brazil into a global Top-5 palm oil producer over the next 10 to 15 years.
Brazil’s strict environmental regula-tions, combined with the development of a truly sustainable, transparent and traceable palm oil industry, could even-tually put local producers at an advan-tage with its global peers when offering its crude oil products to global food and fuel producers, which are increas-ingly concerned about palm oil being associated with forest destruction.
OIl PAlM nuRSERy AT 4IG PAlMATECH, STATE OF PARá.
“BRAzIl: POTEnTIAl TO lEAD THE
wAy FOR A SuSTAInABlE GROwTH
OF THE GlOBAl PAlM OIl InDuSTRy.”
Articles
* Specialist in Agribusiness at FGV Projetos
** Specialist in Agribusiness at FGV Projetos

Special Edition Agroanalysis 49
OIl PAlM nuRSERy AT 4IG PAlMATECH, STATE OF PARá.
Articles
