sustainable development statistics, indicators & decision making reena shah division for...
TRANSCRIPT

Sustainable Development
Statistics, Indicators &
Decision MakingReena Shah
Division for Sustainable Development
United Nations Department of Economic and Social Affairs
(Trinidad, 27-31 October 2003)

Uses of statistics and indicatorsPolicy demands for statistics and indicatorsUsing statistics and indicators for decision-makingInformation pyramidPurposes of indicatorsCriteria for indicator selectionCSD list of indicatorsMDG list of indicatorsParticular issues with environmental data
Overview

Planning
Formulating laws, policies and regulations
Designing market instruments
Research and education
Media
Public participation
Uses of statistics and indicators

Policy demand for statistics and indicators (UNCED)
Chapter 40: Information for Decision-MakingPar. 40.6: Development of Indicators of Sustainable Development“ Countries at the national level and international governmental and
non-governmental organizations at the international level should develop the concept of indicators of sustainable development in order to identify such indicators……”
Par. 40.7: Promotion of the Global Use of Indicators“….The organs and organizations of the UN system … could provide
recommendations for harmonized development of indicators at the national, regional and global levels, and for incorporation of a suitable set of these indicators in common, regularly updated, and widely accessible reports and databases, for use at the international level, subject to national sovereignty considerations”

The CSD 3rd Session (1995) approved a 5 year Programme of Work on Indicators of Sustainable Development
Main Objective:A core list of indicators of sustainable
development accessible to decision-makers at the national level by the year 2001. Achieved by defining them, elucidating their methodologies and providing training and other capacity-building activities, as relevant.
Policy demand for statistics and indicators (CSD 3)

Strengthen national and regional information and statistical and analytical services relevant to sustainable development polices and programmes … (WSSD: X,129);Encourage and promote further work on indicators for sustainable development by countries at the national level … (WSSD: X,130,131);Develop information systems that make the sharing of valuable data possible … (WSSD:X,132 (b));Support countries, particularly developing countries in their national efforts to collect data that are accurate, long-term, consistent and reliable (WSSD:X,133 (a)).
Policy demand for statistics and indicators (WSSD)

Encourages further work on indicators for sustainable development by countries at the national level, including integration of gender aspects, on a voluntary basis, in line with national conditions and priorities (CSD 11 par.13)
Underscores that reporting to the CSD be guided by….effective use of indicators….. (CSD 11 par. 14d)
Policy demand for statistics and indicators (CSD 11-2003)

Recognition of problem (depends on some overview data)
Formulation of policy (implies further data needs)
Identification of solution (followed-up by more detailed data)
Implementation of control (supported by continued detailed data for monitoring)
Sustainable Development - decision-making and action

What are the priority issues?Which statistics/indicators are needed to measure the issues?Do the statistics/indicators exist?Are the data readily available?What are the data sources?How are the data collected?What is the data coverage?What is the periodicity of data collection?What is the quality of the data?
Using statistics and indicators in decision-making for sustainable development
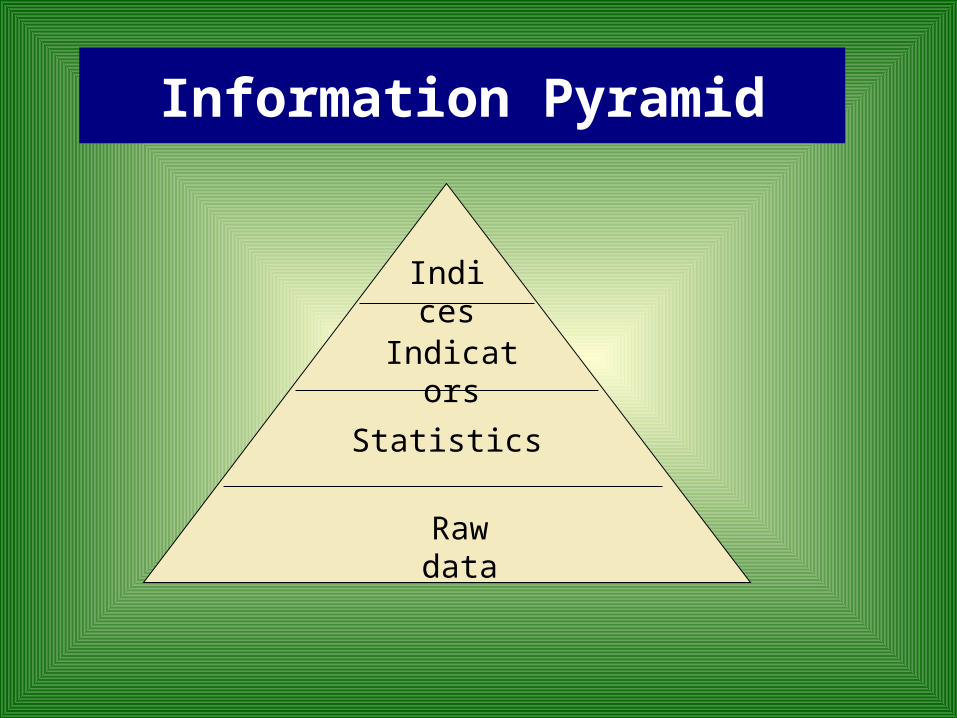
Information Pyramid
Indices
Indicators
Statistics
Raw data
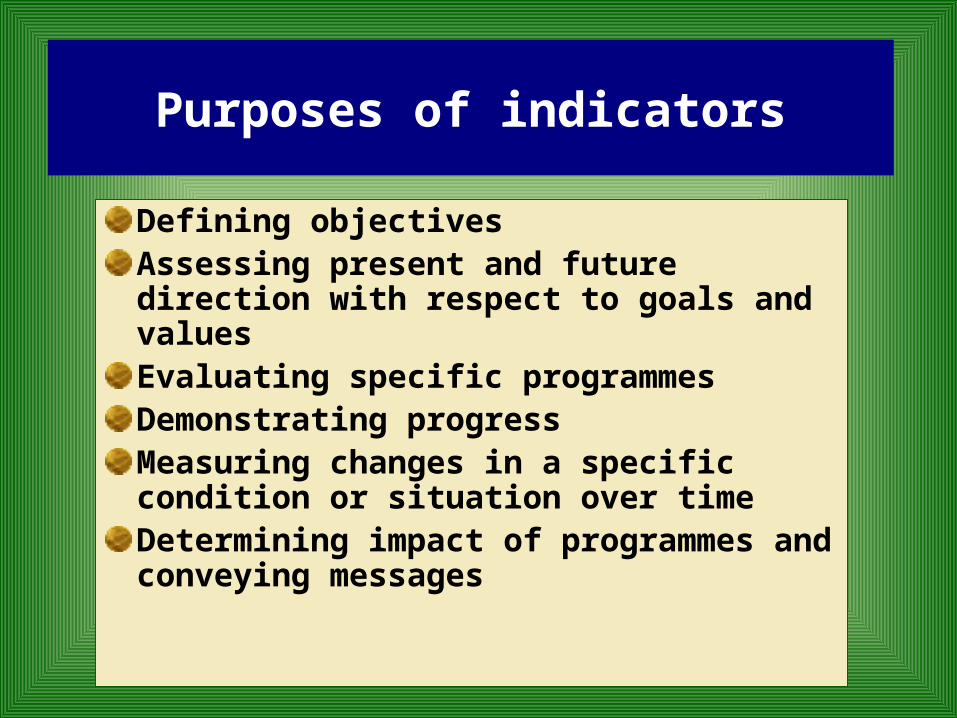
Defining objectivesAssessing present and future direction with respect to goals and valuesEvaluating specific programmesDemonstrating progressMeasuring changes in a specific condition or situation over timeDetermining impact of programmes and conveying messages
Purposes of indicators

Policy-relevantSpecificValidReliableSensitiveMeasurableUser-friendlyCost-effective
Criteria for indicator selection

Relevance
Timeliness
Accessibility
Clarity
Metadata
Accuracy
Completeness
Comparability
Methodological soundness
Efficiency
Coherence
Assessment of data quality

Frameworks and approaches
Lists of indicators
Focus of this presentation is on the Commission on Sustainable Development (CSD) list of indicators and the Millennium Development Indicators
Sustainable Development - frameworks and indicators

Core set of 58 indicators with flexible adaptation at the national levelDescription of themes and sub-themesMethodology sheet for each indicator by lead agencyGuidelines for national implementation
(http://www.un.org/esa/sustdev/natlinfo/indicators/isd.htm)
CSD Indicators of Sustainable DevelopmentGuidelines and Methodologies
Indicators of Sustainable Development

Framework
Dimension Theme Sub-Theme Indicators
Social
Environmental
Economic
Institutional

SOCIAL
Theme Sub-theme Indicator
EquityPoverty
Percent of Population Living below Poverty Line
Gini Index of Income Inequality
Unemployment Rate
Gender Equality Ratio of Average Female Wage to Male Wage
Health (6)
Nutritional Status Nutritional Status of Children
MortalityMortality Rate Under 5 Years Old
Life Expectancy at Birth
Sanitation Percent of Population with Adequate Sewage Disposal Facilities
Drinking Water Population with Access to Safe Drinking Water
Healthcare Delivery
Percent of Population with Access to Primary Health Care Facilities
Immunization against Infectious Childhood Diseases
Contraceptive Prevalence Rate
Education (36)Education Level
Children Reaching Grade 5 of Primary Education Adult
Adult Secondary Education Achievement Level
Literacy Adult Literacy Rate
Housing (7) Living Conditions Floor Area per Person
Security Crime (36, 24) Number of Recorded Crimes per 100,000 Population
Population (5) Population ChangePopulation Growth Rate
Population of Urban Formal and Informal Settlements
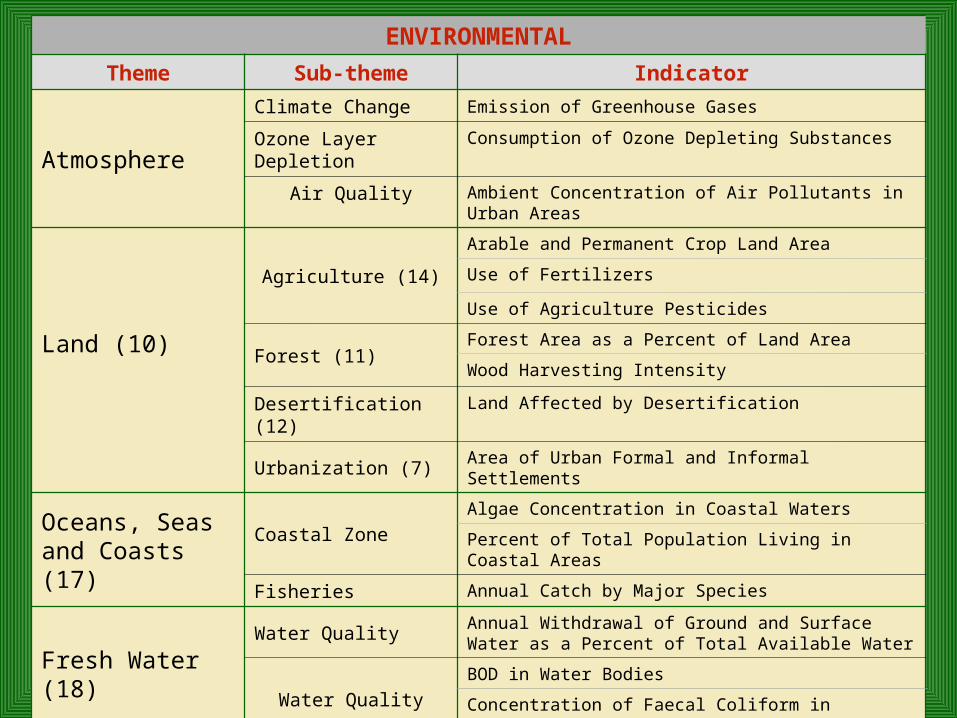
ENVIRONMENTAL
Theme Sub-theme Indicator
Atmosphere
Climate Change Emission of Greenhouse Gases
Ozone Layer Depletion Consumption of Ozone Depleting Substances
Air Quality Ambient Concentration of Air Pollutants in Urban Areas
Land (10)
Agriculture (14)
Arable and Permanent Crop Land Area
Use of Fertilizers
Use of Agriculture Pesticides
Forest (11)Forest Area as a Percent of Land Area
Wood Harvesting Intensity
Desertification (12) Land Affected by Desertification
Urbanization (7) Area of Urban Formal and Informal Settlements
Oceans, Seas and Coasts (17)
Coastal ZoneAlgae Concentration in Coastal Waters
Percent of Total Population Living in Coastal Areas
Fisheries Annual Catch by Major Species
Fresh Water (18)Water Quality
Annual Withdrawal of Ground and Surface Water as a Percent of Total Available Water
Water QualityBOD in Water Bodies
Concentration of Faecal Coliform in Freshwater
Biodiversity (15)Ecosystem
Areas of Selected Key Ecosystems
Protected Area as a % of Total Area
Species Abundance of Selected Key Species

ECONOMIC
Theme Sub-theme Indicator
Economic
Structure (2)
Economic PerformanceGDP per Capita
Investment Share in GDP
Trade Balance of Trade in Goods and Services
Financial Status (33)Debt to GNP Ratio
Total ODA Given or Received as a Percent of GNP
Consumption
and Production Patterns (4)
Material Consumption Intensity of Material Use
Energy Use
Annual Energy Consumption per Capita
Share of Consumption of Renewable Energy Resources
Intensity of Energy Use
Waste Generation and Management (19-22)
Generation of Industrial and Municipal Solid Waste
Generation of Hazardous Waste
Generation of Radioactive Waste
Waste Recycling and Reuse
Transportation Distance Traveled per Capita by Mode of Transport
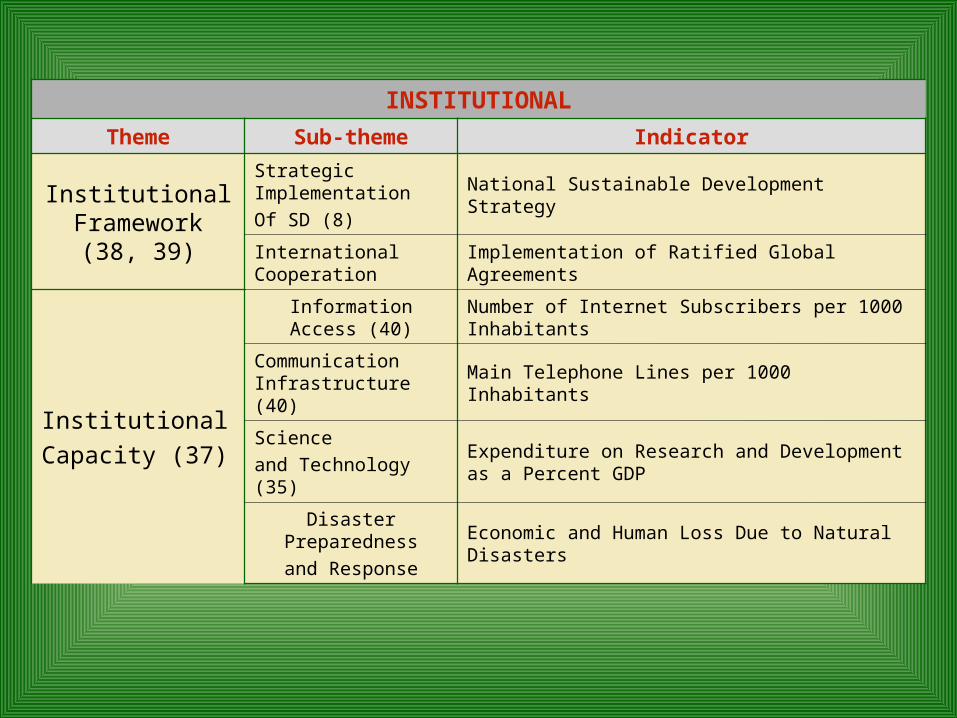
INSTITUTIONAL
Theme Sub-theme Indicator
Institutional Framework (38, 39)
Strategic Implementation
Of SD (8)National Sustainable Development Strategy
International Cooperation Implementation of Ratified Global Agreements
Institutional
Capacity (37)
Information Access (40) Number of Internet Subscribers per 1000 Inhabitants
Communication Infrastructure (40)
Main Telephone Lines per 1000 Inhabitants
Science
and Technology (35)Expenditure on Research and Development as a Percent GDP
Disaster Preparedness
and ResponseEconomic and Human Loss Due to Natural Disasters

Adopted by the United Nations General Assembly in 2000 by 189 nations
Commitment to a set of values and principles
8 Millennium Development Goals
18 Targets and 48 Indicators to be reported on by member states
(http://millenniumindicators.un.org/unsd/mi/mi_goals.asp)
Millennium Declaration

Lack of data and development capacity
International harmonization efforts
Further indicator development in “less advanced” substantive areas
Training in integrated information management
Challenges

DSD responding to challenges by:
Support for regional indicator networks Sustainable Development Information Management for SIDS in the Caribbean RegionCountry projectsDisaster reduction indicators in the context of sustainable development with ISDR & UNDP
DSD Focus

National Coordinating Mechanism & Focal PointGap analysis including a baseline assessment and priority selection through a consultative processAssessment of capacity-building needsAction PlanDissemination strategyPeriodic evaluation and re-assessment
Guidelines

Indicator is not always relevantLack of coordination at the national level Politically sensitive dataLack of resourcesDifferent definitions and/or classificationsLack of adequate time seriesDuplicate data sources and/or conflicting valuesSome examples from the CARICOM region
Particular issues in the compilation of environmental statistics and indicators