sustainable energy for developing countries · sustainable energy for developing countries:...
TRANSCRIPT
1
Sustainable energy for developing countries:
Modelling transitions to renewable and clean energy
in rapidly developing countries
Sustainable energy for developing countries
Modelling transitions to renewable and clean energy in rapidly developing countries
Frauke Urban
Sustainable energy for developing countries:

2
Copyrights © by Frauke Urban
ISBN 978-90-367-3703-6
3
RIJKSUNIVERSITEIT GRONINGEN
Sustainable energy for developing countries:
Modelling transitions to renewable and clean energy
in rapidly developing countries
Proefschrift
ter verkrijging van het doctoraat in de
Wiskunde en Natuurwetenschappen
aan de Rijksuniversiteit Groningen
op gezag van de
Rector Magnificus, dr. F. Zwarts,
in het openbaar te verdedigen op
vrijdag 27 februari 2009
om 16.15 uur
door
Frauke Urban
geboren op 10 juli 1980
te Bremen, Duitsland

4
Promotores: Prof. dr. H.C. Moll
Prof. dr. A.J.M. Schoot Uiterkamp
Copromotor: Dr. R.M.J. Benders
Beoordelingscommissie: Prof. dr. F. G. H. Berkhout
Prof. dr. P. P. S. Ho
Prof. dr. G. S. MacKerron

5
― We can‘t solve problems by using the same kind of thinking
we used when we created them.‖
Albert Einstein (1879-1955)
6
Preface
It all began in autumn 2000 when I started studying Geoecology at the University of
Bayreuth in Germany. Besides a very good education in the Natural and Environmental
Sciences, I learned to appreciate nature and the environment. A field-trip to Mexico sparked my
interest in developing countries.
The foundation for this thesis was laid in 2003/04, when I studied Environmental
Sustainability at the University of Edinburgh in Scotland, UK. I followed courses on
sustainability, which included lessons on renewable energy. The topic renewable energy
immediately attracted me and I decided to write my Master thesis about it. In 2004, I got into
contact with CEA, the Consultants on Energy and the Environment in Rotterdam, The
Netherlands. CEA was the project managing consultancy for the SIWERM-project on wind
energy implementation in the European Community. I joined as a trainee on wind energy policy
and conducted research for my M.Sc. thesis.
Working in the Netherlands, I was inspired by the Dutch interest in renewable energy and
was happy to begin my Ph.D. in December 2004 at the Center for Energy and Environmental
Studies IVEM at the University of Groningen. I received a scholarship funded by the Ubbo-
Emmius-Foundation. Henk Moll became my promotor and René Benders my daily supervisor
and co-promotor. Later on, Ton Schoot Uiterkamp became my second promotor. In my research
project, I modelled the possibilities and constraints for sustainable energy transitions and their
effects in rapidly developing countries with emphasis on China and India.
After thorough desk research, it was time to visit a rapidly developing country in practise.
I therefore attended the ICORE Conference on renewable energy in Hyderabad, India in early
2006 and also took some time to travel around India. In late 2006, I attended the Young
Scientists Conference YSC and the ESSP Global Environmental Change Conference in Beijing,
China and also meet my Chinese colleagues Zhang Xiliang and Wang Yu. This collaboration
turned into a research placement at the Institute for Nuclear and New Energy Technology INET
at Tsinghua University in Beijing, China where I worked for three months in 2007. Living and
working in China gave me a much deeper understanding of my research and the Chinese society
than any desk research could ever have done.
Back at the IVEM, I finalised my research in autumn 2008. Inspired by work on
developing countries and the link between energy and climate change, I got the chance to work
for the Climate Change and Development Group at the Institute of Development Studies IDS at
the University of Sussex in Brighton, UK as a research fellow as of October 2008.
For my time at the IVEM, I would particularly like to thank my (co)promotors Henk
Moll, René Benders and Ton Schoot Uiterkamp who supported me and motivated me throughout
my study, gave useful advice and enabled me to learn from their experience, knowledge and
skills (especially on modelling, thank you, René). I will be very happy to continue our
cooperation in the future. I am also grateful to other current and former IVEM staff members:
Anne Jelle Schilstra, Annemarie Kerkhof, Annemiek Huizinga, Dick van den Berg, Emiel
Elferink, Laurie Hendrickx, Michiel Berger, Michiel Hekkenberg, Nicole van Marle (many
thanks for everything), Niels Schenk, Sander Lensink, Sanderine Nonhebel, Sandra Bellekom,
Thomas Kastner, Winnie Gerbens-Leenes and special thanks to those who turned from
colleagues into friends.

7
I would also like to thank Peter Ho for initiating research contacts in China. Thanks to
Bas van Ruijven, Bert de Vries, Jeroen van der Sluijs and Detlef van Vuuren for the work on our
joint article.
For my time in China, I would like to thank Zhang Xiliang and Wang Yu for making it
possible for me to work in China and for our fruitful research cooperation and academic
exchange which is still continuing today. I am also thankful to Viktoria Mainow, Ling Zheng,
Claire Philippe and Daniel Rady without whom my stay in China would not have been as
enjoyable as it was. Thanks also to Humaira Sultana from YSC.
Most of all, I would like to thank my husband Johan. Johan has been very supportive
during the past four years, supporting my travelling between Oldenburg and Groningen,
approving my leaves to China and India, reading and constructively criticising my articles and
always believing in me and my capacities. Thank you also for coming to the UK with me. I
would also like to thank my parents Eva and Reinhold and my brother Arne for always believing
in me and for their great support.
Finally, I would like to express my special thanks to those organisations making it
financially possible for me to conduct my PhD: the Ubbo-Emmius-Fund from the University of
Groningen for my 4-year long scholarship which gave me the possibility to undertake this PhD,
the Stichting Groningen Universiteitsfonds, the World Meteorological Organisation WMO and
the Earth System Science Partnerships ESSP for enabling research and travelling in China.
A final thanks to those committed people around me who aim at living a sustainable low-
carbon lifestyle – you are my inspiration.
8
Contents
1. General introduction .........................................................................................................11
1.1 Introduction ...........................................................................................................11
1.2 Impacts of energy use ...........................................................................................11
1.3 Sustainable development, equity in the climate change debate and the role of
technology leapfrogging ......................................................................................................12
1.4 Energy transitions and the role of renewable and clean energy............................15
1.5 Energy modelling ..................................................................................................17
1.6 Aim and scope of the thesis ..................................................................................18
1.7 Structure of the thesis............................................................................................20
2. Modelling energy and development: an evaluation of models and concepts ...................22
Abstract .............................................................................................................................22
2.1 Introduction ...........................................................................................................22
2.1.1 Metrics for the comparison of economic activity .................................................23
2.2 Developing countries in global energy models .....................................................24
2.2.1 The Energy Ladder in the SRES models ..............................................................24
2.2.2 The Environmental Kuznets Curve in the SRES models ......................................27
2.3 Key issues of energy systems in developing countries .........................................29
2.3.1 Developments in the energy system .....................................................................31
2.3.1.1 From traditional to commercial fuels ..............................................................31
2.3.1.2 Electrification ..................................................................................................33
2.3.2 From economic development to energy use .........................................................35
2.3.2.1 Economic structural change and dematerialisation .........................................35
2.3.2.2 Income distribution .........................................................................................38
2.3.2.3 Informal economic systems ............................................................................39
2.3.3 The context of development..................................................................................41
2.3.3.1 Fossil energy resource depletion .....................................................................41
2.3.3.2 Climate change................................................................................................41
2.3.3.3 Urban air pollution ..........................................................................................42
2.4 Discussion and conclusion ....................................................................................42
2.5 Acknowledgements ...............................................................................................43
3. Modelling energy systems for developing countries ........................................................44
Abstract .............................................................................................................................44
3.1 Introduction ...........................................................................................................44
3.2 Characteristics of the energy systems and economies of developing countries ...45
3.2.1 Poor performance of the power sector and traditional fuels .................................45
3.2.2 Transitions from traditional to modern economies ...............................................47
3.2.3 Structural deficiencies in society, economy and energy systems .........................48
3.3 Energy model comparison ....................................................................................48
3.4 Results of the energy model comparison ..............................................................50
3.5 Discussion .............................................................................................................52
3.5.1 Discussion of model comparison and model groups ............................................52
3.5.2 Discussion of methodology...................................................................................54
3.6 Conclusions ...........................................................................................................55
3.7 Acknowledgements ...............................................................................................56
9
4. Renewable and low-carbon energy as mitigation options of climate change for China‘s
power sector ..............................................................................................................................57
Abstract .............................................................................................................................57
4.1 Introduction ...........................................................................................................57
4.2 Method ..................................................................................................................58
4.2.1 Description of PowerPlan .....................................................................................58
4.2.2 Modelling the Chinese power sector.....................................................................60
4.2.3 Story-lines and scenario-making...........................................................................61
4.3 Results ...................................................................................................................63
4.3.1 Results of the business-as-usual scenarios ............................................................63
4.3.2 Results of the renewable and low-carbon energy scenarios .................................64
4.3.3 Comparison of the scenarios .................................................................................65
4.4 Discussion .............................................................................................................68
4.4.1 Discussion of the method ......................................................................................68
4.4.2 Discussion of the results and implications ...........................................................68
4.5 Conclusion ............................................................................................................70
4.6 Acknowledgements ...............................................................................................71
5. Scenarios for renewable energy transitions in Beijing .....................................................72
Abstract .............................................................................................................................72
5.1 Introduction ...........................................................................................................72
5.2 Methodology .........................................................................................................73
5.2.1 Modelling with LEAP ...........................................................................................73
5.2.1.1 Final energy demand analysis .........................................................................74
5.2.1.2 Activity levels, energy intensity, emissions and demand costs ......................74
5.2.2 Modelling framework for Beijing .........................................................................75
5.2.2.1 Beijing .............................................................................................................75
5.2.2.2 Modelling the system ......................................................................................77
5.2.3 Scenario-making ...................................................................................................79
5.2.4 Data issues ............................................................................................................80
5.3 Results ...................................................................................................................81
5.3.1 Energy demand .....................................................................................................81
5.3.2 CO2 and other greenhouse gas emissions .............................................................84
5.3.3 Costs ......................................................................................................................85
5.3.4 Technology and policy implications .....................................................................86
5.4 Discussion .............................................................................................................89
5.4.1 Discussion of the method and data .......................................................................89
5.4.2 Uncertainties .........................................................................................................89
5.4.3 Discussion of the results .......................................................................................90
5.4.4 Recommendations .................................................................................................92
5.5 Conclusions ...........................................................................................................93
5.6 Acknowledgements ...............................................................................................94
6. Energy for rural India........................................................................................................95
Abstract .............................................................................................................................95
6.1 Introduction ...........................................................................................................95
6.2 Methodology .........................................................................................................98
6.2.1 Modelling with the Regional Energy Model REM ...............................................98
10
6.2.2 Modelling rural India ............................................................................................98
6.2.3 Scenario-making .................................................................................................101
6.2.4 Data issues ..........................................................................................................103
6.3 Results .................................................................................................................103
6.3.1 Primary energy use .............................................................................................103
6.3.2 GHG emissions ...................................................................................................105
6.3.3 Costs ....................................................................................................................106
6.4 Discussion ...........................................................................................................108
6.4.1 Discussion of method and data ...........................................................................108
6.4.2 Uncertainties .......................................................................................................108
6.4.3 Discussion of results ...........................................................................................109
6.4.4 Policy recommendations .....................................................................................111
6.5 Conclusions .........................................................................................................112
6.6 Acknowledgements .............................................................................................112
7. Conclusions .....................................................................................................................113
7.1 Introduction .........................................................................................................113
7.2 Energy systems of developing countries: characteristics and potential changes 113
7.3 Energy transitions in rapidly developing countries ............................................114
7.3.1 The Chinese power sector ...................................................................................115
7.3.2 Beijing‘s economy ..............................................................................................115
7.3.3 Rural residential India .........................................................................................115
7.4 Effects of sustainable energy transitions .............................................................115
7.4.1 Effects on the Chinese power sector ...................................................................115
7.3.2 Effects on Beijing‘s economy .............................................................................116
7.3.3 Effects on rural residential India .........................................................................117
7.5 The role of energy modelling for developing countries ......................................117
7.6 Overall conclusion and recommendations ..........................................................119
English summary ....................................................................................................................121
Nederlandse samenvatting .....................................................................................................126
Kurze Deutsche Zusammenfassung .......................................................................................132
List of abbreviations ...............................................................................................................133
References ...............................................................................................................................134
11
1. General introduction
1.1 Introduction
Energy is a vital commodity and is closely intertwined with climate change and
development. Energy is needed for basic human needs: for cooking, heating, lighting, boiling
water and for other household-based activities. Energy is also required to sustain and expand
economic processes like agriculture, electricity production, industries, services and transport. It
is commonly suggested that access to energy is closely linked with development and economic
well-being (e.g. DFID, 2002; IEA, 2002; WEC, 2000; WEC, 2001; WHO, 2006) and that
alleviating energy poverty is a prerequisite to fulfill the Millennium Development Goals (DFID,
2002; WHO, 2006).
Fossil energy resources are limited and fossil energy use is associated with a number of
negative environmental effects, therefore energy has become a major geo-political and socio-
economic issue. This development puts pressure on all countries around the world. The pressure
on developing countries may be even greater, because they are currently in the process of
development which requires higher energy resources for achieving higher living standards. High
population levels and high fossil fuel reliance increase this pressure even more. To meet energy
security, reduce pressure on fossil energy resources and to ensure a higher environmental quality,
the share of low-polluting renewable and clean energy should be enhanced.
1.2 Impacts of energy use
The Intergovernmental Panel on Climate Change IPCC (2007a:253) states that
―Currently, energy-related [greenhouse gas] GHG emissions, mainly from fossil fuel combustion
for heat supply, electricity generation and transport, account for around 70% of total emissions
including carbon dioxide, methane and some traces of nitrous oxide‖. It is well documented that
these emissions may increase the global temperature. Energy use has potentially significant
climate impacts, which are assumed to exceed the impacts from other sources like land-use and
other industrial activities. It is considered crucial to implement greenhouse gas (GHG) emission
reduction technologies for fossil fuel combustion processes, as they are considered the main
contributors to global climate change. The IPCC states a wide range of global and regional
effects of global climate change relevant for this research:
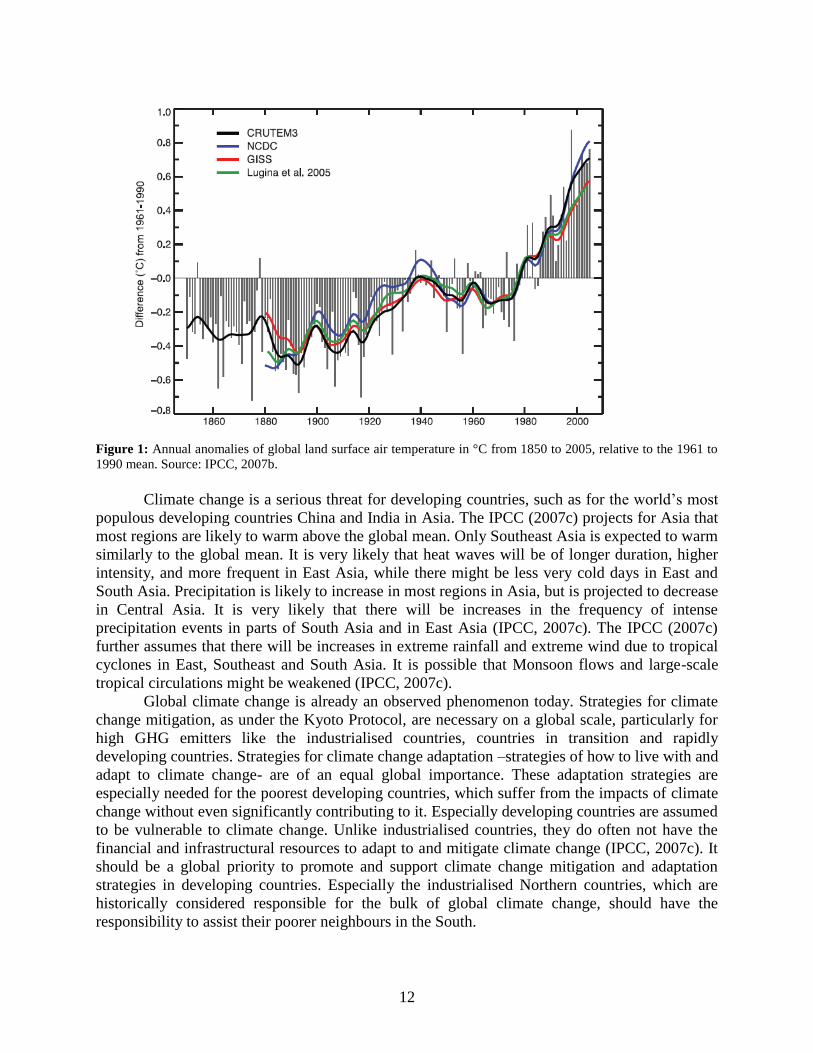
According to the IPCC (2007b), the global mean surface temperature has risen by 0.74°C
± 0.18°C between 1906 and 2005 as indicated in Figure 1. This increase has been particularly
significant over the last 50 years. From a global perspective, the IPCC (2007b) reports that they
found high increases in heavy precipitation events, while droughts have become more frequent
since the 1970s, especially in the (sub)tropics. There are also documentations about changes in
the large-scale atmospheric circulation and increases in tropical cyclone activity since the 1970s
(IPCC, 2007b).
12
Figure 1: Annual anomalies of global land surface air temperature in °C from 1850 to 2005, relative to the 1961 to
1990 mean. Source: IPCC, 2007b.
Climate change is a serious threat for developing countries, such as for the world‘s most
populous developing countries China and India in Asia. The IPCC (2007c) projects for Asia that
most regions are likely to warm above the global mean. Only Southeast Asia is expected to warm
similarly to the global mean. It is very likely that heat waves will be of longer duration, higher
intensity, and more frequent in East Asia, while there might be less very cold days in East and
South Asia. Precipitation is likely to increase in most regions in Asia, but is projected to decrease
in Central Asia. It is very likely that there will be increases in the frequency of intense
precipitation events in parts of South Asia and in East Asia (IPCC, 2007c). The IPCC (2007c)
further assumes that there will be increases in extreme rainfall and extreme wind due to tropical
cyclones in East, Southeast and South Asia. It is possible that Monsoon flows and large-scale
tropical circulations might be weakened (IPCC, 2007c).
Global climate change is already an observed phenomenon today. Strategies for climate
change mitigation, as under the Kyoto Protocol, are necessary on a global scale, particularly for
high GHG emitters like the industrialised countries, countries in transition and rapidly
developing countries. Strategies for climate change adaptation –strategies of how to live with and
adapt to climate change- are of an equal global importance. These adaptation strategies are
especially needed for the poorest developing countries, which suffer from the impacts of climate
change without even significantly contributing to it. Especially developing countries are assumed
to be vulnerable to climate change. Unlike industrialised countries, they do often not have the
financial and infrastructural resources to adapt to and mitigate climate change (IPCC, 2007c). It
should be a global priority to promote and support climate change mitigation and adaptation
strategies in developing countries. Especially the industrialised Northern countries, which are
historically considered responsible for the bulk of global climate change, should have the
responsibility to assist their poorer neighbours in the South.
13
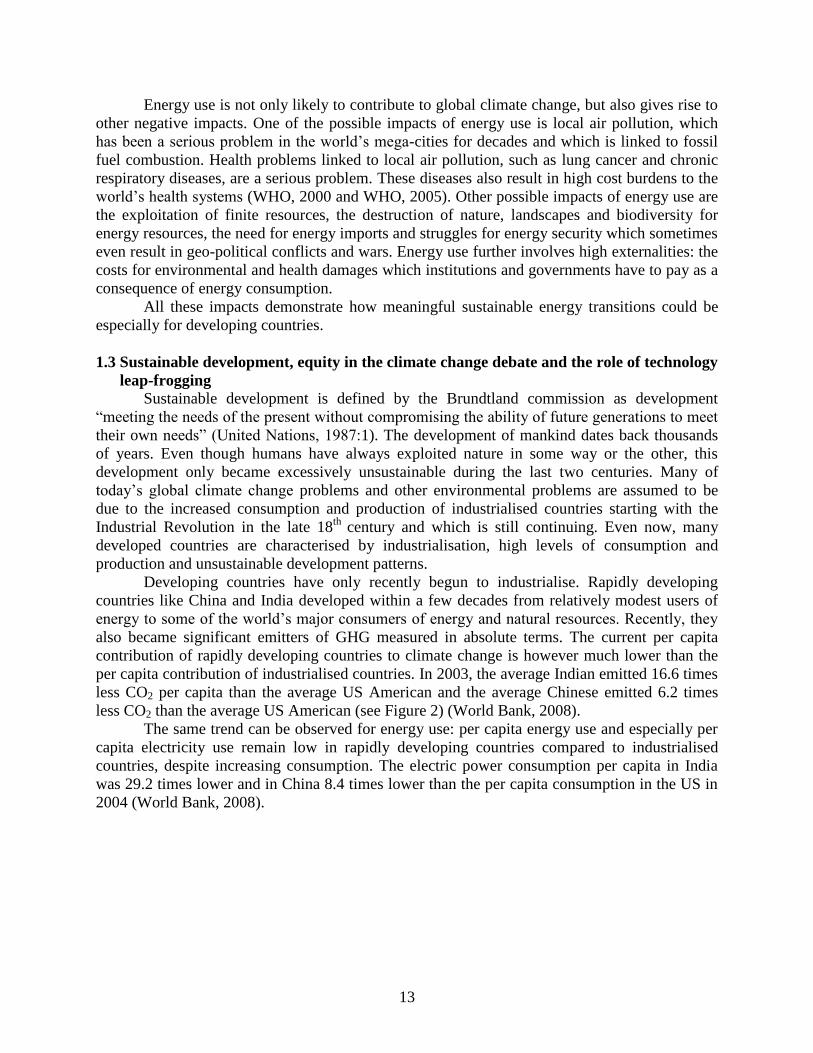
Energy use is not only likely to contribute to global climate change, but also gives rise to
other negative impacts. One of the possible impacts of energy use is local air pollution, which
has been a serious problem in the world‘s mega-cities for decades and which is linked to fossil
fuel combustion. Health problems linked to local air pollution, such as lung cancer and chronic
respiratory diseases, are a serious problem. These diseases also result in high cost burdens to the
world‘s health systems (WHO, 2000 and WHO, 2005). Other possible impacts of energy use are
the exploitation of finite resources, the destruction of nature, landscapes and biodiversity for
energy resources, the need for energy imports and struggles for energy security which sometimes
even result in geo-political conflicts and wars. Energy use further involves high externalities: the
costs for environmental and health damages which institutions and governments have to pay as a
consequence of energy consumption.
All these impacts demonstrate how meaningful sustainable energy transitions could be
especially for developing countries.
1.3 Sustainable development, equity in the climate change debate and the role of technology
leap-frogging
Sustainable development is defined by the Brundtland commission as development
―meeting the needs of the present without compromising the ability of future generations to meet
their own needs‖ (United Nations, 1987:1). The development of mankind dates back thousands
of years. Even though humans have always exploited nature in some way or the other, this
development only became excessively unsustainable during the last two centuries. Many of
today‘s global climate change problems and other environmental problems are assumed to be
due to the increased consumption and production of industrialised countries starting with the
Industrial Revolution in the late 18th
century and which is still continuing. Even now, many
developed countries are characterised by industrialisation, high levels of consumption and
production and unsustainable development patterns.
Developing countries have only recently begun to industrialise. Rapidly developing
countries like China and India developed within a few decades from relatively modest users of
energy to some of the world‘s major consumers of energy and natural resources. Recently, they
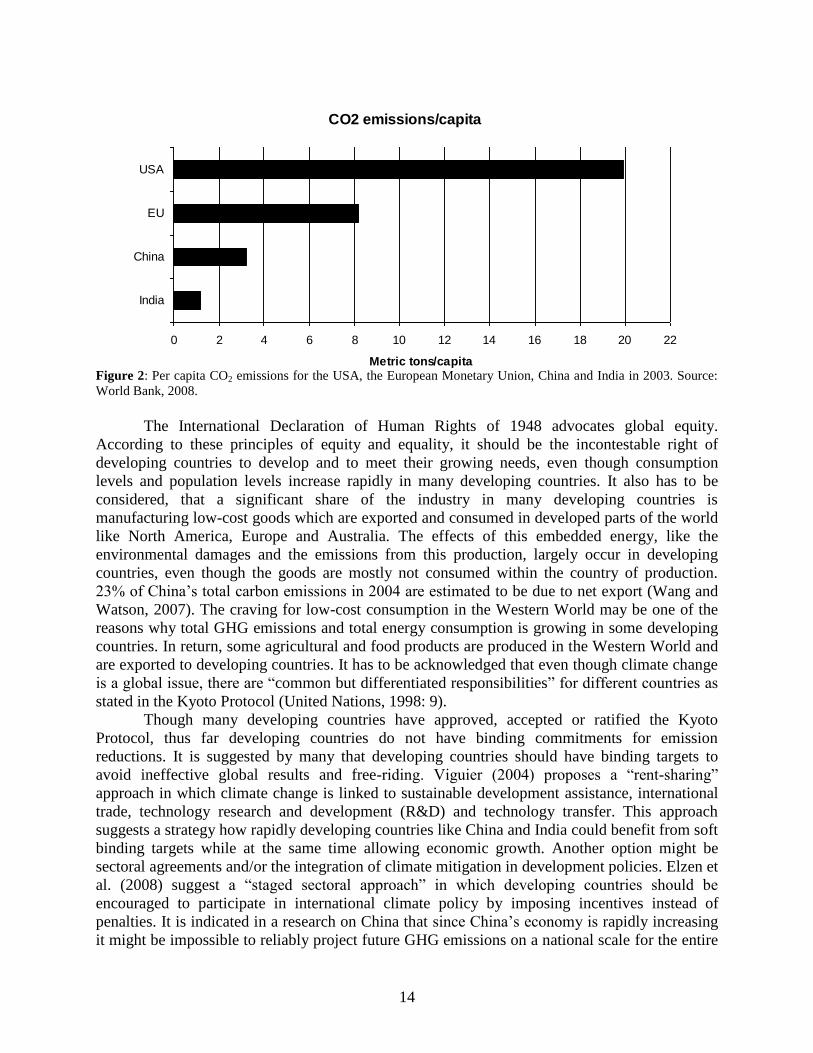
also became significant emitters of GHG measured in absolute terms. The current per capita
contribution of rapidly developing countries to climate change is however much lower than the
per capita contribution of industrialised countries. In 2003, the average Indian emitted 16.6 times
less CO2 per capita than the average US American and the average Chinese emitted 6.2 times
less CO2 than the average US American (see Figure 2) (World Bank, 2008).
The same trend can be observed for energy use: per capita energy use and especially per
capita electricity use remain low in rapidly developing countries compared to industrialised
countries, despite increasing consumption. The electric power consumption per capita in India
was 29.2 times lower and in China 8.4 times lower than the per capita consumption in the US in
2004 (World Bank, 2008).
14
CO2 emissions/capita
0 2 4 6 8 10 12 14 16 18 20 22
India
China
EU
USA
Metric tons/capita
Figure 2: Per capita CO2 emissions for the USA, the European Monetary Union, China and India in 2003. Source:
World Bank, 2008.
The International Declaration of Human Rights of 1948 advocates global equity.
According to these principles of equity and equality, it should be the incontestable right of
developing countries to develop and to meet their growing needs, even though consumption
levels and population levels increase rapidly in many developing countries. It also has to be
considered, that a significant share of the industry in many developing countries is
manufacturing low-cost goods which are exported and consumed in developed parts of the world
like North America, Europe and Australia. The effects of this embedded energy, like the
environmental damages and the emissions from this production, largely occur in developing
countries, even though the goods are mostly not consumed within the country of production.
23% of China‘s total carbon emissions in 2004 are estimated to be due to net export (Wang and
Watson, 2007). The craving for low-cost consumption in the Western World may be one of the
reasons why total GHG emissions and total energy consumption is growing in some developing
countries. In return, some agricultural and food products are produced in the Western World and
are exported to developing countries. It has to be acknowledged that even though climate change
is a global issue, there are ―common but differentiated responsibilities‖ for different countries as
stated in the Kyoto Protocol (United Nations, 1998: 9).
Though many developing countries have approved, accepted or ratified the Kyoto
Protocol, thus far developing countries do not have binding commitments for emission
reductions. It is suggested by many that developing countries should have binding targets to
avoid ineffective global results and free-riding. Viguier (2004) proposes a ―rent-sharing‖
approach in which climate change is linked to sustainable development assistance, international
trade, technology research and development (R&D) and technology transfer. This approach
suggests a strategy how rapidly developing countries like China and India could benefit from soft
binding targets while at the same time allowing economic growth. Another option might be
sectoral agreements and/or the integration of climate mitigation in development policies. Elzen et
al. (2008) suggest a ―staged sectoral approach‖ in which developing countries should be
encouraged to participate in international climate policy by imposing incentives instead of
penalties. It is indicated in a research on China that since China‘s economy is rapidly increasing
it might be impossible to reliably project future GHG emissions on a national scale for the entire
15
economy; therefore sectoral approaches might need more attention (Yamin, 2007). Other
research suggests that from an economic perspective, national GHG reduction targets are not
likely to pose an excessive burden on China (Zhang, 2000). International climate negotiations
such as at the UNFCCC conference in Bali 2007 show the importance of increasing the
participation of developing countries under the next climate agreement of the post-2012 era.
The very fact that developing countries develop should not be contestable. However, the
way in which developing countries develop may be debated. There are a number of options to
enable a more sustainable development, and renewable and clean energy are one of these
options. There are thus means for developing countries to avoid the ―dirty path‖ of development
which today‘s industrialised countries followed and instead to develop more sustainably by using
the latest climate- and environment-friendly technologies. This process is often referred to as
technological leapfrogging.
Technological leap-frogging is assumed to play an important role in the growth of
today‘s developing countries as it should give access to modern technologies and to innovation
enabling a sustainable growth. The Kyoto Protocol incorporates this approach to equity in its
Clean Development Mechanism (CDM) (United Nations, 1998), although developing countries
recently criticised that the CDM does not meet these goals. The use of the CDM can in principle
enable developing countries to receive modern technology for sustainable development from
industrialised countries while industrialised countries in return receive certified emission
reduction credits (CERs) to offset their emission reduction obligations. Innovation and
technological leap-frogging might play a significant role in the coming decades and might
change energy systems significantly and rapidly. Innovation and leap-frogging might also lead to
―jumping over‖ potentially polluting periods, like the coal era during the Industrial Revolution
which Europe and North America had to go through. Developing countries may have a chance to
avoid such periods due to cleaner and more advanced technologies. Predicting the future of
energy systems in rapidly developing countries involves risks, because of the uncertainty of the
implementation of innovative technologies that could enable the leap-frogging process.
1.4 Energy transitions and the role of renewable and clean energy
Energy transitions are usually changes in energy use, energy quantity and energy quality.
Bashmakov‘s three laws of energy transitions indicate that energy transitions are often driven by
long-term energy costs to income stability (the predominant energy form becomes too
expensive), by improving energy quality and by growing energy productivity and decreasing
energy intensity (Bashmakov, 2007).
Sustainable energy transitions can be defined as shifts from a country‘s economic
activities based on fossil fuels to an economy based partially on renewable and cleaner low-
carbon energy. This means that substitutions take place from fossil fuel-based technologies to
cleaner technologies. Such transitions can take place in every sector of a country‘s or a region‘s
economy. Sustainable energy transitions are likely to open up new possibilities for developing
countries to achieve higher development and higher living standards while at the same time
safeguarding energy resources, the environment and human health.
The concept of the ‗Trias Energetica‘ was developed in the Netherlands by Lysen (1996)
as a three-step strategy to achieve such energy transitions: 1. by reducing energy use, 2. by
introducing renewable energy, 3. by using fossil fuels efficiently. This thesis acknowledges the
importance of all three options, but focuses on the introduction of renewable and clean energy.
16
Renewable energy comes from renewable resources, such as sun, water and wind, which
are abundant and globally available. Renewable energy technologies are close to zero-carbon
technologies. They are usually climate-friendly and environment-friendly. Unlike fossil fuels,
renewable energy technologies do not emit GHG emissions during energy generation. If the
complete life cycle of renewable energy technologies is taken into account, there will be GHG
emissions from the production, transport and waste phases. These GHG emissions are
substantially below the GHG emission of fossil fuels. Modern renewable energy sources are also
not likely to contribute to local air pollution or to serious health problems.
Energy transitions can be achieved through the use of clean energy sources. Clean energy
sources are defined as low-carbon energy sources which emit less GHG than conventional coal
and oil, such as a.o. natural gas, compressed natural gas (CNG), liquid petroleum gas (LPG), and
nuclear energy. It has to be noted that the term ―clean‖ energy actually describes less polluting
energy, keeping in mind that there is no completely clean energy. Renewable energy can
negatively impact the environment too considering its complete lifecycle as mentioned earlier,
though not to the same extent as other energy sources. Despite this fact, the term clean energy is
commonly used in energy-related literature.
Renewable and clean energy can enhance energy security and reduce the exploitation of
natural resources. Dependency on energy imports may decrease and natural resources can be
safeguarded. Renewable and clean energy can also support energy security in rural areas. In
contrast to most conventional fossil energy, renewable energy and some clean energy (e.g. LPG)
can be used locally in areas where there is no grid connection and where people rely on
traditional biofuels like fuel wood, dung and agricultural residues. The quality of life of the local
population might be increased due to modern renewable and clean energy, as these energy
sources may be used for lighting, cooking, heating, water boiling and for running electronic
devices such as radios and irrigation pumps. The time spent for collecting traditional fuels or
working with manpower can thereby be reduced; the efficiency of energy services usually
increases and negative health impacts are likely to decline. The usage of traditional biofuels is
considered to have high impacts on health. They are associated with pneumonia, chronic
respiratory disease, lung cancer and adverse pregnancy outcomes due to exposure to indoor air
pollution as well as body deformations due to the transport burden of fuel wood collection
(WHO, 2000; WHO, 2005; WHO, 2006). The World Health Organisation WHO reports that
4.7% of all deaths in least developed countries could be due to traditional solid fuel use (WHO,
2000). According to the WHO (2005), 1.6 million people -mainly women and children- are
likely to die every year, because of exposure to indoor air pollution from traditional biofuels.
Introducing modern renewable and clean energy sources as a replacement for traditional biofuels
is likely to increase the health of the population in developing countries.
There is a high potential for renewable energy world-wide (Hoogwijk, 2004). However,
only a small percentage of this potential is exploited so far (Hoogwijk, 2004). The technologies
for energy transitions are commercially available world-wide. The IPCC further reports that
transitions to low-carbon economies have begun, also in developing countries (IPCC, 2007a).
There are however a number of main barriers which limit the growth of renewable
energy: economic, political, social, environmental, technical and geographic barriers. Those
considered the most relevant ones are briefly listed below:
Economic barriers: There can be high investment costs and high generation costs for
renewable energy which makes it difficult to compete with highly-subsidised fossil fuel
17
costs. These high costs are considered to exist mainly due to insufficient financial policies
and low penetration rates.
Political barriers: These are likely to occur due to missing supportive governmental policies
and the favouring of fossil fuels due to economic and/or geo-political reasons.
Social barriers: Social conflicts may occur concerning the evacuation and relocation of the
local population for large-hydropower dams, like at the Three-Gorges-Dam in China where
1.4 million people were relocated and another 4 million people might have to be evacuated
within the next decade according to Xinhua (2007a). There is the NIMBY-effect (Not In My
BackYard) for wind energy; and there is social opposition to first-generation biofuels partly
due to the competition of land for biofuel crops and food crops. The opposition against first-
generation biofuels has been steadily growing and reached its most recent peak in April 2008
concerning the debates about a global food crisis. This debate is spurred by riots over
increased food prices in some of the world‘s poorest countries like Haiti and Burkina Faso,
but also in Egypt, Mexico and India. Other renewable energy sources such as small-
hydropower, solar energy, geothermal energy and biogas from agricultural residues are likely
to have lower social barriers.
Environmental barriers: There might be a range of high environmental impacts for large-
hydropower like the flooding of creeks and canyons, the decrease in water flow speeds, more
frequent erosion, more frequent landslides and increased water pollution like at the Three-
Gorges-Dam (Xinhua, 2007b) and a potential impact in earthquake-prone regions.
Greenhouse gas emissions from hydropower reservoirs are also a problem; the exact
magnitude of these emissions remains uncertain (Fearnside, 2002; Rosa et al., 2004). Life
cycle analysis however indicates that these emissions are comparable to the emissions from
other renewable energy technologies and are far below the emissions of fossil fuel power
plants (Evans et al., 2008). Fragmented development or degradation of the landscape is often
associated with wind turbines. Conflicts arise concerning land-use for first-generation
biofuels. Other renewable energy sources such as small-hydropower, solar energy,
geothermal energy and biogas from agricultural residues are likely to have lower
environmental barriers.
Technical barriers: Possible barriers are low outputs and fluctuating outputs, need for back-
up capacity and difficulty associated with the storage of power from renewable energy.
Substantial research is currently going on into storage possibilities. Access to low-carbon
technology is also considered a major obstacle for developing countries.
Geographic barriers, both physical and spatial: Renewable energy sources depend on natural
resources like wind, water, sun and land. The availability of these natural resources varies
locally. Renewable energy technologies cannot be used in places where these natural
resources are not available or not sufficiently available. There may not be enough land for
first-generation biofuel production or not enough wind for wind energy production in some
areas.
Clean energy sources such as natural gas, CNG and LPG are mostly competitive compared to
conventional fossil fuels and do not usually suffer from the above described barriers. Nuclear
energy tends to be associated with concerns a.o. about safety, environmental risks, health risks,
social resistance, nuclear proliferation and high costs (e.g. Lee et al., 2007; NEA, 2002). While it
is suggested in the IEA World Energy Outlooks 2006 and 2007 that nuclear power might play an
increased role in the future in mitigating climate change and increasing energy security (IEA,
18
2006; IEA, 2007), some environmental organisations like Greenpeace repeat the risks and costs
of nuclear power (Greenpeace 2006a; 2006b).
Despite the discussed barriers, renewable energy is globally being implemented at a high
growth rate. Due to its rapid implementation time, renewable energy may also avoid carbon lock-
ins and path dependency. Implementing renewable energy technology today may provide
sustainable energy quickly and may avoid lock-in effects, such as dependence on coal power
plants for decades. Renewable and clean energy are therefore globally considered as viable
options for sustainable energy transitions.
1.5 Energy modelling
Energy transitions can be analysed, planned and managed by the use of energy models.
Energy models are planning tools for exploring the future of the global and regional energy
setting and the effects of energy use on the human and natural environment (Chapter 3).
Scenario-making is a method to simulate the consequences of energy use for regions and
countries given different future pathways. Energy models were first developed in the 1970s as a
result of the increasing availability of the personal computer and the increasing environmental
awareness due to a.o. the Club of Rome and the first oil crises. Most of the energy models were
built and used by industrialised countries, so that the assumptions about energy systems of
developing countries were mainly based on experience from the energy systems of industrialised
countries. It was therefore assumed that the energy systems of developing countries would
behave like those of industrialised countries (Shukla, 1995; Chapter 3). It was further assumed,
that the present-day development trajectories for developing countries would be similar to the
historic development trajectories in industrialised countries, which in reality is not the case.
Especially rapidly developing countries like China, India, Brazil and South Africa may defy in
many ways the industrial countries´ perception of development, which tends to be largely based
on their own industrialisation. Technological leap-frogging, ambiguity towards different
trajectories of development, significant regional and income-related differences between
consumption patterns in developing countries are issues which played no role or only marginal
roles in the development of today‘s industrialised countries. For energy modelling, trends for
developing regions were often derived from those of industrialised regions and extrapolated to
low-income ranges. What seems to be a fair modelling technique may nevertheless result in
models biased towards industrialised countries, potentially leading to incorrect interpretations of
the energy systems of developing countries. Still today, many well-known models like those of
the IPCC‘s Special Report on Emission Scenarios (SRES) tend to be built by and predominantly
for industrialised countries and tend to be seldom specifically made for use in developing
countries. There is thus a need to adapt energy models to properly describe the energy future of
developing countries.
There is a great variety of energy models and energy modelling approaches for various
purposes. Models can vary by their regional scope, their time perspective, research aim,
methodology, modelling approach, mathematical approach and other factors. Energy models
could be clustered according to their methodologies and modelling approaches. Based on an
adapted simplified approach by Van Beeck (1999, 2003), these models could be clustered into
four prevailing methodologies: scenario simulation, optimisation, economic equilibrium and
toolbox modelling, though differentiation of methodology could be difficult sometimes due to
overlaps. Energy models could also be clustered into three prevailing modelling approaches: top-
down, bottom-up and hybrid approach (Chapter 3). It has to be kept in mind that all models have
19
shortcomings and limitations by definition, since models are simplifications of the complex real-
world (Schenk, 2006). Schenk (2006) indicates that some of the major weaknesses of energy
models are that they may represent only one viewpoint about the future, that they may be used in
a manipulative way to give the impression that subjective judgments are based on thorough
analysis and calculation and that they should not be used to address problems they were not built
for.
1.6 Aim and scope of the thesis
Energy use is quickly rising in rapidly developing countries like China and India. The
majority of conventional energy sources used in rapidly developing countries come from
polluting fossil fuels, while unconventional energy sources like traditional biomass are also used
to a large extent, especially in rural areas (IEA, 2008). Fossil fuel use is associated with
significant environmental impacts such as global climate change, air pollution and resource
depletion. Since energy processes are considered the main contributors to environmental
problems like global climate change, it is crucial to implement mitigation measures. An effective
mitigation measure is to use low-carbon energy technologies like renewable and clean energy
technologies which can spur sustainable energy transitions. Sustainable energy transitions are
important for developing countries, because they can avoid carbon lock-ins, provide possibilities
for sustainable development and leapfrogging while safeguarding energy resources, the
environment and human health. Energy models are considered important tools for analysing and
planning such energy transitions. Many present-day energy models are developed by and for
industrialised countries. Their approach tends to be biased towards the energy systems of
industrialised countries and may neglect that the situation is very different in developing
countries. Developing countries usually differ from industrialised countries in terms of energy
consumption, production and distribution, energy infrastructure and energy economy. There is a
need for new energy modelling approaches which are especially suited for the energy systems in
developing countries.
The main objective of this thesis is therefore first to adjust energy models for use in
developing countries and second to model sustainable energy transitions and their effects in
rapidly developing countries like China and India. This research can be relevant for energy
experts and policy-makers, especially in developing countries. It could give an indication about
the opportunities and implications of sustainable energy transitions and potential future energy
pathways. This could increase the knowledge developing countries have concerning their own
choices for energy planning and climate policy negotiations in the post-2012 era.
The focus of this research is three-fold: a) to identify the characteristics of developing
countries´ energy systems and to elaborate the differences between energy systems in developing
countries and in industrialised countries, b) to move away from energy models´ bias of
industrialised countries´ energy systems and to adapt energy modelling approaches by means of
scenario-making to increase their suitability for rapidly developing countries and c) to develop
scenarios using these adapted models to simulate sustainable energy transitions for rapidly
developing countries. The core of this research is to develop scenarios for sustainable energy
transitions in China and India. Renewable energy sources which are taken into account for these
energy transitions are first-generation biofuels (e.g. biodiesel, bioethanol), biogas, geothermal
energy, hydrogen, hydropower (small and large-hydropower), solar energy (e.g. photovoltaic
(PV) cells, solar water heaters, solar lamps), tidal energy and wind energy. Clean energy sources
20
considered are CNG, LPG and natural gas. Nuclear energy is also considered with its
implications.
The main research questions are:
1. How are energy systems of developing countries characterised, with a focus on developing
Asia? What are the factors influencing these energy systems and how will they change in the
process of development? How is this modelled in present-day energy models and how could the
modelling be improved?
2. How could sustainable energy transitions take place in specific economic sectors of China and
India?
3. What could be the effects of these energy transitions on emissions, the electricity system,
energy resource use, costs and social issues (e.g. access to electricity, effects on the urban and
rural population)? What policy recommendations would be useful?
These questions will be addressed using energy modelling and scenario-making as tools.
It has to be noted at this point that developing countries show a large variety in and
among themselves. Rapidly developing countries like China, India, Brazil and South Africa
differ greatly from less developed countries or even from the least developed countries as in Sub-
Saharan Africa (e.g. Burkina Faso, Mali, Mozambique, Niger, Sierra Leone) and in Southeast
Asia (e.g. Bhutan, Cambodia, Myanmar, Nepal). Rural and urban areas can also differ
significantly within one country. In some countries like Brazil or South Africa, large differences
exist between the poor and the rich and their energy consumption patterns. Significant
differences between urban and rural areas prevail in many developing countries concerning
access to energy infrastructure and energy consumption patterns. A limitation on specific
countries and a case study approach for specific regions and sectors is therefore necessary.
The general aspects of the energy systems of developing countries and their
representation in energy models are elaborated first to address research question 1. For
addressing research questions 2 and 3, case studies are chosen. This thesis focuses on rapidly
developing countries in Asia and more specifically on China and India. These countries have
been chosen, because they are currently the most rapidly developing, most energy consuming,
most climate change-relevant and one of the most economically-growing developing countries.
Their development will have global impacts. Implementing renewable and clean energy sources
in these countries is likely to mitigate climate change. Due to the high variety also within China
and India, system boundaries have to be determined and three case studies are selected to assess
energy transitions in specific sectors of China and India. The case studies are the following: 1. a
study on a national level examining the energy supply-side perspective for the power sector of
China, 2. a study on an urban regional level examining the energy demand-side perspective for
Beijing and its economic sectors and 3. a study on a rural regional level examining the energy
supply and demand for the non-electrified residential sector in India. These case studies are
chosen to assess energy transitions both from the supply-side and the demand-side, from the
national and regional perspective, from the urban and rural perspective and for various sectors.
This variety aims to give a comprehensive picture of energy transitions in rapidly developing
countries like China and India.
1.7 Structure of the thesis
Besides introduction and conclusion, the thesis comprises five main chapters.
Chapter 2 elaborates concepts on energy and development, their relevance for developing
countries and their implementation in the IPCC´s Special Report on Emission Scenarios (SRES)
21
for Asia. This chapter focuses particularly on the concepts of the Energy Ladder and the
Environmental Kuznets Curve and suggests that improvements can be made in modelling the
issues underlying these concepts.
Chapter 3 deals with characterising and modelling energy systems of developing
countries with a focus on developing Asia. Factors influencing energy systems and possible
changes due to development are elaborated. Since the energy systems of developing countries
differ from those of industrialised countries, consequences for energy modelling are involved.
New requirements should be met by energy models to adequately explore the future of
developing countries‘ energy systems. This chapter therefore aims to assess if and how the main
characteristics of developing countries are adequately incorporated in commonly used energy
models. It indicates how to improve energy models for increasing their suitability for developing
countries and elaborates possible modelling techniques and data requirements.
Chapter 4 elaborates on sustainable energy transitions as mitigation options of climate
change for China‘s power sector. Sustainable energy transitions are modelled based on scenarios
developed in PowerPlan, a bottom-up model simulating a countries‘ power sector and the
emissions arising from it. China‘s carbon-based electricity production system of today is
simulated as well as possible sustainable energy transitions for the future. Some of the
improvements suggested for energy modelling in chapters 2 and 3 are incorporated in this
chapter.
Chapter 5 presents scenarios for transitions to renewable energy for China‘s capital
Beijing. This chapter aims to elaborate alternative futures of the energy demand of Beijing using
the Long-range Energy Alternatives Planning System LEAP. The scenarios are based on
Beijing‘s fossil fuel-dependent economy of today and the government‘s targets for a future
economy relying more on renewable energy. Some of the improvements for energy modelling
addressed in chapters 2 and 3 are incorporated in this chapter.
While Chapters 4 and 5 aim at modelling the grid-related energy supply and demand of
rapidly developing countries, Chapter 6 presents a different approach. The residential energy
supply and demand of rural India is modelled using the Regional Energy Model REM. This
approach focuses on non grid-connected households and compares possibilities for rural
electrification with grid-extensions, decentral renewable energy systems and decentral diesel
systems. Issues like electrification, energy poverty and fuel-switching play a role in this chapter.
Chapter 6 is a contrast to the modelling of mainly urban energy systems in Chapter 5 and also
includes some of the improvements suggested for energy modelling in Chapters 2 and 3. In
Chapter 7, the conclusion is elaborated.
22
2. Modelling energy and development: an evaluation of models and concepts1
Abstract
Most global energy models are developed by institutes from developed countries,
focusing primarily on issues that are important in industrialised countries. Evaluating the results
for Asia of the IPCC/SRES models shows that broad concepts of energy and development, the
Energy Ladder and the Environmental Kuznets Curve, can be observed in the results of the
models. However, improvements can be made in modelling the issues that underlie these
concepts, like traditional fuels, electrification, economic structural change, income distribution
and informal economies. Given the rapidly growing importance of energy trajectories of
developing countries for global sustainability, the challenge for the future is to develop energy
models that include all these aspects of energy and development.
2.1 Introduction
The consumption and production of energy worldwide plays a major role in several
sustainability problems, such as climate change and depletion of resources. So far, world energy
use has been dominated by energy consumption in industrialised countries. However, that
situation is currently changing. Industrialisation, improvement of living standards and population
growth are leading to rapidly increasing energy consumption in developing countries, with
subsequent impacts on global sustainability issues.
Global energy models are used to explore and understand possible future changes in the
global energy system. Only very few global energy models account explicitly for the specific
dynamics of developing countries. As the majority is developed in industrialised countries, they
mainly focus on issues that are important for industrialised energy systems, systems that can be
characterised by full access to modern energy forms, high (and increasing) welfare levels and a
minor role of agriculture in the structure of the economy. Implicitly, it is assumed that the future
of developing countries can be derived from experiences in developed countries during the last
decades. For a variety of reasons, this is not necessarily the case, as developed and developing
countries differ for instance in market development, institutional arrangements and the existence
of traditional economies and energy systems (Shukla, 1995; Pandey, 2002).
In 2000, the IPCC published a set of scenarios in the Special Report on Emission
Scenarios (SRES) (IPCC, 2000a; IPCC, 2000b). These scenarios have been developed using
global energy models, to explore future pathways for greenhouse gas (GHG) emissions. Despite
the fact that developing countries play an important role in the increase in global energy
consumption projected in these scenarios, all modelling teams in the SRES were from the
developed world (the number of global energy modelling teams in developing countries is very
limited). It should be noted that in the SRES some attempts were made to compensate for this:
one modelling team involved modellers from developing countries, while the report as a whole
involved several experts from developing countries as non-modelling experts. However, these
activities did not change the models that were applied.
This chapter looks at the question whether current global energy models include several
key issues of energy systems in developing countries. In this analysis, the focus is especially on
1 This chapter is a slightly adapted version of Van Ruijven, B.*, Urban, F.*, Benders, R.M.J., Moll, H.C, Van der
Sluijs, J., De Vries, B. and Van Vuuren, D.P., 2008. Modeling Energy and Development: an Evaluation of Models
and Concepts. World Development, Vol. 36(12): 2801-2821.
* Both F. Urban and B. Van Ruijven are the main authors and have contributed equally much to the article.
23
the Asian region. It is first evaluated whether two broad concepts of energy and development, the
Energy Ladder and the Environmental Kuznets Curve, can be found in the SRES model results
(Chapter 2.2). Next, several key issues of energy systems in developing countries are identified
that are relevant for global energy models. Chapter 2.3 discusses these issues, focusing on the
trends and stylised facts and the relevance for global energy models. Chapter 2.4 discusses the
methods and gives the conclusions.
Some notes on this study have to be made beforehand. First, completeness of the key
issues is not claimed; the focus is on what is considered the most relevant changes in energy
systems in developing countries with respect to global energy modelling, based on this own
analysis and observation. Second, the focus is mainly on Asia, as among all developing regions
this continent has the largest population size, experiences the fastest economic growth and
consequently the fastest growing contribution to energy consumption and global climate change.
Many definitions exist for the terms ―developing country‖ and ―developing region‖. In
this chapter, developing countries are defined as all countries within the World Bank‘s low
income, lower-middle and upper-middle income groups, excluding the former Soviet regions and
Central-European countries (or, in other words, all countries in Latin America, Africa, the
Middle East, Asia and Oceania that are not in the high income class). The terms developing
country and developing region are used interchangeably.
2.1.1 Metrics for the comparison of economic activity
Most energy models use economic activity (GDP/capita, representing living standards) as
driving force for energy related issues. When internationally comparing economic activity, one
has to express local currencies in a common currency. Two options are available for such
comparison: market exchange rates (MER, usually US dollars) or purchasing power parity (PPP,
expressed as international dollars). MER comparison is based on bilateral exchange rates
between different currencies and the US dollar, but this ignores the often large differences in
prices of a broad set of goods and services that are not reflected in the value of the exchange rate.
The PPP exchange rate is defined as the ratio of prices for a representative basket of goods and
services, such that the purchasing power of the currencies is equal (Lafrance and Schembri,
2002). Usually, North American purchasing power in US dollars is set to equal international
dollars. Developing countries are usually characterised by a high ratio between PPP income
levels and MER-based income levels (the so-called PPP-ratio), which makes the issue especially
relevant for the modelling of energy systems in these regions. In other words, developing
countries‘ economies are larger on PPP basis than suggested on MER basis. In the SRES,
economic activity was mainly expressed in MER terms and this has been extensively debated in
long-term scenario literature (Castles and Henderson, 2003; Grübler et al., 2004; van Vuuren and
Alfsen, 2006; Nordhaus, 2007). In the dynamic context of global models, one of the crucial
questions is whether PPP values should be regarded as constant or dynamically converging with
increasing welfare levels (van Vuuren and Alfsen, 2006). Although it was found that models lead
to comparable results if calibrated consistently in PPP or MER (van Vuuren and Alfsen, 2006),
this aspect contributes to uncertainty in the projection for energy use in developing countries. In
this chapter, MER values are used in the discussion of the SRES results (Chapter 2.2) and PPP
values for the analysis of data (Chapter 2.3), as PPP is more suitable for the comparison of
welfare levels between different developing countries. The different use of metrics in these two
chapters is irrelevant for the type of comparisons that are made.
24
2.2 Developing countries in global energy models
One of the few consistent databases with scenario results from global energy models is
the IPCC/SRES (IPCC, 2000b). Due to differences in regional definitions and levels of detail of
the models, the reporting of model results in this database is rather rough and at a high level of
aggregation. For example, results are published for only four world regions (of which the focus
is on the region of Asia2) and a limited set of socio-economic and energy data. Due to these
limitations, it is only possible to evaluate these models on rather aggregated concepts of energy
and development. Here, the focus is on the Energy Ladder and the Environmental Kuznets Curve
(EKC).
The six models involved in the IPCC/SRES process are AIM, ASF, IMAGE/TIMER,
MARIA, MESSAGE and MiniCAM ( IPCC, 2000a; IPCC, 2000b). In the IPCC/SRES, a set of
four scenarios was developed, defined by an axis of global versus regional orientation and
economic versus environmental preferences. The A1 storyline is a case of rapid globalisation and
economic development, in which average income per capita converges between world regions.
The A2 scenario represents a differentiated world with a focus on materialism, in which
protectionism of regions is more important than global interaction and in which significant
income disparities continue to exist. The B1 storyline describes a fast-changing and convergent
world, aiming at environmental, social and economic sustainability from a global perspective.
Finally, the B2 world is one of increased concern for environmental and social sustainability
coupled with an emphasis on regional solutions ( IPCC, 2000a; IPCC, 2000b). Per scenario one
model is the marker model, which is illustrative of a particular storyline. On several key-
variables, the results of other models are harmonised with the marker model.
In this analysis, all data are derived from the IPCC/SRES website3 except for the
IMAGE-model data: these are from the IMAGE SRES implementation CD-ROM (IMAGE-
team, 2001). Ideally, the source-codes and technical documentation of the models should have
analysed with respect to specific development issues. However, documentation of many of these
models is incomplete and source codes are hard to obtain. Therefore, it was decided to use the
results of the models and the available model documentation. By limiting this evaluation to these
models, there is awareness that a range of specific energy models are excluded, among them the
MARKAL/TIMES family and the IEA World Energy Model (WEM), which were not involved
in the IPCC/SRES process. Also, the SRES versions of the models might be outdated as models
are continuously improved. For example, the IMAGE model has been considerably improved
since the SRES (Bouwman et al., 2006), but no changes have been made to the processes that are
relevant for energy and development issues. Also for other models it is presumed that little has
changed on the issues discussed in Chapter 2.3. Finally, it should be noted that data in the
chapters are often presented as function of per capita income, an indicator used as a proxy of
development level4.
2.2.1 The Energy Ladder in the SRES models
It is a general historically observed pattern that once fuels become available and
affordable, populations switch to fuel-stove combinations with a higher quality (Holdren and
2 Due to different regional aggregations of the SRES models, the final report used only four regions: REF (economic
reforming countries), OECD90, ASIA and ALM (Africa and Latin America). 3 http://www.grida.no/climate/ipcc/emission/index.htm
4 For reasons of comparability and to focus on the process of development (i.e. low incomes), it was chosen to limit
the graphs to 12,000 US$/capita, which is the maximum average Asian income level in the A2 scenario.
25
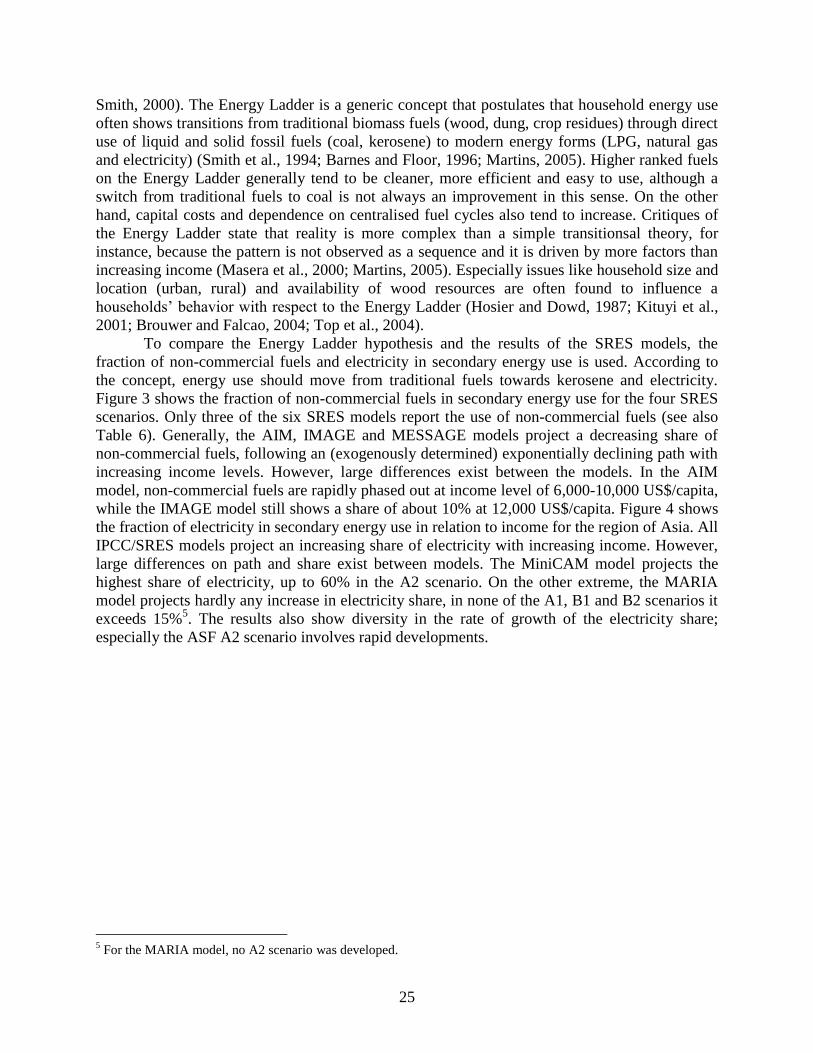
Smith, 2000). The Energy Ladder is a generic concept that postulates that household energy use
often shows transitions from traditional biomass fuels (wood, dung, crop residues) through direct
use of liquid and solid fossil fuels (coal, kerosene) to modern energy forms (LPG, natural gas
and electricity) (Smith et al., 1994; Barnes and Floor, 1996; Martins, 2005). Higher ranked fuels
on the Energy Ladder generally tend to be cleaner, more efficient and easy to use, although a
switch from traditional fuels to coal is not always an improvement in this sense. On the other
hand, capital costs and dependence on centralised fuel cycles also tend to increase. Critiques of
the Energy Ladder state that reality is more complex than a simple transitionsal theory, for
instance, because the pattern is not observed as a sequence and it is driven by more factors than
increasing income (Masera et al., 2000; Martins, 2005). Especially issues like household size and
location (urban, rural) and availability of wood resources are often found to influence a
households‘ behavior with respect to the Energy Ladder (Hosier and Dowd, 1987; Kituyi et al.,
2001; Brouwer and Falcao, 2004; Top et al., 2004).
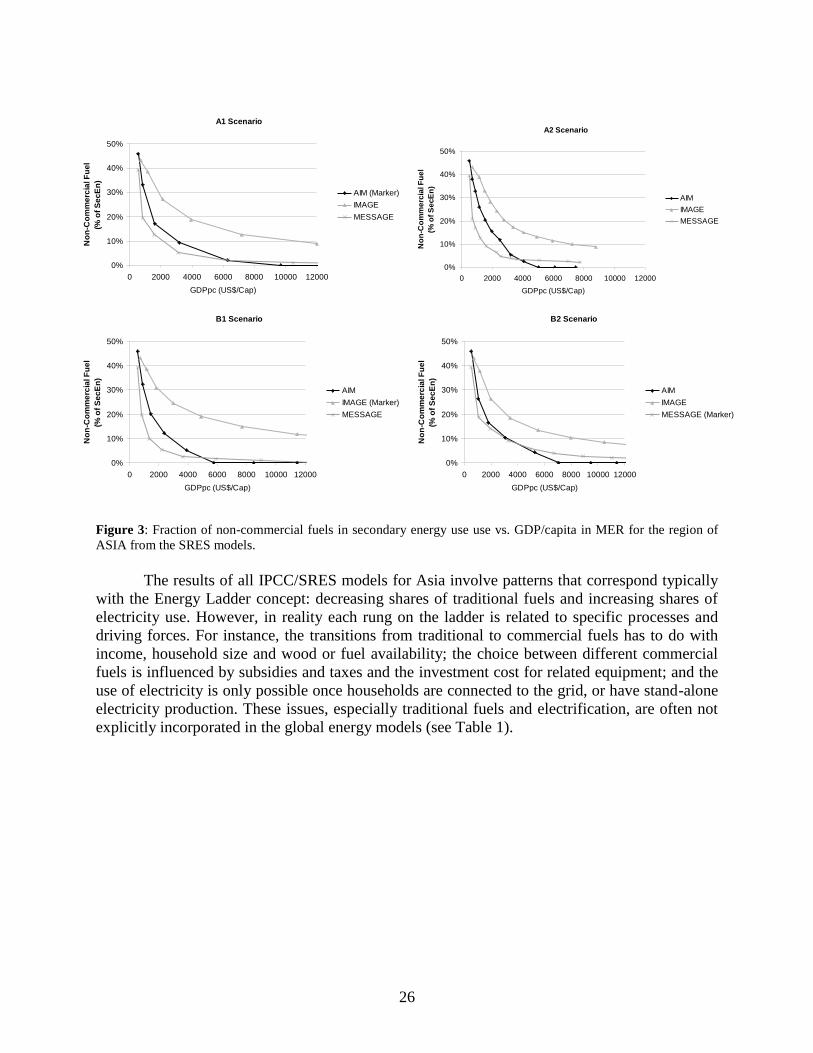
To compare the Energy Ladder hypothesis and the results of the SRES models, the
fraction of non-commercial fuels and electricity in secondary energy use is used. According to
the concept, energy use should move from traditional fuels towards kerosene and electricity.
Figure 3 shows the fraction of non-commercial fuels in secondary energy use for the four SRES
scenarios. Only three of the six SRES models report the use of non-commercial fuels (see also
Table 6). Generally, the AIM, IMAGE and MESSAGE models project a decreasing share of
non-commercial fuels, following an (exogenously determined) exponentially declining path with
increasing income levels. However, large differences exist between the models. In the AIM
model, non-commercial fuels are rapidly phased out at income level of 6,000-10,000 US$/capita,
while the IMAGE model still shows a share of about 10% at 12,000 US$/capita. Figure 4 shows
the fraction of electricity in secondary energy use in relation to income for the region of Asia. All
IPCC/SRES models project an increasing share of electricity with increasing income. However,
large differences on path and share exist between models. The MiniCAM model projects the
highest share of electricity, up to 60% in the A2 scenario. On the other extreme, the MARIA
model projects hardly any increase in electricity share, in none of the A1, B1 and B2 scenarios it
exceeds 15%5. The results also show diversity in the rate of growth of the electricity share;
especially the ASF A2 scenario involves rapid developments.
5 For the MARIA model, no A2 scenario was developed.
26
Figure 3: Fraction of non-commercial fuels in secondary energy use use vs. GDP/capita in MER for the region of
ASIA from the SRES models.
The results of all IPCC/SRES models for Asia involve patterns that correspond typically
with the Energy Ladder concept: decreasing shares of traditional fuels and increasing shares of
electricity use. However, in reality each rung on the ladder is related to specific processes and
driving forces. For instance, the transitions from traditional to commercial fuels has to do with
income, household size and wood or fuel availability; the choice between different commercial
fuels is influenced by subsidies and taxes and the investment cost for related equipment; and the
use of electricity is only possible once households are connected to the grid, or have stand-alone
electricity production. These issues, especially traditional fuels and electrification, are often not
explicitly incorporated in the global energy models (see Table 1).
A1 Scenario
0%
10%
20%
30%
40%
50%
0 2000 4000 6000 8000 10000 12000
GDPpc (US$/Cap)
No
n-C
om
me
rcia
l F
ue
l
(% o
f S
ec
En
)
AIM (Marker)
IMAGE
MESSAGE
A2 Scenario
0%
10%
20%
30%
40%
50%
0 2000 4000 6000 8000 10000 12000
GDPpc (US$/Cap)
No
n-C
om
me
rcia
l F
ue
l
(% o
f S
ecE
n)
AIM
IMAGE
MESSAGE
B1 Scenario
0%
10%
20%
30%
40%
50%
0 2000 4000 6000 8000 10000 12000
GDPpc (US$/Cap)
No
n-C
om
me
rcia
l F
ue
l
(% o
f S
ec
En
)
AIM
IMAGE (Marker)
MESSAGE
B2 Scenario
0%
10%
20%
30%
40%
50%
0 2000 4000 6000 8000 10000 12000
GDPpc (US$/Cap)
No
n-C
om
me
rcia
l F
ue
l
(% o
f S
ec
En
)
AIM
IMAGE
MESSAGE (Marker)
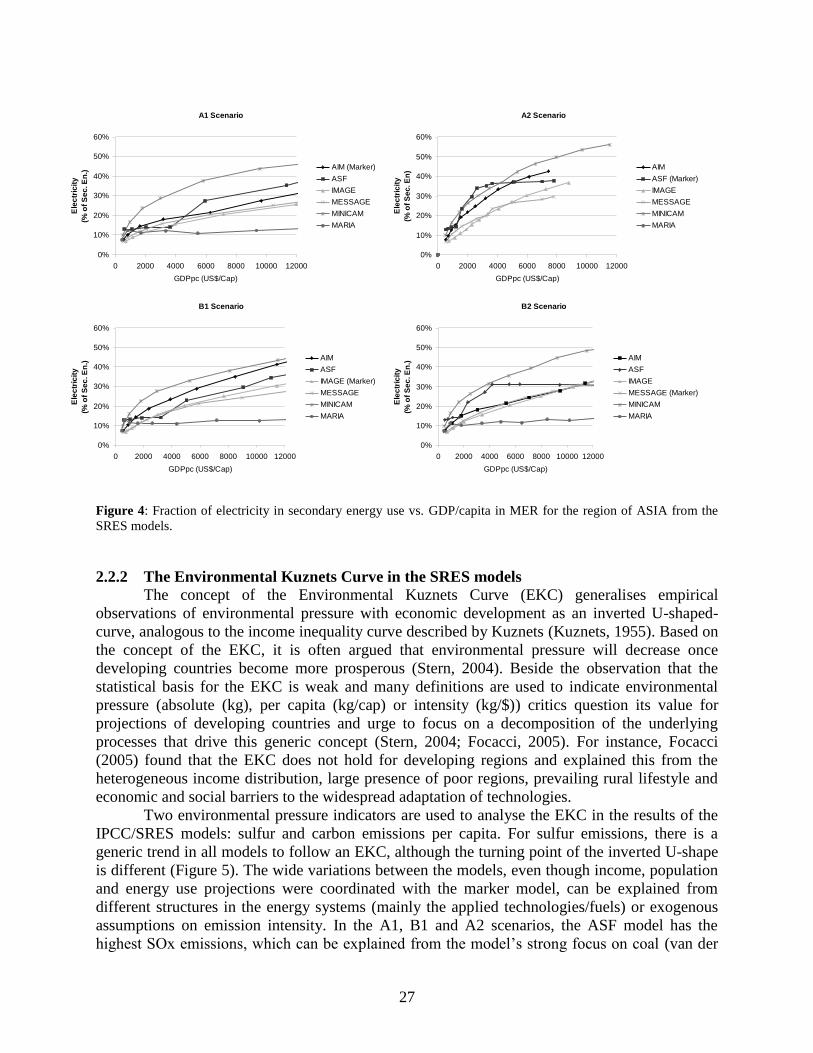
27
Figure 4: Fraction of electricity in secondary energy use vs. GDP/capita in MER for the region of ASIA from the
SRES models.
2.2.2 The Environmental Kuznets Curve in the SRES models
The concept of the Environmental Kuznets Curve (EKC) generalises empirical
observations of environmental pressure with economic development as an inverted U-shaped-
curve, analogous to the income inequality curve described by Kuznets (Kuznets, 1955). Based on
the concept of the EKC, it is often argued that environmental pressure will decrease once
developing countries become more prosperous (Stern, 2004). Beside the observation that the
statistical basis for the EKC is weak and many definitions are used to indicate environmental
pressure (absolute (kg), per capita (kg/cap) or intensity (kg/$)) critics question its value for
projections of developing countries and urge to focus on a decomposition of the underlying
processes that drive this generic concept (Stern, 2004; Focacci, 2005). For instance, Focacci
(2005) found that the EKC does not hold for developing regions and explained this from the
heterogeneous income distribution, large presence of poor regions, prevailing rural lifestyle and
economic and social barriers to the widespread adaptation of technologies.
Two environmental pressure indicators are used to analyse the EKC in the results of the
IPCC/SRES models: sulfur and carbon emissions per capita. For sulfur emissions, there is a
generic trend in all models to follow an EKC, although the turning point of the inverted U-shape
is different (Figure 5). The wide variations between the models, even though income, population
and energy use projections were coordinated with the marker model, can be explained from
different structures in the energy systems (mainly the applied technologies/fuels) or exogenous
assumptions on emission intensity. In the A1, B1 and A2 scenarios, the ASF model has the
highest SOx emissions, which can be explained from the model‘s strong focus on coal (van der
A1 Scenario
0%
10%
20%
30%
40%
50%
60%
0 2000 4000 6000 8000 10000 12000
GDPpc (US$/Cap)
Ele
ctr
icit
y
(% o
f S
ec
. E
n.)
AIM (Marker)
ASF
IMAGE
MESSAGE
MINICAM
MARIA
A2 Scenario
0%
10%
20%
30%
40%
50%
60%
0 2000 4000 6000 8000 10000 12000
GDPpc (US$/Cap)
Ele
ctr
icit
y
(% o
f S
ec
. E
n)
AIM
ASF (Marker)
IMAGE
MESSAGE
MINICAM
MARIA
B1 Scenario
0%
10%
20%
30%
40%
50%
60%
0 2000 4000 6000 8000 10000 12000
GDPpc (US$/Cap)
Ele
ctr
icit
y
(% o
f S
ec
. E
n.)
AIM
ASF
IMAGE (Marker)
MESSAGE
MINICAM
MARIA
B2 Scenario
0%
10%
20%
30%
40%
50%
60%
0 2000 4000 6000 8000 10000 12000
GDPpc (US$/Cap)
Ele
ctr
icit
y
(% o
f S
ec
. E
n.)
AIM
ASF
IMAGE
MESSAGE (Marker)
MINICAM
MARIA
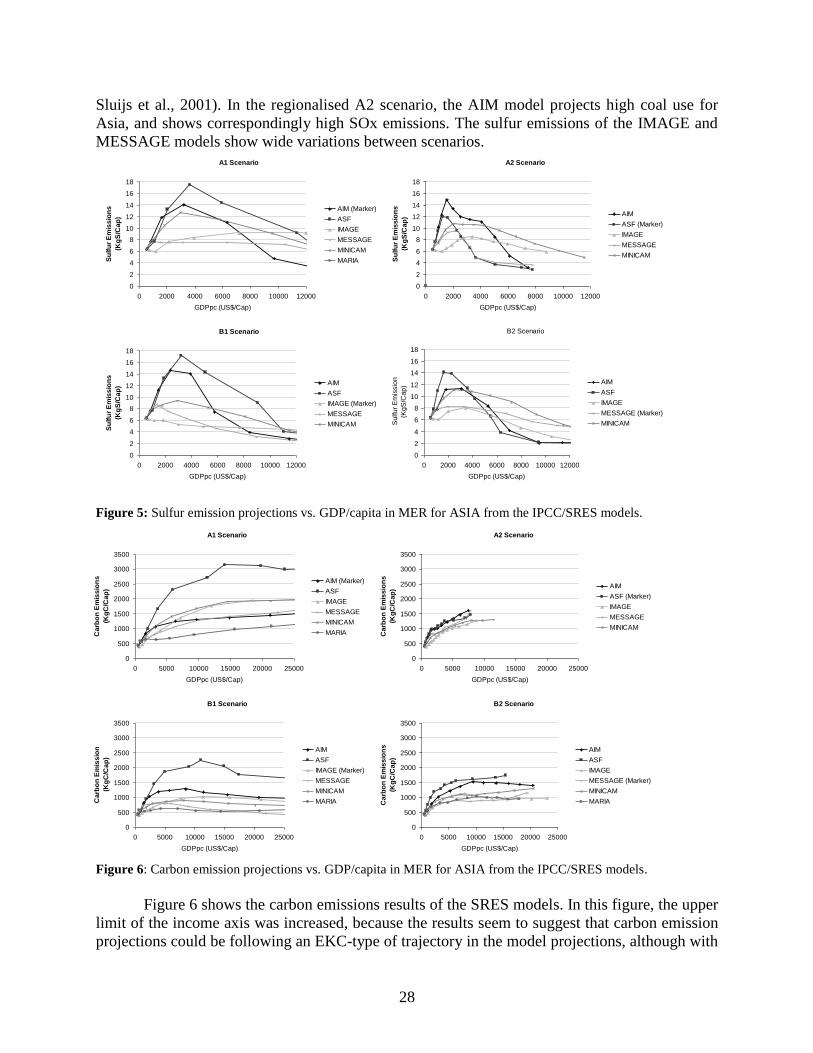
28
Sluijs et al., 2001). In the regionalised A2 scenario, the AIM model projects high coal use for
Asia, and shows correspondingly high SOx emissions. The sulfur emissions of the IMAGE and
MESSAGE models show wide variations between scenarios.
Figure 5: Sulfur emission projections vs. GDP/capita in MER for ASIA from the IPCC/SRES models.
Figure 6: Carbon emission projections vs. GDP/capita in MER for ASIA from the IPCC/SRES models.
Figure 6 shows the carbon emissions results of the SRES models. In this figure, the upper
limit of the income axis was increased, because the results seem to suggest that carbon emission
projections could be following an EKC-type of trajectory in the model projections, although with
A1 Scenario
0
2
4
6
8
10
12
14
16
18
0 2000 4000 6000 8000 10000 12000
GDPpc (US$/Cap)
Su
lfu
r E
mis
sio
ns
(Kg
S/C
ap
)
AIM (Marker)
ASF
IMAGE
MESSAGE
MINICAM
MARIA
A2 Scenario
0
2
4
6
8
10
12
14
16
18
0 2000 4000 6000 8000 10000 12000
GDPpc (US$/Cap)
Su
lfu
r E
mis
sio
ns
(Kg
S/C
ap
) AIM
ASF (Marker)
IMAGE
MESSAGE
MINICAM
B1 Scenario
0
2
4
6
8
10
12
14
16
18
0 2000 4000 6000 8000 10000 12000
GDPpc (US$/Cap)
Su
lfu
r E
mis
sio
ns
(Kg
S/C
ap
) AIM
ASF
IMAGE (Marker)
MESSAGE
MINICAM
B2 Scenario
0
2
4
6
8
10
12
14
16
18
0 2000 4000 6000 8000 10000 12000
GDPpc (US$/Cap)
Su
lfu
r E
mis
sio
n
(Kg
S/C
ap
)
AIM
ASF
IMAGE
MESSAGE (Marker)
MINICAM
B1 Scenario
0
500
1000
1500
2000
2500
3000
3500
0 5000 10000 15000 20000 25000
GDPpc (US$/Cap)
Ca
rbo
n E
mis
sio
n
(Kg
C/C
ap
)
AIM
ASF
IMAGE (Marker)
MESSAGE
MINICAM
MARIA
B2 Scenario
0
500
1000
1500
2000
2500
3000
3500
0 5000 10000 15000 20000 25000
GDPpc (US$/Cap)
Ca
rbo
n E
mis
sio
ns
(Kg
C/C
ap
)
AIM
ASF
IMAGE
MESSAGE (Marker)
MINICAM
MARIA
A2 Scenario
0
500
1000
1500
2000
2500
3000
3500
0 5000 10000 15000 20000 25000
GDPpc (US$/Cap)
Ca
rbo
n E
mis
sio
ns
(Kg
C/C
ap
) AIM
ASF (Marker)
IMAGE
MESSAGE
MINICAM
A1 Scenario
0
500
1000
1500
2000
2500
3000
3500
0 5000 10000 15000 20000 25000
GDPpc (US$/Cap)
Ca
rbo
n E
mis
sio
ns
(Kg
C/C
ap
)
AIM (Marker)
ASF
IMAGE
MESSAGE
MINICAM
MARIA
29
a higher turning point than SO2. Also for carbon emissions, wide variations exist between models
and scenarios. In the A2 scenario, the top of the EKC is not reached in the 21st century, in the B1
scenario the turning point of the EKC is well below 10,000 US$/capita. The ASF model shows
the highest carbon emissions in all scenarios, which can be explained from its focus on coal. The
AIM model also projects a high share of coal, and thus relatively high CO2 emissions in
regionalising scenarios. Very low-carbon emissions are projected by the MARIA model, due to
the substantial amount of nuclear energy projected here (IPCC, 2000b; van der Sluijs et al.,
2001).
Generally, all model results show the inverted U-shape of the EKC in the A1 and B1
scenarios. Higher turning points for the A2 and B2 scenarios were also found in an analysis of
the EKC in the IPCC/SRES models at the global level (Fonkych and Lempert, 2005). The SRES
results of the A1 and B1 scenarios show an EKC pattern for CO2 emissions, although carbon
mitigation policies were explicitly excluded from the scenarios. For SOx emissions,
industrialised countries have restrictive policies since the 1970s and end-of-pipe technologies are
widely applied. Diffusion of these policies and technologies towards developing countries takes
place and is expected to continue (Grubler, 2002; Smith et al., 2005).
Also for the EKC, the underlying processes that determine whether developing countries
follow the EKC, e.g. heterogeneous income distribution, rural-urban divide or socio-economic
barriers (Focacci, 2005), are not explicitly modelled in global energy models (see Table 1).
2.3 Key issues of energy systems in developing countries
Based on the analysis of the model results with respect to the Energy Ladder and the
EKC, three groups of key issues can be distinguished that were less relevant for energy systems
in industrialised regions (in recent history), but are of importance for today‘s developing
countries. First, key issues in the energy system itself are the use of traditional fuels and limited
access to modern energy (electrification), both related to the Energy Ladder. A second group of
issues, involving structural change, income distribution and the role of the informal economy,
has a more socio-economic nature and is related to the demand for energy. A third group of
issues is related to the context of development for present-day developing countries compared to
Western regions after 1960 and involves depletion of resources, climate change and local air
pollution. A final issue is the difference between urban and rural areas. Most global energy
models do not make a differentiation between urban and rural energy systems, although for most
of the above identified key issues, urban and rural characteristics are different. Therefore, this is
discussed together with the key issues below.
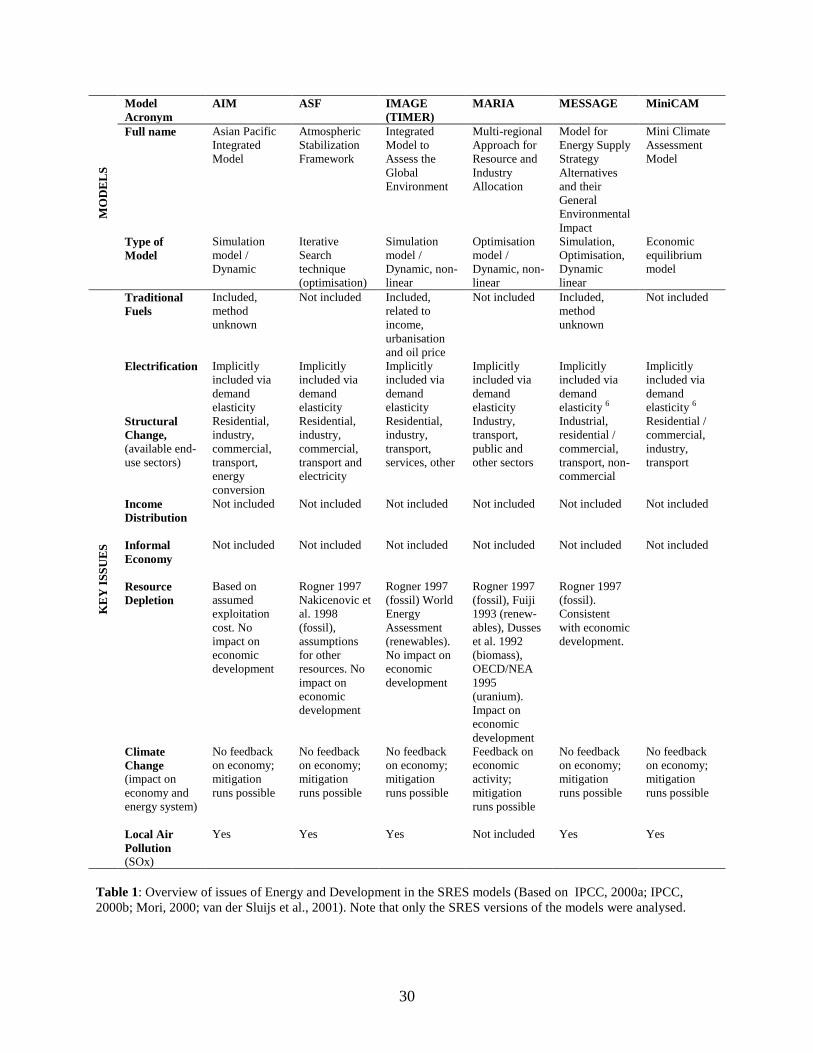
30
MO
DE
LS
Model
Acronym
AIM ASF IMAGE
(TIMER)
MARIA MESSAGE MiniCAM
Full name Asian Pacific
Integrated
Model
Atmospheric
Stabilization
Framework
Integrated
Model to
Assess the
Global
Environment
Multi-regional
Approach for
Resource and
Industry
Allocation
Model for
Energy Supply
Strategy
Alternatives
and their
General
Environmental
Impact
Mini Climate
Assessment
Model
Type of
Model
Simulation
model /
Dynamic
Iterative
Search
technique
(optimisation)
Simulation
model /
Dynamic, non-
linear
Optimisation
model /
Dynamic, non-
linear
Simulation,
Optimisation,
Dynamic
linear
Economic
equilibrium
model
KE
Y I
SS
UE
S
Traditional
Fuels
Included,
method
unknown
Not included Included,
related to
income,
urbanisation
and oil price
Not included Included,
method
unknown
Not included
Electrification Implicitly
included via
demand
elasticity
Implicitly
included via
demand
elasticity
Implicitly
included via
demand
elasticity
Implicitly
included via
demand
elasticity
Implicitly
included via
demand
elasticity 6
Implicitly
included via
demand
elasticity 6
Structural
Change,
(available end-
use sectors)
Residential,
industry,
commercial,
transport,
energy
conversion
Residential,
industry,
commercial,
transport and
electricity
Residential,
industry,
transport,
services, other
Industry,
transport,
public and
other sectors
Industrial,
residential /
commercial,
transport, non-
commercial
Residential /
commercial,
industry,
transport
Income
Distribution
Not included Not included Not included Not included Not included Not included
Informal
Economy
Not included Not included Not included Not included Not included Not included
Resource
Depletion
Based on
assumed
exploitation
cost. No
impact on
economic
development
Rogner 1997
Nakicenovic et
al. 1998
(fossil),
assumptions
for other
resources. No
impact on
economic
development
Rogner 1997
(fossil) World
Energy
Assessment
(renewables).
No impact on
economic
development
Rogner 1997
(fossil), Fuiji
1993 (renew-
ables), Dusses
et al. 1992
(biomass),
OECD/NEA
1995
(uranium).
Impact on
economic
development
Rogner 1997
(fossil).
Consistent
with economic
development.
Climate
Change
(impact on
economy and
energy system)
No feedback
on economy;
mitigation
runs possible
No feedback
on economy;
mitigation
runs possible
No feedback
on economy;
mitigation
runs possible
Feedback on
economic
activity;
mitigation
runs possible
No feedback
on economy;
mitigation
runs possible
No feedback
on economy;
mitigation
runs possible
Local Air
Pollution
(SOx)
Yes Yes Yes Not included Yes Yes
Table 1: Overview of issues of Energy and Development in the SRES models (Based on IPCC, 2000a; IPCC,
2000b; Mori, 2000; van der Sluijs et al., 2001). Note that only the SRES versions of the models were analysed.
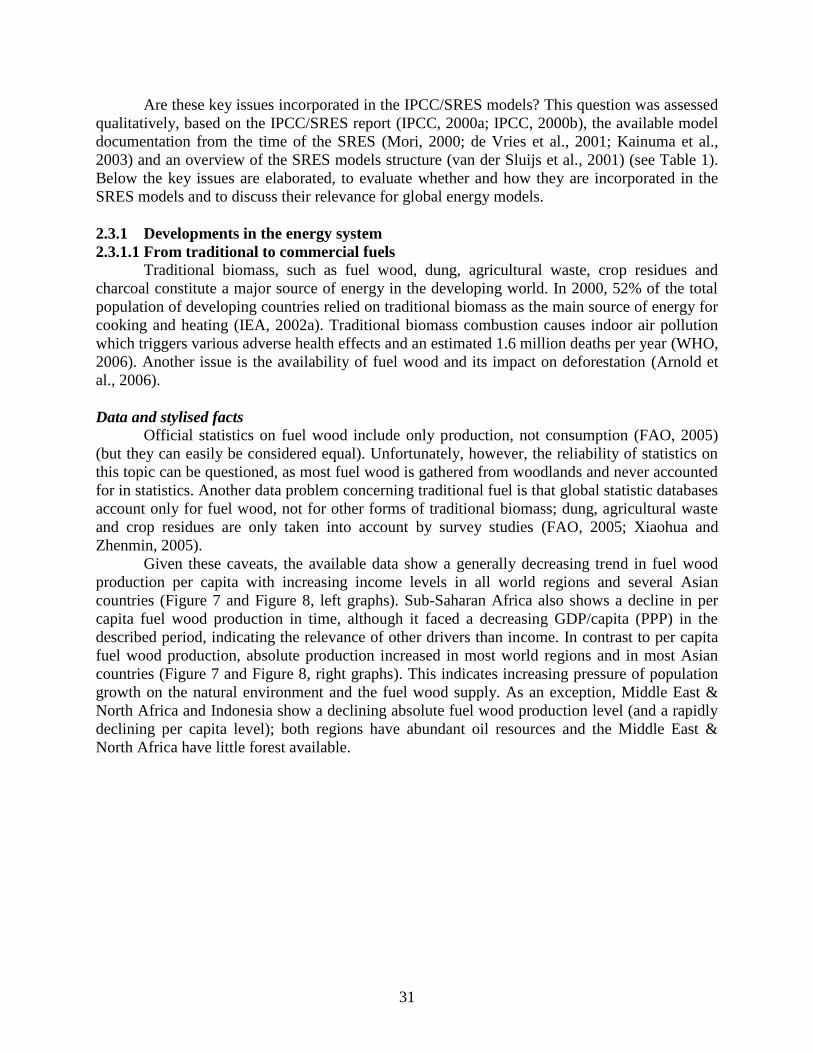
31
Are these key issues incorporated in the IPCC/SRES models? This question was assessed
qualitatively, based on the IPCC/SRES report (IPCC, 2000a; IPCC, 2000b), the available model
documentation from the time of the SRES (Mori, 2000; de Vries et al., 2001; Kainuma et al.,
2003) and an overview of the SRES models structure (van der Sluijs et al., 2001) (see Table 1).
Below the key issues are elaborated, to evaluate whether and how they are incorporated in the
SRES models and to discuss their relevance for global energy models.
2.3.1 Developments in the energy system
2.3.1.1 From traditional to commercial fuels
Traditional biomass, such as fuel wood, dung, agricultural waste, crop residues and
charcoal constitute a major source of energy in the developing world. In 2000, 52% of the total
population of developing countries relied on traditional biomass as the main source of energy for
cooking and heating (IEA, 2002a). Traditional biomass combustion causes indoor air pollution
which triggers various adverse health effects and an estimated 1.6 million deaths per year (WHO,
2006). Another issue is the availability of fuel wood and its impact on deforestation (Arnold et
al., 2006).
Data and stylised facts
Official statistics on fuel wood include only production, not consumption (FAO, 2005)
(but they can easily be considered equal). Unfortunately, however, the reliability of statistics on
this topic can be questioned, as most fuel wood is gathered from woodlands and never accounted
for in statistics. Another data problem concerning traditional fuel is that global statistic databases
account only for fuel wood, not for other forms of traditional biomass; dung, agricultural waste
and crop residues are only taken into account by survey studies (FAO, 2005; Xiaohua and
Zhenmin, 2005).
Given these caveats, the available data show a generally decreasing trend in fuel wood
production per capita with increasing income levels in all world regions and several Asian
countries (Figure 7 and Figure 8, left graphs). Sub-Saharan Africa also shows a decline in per
capita fuel wood production in time, although it faced a decreasing GDP/capita (PPP) in the
described period, indicating the relevance of other drivers than income. In contrast to per capita
fuel wood production, absolute production increased in most world regions and in most Asian
countries (Figure 7 and Figure 8, right graphs). This indicates increasing pressure of population
growth on the natural environment and the fuel wood supply. As an exception, Middle East &
North Africa and Indonesia show a declining absolute fuel wood production level (and a rapidly
declining per capita level); both regions have abundant oil resources and the Middle East &
North Africa have little forest available.
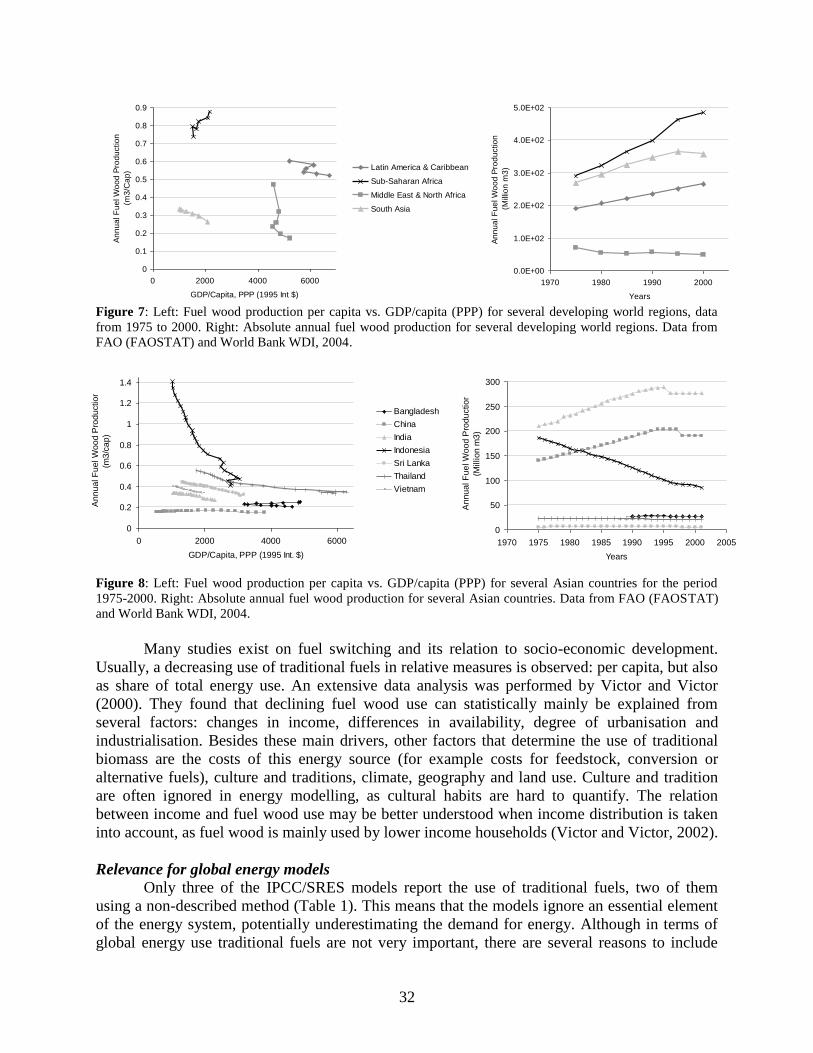
32
Figure 7: Left: Fuel wood production per capita vs. GDP/capita (PPP) for several developing world regions, data
from 1975 to 2000. Right: Absolute annual fuel wood production for several developing world regions. Data from
FAO (FAOSTAT) and World Bank WDI, 2004.
Figure 8: Left: Fuel wood production per capita vs. GDP/capita (PPP) for several Asian countries for the period
1975-2000. Right: Absolute annual fuel wood production for several Asian countries. Data from FAO (FAOSTAT)
and World Bank WDI, 2004.
Many studies exist on fuel switching and its relation to socio-economic development.
Usually, a decreasing use of traditional fuels in relative measures is observed: per capita, but also
as share of total energy use. An extensive data analysis was performed by Victor and Victor
(2000). They found that declining fuel wood use can statistically mainly be explained from
several factors: changes in income, differences in availability, degree of urbanisation and
industrialisation. Besides these main drivers, other factors that determine the use of traditional
biomass are the costs of this energy source (for example costs for feedstock, conversion or
alternative fuels), culture and traditions, climate, geography and land use. Culture and tradition
are often ignored in energy modelling, as cultural habits are hard to quantify. The relation
between income and fuel wood use may be better understood when income distribution is taken
into account, as fuel wood is mainly used by lower income households (Victor and Victor, 2002).
Relevance for global energy models
Only three of the IPCC/SRES models report the use of traditional fuels, two of them
using a non-described method (Table 1). This means that the models ignore an essential element
of the energy system, potentially underestimating the demand for energy. Although in terms of
global energy use traditional fuels are not very important, there are several reasons to include
0
0.1
0.2
0.3
0.4
0.5
0.6
0.7
0.8
0.9
0 2000 4000 6000
GDP/Capita, PPP (1995 Int $)
An
nu
al F
ue
l W
oo
d P
rod
uctio
n
(m3
/Ca
p) Latin America & Caribbean
Sub-Saharan Africa
Middle East & North Africa
South Asia
0.0E+00
1.0E+02
2.0E+02
3.0E+02
4.0E+02
5.0E+02
1970 1980 1990 2000
Years
An
nu
al F
ue
l W
oo
d P
rod
uctio
n
(Mill
ion
m3
)
0
0.2
0.4
0.6
0.8
1
1.2
1.4
0 2000 4000 6000
GDP/Capita, PPP (1995 Int. $)
An
nu
al F
ue
l W
oo
d P
rod
uctio
n
(m3
/ca
p)
Bangladesh
China
India
Indonesia
Sri Lanka
Thailand
Vietnam
0
50
100
150
200
250
300
1970 1975 1980 1985 1990 1995 2000 2005
Years
An
nu
al F
ue
l W
oo
d P
rod
uctio
n
(Millio
n m
3)
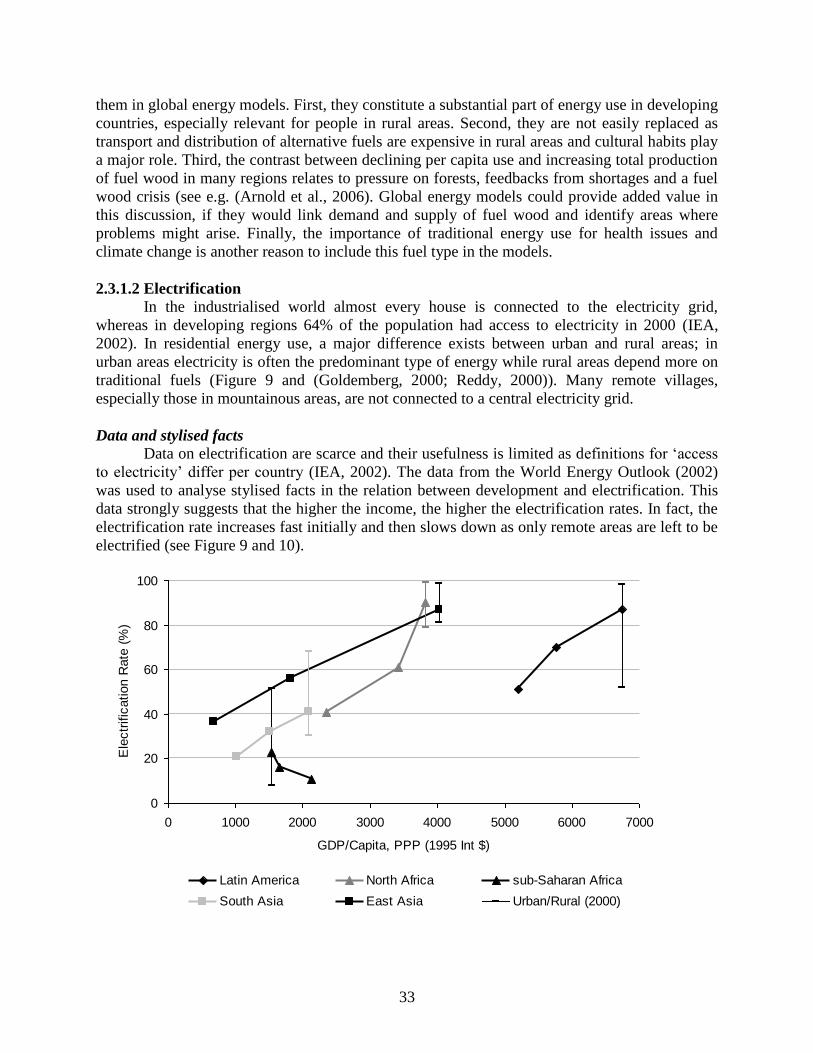
33
them in global energy models. First, they constitute a substantial part of energy use in developing
countries, especially relevant for people in rural areas. Second, they are not easily replaced as
transport and distribution of alternative fuels are expensive in rural areas and cultural habits play
a major role. Third, the contrast between declining per capita use and increasing total production
of fuel wood in many regions relates to pressure on forests, feedbacks from shortages and a fuel
wood crisis (see e.g. (Arnold et al., 2006). Global energy models could provide added value in
this discussion, if they would link demand and supply of fuel wood and identify areas where
problems might arise. Finally, the importance of traditional energy use for health issues and
climate change is another reason to include this fuel type in the models.
2.3.1.2 Electrification
In the industrialised world almost every house is connected to the electricity grid,
whereas in developing regions 64% of the population had access to electricity in 2000 (IEA,
2002). In residential energy use, a major difference exists between urban and rural areas; in
urban areas electricity is often the predominant type of energy while rural areas depend more on
traditional fuels (Figure 9 and (Goldemberg, 2000; Reddy, 2000)). Many remote villages,
especially those in mountainous areas, are not connected to a central electricity grid.
Data and stylised facts
Data on electrification are scarce and their usefulness is limited as definitions for ‗access
to electricity‘ differ per country (IEA, 2002). The data from the World Energy Outlook (2002)
was used to analyse stylised facts in the relation between development and electrification. This
data strongly suggests that the higher the income, the higher the electrification rates. In fact, the
electrification rate increases fast initially and then slows down as only remote areas are left to be
electrified (see Figure 9 and 10).
0
20
40
60
80
100
0 1000 2000 3000 4000 5000 6000 7000
GDP/Capita, PPP (1995 Int $)
Ele
ctr
ific
ation R
ate
(%
)
Latin America North Africa sub-Saharan Africa
South Asia East Asia Urban/Rural (2000)
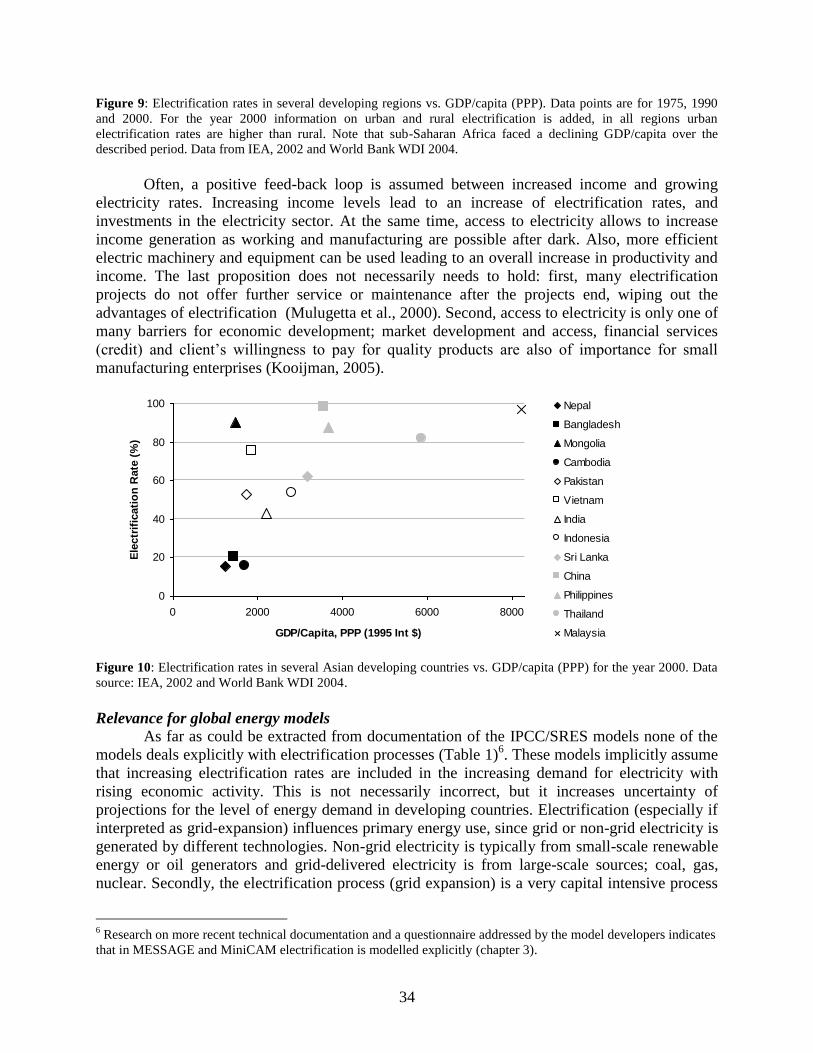
34
Figure 9: Electrification rates in several developing regions vs. GDP/capita (PPP). Data points are for 1975, 1990
and 2000. For the year 2000 information on urban and rural electrification is added, in all regions urban
electrification rates are higher than rural. Note that sub-Saharan Africa faced a declining GDP/capita over the
described period. Data from IEA, 2002 and World Bank WDI 2004.
Often, a positive feed-back loop is assumed between increased income and growing
electricity rates. Increasing income levels lead to an increase of electrification rates, and
investments in the electricity sector. At the same time, access to electricity allows to increase
income generation as working and manufacturing are possible after dark. Also, more efficient
electric machinery and equipment can be used leading to an overall increase in productivity and
income. The last proposition does not necessarily needs to hold: first, many electrification
projects do not offer further service or maintenance after the projects end, wiping out the
advantages of electrification (Mulugetta et al., 2000). Second, access to electricity is only one of
many barriers for economic development; market development and access, financial services
(credit) and client‘s willingness to pay for quality products are also of importance for small
manufacturing enterprises (Kooijman, 2005).
Figure 10: Electrification rates in several Asian developing countries vs. GDP/capita (PPP) for the year 2000. Data
source: IEA, 2002 and World Bank WDI 2004.
Relevance for global energy models
As far as could be extracted from documentation of the IPCC/SRES models none of the
models deals explicitly with electrification processes (Table 1)6. These models implicitly assume
that increasing electrification rates are included in the increasing demand for electricity with
rising economic activity. This is not necessarily incorrect, but it increases uncertainty of
projections for the level of energy demand in developing countries. Electrification (especially if
interpreted as grid-expansion) influences primary energy use, since grid or non-grid electricity is
generated by different technologies. Non-grid electricity is typically from small-scale renewable
energy or oil generators and grid-delivered electricity is from large-scale sources; coal, gas,
nuclear. Secondly, the electrification process (grid expansion) is a very capital intensive process
6 Research on more recent technical documentation and a questionnaire addressed by the model developers indicates
that in MESSAGE and MiniCAM electrification is modelled explicitly (chapter 3).
0
20
40
60
80
100
0 2000 4000 6000 8000
GDP/Capita, PPP (1995 Int $)
Ele
ctr
ific
ati
on
Rate
(%
)
Nepal
Bangladesh
Mongolia
Cambodia
Pakistan
Vietnam
India
Indonesia
Sri Lanka
China
Philippines
Thailand
Malaysia
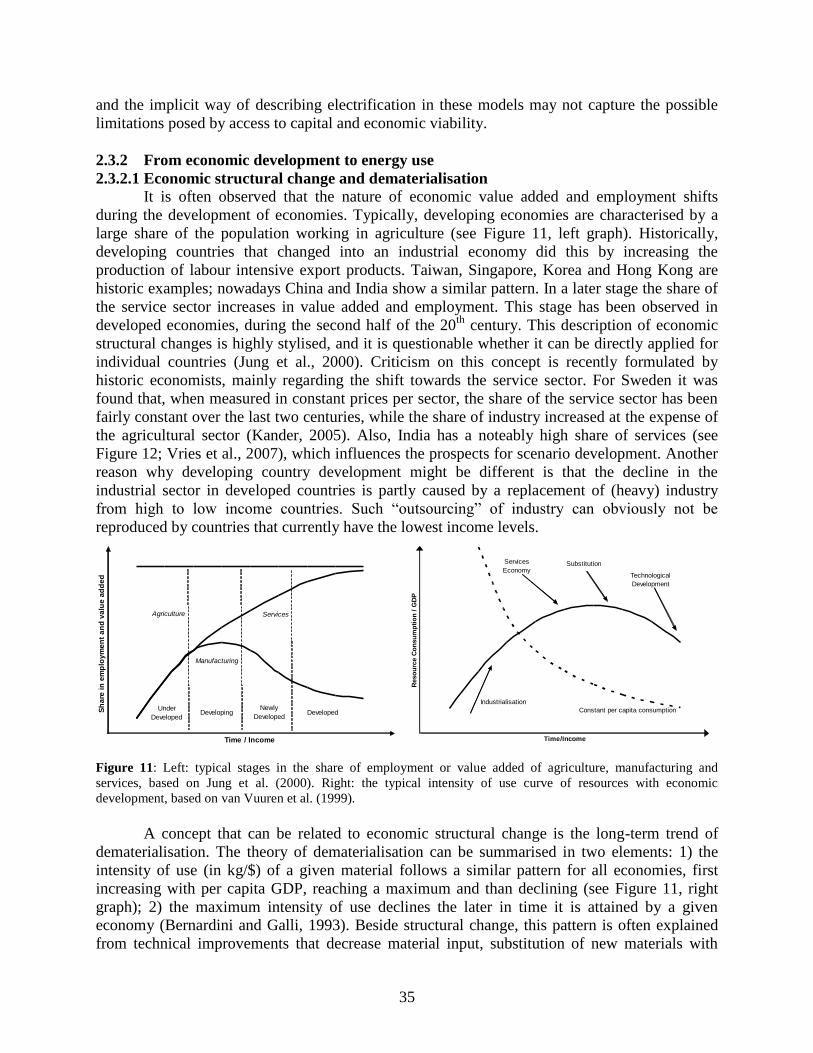
35
and the implicit way of describing electrification in these models may not capture the possible
limitations posed by access to capital and economic viability.
2.3.2 From economic development to energy use
2.3.2.1 Economic structural change and dematerialisation
It is often observed that the nature of economic value added and employment shifts
during the development of economies. Typically, developing economies are characterised by a
large share of the population working in agriculture (see Figure 11, left graph). Historically,
developing countries that changed into an industrial economy did this by increasing the
production of labour intensive export products. Taiwan, Singapore, Korea and Hong Kong are
historic examples; nowadays China and India show a similar pattern. In a later stage the share of
the service sector increases in value added and employment. This stage has been observed in
developed economies, during the second half of the 20th
century. This description of economic
structural changes is highly stylised, and it is questionable whether it can be directly applied for
individual countries (Jung et al., 2000). Criticism on this concept is recently formulated by
historic economists, mainly regarding the shift towards the service sector. For Sweden it was
found that, when measured in constant prices per sector, the share of the service sector has been
fairly constant over the last two centuries, while the share of industry increased at the expense of
the agricultural sector (Kander, 2005). Also, India has a noteably high share of services (see
Figure 12; Vries et al., 2007), which influences the prospects for scenario development. Another
reason why developing country development might be different is that the decline in the
industrial sector in developed countries is partly caused by a replacement of (heavy) industry
from high to low income countries. Such ―outsourcing‖ of industry can obviously not be
reproduced by countries that currently have the lowest income levels.
Figure 11: Left: typical stages in the share of employment or value added of agriculture, manufacturing and
services, based on Jung et al. (2000). Right: the typical intensity of use curve of resources with economic
development, based on van Vuuren et al. (1999).
A concept that can be related to economic structural change is the long-term trend of
dematerialisation. The theory of dematerialisation can be summarised in two elements: 1) the
intensity of use (in kg/$) of a given material follows a similar pattern for all economies, first
increasing with per capita GDP, reaching a maximum and than declining (see Figure 11, right
graph); 2) the maximum intensity of use declines the later in time it is attained by a given
economy (Bernardini and Galli, 1993). Beside structural change, this pattern is often explained
from technical improvements that decrease material input, substitution of new materials with
Time / Income
Sh
are
in
em
plo
ym
en
t a
nd
va
lue
ad
de
d
Under
DevelopedDeveloping
Newly
DevelopedDeveloped
Agriculture Services
Manufacturing
Time/Income
Reso
urc
e C
on
su
mp
tio
n /
GD
P
Industrialisation
Services
Economy Substitution
Technological
Development
Constant per capita consumption
Time / Income
Sh
are
in
em
plo
ym
en
t a
nd
va
lue
ad
de
d
Under
DevelopedDeveloping
Newly
DevelopedDeveloped
Agriculture Services
Manufacturing
Time/Income
Reso
urc
e C
on
su
mp
tio
n /
GD
P
Industrialisation
Services
Economy Substitution
Technological
Development
Constant per capita consumption
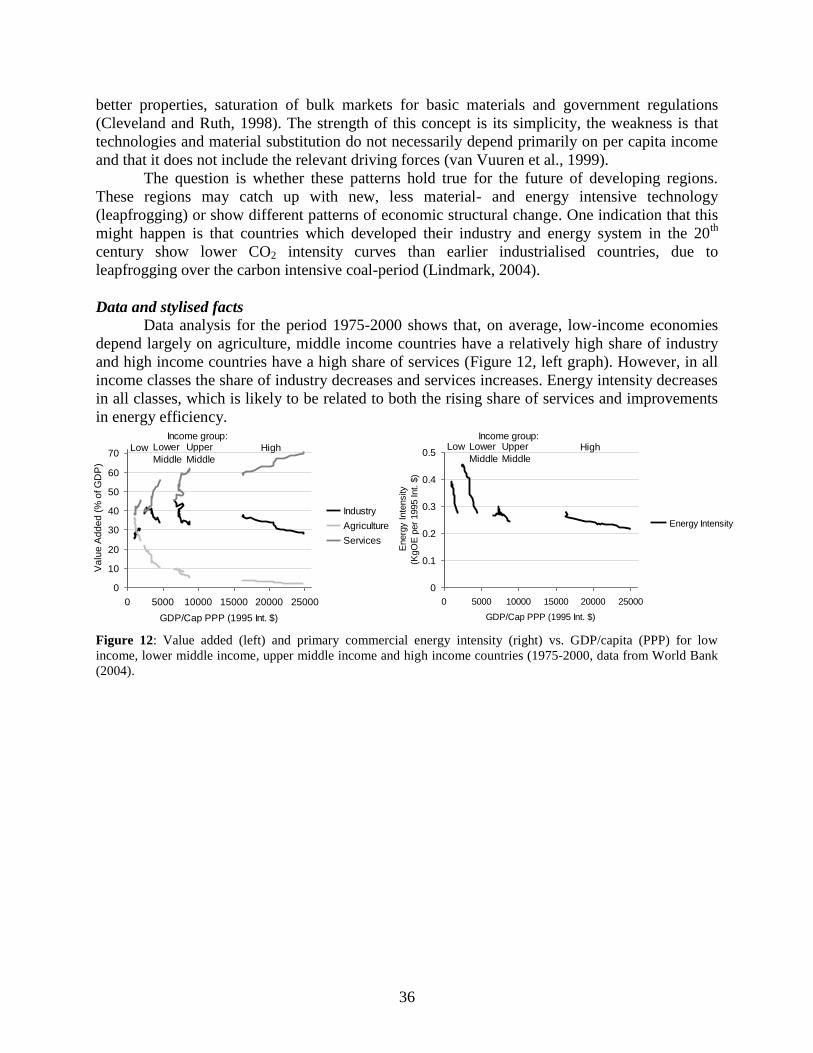
36
better properties, saturation of bulk markets for basic materials and government regulations
(Cleveland and Ruth, 1998). The strength of this concept is its simplicity, the weakness is that
technologies and material substitution do not necessarily depend primarily on per capita income
and that it does not include the relevant driving forces (van Vuuren et al., 1999).
The question is whether these patterns hold true for the future of developing regions.
These regions may catch up with new, less material- and energy intensive technology
(leapfrogging) or show different patterns of economic structural change. One indication that this
might happen is that countries which developed their industry and energy system in the 20th
century show lower CO2 intensity curves than earlier industrialised countries, due to
leapfrogging over the carbon intensive coal-period (Lindmark, 2004).
Data and stylised facts
Data analysis for the period 1975-2000 shows that, on average, low-income economies
depend largely on agriculture, middle income countries have a relatively high share of industry
and high income countries have a high share of services (Figure 12, left graph). However, in all
income classes the share of industry decreases and services increases. Energy intensity decreases
in all classes, which is likely to be related to both the rising share of services and improvements
in energy efficiency.
Figure 12: Value added (left) and primary commercial energy intensity (right) vs. GDP/capita (PPP) for low
income, lower middle income, upper middle income and high income countries (1975-2000, data from World Bank
(2004).
0
10
20
30
40
50
60
70
0 5000 10000 15000 20000 25000
GDP/Cap PPP (1995 Int. $)
Va
lue
Ad
de
d (
% o
f G
DP
)
Industry
Agriculture
Services
0
0.1
0.2
0.3
0.4
0.5
0 5000 10000 15000 20000 25000
GDP/Cap PPP (1995 Int. $)
Energ
y Inte
nsity
(KgO
E p
er
1995 Int. $
)
Energy Intensity
Low Lower
Middle
Upper
Middle
HighIncome group:
Low Lower
Middle
Upper
Middle
High
Income group:
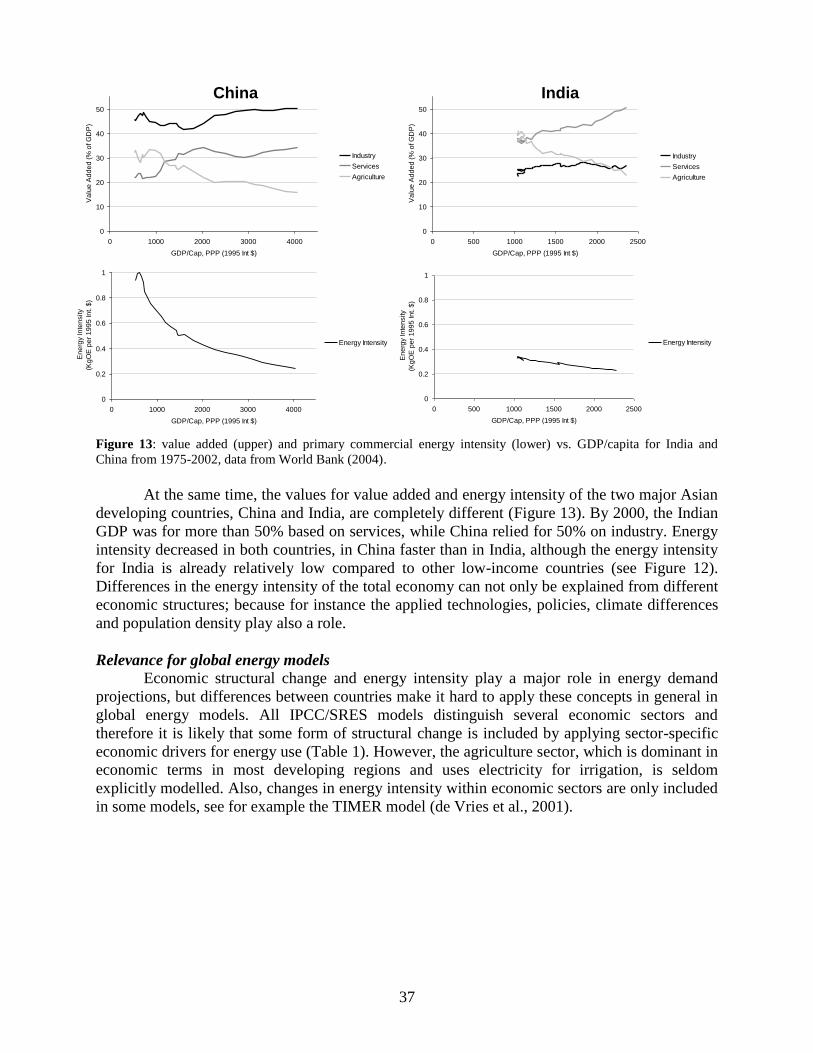
37
Figure 13: value added (upper) and primary commercial energy intensity (lower) vs. GDP/capita for India and
China from 1975-2002, data from World Bank (2004).
At the same time, the values for value added and energy intensity of the two major Asian
developing countries, China and India, are completely different (Figure 13). By 2000, the Indian
GDP was for more than 50% based on services, while China relied for 50% on industry. Energy
intensity decreased in both countries, in China faster than in India, although the energy intensity
for India is already relatively low compared to other low-income countries (see Figure 12).
Differences in the energy intensity of the total economy can not only be explained from different
economic structures; because for instance the applied technologies, policies, climate differences
and population density play also a role.
Relevance for global energy models
Economic structural change and energy intensity play a major role in energy demand
projections, but differences between countries make it hard to apply these concepts in general in
global energy models. All IPCC/SRES models distinguish several economic sectors and
therefore it is likely that some form of structural change is included by applying sector-specific
economic drivers for energy use (Table 1). However, the agriculture sector, which is dominant in
economic terms in most developing regions and uses electricity for irrigation, is seldom
explicitly modelled. Also, changes in energy intensity within economic sectors are only included
in some models, see for example the TIMER model (de Vries et al., 2001).
0
0.2
0.4
0.6
0.8
1
0 1000 2000 3000 4000
GDP/Cap, PPP (1995 Int $)
En
erg
y In
ten
sity
(Kg
OE
pe
r 1
99
5 In
t. $
)
Energy Intensity
0
0.2
0.4
0.6
0.8
1
0 500 1000 1500 2000 2500
GDP/Cap, PPP (1995 Int $)
En
erg
y In
ten
sity
(Kg
OE
pe
r 1
99
5 In
t. $
)
Energy Intensity
0
10
20
30
40
50
0 1000 2000 3000 4000
GDP/Cap, PPP (1995 Int $)
Va
lue
Ad
de
d (
% o
f G
DP
)
Industry
Services
Agriculture
0
10
20
30
40
50
0 500 1000 1500 2000 2500
GDP/Cap, PPP (1995 Int $)
Va
lue
Ad
de
d (
% o
f G
DP
)
Industry
Services
Agriculture
China India
0
0.2
0.4
0.6
0.8
1
0 1000 2000 3000 4000
GDP/Cap, PPP (1995 Int $)
En
erg
y In
ten
sity
(Kg
OE
pe
r 1
99
5 In
t. $
)
Energy Intensity
0
0.2
0.4
0.6
0.8
1
0 500 1000 1500 2000 2500
GDP/Cap, PPP (1995 Int $)
En
erg
y In
ten
sity
(Kg
OE
pe
r 1
99
5 In
t. $
)
Energy Intensity
0
10
20
30
40
50
0 1000 2000 3000 4000
GDP/Cap, PPP (1995 Int $)
Va
lue
Ad
de
d (
% o
f G
DP
)
Industry
Services
Agriculture
0
10
20
30
40
50
0 500 1000 1500 2000 2500
GDP/Cap, PPP (1995 Int $)
Va
lue
Ad
de
d (
% o
f G
DP
)
Industry
Services
Agriculture
China India
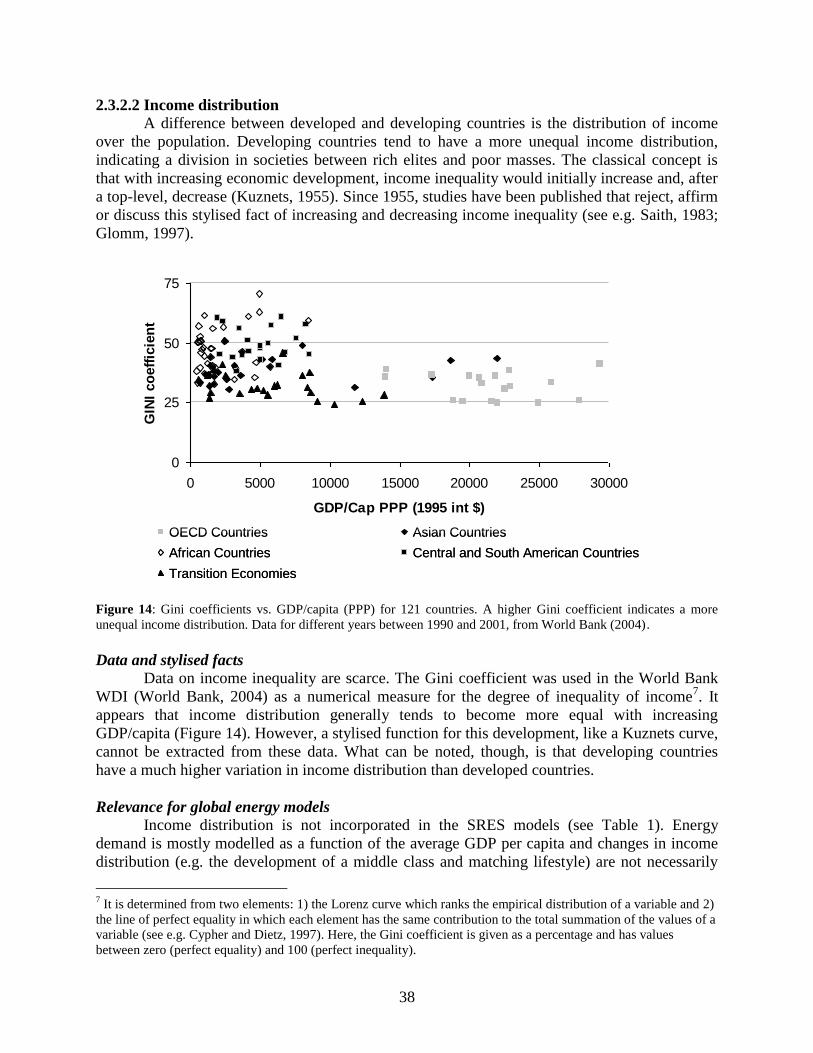
38
2.3.2.2 Income distribution
A difference between developed and developing countries is the distribution of income
over the population. Developing countries tend to have a more unequal income distribution,
indicating a division in societies between rich elites and poor masses. The classical concept is
that with increasing economic development, income inequality would initially increase and, after
a top-level, decrease (Kuznets, 1955). Since 1955, studies have been published that reject, affirm
or discuss this stylised fact of increasing and decreasing income inequality (see e.g. Saith, 1983;
Glomm, 1997).
Figure 14: Gini coefficients vs. GDP/capita (PPP) for 121 countries. A higher Gini coefficient indicates a more
unequal income distribution. Data for different years between 1990 and 2001, from World Bank (2004).
Data and stylised facts
Data on income inequality are scarce. The Gini coefficient was used in the World Bank
WDI (World Bank, 2004) as a numerical measure for the degree of inequality of income7. It
appears that income distribution generally tends to become more equal with increasing
GDP/capita (Figure 14). However, a stylised function for this development, like a Kuznets curve,
cannot be extracted from these data. What can be noted, though, is that developing countries
have a much higher variation in income distribution than developed countries.
Relevance for global energy models
Income distribution is not incorporated in the SRES models (see Table 1). Energy
demand is mostly modelled as a function of the average GDP per capita and changes in income
distribution (e.g. the development of a middle class and matching lifestyle) are not necessarily
7 It is determined from two elements: 1) the Lorenz curve which ranks the empirical distribution of a variable and 2)
the line of perfect equality in which each element has the same contribution to the total summation of the values of a
variable (see e.g. Cypher and Dietz, 1997). Here, the Gini coefficient is given as a percentage and has values
between zero (perfect equality) and 100 (perfect inequality).
0
25
50
75
0 5000 10000 15000 20000 25000 30000
GDP/Cap PPP (1995 int $)
GIN
I co
eff
icie
nt
OECD Countries Asian Countries
African Countries Central and South American Countries
Transition Economies
0
25
50
75
0 5000 10000 15000 20000 25000 30000
GDP/Cap PPP (1995 int $)
GIN
I co
eff
icie
nt
OECD Countries Asian Countries
African Countries Central and South American Countries
Transition Economies
39
reflected in this indicator. Initial research indicates that income distribution could be an
important factor in transport energy demand but more research is needed to explore this topic for
long-term global energy modelling (Storchmann, 2005). In this respect, it is important to realise
that independent modelling of high and low income groups may result in very different dynamic
behavior than suggested by the averages (see Van Vuuren et al., 1999 for example with high and
low income regions). A tentative indication is that models that ignore income distribution
differences in developing countries tend to underestimate energy behavior that is typically
related to low- or high income groups, e.g. the use of traditional energy or the electricity and
transport behavior of high income households.
A complicating factor for including income distribution in energy modelling is the
availability and quality of data. Long-term time series are rare, measuring is not consistent and
future projections are not provided by macro-economic models. Another pitfall is the possible
interference with other developments, like urbanisation and decreasing household size. However,
it could be worthwhile to attempt as it adds a new dynamic process to global energy models; the
available data provide a starting-point and future assumptions can be part of a scenario storyline.
2.3.2.3 Informal economic systems
Most energy models use GDP per capita as a driver for energy use. Apart from the issue
of the underestimation of economies of developing countries using market-exchange rate data
(which can be solved by using PPP data), GDP may still not be a good indicator for the energy
intensity of activities, as developing countries have a large informal sector. This informal
economy involves the unofficial transactions that take place in the real world, but that are not
reflected in official economic descriptions. It is a broad concept, for which different scientists
use different definitions, including or excluding illegal activities, tax evasion and monetary and
non-monetary transactions (Schneider, 2005). The main ‗drivers‘ for the informal economy
appear to be the tax burden and social security contributions, the intensity of regulations, social
transfer systems, overregulation and high cost on the official labour market (Schneider and
Enste, 2000). Informal economies exist all over the world, but in developing countries the
informal economy usually forms a much larger share of the total economy (Kahn and Pfaff,
2000; Chaudhuri et al., 2006): on average in 1999-2000 41% of the total official GDP, against an
average of 17% in OECD-countries (Schneider, 2005).
Data and stylised facts
The main problem of informal transactions is that they are hard to measure; data have to
be derived from indirect indicators. Several methods exist to assess the size of the informal
economy. The direct approach uses surveys and samples, but its reliability might be weak.
Indirect methods use discrepancies between several statistics, for instance between national
expenditures and income statistics. More advanced methods use the expected amount of
transactions in the economy or look into the physical input of the economy (e.g. electricity) as an
indicator for the real economic activity. The DYMIMIC model approach (Schneider, 2005) uses
multiple input and output indicators to estimate and explain the size of the informal economy.
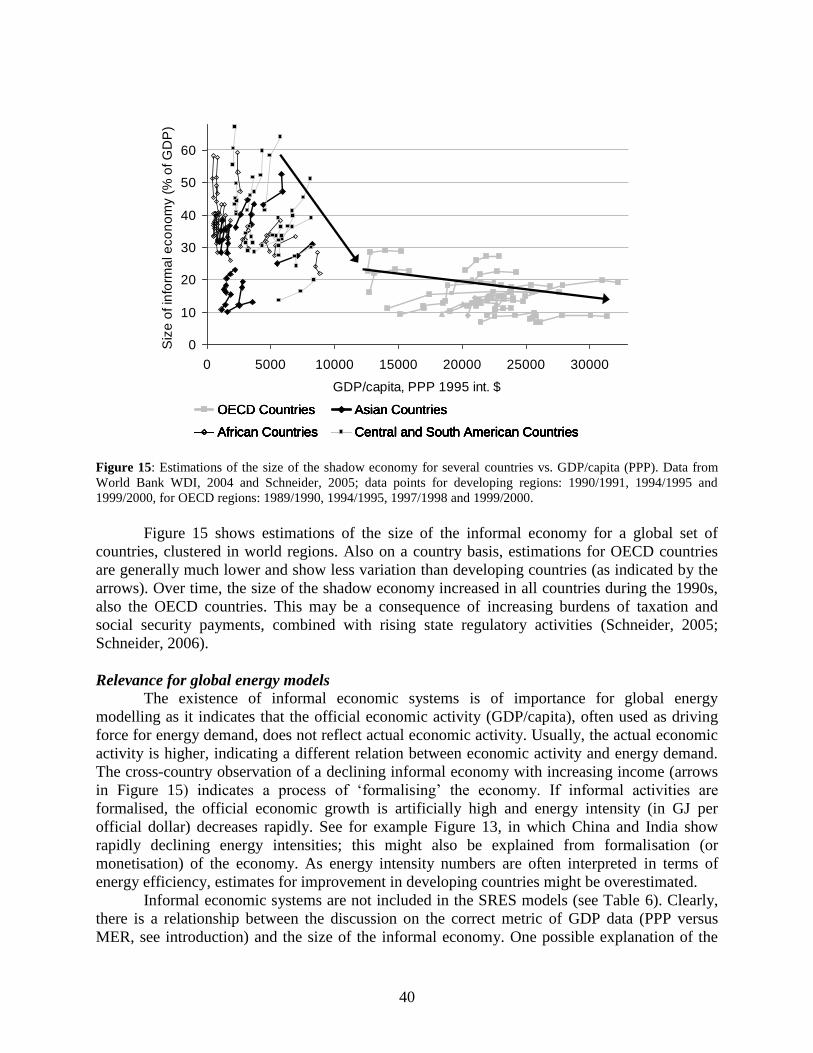
40
Figure 15: Estimations of the size of the shadow economy for several countries vs. GDP/capita (PPP). Data from
World Bank WDI, 2004 and Schneider, 2005; data points for developing regions: 1990/1991, 1994/1995 and
1999/2000, for OECD regions: 1989/1990, 1994/1995, 1997/1998 and 1999/2000.
Figure 15 shows estimations of the size of the informal economy for a global set of
countries, clustered in world regions. Also on a country basis, estimations for OECD countries
are generally much lower and show less variation than developing countries (as indicated by the
arrows). Over time, the size of the shadow economy increased in all countries during the 1990s,
also the OECD countries. This may be a consequence of increasing burdens of taxation and
social security payments, combined with rising state regulatory activities (Schneider, 2005;
Schneider, 2006).
Relevance for global energy models
The existence of informal economic systems is of importance for global energy
modelling as it indicates that the official economic activity (GDP/capita), often used as driving
force for energy demand, does not reflect actual economic activity. Usually, the actual economic
activity is higher, indicating a different relation between economic activity and energy demand.
The cross-country observation of a declining informal economy with increasing income (arrows
in Figure 15) indicates a process of ‗formalising‘ the economy. If informal activities are
formalised, the official economic growth is artificially high and energy intensity (in GJ per
official dollar) decreases rapidly. See for example Figure 13, in which China and India show
rapidly declining energy intensities; this might also be explained from formalisation (or
monetisation) of the economy. As energy intensity numbers are often interpreted in terms of
energy efficiency, estimates for improvement in developing countries might be overestimated.
Informal economic systems are not included in the SRES models (see Table 6). Clearly,
there is a relationship between the discussion on the correct metric of GDP data (PPP versus
MER, see introduction) and the size of the informal economy. One possible explanation of the
0
10
20
30
40
50
60
0 5000 10000 15000 20000 25000 30000
GDP/capita, PPP 1995 int. $
Siz
e o
f in
form
al e
co
no
my (
% o
f G
DP
)
OECD Countries Asian Countries
African Countries Central and South American Countries
OECD Countries Asian Countries
African Countries Central and South American Countries
41
large differences in the PPP/MER ratio is that informal economic activities decrease the prices of
tradable services and goods also on the official market, increasing the purchasing power of
consumers. The relation between PPP and the informal economy is unfortunately barely
understood (Schneider, 2006) – and alternative explanations for high PPP/MER ratios also exist
(Van Vuuren and Alfsen, 2006).
2.3.3 The context of development
An implicit assumption of many global energy models is that the future of developing
regions can be derived from experiences during the last decades in industrialised regions. This
focus on only the recent past of industrialised regions (for practical reasons), unfortunately
implies that potentially valuable information from the times that Western countries were at the
economic activity level (but not technology level) of present-day developing countries is not
often used to develop insights in developing countries trends. Above, some characteristics of
energy systems and socio-economic developments are discussed that mark the difference
between developed and developing regions. A final series of issues is related to the context in
which energy systems are developing: depletion of fossil resources, climate change and local air
pollution. These issues are not unique for developing regions (high energy prices and air
pollution were also relevant for Western countries in the 19th
century) but they might drive
energy systems in developing countries in a different direction than industrialised regions since
1960. Generally, these issues are more elaborately included in global energy models than the
issues discussed before (see Table 1).
2.3.3.1 Fossil energy resource depletion
The issue of resource depletion and increasing energy costs is included in all SRES
models, mostly based on a single fossil resource assessment (Rogner, 1997) (see Table 1). This is
the most straightforward impact of resource depletion: some energy sources become more
expensive upon depletion, causing a shift towards competitive alternatives. A second impact is
the feedback of rising long-term energy costs (or at least a break with the long-term decline) on
economic development, a process that can only be modelled in integrated energy-economy
models (many of the SRES models are partial equilibrium models and do not capture this
feedback). The question here is whether experiences during the oil crisis can be used to model
expected future depletion of fossil resources. It should be noted that as oil-importing developing
countries have a higher energy intensity, they are much more vulnerable to energy price
increases than Western countries (Lucon et al., 2006; Srivastava and Misra, 2007). At the same
time, long-term economic history shows that energy prices were also relatively high during the
early stages of economic development in Western countries (Kander, 2002); this period might
provide valuable lessons to global energy models.
2.3.3.2 Climate change
Historically, climate change has hardly had any impact on the development of energy
systems, both in developing and industrialised regions. However, since energy use is responsible
for the majority of greenhouse gas emissions and climate change is expected to influence
economic development (O'Brien et al., 2004; Halsnæs et al., 2007), it becomes a relevant issue
for energy systems in developing countries. Climate change can have two major impacts on the
development of the energy system. One is that changes in climate can lead to changes in energy
demand projections (e.g. higher cooling demand) or to constraints in energy production (e.g.
42
operational requirements in power plants). A much more relevant impact, however, is the impact
of climate policy on energy system development. Model studies stress the importance of
involving developing countries in international climate policy – in order to avoid high costs and
to keep ambitious climate policy targets attainable (e.g. van Vuuren et al., 2007). However, as
energy technologies with low or zero greenhouse gas emissions are usually more expensive than
their fossil fuel alternatives this raises the issue who will pay for these additional costs. At the
moment, the position of developing countries in international negotiations is that the additional
burden of climate policy would damage their abilities for development. Current models are in
principle well equipped to assess the additional costs of mitigation trajectories, also on a regional
basis (including different proposals for differentiation of commitments among developed and
developing countries). There are, however, open issues with respect to additional implementation
barriers (e.g. information, risk) in developing countries that are poorly captured by these models.
In any case, climate policy might put developing (and developed) countries on a different
trajectory than observed historically.
2.3.3.3 Urban air pollution
One of the major present-day energy-related problems in developing countries is urban
air pollution. During the Industrial Revolution, Western countries also suffered from urban air
pollution (Mosley, 2001) and more recently other forms of regional air pollution (e.g.
acidification). Especially in the last decades, these problems have been solved using end-of-pipe
technology for sulfur emissions, volatile organic compounds and nitrous oxides. Since most of
these technologies are affordable and available in developing regions, this issue alone might not
be very decisive on the future development of energy systems. However, if combined with
climate policy (e.g. van Vuuren et al., 2006) or if renewable energy is promoted as a solution
(e.g. Boudri et al., 2002), urban air pollution can benefit from other developments in the energy
system that have an impact on the energy system structure. Interestingly, the link could also
work the other way around. While historically, end-of-pipe solutions have been favored,
integrated consideration of both air pollution and climate policy objectives, could lead to a
preference for energy efficiency and low-greenhouse gas energy supply options driven primarily
by the desire to reduce health impacts of air pollution (Bollen et al., 2007).
2.4 Discussion and conclusion
This chapter discussed the handling of developing countries in energy-climate models,
suggesting that given the increasing importance of developing countries, these models might
need to be reformulated to better capture the dynamics of developing country energy systems.
The need of focus meant that this chapter focused on only a selection of the issues that are
relevant in this context. Other key issues like development of infrastructure or technology
leapfrogging could have been discussed as well. Also examples of only a limited set of models
(the IPCC/SRES models) have been used as they represented a useful consistent scenario
database. Of course the choice of models influences the results, but to this experience most
discussed issues are not well captured in other global energy models either. Most data used in
this chapter are derived from global databases: the World Bank WDI, the FAO statistical
database, the IEA world energy outlook. These data are harmonised and comparable between
countries, but insight in the reliability and collecting methods is generally weak. Finally, global
energy models are (also) used to support a wide range of policy-making and weakness in
modelling the energy systems of developing countries might lead to inaccuracies in policy-
43
making. However, it is at this stage not possible to speculate about what the inclusion of the
developing country issues in global energy models would mean for the results. Many of these
issues have implications that work in two directions, both increasing and decreasing energy use
and GHG emissions.
In this study, it was found that the results of the IPCC/SRES global energy models for
Asia are consistent with general ―energy development‖ theories such as the Environmental
Kuznets Curve and the Energy Ladder. Although some of the driving forces behind these
concepts are already included in these models, several improvements for example on traditional
fuel use, electrification, structural change, income distribution, the informal economy and a
feedback of climate change on the economy, can increase their credibility for changes in the
energy systems of developing countries.
The modelling of traditional energy, which is currently only done in three of the SRES
models, can be improved by including wood-supply. This could be linked to forestation policies
and health policies related to indoor air pollution. Explicitly accounting for electrification might
improve the quality of projections on energy demand and technology choices for electricity
generation. This could be related to electrification policies and the role of off-grid (renewable)
energy systems. Economic structural change seems to be included in all SRES models, but the
agriculture sector is not explicitly modelled. Modelling income distribution and rural/urban
differences can give more insight in the impact of different lifestyles. Establishing a relation
between different income groups, their behavior towards energy use and linking this to income-
related energy pricing could be useful. Modelling the role of the informal economy might be
useful, but seems not possible with current knowledge. Modelling the impacts of climate policy
and climate change on the economy could be valuable to enhance insight in suitable GHG
reduction mechanisms and their full effects.
2.5 Acknowledgements
Thanks to Ton Schoot Uiterkamp and Annemarije Kooijman for their comments on draft
versions of this chapter and three anonymous reviewers for their useful comments on this
chapter.
44
3. Modelling energy systems for developing countries8
Abstract
Developing countries‘ energy use is rapidly increasing, which affects global climate
change and global and regional energy settings. Energy models are helpful for exploring the
future of developing and industrialised countries. However, energy systems of developing
countries differ from those of industrialised countries, which has consequences for energy
modelling. New requirements should be met by present-day energy models to adequately explore
the future of developing countries‘ energy systems. This chapter aims to assess if the main
characteristics of developing countries are adequately incorporated in present-day energy
models. These main characteristics will first be discussed; focusing particularly on developing
Asia, and then a model comparison will be presented consisting of 12 selected energy models to
test their suitability for developing countries. It is concluded that many models tend to be biased
towards industrialised countries, neglecting main characteristics of developing countries, e.g. the
informal economy, supply shortages, poor performance of the power sector, structural economic
change, electrification, traditional biofuels and the urban–rural divide. To more adequately
address the energy systems of developing countries, energy models should be adapted and new
models should be build. It is therefore indicated how to improve energy models for increasing
their suitability for developing countries and it is given advice on modelling techniques and data
requirements.
3.1 Introduction
The energy use in developing countries is rapidly growing and affects global climate
change and the world‘s energy resource stocks. Mankind has to acknowledge the increasing
influence of developing countries on the global energy setting. One way to do this is through
energy models, which explore the future of the global and regional energy setting and the effects
of energy use on the human and natural environment.
Most present-day energy models were built and used by industrialised countries, so that
the assumptions about energy systems of developing countries were mainly based on experience
from the energy systems of industrialised countries. It was therefore assumed that the energy
systems of developing countries would behave like those of industrialised countries (Shukla,
1995). It was further assumed, that the present-day development trajectories for developing
countries would be similar to the historic development trajectories in industrialised countries,
which in reality is not the case. For energy modelling, trends for developing regions were
derived from those of industrialised regions and extrapolated to low-income ranges. What seems
to be a fair modelling technique may nevertheless result in models biased towards industrialised
countries, possibly leading to incorrect interpretations of the energy systems of developing
countries. The use of these biased models is therefore questionable for developing countries.
In line with this reasoning, this chapter of the thesis aims to assess to what extent present-
day energy models used in developing countries adequately address main characteristics of
developing countries‘ energy systems and economies. Chapter 3.2 first describes briefly these
main characteristics: poor performance of the power sector and traditional fuels which implies
supply shortages, lack of access to electricity and the predominance of traditional biofuels.
8 This chapter is a slightly adapted version of Urban, F., Benders, R.M.J., Moll, H.C., 2007. Modelling energy
systems for developing countries. Energy Policy, Volume 35(6): 3473-3482.
45
Afterwards, it is elaborated on the transitions from traditional to modern economies which
include the informal economy, non-monetary transactions and structural economic change.
Finally, there is a discussion about structural deficiencies in society, economy and energy
systems by which is meant the urban-rural divide, inadequate investment decisions and
misdirected subsidies. For evaluating these characteristics in Chapter 3.3, secondly 12 present-
day energy models are compared to assess their suitability for developing countries‘ energy
systems and their economies. In Chapter 3.4, the results of the energy model comparison are
presented and discussed in Chapter 3.5. In Chapter 3.5, it is also indicated how to improve
energy models for increasing their suitability for developing countries. In Chapter 3.6, the
findings are concluded and recommendations for future research are indicated.
For the description of the energy systems and the model comparison, wide disparities are
acknowledged between ―developing countries‖, particularly between smaller and larger, poorer
and wealthier countries and the differing modelling approaches required for each individual
country. For this study, developing countries are defined as countries with an average income of
below $10,065 GNI per capita (representing the lower and middle income countries of the World
Development Indicators, World Bank, 2006), an under-developed infrastructure and a poor
human development index. Recognising the wide cross-country disparities, the focus is only on
developing Asia in this study, because it is the world‘s largest developing region, hosting the
world‘s largest population, having the highest economic and industrial growth rate and
contributing the most to global climate change in absolute terms compared to the contributions of
other developing regions. The focus is especially on rapidly developing countries such as China
and India.
3.2 Characteristics of the energy systems and economies of developing countries
The energy systems of industrialised countries are characterised by a constant match of
supply and demand, low losses of transmission and distribution, universal access to electricity,
predominance of modern energy carriers, similar structural premises in urban and rural areas,
adequate financing and investment decisions, adequate subsidies and profit-making utility
companies in developed economies with a low extent of informal economies. To the contrary,
the energy systems of developing countries differ from those of industrialised countries and
among each other. A number of issues will be elaborated which are described in scientific
literature as the main characteristics of developing countries‘ energy systems and economies
(e.g. Van der Werff and Benders, 1987; Schramm, 1990; IEA, 2002a b; Xu Yi-chong, 2002, Xu
Yi-chong, 2005; Urban et al., 2006). These characteristics are also the most important issues for
energy modelling. It is therefore evaluated in Chapter 3.4, whether these characteristics have
been adequately addressed in present-day energy models. For the description of the main
characteristics of developing countries‘ energy systems and economies, specific examples for
Asia are given.
3.2.1 Poor performance of the power sector and traditional fuels
Many Asian developing countries suffer from a poor performance of the power sector for
various supply-side, demand-side and economic reasons.
First, from a supply-side perspective, the power system configurations are often sub-
optimal: these systems are often not meeting the demand, even though a substantial excess
capacity may exist (Schramm, 1990). The reasons for the excess capacity are faulty planning and
poorly performed operational and maintenance tasks leading to frequent plant breakdown,
46
outages and voltage fluctuations, resulting in unreliable service causing economic losses
(Schramm, 1990).
For the functioning of modern economies, meeting the electricity demand is crucial.
Supply shortages are unfortunately characteristic for many Asian developing countries and
regions. They are caused by (a) a poor performance of the power sector such as poor conditions
of generation and distribution equipment, inadequate operational and maintenance performance
and a high level of technical and nontechnical losses. Other reasons are (b) a rapidly growing
demand for electricity (c) a low number of power plants (d) technical constraints (e)
organisational problems (f) underfinanced power companies (g) restriction on capital available
for investments (h) a dependence on import of plants and equipment for power supply and (i) too
low consumer prices (Schramm, 1990; Van der Werff and Benders, 1987; IEA, 2002b). A
reliable electricity supply can in some situations also be threatened by high electricity losses,
such as in India where they account for 27%, ranking world second just after Nigeria (IEA,
2002a). The Philippines have also high losses of about 14% and Indonesia has 12%, compared to
an OECD average of about 6% (IEA, 2002a).
Second, a demand-side problem is access to electricity, which is in general rather low in
developing Asia, particularly in poorer rural areas. Only 64% of the Asian population had access
to electricity in 2000, leaving about one billion inhabitants in the dark (IEA, 2002a). A good
example for increased access to electricity is, however, China which managed to achieve an
electrification rate of about 99% in the last years, because of wide-spread electrification
schemes. The lowest electrification rates in Asia in 2000 were in Afghanistan with only 2% and
Myanmar with only 5% (IEA, 2002a). Despite some very low electrification rates, the IEA
(2002a) expects that with rising per capita income access to electricity will reach 81% in
developing Asia by 2030, thus an increase of 0.57% per year. Critically assessed, however, it
appears to be too simplistic to assume a direct link between income and access to electricity for a
number of reasons: income is not equally distributed, governments can refuse to invest in
electricity infrastructure, also structural problems may occur as described earlier, and technical
and geographical limitations exist for grid connections. Further, population growth will also lead
to an increase of at least one billion inhabitants in developing Asia until 2030. Consequently, the
additional one billion inhabitants need to be provided with electricity, which will decrease the
annual rise of electrification rates. Further, stand-alone renewable options or mini-grids are also
possibilities to electrify households, but these options are often not included in the national
statistics of electrification. Finally, some studies advocate that electrification in developing Asia
can only be successful if long-term strategies comprise micro-loans or other forms of financial
support for investments for electric equipments (Kanoria, 2006) or create opportunities for a
higher income generation (Bhattacharyya, 2005), as experience from India has shown.
Third, concerning the demand side, even though electricity consumption is at the rise, the
predominant fuels in developing Asia are still traditional biofuels: fuel wood, fuel roots, dung,
agricultural waste, crop residues, and fuel sticks. Traditional biofuels are primarily used
domestically for cooking and heating, particularly in poorer rural areas, as indicated by 1.7
billion poor inhabitants in Asia who relied on traditional biofuels in 2000, which is about 53% of
the total Asian population (IEA, 2002a; IEA, 2004). The number of people relying on traditional
biofuels is expected to increase to 2.6 billion by 2030, mainly because of population growth and
unavailability of alternative fuels (IEA, 2002a). Besides population growth and the unavailability
of alternative fuels, increased consumption of traditional biofuels is mainly due to three factors:
changes in income, the degree of urbanisation and the degree of industrialisation. The share of
47
traditional biofuels declines in general with rising GDP, although differences exist between
countries and regions (Victor and Victor, 2002). When income distribution and geographic
distribution is taken into account, the relation between income and traditional bio-fuel use,
particularly fuel wood use, can be different (Victor and Victor, 2002), because traditional
biofuels are mainly used by lower income households and in poorer rural areas.
Fourth, from an economic perspective, poor sector financing is common with tariffs
below long-term marginal costs of production or even below average operating costs and a poor
revenue collection performance by the utilities where a large share of the non-paid bills will
never be collected (Schramm, 1990; Van der Werff and Benders, 1987). This is mainly because
governmental departments and government-owned companies are under government protection
and do therefore frequently not pay their electricity bills or because customers are simply to poor
to pay their bills (Schramm, 1990). Another reason for the financial deficiencies is that theft of
electricity is common. India‘s power sector, for instance, is facing a serious risk of bankruptcy,
mainly because of unpaid bills and high transmission and distribution losses (IEA, 2002b). For
such cases, installing a theft-proof system would be helpful, as experience has shown in Haiti
(Schramm, 1990).
3.2.2 Transitions from traditional to modern economies
There are currently transitions ongoing in many Asian countries from a traditional mainly
rural-based economy to a modern mainly industry- or service-based economy. One important
part of these economic transitions is the concept of the informal economy and non-monetary
transactions. The informal economy (also often referred to as the shadow-economy) and non-
monetary transactions take into account the unofficial transactions which occur in reality, but
which are not accounted for in official economic descriptions, like GDP or value added (Chapter
2). The informal economy is a broad concept based on varying definitions associated with illegal
activities, tax evasion or avoidance and (non-)monetary transactions (Schneider, 2005; Chapter
2). The main drivers for the informal economy are estimated to be the burdens from tax and
social security contributions, the intensity of regulations, social transfer systems, overregulation
and high costs on the official labour market (Schneider and Enste, 2000; Chapter 2). All around
the world, informal economies and non-monetary transactions occur, but it has been observed
that they are usually larger in developing countries (Kahn and Pfaff, 2000; Chapter 2). The
informal economy had the size of 41% of the total official GDP in developing countries in 1999–
2000 in average. Although OECD countries also show a share of 17%, the issue is clearly more
present in developing countries (Schneider, 2005; Chapter 2). A major problem with the informal
economy and non-monetary transactions is that data are rare which causes difficulties for
representing developing countries‘ economies and their energy systems.
Besides the informal economy, the economies in developing Asia are characterised by
different structural economic changes than in industrialised countries. For developing countries,
it is often assumed that they will follow the same development trajectory as today‘s
industrialised countries did in the past: first a decline of the agricultural sector, then a heavily
growing industry and later a shift towards the service sector (Jung et al., 2000). It has been
observed, however, that structural economic change in many Asian developing countries takes
place as an early shift towards energy-extensive services in the economy of a country, which
results in low energy intensity. The trends for India, for example, indicate that the country first
developed a modest industrial sector, but then shifted towards the service sector which is
flourishing nowadays (Urban et al., 2006; Chapter 2). There are large differences between
48
countries in Asia, such as between the mainly service-based India and the mainly industry-based
China. These differences can partially be explained by differences in culture (e.g. it is often
stated by Indians that ―India‘s biggest asset is people‖ which can most cost-effectively be
employed in the service sector) and politics (as a communist country China needed a large
industry for producing raw materials, such as steel, for being independent from Western imports
and for competing in the global arms race).
3.2.3 Structural deficiencies in society, economy and energy systems
Many Asian countries suffer from structural problems which affect society, economy and
energy systems. One of these structural problems is the urban–rural divide which describes
differences between urban and rural areas affecting access to energy, fuel use, access to
education, safe drinking water, health services and sanitation. The urban–rural divide is more
common in the developing world than in the industrialised world, usually with rural areas being
worse off than urban areas (WEC, 2005). China, as an example, is expected to have to deal with
rural poverty for another decade as Yao et al. (2004) report, mainly because of the growing
inequality between urban and rural areas as a consequence of policy-makers who tend to favour
urban areas. On the other hand, it has to be noted that national and international policy-makers
regularly stress the importance of increasing basic human needs, infrastructure and economy in
rural areas. Many Asian countries therefore have rural development schemes and/or rural
electrification schemes in place since years or even decades, such as Bangladesh, China, India,
Nepal, the Philippines and Sri Lanka. The existence of rural development schemes is an
indication that the situation might become better in the coming decades.
Another major structural problem of developing Asia‘s power sector is inadequate
planning which results in inadequate investment decisions. In developing countries, actual
investment costs often turn out to be much higher than the initial appraisal estimate, because
forecasting techniques are poor and/or uncertainty ranges were neglected (Schramm, 1990). This
often results in exceeded private and governmental funds, difficulties to attract foreign investors
and incomplete or sub-standard power projects.
Another structural problem can be the abuse or inadequate use of subsidies. Subsidies
were a way of ensuring state regulation of the power industry in many Asian countries in which
the power industry was formerly often dominated by state regulation, monopolies and inefficient
legislative and policy frameworks (IEA, 2002a; Xu Yichong, 2002; Xu Yi-chong, 2005).
Subsidies which are purpose-bound, such as subsidies for rural development and irrigation, e.g.
providing free electricity to farmers, may be helpful for the individual consumer and are a way to
reduce poverty and enhance rural development, but may lead to market distortion, discarded
prices, limited competition between utility companies, and the favouring of government-owned
utility companies.
Conclusively, the energy systems of developing countries are complex and face serious
challenges. To solve these challenges, adequate energy planning is required. Adequate energy
planning can, however, only take place when adequate energy models are used. The issue of
energy modelling is discussed in the following chapter.
3.3 Energy model comparison
The above discussed characteristics of the energy systems of developing countries need
to be addressed in energy models to ensure an adequate representation of developing countries.
This is crucial for an adequate modelling and scenario-making of the regional and global energy
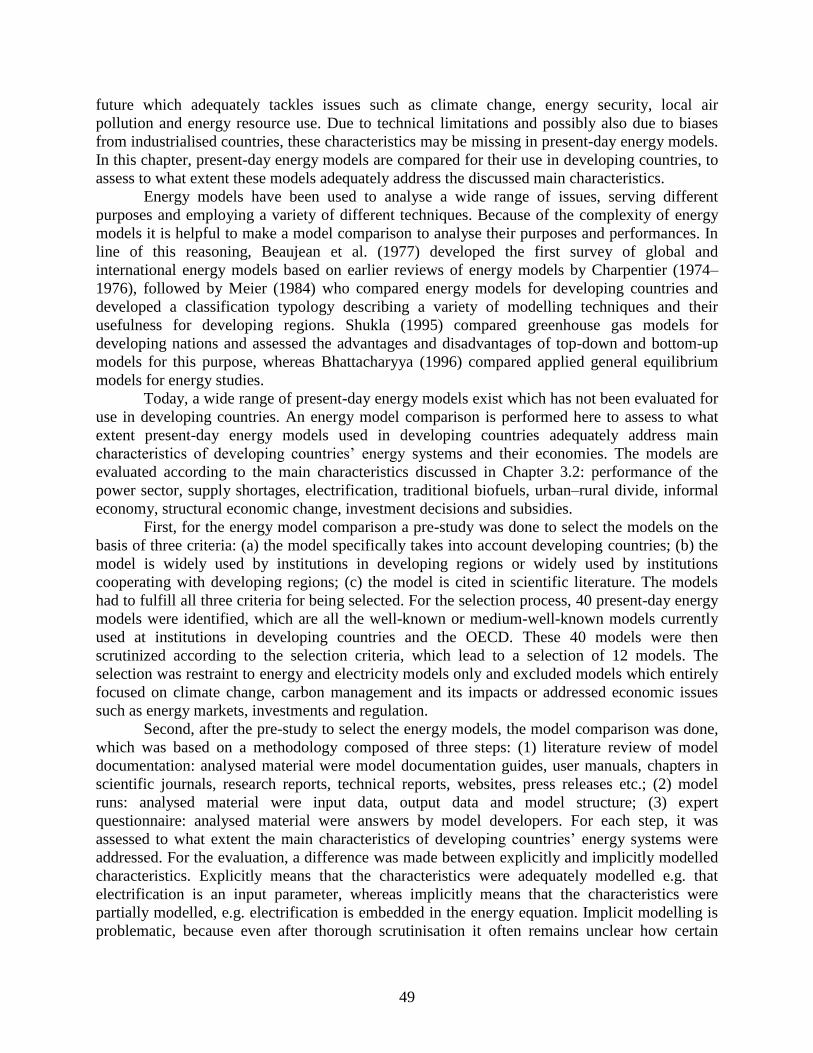
49
future which adequately tackles issues such as climate change, energy security, local air
pollution and energy resource use. Due to technical limitations and possibly also due to biases
from industrialised countries, these characteristics may be missing in present-day energy models.
In this chapter, present-day energy models are compared for their use in developing countries, to
assess to what extent these models adequately address the discussed main characteristics.
Energy models have been used to analyse a wide range of issues, serving different
purposes and employing a variety of different techniques. Because of the complexity of energy
models it is helpful to make a model comparison to analyse their purposes and performances. In
line of this reasoning, Beaujean et al. (1977) developed the first survey of global and
international energy models based on earlier reviews of energy models by Charpentier (1974–
1976), followed by Meier (1984) who compared energy models for developing countries and
developed a classification typology describing a variety of modelling techniques and their
usefulness for developing regions. Shukla (1995) compared greenhouse gas models for
developing nations and assessed the advantages and disadvantages of top-down and bottom-up
models for this purpose, whereas Bhattacharyya (1996) compared applied general equilibrium
models for energy studies.
Today, a wide range of present-day energy models exist which has not been evaluated for
use in developing countries. An energy model comparison is performed here to assess to what
extent present-day energy models used in developing countries adequately address main
characteristics of developing countries‘ energy systems and their economies. The models are
evaluated according to the main characteristics discussed in Chapter 3.2: performance of the
power sector, supply shortages, electrification, traditional biofuels, urban–rural divide, informal
economy, structural economic change, investment decisions and subsidies.
First, for the energy model comparison a pre-study was done to select the models on the
basis of three criteria: (a) the model specifically takes into account developing countries; (b) the
model is widely used by institutions in developing regions or widely used by institutions
cooperating with developing regions; (c) the model is cited in scientific literature. The models
had to fulfill all three criteria for being selected. For the selection process, 40 present-day energy
models were identified, which are all the well-known or medium-well-known models currently
used at institutions in developing countries and the OECD. These 40 models were then
scrutinized according to the selection criteria, which lead to a selection of 12 models. The
selection was restraint to energy and electricity models only and excluded models which entirely
focused on climate change, carbon management and its impacts or addressed economic issues
such as energy markets, investments and regulation.
Second, after the pre-study to select the energy models, the model comparison was done,
which was based on a methodology composed of three steps: (1) literature review of model
documentation: analysed material were model documentation guides, user manuals, chapters in
scientific journals, research reports, technical reports, websites, press releases etc.; (2) model
runs: analysed material were input data, output data and model structure; (3) expert
questionnaire: analysed material were answers by model developers. For each step, it was
assessed to what extent the main characteristics of developing countries‘ energy systems were
addressed. For the evaluation, a difference was made between explicitly and implicitly modelled
characteristics. Explicitly means that the characteristics were adequately modelled e.g. that
electrification is an input parameter, whereas implicitly means that the characteristics were
partially modelled, e.g. electrification is embedded in the energy equation. Implicit modelling is
problematic, because even after thorough scrutinisation it often remains unclear how certain
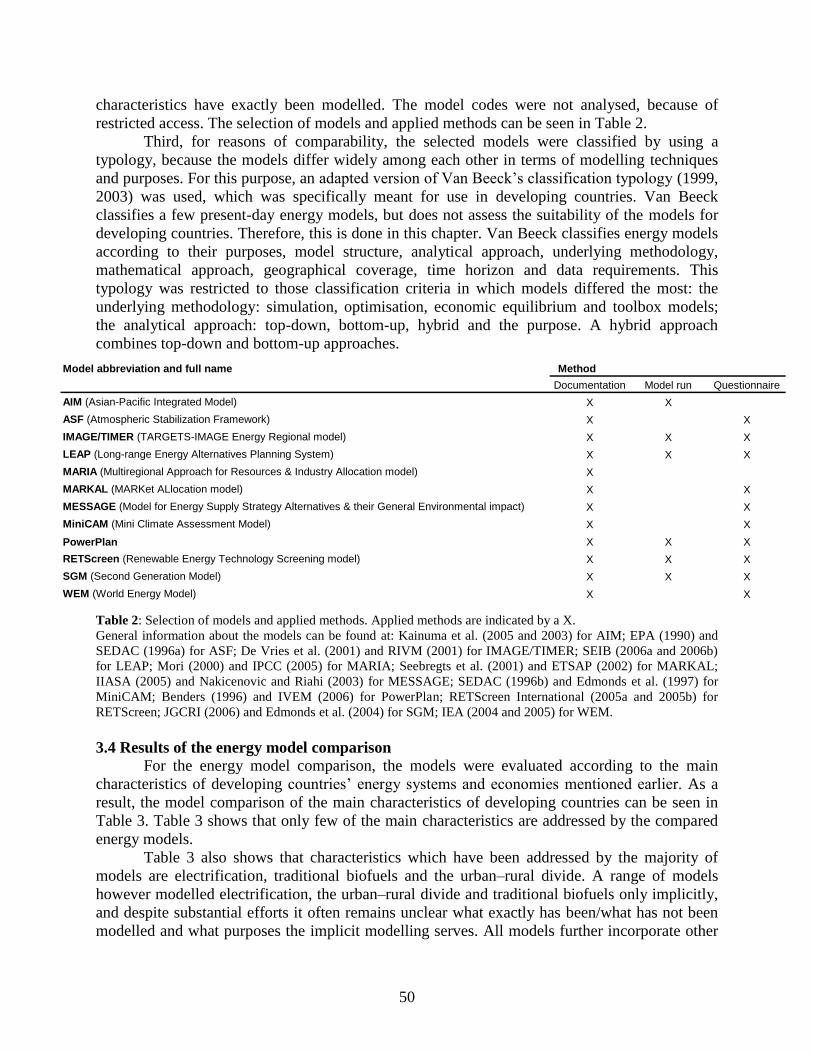
50
characteristics have exactly been modelled. The model codes were not analysed, because of
restricted access. The selection of models and applied methods can be seen in Table 2.
Third, for reasons of comparability, the selected models were classified by using a
typology, because the models differ widely among each other in terms of modelling techniques
and purposes. For this purpose, an adapted version of Van Beeck‘s classification typology (1999,
2003) was used, which was specifically meant for use in developing countries. Van Beeck
classifies a few present-day energy models, but does not assess the suitability of the models for
developing countries. Therefore, this is done in this chapter. Van Beeck classifies energy models
according to their purposes, model structure, analytical approach, underlying methodology,
mathematical approach, geographical coverage, time horizon and data requirements. This
typology was restricted to those classification criteria in which models differed the most: the
underlying methodology: simulation, optimisation, economic equilibrium and toolbox models;
the analytical approach: top-down, bottom-up, hybrid and the purpose. A hybrid approach
combines top-down and bottom-up approaches.
Table 2: Selection of models and applied methods. Applied methods are indicated by a X.
General information about the models can be found at: Kainuma et al. (2005 and 2003) for AIM; EPA (1990) and
SEDAC (1996a) for ASF; De Vries et al. (2001) and RIVM (2001) for IMAGE/TIMER; SEIB (2006a and 2006b)
for LEAP; Mori (2000) and IPCC (2005) for MARIA; Seebregts et al. (2001) and ETSAP (2002) for MARKAL;
IIASA (2005) and Nakicenovic and Riahi (2003) for MESSAGE; SEDAC (1996b) and Edmonds et al. (1997) for
MiniCAM; Benders (1996) and IVEM (2006) for PowerPlan; RETScreen International (2005a and 2005b) for
RETScreen; JGCRI (2006) and Edmonds et al. (2004) for SGM; IEA (2004 and 2005) for WEM.
3.4 Results of the energy model comparison
For the energy model comparison, the models were evaluated according to the main
characteristics of developing countries‘ energy systems and economies mentioned earlier. As a
result, the model comparison of the main characteristics of developing countries can be seen in
Table 3. Table 3 shows that only few of the main characteristics are addressed by the compared
energy models.
Table 3 also shows that characteristics which have been addressed by the majority of
models are electrification, traditional biofuels and the urban–rural divide. A range of models
however modelled electrification, the urban–rural divide and traditional biofuels only implicitly,
and despite substantial efforts it often remains unclear what exactly has been/what has not been
modelled and what purposes the implicit modelling serves. All models further incorporate other
Model abbreviation and full name Method
Documentation Model run Questionnaire
AIM (Asian-Pacific Integrated Model) X X
ASF (Atmospheric Stabilization Framework) X X
IMAGE/TIMER (TARGETS-IMAGE Energy Regional model) X X X
LEAP (Long-range Energy Alternatives Planning System) X X X
MARIA (Multiregional Approach for Resources & Industry Allocation model) X
MARKAL (MARKet ALlocation model) X X
MESSAGE (Model for Energy Supply Strategy Alternatives & their General Environmental impact) X X
MiniCAM (Mini Climate Assessment Model) X X
PowerPlan X X X
RETScreen (Renewable Energy Technology Screening model) X X X
SGM (Second Generation Model) X X X
WEM (World Energy Model) X X
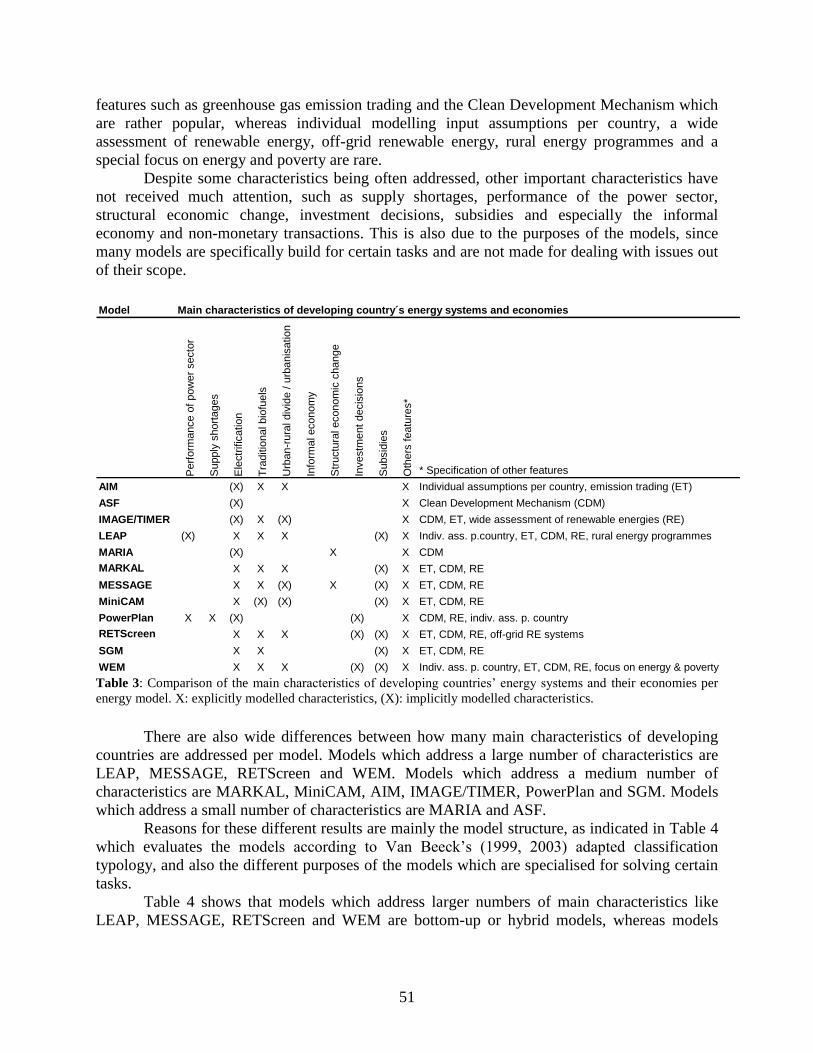
51
features such as greenhouse gas emission trading and the Clean Development Mechanism which
are rather popular, whereas individual modelling input assumptions per country, a wide
assessment of renewable energy, off-grid renewable energy, rural energy programmes and a
special focus on energy and poverty are rare.
Despite some characteristics being often addressed, other important characteristics have
not received much attention, such as supply shortages, performance of the power sector,
structural economic change, investment decisions, subsidies and especially the informal
economy and non-monetary transactions. This is also due to the purposes of the models, since
many models are specifically build for certain tasks and are not made for dealing with issues out
of their scope.
Model Main characteristics of developing country´s energy systems and economies
Perf
orm
ance o
f pow
er
secto
r
Supply
short
ages
Ele
ctr
ific
ation
Tra
ditio
nal bio
fuels
Urb
an-r
ura
l div
ide /
urb
anis
ation
Info
rmal econom
y
Str
uctu
ral econom
ic c
hange
Investm
ent
decis
ions
Subsid
ies
Oth
ers
featu
res*
* Specification of other features
AIM (X) X X X Individual assumptions per country, emission trading (ET)
ASF (X) X Clean Development Mechanism (CDM)
IMAGE/TIMER (X) X (X) X CDM, ET, wide assessment of renewable energies (RE)
LEAP (X) X X X (X) X Indiv. ass. p.country, ET, CDM, RE, rural energy programmes
MARIA (X) X X CDM
MARKAL X X X (X) X ET, CDM, RE
MESSAGE X X (X) X (X) X ET, CDM, RE
MiniCAM X (X) (X) (X) X ET, CDM, RE
PowerPlan X X (X) (X) X CDM, RE, indiv. ass. p. country
RETScreen X X X (X) (X) X ET, CDM, RE, off-grid RE systems
SGM X X (X) X ET, CDM, RE
WEM X X X (X) (X) X Indiv. ass. p. country, ET, CDM, RE, focus on energy & poverty
Table 3: Comparison of the main characteristics of developing countries‘ energy systems and their economies per
energy model. X: explicitly modelled characteristics, (X): implicitly modelled characteristics.
There are also wide differences between how many main characteristics of developing
countries are addressed per model. Models which address a large number of characteristics are
LEAP, MESSAGE, RETScreen and WEM. Models which address a medium number of
characteristics are MARKAL, MiniCAM, AIM, IMAGE/TIMER, PowerPlan and SGM. Models
which address a small number of characteristics are MARIA and ASF.
Reasons for these different results are mainly the model structure, as indicated in Table 4
which evaluates the models according to Van Beeck‘s (1999, 2003) adapted classification
typology, and also the different purposes of the models which are specialised for solving certain
tasks.
Table 4 shows that models which address larger numbers of main characteristics like
LEAP, MESSAGE, RETScreen and WEM are bottom-up or hybrid models, whereas models
52
which address smaller numbers of main characteristics like ASF and MARIA are top-down
optimisation models.
Table 4: Typology of selected energy models, specifying the underlying methodology, analytical approach and
purpose. Adapted from Van Beeck´s energy model classification (1999; 2003). *: Optimisation and Economic
Equilibrium Model.
3.5 Discussion
3.5.1 Discussion of model comparison and model groups
In Chapter 3.2, the main characteristics of the energy systems and economies of
developing countries are first discussed. Modelling these main characteristics is crucial for an
adequate representation of developing countries and therewith also crucial for an adequate
modelling and scenario-making of the energy future and environmental problems. In line of this
reasoning, present-day energy models were compared to assess whether the main characteristics
of the energy systems and economies of developing countries are incorporated in the models.
Differing results were found, both positive and negative, which can mainly be explained
by the differing underlying methodology, analytical approach and purpose of the models. These
model classification differences will be discussed in detail at this point referring to top-down,
bottom-up and hybrid models as well as to simulation, optimisation, economic equilibrium and
toolbox models.
Top-down models use aggregated data for predicting purposes, they do not explicitly
represent technologies and the most efficient technologies are given by the production frontier,
which is set by market behaviour. Top-down models also determine energy demand through
aggregate economic indices like GDP and price elasticities, but vary in addressing energy
supply. They exogenise behavioural relationships and assume there are no discontinuities in
historical trends (Van Beeck, 1999). One reason why a top- down approach is not realistic for
developing countries is that market behaviour is only a limited driver of energy consumption and
production frontiers are less clear defined than in industrialised countries (e.g. the production
frontier of fuel wood). Also, a large part of the economy is non-monetary and aggregate
economic indices are not in relation to income distribution, living standards, energy supply and
demand. Technologies can further not be determined by market behaviour, because predominant
technologies are often based on traditional biofuels, which are not part of the commercial market.
Also, assuming no discontinuities in historical trends is not realistic, because rapid population
and economic growth affect energy use much more today than a few decades ago, as can be
Model Method Approach Type of model / purpose
Simulation Optimis.* Eco. Equi.* Toolbox Top-down Bottom-up Hybrid
AIM X X Energy-economy-climate
ASF X X Energy-economy-climate
IMAGE/TIMER X X Energy-economy-climate
LEAP X X Energy-economy-environment tool
MARIA X X Energy-economy-climate
MARKAL X X Energy-economy-climate
MESSAGE X X Energy supply-economy-climate
MiniCAM X X Energy-economy-climate
PowerPlan X X Electricity-supply-environment
RETScreen X X Renewable energy-climate decision support
SGM X X Energy-economy-climate
WEM X X Energy-economy-climate, poverty & development
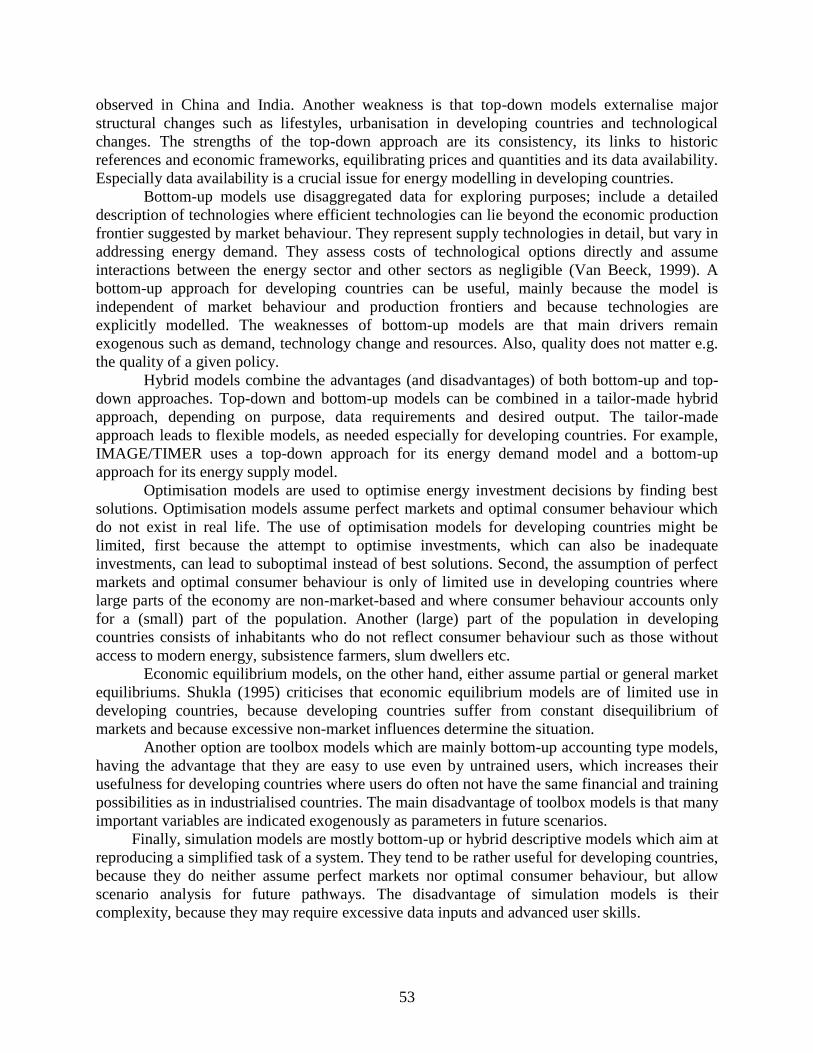
53
observed in China and India. Another weakness is that top-down models externalise major
structural changes such as lifestyles, urbanisation in developing countries and technological
changes. The strengths of the top-down approach are its consistency, its links to historic
references and economic frameworks, equilibrating prices and quantities and its data availability.
Especially data availability is a crucial issue for energy modelling in developing countries.
Bottom-up models use disaggregated data for exploring purposes; include a detailed
description of technologies where efficient technologies can lie beyond the economic production
frontier suggested by market behaviour. They represent supply technologies in detail, but vary in
addressing energy demand. They assess costs of technological options directly and assume
interactions between the energy sector and other sectors as negligible (Van Beeck, 1999). A
bottom-up approach for developing countries can be useful, mainly because the model is
independent of market behaviour and production frontiers and because technologies are
explicitly modelled. The weaknesses of bottom-up models are that main drivers remain
exogenous such as demand, technology change and resources. Also, quality does not matter e.g.
the quality of a given policy.
Hybrid models combine the advantages (and disadvantages) of both bottom-up and top-
down approaches. Top-down and bottom-up models can be combined in a tailor-made hybrid
approach, depending on purpose, data requirements and desired output. The tailor-made
approach leads to flexible models, as needed especially for developing countries. For example,
IMAGE/TIMER uses a top-down approach for its energy demand model and a bottom-up
approach for its energy supply model.
Optimisation models are used to optimise energy investment decisions by finding best
solutions. Optimisation models assume perfect markets and optimal consumer behaviour which
do not exist in real life. The use of optimisation models for developing countries might be
limited, first because the attempt to optimise investments, which can also be inadequate
investments, can lead to suboptimal instead of best solutions. Second, the assumption of perfect
markets and optimal consumer behaviour is only of limited use in developing countries where
large parts of the economy are non-market-based and where consumer behaviour accounts only
for a (small) part of the population. Another (large) part of the population in developing
countries consists of inhabitants who do not reflect consumer behaviour such as those without
access to modern energy, subsistence farmers, slum dwellers etc.
Economic equilibrium models, on the other hand, either assume partial or general market
equilibriums. Shukla (1995) criticises that economic equilibrium models are of limited use in
developing countries, because developing countries suffer from constant disequilibrium of
markets and because excessive non-market influences determine the situation.
Another option are toolbox models which are mainly bottom-up accounting type models,
having the advantage that they are easy to use even by untrained users, which increases their
usefulness for developing countries where users do often not have the same financial and training
possibilities as in industrialised countries. The main disadvantage of toolbox models is that many
important variables are indicated exogenously as parameters in future scenarios.
Finally, simulation models are mostly bottom-up or hybrid descriptive models which aim at
reproducing a simplified task of a system. They tend to be rather useful for developing countries,
because they do neither assume perfect markets nor optimal consumer behaviour, but allow
scenario analysis for future pathways. The disadvantage of simulation models is their
complexity, because they may require excessive data inputs and advanced user skills.
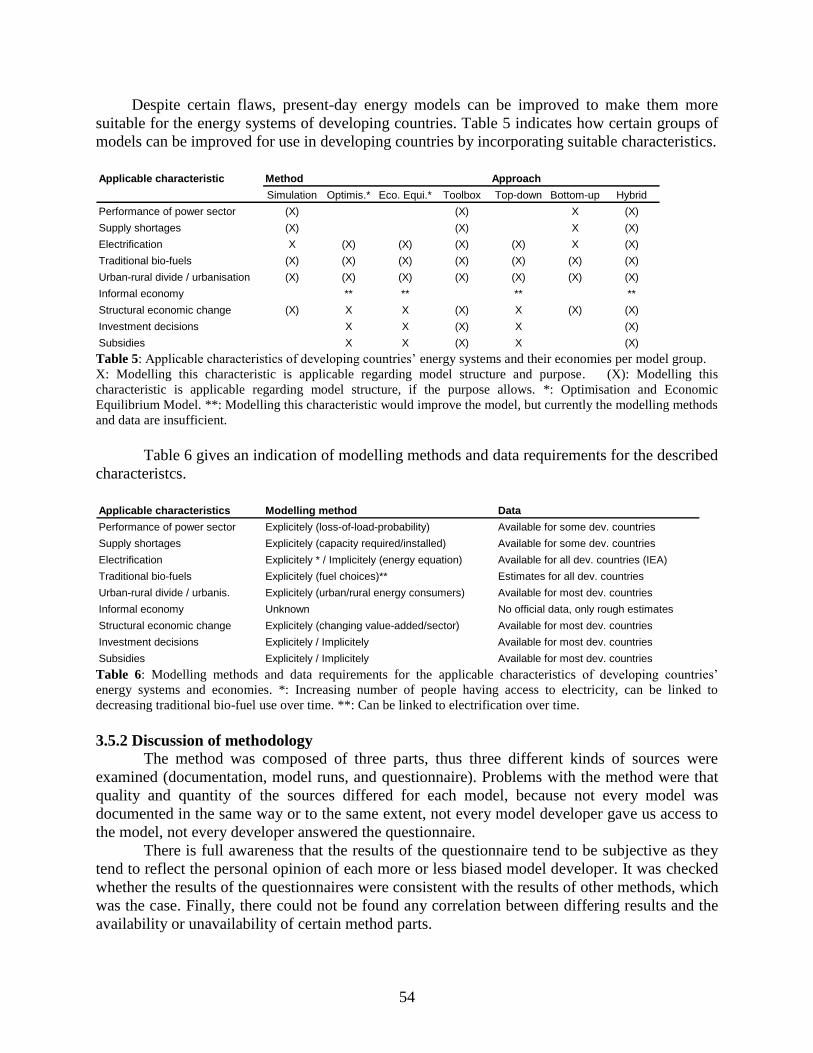
54
Despite certain flaws, present-day energy models can be improved to make them more
suitable for the energy systems of developing countries. Table 5 indicates how certain groups of
models can be improved for use in developing countries by incorporating suitable characteristics.
Applicable characteristic Method Approach
Simulation Optimis.* Eco. Equi.* Toolbox Top-down Bottom-up Hybrid
Performance of power sector (X) (X) X (X)
Supply shortages (X) (X) X (X)
Electrification X (X) (X) (X) (X) X (X)
Traditional bio-fuels (X) (X) (X) (X) (X) (X) (X)
Urban-rural divide / urbanisation (X) (X) (X) (X) (X) (X) (X)
Informal economy ** ** ** **
Structural economic change (X) X X (X) X (X) (X)
Investment decisions X X (X) X (X)
Subsidies X X (X) X (X) Table 5: Applicable characteristics of developing countries‘ energy systems and their economies per model group.
X: Modelling this characteristic is applicable regarding model structure and purpose. (X): Modelling this
characteristic is applicable regarding model structure, if the purpose allows. *: Optimisation and Economic
Equilibrium Model. **: Modelling this characteristic would improve the model, but currently the modelling methods
and data are insufficient.
Table 6 gives an indication of modelling methods and data requirements for the described
characteristcs.
Applicable characteristics Modelling method Data
Performance of power sector Explicitely (loss-of-load-probability) Available for some dev. countries
Supply shortages Explicitely (capacity required/installed) Available for some dev. countries
Electrification Explicitely * / Implicitely (energy equation) Available for all dev. countries (IEA)
Traditional bio-fuels Explicitely (fuel choices)** Estimates for all dev. countries
Urban-rural divide / urbanis. Explicitely (urban/rural energy consumers) Available for most dev. countries
Informal economy Unknown No official data, only rough estimates
Structural economic change Explicitely (changing value-added/sector) Available for most dev. countries
Investment decisions Explicitely / Implicitely Available for most dev. countries
Subsidies Explicitely / Implicitely Available for most dev. countries Table 6: Modelling methods and data requirements for the applicable characteristics of developing countries‘
energy systems and economies. *: Increasing number of people having access to electricity, can be linked to
decreasing traditional bio-fuel use over time. **: Can be linked to electrification over time.
3.5.2 Discussion of methodology
The method was composed of three parts, thus three different kinds of sources were
examined (documentation, model runs, and questionnaire). Problems with the method were that
quality and quantity of the sources differed for each model, because not every model was
documented in the same way or to the same extent, not every model developer gave us access to
the model, not every developer answered the questionnaire.
There is full awareness that the results of the questionnaire tend to be subjective as they
tend to reflect the personal opinion of each more or less biased model developer. It was checked
whether the results of the questionnaires were consistent with the results of other methods, which
was the case. Finally, there could not be found any correlation between differing results and the
availability or unavailability of certain method parts.
55
A wide range of models were tested, from economic models like MARKAL and
MiniCAM to user-support modelling tools such as LEAP and RETScreen. The differences in
modelling approaches are acknowledged and there is full awareness that these differences lead to
different outcomes, just as much as different scenario inputs lead to different scenario outputs.
These results are therefore not standardised, but can still be considered relevant, because they
indicate for each model in specific to what extent the main characteristics of developing
countries‘ energy systems are addressed, as discussed in Chapter 3.4.
3.6 Conclusions
In conclusion, this results show that present-day energy models tend to be biased towards
experience from the energy systems and economies of industrialised countries as experience
from these systems has a long and successful tradition. However, the energy systems and
economies of developing countries are different and therefore also need to be modelled
differently. None of the present-day energy models fulfills all requirements for adequately
addressing the energy systems and economies of developing countries. A ―universal‖ model
which will solve all tasks equally well and which will represent all main characteristics of
developing countries is also illusory, because of technical restrictions, data inconsistencies,
limited purposes of the models and the complexity of the system.
Nevertheless, a poor characterisation of the energy systems and economies of developing
countries can lead to incorrect modelling of the future energy and climate settings. This could
affect the results of optimisation models, meaning that their modelled best solutions might be
only sub-optimal, because the economy and energy systems of developing countries might not
have been modelled correctly. There could be similar effects for economic equilibrium models,
which might neglect the disequilibrium of markets and overestimate market influences which
might lead to distorted results. The consequences of a poor characterisation of developing
countries‘ features for simulation models could be that unreliable scenarios might be developed
based on inconsistent or incomplete data and assumptions computing unrealistic results for the
global and regional energy future. Toolbox models could be affected by using incomplete or
incorrect data and relationships in their accounting scheme which might lead to distorted results.
Similarly, bottom-up models could primarily be affected by incomplete or incorrect
technological data which might result in incorrect outputs while top-down models could
primarily be affected by their link to incorrect or incomplete economic frameworks, which might
result in incorrect computed outputs. The effects of a poor characterisation of developing
countries‘ features in hybrid models could lead to distorted results due to incorrect economic and
technological data. As indicated before, present-day energy models can be improved to make
them more suitable for the energy systems of developing countries. It is suggested that models
take more into account those characteristics of developing countries, which are the most relevant
for the purpose and scope of the models (as indicated in Table 5).
For further research, new or improved existing energy models need to be developed
which adequately address the characteristics of developing countries‘ energy systems and
economies such as indicated in Tables 5 and 6. Particularly those characteristics need to be
modelled for which reliable data are available and where the system dynamics are understood,
e.g. for the performance of the power sector, electrification, investment decisions and subsidies.
For a better representation of developing countries, these new or improved models should
preferably follow a bottom-up or hybrid approach and be simulation or toolbox models.
56
Such research is performed for this thesis by developing an improved version of the
electricity model PowerPlan for China in specific, which, besides the performance of the power
sector and supply shortages, explicitly models electrification and the urban–rural divide (see
Chapters 4). It is also intended to develop a new version of one of the simulation energy models
discussed earlier to assess a.o. the use of traditional biofuels and the urban–rural divide for
specific developing countries (see Chapter 5 and 6).
3.7 Acknowledgements
Thanks to an anonymous reviewer, Prof. Dr. A.J.M. Schoot Uiterkamp for valuable
comments and feed-back, the energy model developers who addressed this questionnaire and Dr.
L. Hendrickx who assisted the development of the questionnaire.
57
4. Renewable and low-carbon energy as mitigation options of climate change
for China’s power sector9
Abstract
This chapter discusses how renewable and low-carbon energy can serve as mitigation
options of climate change in China‘s power sector. This study is based on scenarios developed in
PowerPlan, a bottom-up model simulating a countries‘ power sector and its emissions. First, the
model was adapted to China‘s present-day economy and power sector. Different scenarios were
then developed based on story lines for possible future developments in China. China‘s carbon-
based electricity production system of today was simulated and possible future transitions to a
low-carbon system relying on renewable and low-carbon energy. In this analysis, the business-
as-usual scenarios are compared with more sustainable energy scenarios. It was found that by
increasing the share of renewable and nuclear energy to different levels, between 17-57% of all
CO2 emissions from the power sector could be avoided by 2030 compared to the business-as-
usual scenario. It was also found that electricity generation costs increase when more sustainable
power plants are installed. As a conclusion, China has two options: choosing for high climate
change mitigation and high costs or choosing for moderate climate change mitigation and
moderate costs. In case high climate change mitigation will be chosen, development assistance is
likely to be needed to cover the costs.
4.1 Introduction Diminishing the share of fossil fuel energy and increasing the share of renewable and
low-carbon energy sources in the energy portfolio is essential to mitigate climate change. For a
highly populous and vast country like China, which produces more than 2,000 TWh of mainly
coal-produced electricity annually and emitted 5,126.84 Mt of CO2 in total from all sectors in
2005 (IEA, 2008; according to reference approach), the use of renewable and low-carbon energy
sources offers important options to mitigate climate change, reduce air pollution and limit natural
resource use.
In this chapter, the possibilities and limitations of implementing renewable and low-carbon
energy sources as mitigation options in the Chinese power sector are therefore studied by using
the bottom-up simulation model PowerPlan.
Energy planning models are means for exploring ―the future of the global and regional
energy settings and the effects of energy use on the human and natural environment‖ (Chapter 3).
The PowerPlan model simulates the electricity supply of a country or region for the coming decades
while assessing the effects of energy choices on a.o. emissions, costs, fossil fuel dependency and
system stability.
The objective of this study therefore is to explore how renewable and low-carbon energy
can partially replace fossil fuels in the Chinese power sector and thereby serve as mitigation
options. It is aimed to assess the implications of these energy transitions on climate change, costs
and effects on the electricity system and to assess the possibilities for a more sustainable
development. This study is a scenario study based on ‗what if‘-simulations, not a policy
9 This chapter is a slightly adapted version of Urban, F., Benders, R.M.J., Moll, H.C., 2009. Renewable and low-
carbon energies as mitigation options of climate change for China. Climatic Change, in press, DOI: 10.1007/s10584-
009-9553-y.
58
projection. Trends in current policies are however used to ensure the feasibility of the
simulations.
In September 2007, the National Development and Reform Commission of China
(NDRC) set the objective to raise the share of renewable energy among the total primary energy
consumption to 10% in 2010 and to 15% in 2020 including large-hydro power. This equals an
installed electric capacity of about 10% renewable energy in 2010 and about 20% in 2020,
excluding large-hydro power (NDRC, 2007; Philippe, 2007). The NDRC reports that modern
biomass - including biogas, biofuels and biopellets -, geothermal energy, hydro power, solar
power - including solar thermal, solar PV and solar heating systems -, tidal energy and wind
energy will be promoted. According to Nature (2008), energy officials announced the increase of
nuclear power plants leading to at least a contribution of 5% among the total primary energy
consumption in 2020. Nuclear and renewable energy are expected to account for at least half of
China‘s energy mix by 2050 (Nature, 2008).
China‘s Renewable Energy Law which is effective since 1st January 2006 and China‘s
11th
Five-Year Plan, covering the years 2006 to 2010, both aim at promoting renewable energy.
The 11th
Five-Year Plan further indicates the objective to close down 50 GW of inefficient and
small-capacity coal power plants (Philippe, 2007), to decrease the share of energy produced from
coal and oil and to promote hydro power, nuclear power and natural gas (Wang, 2007). The
modelling and scenarios developed for this study partially simulate the effects of these policies
and will be explained below.
4.2 Method
The tool used for this research is the PowerPlan model which is explained below. The
research method is composed of three parts: first, modelling the Chinese power sector and its
specific economic, demographic and energy-related settings. Second, story-lines were developed
for the future development of China. Third, scenarios for future transitions to sustainable energy
were made.
4.2.1 Description of PowerPlan
PowerPlan is a dynamic and interactive simulation model that can address ‗what if‘
questions quickly.
The model is built from the perspective of a central electricity board, in control of the central
demand/supply balance in a country or region. Starting from a reference year, the electric power
system is simulated. At each planning interval (which can be one or more years), investments in
new power plants can be made. At the end of each simulation step, the results such as costs,
reliability, fuel use, and environment can be examined and used as an aid for the input of the next
planning round. The core of the PowerPlan model simulates the electric power generation in a given
year. A complete one-period-calculation-cycle is calculated as follows: The annual demand for
electricity is calculated from the Load Duration Curve (LDC) or a year pattern and the Simultaneous
Maximum Demand (SMD) or so-called peak demand. The LDC is an electric load curve describing
the typical demand for electric energy at each time of a given year. The LDC represents the
relationship between capacity utilisation and generating capacity requirements. The SMD or peak
demand is the maximum demand for electric energy which is required at a certain point in time.
For example, in the morning and evening the SMD is usually higher than during the day, because
more electricity is needed for lighting, for heating shower and bathing water, for electric devices
for cooking, making coffee and similar. More electricity is thus needed during these peak times.
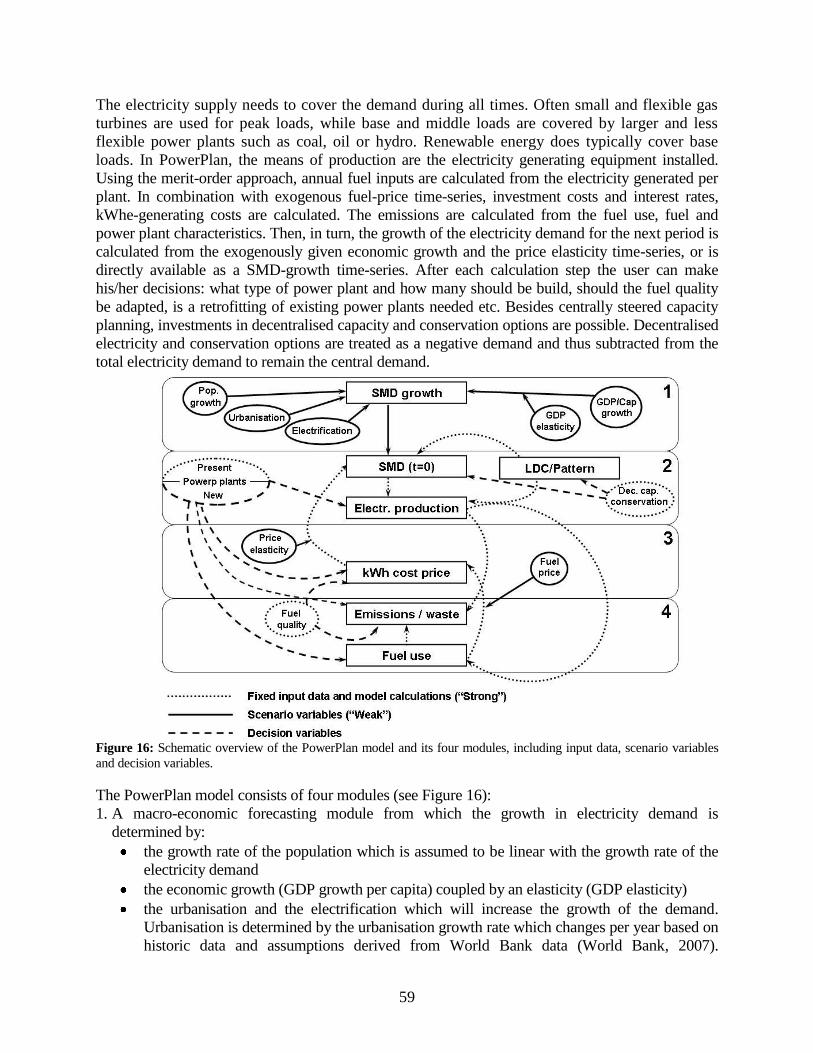
59
The electricity supply needs to cover the demand during all times. Often small and flexible gas
turbines are used for peak loads, while base and middle loads are covered by larger and less
flexible power plants such as coal, oil or hydro. Renewable energy does typically cover base
loads. In PowerPlan, the means of production are the electricity generating equipment installed.
Using the merit-order approach, annual fuel inputs are calculated from the electricity generated per
plant. In combination with exogenous fuel-price time-series, investment costs and interest rates,
kWhe-generating costs are calculated. The emissions are calculated from the fuel use, fuel and
power plant characteristics. Then, in turn, the growth of the electricity demand for the next period is
calculated from the exogenously given economic growth and the price elasticity time-series, or is
directly available as a SMD-growth time-series. After each calculation step the user can make
his/her decisions: what type of power plant and how many should be build, should the fuel quality
be adapted, is a retrofitting of existing power plants needed etc. Besides centrally steered capacity
planning, investments in decentralised capacity and conservation options are possible. Decentralised
electricity and conservation options are treated as a negative demand and thus subtracted from the
total electricity demand to remain the central demand.
Figure 16: Schematic overview of the PowerPlan model and its four modules, including input data, scenario variables
and decision variables.
The PowerPlan model consists of four modules (see Figure 16):
1. A macro-economic forecasting module from which the growth in electricity demand is
determined by:
the growth rate of the population which is assumed to be linear with the growth rate of the
electricity demand
the economic growth (GDP growth per capita) coupled by an elasticity (GDP elasticity)
the urbanisation and the electrification which will increase the growth of the demand.
Urbanisation is determined by the urbanisation growth rate which changes per year based on
historic data and assumptions derived from World Bank data (World Bank, 2007).
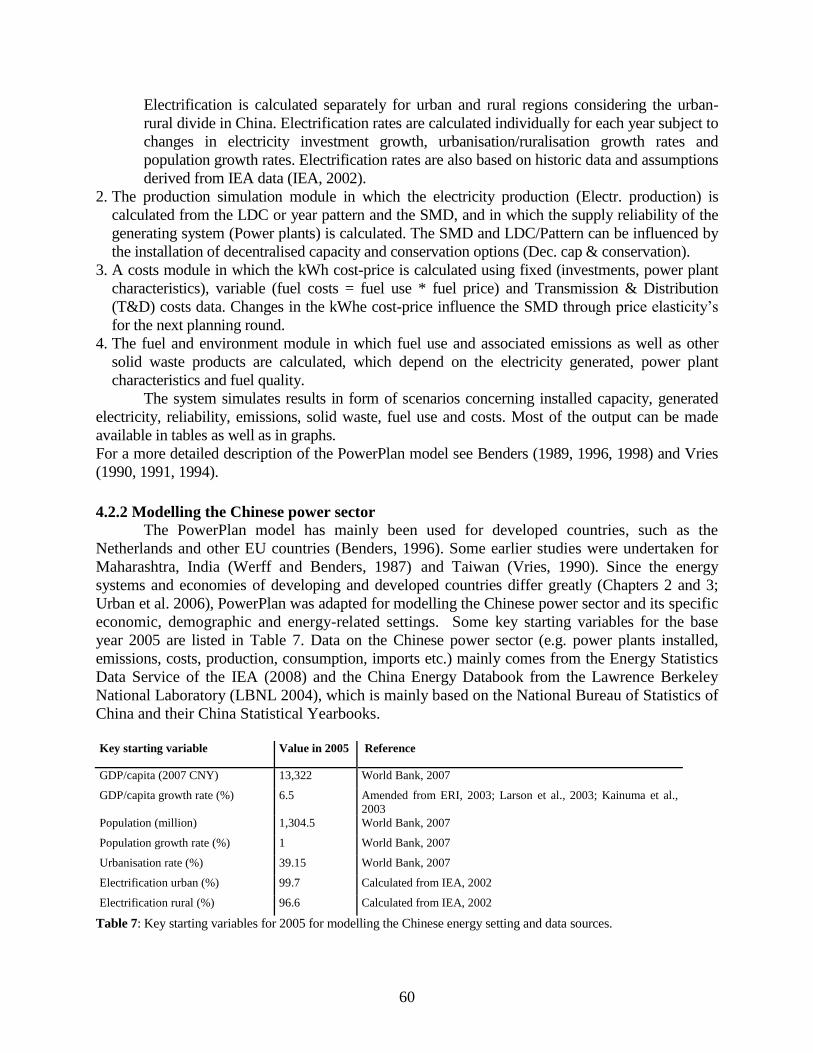
60
Electrification is calculated separately for urban and rural regions considering the urban-
rural divide in China. Electrification rates are calculated individually for each year subject to
changes in electricity investment growth, urbanisation/ruralisation growth rates and
population growth rates. Electrification rates are also based on historic data and assumptions
derived from IEA data (IEA, 2002).
2. The production simulation module in which the electricity production (Electr. production) is
calculated from the LDC or year pattern and the SMD, and in which the supply reliability of the
generating system (Power plants) is calculated. The SMD and LDC/Pattern can be influenced by
the installation of decentralised capacity and conservation options (Dec. cap & conservation).
3. A costs module in which the kWh cost-price is calculated using fixed (investments, power plant
characteristics), variable (fuel costs = fuel use * fuel price) and Transmission & Distribution
(T&D) costs data. Changes in the kWhe cost-price influence the SMD through price elasticity‘s
for the next planning round.
4. The fuel and environment module in which fuel use and associated emissions as well as other
solid waste products are calculated, which depend on the electricity generated, power plant
characteristics and fuel quality.
The system simulates results in form of scenarios concerning installed capacity, generated
electricity, reliability, emissions, solid waste, fuel use and costs. Most of the output can be made
available in tables as well as in graphs.
For a more detailed description of the PowerPlan model see Benders (1989, 1996, 1998) and Vries
(1990, 1991, 1994).
4.2.2 Modelling the Chinese power sector
The PowerPlan model has mainly been used for developed countries, such as the
Netherlands and other EU countries (Benders, 1996). Some earlier studies were undertaken for
Maharashtra, India (Werff and Benders, 1987) and Taiwan (Vries, 1990). Since the energy
systems and economies of developing and developed countries differ greatly (Chapters 2 and 3;
Urban et al. 2006), PowerPlan was adapted for modelling the Chinese power sector and its specific
economic, demographic and energy-related settings. Some key starting variables for the base
year 2005 are listed in Table 7. Data on the Chinese power sector (e.g. power plants installed,
emissions, costs, production, consumption, imports etc.) mainly comes from the Energy Statistics
Data Service of the IEA (2008) and the China Energy Databook from the Lawrence Berkeley
National Laboratory (LBNL 2004), which is mainly based on the National Bureau of Statistics of
China and their China Statistical Yearbooks.
Key starting variable Value in 2005
Reference
GDP/capita (2007 CNY) 13,322 World Bank, 2007
GDP/capita growth rate (%) 6.5 Amended from ERI, 2003; Larson et al., 2003; Kainuma et al.,
2003
Population (million) 1,304.5 World Bank, 2007
Population growth rate (%) 1 World Bank, 2007
Urbanisation rate (%) 39.15 World Bank, 2007
Electrification urban (%) 99.7 Calculated from IEA, 2002
Electrification rural (%) 96.6 Calculated from IEA, 2002
Table 7: Key starting variables for 2005 for modelling the Chinese energy setting and data sources.
61
In 2005, China‘s central electricity production was about 2500 TWh with an average
growth rate of 5.5% in the last five years. This electricity is mainly produced by coal fired power
plants (74%) and large-hydro plants (15%). According to PowerPlan, the most important yearly
emissions are about 16 Mton of SO2, 0.7 Mton NOx, 2,050 Mton CO2 and 0.3 Mton of aerosols.
During the last decade, China made a significant leap forward in terms of economic, industrial
and energy-related output. The power sector alone contributes to about 35-45% of the total
national CO2 emissions (IEA, 2008). Low-carbon technologies in the power sector, such as
renewable energy, nuclear energy, natural gas, coal liquidation and coal gasification technologies
with CO2 storage are thus of growing importance. In the past, renewable energy only played a
minor role, but since the Renewable Energy Law came into force in 2006, the Chinese
government aims at augmenting the share of renewables on the total electricity production
(Buruku, 2005). The goal of the Renewable Energy Law is ―… to promote the development and
utilization of renewable energy, improve the energy structure, diversify energy supplies,
safeguard energy security, protect the environment, and realise the sustainable development of
the economy and society‖ (National People‘s Congress of China, 2005 (article 1)). More specific
goals are removing market barriers to renewable energy development, establishing a financing
system to ensure renewable energy development, establishing a self-sufficient and non-import
dependant renewable energy industry system and building knowledge and awareness around
renewable energy (Baker and McKenzie, 2007). The Renewable Energy Law does not name any
specific targets, but provides the legislative framework for other policies, which include e.g. the
renewable energy targets determined by the NDRC (NDRC, 2007), obligatory grid connections
for renewable energy systems, cost-sharing agreements between utilities and end-users, pricing
agreements like feed-in tariffs, surcharges and concessions to guarantee the market (Baker and
McKenzie, 2007).
In line with recent developments, the types of power plants modelled in PowerPlan for
the Chinese setting are coal-fired power plants, conventional oil-fired power plants, combined-
cycle-gas-turbines (CCGT), peak gas turbines (GT peak), combined heat and power (CHP),
large-hydro plants, biogas plants, geothermal plants, small-hydro plants (SHP), solar
photovoltaic panels (PV), tidal plants and wind turbines. The renewable energy modelled in this
study are those promoted by the NDRC‘s Medium and Long-Term Development Plan for
Renewable Energy in which the NDRC sets its renewable energy targets; the development of
these renewables is thus likely to increase (NDRC, 2007). Electricity imports to China are also
considered, which came in 2001 from Hong Kong, Russia and North Korea (LBNL, 2004).
4.2.3 Story-lines and scenario-making
After adapting the model to the specific settings of China, qualitative story-lines were
developed. These story-lines explore the ‗stories‘ of the future taking into account a.o. possible
economic, demographic, technical and energy-related developments for China.
Three story-lines were developed: business-as-usual (BAU), renewable energy future
(RE) and nuclear future (NUC). Other low-carbon energy, like natural gas and coal
gasification/liquidation with CO2 storage, are also important mitigation options of climate
change, but have not been assessed in this study. Natural gas has not been considered, because it
does not play a major role in China‘s power sector and its use requires imports -mainly from
Russia- and costly infrastructure, thus decreasing China‘s energy security and increasing costs.
Coal gasification/liquidation with CO2 storage has not been considered, because world-wide it is
not yet commercially employed. The simulation of its use would thus be based on speculations.
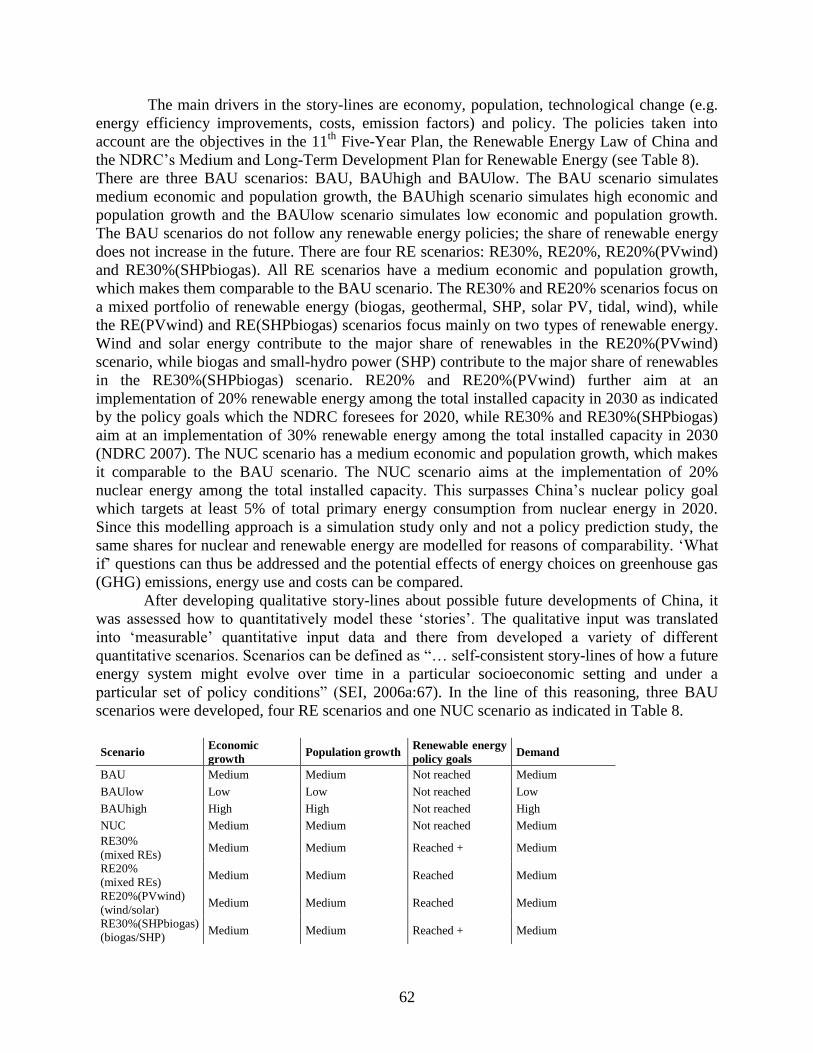
62
The main drivers in the story-lines are economy, population, technological change (e.g.
energy efficiency improvements, costs, emission factors) and policy. The policies taken into
account are the objectives in the 11th
Five-Year Plan, the Renewable Energy Law of China and
the NDRC‘s Medium and Long-Term Development Plan for Renewable Energy (see Table 8).
There are three BAU scenarios: BAU, BAUhigh and BAUlow. The BAU scenario simulates
medium economic and population growth, the BAUhigh scenario simulates high economic and
population growth and the BAUlow scenario simulates low economic and population growth.
The BAU scenarios do not follow any renewable energy policies; the share of renewable energy
does not increase in the future. There are four RE scenarios: RE30%, RE20%, RE20%(PVwind)
and RE30%(SHPbiogas). All RE scenarios have a medium economic and population growth,
which makes them comparable to the BAU scenario. The RE30% and RE20% scenarios focus on
a mixed portfolio of renewable energy (biogas, geothermal, SHP, solar PV, tidal, wind), while
the RE(PVwind) and RE(SHPbiogas) scenarios focus mainly on two types of renewable energy.
Wind and solar energy contribute to the major share of renewables in the RE20%(PVwind)
scenario, while biogas and small-hydro power (SHP) contribute to the major share of renewables
in the RE30%(SHPbiogas) scenario. RE20% and RE20%(PVwind) further aim at an
implementation of 20% renewable energy among the total installed capacity in 2030 as indicated
by the policy goals which the NDRC foresees for 2020, while RE30% and RE30%(SHPbiogas)
aim at an implementation of 30% renewable energy among the total installed capacity in 2030
(NDRC 2007). The NUC scenario has a medium economic and population growth, which makes
it comparable to the BAU scenario. The NUC scenario aims at the implementation of 20%
nuclear energy among the total installed capacity. This surpasses China‘s nuclear policy goal
which targets at least 5% of total primary energy consumption from nuclear energy in 2020.
Since this modelling approach is a simulation study only and not a policy prediction study, the
same shares for nuclear and renewable energy are modelled for reasons of comparability. ‗What
if‘ questions can thus be addressed and the potential effects of energy choices on greenhouse gas
(GHG) emissions, energy use and costs can be compared.
After developing qualitative story-lines about possible future developments of China, it
was assessed how to quantitatively model these ‗stories‘. The qualitative input was translated
into ‗measurable‘ quantitative input data and there from developed a variety of different
quantitative scenarios. Scenarios can be defined as ―… self-consistent story-lines of how a future
energy system might evolve over time in a particular socioeconomic setting and under a
particular set of policy conditions‖ (SEI, 2006a:67). In the line of this reasoning, three BAU
scenarios were developed, four RE scenarios and one NUC scenario as indicated in Table 8.
Scenario Economic
growth Population growth
Renewable energy
policy goals Demand
BAU Medium Medium Not reached Medium
BAUlow Low Low Not reached Low
BAUhigh High High Not reached High
NUC Medium Medium Not reached Medium
RE30%
(mixed REs) Medium Medium Reached + Medium
RE20%
(mixed REs) Medium Medium Reached Medium
RE20%(PVwind)
(wind/solar) Medium Medium Reached Medium
RE30%(SHPbiogas)
(biogas/SHP) Medium Medium Reached + Medium
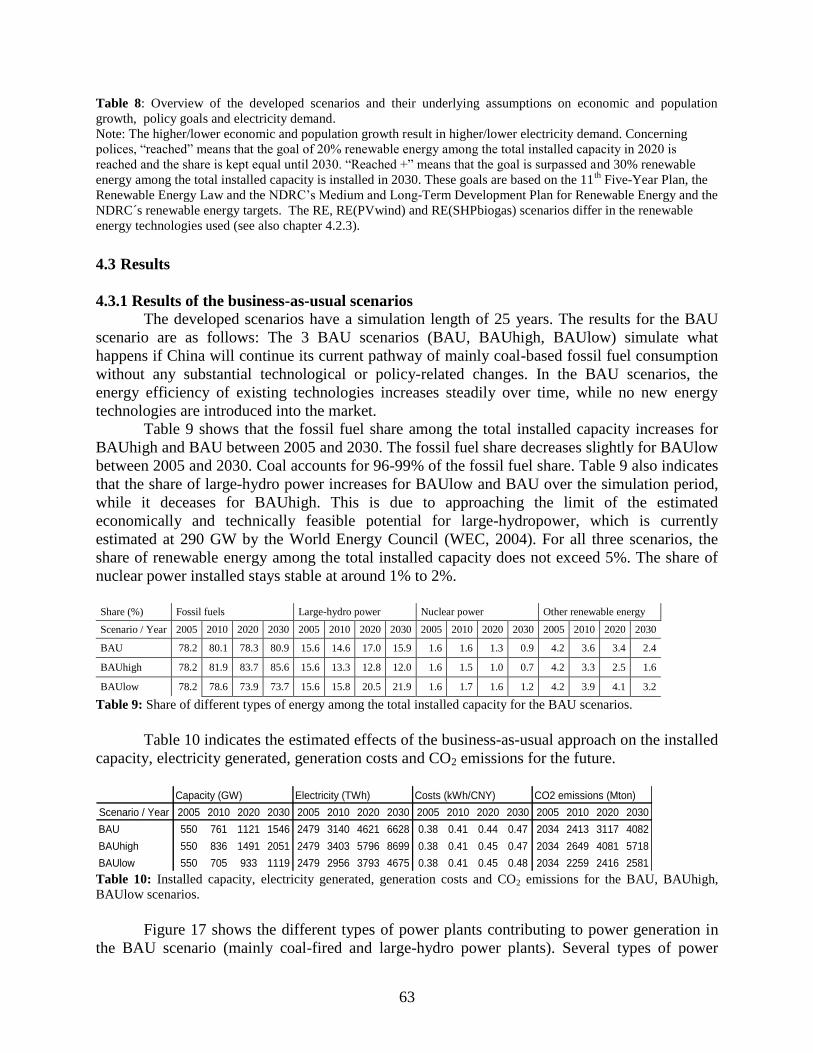
63
Table 8: Overview of the developed scenarios and their underlying assumptions on economic and population
growth, policy goals and electricity demand.
Note: The higher/lower economic and population growth result in higher/lower electricity demand. Concerning
polices, ―reached‖ means that the goal of 20% renewable energy among the total installed capacity in 2020 is
reached and the share is kept equal until 2030. ―Reached +‖ means that the goal is surpassed and 30% renewable
energy among the total installed capacity is installed in 2030. These goals are based on the 11th
Five-Year Plan, the
Renewable Energy Law and the NDRC‘s Medium and Long-Term Development Plan for Renewable Energy and the
NDRC´s renewable energy targets. The RE, RE(PVwind) and RE(SHPbiogas) scenarios differ in the renewable
energy technologies used (see also chapter 4.2.3).
4.3 Results
4.3.1 Results of the business-as-usual scenarios
The developed scenarios have a simulation length of 25 years. The results for the BAU
scenario are as follows: The 3 BAU scenarios (BAU, BAUhigh, BAUlow) simulate what
happens if China will continue its current pathway of mainly coal-based fossil fuel consumption
without any substantial technological or policy-related changes. In the BAU scenarios, the
energy efficiency of existing technologies increases steadily over time, while no new energy
technologies are introduced into the market.
Table 9 shows that the fossil fuel share among the total installed capacity increases for
BAUhigh and BAU between 2005 and 2030. The fossil fuel share decreases slightly for BAUlow
between 2005 and 2030. Coal accounts for 96-99% of the fossil fuel share. Table 9 also indicates
that the share of large-hydro power increases for BAUlow and BAU over the simulation period,
while it deceases for BAUhigh. This is due to approaching the limit of the estimated
economically and technically feasible potential for large-hydropower, which is currently
estimated at 290 GW by the World Energy Council (WEC, 2004). For all three scenarios, the
share of renewable energy among the total installed capacity does not exceed 5%. The share of
nuclear power installed stays stable at around 1% to 2%.
Share (%) Fossil fuels Large-hydro power Nuclear power Other renewable energy
Scenario / Year 2005 2010 2020 2030 2005 2010 2020 2030 2005 2010 2020 2030 2005 2010 2020 2030
BAU 78.2 80.1 78.3 80.9 15.6 14.6 17.0 15.9 1.6 1.6 1.3 0.9 4.2 3.6 3.4 2.4
BAUhigh 78.2 81.9 83.7 85.6 15.6 13.3 12.8 12.0 1.6 1.5 1.0 0.7 4.2 3.3 2.5 1.6
BAUlow 78.2 78.6 73.9 73.7 15.6 15.8 20.5 21.9 1.6 1.7 1.6 1.2 4.2 3.9 4.1 3.2
Table 9: Share of different types of energy among the total installed capacity for the BAU scenarios.
Table 10 indicates the estimated effects of the business-as-usual approach on the installed
capacity, electricity generated, generation costs and CO2 emissions for the future.
Capacity (GW) Electricity (TWh) Costs (kWh/CNY) CO2 emissions (Mton)
Scenario / Year 2005 2010 2020 2030 2005 2010 2020 2030 2005 2010 2020 2030 2005 2010 2020 2030
BAU 550 761 1121 1546 2479 3140 4621 6628 0.38 0.41 0.44 0.47 2034 2413 3117 4082
BAUhigh 550 836 1491 2051 2479 3403 5796 8699 0.38 0.41 0.45 0.47 2034 2649 4081 5718
BAUlow 550 705 933 1119 2479 2956 3793 4675 0.38 0.41 0.45 0.48 2034 2259 2416 2581 Table 10: Installed capacity, electricity generated, generation costs and CO2 emissions for the BAU, BAUhigh,
BAUlow scenarios.
Figure 17 shows the different types of power plants contributing to power generation in
the BAU scenario (mainly coal-fired and large-hydro power plants). Several types of power
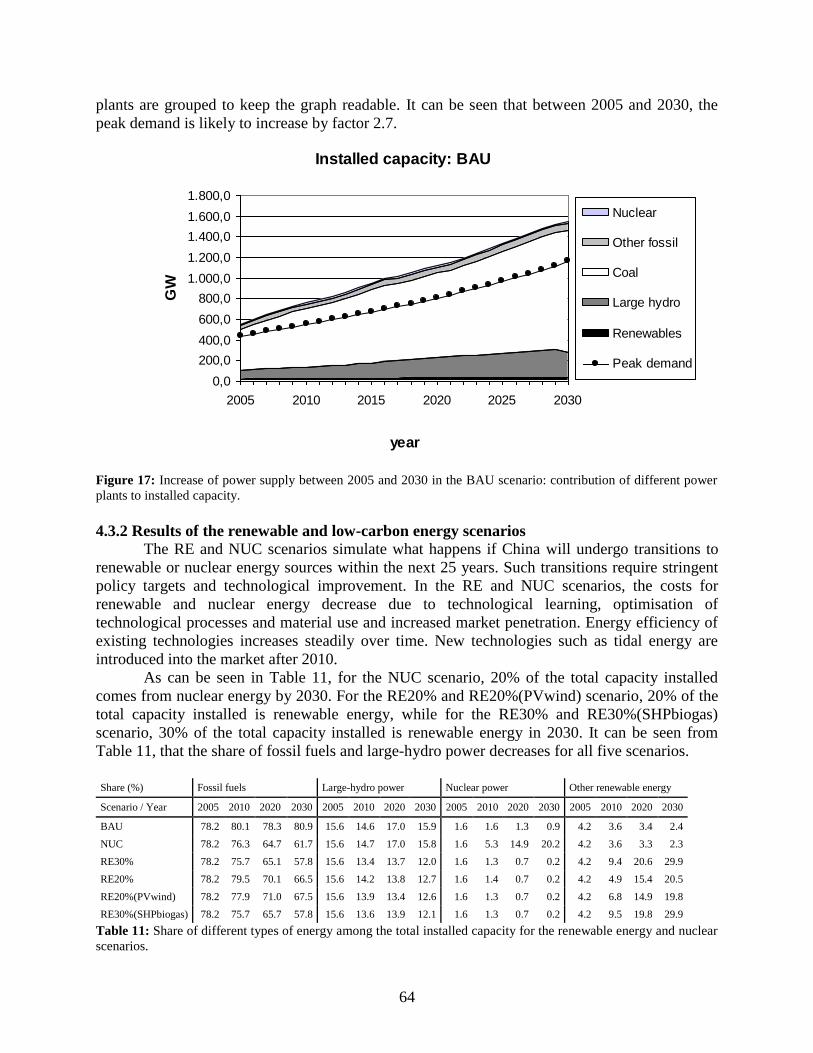
64
plants are grouped to keep the graph readable. It can be seen that between 2005 and 2030, the
peak demand is likely to increase by factor 2.7.
Installed capacity: BAU
0,0
200,0
400,0
600,0
800,0
1.000,0
1.200,0
1.400,0
1.600,0
1.800,0
2005 2010 2015 2020 2025 2030
year
GW
Nuclear
Other fossil
Coal
Large hydro
Renewables
Peak demand
Figure 17: Increase of power supply between 2005 and 2030 in the BAU scenario: contribution of different power
plants to installed capacity.
4.3.2 Results of the renewable and low-carbon energy scenarios
The RE and NUC scenarios simulate what happens if China will undergo transitions to
renewable or nuclear energy sources within the next 25 years. Such transitions require stringent
policy targets and technological improvement. In the RE and NUC scenarios, the costs for
renewable and nuclear energy decrease due to technological learning, optimisation of
technological processes and material use and increased market penetration. Energy efficiency of
existing technologies increases steadily over time. New technologies such as tidal energy are
introduced into the market after 2010.
As can be seen in Table 11, for the NUC scenario, 20% of the total capacity installed
comes from nuclear energy by 2030. For the RE20% and RE20%(PVwind) scenario, 20% of the
total capacity installed is renewable energy, while for the RE30% and RE30%(SHPbiogas)
scenario, 30% of the total capacity installed is renewable energy in 2030. It can be seen from
Table 11, that the share of fossil fuels and large-hydro power decreases for all five scenarios.
Share (%) Fossil fuels Large-hydro power Nuclear power Other renewable energy
Scenario / Year 2005 2010 2020 2030 2005 2010 2020 2030 2005 2010 2020 2030 2005 2010 2020 2030
BAU 78.2 80.1 78.3 80.9 15.6 14.6 17.0 15.9 1.6 1.6 1.3 0.9 4.2 3.6 3.4 2.4
NUC 78.2 76.3 64.7 61.7 15.6 14.7 17.0 15.8 1.6 5.3 14.9 20.2 4.2 3.6 3.3 2.3
RE30% 78.2 75.7 65.1 57.8 15.6 13.4 13.7 12.0 1.6 1.3 0.7 0.2 4.2 9.4 20.6 29.9
RE20% 78.2 79.5 70.1 66.5 15.6 14.2 13.8 12.7 1.6 1.4 0.7 0.2 4.2 4.9 15.4 20.5
RE20%(PVwind) 78.2 77.9 71.0 67.5 15.6 13.9 13.4 12.6 1.6 1.3 0.7 0.2 4.2 6.8 14.9 19.8
RE30%(SHPbiogas) 78.2 75.7 65.7 57.8 15.6 13.6 13.9 12.1 1.6 1.3 0.7 0.2 4.2 9.5 19.8 29.9
Table 11: Share of different types of energy among the total installed capacity for the renewable energy and nuclear
scenarios.
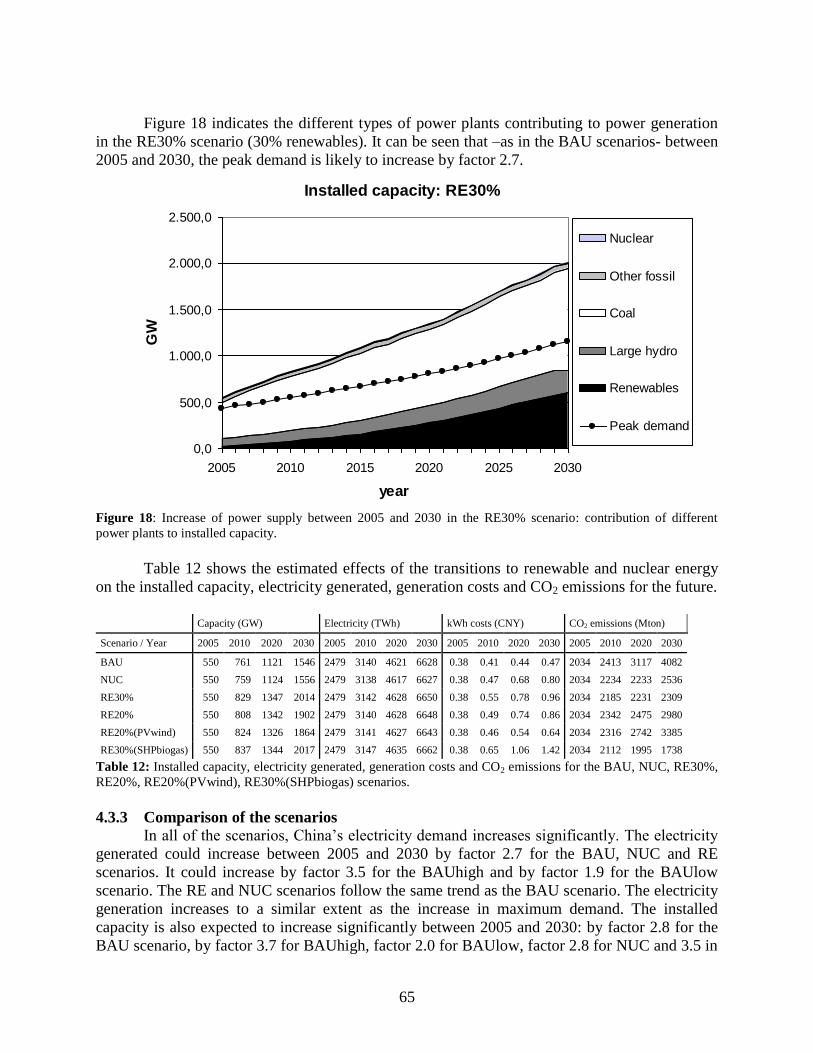
65
Figure 18 indicates the different types of power plants contributing to power generation
in the RE30% scenario (30% renewables). It can be seen that –as in the BAU scenarios- between
2005 and 2030, the peak demand is likely to increase by factor 2.7.
Installed capacity: RE30%
0,0
500,0
1.000,0
1.500,0
2.000,0
2.500,0
2005 2010 2015 2020 2025 2030
year
GW
Nuclear
Other fossil
Coal
Large hydro
Renewables
Peak demand
Figure 18: Increase of power supply between 2005 and 2030 in the RE30% scenario: contribution of different
power plants to installed capacity.
Table 12 shows the estimated effects of the transitions to renewable and nuclear energy
on the installed capacity, electricity generated, generation costs and CO2 emissions for the future.
Capacity (GW) Electricity (TWh) kWh costs (CNY) CO2 emissions (Mton)
Scenario / Year 2005 2010 2020 2030 2005 2010 2020 2030 2005 2010 2020 2030 2005 2010 2020 2030
BAU 550 761 1121 1546 2479 3140 4621 6628 0.38 0.41 0.44 0.47 2034 2413 3117 4082
NUC 550 759 1124 1556 2479 3138 4617 6627 0.38 0.47 0.68 0.80 2034 2234 2233 2536
RE30% 550 829 1347 2014 2479 3142 4628 6650 0.38 0.55 0.78 0.96 2034 2185 2231 2309
RE20% 550 808 1342 1902 2479 3140 4628 6648 0.38 0.49 0.74 0.86 2034 2342 2475 2980
RE20%(PVwind) 550 824 1326 1864 2479 3141 4627 6643 0.38 0.46 0.54 0.64 2034 2316 2742 3385
RE30%(SHPbiogas) 550 837 1344 2017 2479 3147 4635 6662 0.38 0.65 1.06 1.42 2034 2112 1995 1738
Table 12: Installed capacity, electricity generated, generation costs and CO2 emissions for the BAU, NUC, RE30%,
RE20%, RE20%(PVwind), RE30%(SHPbiogas) scenarios.
4.3.3 Comparison of the scenarios
In all of the scenarios, China‘s electricity demand increases significantly. The electricity
generated could increase between 2005 and 2030 by factor 2.7 for the BAU, NUC and RE
scenarios. It could increase by factor 3.5 for the BAUhigh and by factor 1.9 for the BAUlow
scenario. The RE and NUC scenarios follow the same trend as the BAU scenario. The electricity
generation increases to a similar extent as the increase in maximum demand. The installed
capacity is also expected to increase significantly between 2005 and 2030: by factor 2.8 for the
BAU scenario, by factor 3.7 for BAUhigh, factor 2.0 for BAUlow, factor 2.8 for NUC and 3.5 in
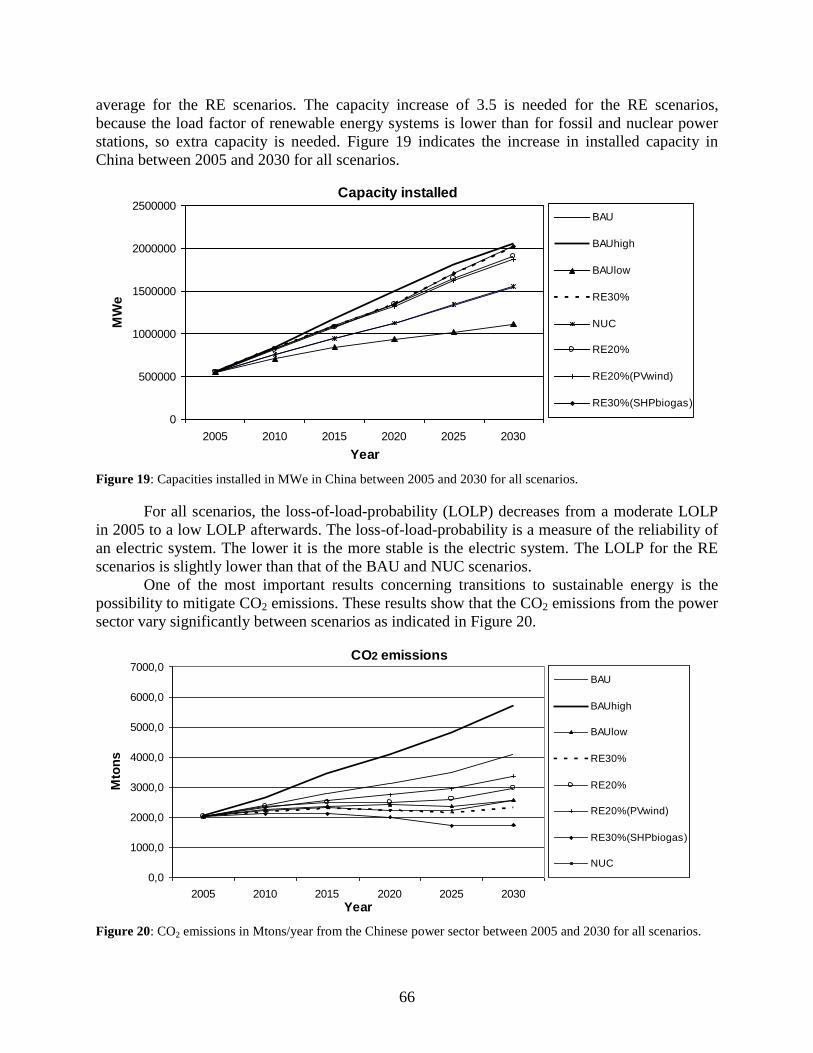
66
average for the RE scenarios. The capacity increase of 3.5 is needed for the RE scenarios,
because the load factor of renewable energy systems is lower than for fossil and nuclear power
stations, so extra capacity is needed. Figure 19 indicates the increase in installed capacity in
China between 2005 and 2030 for all scenarios.
Capacity installed
0
500000
1000000
1500000
2000000
2500000
2005 2010 2015 2020 2025 2030
Year
MW
e
BAU
BAUhigh
BAUlow
RE30%
NUC
RE20%
RE20%(PVwind)
RE30%(SHPbiogas)
Figure 19: Capacities installed in MWe in China between 2005 and 2030 for all scenarios.
For all scenarios, the loss-of-load-probability (LOLP) decreases from a moderate LOLP
in 2005 to a low LOLP afterwards. The loss-of-load-probability is a measure of the reliability of
an electric system. The lower it is the more stable is the electric system. The LOLP for the RE
scenarios is slightly lower than that of the BAU and NUC scenarios.
One of the most important results concerning transitions to sustainable energy is the
possibility to mitigate CO2 emissions. These results show that the CO2 emissions from the power
sector vary significantly between scenarios as indicated in Figure 20.
CO2 emissions
0,0
1000,0
2000,0
3000,0
4000,0
5000,0
6000,0
7000,0
2005 2010 2015 2020 2025 2030
Year
Mto
ns
BAU
BAUhigh
BAUlow
RE30%
RE20%
RE20%(PVwind)
RE30%(SHPbiogas)
NUC
Figure 20: CO2 emissions in Mtons/year from the Chinese power sector between 2005 and 2030 for all scenarios.
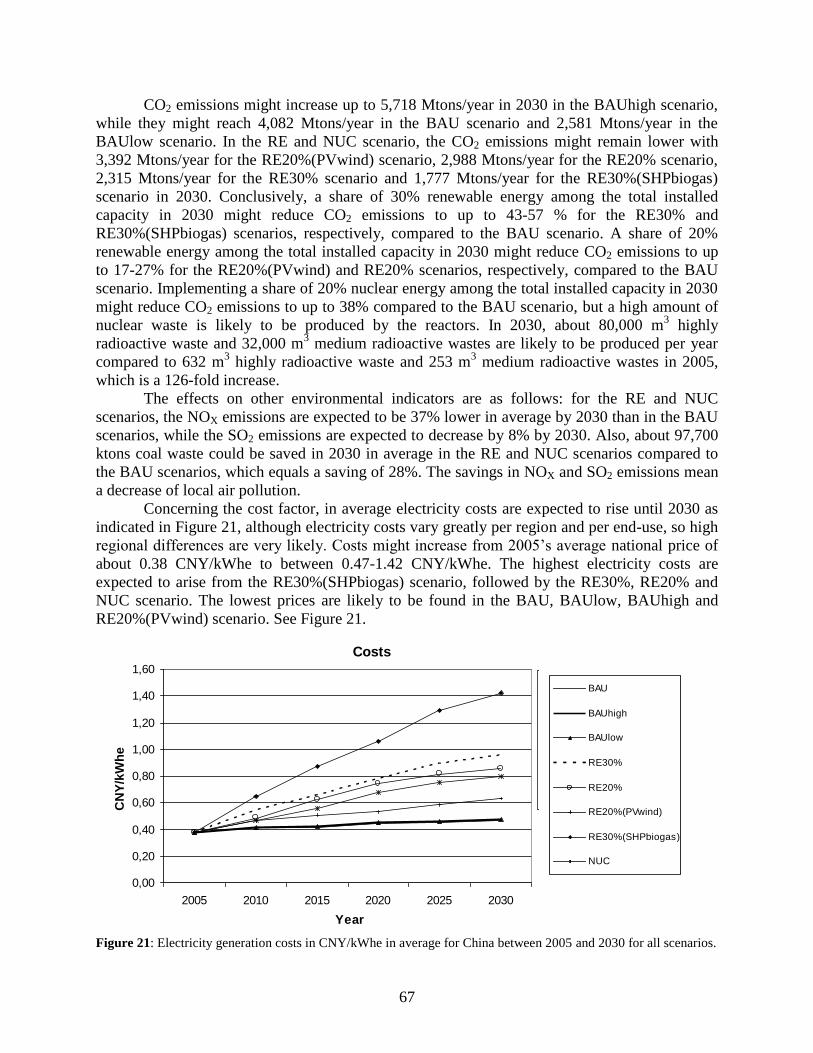
67
CO2 emissions
0,0
1000,0
2000,0
3000,0
4000,0
5000,0
6000,0
7000,0
2005 2010 2015 2020 2025 2030
Year
Mto
ns
BAU
BAUhigh
BAUlow
RE30%
RE20%
RE20%(PVwind)
RE30%(SHPbiogas)
NUC
CO2 emissions might increase up to 5,718 Mtons/year in 2030 in the BAUhigh scenario,
while they might reach 4,082 Mtons/year in the BAU scenario and 2,581 Mtons/year in the
BAUlow scenario. In the RE and NUC scenario, the CO2 emissions might remain lower with
3,392 Mtons/year for the RE20%(PVwind) scenario, 2,988 Mtons/year for the RE20% scenario,
2,315 Mtons/year for the RE30% scenario and 1,777 Mtons/year for the RE30%(SHPbiogas)
scenario in 2030. Conclusively, a share of 30% renewable energy among the total installed
capacity in 2030 might reduce CO2 emissions to up to 43-57 % for the RE30% and
RE30%(SHPbiogas) scenarios, respectively, compared to the BAU scenario. A share of 20%
renewable energy among the total installed capacity in 2030 might reduce CO2 emissions to up
to 17-27% for the RE20%(PVwind) and RE20% scenarios, respectively, compared to the BAU
scenario. Implementing a share of 20% nuclear energy among the total installed capacity in 2030
might reduce CO2 emissions to up to 38% compared to the BAU scenario, but a high amount of
nuclear waste is likely to be produced by the reactors. In 2030, about 80,000 m3 highly
radioactive waste and 32,000 m3 medium radioactive wastes are likely to be produced per year
compared to 632 m3 highly radioactive waste and 253 m
3 medium radioactive wastes in 2005,
which is a 126-fold increase.
The effects on other environmental indicators are as follows: for the RE and NUC
scenarios, the NOX emissions are expected to be 37% lower in average by 2030 than in the BAU
scenarios, while the SO2 emissions are expected to decrease by 8% by 2030. Also, about 97,700
ktons coal waste could be saved in 2030 in average in the RE and NUC scenarios compared to
the BAU scenarios, which equals a saving of 28%. The savings in NOX and SO2 emissions mean
a decrease of local air pollution.
Concerning the cost factor, in average electricity costs are expected to rise until 2030 as
indicated in Figure 21, although electricity costs vary greatly per region and per end-use, so high
regional differences are very likely. Costs might increase from 2005‘s average national price of
about 0.38 CNY/kWhe to between 0.47-1.42 CNY/kWhe. The highest electricity costs are
expected to arise from the RE30%(SHPbiogas) scenario, followed by the RE30%, RE20% and
NUC scenario. The lowest prices are likely to be found in the BAU, BAUlow, BAUhigh and
RE20%(PVwind) scenario. See Figure 21.
Costs
0,00
0,20
0,40
0,60
0,80
1,00
1,20
1,40
1,60
2005 2010 2015 2020 2025 2030
Year
CN
Y/k
Wh
e
BAU
BAUhigh
BAUlow
RE1
NUC
RE2
REhybrid1
REhybrid2
Figure 21: Electricity generation costs in CNY/kWhe in average for China between 2005 and 2030 for all scenarios.
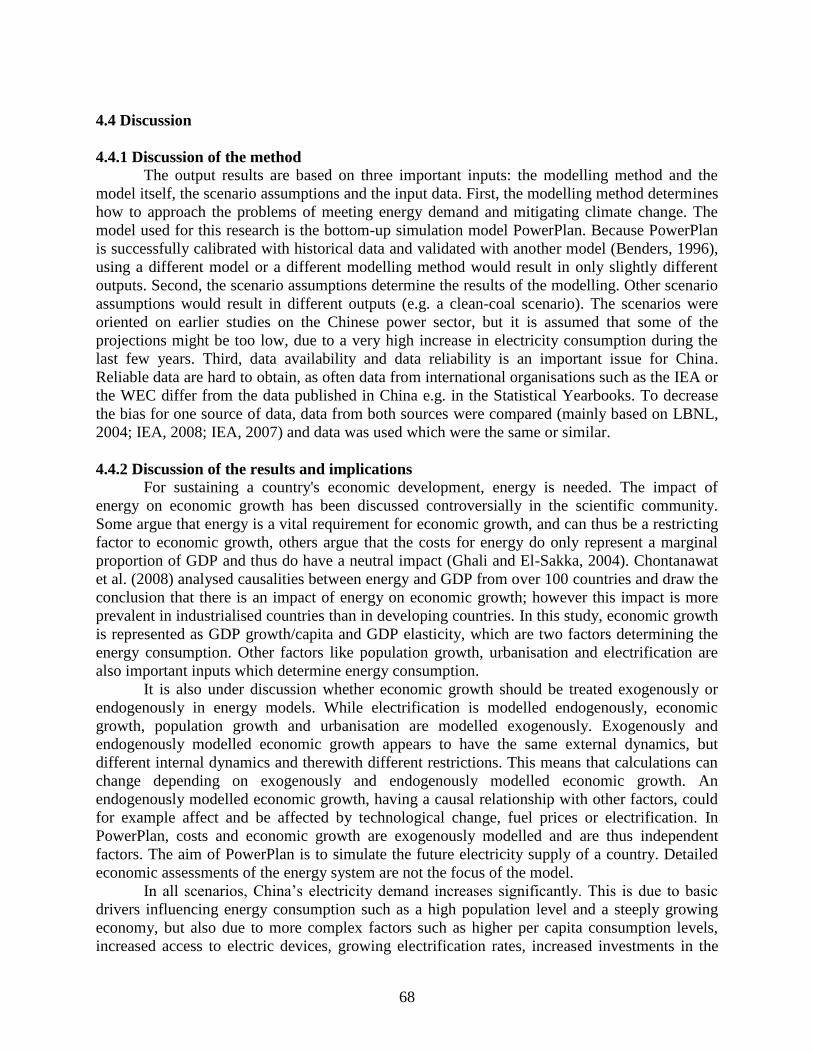
68
4.4 Discussion
4.4.1 Discussion of the method
The output results are based on three important inputs: the modelling method and the
model itself, the scenario assumptions and the input data. First, the modelling method determines
how to approach the problems of meeting energy demand and mitigating climate change. The
model used for this research is the bottom-up simulation model PowerPlan. Because PowerPlan
is successfully calibrated with historical data and validated with another model (Benders, 1996),
using a different model or a different modelling method would result in only slightly different
outputs. Second, the scenario assumptions determine the results of the modelling. Other scenario
assumptions would result in different outputs (e.g. a clean-coal scenario). The scenarios were
oriented on earlier studies on the Chinese power sector, but it is assumed that some of the
projections might be too low, due to a very high increase in electricity consumption during the
last few years. Third, data availability and data reliability is an important issue for China.
Reliable data are hard to obtain, as often data from international organisations such as the IEA or
the WEC differ from the data published in China e.g. in the Statistical Yearbooks. To decrease
the bias for one source of data, data from both sources were compared (mainly based on LBNL,
2004; IEA, 2008; IEA, 2007) and data was used which were the same or similar.
4.4.2 Discussion of the results and implications
For sustaining a country's economic development, energy is needed. The impact of
energy on economic growth has been discussed controversially in the scientific community.
Some argue that energy is a vital requirement for economic growth, and can thus be a restricting
factor to economic growth, others argue that the costs for energy do only represent a marginal
proportion of GDP and thus do have a neutral impact (Ghali and El-Sakka, 2004). Chontanawat
et al. (2008) analysed causalities between energy and GDP from over 100 countries and draw the
conclusion that there is an impact of energy on economic growth; however this impact is more
prevalent in industrialised countries than in developing countries. In this study, economic growth
is represented as GDP growth/capita and GDP elasticity, which are two factors determining the
energy consumption. Other factors like population growth, urbanisation and electrification are
also important inputs which determine energy consumption.
It is also under discussion whether economic growth should be treated exogenously or
endogenously in energy models. While electrification is modelled endogenously, economic
growth, population growth and urbanisation are modelled exogenously. Exogenously and
endogenously modelled economic growth appears to have the same external dynamics, but
different internal dynamics and therewith different restrictions. This means that calculations can
change depending on exogenously and endogenously modelled economic growth. An
endogenously modelled economic growth, having a causal relationship with other factors, could
for example affect and be affected by technological change, fuel prices or electrification. In
PowerPlan, costs and economic growth are exogenously modelled and are thus independent
factors. The aim of PowerPlan is to simulate the future electricity supply of a country. Detailed
economic assessments of the energy system are not the focus of the model.
In all scenarios, China‘s electricity demand increases significantly. This is due to basic
drivers influencing energy consumption such as a high population level and a steeply growing
economy, but also due to more complex factors such as higher per capita consumption levels,
increased access to electric devices, growing electrification rates, increased investments in the
69
power sector and fuel switching. If China‘s economy and related factors, like consumption levels
and access to electric devices, will continue to grow as fast as they currently do for another few
years or even for a few decades, the BAU or BAUhigh scenarios are likely. If China‘s economy
and related factors will stabilise or slow down, the BAUlow scenario is likely. In any case, the
increase in electricity demand will be high, leading to high impacts on CO2 emissions, local air
pollution, resource use and struggles for energy security. Alternatives to a mainly coal-
dominated power sector should therefore be implemented. This research shows that it may be
possible for China to install up to 30% renewable energy among the total capacity by 2030. As
this share is very high, the geographic, technical and economically feasible potentials of some
renewables could be reached e.g. for wind. Also, the location of resources could become a
problem, as most regions having splendid renewable energy resources are located far from the
regions with the highest electricity demand, so transport and storage would become an issue.
This could be a problem, since there are several independent grids in China instead of one
national grid, even though there are plans for building a national grid in the future. Implementing
a lower share of about 20% renewables among the total installed capacity would reduce the
stress on land-use and resources and might increase the geographical, technical and economic
feasibility while also reducing a significant amount of CO2 emissions.
Another drawback of renewable energy is that it tends to fluctuate. Therefore back-up
capacity is needed, so more capacity has to be installed (see Figure 19). This can increase the
costs as indicated in Figure 21. However, the effects on the electricity system‘s reliability are
positive, as the LOLP (Loss-of-load-probability) for the RE scenarios is likely to decrease
compared to the BAU and NUC scenarios.
The feasibility of installing a 20% or 30% share of renewable energy amongst the total
installed capacity in 2030 is high, as Chinese policies developed by the NDRC aim at a share of
20% in 2020. For the 20%-scenarios, the installed capacity for renewable energy would thus
need to grow at the same rate as the total increase in installed capacity between 2020 and 2030.
For the 30%-scenarios, the installed capacity for renewable energy would need to grow at a
higher rate than the total increase in installed capacity between 2020 and 2030. Martinot (2008)
indicates that between 2006 and 2020, the installed capacity of hydro power is expected to more
than double, to increase 12 times for wind energy, 15 times for biogas and 23 times for solar PV.
The feasibility of a 20% or 30% share of renewable energy in 2030 is thus likely according to
recent trends and policy goals. It also has to be noted that 20% and 30% renewable energy shares
among the total installed capacity are simulated and not 20% and 30% renewable energy shares
among the total electricity generated. Due to the lower load factor of renewable energy compared
to fossil energy, a higher share of renewable energy needs to be installed, but a lower share of
electricity from renewable energy is finally generated.
In this study, installing a share of 20% nuclear energy among the total installed capacity
in 2030 is a simulation with the goal to address ‗what if‘ questions and to enable a comparison
with an installed capacity of 20% renewable energy. This simulation is not a policy scenario,
even though nuclear energy is on the rise in China. The World Nuclear Association (2008:1)
reports that currently ―China has eleven nuclear power reactors in commercial operation, six
under construction, and several more about to start construction. Additional reactors are planned,
including some of the world's most advanced, to give a sixfold increase in nuclear capacity to at
least 50 GWe by 2020 and then a further three to fourfold increase to 120-160 GWe by 2030.‖
There are however a few restrictions to nuclear energy implementation: The construction time of
a nuclear power plant is estimated at 8 years in average with an economic life time of 20 years.
70
Before a high share of nuclear energy will be implemented, a few years would thus pass due to
construction. High investment costs are also involved for the construction of nuclear power
plants. If nuclear energy will be implemented to a larger extent, nuclear waste is likely to
increase rapidly. This is likely to raise concerns about nuclear waste treatment and disposal.
Storage and recycling of the radioactive waste could therefore become an important issue.
Finally, uranium is not a renewable resource, but a finite resource. China will depend mainly on
imported uranium. Once easily accessible uranium will be depleted, the prices for uranium will
increase rapidly. New nuclear technologies, such as fusion, might be a solution to this problem,
but so far they do not exist.
Concerning China‘s future, there are two major possibilities how to mitigate climate
change by reducing CO2 emissions in the power sector: A CO2 emission reduction can either be
achieved by reducing economic growth, population growth and total electricity consumption (as
in the BAUlow scenario) or by implementing ambitious policies which increase e.g. the share of
low- or zero-carbon technologies, such as renewable energy and to introduce policies which
increase energy efficiency. Other useful measures could be energy-saving programmes and
installing more energy-efficient technologies etc.
The results of this study concerning costs give an indication of the relative costs between all
scenarios. Technological learning curves have been incorporated in the RE and NUC scenarios,
which makes costs decrease after time. However, the electricity prices for the RE and NUC
scenarios remain between 22% higher for the RE20%(PVwind) scenario compared to the BAU
scenario, 74% higher for the NUC scenario and 178% more expensive for the
RE30%(SHPbiogas) scenario in 2030. This raises the following question: who will pay for the
investments necessary for sustainable energy transitions?
Finally, urban and rural differences in China have to be acknowledged concerning the
electricity supply. Many urban areas in China are rather developed and economically well-off,
while many rural areas remain rather undeveloped and impoverished. The power systems differ
between the urban and the rural areas, but China‘s government is striving for a country-wide
modernisation in the power sector. The future of China‘s power sector will therefore also depend
on how China will deal with equity issues in its energy supply and overall economy.
Security of supply is another important issue in the Chinese power sector. The IEA
(2007) assumes that China might not be able to meet its growing demand for oil and gas by own
reserves in the future. Either more oil and gas imports will be needed, or energy demand has to
be curbed, or alternatives energy will have to be used. Alternatives are renewable energy and
clean coal technologies. Clean coal technologies and CO2 storage are however still in the
research and development phase and are not being used commercially. The IEA (2007) also
mentions options for hydrogen, which however is also not yet commercially used. Since China is
endowed with rich renewable resources like hydro-power, wind, biomass and solar, these seem
to be feasible alternatives.
4.5 Conclusion
The Chinese electricity demand is expected to increase significantly until 2030. This will
have major impacts on resource use, energy security, the electricity system, local air pollution,
and most important on climate change issues. In the business-as-usual case, the CO2 emissions
from the power sector might increase to about 2,600 Mtons/year (BAUlow), 4,100 Mtons/year
(BAU) and 5,700 Mtons/year (BAUhigh) until 2030. Low- and zero-carbon energy, such as
renewable and nuclear energy, is therefore essential for mitigating the CO2 emissions of the
71
growing giant economy of China. Various technology combinations were tested in the
sustainable energy scenarios (biogas-SHP, wind-solar PV, mixed renewables, nuclear) and all
contributed to climate change mitigation. Effects on the electricity system and the LOLP were
positive, but costs increased to a larger extent than in the business-as-usual scenarios. It was
found that implementing a share of 30% renewable energy among the total installed capacity in
2030 could reduce CO2 emissions to up to 43-57% for the RE30% and RE30%(SHPbiogas)
scenarios, respectively, compared to the BAU scenario. It was also found that implementing a
share of 20% renewable energy among the total installed capacity in 2030 could reduce CO2
emissions to up to 17-27% for the RE20%(PVwind) and RE20% scenarios, respectively,
compared to the BAU scenario. The RE30%(SHPbiogas) scenario with a focus on biogas and
SHP systems has the highest climate change mitigation potential, but is also the most expensive
option. The RE20%(PVwind) scenario with a focus on wind energy and solar PV has the lowest
climate change mitigation potential, but is also the most cost-effective option. Both options, the
20% and 30% share of renewable energy among the total installed capacity, seem feasible
regarding China‘s current renewable energy policies, programs and latest installation trends.
Implementing a share of 20% nuclear energy among the total installed capacity in 2030 is
currently not a policy goal in China, although the share of nuclear energy is targeted to increase
significantly in the future. 20% nuclear energy among the total installed capacity could reduce
CO2 emissions to up to 38% compared to the BAU scenario, but the quantity of high and
medium radioactive waste might increase more than a 120 times. An increase of nuclear power
plants could further raise justified concerns regarding safety, human health, the environment and
costs. Finally, uranium is not endlessly abundant, but a finite resource. In contrary, renewable
energy are abundant in China and raise less safety or human health-related concerns. This study
suggests that renewable energy is the most feasible option of climate change mitigation in the
Chinese power sector.
There are thus several possibilities and several cost options for transitions to a more
sustainable power sector in China. China may be faced with two main options: choosing for high
climate change mitigation and high costs or choosing for moderate climate change mitigation
and moderate costs. In case high climate change mitigation options will be chosen, costs are
expected to increase significantly. Development assistance is likely to be needed to cover these
costs. Even though China itself will have to choose which pathway it will follow, it is of global
importance to assist the world‘s most populous country in achieving a sustainable development.
Industrialised countries should feel responsible to contribute to climate change mitigation in
China considering their financial means, technological advancement and their own current and
historic contributions to climate change.
4.6 Acknowledgements Thanks to the Stichting Groninger Universiteitsfonds for funding, the INET at Tsinghua
University for using their premises, Wang Yu for fruitful discussions and correspondence,
A.J.M. Schoot Uiterkamp and two anonymous reviewers for valuable comments on this chapter.
72
5. Scenarios for renewable energy transitions in Beijing10
Abstract
Beijing is facing severe energy and climate challenges. This chapter therefore aims to
elaborate the energy future of Beijing and assesses the impacts on energy resources, greenhouse
gas (GHG) emissions, costs and technology choices. LEAP was used to model a business-as-
usual approach and transitions to renewable energy. The renewable energy scenario simulates the
government‘s renewable energy targets. This research indicates that the energy demand is likely
to increase by 80% between 2005 and 2020 in the business-as-usual scenario. The fossil fuel
saving is expected to be 16% in the renewable energy scenario. The GHG emissions could
increase by 60% until 2020 in the business-as-usual scenario, while transitions to renewable
energy could save 23% of GHG emissions in 2020. Costs for fuels and energy investments will
increase rapidly in the coming decades, but costs will be higher when transitions to renewable
energy will be pursued. This study also indicates which renewable energy technologies could be
used in each of Beijing‘s economic sectors and which policy choices are necessary. The research
emphasises the need to implement renewable energy to reduce the effects on climate change,
local air pollution, resource use and to increase energy security.
5.1 Introduction
Global climate change, local air pollution, increased pressure on energy resources and the
struggle for energy security are challenges which the world is facing today. Renewable and other
low-carbon fuels can therefore be of great value for mega-cities such as Beijing.
With more than 15 million inhabitants (Beijing Municipal Bureau of Statistics BMBS,
2007), Beijing is the political and cultural capital of China and also one of the country‘s most
important economic motors. This entails not only increasing income, welfare and consumption of
the population, but also a rapidly growing energy demand and a rapid increase in greenhouse gas
(GHG) emissions. In 1996, Beijing‘s energy consumption was 37.4 million tonnes coal
equivalent (tce) and rose to 55.2 mio tce in 2005 (BMBS, 2007). Since China is endowed with
rich coal reserves, the majority of fuels used in Beijing is coal which has to be transported from
coal-rich provinces such as Shanxi, Inner Mongolia and Hebei. The major energy-consuming
sector is industry, which in Beijing is mainly based on energy-intensive manufacturing.
However, since income is rising, the transport sector and the household sector, particularly
heating, are expanding rapidly. The commercial sector is also prospering in Beijing, making high
tech services, tourism and research flourishing industries (BMBS, 2007). The emissions from
these commercial activities provoke both the concern of the international public regarding the
2008 Olympics and the awareness of tourists and local residents. Therefore, it is evident that
measures have to be taken for the future to avoid adverse effects and to enhance the quality of
life of Beijing‘s residents. One possibility which is under serious consideration and negotiation
by government officials, policy-makers and researchers is to implement a greater share of
renewable energy in Beijing.
This chapter therefore intends to give advice on this issue by elaborating the future of
Beijing‘s energy demand and assessing the impacts on energy resources, greenhouse gas
10
This chapter is a slightly adapted version of Urban, F., Wang, Y., Zhang, X., Benders, R.M.J., Moll, H.C., 2009.
Scenarios for a renewable energy transition in Beijing. Energy Policy, invited paper to the Special Issue ―Renewable
Energy in China‖, submitted.
73
emissions, costs and technology choices. The Long-range Energy Alternatives Planning System
LEAP was used to model a business-as-usual approach and transitions to renewable energy. The
renewable energy scenario simulates the government‘s targets to implement 4% of renewable
energy in 2010 and 6% in 2020.
Earlier research on renewable energy focused mainly on national level, such as Zhang
and Martinot (2007) which elaborate the context of renewable energy development in China and
discuss recent renewable energy policies and legislation. China‘s Energy Outlook 2004 (INET,
2004) gives an overview of the renewable energy supply outlook and an overview of its
production. Chang et al. (2003) also assess the production, consumption and prospect of Chinese
renewable energy while Li et al. (2005) analyse the potential of renewable energy in China. In
chapter 4, the possibilities and impacts of implementing renewable energy in the Chinese power
sector are modelled. Even though there is much research on renewable energy in China, research
on Beijing is rare. The World Bank (2007) project ―Beijing Renewable Energy Development
Study‖ is one of the first large-scale research projects on Beijing‘s renewable energy present and
future. An associated research by Philippe (2007) indicates the potential and implications for
three renewable energy technologies in Beijing: solar water heaters, geothermal heating and
municipal solid waste. This research stresses the possibilities and opportunities which Beijing
faces concerning renewable energy and concludes that a substantial share of coal equivalents
could be saved by employing these three technologies alone. This research is one of the first
studies on local level which takes into account in detail the present energy demand of Beijing.
The research follows a bottom-up approach to simulate Beijing‘s energy developments over the
next few decades and to assess a wide range of technologies under the business-as-usual and
renewable energy transitions scenarios.
In chapter 5.2 the methodology is described giving special attention to the modelling with
LEAP, in chapter 5.3 the results are explored, in chapter 5.4 the method and results are discussed
and the conclusions are elaborated in chapter 5.5.
5.2 Methodology
5.2.1 Modelling with LEAP
The LEAP model was developed in 1980 by Paul Raskin from the Beijer Institute for the
purpose of the Kenya Fuelwood Project. It was one of the first energy models to assess
environmental impacts such as GHG emissions. The model was extended in the following
decades and at the end of the 90s Charles Heaps from the Stockholm Environment Institute
created a Windows-based version of LEAP. The first version of the model was available to the
public in 2001 (SEI, 2007a).
LEAP is a bottom-up simulation tool with a flexible model structure which can be
adapted to the user‘s needs. It can incorporate a high level of technological detail allowing the
user to model even as detailed as end-use appliances. LEAP is based on physical accounting and
can be used as simulation, forecasting, scenario analysis and policy analysis tool. It is used
world-wide in over 130 countries as of 2006 (SEI, 2007a).
Earlier studies with LEAP for China include among others the APEC Energy Demand
and Supply Outlook 2006 and 2002, a study on national energy intensity reduction planning on
end-use level by Lin et al. (2006), China‘s Sustainable Energy Future by ERI (2003) and the East
Asia Energy Futures (EAEF)/Asia Energy Security Project by Guo et al. (2003).
74
This research is however the first to model the energy demand of Beijing with LEAP.
The study focuses on the energy demand only, due to restricted data availability for the energy
supply. The research in chapter 5.4 however covers the energy supply and the possibilities for
renewable energy on national level.
5.2.1.1 Final energy demand analysis
Main inputs of LEAP are the total activity level per fuel and end-use, the energy intensity
per activity, the demand costs and the environmental loadings or emissions. The end-use could
be for example the share of rural households using electricity for lighting. The energy intensity
per activity could be e.g. 100 kWh electricity per household. The demand costs could be e.g. 555
CNY per household and the environmental loadings or emissions could be e.g. 140 kg/GJ of
non-biogenic CO2. The final energy demand is then calculated for the base year and for each
future year in each scenario as follows (SEI, 2006a):
EDb,s,t = TAb,s,t * EIb,s,t
ED = energy demand
TA = total activity level
EI = energy intensity
b = technology branch
s = scenario
t = year
For every technology branch, the energy demand is calculated separately, thus
determining a specific fuel for every branch. When all technology branches are calculated, the
total final energy demand is computed for each fuel. The total activity level for a fuel is
calculated as the sum of all activity levels in all branches (SEI, 2006a).
5.2.1.2 Activity levels, energy intensity, emissions and demand costs
Activity levels are defined by SEI (2006a:77) as ―…a measure of the social or economic
activity for which energy is consumed‖. It describes the share of usage of each technology and
fuel in each sector and year. For the scenario-making assumptions on technological change, fuel
switching and policy development were the main drivers of changes in activity levels. These
drivers are explained in detail in chapter 2.2.
Energy intensity is defined as the energy use per unit of activity (SEI, 2006a). In this
study, energy intensities are calculated individually for each technology in each scenario and
each year. The energy intensities are based on data on consumption and energy use from the
Statistical Yearbooks of the BMBS and China‘s National Bureau of Statistics NBS (2007).
CO2 emissions are calculated using standard emission factors from the IPCC (2006) and
estimates from Chinese governmental agencies. For renewable energy, it is assumed that CO2
emissions equal zero, because only energy production is assessed and not the complete life cycle.
Emissions would be higher if the complete life cycle was to be considered, due to the
processing/production, transport and waste phase. Also, emissions for other energy would be
much higher if the complete life cycle was taken into account.
CO2 emissions account for about a 95% share of the total GHG emissions. Other GHG
emissions such as methane, non methane volatile organic compounds, nitrogen oxides, nitrous
oxide and sulfur dioxide come from the IPCC´s Revised Guidelines for National Greenhouse
75
Gas Inventories (2006) as incorporated in LEAP´s Technology and Environmental Database
TED.
Energy costs are calculated as the total expenditures for satisfying the energy demand in a
certain year.
In the household sector, costs are composed of the supply costs of energy e.g. costs per
kWh electricity, the investment cost of the device e.g. the costs of a light bulb or a radio, and
where applicable the installation and maintenance costs e.g. costs for installing and maintaining a
PV panel. The costs are calculated per year taking into account the life time of the device and
differentiating between regular costs, such as energy costs, and unique costs, such as investment
costs. The costs are calculated for each technology and each fuel individually as indicated:
CHb,s,t = ((ICb,s,t /L b,s,t) + SC b,s,t + OMC b,s,t) * ND
CH = Costs per household
IC = Investment costs per device
L = Life time of device
SC = Supply costs
OMC = Operation and maintenance costs (where applicable, otherwise 0)
ND = Number of devices per household
b = technology branch
s = scenario
t = year
Total costs in the household sector are the sum of all individual costs in each given year
and scenario. Costs for the agricultural, commercial, construction, industrial, transport sectors
and heating are calculated as activity costs. The activity costs are calculated as follows (SEI,
2006a):
Cb,s,t = CAb,s,t * AL b,s,t
C = Costs
CA = Costs per activity
AL = Activity Level
b = technology branch
s = scenario
t = year
The total costs are the sum of all individual costs per sector and per technology for each
given year and scenario. Costs for externalities such as costs for environmental pollution are not
considered. Costs are not discounted and no inflation rate is taken into account, because of lack
of data.
5.2.2 Modelling framework for Beijing
5.2.2.1 Beijing When referring to Beijing, the municipality of Beijing is meant. Of the total population,
83.6% were urban residents and 16.4% were rural residents in 2005 according to official
76
numbers. Beijing has 18 districts, of which 8 are urban and 10 are rural (BMBS, 2007). Beijing
covers an area of 16,411 km² comparable to the size of half of the Netherlands (BMBS, 2007).
6,000 km² are flat while the remaining area is hilly or mountainous. The central area of the city
of Beijing covers 1,300km². Despite strict population regulation policies on child-bearing and
immigration, the population of Beijing is growing by 2% annually since the 90s. Urbanisation
levels are also on the rise. In 2005, Beijing‘s population surpassed the 15 million mark (BMBS,
2007).
Beijing is the political and cultural capital of China. Beijing experiences a rapid
development since the 80s in all sectors and GDP growth rates rose to over 10% in recent years.
Purchasing power parity is constantly rising and official incomes are reported to increase in
average about 10% annually since 1992 (Philippe, 2007).
Beijing‘s economy is flourishing, particularly due to structural changes. The service
sector increases rapidly since the 80s resulting in numerous research centres, universities and
high-tech zones such as the Zhongguancun Science and Technology Park (BMBS, 2007). Today,
the service sector is the main income motor of Beijing accounting for 63% of Beijing‘s GDP in
2005, but consuming only 24.5% of its total energy. The industrial sector remains however large,
both in terms of GDP and in terms of energy consumption. In 2005, the industrial sector,
including construction, consumed 49% of Beijing‘s total energy and accounted for 29% of its
GDP. Particularly manufacturing and construction are responsible for a large share of both
income and energy use. With a total energy use of 1.6% and a 1.4% share of Beijing‘s GDP in
2005 the agricultural sector plays only a negligible role. The remaining GDP is generated by the
transport sector, which played a relatively small role so far in comparison to other countries, but
projections indicate a rise in transport demand associated with higher consumption levels and car
ownership (Zhang, 2007). The transport sector accounted for 10.2% of Beijing‘s energy use in
2005. The remaining 14.7% of Beijing‘s energy were consumed by the household sector in 2005
which is also subject to rising consumption levels (BMBS, 2007). Figure 22 shows the energy
consumption per sector in 2005. Energy consumption increases steadily since the last decades,
despite governmental reduction efforts. It is assumed that Beijingers consume in average at least
double as much energy as the average Chinese citizen (Philippe, 2007). Due to China‘s abundant
coal reserves, Beijing mainly relies on coal. Most industrial processes are coal-driven,
commercial and household activities such as heating and cooking partially rely on coal as well as
many agricultural processes. The majority of electricity and heat is generated from coal. Still,
there is a change ongoing. As a consequence of the energy efficiency goals of the 11th
Five-Year
plan, smaller inefficient coal power stations are being shut down and replaced by more modern
power plants. New natural gas power plants are being built and investments into renewable
energy are increasing (Philippe, 2007).
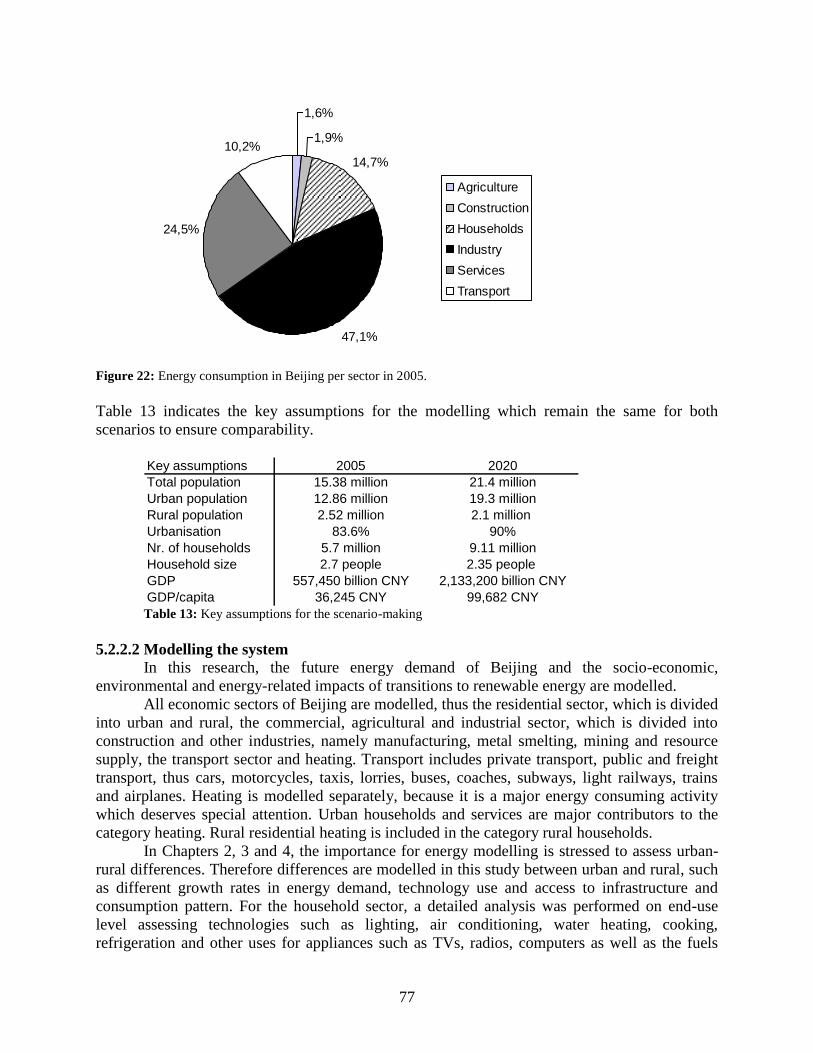
77
1,6%
1,9%
14,7%
47,1%
24,5%
10,2%
Agriculture
Construction
Households
Industry
Services
Transport
1,6%
1,9%
14,7%
47,1%
24,5%
10,2%
Agriculture
Construction
Households
Industry
Services
Transport
Figure 22: Energy consumption in Beijing per sector in 2005.
Table 13 indicates the key assumptions for the modelling which remain the same for both
scenarios to ensure comparability.
Key assumptions 2005 2020
Total population 15.38 million 21.4 million
Urban population 12.86 million 19.3 million
Rural population 2.52 million 2.1 million
Urbanisation 83.6% 90%
Nr. of households 5.7 million 9.11 million
Household size 2.7 people 2.35 people
GDP 557,450 billion CNY 2,133,200 billion CNY
GDP/capita 36,245 CNY 99,682 CNY Table 13: Key assumptions for the scenario-making
5.2.2.2 Modelling the system
In this research, the future energy demand of Beijing and the socio-economic,
environmental and energy-related impacts of transitions to renewable energy are modelled.
All economic sectors of Beijing are modelled, thus the residential sector, which is divided
into urban and rural, the commercial, agricultural and industrial sector, which is divided into
construction and other industries, namely manufacturing, metal smelting, mining and resource
supply, the transport sector and heating. Transport includes private transport, public and freight
transport, thus cars, motorcycles, taxis, lorries, buses, coaches, subways, light railways, trains
and airplanes. Heating is modelled separately, because it is a major energy consuming activity
which deserves special attention. Urban households and services are major contributors to the
category heating. Rural residential heating is included in the category rural households.
In Chapters 2, 3 and 4, the importance for energy modelling is stressed to assess urban-
rural differences. Therefore differences are modelled in this study between urban and rural, such
as different growth rates in energy demand, technology use and access to infrastructure and
consumption pattern. For the household sector, a detailed analysis was performed on end-use
level assessing technologies such as lighting, air conditioning, water heating, cooking,
refrigeration and other uses for appliances such as TVs, radios, computers as well as the fuels
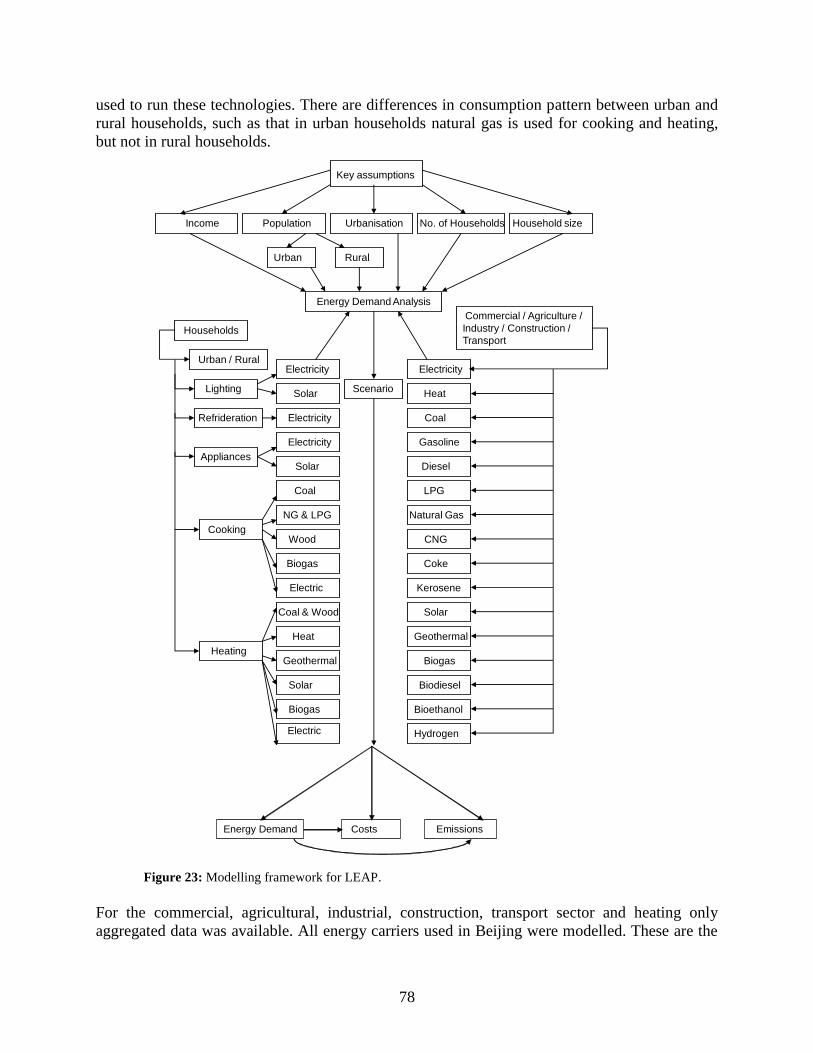
78
used to run these technologies. There are differences in consumption pattern between urban and
rural households, such as that in urban households natural gas is used for cooking and heating,
but not in rural households.
Figure 23: Modelling framework for LEAP.
For the commercial, agricultural, industrial, construction, transport sector and heating only
aggregated data was available. All energy carriers used in Beijing were modelled. These are the
Key assumptions
Income Population Urbanisation No. of Households Household size
Urban Rural
Energy Demand Analysis
Scenario
Households
Urban / Rural
Lighting
Electricity
Solar
Refrideration Electricity
Electricity
SolarAppliances
Cooking
Coal
NG & LPG
Wood
Biogas
Electric
Heating
Coal & Wood
Heat
Geothermal
Solar
Biogas
Electric
Coke
Electricity
Heat
Coal
Gasoline
Diesel
LPG
Natural Gas
Kerosene
Biogas
Biodiesel
Bioethanol
Solar
Geothermal
Hydrogen
CNG
Commercial / Agriculture /
Industry / Construction /
Transport
Energy Demand EmissionsCosts
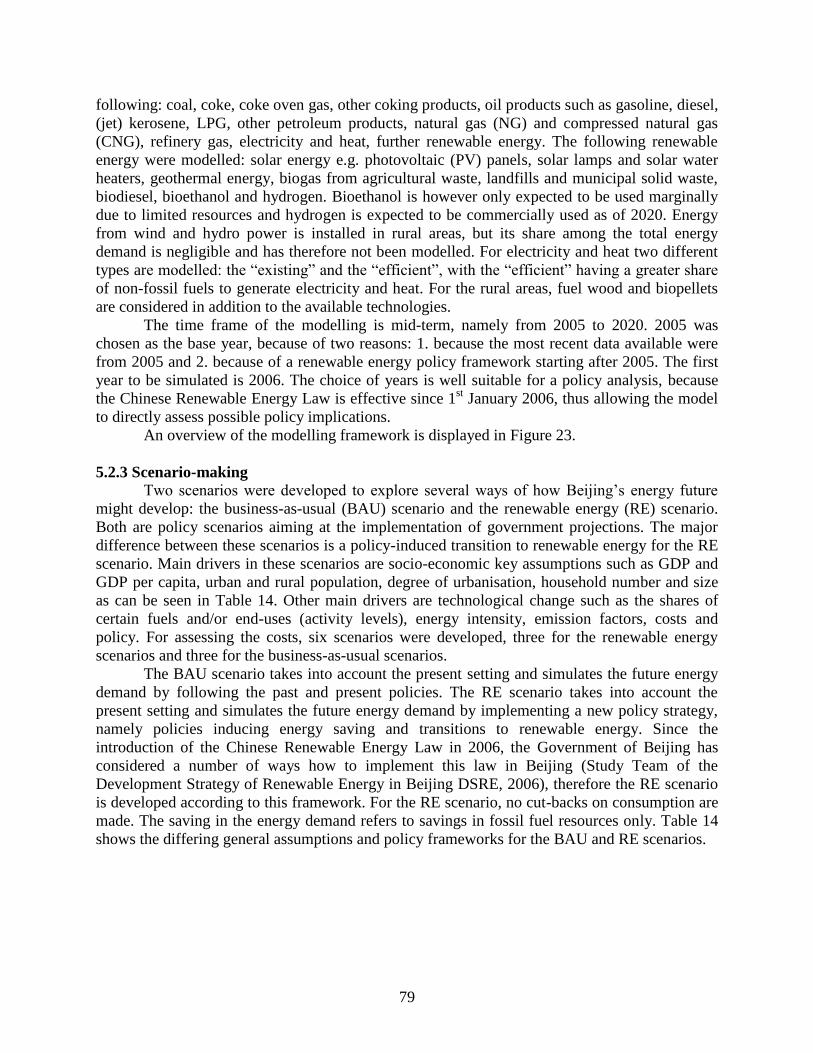
79
following: coal, coke, coke oven gas, other coking products, oil products such as gasoline, diesel,
(jet) kerosene, LPG, other petroleum products, natural gas (NG) and compressed natural gas
(CNG), refinery gas, electricity and heat, further renewable energy. The following renewable
energy were modelled: solar energy e.g. photovoltaic (PV) panels, solar lamps and solar water
heaters, geothermal energy, biogas from agricultural waste, landfills and municipal solid waste,
biodiesel, bioethanol and hydrogen. Bioethanol is however only expected to be used marginally
due to limited resources and hydrogen is expected to be commercially used as of 2020. Energy
from wind and hydro power is installed in rural areas, but its share among the total energy
demand is negligible and has therefore not been modelled. For electricity and heat two different
types are modelled: the ―existing‖ and the ―efficient‖, with the ―efficient‖ having a greater share
of non-fossil fuels to generate electricity and heat. For the rural areas, fuel wood and biopellets
are considered in addition to the available technologies. The time frame of the modelling is mid-term, namely from 2005 to 2020. 2005 was
chosen as the base year, because of two reasons: 1. because the most recent data available were
from 2005 and 2. because of a renewable energy policy framework starting after 2005. The first
year to be simulated is 2006. The choice of years is well suitable for a policy analysis, because
the Chinese Renewable Energy Law is effective since 1st January 2006, thus allowing the model
to directly assess possible policy implications.
An overview of the modelling framework is displayed in Figure 23.
5.2.3 Scenario-making
Two scenarios were developed to explore several ways of how Beijing‘s energy future
might develop: the business-as-usual (BAU) scenario and the renewable energy (RE) scenario.
Both are policy scenarios aiming at the implementation of government projections. The major
difference between these scenarios is a policy-induced transition to renewable energy for the RE
scenario. Main drivers in these scenarios are socio-economic key assumptions such as GDP and
GDP per capita, urban and rural population, degree of urbanisation, household number and size
as can be seen in Table 14. Other main drivers are technological change such as the shares of
certain fuels and/or end-uses (activity levels), energy intensity, emission factors, costs and
policy. For assessing the costs, six scenarios were developed, three for the renewable energy
scenarios and three for the business-as-usual scenarios.
The BAU scenario takes into account the present setting and simulates the future energy
demand by following the past and present policies. The RE scenario takes into account the
present setting and simulates the future energy demand by implementing a new policy strategy,
namely policies inducing energy saving and transitions to renewable energy. Since the
introduction of the Chinese Renewable Energy Law in 2006, the Government of Beijing has
considered a number of ways how to implement this law in Beijing (Study Team of the
Development Strategy of Renewable Energy in Beijing DSRE, 2006), therefore the RE scenario
is developed according to this framework. For the RE scenario, no cut-backs on consumption are
made. The saving in the energy demand refers to savings in fossil fuel resources only. Table 14
shows the differing general assumptions and policy frameworks for the BAU and RE scenarios.
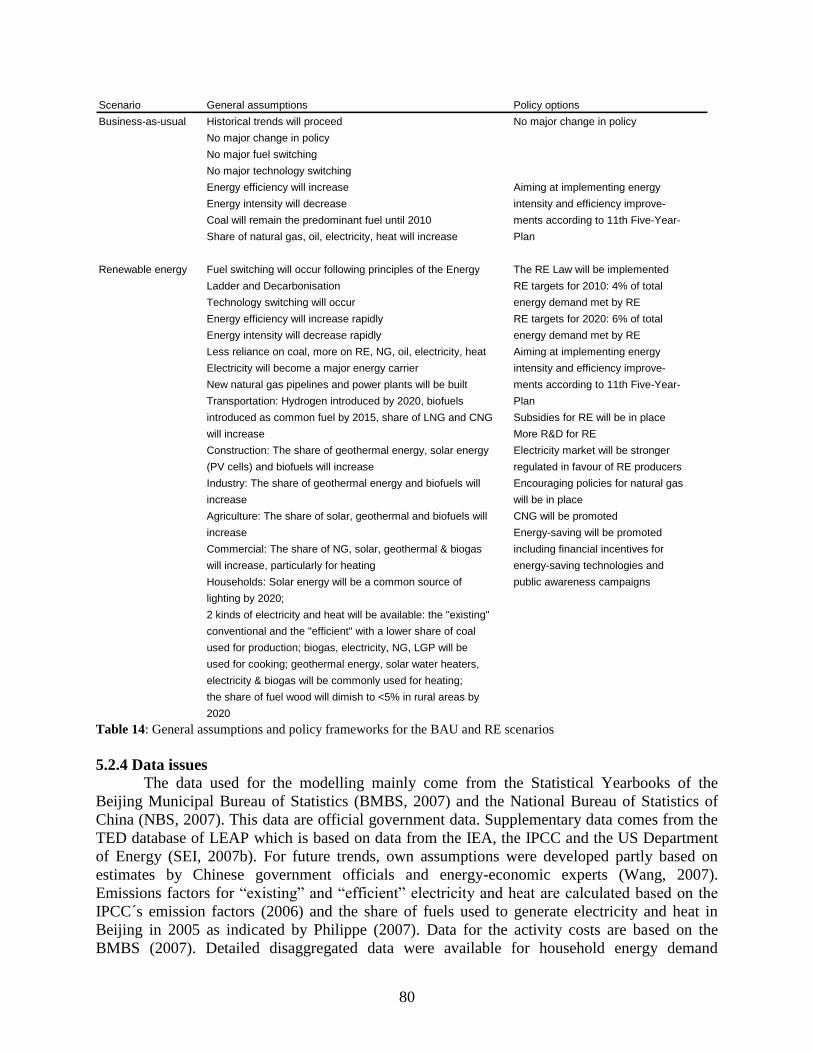
80
Scenario General assumptions Policy options
Business-as-usual Historical trends will proceed No major change in policy
No major change in policy
No major fuel switching
No major technology switching
Energy efficiency will increase Aiming at implementing energy
Energy intensity will decrease intensity and efficiency improve-
Coal will remain the predominant fuel until 2010 ments according to 11th Five-Year-
Share of natural gas, oil, electricity, heat will increase Plan
Renewable energy Fuel switching will occur following principles of the Energy The RE Law will be implemented
Ladder and Decarbonisation RE targets for 2010: 4% of total
Technology switching will occur energy demand met by RE
Energy efficiency will increase rapidly RE targets for 2020: 6% of total
Energy intensity will decrease rapidly energy demand met by RE
Less reliance on coal, more on RE, NG, oil, electricity, heat Aiming at implementing energy
Electricity will become a major energy carrier intensity and efficiency improve-
New natural gas pipelines and power plants will be built ments according to 11th Five-Year-
Transportation: Hydrogen introduced by 2020, biofuels Plan
introduced as common fuel by 2015, share of LNG and CNG Subsidies for RE will be in place
will increase More R&D for RE
Construction: The share of geothermal energy, solar energy Electricity market will be stronger
(PV cells) and biofuels will increase regulated in favour of RE producers
Industry: The share of geothermal energy and biofuels will Encouraging policies for natural gas
increase will be in place
Agriculture: The share of solar, geothermal and biofuels will CNG will be promoted
increase Energy-saving will be promoted
Commercial: The share of NG, solar, geothermal & biogas including financial incentives for
will increase, particularly for heating energy-saving technologies and
Households: Solar energy will be a common source of public awareness campaigns
lighting by 2020;
2 kinds of electricity and heat will be available: the "existing"
conventional and the "efficient" with a lower share of coal
used for production; biogas, electricity, NG, LGP will be
used for cooking; geothermal energy, solar water heaters,
electricity & biogas will be commonly used for heating;
the share of fuel wood will dimish to <5% in rural areas by
2020 Table 14: General assumptions and policy frameworks for the BAU and RE scenarios
5.2.4 Data issues
The data used for the modelling mainly come from the Statistical Yearbooks of the
Beijing Municipal Bureau of Statistics (BMBS, 2007) and the National Bureau of Statistics of
China (NBS, 2007). This data are official government data. Supplementary data comes from the
TED database of LEAP which is based on data from the IEA, the IPCC and the US Department
of Energy (SEI, 2007b). For future trends, own assumptions were developed partly based on
estimates by Chinese government officials and energy-economic experts (Wang, 2007).
Emissions factors for ―existing‖ and ―efficient‖ electricity and heat are calculated based on the
IPCC´s emission factors (2006) and the share of fuels used to generate electricity and heat in
Beijing in 2005 as indicated by Philippe (2007). Data for the activity costs are based on the
BMBS (2007). Detailed disaggregated data were available for household energy demand
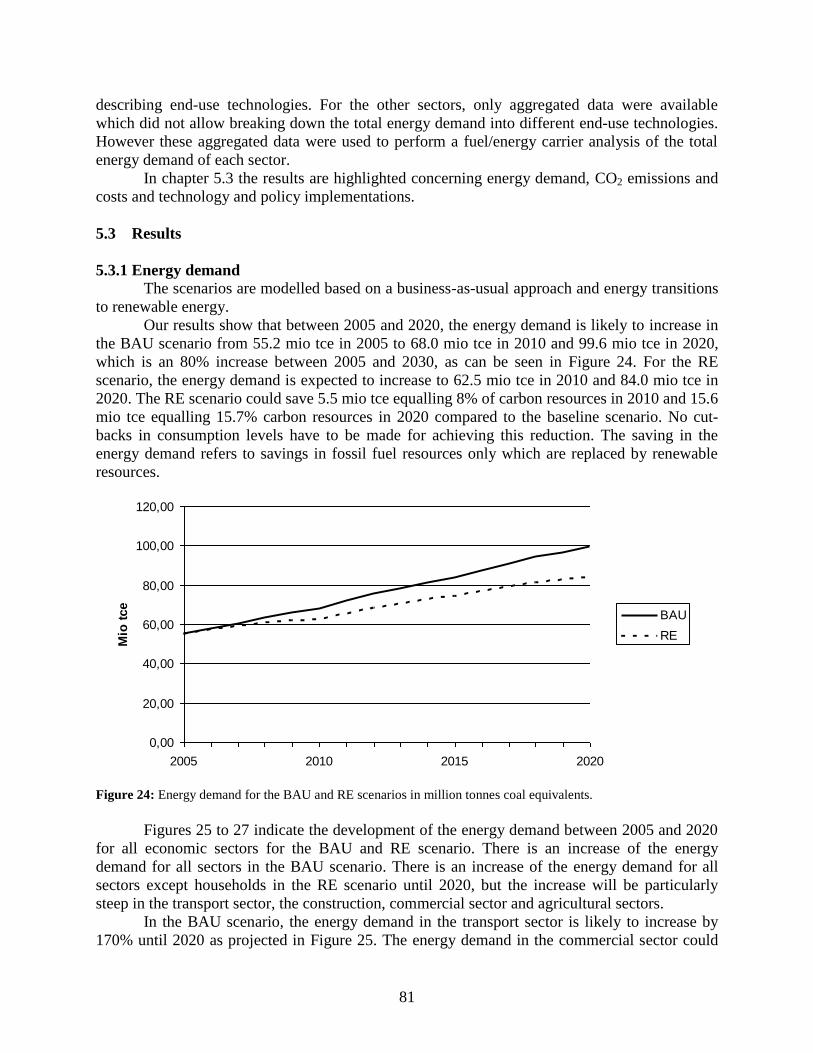
81
describing end-use technologies. For the other sectors, only aggregated data were available
which did not allow breaking down the total energy demand into different end-use technologies.
However these aggregated data were used to perform a fuel/energy carrier analysis of the total
energy demand of each sector.
In chapter 5.3 the results are highlighted concerning energy demand, CO2 emissions and
costs and technology and policy implementations.
5.3 Results
5.3.1 Energy demand
The scenarios are modelled based on a business-as-usual approach and energy transitions
to renewable energy.
Our results show that between 2005 and 2020, the energy demand is likely to increase in
the BAU scenario from 55.2 mio tce in 2005 to 68.0 mio tce in 2010 and 99.6 mio tce in 2020,
which is an 80% increase between 2005 and 2030, as can be seen in Figure 24. For the RE
scenario, the energy demand is expected to increase to 62.5 mio tce in 2010 and 84.0 mio tce in
2020. The RE scenario could save 5.5 mio tce equalling 8% of carbon resources in 2010 and 15.6
mio tce equalling 15.7% carbon resources in 2020 compared to the baseline scenario. No cut-
backs in consumption levels have to be made for achieving this reduction. The saving in the
energy demand refers to savings in fossil fuel resources only which are replaced by renewable
resources.
0,00
20,00
40,00
60,00
80,00
100,00
120,00
2005 2010 2015 2020
Mio
tce
BAU
RE
Figure 24: Energy demand for the BAU and RE scenarios in million tonnes coal equivalents.
Figures 25 to 27 indicate the development of the energy demand between 2005 and 2020
for all economic sectors for the BAU and RE scenario. There is an increase of the energy
demand for all sectors in the BAU scenario. There is an increase of the energy demand for all
sectors except households in the RE scenario until 2020, but the increase will be particularly
steep in the transport sector, the construction, commercial sector and agricultural sectors.
In the BAU scenario, the energy demand in the transport sector is likely to increase by
170% until 2020 as projected in Figure 25. The energy demand in the commercial sector could
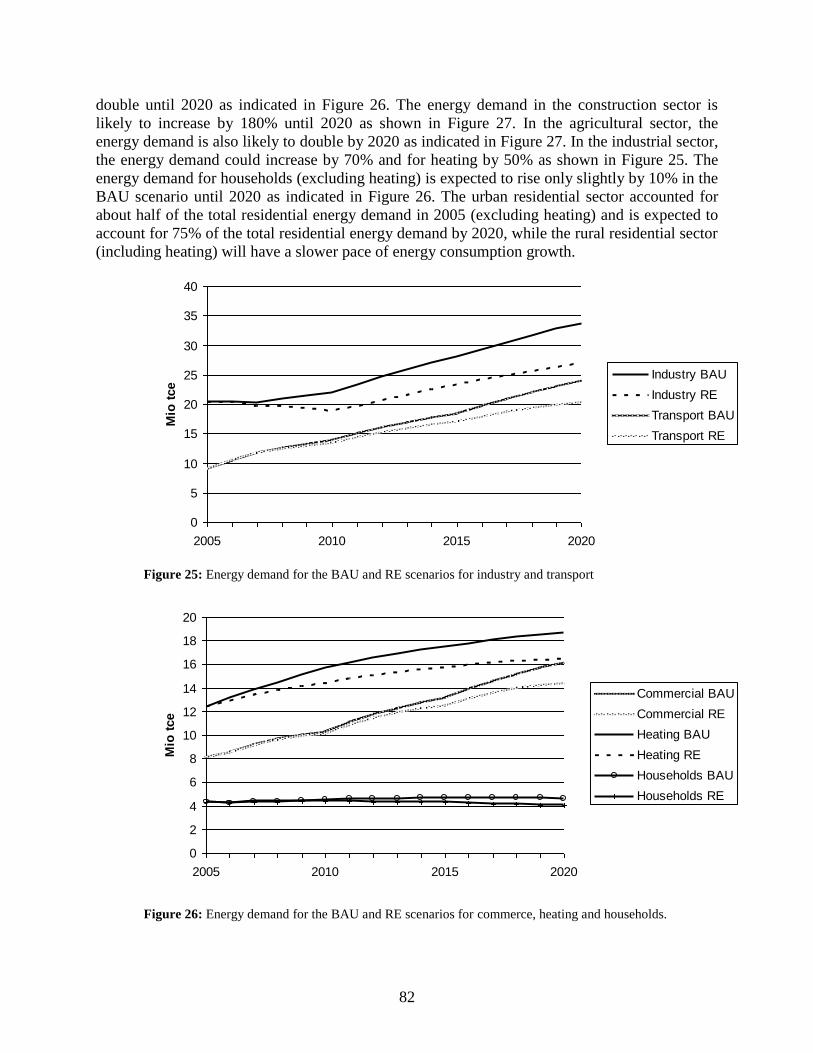
82
double until 2020 as indicated in Figure 26. The energy demand in the construction sector is
likely to increase by 180% until 2020 as shown in Figure 27. In the agricultural sector, the
energy demand is also likely to double by 2020 as indicated in Figure 27. In the industrial sector,
the energy demand could increase by 70% and for heating by 50% as shown in Figure 25. The
energy demand for households (excluding heating) is expected to rise only slightly by 10% in the
BAU scenario until 2020 as indicated in Figure 26. The urban residential sector accounted for
about half of the total residential energy demand in 2005 (excluding heating) and is expected to
account for 75% of the total residential energy demand by 2020, while the rural residential sector
(including heating) will have a slower pace of energy consumption growth.
0
5
10
15
20
25
30
35
40
2005 2010 2015 2020
Mio
tce
Industry BAU
Industry RE
Transport BAU
Transport RE
Figure 25: Energy demand for the BAU and RE scenarios for industry and transport
0
2
4
6
8
10
12
14
16
18
20
2005 2010 2015 2020
Mio
tce
Commercial BAU
Commercial RE
Heating BAU
Heating RE
Households BAU
Households RE
Figure 26: Energy demand for the BAU and RE scenarios for commerce, heating and households.
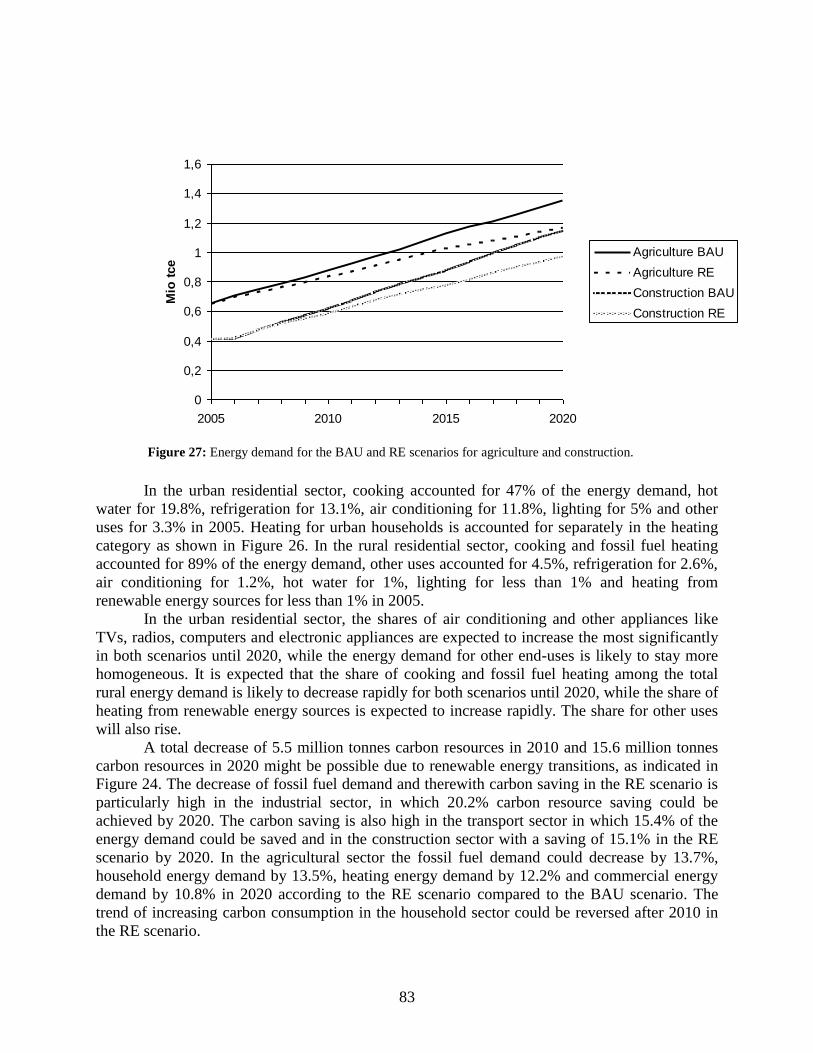
83
0
0,2
0,4
0,6
0,8
1
1,2
1,4
1,6
2005 2010 2015 2020
Mio
tce
Agriculture BAU
Agriculture RE
Construction BAU
Construction RE
Figure 27: Energy demand for the BAU and RE scenarios for agriculture and construction.
In the urban residential sector, cooking accounted for 47% of the energy demand, hot
water for 19.8%, refrigeration for 13.1%, air conditioning for 11.8%, lighting for 5% and other
uses for 3.3% in 2005. Heating for urban households is accounted for separately in the heating
category as shown in Figure 26. In the rural residential sector, cooking and fossil fuel heating
accounted for 89% of the energy demand, other uses accounted for 4.5%, refrigeration for 2.6%,
air conditioning for 1.2%, hot water for 1%, lighting for less than 1% and heating from
renewable energy sources for less than 1% in 2005.
In the urban residential sector, the shares of air conditioning and other appliances like
TVs, radios, computers and electronic appliances are expected to increase the most significantly
in both scenarios until 2020, while the energy demand for other end-uses is likely to stay more
homogeneous. It is expected that the share of cooking and fossil fuel heating among the total
rural energy demand is likely to decrease rapidly for both scenarios until 2020, while the share of
heating from renewable energy sources is expected to increase rapidly. The share for other uses
will also rise.
A total decrease of 5.5 million tonnes carbon resources in 2010 and 15.6 million tonnes
carbon resources in 2020 might be possible due to renewable energy transitions, as indicated in
Figure 24. The decrease of fossil fuel demand and therewith carbon saving in the RE scenario is
particularly high in the industrial sector, in which 20.2% carbon resource saving could be
achieved by 2020. The carbon saving is also high in the transport sector in which 15.4% of the
energy demand could be saved and in the construction sector with a saving of 15.1% in the RE
scenario by 2020. In the agricultural sector the fossil fuel demand could decrease by 13.7%,
household energy demand by 13.5%, heating energy demand by 12.2% and commercial energy
demand by 10.8% in 2020 according to the RE scenario compared to the BAU scenario. The
trend of increasing carbon consumption in the household sector could be reversed after 2010 in
the RE scenario.
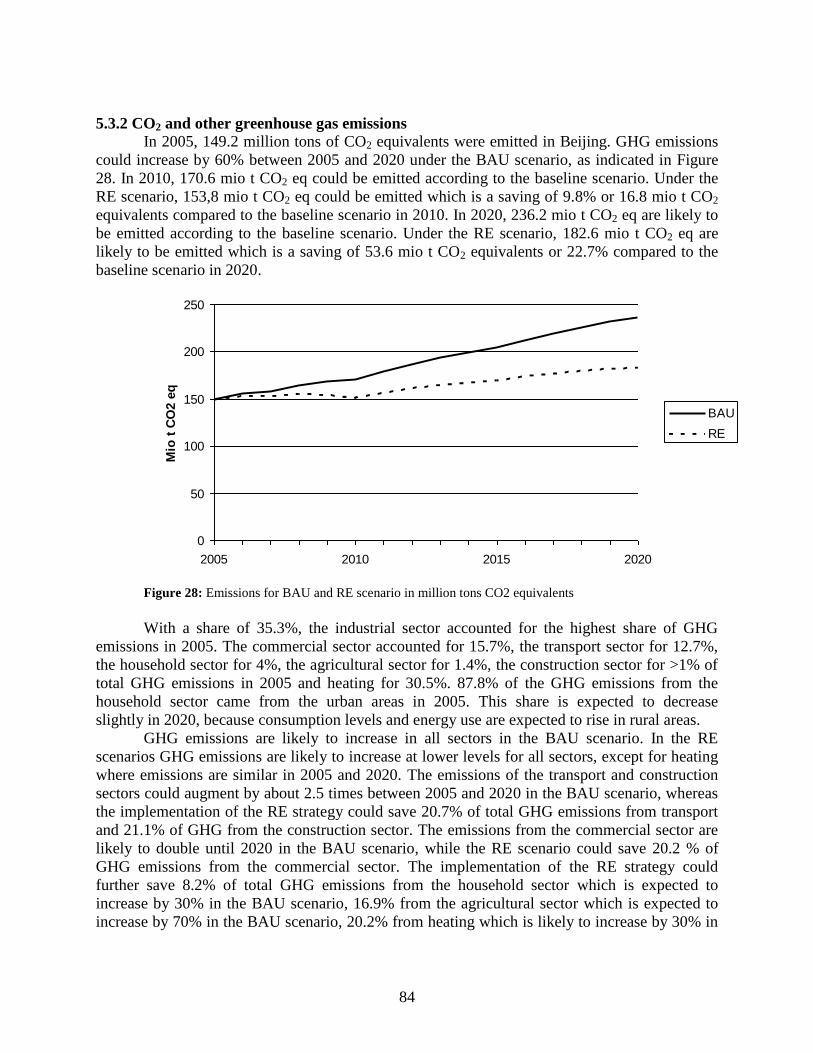
84
5.3.2 CO2 and other greenhouse gas emissions
In 2005, 149.2 million tons of CO2 equivalents were emitted in Beijing. GHG emissions
could increase by 60% between 2005 and 2020 under the BAU scenario, as indicated in Figure
28. In 2010, 170.6 mio t CO2 eq could be emitted according to the baseline scenario. Under the
RE scenario, 153,8 mio t CO2 eq could be emitted which is a saving of 9.8% or 16.8 mio t CO2
equivalents compared to the baseline scenario in 2010. In 2020, 236.2 mio t CO2 eq are likely to
be emitted according to the baseline scenario. Under the RE scenario, 182.6 mio t CO2 eq are
likely to be emitted which is a saving of 53.6 mio t CO2 equivalents or 22.7% compared to the
baseline scenario in 2020.
0
50
100
150
200
250
2005 2010 2015 2020
Mio
t C
O2 e
q
BAU
RE
Figure 28: Emissions for BAU and RE scenario in million tons CO2 equivalents
With a share of 35.3%, the industrial sector accounted for the highest share of GHG
emissions in 2005. The commercial sector accounted for 15.7%, the transport sector for 12.7%,
the household sector for 4%, the agricultural sector for 1.4%, the construction sector for >1% of
total GHG emissions in 2005 and heating for 30.5%. 87.8% of the GHG emissions from the
household sector came from the urban areas in 2005. This share is expected to decrease
slightly in 2020, because consumption levels and energy use are expected to rise in rural areas.
GHG emissions are likely to increase in all sectors in the BAU scenario. In the RE
scenarios GHG emissions are likely to increase at lower levels for all sectors, except for heating
where emissions are similar in 2005 and 2020. The emissions of the transport and construction
sectors could augment by about 2.5 times between 2005 and 2020 in the BAU scenario, whereas
the implementation of the RE strategy could save 20.7% of total GHG emissions from transport
and 21.1% of GHG from the construction sector. The emissions from the commercial sector are
likely to double until 2020 in the BAU scenario, while the RE scenario could save 20.2 % of
GHG emissions from the commercial sector. The implementation of the RE strategy could
further save 8.2% of total GHG emissions from the household sector which is expected to
increase by 30% in the BAU scenario, 16.9% from the agricultural sector which is expected to
increase by 70% in the BAU scenario, 20.2% from heating which is likely to increase by 30% in
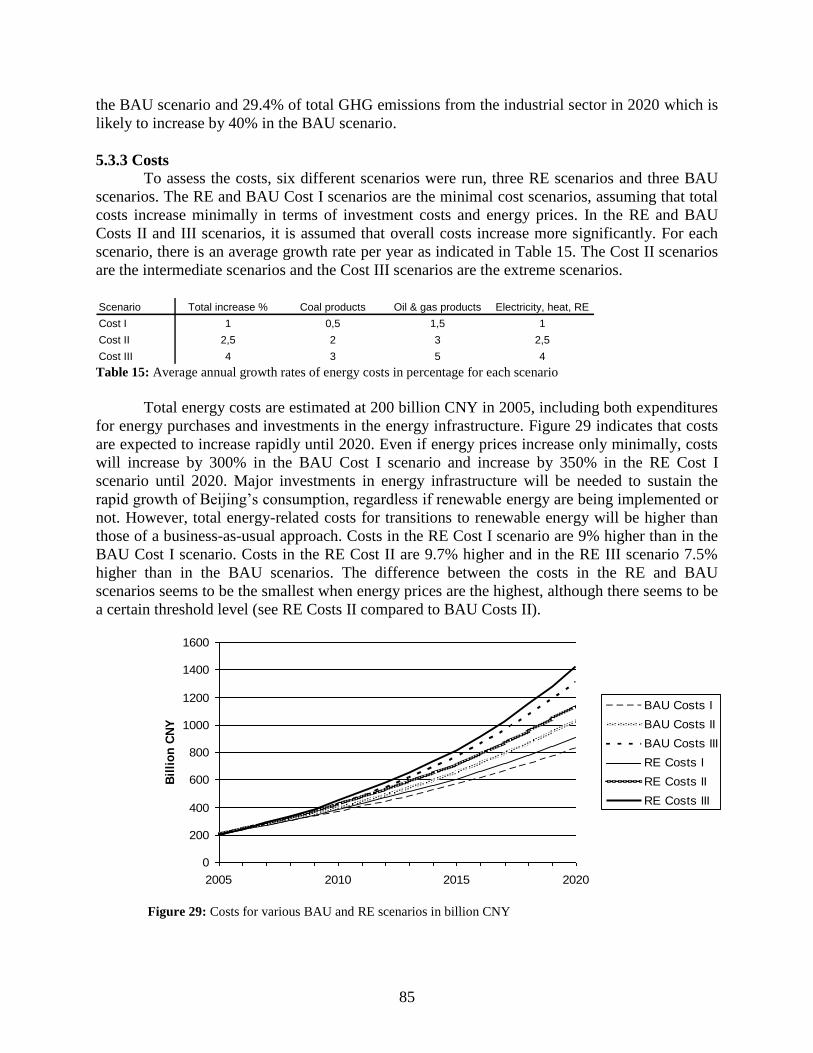
85
the BAU scenario and 29.4% of total GHG emissions from the industrial sector in 2020 which is
likely to increase by 40% in the BAU scenario.
5.3.3 Costs
To assess the costs, six different scenarios were run, three RE scenarios and three BAU
scenarios. The RE and BAU Cost I scenarios are the minimal cost scenarios, assuming that total
costs increase minimally in terms of investment costs and energy prices. In the RE and BAU
Costs II and III scenarios, it is assumed that overall costs increase more significantly. For each
scenario, there is an average growth rate per year as indicated in Table 15. The Cost II scenarios
are the intermediate scenarios and the Cost III scenarios are the extreme scenarios.
Scenario Total increase % Coal products Oil & gas products Electricity, heat, RE
Cost I 1 0,5 1,5 1
Cost II 2,5 2 3 2,5
Cost III 4 3 5 4 Table 15: Average annual growth rates of energy costs in percentage for each scenario
Total energy costs are estimated at 200 billion CNY in 2005, including both expenditures
for energy purchases and investments in the energy infrastructure. Figure 29 indicates that costs
are expected to increase rapidly until 2020. Even if energy prices increase only minimally, costs
will increase by 300% in the BAU Cost I scenario and increase by 350% in the RE Cost I
scenario until 2020. Major investments in energy infrastructure will be needed to sustain the
rapid growth of Beijing‘s consumption, regardless if renewable energy are being implemented or
not. However, total energy-related costs for transitions to renewable energy will be higher than
those of a business-as-usual approach. Costs in the RE Cost I scenario are 9% higher than in the
BAU Cost I scenario. Costs in the RE Cost II are 9.7% higher and in the RE III scenario 7.5%
higher than in the BAU scenarios. The difference between the costs in the RE and BAU
scenarios seems to be the smallest when energy prices are the highest, although there seems to be
a certain threshold level (see RE Costs II compared to BAU Costs II).
0
200
400
600
800
1000
1200
1400
1600
2005 2010 2015 2020
Bil
lio
n C
NY
BAU Costs I
BAU Costs II
BAU Costs III
RE Costs I
RE Costs II
RE Costs III
Figure 29: Costs for various BAU and RE scenarios in billion CNY
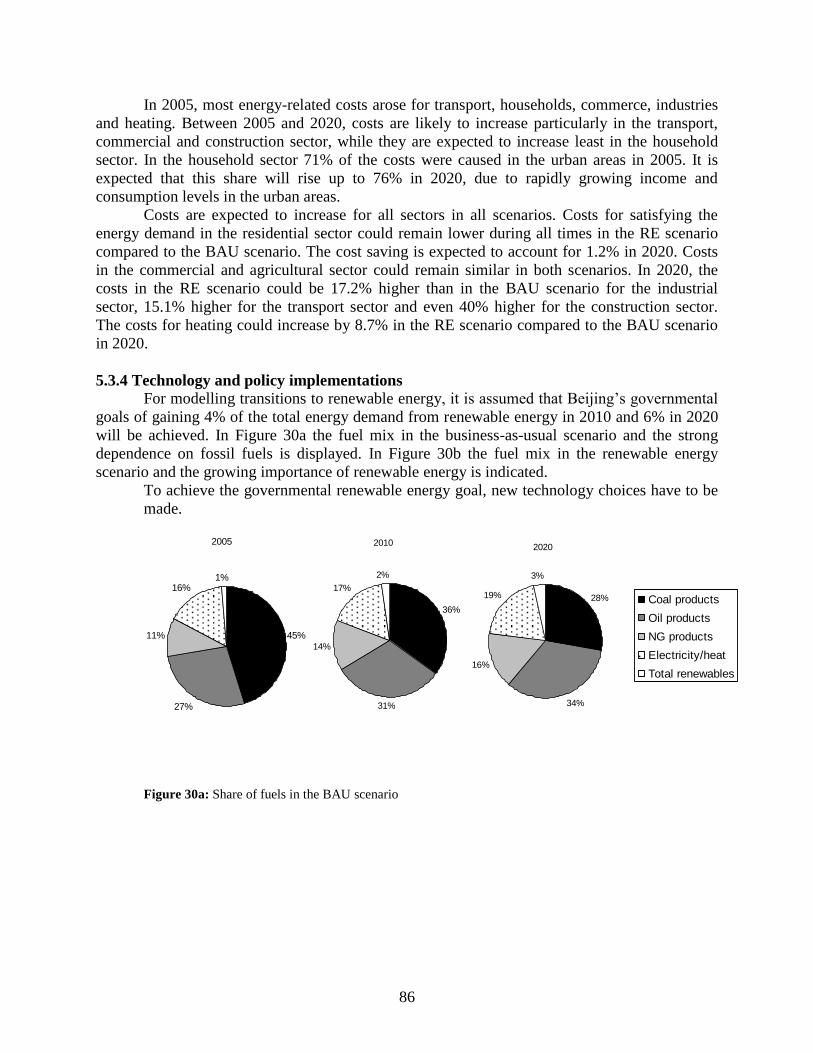
86
In 2005, most energy-related costs arose for transport, households, commerce, industries
and heating. Between 2005 and 2020, costs are likely to increase particularly in the transport,
commercial and construction sector, while they are expected to increase least in the household
sector. In the household sector 71% of the costs were caused in the urban areas in 2005. It is
expected that this share will rise up to 76% in 2020, due to rapidly growing income and
consumption levels in the urban areas.
Costs are expected to increase for all sectors in all scenarios. Costs for satisfying the
energy demand in the residential sector could remain lower during all times in the RE scenario
compared to the BAU scenario. The cost saving is expected to account for 1.2% in 2020. Costs
in the commercial and agricultural sector could remain similar in both scenarios. In 2020, the
costs in the RE scenario could be 17.2% higher than in the BAU scenario for the industrial
sector, 15.1% higher for the transport sector and even 40% higher for the construction sector.
The costs for heating could increase by 8.7% in the RE scenario compared to the BAU scenario
in 2020.
5.3.4 Technology and policy implementations
For modelling transitions to renewable energy, it is assumed that Beijing‘s governmental
goals of gaining 4% of the total energy demand from renewable energy in 2010 and 6% in 2020
will be achieved. In Figure 30a the fuel mix in the business-as-usual scenario and the strong
dependence on fossil fuels is displayed. In Figure 30b the fuel mix in the renewable energy
scenario and the growing importance of renewable energy is indicated.
To achieve the governmental renewable energy goal, new technology choices have to be
made.
2005
45%
27%
11%
16%1%
Coal products
Oil products
NG products
Electricity/heat
Total renewables
2010
31%
30%
16%
19%
4%
Coal products
Oil products
NG products
Electricity/heat
Total renewables
2010
36%
31%
14%
17%
2%
Coal products
Oil products
NG products
Electricity/heat
Total renewables
2020
28%
34%
16%
19%
3%
Coal products
Oil products
NG products
Electricity/heat
Total renewables
Figure 30a: Share of fuels in the BAU scenario
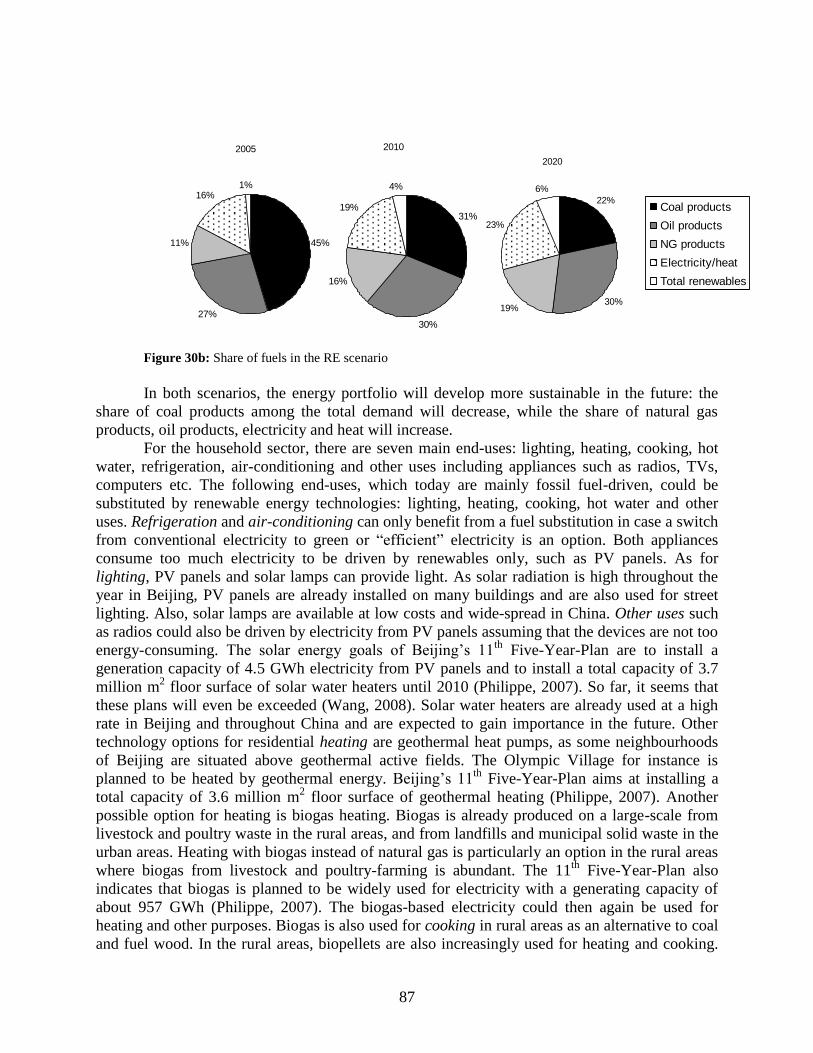
87
2020
22%
30%19%
23%
6%
Coal products
Oil products
NG products
Electricity/heat
Total renewables
2005
45%
27%
11%
16%1%
Coal products
Oil products
NG products
Electricity/heat
Total renewables
2010
31%
30%
16%
19%
4%
Coal products
Oil products
NG products
Electricity/heat
Total renewables
2010
31%
30%
16%
19%
4%
Coal products
Oil products
NG products
Electricity/heat
Total renewables
Figure 30b: Share of fuels in the RE scenario
In both scenarios, the energy portfolio will develop more sustainable in the future: the
share of coal products among the total demand will decrease, while the share of natural gas
products, oil products, electricity and heat will increase.
For the household sector, there are seven main end-uses: lighting, heating, cooking, hot
water, refrigeration, air-conditioning and other uses including appliances such as radios, TVs,
computers etc. The following end-uses, which today are mainly fossil fuel-driven, could be
substituted by renewable energy technologies: lighting, heating, cooking, hot water and other
uses. Refrigeration and air-conditioning can only benefit from a fuel substitution in case a switch
from conventional electricity to green or ―efficient‖ electricity is an option. Both appliances
consume too much electricity to be driven by renewables only, such as PV panels. As for
lighting, PV panels and solar lamps can provide light. As solar radiation is high throughout the
year in Beijing, PV panels are already installed on many buildings and are also used for street
lighting. Also, solar lamps are available at low costs and wide-spread in China. Other uses such
as radios could also be driven by electricity from PV panels assuming that the devices are not too
energy-consuming. The solar energy goals of Beijing‘s 11th
Five-Year-Plan are to install a
generation capacity of 4.5 GWh electricity from PV panels and to install a total capacity of 3.7
million m2 floor surface of solar water heaters until 2010 (Philippe, 2007). So far, it seems that
these plans will even be exceeded (Wang, 2008). Solar water heaters are already used at a high
rate in Beijing and throughout China and are expected to gain importance in the future. Other
technology options for residential heating are geothermal heat pumps, as some neighbourhoods
of Beijing are situated above geothermal active fields. The Olympic Village for instance is
planned to be heated by geothermal energy. Beijing‘s 11th
Five-Year-Plan aims at installing a
total capacity of 3.6 million m2 floor surface of geothermal heating (Philippe, 2007). Another
possible option for heating is biogas heating. Biogas is already produced on a large-scale from
livestock and poultry waste in the rural areas, and from landfills and municipal solid waste in the
urban areas. Heating with biogas instead of natural gas is particularly an option in the rural areas
where biogas from livestock and poultry-farming is abundant. The 11th
Five-Year-Plan also
indicates that biogas is planned to be widely used for electricity with a generating capacity of
about 957 GWh (Philippe, 2007). The biogas-based electricity could then again be used for
heating and other purposes. Biogas is also used for cooking in rural areas as an alternative to coal
and fuel wood. In the rural areas, biopellets are also increasingly used for heating and cooking.
88
For hot water, solar water heaters are already in place in many households, especially in rural
areas.
For the commercial sector, lighting, heating, cooking, refrigeration, air-conditioning and
other uses such as radios, TVs and computers do also play an important role. Therefore PV
panels, solar lamps, solar water heaters, geothermal heaters and biogas for cooking are also
viable technologies for substituting the predominant coal products, oil products and natural gas
products.
For the agricultural sector, solar energy, geothermal energy and biogas are used in
agricultural processes as substitutes for fossil fuels. Biofuels such as biodiesel is further vital for
running agricultural machines which would otherwise run mainly on diesel.
For the industrial sector, biofuels for machines, biogas and geothermal energy play a role.
Other renewable energy technologies are not viable for the industrial sector, because processes
are energy-intensive and large-scale.
For the construction sector, biofuels, biogas and geothermal energy play a role, similar to
the other industrial processes. However, solar energy might also play a role in form of PV panels
or solar lamps for smaller-scale processes.
For the transport sector, biofuels such as biodiesel, bioethanol and biogas and hydrogen
are of growing importance. Also other fuels such as CNG and LGP are already employed in the
public transport sector. There are currently successful initiatives to increase the share of public
buses running on CNG (BMBS, 2007) and it is reported that a few public buses seem to be
driven on hydrogen as a demonstration project (Wang, 2007). This research indicates that fueling
vehicles with alternative fuels or even with hydrogen would make an impact, although today
hydrogen technologies are still not commercially employed. It is assumed for the future that
more vehicles will drive on biofuels as vehicle producers will develop more environmental
vehicles. It is assumed that by 2020, hydrogen will be a common energy carrier in the
commercial transport sector. In urban areas, private transport plays so far a small, but
increasingly important role (Zhang, 2007; BMBS, 2007). In 2004, there were 11 cars per 100
permanent residents. In 2007, there were already 18 cars per 100 permanent residents (BMBS,
2007). According to the Beijing Municipal Transportation Commission (2007), 29.8% of the
urban population used public transport for commuting, another 29.8% used private cars, while
the remaining 40.4% either used taxis or cycled or walked to work in 2005. Unfortunately, public
transport tends to be crowded and buses are often slow, so that people tend to opt for other
options such as taxis or private cars. In rural areas, car ownership is very low, so that private
transport does not play a role (BMBS, 2007).
To achieve the transitions to renewable energy, strict policies are needed to encourage
environmental change. Some policies stimulating renewable energy are officially in place in
China, such as among others investment subsidies and tax reductions for renewable energy
projects, renewable obligations for grid companies and the Clean Development Mechanism
(CDM). The efficiency of implementing these policies is however variable. Strict
implementation of existing policies and introduction of additional policies is therefore necessary.
Policies focusing on local scale might even be more effective than national ones, because of
lower organisation and management scales.
More financial incentives must come into place to stimulate the development and usage
of renewable energy technologies, such as renewable energy credits or rewards for research and
development in the field of renewable energy technologies. Multinational companies could play
89
a role in importing their newest technologies to China e.g. hybrid cars; however the local
industry should also be rewarded for developing cleaner technologies.
On the other hand, restricting policies could also be useful to achieve transitions to
renewable energy. This could happen for instance as a reduction of subsidies for coal, as carbon
taxes for fossil fuels or as reasonably high fees for climate-unfriendly emissions according to the
―polluter-pays-principle‖. This combination of rewards and punishments might change the
behaviour of both the providers of goods and services and the consumers to make conscious and
environment-sound decisions about their energy choices.
5.4 Discussion
5.4.1 Discussion of the method and data
The results of this research are dependent on three important inputs: the modelling
method and the model itself, the scenario assumptions and the input data.
1. The modelling method determines how to model the energy demand and its impacts.
The model used for this research is the bottom-up accounting tool LEAP which is used for
scenario simulation. With the same data, using a different model or a different modelling method
would result in only slightly different outputs, because LEAP is a reliable tool which has been
calibrated and validated. One of the major advantages of LEAP is its bottom-up approach which
allows to model technological details resulting in a disaggregated description of energy
technology processes. One of the major disadvantages is that economic processes are modelled
in a rather aggregated way, as LEAP is not an economic equilibrium or optimisation model.
2. The underlying scenario assumptions determine the results of the modelling. Other
scenario assumptions would result in different outputs e.g. nuclear energy scenario or hydrogen
scenario. Different aggregations of end-uses and sub-sectors can also influence the outcome.
Based on the available data, the industrial sector is analysed in different sub-sectors: construction
and other industries. Heating was also analysed as a separate sector. This approach allows a more
differentiated analysis.
3. Both official governmental data from the BMBS and the NBS and international data
from the IPCC, IEA and the US Department of Energy were used. As far as possible, the data
from the BMBS and NBS were compared to similar data available from the IEA Energy
Statistics (IEA, 2008). It was found that there are differences between the official Chinese
government data and the IEA data, mainly indicating a slightly lower energy consumption,
production and emissions in the Chinese data, but in total the data from both sources are
consistent.
5.4.2 Uncertanties
There are a number of uncertainties in the system which makes it impossible to predict
the future. There is full awareness of the uncertainties involved in the modelling as shown in
Table 16. The scenarios presented are therefore an indicator of possible future developments, but
not a prediction.
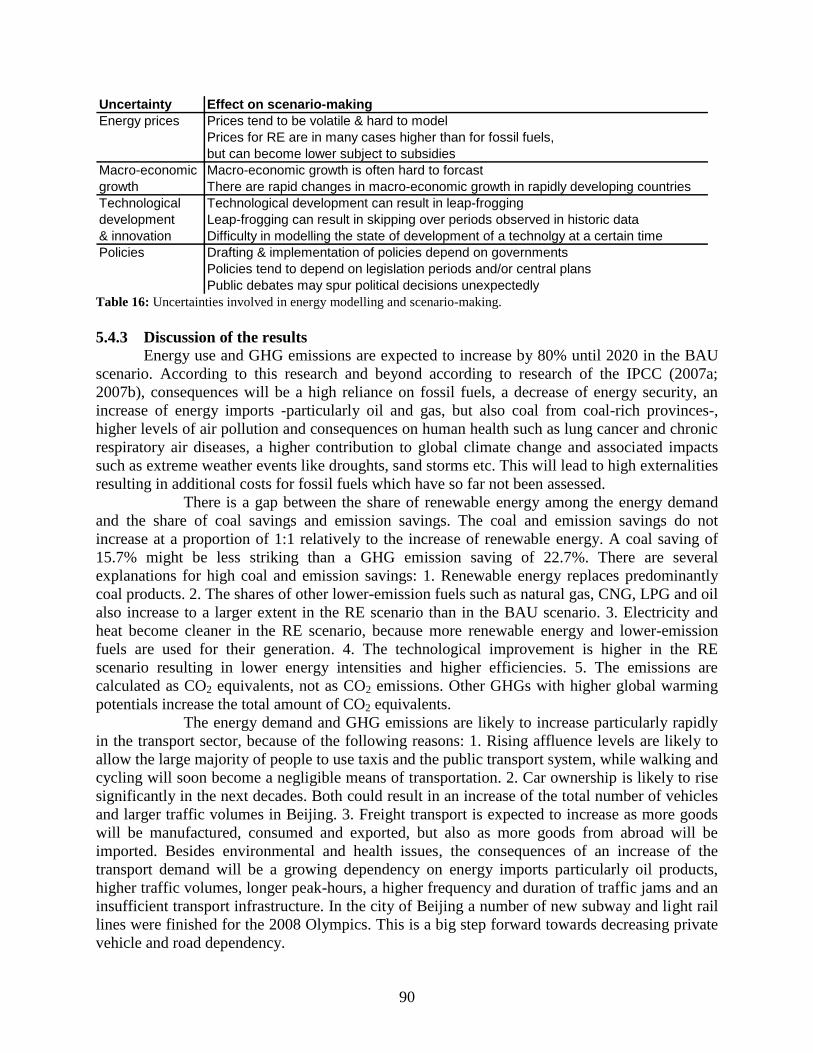
90
Uncertainty Effect on scenario-making
Energy prices Prices tend to be volatile & hard to model
Prices for RE are in many cases higher than for fossil fuels,
but can become lower subject to subsidies
Macro-economic Macro-economic growth is often hard to forcast
growth There are rapid changes in macro-economic growth in rapidly developing countries
Technological Technological development can result in leap-frogging
development Leap-frogging can result in skipping over periods observed in historic data
& innovation Difficulty in modelling the state of development of a technolgy at a certain time
Policies Drafting & implementation of policies depend on governments
Policies tend to depend on legislation periods and/or central plans
Public debates may spur political decisions unexpectedly Table 16: Uncertainties involved in energy modelling and scenario-making.
5.4.3 Discussion of the results
Energy use and GHG emissions are expected to increase by 80% until 2020 in the BAU
scenario. According to this research and beyond according to research of the IPCC (2007a;
2007b), consequences will be a high reliance on fossil fuels, a decrease of energy security, an
increase of energy imports -particularly oil and gas, but also coal from coal-rich provinces-,
higher levels of air pollution and consequences on human health such as lung cancer and chronic
respiratory air diseases, a higher contribution to global climate change and associated impacts
such as extreme weather events like droughts, sand storms etc. This will lead to high externalities
resulting in additional costs for fossil fuels which have so far not been assessed.
There is a gap between the share of renewable energy among the energy demand
and the share of coal savings and emission savings. The coal and emission savings do not
increase at a proportion of 1:1 relatively to the increase of renewable energy. A coal saving of
15.7% might be less striking than a GHG emission saving of 22.7%. There are several
explanations for high coal and emission savings: 1. Renewable energy replaces predominantly
coal products. 2. The shares of other lower-emission fuels such as natural gas, CNG, LPG and oil
also increase to a larger extent in the RE scenario than in the BAU scenario. 3. Electricity and
heat become cleaner in the RE scenario, because more renewable energy and lower-emission
fuels are used for their generation. 4. The technological improvement is higher in the RE
scenario resulting in lower energy intensities and higher efficiencies. 5. The emissions are
calculated as CO2 equivalents, not as CO2 emissions. Other GHGs with higher global warming
potentials increase the total amount of CO2 equivalents.
The energy demand and GHG emissions are likely to increase particularly rapidly
in the transport sector, because of the following reasons: 1. Rising affluence levels are likely to
allow the large majority of people to use taxis and the public transport system, while walking and
cycling will soon become a negligible means of transportation. 2. Car ownership is likely to rise
significantly in the next decades. Both could result in an increase of the total number of vehicles
and larger traffic volumes in Beijing. 3. Freight transport is expected to increase as more goods
will be manufactured, consumed and exported, but also as more goods from abroad will be
imported. Besides environmental and health issues, the consequences of an increase of the
transport demand will be a growing dependency on energy imports particularly oil products,
higher traffic volumes, longer peak-hours, a higher frequency and duration of traffic jams and an
insufficient transport infrastructure. In the city of Beijing a number of new subway and light rail
lines were finished for the 2008 Olympics. This is a big step forward towards decreasing private
vehicle and road dependency.
91
There is an ongoing debate among experts about the competition between land for food
production and for biofuel production (e.g. Nonhebel, 2005 and 2007; Chakravorty, 2007;
Ignaciuk, 2006). This might also be an important issue for Beijing and for the regions
transporting biofuels to Beijing. More research is needed to address the question whether enough
land is available for sustaining both Beijing‘s food consumption and its biofuel consumption.
Since biofuels are currently only produced from animal waste oil in Beijing, it is rather likely
that not enough land will be available for a high introduction of biofuels. Another critical issue
with biofuels is the low efficiency. In most countries, currently a blend of about 5-20% biofuel
and 80-95% conventional fuel is used, which decreases its environmental value. Another
problem is the CO2 emissions from biofuels. These are only significantly lower than the
emissions from conventional fuels if the CO2 uptake of plants used for biofuel production is
considered. Finally, growing biocrops on a large-scale might be a threat to biodiversity and
might increase deforestation. Second-generation biofuels could be a solution to these problems,
but they are not yet commercially available.
Heating is treated as a separate sector. Most of the heating is used for urban residential
and commercial purposes. Rural residential heating is accounted for separately in the residential
sector. The overall potential for the reduction of energy demand and emissions is therefore in
total higher in the urban residential and commercial sector when heating is considered. Total
energy use in the urban household and commercial sector is thus also higher.
Costs will rise rapidly, similar to energy consumption, income levels and
purchasing power parity. Rising costs might be less problematic at higher income levels. Rising
costs could be reduced if energy saving and energy efficiency will be effective. Costs are higher
for the RE scenarios, however externalities are not added to the costs for the BAU scenarios as
mentioned before. An increase of energy prices of 4% annually might seem high for a
developing country, but recent oil price increases have shown that this assumption is very
realistic. Even higher prices might be likely. Nevertheless, costs are always a sensitive issue and
can hardly be predicted correctly. Average costs were modelled; no extreme fluctuations are
simulated such as oil price shocks, even though fluctuations in prices can result in fuel switching.
Even in 2020, there will be significant differences between urban and rural areas in
terms of income and life styles. The rural population will adapt only slowly to the increasingly
Westernised life styles of their urban neighbours. Renewable energy is more likely to be installed
in rural areas, because of abundant renewable resources and lack of access to fuel markets. For
the future it is therefore important to promote sustainable and equitable growth. In urban areas it
is particularly important to ensure that both poorer and richer citizens gain equal access to
sustainable energy to avoid unequal consumption and distribution of energy.
With Beijing having the size of about half of the Netherlands, there is enough
space for installing renewable energy. Some renewable technologies do also not require much
space, such as roof-top PV panels, solar water heaters, geothermal heating systems from
geothermal fields situated under some parts of the city or biogas coming from existing landfills.
The fact that high-rise buildings are the prevalent type of buildings in Beijing results however in
the effect that less space is available for installing solar water heaters and PV cells than in cities
with a larger number of low-rise buildings.
Technological leapfrogging is likely to play a role as new technologies such as
hybrid or hydrogen cars and high-efficiency power plants could be implemented. Leapfrogging
is an assumption in this simulation concerning hydrogen cars. With a growing emphasis on the
92
service sector, dematerialisation and decarbonisation can be possible in Beijing. The ―dirty road‖
of the industrialised countries´ development does not necessarily have to be followed.
It is assumed in both scenarios that Beijing´s economy will develop similar to the
last years. These assumptions are based on governmental projections (Wang, 2007). It could
nevertheless happen that the economy of Beijing develops differently in the future. Heavy-
polluting industries could move into poorer neighbouring provinces where production costs are
lower. Especially the coking, chemical and steel industries are likely to decline in Beijing in the
near future. Beijing might become an administrative and service-oriented city with only few
industries. In this case, environmental issues in Beijing could resolve positively. However,
Beijing could be influenced negatively by the industries in neighbour provinces. In the last few
years, some of Beijing‘s polluting industries were moved to neighbouring provinces such as
Hebei. Beijing is however affected from these neighbouring industries when the wind blows
―trans-provincial air pollution‖ back into the city. It could be possible that some of Beijing‘s
environmental problems could soon become problems beyond its municipal boundaries. Trans-
provincial cooperation on energy planning could therefore be needed.
5.4.4 Recommendations
Several recommendations are derived from the discussion of the results:
For decreasing the transport energy demand, Beijing needs a three-fold approach: 1. To
re-adapt the transport infrastructure by decreasing the dependency on road transport and
increasing the infrastructure for other forms of transport. Possible options could be to invest into
further extensions of the subway and light rail, more train stations, introduction of trams and
possibilities for car pooling. Congestion charges might also be a viable option, like experience
from other large cities such as London has shown. City-planning needs to be re-adapted to avoid
importing problems similar to American cities such as dependency on cars, car infrastructure and
urban sprawl. 2. To encourage individuals to use public transport or taxis instead of purchasing
own cars or motorcycles. Public awareness campaigns might be necessary. Auctioning vehicle
plates like it is already common practise in Shanghai might further be an option to restrict private
car ownership. 3. To switch to alternative fuels. Fueling public transport and maybe also taxis
with biofuels and CNG and later with hydrogen might make a high impact. Biofuels could
become competitive if subsidies on fossil fuels were decreased and/or if gasoline and diesel were
carbon-taxed like in other countries. Using the tax revenues or switching subsidies to finance
biofuels could make them cheaper than conventional fuels and could therefore save costs on the
consumer-side. There could be investment subsidies for hybrid cars or other forms of cleaner
cars to encourage individuals to drive cleaner.
Also for the other sectors, there are serious policy implications which arise from
Beijing‘s energy use. Energy saving is vital, regardless if renewable energy will be implemented
or not. In 2006, Beijing‘s energy intensity decreased by more than 5% in comparison to 2005.
The province of Beijing is one of the few Chinese provinces that can realistically achieve the
energy saving targets set in the national 11th
Five-Year Plan (Wang, 2007). However, a range of
strict policies need to be implemented to increase energy saving and energy efficiency. Schemes
for energy saving and energy efficiency could help to increase public awareness. Energy saving
devices like energy saving light bulbs, energy efficient refrigerators and air conditionings need to
be installed where possible. However, energy saving devices are not enough. Instead a
behavioural shift in consumption patterns is necessary to prime the consumer from energy-
intensive to energy saving. Behavioural change can be achieved through education; however
93
rewards like subsidies or other financial incentives could be much more effective, especially for
enterprises with high stakes. ―Punishments‖ like reduction of subsidies, fines and taxes could
also be an option, especially for climate-unfriendly enterprises and product groups e.g. reduction
of coal subsidies, carbon tax on gasoline/diesel.
5.5 Conclusions
This chapter elaborated the future of the energy supply and demand of Beijing and
assessed the impacts on energy resources, GHG emissions, technology choices and costs. LEAP
was used to model a business-as-usual approach and transitions to renewable energy. The
renewable energy scenario simulates the government‘s targets to implement 4% of renewable
energy in 2010 and 6% in 2020. This research indicates that transitions to renewable energy is
strongly needed as the energy demand will increase by 80% between 2005 and 2020 in the
baseline scenario, while a 15.7% reduction of fossil fuel demand is achieved in the renewable
energy scenario, equalling a carbon saving of 15.6 mio tce. The CO2 emissions will increase by
60% between 2005 and 2020 in the business-as-usual scenario, while transitions to renewable
energy could save 22.7%, equalling 53.6 mio t CO2 emission equivalents in 2020 alone.
If no counter measures will be taken there could be severe consequences such as
increasing levels of air pollution, consequences on human health, rising contributions to global
climate change and a high reliance on energy imports.
Installing a modest share of renewable energy can already have significant effects.
Consumption levels do not have to be restricted as fossil energy is replaced by renewable energy.
The most effective reduction of energy demand and GHG emissions due to transitions to
renewable energy could be possible for industries and construction. Effective GHG reduction
could also be implemented for heating and commerce. Transitions to renewable energy could be
most cost-effective in households, agriculture, commerce and heating. The most cost-effective
way to switch from fossil fuel energy to renewable energy seems to be in places where processes
remain the same, while only small-scale devices have to be switched. Renewable energy could
therefore particularly be employed in households, the commercial sector and heating where
technologies such as PV panels, solar water heaters, solar lamps, geothermal heating and biogas
stoves/heating could be used. A decrease of energy demand in the household sector is however
only expected to be possible if renewables energy are employed on large-scale. Governmental
programs and/or financial incentives should be in place to achieve a large-scale implementation.
In other sectors fuel switching might be more expensive, such as in the industrial and
construction sector where large-scale processes or machinery might have to be amended.
However, this work has proven that transitions to fossil fuels could be particularly effective in
these sectors.
It is recommended to increase the share of renewable energy, particularly in the
industrial, construction and transport sector where most effects can be obtained, and in the
household sector where renewable energy are relatively easy and cost-effective to install.
Switching to CNG, biofuels and hybrid vehicles is recommended in the rapidly growing
transport sector. Research on hydrogen vehicles could be valuable and might allow possibilities
for Chinese market leadership in this technology. However, low-carbon energy may only be one
part of solving Beijing‘s traffic problems. Another –maybe even more important- part is to re-
adapt the transport infrastructure to reduce dependency on roads and private cars and to
encourage the local population to use public transport. Possible solutions could be to further

94
extend the subway and light rail lines, to add train stations, to build a tram system and to promote
public transport and car pooling.
Governmental programs, financial incentives and/or environmental rewarding and
taxation schemes should be in place to achieve a large-scale implementation. Energy saving is
also crucial to decrease the rapid expansion of energy demand and emissions.
5.6 Acknowledgements Thanks to the Stichting Groninger Universiteitsfonds for funding, the INET at Tsinghua
University for using their premises, the colleagues at INET and other local experts for valuable
discussions and/or comments on this chapter.
95
6. Energy for rural India11
Abstract
About 72 million households in rural India do not have access to electricity and rely
primarily on traditional biofuels. This research investigates how rural electrification could be
achieved in India using different energy sources and what the effects for climate change
mitigation could be. I use the Regional Energy Model REM to develop scenarios for rural
electrification for the period 2005 to 2030 and to assess the effects on greenhouse gas emissions,
primary energy use and costs. I compare the business-as-usual scenario (BAU) with different
electrification scenarios based on electricity from renewable energy, diesel and the grid. My
results indicate that diesel systems tend to have the highest CO2 emissions, followed by grid
systems. Rural electrification with primarily renewable energy-based end-uses could save up to
99% of total CO2 emissions and 35% of primary energy use in 2030 compared to BAU. My
research indicates that electrification with decentral diesel systems is likely to be the most
expensive option. Rural electrification with renewable energy tends to be the most cost-effective
option when end-uses are predominantly based on renewable energy, but turns out to be more
costly than grid extensions when electric end-use devices are predominantly used. This research
therefore elaborates whether renewable energy is a viable option for rural electrification and
climate change mitigation in rural India and gives policy recommendations.
6.1. Introduction
Energy is a vital commodity. It is commonly recognised that access to energy is closely
linked with development and economic well-being (DFID, 2002; IEA, 2002a; WEC, 2001;
WEC, 2000; WHO, 2006) and that alleviating energy poverty is a prerequisite to fulfill the
Millennium Development Goals (DFID, 2002; WHO, 2006). Especially access to modern
energy, like electricity, is vital for development in low-income countries. With 412 million
people not having access to electricity in 2005, India hosts the world‘s largest population
deprived of electricity. 92% of this population lives in rural India, equaling about 380 million
people or 71.7 million households (IEA, 2007). The Indian government takes rural energy
poverty serious and issued numerous rural electrification schemes since the Indian independence
(Bhattacharyya, 2006a; Liming, 2008). Rural electrification plays a major role in the current and
future energy setting of India.
This chapter therefore aims to investigate how complete rural electrification could be
achieved in India using different energy sources and what the effects for climate change
mitigation could be. Scenarios were developed for rural electrification for the period 2005 to
2030 with the Regional Energy Model (REM). REM is a bottom-up simulation model which
analyses the energy supply and demand of a country or region for all sectors. Using REM, the
effects of rural electrification were assessed on greenhouse gas emissions (GHG), primary
energy use and costs. Five main scenarios were developed: the business-as-usual scenario
(BAU1), in which no electrification takes place, and four electrification scenarios based on
electricity from renewable energy (2 scenarios), diesel and the grid. Six cost scenarios were
developed in addition.
11
This chapter is a slightly adapted version of Urban, F., Benders, R.M.J., Moll, H.C., 2009. Energy for rural India.
Applied Energy, accepted for the special issue ―Biofuels in Asia‖.
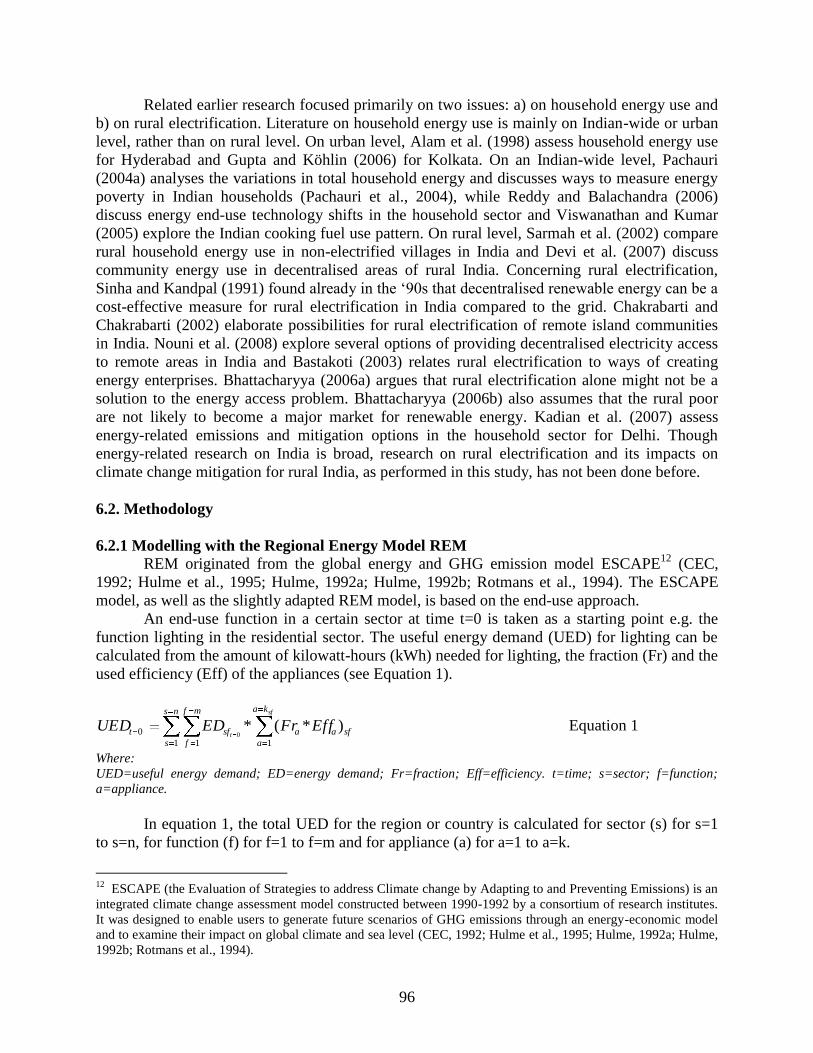
96
Related earlier research focused primarily on two issues: a) on household energy use and
b) on rural electrification. Literature on household energy use is mainly on Indian-wide or urban
level, rather than on rural level. On urban level, Alam et al. (1998) assess household energy use
for Hyderabad and Gupta and Köhlin (2006) for Kolkata. On an Indian-wide level, Pachauri
(2004a) analyses the variations in total household energy and discusses ways to measure energy
poverty in Indian households (Pachauri et al., 2004), while Reddy and Balachandra (2006)
discuss energy end-use technology shifts in the household sector and Viswanathan and Kumar
(2005) explore the Indian cooking fuel use pattern. On rural level, Sarmah et al. (2002) compare
rural household energy use in non-electrified villages in India and Devi et al. (2007) discuss
community energy use in decentralised areas of rural India. Concerning rural electrification,
Sinha and Kandpal (1991) found already in the ‗90s that decentralised renewable energy can be a
cost-effective measure for rural electrification in India compared to the grid. Chakrabarti and
Chakrabarti (2002) elaborate possibilities for rural electrification of remote island communities
in India. Nouni et al. (2008) explore several options of providing decentralised electricity access
to remote areas in India and Bastakoti (2003) relates rural electrification to ways of creating
energy enterprises. Bhattacharyya (2006a) argues that rural electrification alone might not be a
solution to the energy access problem. Bhattacharyya (2006b) also assumes that the rural poor
are not likely to become a major market for renewable energy. Kadian et al. (2007) assess
energy-related emissions and mitigation options in the household sector for Delhi. Though
energy-related research on India is broad, research on rural electrification and its impacts on
climate change mitigation for rural India, as performed in this study, has not been done before.
6.2. Methodology
6.2.1 Modelling with the Regional Energy Model REM REM originated from the global energy and GHG emission model ESCAPE
12 (CEC,
1992; Hulme et al., 1995; Hulme, 1992a; Hulme, 1992b; Rotmans et al., 1994). The ESCAPE
model, as well as the slightly adapted REM model, is based on the end-use approach.
An end-use function in a certain sector at time t=0 is taken as a starting point e.g. the
function lighting in the residential sector. The useful energy demand (UED) for lighting can be
calculated from the amount of kilowatt-hours (kWh) needed for lighting, the fraction (Fr) and the
used efficiency (Eff) of the appliances (see Equation 1).
sfa
ka
a
a
ns
s
mf
f
sft EffFrEDUEDsf
t)*(*
11 1
0 0 Equation 1
Where:
UED=useful energy demand; ED=energy demand; Fr=fraction; Eff=efficiency. t=time; s=sector; f=function;
a=appliance.
In equation 1, the total UED for the region or country is calculated for sector (s) for s=1
to s=n, for function (f) for f=1 to f=m and for appliance (a) for a=1 to a=k.
12
ESCAPE (the Evaluation of Strategies to address Climate change by Adapting to and Preventing Emissions) is an
integrated climate change assessment model constructed between 1990-1992 by a consortium of research institutes.
It was designed to enable users to generate future scenarios of GHG emissions through an energy-economic model
and to examine their impact on global climate and sea level (CEC, 1992; Hulme et al., 1995; Hulme, 1992a; Hulme,
1992b; Rotmans et al., 1994).
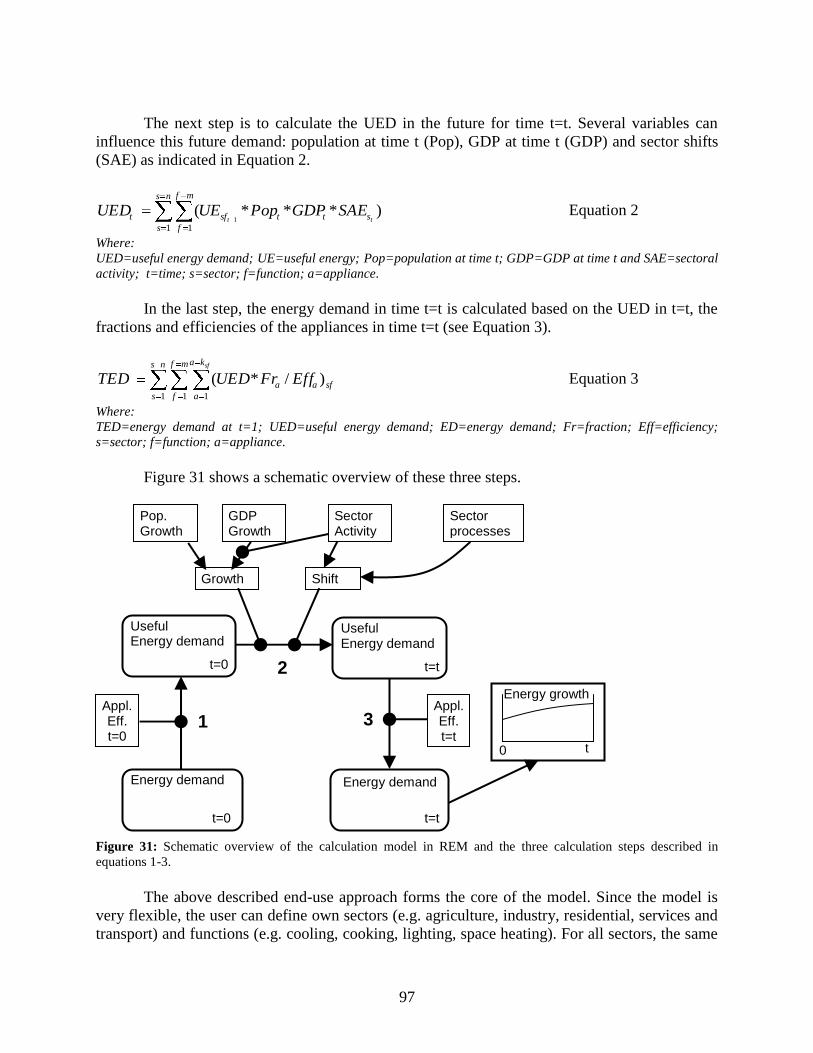
97
The next step is to calculate the UED in the future for time t=t. Several variables can
influence this future demand: population at time t (Pop), GDP at time t (GDP) and sector shifts
(SAE) as indicated in Equation 2.
)***(1 1
1 tt stt
ns
s
mf
f
sft SAEGDPPopUEUED Equation 2
Where:
UED=useful energy demand; UE=useful energy; Pop=population at time t; GDP=GDP at time t and SAE=sectoral
activity; t=time; s=sector; f=function; a=appliance.
In the last step, the energy demand in time t=t is calculated based on the UED in t=t, the
fractions and efficiencies of the appliances in time t=t (see Equation 3).
sfaa
ns
s
mf
f
ka
a
EffFrUEDTEDsf
)/*(1 1 1
Equation 3
Where:
TED=energy demand at t=1; UED=useful energy demand; ED=energy demand; Fr=fraction; Eff=efficiency;
s=sector; f=function; a=appliance.
Figure 31 shows a schematic overview of these three steps.
Figure 31: Schematic overview of the calculation model in REM and the three calculation steps described in
equations 1-3.
The above described end-use approach forms the core of the model. Since the model is
very flexible, the user can define own sectors (e.g. agriculture, industry, residential, services and
transport) and functions (e.g. cooling, cooking, lighting, space heating). For all sectors, the same
Energy demand demand
t=0
Useful Energy demand
t=0
Appl. Eff. t=0
1
Energy demand
t=t
Appl. Eff. t=t
3
Useful Energy demand
t=t 2
Growth Shift
Pop. Growth
GDP Growth
Sector Activity
Sector processes
0 t
Energy growth
98
functions are defined, but can be used optionally. All appliances present in a certain sector
should be placed in one of these defined functions for energy demand. Several appliances per
function for a certain sector are allowed. For example, the function lighting in the residential
sector of rural India has five types of lamps: kerosene lamps, photovoltaic (PV) lamps,
conventional light bulbs, energy-saving light bulbs and Light Emitting Diode (LED) light bulbs.
The efficiency of each appliance can increase over time and a sector can shift within a function
from one appliance to another, e.g. from mainly kerosene lamps to conventional light bulbs.
Besides this sector–function matrix, REM contains a module for the supply side: the
energy conversion sector accounting for electricity production, refineries and Combined Heat
and Power (CHP). For the supply side, several types of technologies can be defined. The
fractions determine how much electricity, heat or oil is generated with a certain technology e.g.
wind, coal-fired power plant, district heating etc.
6.2.2 Modelling rural India Most energy models assess energy resources, technologies, and emissions. Only few
energy models analyse the needs and services related to energy, like the latent energy demand in
rural areas in developing countries. This part of the system is hardly modelled, because of its
complexity and uncertainty about the underlying processes and assumptions. This chapter
however addresses the energy needs and services for rural India.
With 1.1 billion inhabitants in 2006, India is the second most populous country in the
world (World Bank, 2008) and is expect to be the world‘s most populous country in 2050 (UN
PRB, 2006). In terms of energy, India is the world‘s fourth highest consumer of energy just after
the USA, China and the Russian Federation (IEA, 2008). India is also one of the world‘s top five
GHG emitters measured in absolute terms. In per capita terms however, an average Indian citizen
uses about 15 times less energy than an average US American citizen, emits about 17 times less
GHG emissions and uses about 30 times less electricity (World Bank, 2008).
In economic terms, India has a steeply increasing GDP growth and an expanding
economy. At the same time, India hosts a large population living below poverty line, namely
35% of its total population in 2003 (World Bank, 2008). High differences between urban and
rural areas prevail. While the Indian economy generates most of its income from services and
industries, more than 70% of the total population live in rural areas (UN PRB, 2006) and depend
primarily on non-mechanised agriculture for sustaining their living. Energy poverty is clearly an
issue: electrification rates were as low as 50% in rural areas and 62% in total India in 2005 (IEA,
2007). Electricity consumption in the rural areas is estimated as ranging between 0.3 kWh
(Dijkstra, 2007) to 1 kWh per household per day (Puri, 2006; Bhattacharyya; 2006a). The
predominant fuels used in rural India are solid traditional biofuels such as fuel wood, dung and
agricultural residues which are assumed to have high impacts on human health (WHO, 2006;
2005; 2000).
In average 80-90% of all energy used in rural households is needed for cooking and
heating water (Devi et al., 2007). The remaining energy is used for lighting, heating in winter
and for basic appliances such as radios and fans (Chakrabarti and Chakrabarti, 2002). In 2005,
the total primary energy use in non-electrified rural Indian households consisted in average of
73% traditional biofuels, 19% oil products, 7% solar energy and 1% coal, mainly charcoal. For
cooking and heating water, in average 75-95% of the energy is fuel wood and dung (Reddy and
Balachandra, 2006; Devi et al., 2007). Most of the cooking is done on so-called chulhas, simple
stoves with very low efficiencies (Reddy and Balachandra, 2006). Other fuels used for cooking
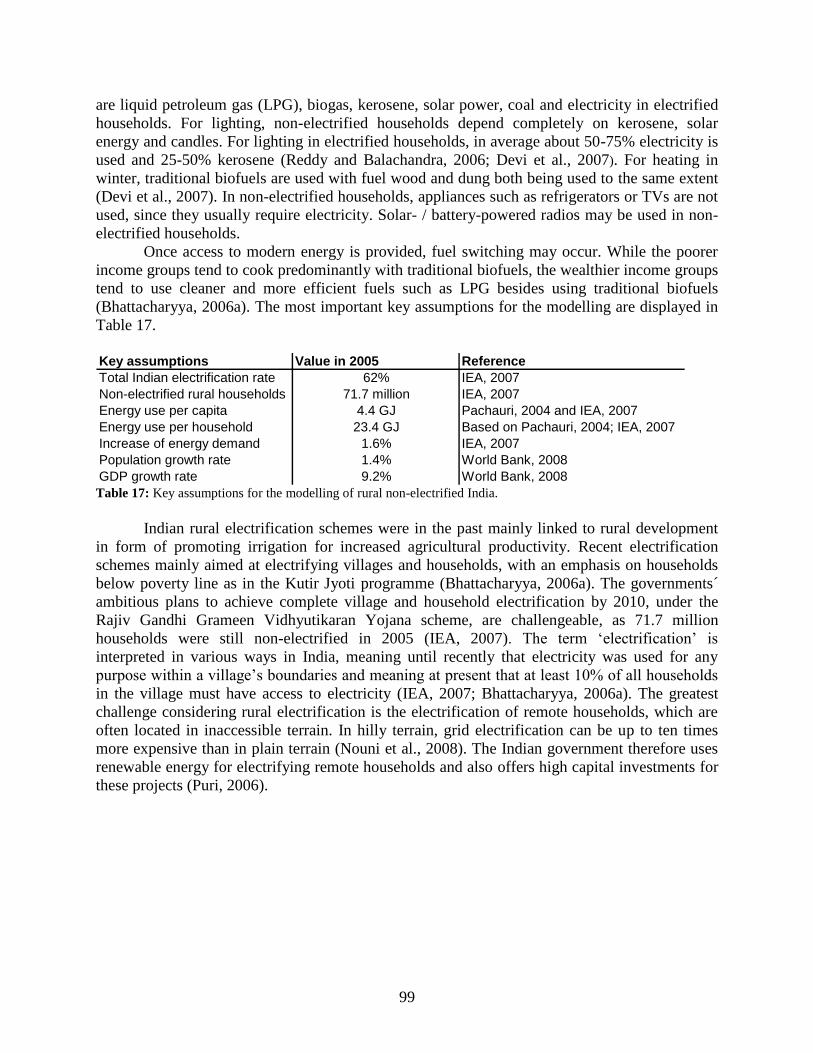
99
are liquid petroleum gas (LPG), biogas, kerosene, solar power, coal and electricity in electrified
households. For lighting, non-electrified households depend completely on kerosene, solar
energy and candles. For lighting in electrified households, in average about 50-75% electricity is
used and 25-50% kerosene (Reddy and Balachandra, 2006; Devi et al., 2007). For heating in
winter, traditional biofuels are used with fuel wood and dung both being used to the same extent
(Devi et al., 2007). In non-electrified households, appliances such as refrigerators or TVs are not
used, since they usually require electricity. Solar- / battery-powered radios may be used in non-
electrified households.
Once access to modern energy is provided, fuel switching may occur. While the poorer
income groups tend to cook predominantly with traditional biofuels, the wealthier income groups
tend to use cleaner and more efficient fuels such as LPG besides using traditional biofuels
(Bhattacharyya, 2006a). The most important key assumptions for the modelling are displayed in
Table 17.
Key assumptions Value in 2005 Reference
Total Indian electrification rate 62% IEA, 2007
Non-electrified rural households 71.7 million IEA, 2007
Energy use per capita 4.4 GJ Pachauri, 2004 and IEA, 2007
Energy use per household 23.4 GJ Based on Pachauri, 2004; IEA, 2007
Increase of energy demand 1.6% IEA, 2007
Population growth rate 1.4% World Bank, 2008
GDP growth rate 9.2% World Bank, 2008 Table 17: Key assumptions for the modelling of rural non-electrified India.
Indian rural electrification schemes were in the past mainly linked to rural development
in form of promoting irrigation for increased agricultural productivity. Recent electrification
schemes mainly aimed at electrifying villages and households, with an emphasis on households
below poverty line as in the Kutir Jyoti programme (Bhattacharyya, 2006a). The governments´
ambitious plans to achieve complete village and household electrification by 2010, under the
Rajiv Gandhi Grameen Vidhyutikaran Yojana scheme, are challengeable, as 71.7 million
households were still non-electrified in 2005 (IEA, 2007). The term ‗electrification‘ is
interpreted in various ways in India, meaning until recently that electricity was used for any
purpose within a village‘s boundaries and meaning at present that at least 10% of all households
in the village must have access to electricity (IEA, 2007; Bhattacharyya, 2006a). The greatest
challenge considering rural electrification is the electrification of remote households, which are
often located in inaccessible terrain. In hilly terrain, grid electrification can be up to ten times
more expensive than in plain terrain (Nouni et al., 2008). The Indian government therefore uses
renewable energy for electrifying remote households and also offers high capital investments for
these projects (Puri, 2006).
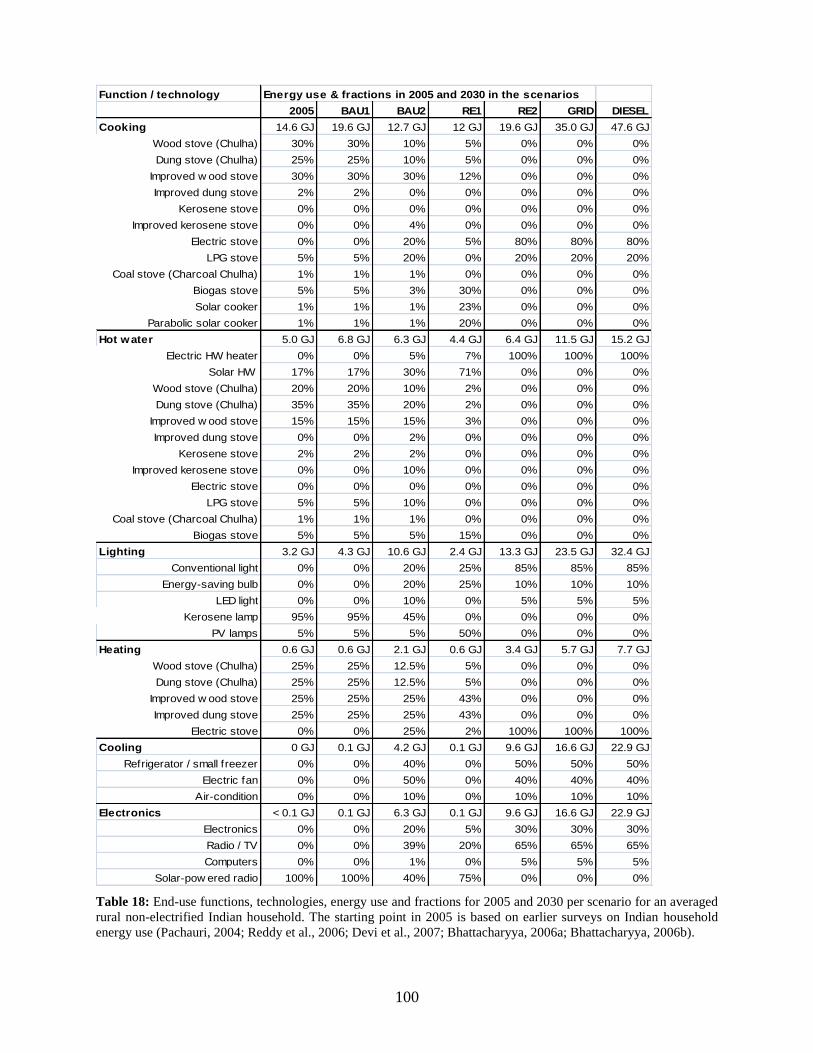
100
Table 18: End-use functions, technologies, energy use and fractions for 2005 and 2030 per scenario for an averaged
rural non-electrified Indian household. The starting point in 2005 is based on earlier surveys on Indian household
energy use (Pachauri, 2004; Reddy et al., 2006; Devi et al., 2007; Bhattacharyya, 2006a; Bhattacharyya, 2006b).
Function / technology Energy use & fractions in 2005 and 2030 in the scenarios
2005 BAU1 BAU2 RE1 RE2 GRID DIESEL
Cooking 14.6 GJ 19.6 GJ 12.7 GJ 12 GJ 19.6 GJ 35.0 GJ 47.6 GJ
Wood stove (Chulha) 30% 30% 10% 5% 0% 0% 0%
Dung stove (Chulha) 25% 25% 10% 5% 0% 0% 0%
Improved w ood stove 30% 30% 30% 12% 0% 0% 0%
Improved dung stove 2% 2% 0% 0% 0% 0% 0%
Kerosene stove 0% 0% 0% 0% 0% 0% 0%
Improved kerosene stove 0% 0% 4% 0% 0% 0% 0%
Electric stove 0% 0% 20% 5% 80% 80% 80%
LPG stove 5% 5% 20% 0% 20% 20% 20%
Coal stove (Charcoal Chulha) 1% 1% 1% 0% 0% 0% 0%
Biogas stove 5% 5% 3% 30% 0% 0% 0%
Solar cooker 1% 1% 1% 23% 0% 0% 0%
Parabolic solar cooker 1% 1% 1% 20% 0% 0% 0%
Hot water 5.0 GJ 6.8 GJ 6.3 GJ 4.4 GJ 6.4 GJ 11.5 GJ 15.2 GJ
Electric HW heater 0% 0% 5% 7% 100% 100% 100%
Solar HW 17% 17% 30% 71% 0% 0% 0%
Wood stove (Chulha) 20% 20% 10% 2% 0% 0% 0%
Dung stove (Chulha) 35% 35% 20% 2% 0% 0% 0%
Improved w ood stove 15% 15% 15% 3% 0% 0% 0%
Improved dung stove 0% 0% 2% 0% 0% 0% 0%
Kerosene stove 2% 2% 2% 0% 0% 0% 0%
Improved kerosene stove 0% 0% 10% 0% 0% 0% 0%
Electric stove 0% 0% 0% 0% 0% 0% 0%
LPG stove 5% 5% 10% 0% 0% 0% 0%
Coal stove (Charcoal Chulha) 1% 1% 1% 0% 0% 0% 0%
Biogas stove 5% 5% 5% 15% 0% 0% 0%
Lighting 3.2 GJ 4.3 GJ 10.6 GJ 2.4 GJ 13.3 GJ 23.5 GJ 32.4 GJ
Conventional light 0% 0% 20% 25% 85% 85% 85%
Energy-saving bulb 0% 0% 20% 25% 10% 10% 10%
LED light 0% 0% 10% 0% 5% 5% 5%
Kerosene lamp 95% 95% 45% 0% 0% 0% 0%
PV lamps 5% 5% 5% 50% 0% 0% 0%
Heating 0.6 GJ 0.6 GJ 2.1 GJ 0.6 GJ 3.4 GJ 5.7 GJ 7.7 GJ
Wood stove (Chulha) 25% 25% 12.5% 5% 0% 0% 0%
Dung stove (Chulha) 25% 25% 12.5% 5% 0% 0% 0%
Improved w ood stove 25% 25% 25% 43% 0% 0% 0%
Improved dung stove 25% 25% 25% 43% 0% 0% 0%
Electric stove 0% 0% 25% 2% 100% 100% 100%
Cooling 0 GJ 0.1 GJ 4.2 GJ 0.1 GJ 9.6 GJ 16.6 GJ 22.9 GJ
Refrigerator / small freezer 0% 0% 40% 0% 50% 50% 50%
Electric fan 0% 0% 50% 0% 40% 40% 40%
Air-condition 0% 0% 10% 0% 10% 10% 10%
Electronics < 0.1 GJ 0.1 GJ 6.3 GJ 0.1 GJ 9.6 GJ 16.6 GJ 22.9 GJ
Electronics 0% 0% 20% 5% 30% 30% 30%
Radio / TV 0% 0% 39% 20% 65% 65% 65%
Computers 0% 0% 1% 0% 5% 5% 5%
Solar-pow ered radio 100% 100% 40% 75% 0% 0% 0%

101
6.2.3 Scenario-making Direct household energy requirements in rural areas were in average 3.7 GJ per capita in
1993/94 according to survey data (Pachauri, 2004) and estimates by the IEA indicate that
household energy use was increasing every year by 1.6% between 1990 and 2005 (IEA, 2007),
thus leading to 4.4 GJ per capita in 2005. Consequently, household energy use per household in
rural non-electrified India is estimated at 23.4 GJ in average for 2005. It is assumed that the
energy use keeps increasing at 1.6% per year as indicated by the IEA (2007) for the start year
2005 and the consequent years and increases at a slightly higher rate afterwards. This
development takes into account population growth and increases in incomes and affluence levels.
Six end-use functions are employed in Indian households: cooking, heating, lighting, hot water,
cooling and electronics. Table 18 indicates the technologies employed per end-use function and
shows whether these technologies were used in rural non-electrified households in India in 2005.
It is assumed that full access to technologies can be achieved until 2030 depending on each
specific scenario.
Six main scenarios were developed: two business-as-usual scenarios (BAU1 and BAU2)
and four electrification scenarios based on electricity from renewable energy (RE1 and RE2),
diesel (DIESEL) and the grid (GRID) as shown in Table 19. Six cost scenarios were developed
in addition.
Scenario Type of scenario Characteristic
BAU1 Business-as-usual pessimistic No electrification takes place
BAU2 Business-as-usual optimistic Modest electrification takes place with grid extensions
RE1 Renewable energy scenario Electrification with RE, RE-based end-use appliances
RE2 Renewable energy scenario Electrification with RE, electric end-use appliances
DIESEL Diesel scenario Electrification with decentral diesel systems
GRID Grid extension scenario Electrification with central grid extensions
BAU_200% Oil price scenario BAU Oil price doubles between 2005 and 2030
DIESEL_200% Oil price scenario DIESEL Oil price doubles between 2005 and 2030
GRID_200% Oil price scenario GRID Oil price doubles between 2005 and 2030
GRID_10km Grid distance scenario Distance from households to grid is 10 km
GRID_15km Grid distance scenario Distance from households to grid is 15 km
GRID_25km Grid distance scenario Distance from households to grid is 25 km Table 19: Scheme of the scenarios.
The BAU1 scenario is the baseline scenario in which no electrification takes place.
Traditional biofuels are predominantly used and small shares of kerosene, renewable energy and
coal. While the amount of energy used increases between 2005 and 2030 due to population
growth and economic growth, the share used per energy source stays stable. This is mainly due
to the unavailability of energy markets and infrastructure, like natural gas pipelines in urban
areas, and due to a lack of access to energy services and facilities, like access to natural gas
stoves. In BAU1, technology and fuel use do not change over the coming decades due to the
absence of electricity.
The BAU2 scenario is the optimistic baseline scenario in which a grid electrification of
50% takes place until 2030. The share of traditional biofuels declines, while the share of fossil
fuels rises due to fossil-intense electricity consumed from the grid. The BAU2 scenario is a
varied scenario compared to the extreme scenarios BAU1, RE2, DIESEL and GRID. Traditional
biofuels, oil, coal and gas products, renewable energy and nuclear energy are consumed.
102
Consumption levels remain below consumption levels in the universal electrification scenarios
RE, GRID and DIESEL.
In DIESEL, universal electrification takes place through decentral diesel systems which
can form mini-grids. This is an extreme scenario, because traditional biofuels, kerosene,
renewable energy and coal are phased out until 2030 and are completely replaced by diesel. LPG
is however partly used for cooking throughout 2030, as LPG is often used even among the top
rural income groups (Reddy, 2003 Pachauri, 2007; ESMAP, 2003). Diesel systems are used for
supplying electricity to satisfy the demand.
In GRID, universal electrification takes place through the central electricity grid. This is
also an extreme scenario, because traditional biofuels, kerosene, renewable energy and coal are
phased out until 2030 and are completely replaced by electricity from the grid which mainly
comes from coal. LPG is however partly used for cooking throughout 2030. Grid extensions are
used for supplying electricity to satisfy the demand.
In RE1, universal electrification takes place through decentral renewable energy. Oil-
based products like kerosene are completely phased out until 2030 and replaced by sustainable
energy, coal is completely phased out and the share of traditional fuels declines rapidly after
2030. Rural electrification is achieved (1) by establishing decentral mini-grids based on
renewable energy systems like solar energy technology, small-hydro power stations (SHP), wind
turbines and biomass gasifiers and (2) by using off-grid self-sufficient devices like solar cookers
and solar water heaters. The RE1 scenario depends less on mini-grids (20%) and more on self-
sufficient devices (80%). Renewable energy-based off-grid devices are predominantly used,
while electric devices are only minimally used. In the RE1 scenario, all end-use functions are
used, but cooling and electronics are only marginally used, since both cooling and electronics
usually require too much electricity to be run by renewable end-use devices and since not much
electricity is used.
Also in RE2, electrification takes place through decentral renewable energy. This is an
extreme scenario, as traditional biofuels, kerosene and coal are phased out until 2030 and
completely replaced by renewable energy. Most oil-based products like kerosene are almost
completely phased out until 2030 with the exception of LPG which is used for cooking
throughout 2030. Rural electrification is achieved by establishing decentral mini-grids based on
renewable energy systems like solar energy technology, small-hydro power stations (SHP), wind
turbines and biomass gasifiers (100%). No renewable energy-based off-grid devices are used in
the RE2 scenario, instead the same electric appliances and end-use functions as in the GRID and
DIESEL scenarios are used. More electricity is therefore used in RE2 than in the RE1 scenario.
In RE, DIESEL and GRID, fuel switching and technology switching occur due to access
to electricity. It has however been observed that complete fuel switching is rare both in poorer
and wealthier households. Instead modern fuels and traditional fuels tend to be used parallel to
each other (Bhattacharyya, 2006a; Chapter 2). Since electric devices are associated with high
investment costs, fuel and technology switching is not expected to happen within a few years,
but is likely to occur over a few decades as modelled here. Investment costs and installation time
are also high, usually making electrification a lengthy process.
In addition to the main scenarios, six cost scenarios were developed: three oil price
scenarios based on doubling oil prices between 2005 and 2030 and three grid distance scenarios
based on different distances to the grid. The increasing oil price affects the costs of kerosene,
diesel, LPG and other oil products. It also affects the costs of running combined cycle plants and
oil turbines. The transmission costs of centralised grid-power and decentralised PV-power is
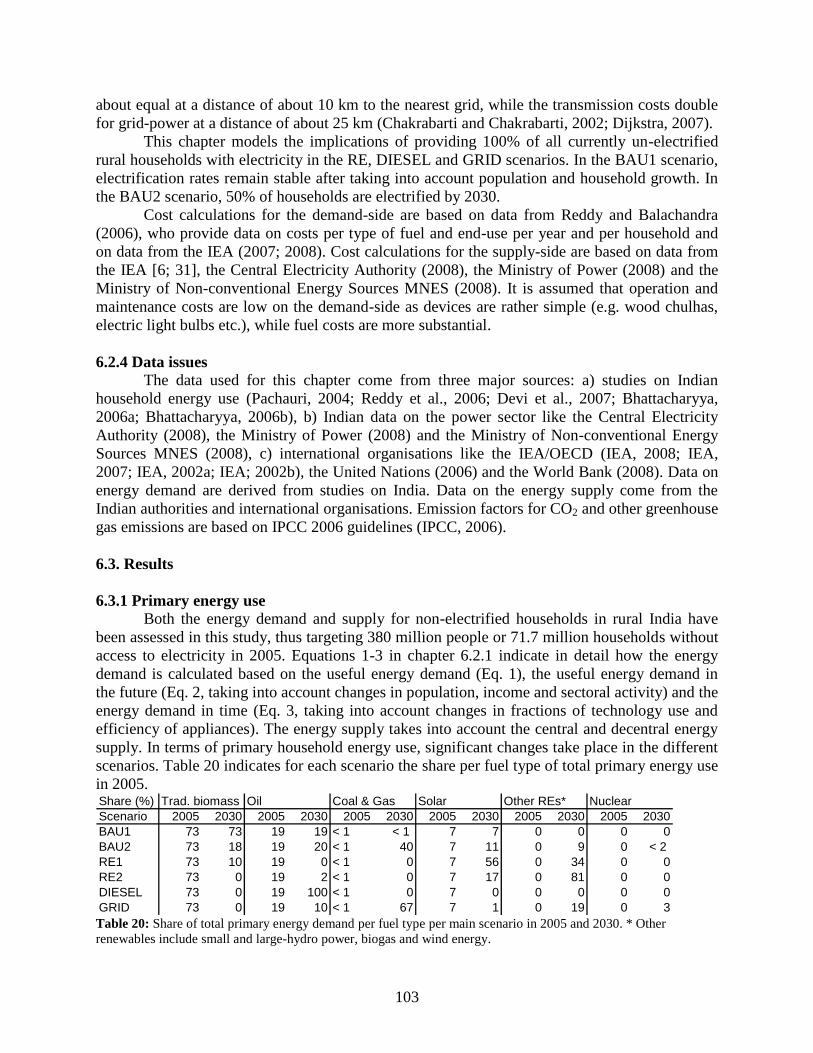
103
about equal at a distance of about 10 km to the nearest grid, while the transmission costs double
for grid-power at a distance of about 25 km (Chakrabarti and Chakrabarti, 2002; Dijkstra, 2007).
This chapter models the implications of providing 100% of all currently un-electrified
rural households with electricity in the RE, DIESEL and GRID scenarios. In the BAU1 scenario,
electrification rates remain stable after taking into account population and household growth. In
the BAU2 scenario, 50% of households are electrified by 2030.
Cost calculations for the demand-side are based on data from Reddy and Balachandra
(2006), who provide data on costs per type of fuel and end-use per year and per household and
on data from the IEA (2007; 2008). Cost calculations for the supply-side are based on data from
the IEA [6; 31], the Central Electricity Authority (2008), the Ministry of Power (2008) and the
Ministry of Non-conventional Energy Sources MNES (2008). It is assumed that operation and
maintenance costs are low on the demand-side as devices are rather simple (e.g. wood chulhas,
electric light bulbs etc.), while fuel costs are more substantial.
6.2.4 Data issues The data used for this chapter come from three major sources: a) studies on Indian
household energy use (Pachauri, 2004; Reddy et al., 2006; Devi et al., 2007; Bhattacharyya,
2006a; Bhattacharyya, 2006b), b) Indian data on the power sector like the Central Electricity
Authority (2008), the Ministry of Power (2008) and the Ministry of Non-conventional Energy
Sources MNES (2008), c) international organisations like the IEA/OECD (IEA, 2008; IEA,
2007; IEA, 2002a; IEA; 2002b), the United Nations (2006) and the World Bank (2008). Data on
energy demand are derived from studies on India. Data on the energy supply come from the
Indian authorities and international organisations. Emission factors for CO2 and other greenhouse
gas emissions are based on IPCC 2006 guidelines (IPCC, 2006).
6.3. Results
6.3.1 Primary energy use
Both the energy demand and supply for non-electrified households in rural India have
been assessed in this study, thus targeting 380 million people or 71.7 million households without
access to electricity in 2005. Equations 1-3 in chapter 6.2.1 indicate in detail how the energy
demand is calculated based on the useful energy demand (Eq. 1), the useful energy demand in
the future (Eq. 2, taking into account changes in population, income and sectoral activity) and the
energy demand in time (Eq. 3, taking into account changes in fractions of technology use and
efficiency of appliances). The energy supply takes into account the central and decentral energy
supply. In terms of primary household energy use, significant changes take place in the different
scenarios. Table 20 indicates for each scenario the share per fuel type of total primary energy use
in 2005. Share (%) Trad. biomass Oil Coal & Gas Solar Other REs* Nuclear
Scenario 2005 2030 2005 2030 2005 2030 2005 2030 2005 2030 2005 2030
BAU1 73 73 19 19 < 1 < 1 7 7 0 0 0 0
BAU2 73 18 19 20 < 1 40 7 11 0 9 0 < 2
RE1 73 10 19 0 < 1 0 7 56 0 34 0 0
RE2 73 0 19 2 < 1 0 7 17 0 81 0 0
DIESEL 73 0 19 100 < 1 0 7 0 0 0 0 0
GRID 73 0 19 10 < 1 67 7 1 0 19 0 3 Table 20: Share of total primary energy demand per fuel type per main scenario in 2005 and 2030. * Other
renewables include small and large-hydro power, biogas and wind energy.
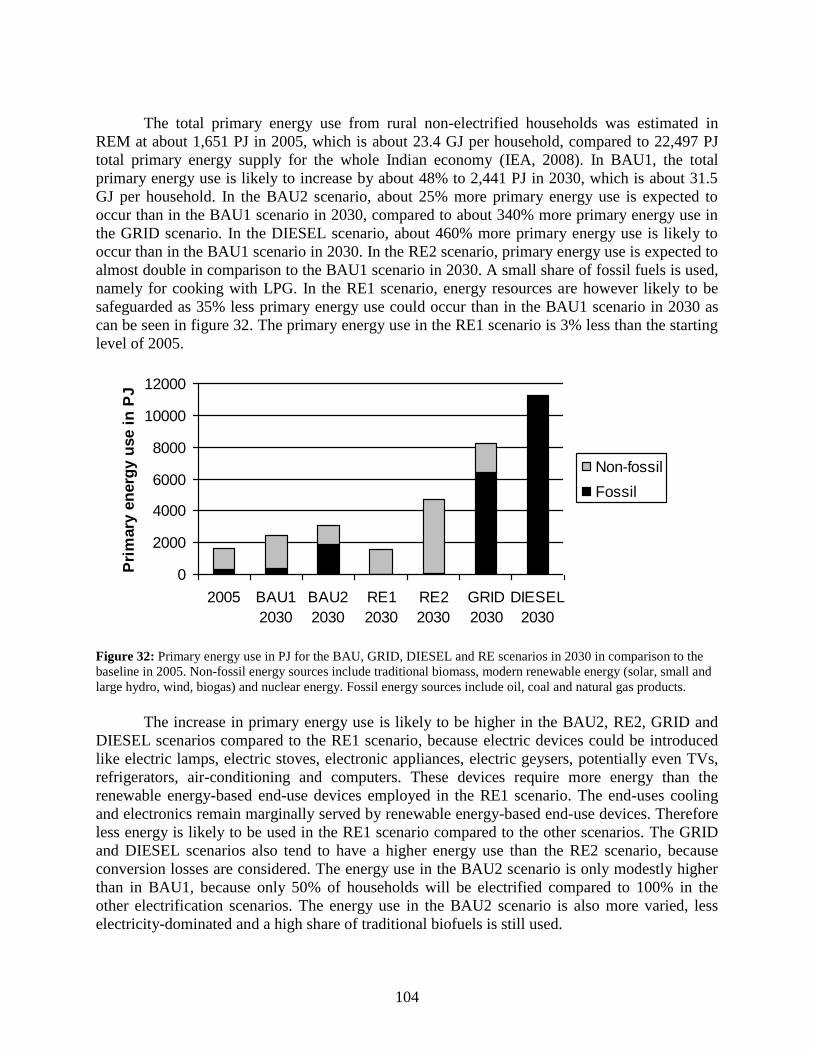
104
The total primary energy use from rural non-electrified households was estimated in
REM at about 1,651 PJ in 2005, which is about 23.4 GJ per household, compared to 22,497 PJ
total primary energy supply for the whole Indian economy (IEA, 2008). In BAU1, the total
primary energy use is likely to increase by about 48% to 2,441 PJ in 2030, which is about 31.5
GJ per household. In the BAU2 scenario, about 25% more primary energy use is expected to
occur than in the BAU1 scenario in 2030, compared to about 340% more primary energy use in
the GRID scenario. In the DIESEL scenario, about 460% more primary energy use is likely to
occur than in the BAU1 scenario in 2030. In the RE2 scenario, primary energy use is expected to
almost double in comparison to the BAU1 scenario in 2030. A small share of fossil fuels is used,
namely for cooking with LPG. In the RE1 scenario, energy resources are however likely to be
safeguarded as 35% less primary energy use could occur than in the BAU1 scenario in 2030 as
can be seen in figure 32. The primary energy use in the RE1 scenario is 3% less than the starting
level of 2005.
0
2000
4000
6000
8000
10000
12000
2005 BAU1
2030
BAU2
2030
RE1
2030
RE2
2030
GRID
2030
DIESEL
2030
Pri
mary
en
erg
y u
se i
n P
J
Non-fossil
Fossil
Figure 32: Primary energy use in PJ for the BAU, GRID, DIESEL and RE scenarios in 2030 in comparison to the
baseline in 2005. Non-fossil energy sources include traditional biomass, modern renewable energy (solar, small and
large hydro, wind, biogas) and nuclear energy. Fossil energy sources include oil, coal and natural gas products.
The increase in primary energy use is likely to be higher in the BAU2, RE2, GRID and
DIESEL scenarios compared to the RE1 scenario, because electric devices could be introduced
like electric lamps, electric stoves, electronic appliances, electric geysers, potentially even TVs,
refrigerators, air-conditioning and computers. These devices require more energy than the
renewable energy-based end-use devices employed in the RE1 scenario. The end-uses cooling
and electronics remain marginally served by renewable energy-based end-use devices. Therefore
less energy is likely to be used in the RE1 scenario compared to the other scenarios. The GRID
and DIESEL scenarios also tend to have a higher energy use than the RE2 scenario, because
conversion losses are considered. The energy use in the BAU2 scenario is only modestly higher
than in BAU1, because only 50% of households will be electrified compared to 100% in the
other electrification scenarios. The energy use in the BAU2 scenario is also more varied, less
electricity-dominated and a high share of traditional biofuels is still used.
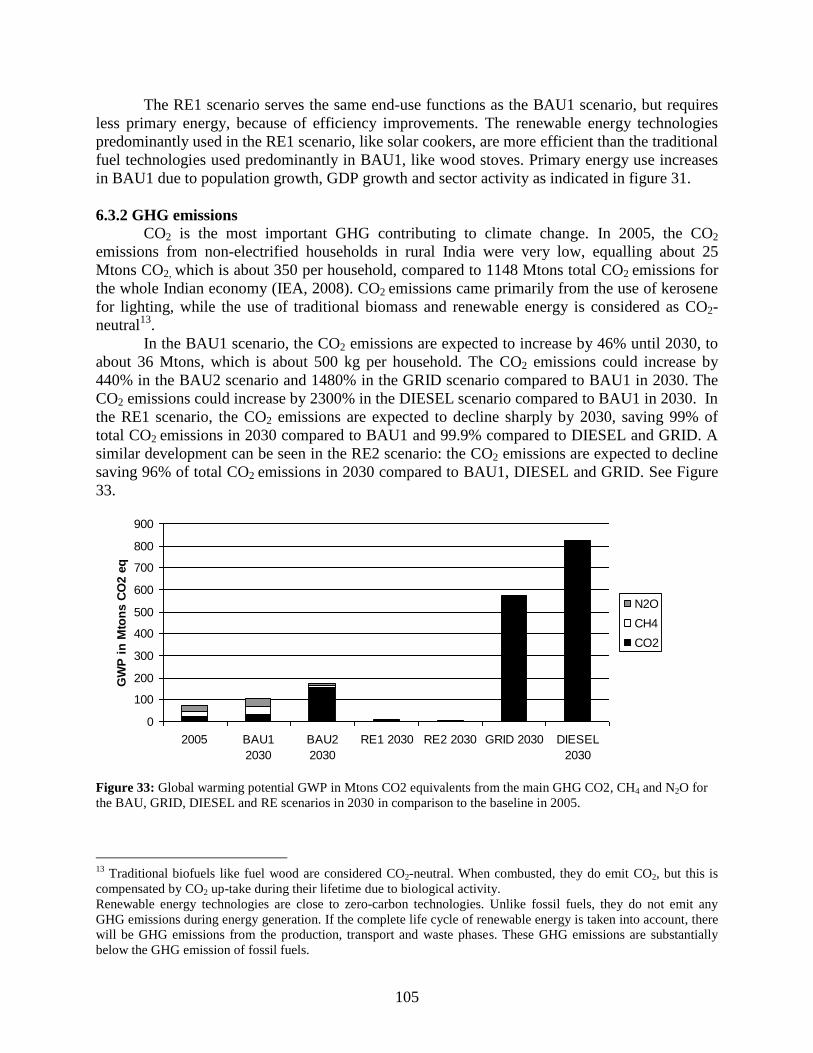
105
The RE1 scenario serves the same end-use functions as the BAU1 scenario, but requires
less primary energy, because of efficiency improvements. The renewable energy technologies
predominantly used in the RE1 scenario, like solar cookers, are more efficient than the traditional
fuel technologies used predominantly in BAU1, like wood stoves. Primary energy use increases
in BAU1 due to population growth, GDP growth and sector activity as indicated in figure 31.
6.3.2 GHG emissions
CO2 is the most important GHG contributing to climate change. In 2005, the CO2
emissions from non-electrified households in rural India were very low, equalling about 25
Mtons CO2, which is about 350 per household, compared to 1148 Mtons total CO2 emissions for
the whole Indian economy (IEA, 2008). CO2 emissions came primarily from the use of kerosene
for lighting, while the use of traditional biomass and renewable energy is considered as CO2-
neutral13
.
In the BAU1 scenario, the CO2 emissions are expected to increase by 46% until 2030, to
about 36 Mtons, which is about 500 kg per household. The CO2 emissions could increase by
440% in the BAU2 scenario and 1480% in the GRID scenario compared to BAU1 in 2030. The
CO2 emissions could increase by 2300% in the DIESEL scenario compared to BAU1 in 2030. In
the RE1 scenario, the CO2 emissions are expected to decline sharply by 2030, saving 99% of
total CO2 emissions in 2030 compared to BAU1 and 99.9% compared to DIESEL and GRID. A
similar development can be seen in the RE2 scenario: the CO2 emissions are expected to decline
saving 96% of total CO2 emissions in 2030 compared to BAU1, DIESEL and GRID. See Figure
33.
0
100
200
300
400
500
600
700
800
900
2005 BAU1
2030
BAU2
2030
RE1 2030 RE2 2030 GRID 2030 DIESEL
2030
GW
P i
n M
ton
s C
O2 e
q
N2O
CH4
CO2
Figure 33: Global warming potential GWP in Mtons CO2 equivalents from the main GHG CO2, CH4 and N2O for
the BAU, GRID, DIESEL and RE scenarios in 2030 in comparison to the baseline in 2005.
13
Traditional biofuels like fuel wood are considered CO2-neutral. When combusted, they do emit CO2, but this is
compensated by CO2 up-take during their lifetime due to biological activity.
Renewable energy technologies are close to zero-carbon technologies. Unlike fossil fuels, they do not emit any
GHG emissions during energy generation. If the complete life cycle of renewable energy is taken into account, there
will be GHG emissions from the production, transport and waste phases. These GHG emissions are substantially
below the GHG emission of fossil fuels.
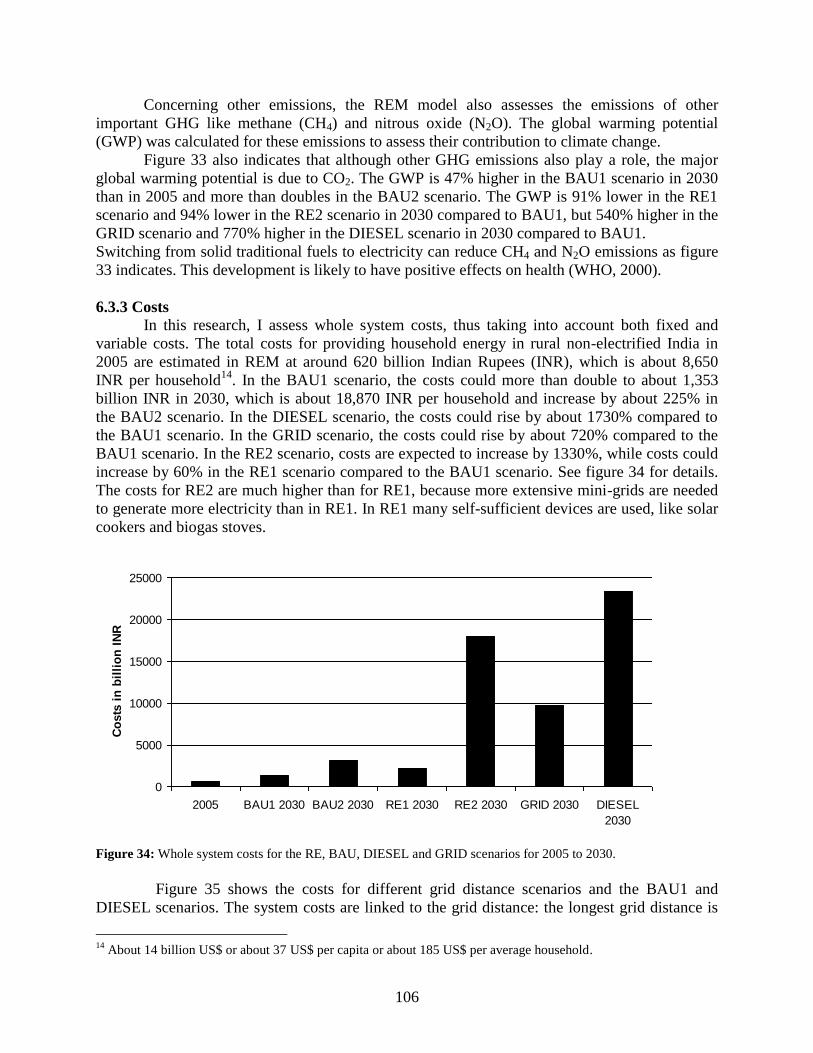
106
Concerning other emissions, the REM model also assesses the emissions of other
important GHG like methane (CH4) and nitrous oxide (N2O). The global warming potential
(GWP) was calculated for these emissions to assess their contribution to climate change.
Figure 33 also indicates that although other GHG emissions also play a role, the major
global warming potential is due to CO2. The GWP is 47% higher in the BAU1 scenario in 2030
than in 2005 and more than doubles in the BAU2 scenario. The GWP is 91% lower in the RE1
scenario and 94% lower in the RE2 scenario in 2030 compared to BAU1, but 540% higher in the
GRID scenario and 770% higher in the DIESEL scenario in 2030 compared to BAU1.
Switching from solid traditional fuels to electricity can reduce CH4 and N2O emissions as figure
33 indicates. This development is likely to have positive effects on health (WHO, 2000).
6.3.3 Costs
In this research, I assess whole system costs, thus taking into account both fixed and
variable costs. The total costs for providing household energy in rural non-electrified India in
2005 are estimated in REM at around 620 billion Indian Rupees (INR), which is about 8,650
INR per household14
. In the BAU1 scenario, the costs could more than double to about 1,353
billion INR in 2030, which is about 18,870 INR per household and increase by about 225% in
the BAU2 scenario. In the DIESEL scenario, the costs could rise by about 1730% compared to
the BAU1 scenario. In the GRID scenario, the costs could rise by about 720% compared to the
BAU1 scenario. In the RE2 scenario, costs are expected to increase by 1330%, while costs could
increase by 60% in the RE1 scenario compared to the BAU1 scenario. See figure 34 for details.
The costs for RE2 are much higher than for RE1, because more extensive mini-grids are needed
to generate more electricity than in RE1. In RE1 many self-sufficient devices are used, like solar
cookers and biogas stoves.
0
5000
10000
15000
20000
25000
2005 BAU1 2030 BAU2 2030 RE1 2030 RE2 2030 GRID 2030 DIESEL
2030
Co
sts
in
bil
lio
n I
NR
Figure 34: Whole system costs for the RE, BAU, DIESEL and GRID scenarios for 2005 to 2030.
Figure 35 shows the costs for different grid distance scenarios and the BAU1 and
DIESEL scenarios. The system costs are linked to the grid distance: the longest grid distance is
14
About 14 billion US$ or about 37 US$ per capita or about 185 US$ per average household.
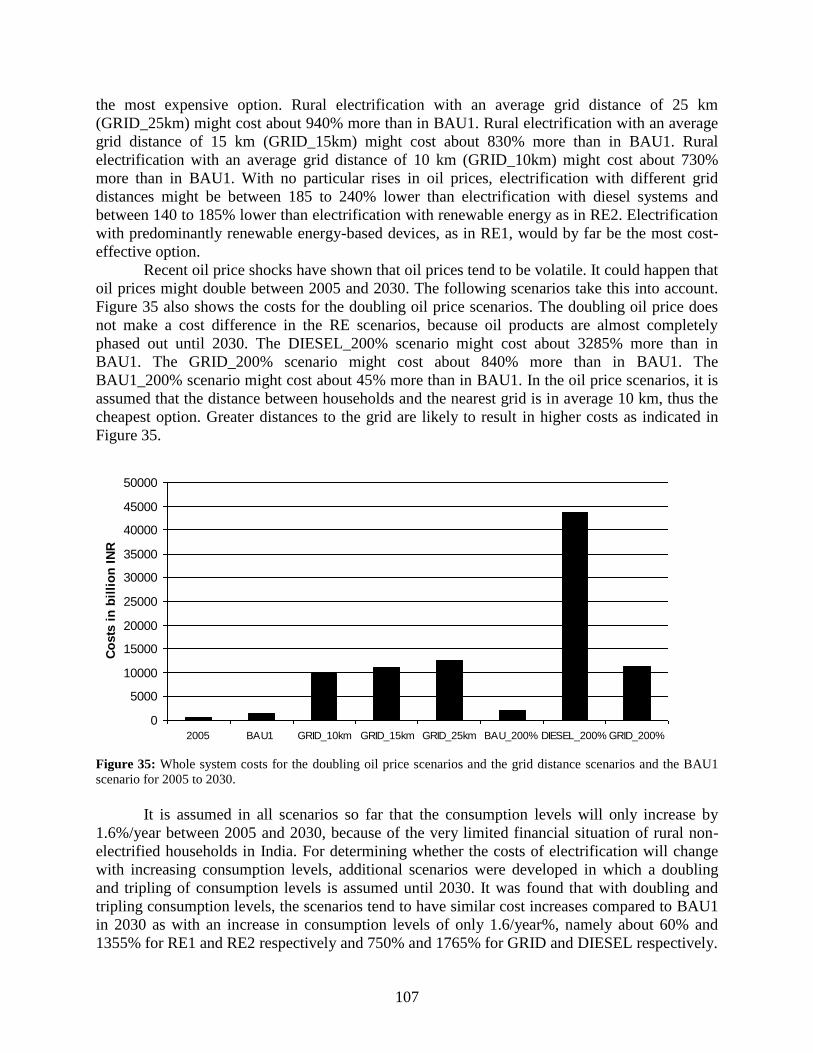
107
0
5000
10000
15000
20000
25000
30000
35000
40000
45000
50000
2005 BAU1 GRID_10km GRID_15km GRID_25km BAU_200% DIESEL_200% GRID_200%
Co
sts
in
bil
lio
n I
NR
the most expensive option. Rural electrification with an average grid distance of 25 km
(GRID_25km) might cost about 940% more than in BAU1. Rural electrification with an average
grid distance of 15 km (GRID_15km) might cost about 830% more than in BAU1. Rural
electrification with an average grid distance of 10 km (GRID_10km) might cost about 730%
more than in BAU1. With no particular rises in oil prices, electrification with different grid
distances might be between 185 to 240% lower than electrification with diesel systems and
between 140 to 185% lower than electrification with renewable energy as in RE2. Electrification
with predominantly renewable energy-based devices, as in RE1, would by far be the most cost-
effective option.
Recent oil price shocks have shown that oil prices tend to be volatile. It could happen that
oil prices might double between 2005 and 2030. The following scenarios take this into account.
Figure 35 also shows the costs for the doubling oil price scenarios. The doubling oil price does
not make a cost difference in the RE scenarios, because oil products are almost completely
phased out until 2030. The DIESEL_200% scenario might cost about 3285% more than in
BAU1. The GRID_200% scenario might cost about 840% more than in BAU1. The
BAU1_200% scenario might cost about 45% more than in BAU1. In the oil price scenarios, it is
assumed that the distance between households and the nearest grid is in average 10 km, thus the
cheapest option. Greater distances to the grid are likely to result in higher costs as indicated in
Figure 35.
Figure 35: Whole system costs for the doubling oil price scenarios and the grid distance scenarios and the BAU1
scenario for 2005 to 2030.
It is assumed in all scenarios so far that the consumption levels will only increase by
1.6%/year between 2005 and 2030, because of the very limited financial situation of rural non-
electrified households in India. For determining whether the costs of electrification will change
with increasing consumption levels, additional scenarios were developed in which a doubling
and tripling of consumption levels is assumed until 2030. It was found that with doubling and
tripling consumption levels, the scenarios tend to have similar cost increases compared to BAU1
in 2030 as with an increase in consumption levels of only 1.6/year%, namely about 60% and
1355% for RE1 and RE2 respectively and 750% and 1765% for GRID and DIESEL respectively.
108
6.4. Discussion
6.4.1 Discussion of method and data The results are dependent on three methodological inputs: the model, the scenarios and
the data. The simulation model REM was used. REM is a reliable tool which has been calibrated
and validated. Other models should produce very similar output using the same data. Since REM
is a bottom-up tool, its technological detail is high, while economic processes are modelled in a
rather aggregated manner.
Electrification scenarios were developed based on grid extensions, diesel systems and
renewable energy systems. These scenarios determine the results. Other scenario assumptions
will produce different results, such as mixed fuel scenarios or scenarios on hydrogen.
Concerning data, there are differences on electrification between Indian and international
sources. In the Indian sources, electrification rates are assumed to be higher than in the
international sources. One reason could be the recent changing of the definition ‗electrified‘ in
India as discussed earlier. Another reason could be a bias of the Indian authorities towards lower
numbers of people living in energy poverty. In the case of electrification, it was therefore
decided to opt for the most recent data from international organisations like the IEA (2007). Due
to data restrictions, mean values of average rural households in India were used. There is full
awareness that the Indian subcontinent is vast and diverse. Households are located in variously
tempered regions which affects their energy demand (e.g. for cooling and heating). Households
are located in various terrains and have various distances to the grid which affects costs. Some of
these possibilities were assessed in these scenarios, but it is not possible to model all the
possibilities due to restricted data. The effects of electrification on various income groups were
not analysed, because REM is not an economic model and data on this issue are rare. The costs
are calculated as whole system costs indicating how high the overall costs for fueling rural
households with electricity could be. Since electricity is treated as a fuel in the end-use approach,
disaggregating into further cost categories is currently not possible and would require further
research. Further research into the costs of electrification may be better performed by economic
equilibrium or optimisation models; however most of these models do not model electrification
explicitly (Chapters 2 and 3).
6.4.2 Uncertainties
Various uncertainties exist in the system. Since all models are simplifications of the real
world, all models have limitations. These two issues make it impossible to predict the future.
These scenarios are therefore indicators of possible future developments, not predictions. There
is full awareness of the complexities and uncertainties involved in the modelling. These
uncertainties affect particularly energy prices, macro-economic growth of the economy and
effects on rural populations, technological development and policies as elaborated in Table 21.
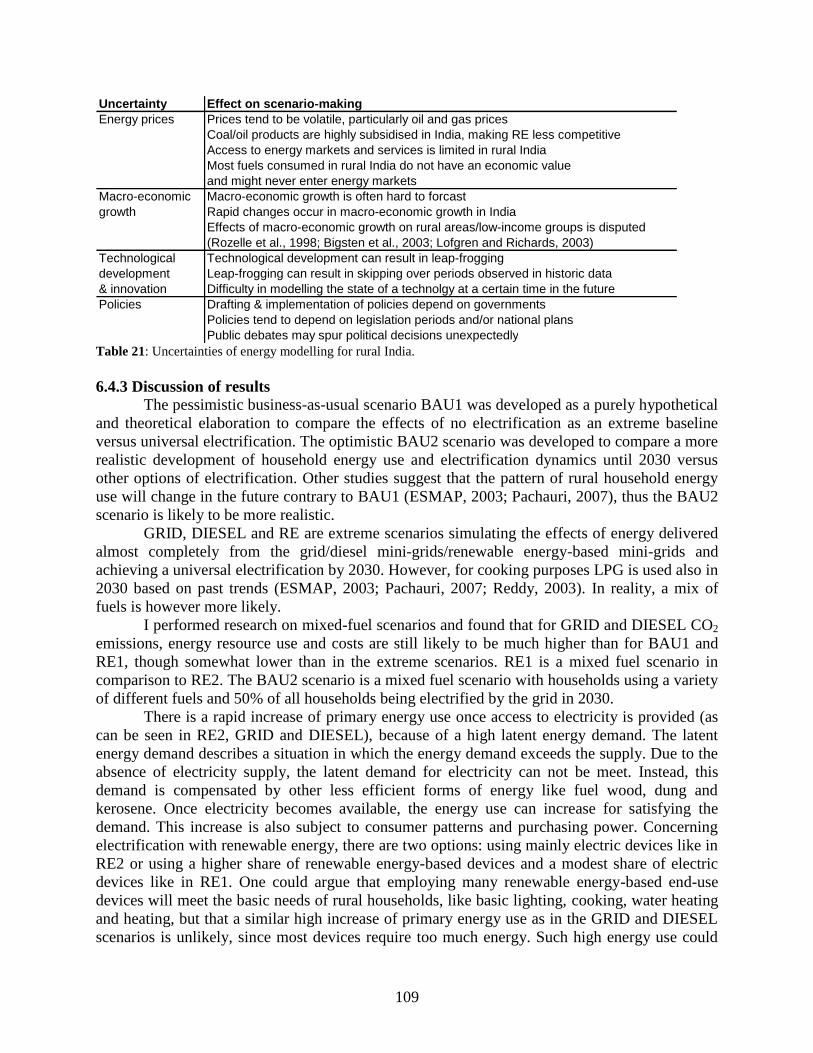
109
Uncertainty Effect on scenario-making
Energy prices Prices tend to be volatile, particularly oil and gas prices
Coal/oil products are highly subsidised in India, making RE less competitive
Access to energy markets and services is limited in rural India
Most fuels consumed in rural India do not have an economic value
and might never enter energy markets
Macro-economic Macro-economic growth is often hard to forcast
growth Rapid changes occur in macro-economic growth in India
Effects of macro-economic growth on rural areas/low-income groups is disputed
(Rozelle et al., 1998; Bigsten et al., 2003; Lofgren and Richards, 2003)
Technological Technological development can result in leap-frogging
development Leap-frogging can result in skipping over periods observed in historic data
& innovation Difficulty in modelling the state of a technolgy at a certain time in the future
Policies Drafting & implementation of policies depend on governments
Policies tend to depend on legislation periods and/or national plans
Public debates may spur political decisions unexpectedly Table 21: Uncertainties of energy modelling for rural India.
6.4.3 Discussion of results
The pessimistic business-as-usual scenario BAU1 was developed as a purely hypothetical
and theoretical elaboration to compare the effects of no electrification as an extreme baseline
versus universal electrification. The optimistic BAU2 scenario was developed to compare a more
realistic development of household energy use and electrification dynamics until 2030 versus
other options of electrification. Other studies suggest that the pattern of rural household energy
use will change in the future contrary to BAU1 (ESMAP, 2003; Pachauri, 2007), thus the BAU2
scenario is likely to be more realistic.
GRID, DIESEL and RE are extreme scenarios simulating the effects of energy delivered
almost completely from the grid/diesel mini-grids/renewable energy-based mini-grids and
achieving a universal electrification by 2030. However, for cooking purposes LPG is used also in
2030 based on past trends (ESMAP, 2003; Pachauri, 2007; Reddy, 2003). In reality, a mix of
fuels is however more likely.
I performed research on mixed-fuel scenarios and found that for GRID and DIESEL CO2
emissions, energy resource use and costs are still likely to be much higher than for BAU1 and
RE1, though somewhat lower than in the extreme scenarios. RE1 is a mixed fuel scenario in
comparison to RE2. The BAU2 scenario is a mixed fuel scenario with households using a variety
of different fuels and 50% of all households being electrified by the grid in 2030.
There is a rapid increase of primary energy use once access to electricity is provided (as
can be seen in RE2, GRID and DIESEL), because of a high latent energy demand. The latent
energy demand describes a situation in which the energy demand exceeds the supply. Due to the
absence of electricity supply, the latent demand for electricity can not be meet. Instead, this
demand is compensated by other less efficient forms of energy like fuel wood, dung and
kerosene. Once electricity becomes available, the energy use can increase for satisfying the
demand. This increase is also subject to consumer patterns and purchasing power. Concerning
electrification with renewable energy, there are two options: using mainly electric devices like in
RE2 or using a higher share of renewable energy-based devices and a modest share of electric
devices like in RE1. One could argue that employing many renewable energy-based end-use
devices will meet the basic needs of rural households, like basic lighting, cooking, water heating
and heating, but that a similar high increase of primary energy use as in the GRID and DIESEL
scenarios is unlikely, since most devices require too much energy. Such high energy use could
110
only be obtained when electric devices are employed on a larger scale like in the RE2 scenario.
The RE1 scenarios is therefore likely to sustain a modest quality of life at modest costs and very
low emissions, while the RE2, GRID and DIESEL scenarios could sustain higher levels of
consumption at higher costs and in the case of the GRID and DIESEL scenarios this would also
result in higher emissions. The prerequisite for higher levels of electricity consumption is
however that funding is available for purchasing and operating electric devices.
The Indian power sector suffers from high electricity load shedding and power deficits
being as high as 14% for peak loads (IEA; 2007). Quality of supply is an important issue in
India. To enable reliable electricity supply from renewable energy, storage needs to be in place.
On rural household level, batteries could be suitable options and are sometimes already a part of
renewable energy systems; however batteries tend to be expensive. Once hydrogen storage
technology will be commercially available, this might also be an option, but might also be rather
costly.
In 2005, the central electricity generated in India came predominantly from coal. In this
research, it is assumed that the Indian electricity generation will also depend predominantly on
fossil fuels in the future. If in the future the energy mix was to change, the CO2 emissions would
also change.
There might be a particularly high increase in CO2 emissions and energy resource use in
the DIESEL scenario, because oil is used predominantly. With still a very low electric
consumption in 2030, rural households might emit between 530 and 825 Mtons CO2 using grid
or diesel systems. This is a high amount which could increase India´s CO2 emissions
significantly and which is likely to have effects on climate change. The emissions would be even
higher, if higher consumption levels were attained in rural households. Renewable energy was
found to have the lowest CO2 emissions and thus the highest climate change mitigation potential,
with levels substantially below baseline scenario. Other GHG emissions also decline
significantly in the renewable energy scenarios. Emissions associated with local air pollution and
indoor air pollution decrease rapidly when less traditional biofuels are used, thus potentially
having a positive effect on health.
Concerning the RE scenario, physical requirements –like the availability of land, sun,
water, wind- have to be considered. For solar energy, such as PV cells and solar end-use devices,
a high solar potential is needed. Most of India receives about 300 days of sunlight per year
(Varun, 2007) and the average PV potential in India is about 20 W/m2 (Dijkstra, 2007). India also
has a domestic solar industry. For SHP, running water from rivers or streams is needed. One
SHP station may usually be enough to supply a rural Indian household or small village with basic
electricity. For wind energy, one powerful modern turbine could supply up to 50,000 rural Indian
households in windy areas, assuming that rural Indian households consume at least 10 times less
energy than Western households (Dijkstra, 2007; Enercon, 2007). Wind turbines do not require
much land, but require windy conditions. In India, especially the regions along the coastline are
windy and India has a domestic wind industry. For biomass gasification, agricultural wastes need
to be available. The land requirements for biomass were modelled in the RE scenarios and it was
found that between 3.9 and 18.9 million hectares might be needed, thus 0.01 to 0.06 times the
surface of India. It was concluded from this analysis, that land requirements for biomass will not
be a restricting factor.
Concerning costs, electrification using mainly off-grid renewable energy-based end-use
appliances could be the most cost-effective option, while decentral diesel systems could be the
most expensive option. Other research also indicates that decentral renewable energy can be
111
financially attractive compared to conventional central grid energy (Abe et al., 2007; Nouni et
al., 2008; Sinha and Kandpal, 1991), also due to low load factors, long distribution lines and high
associated transmission and distribution losses (Sinha and Kandpal, 1991). It was however found
that electrification based mainly on running electric appliances with electricity generated from
renewable energy-based mini-grids, could be more expensive than grid extensions. The IEA
(2007) estimates that between 2006 and 2030, 956 billion US$ equalling 40,875 billion INR will
be needed as investments for new power infrastructure alone. My research takes into account not
only the investment costs, but also the operation and maintenance costs (O&M) and the fuel
costs. Investment costs are assumed to make up less than one third of the total costs. For the
period 2005 to 2030, the whole system costs, averaged for all scenarios, are estimated in REM to
be 137,590 billion INR for the complete rural households which are still to be electrified15
. This
takes into account the investment costs to be paid by investors, the O&M costs to be paid by
utilities and the fuel costs to be paid both by utilities and by private households. Diesel systems
are expected to have the highest costs, ca. 222,090 billion INR16
and renewable energy systems
using mainly renewable energy-based end-use devices are likely to have the lowest costs, ca.
32,700 billion INR17
for the period 2005 to 2030.
Finally, this study is a simulation to assess how India‘s many poor could get electricity
and what the effects could be. It has to be investigated more thoroughly whether the
governmental universal electrification schemes by 2010 are realistic, but also whether universal
electrification by 2030 is realistic as assessed in this study. As rural electrification is a lengthy
process and the rural non-electrified population in India is large, this process could even take
more time and be more complex.
6.4.4 Policy recommendations
Since renewable energy is considered climate- and resource-friendly, while diesel power
and coal-based grid power are not, policy-makers should promote renewable energy for rural
electrification, particularly in view of climate change mitigation and adaptation.
Off-grid renewable energy-based appliances like biogas cookers and solar devices (e.g.
lamps, cookers, water heaters) are relatively cost-effective options of bringing modern forms of
energy to rural households -also in combination with modest use of electric appliances driven by
electricity from renewable energy-based mini-grids and could provide possibilities for increased
development. Even though rural electrification with mainly renewable energy-based end-use
devices is likely to be the most cost-effective option for rural electrification, high investments
will be needed. The Indian government has already mobilised large investments for rural
electrification (IEA; 2007). In addition to their conventional financing mechanisms, new
innovative financing mechanisms could be developed. Industrialised countries should also be
committed to supporting sustainable development. Historically, industrialised countries are
considered responsible for a great share of global climate change. Also today, industrialised
countries emit high CO2 emissions due to their prosperous lifestyles. It should therefore be their
responsibility to support climate change mitigation in developing countries like India.
15
About 3,200 billion US$ for the period 2005-2030 or about 8,420 US$ per person or about 44,600 US$ per
household. 16
About 5,160 billion US$ for the period 2005-2030 or about 13,580 US$ per person or about 71,970 US$ per
household. 17
About 760 billion US$ for the period 2005-2030 or about 2,000 US$ per person or about 10,600 US$ per
household.
112
Development assistance may be a viable financing mechanism to achieve this. Another option
could be to strengthen technology transfer, as under the Clean Development Mechanism, for
enabling the use of modern electric equipment.
6.5. Conclusions
In this study, electrification options for rural non-electrified households in India were
modelled. The impacts of four types of electrification were assessed: central grid-based using
electric appliances, decentral diesel-based using electric appliances, decentral renewable energy-
based using electric appliances and decentral renewable energy-based using mainly renewable
energy-based appliances like solar cookers, biogas stoves and solar water heaters.
It was found that rural electrification with decentral renewable energy could reduce up to
99% of total CO2 emissions from the residential sector compared to electrification with grid and
decentral diesel systems and therefore has very high climate change mitigation potentials. A
decentral renewable energy based-electrification could also reduce primary energy use compared
to electrification with grid and diesel systems and thereby save energy resources. It was also
found that rural electrification with mainly renewable energy-based appliances is likely to be the
most cost-effective option for rural electrification, followed by grid extensions. Electrification
based on decentral renewable energy, but mainly using electric appliances could however be
more expensive than grid extensions. Electrification with decentral diesel systems could be
particularly undesirable for climate, primary energy use and costs.
This research therefore suggests that decentral renewable energy is a viable option of
climate change mitigation for rural India. Concerning costs, rural electrification based on
decentral renewable energy end-use appliances is clearly the most viable option. Renewable
energy sources are assumed to spur sustainable energy transitions in rural India. Policies may
need to be adapted for subsidising access to electricity for the rural poor, to increase technology
transfer between India and the industrialised countries and to increase sustainable rural
electrification. Development assistance and Indian government efforts could be some of the key
strategies to achieve rural electrification in India.
6.6 Acknowledgements
Thanks to two anonymous reviewers for their valuable comments and Annemarie Kerkhof,
Michiel Hekkenberg and Thomas Kastner for their discussions and comments on this topic.
113
7. Conclusions
7.1 Introduction
In the past, global energy use increased primarily due to rising consumption levels in
industrialised countries. Today, industrialised countries, countries in transition and rapidly
developing countries play a major role in increasing global energy demand. The Pareto principle
acknowledges that the poorer 80% of the world's population only consume about 20% of global
resources, including energy resources, while the richer minority consumes the vast majority of
resources (Ehrlich and Holdren, 1971). This has changed in recent years as rapidly developing
countries have become more and more developed and consume more and more energy.
Characterising the changing energy systems of rapidly developing countries is therefore a
very timely necessity. Energy models can be used for this assessment to analyse past, present and
future energy systems. Energy models may serve as planning tools, scenario analysis tools and
policy assessment tools and can be important for an efficient planning of a country‘s or region‘s
future energy setting.
Even though traditional biomass plays an important role in rural areas, rapidly developing
countries like China and India rely in total primarily on fossil fuels, mainly on coal, for their
energy supply and demand (IEA, 2008). This may increase their efforts to guarantee energy
security, reduce pressure on energy resources and to ensure a higher environmental and climate
quality. Renewable and clean energy sources are low- and near zero-carbon energy sources
which are considered viable alternatives to fossil fuels and which can contribute to solving some
of the addressed challenges. For designing pathways to solve these challenges, sustainable
energy transitions can be modelled.
In this thesis, the characteristics of energy systems in developing countries are first
elaborated and it is analysed if and how they are considered in energy models. Energy modelling
approaches were then adapted through scenario-making for the use in developing countries.
Sustainable energy transitions were then modelled for the Chinese power sector, Beijing‘s
economy and the non-electrified residential sector of rural India.
This chapter provides a summary of the findings presented in Chapters 2-6 and addresses
the research questions by highlighting the key findings in Chapters 7.2-7.4. A reflection on
modelling approaches is elaborated in Chapter 7.5. The overall conclusions and
recommendations are elaborated in Chapter 7.6.
7.2 Energy systems of developing countries: characteristics and potential changes
The first research question is: How are energy systems of developing countries
characterised, with a focus on developing Asia? What are the factors influencing these energy
systems and how will they change in the process of development? How is this modelled in
present-day energy models and how could the modelling be improved? Chapters 2 and 3
elaborate these issues. The results are presented below.
It is found that the energy systems of developing countries are characterised among
others by a high dependence on traditional biofuels such as fuel wood and dung, particularly in
rural areas, by low electrification rates and limited access to modern energy, by supply shortages,
poor performance of the power sector and high differences in energy access, supply and demand
between urban and rural areas. The prevalence of the informal economy and structural economic
change also influence the energy setting. These characteristics can be observed in general in
developing countries; however the extent to which these characteristics play a role varies
114
between countries and regions. In developing Asia, there are high differences between the energy
systems of various countries. China for example has a very high electrification rate while India
has a much lower electrification rate. China also uses much more coal for the total primary
energy supply than India, while India uses more combined renewables and waste, also more
(traditional) biofuels.
Factors influencing the energy systems and triggering changes are among others
population growth, economic growth, fuel switching, technological change/leapfrogging and
policies. Energy systems of developing countries are likely to change over time when these
countries will become wealthier and gain access to modern technology. It has to be noted that
this development is not likely to be equally distributed within a country, but that rural areas are
likely to lag behind the developments in urban areas even within a few decades. Rural energy
poverty and energy-related social exclusion are thus prevailing issues that have to be considered
for energy planning. In general, it is assumed that with increasing development of a country the
use of modern energy is likely to increase while dependency on traditional fuels is likely to
decrease. It has to be considered though that fuel switching and the concept of the Energy Ladder
have not been observed fully in reality. Some uncertainty about these concepts remains. With
increasing development of a country, the power sector is also assumed to perform better due to
access to modern technologies with higher efficiencies, less supply shortages, better planning
and more adequate investments and subsidies. The extent of this development is specific for each
country and can not be generalised, because non-energy related factors such as economic and
political stability do also play a major role in the changes of energy systems. There is also a
scientific debate on how the economic well-being of countries affects the economic well-being
of people, particularly in rural areas.
This thesis also elaborates in Chapters 2 and 3 that many present-day energy models tend
to neglect important characteristics of the energy systems of developing countries.
Characteristics which are seldom explicitly modelled are for example among others the high
prevalence of fuel wood, low access to electricity and the poor performance of the power sector
and the overall economy. Non-development-adapted energy models may work very well for
industrialised countries, but tend to lack important features for developing countries. However
these models are used for a world-wide coverage, thus including developing countries. Some of
these models are used for the IPCC/SRES scenarios to support international climate policy
negotiations. It needs to be noted that a poor characterisation of the energy systems of
developing countries might lead to a poor modelling of the future energy and climate settings,
which might have implications for policy-making. As a consequence, energy models need to be
improved. They need to be adapted to specifically suit the energy systems of developing
countries, thus incorporating explicitly the characteristics of developing countries´ energy
systems. Adapting energy models for developing countries was therefore done for this thesis.
Three approaches to adapt existing energy models to the energy settings in developing countries
are presented in Chapters 4 to 6. Chapters 7.3 to 7.5 present the results, with special focus on
energy modelling in Chapter 7.5.
7.3 Energy transitions in rapidly developing countries The second research question is: How could sustainable energy transitions take place in
specific economic sectors of China and India? In Chapters 4-6 energy modelling approaches are
adapted for exploring how sustainable energy transitions could take place in specific economic
sectors of China and India. The results are presented below.
115
7.3.1 The Chinese power sector
Chapter 4 elaborates how the installation of renewable and clean energy such as small
and large-hydro power, modern biomass, solar energy, wind energy, tidal energy, and nuclear
power could lead to energy transitions in the Chinese electricity supply sector. It is suggested
that sustainable electricity is likely to be a viable mitigation option for climate change. It is also
indicated that the electricity system is expected to stay stable in the future when implementing a
high share of renewable energy technology. Installing a high share of renewable energy
technology in the Chinese power sector could though be a costly option.
7.3.2 Beijing’s economy
Chapter 5 elaborates how energy transitions to renewable energy could take place in the
energy demand of Beijing based on governmental targets. End-use technologies such as solar
water heaters, PV cells, biogas stoves, geothermal heating, biofuel-driven vehicles etc. could
replace fossil fuel technologies in all sectors of Beijing‘s economy. This is likely to have positive
effects on climate change mitigation, while only a moderate cost increase is expected. The use of
biofuels must however be carefully assessed considering the competition for land and water
between biofuel and food production. To avoid food crisis, there must be enough land for
supplying the local population with food.
7.3.3 Rural residential India
Chapter 6 suggests how energy transitions in non-electrified rural households in India
could take place. It is found that transitions to decentral renewable energy could be viable
options of electrification and climate change mitigation in rural India. Decentral renewable
energy could be used for the energy supply and demand. Solar energy, biogas from agricultural
residues, small-hydro power and wind turbines can provide sustainable electricity for driving
electric devices. Renewable energy-based devices can be used in addition for cooking, (water)
heating, lighting and some appliances (using a.o. solar cookers, biogas stoves, solar water
heaters). Decentral renewable energy could be an effective way to electrify rural Indian
households and to keep primary energy use and greenhouse gas emissions at low levels.
7.4 Effects of sustainable energy transitions in rapidly developing countries
The third research question is: What could be the effects of these energy transitions on
emissions, resource use, the electricity system, costs and social issues (e.g. access to electricity,
effects on the urban and rural population) for China and India? What policy recommendations
would be useful? Chapters 4 to 6 elaborate these issues. The results are presented below.
7.4.1 Effects on the Chinese power sector
High increases in energy supply and CO2 emissions are expected in China‘s coal-based
power sector until 2030. Energy transitions to renewable energy might save between 17-57% of
CO2 emissions compared to the baseline scenario in 2030, depending on type and share of
renewable energy technology installed. 20% renewable energy among the total installed capacity
might reduce CO2 emissions by up to 27%, while 30% renewable energy installed might save up
to 57% CO2 emissions compared to the baseline scenario in 2030. A combination of biogas and
small-hydro power plants is likely to achieve the highest CO2 emissions savings, compared to
mixed renewables and a combination of PV and wind power. 20% nuclear energy among the
116
total installed capacity could reduce CO2 emissions by up to 38% compared to the baseline
scenario in 2030. It is suggested that renewable and low-carbon technologies can have high
climate change mitigation potentials. NOx and SO2 are also likely to decrease due to sustainable
energy transitions with positive impacts on local air pollution. Concerning resource use, it is
found that high amounts of coal waste and radioactive waste could be avoided due to sustainable
energy transitions, while coal resources and uranium resources would be safeguarded. It is also
found that the overall performance of the electricity system is likely to stay stable in the future
even when a higher share of renewable energy will be installed. Costs might increase due to
sustainable energy transitions by between 20-180% in the Chinese power sector compared to the
baseline scenario in 2030. It is found that the higher the share of renewable or nuclear energy,
the higher the costs.
As policy recommendations, there are several possibilities and several cost options for
transitions to a more sustainable power sector in China. China could be face with two main
options: choosing for high climate change mitigation and high costs or choosing for moderate
climate change mitigation and moderate costs. If high climate change mitigation options are
chosen, costs are expected to increase significantly. Development assistance is likely to be
needed to cover these costs. Even though China itself will have to choose which climate policy it
will follow, it could be of global importance to assist the world‘s most populous country in
achieving sustainable development. Industrialised countries might need to show responsibility to
contribute to climate change mitigation in China considering their financial means, technological
advancement and their own current and historic contributions to climate change.
7.4.2 Effects on Beijing’s economy
Similar to national developments, high increases in energy demand and CO2 emissions
are expected in Beijing‘s coal-based economy until 2020. The government‘s targets to
implement 6% of renewable energy among the total energy demand in 2020 could save 23% of
total GHG emissions in 2020. The fossil resource use saving is expected to be 16% in the
renewable energy scenario compared to the baseline scenario in 2020. Local air pollution, which
is a serious problem in Beijing, might also be reduced due to renewable energy transitions in
Beijing. It is likely that renewable energy transitions could reduce SO2 emissions by 9%, NOx by
5%, NO by 20% and CO emissions by 2% compared to the baseline scenario in 2020. This
conclusion is derived from the energy modelling for Beijing, but is not included in the original
chapter in chapter 5, because the chapter is only intended to focus on climate change mitigation.
The highest GHG emission reductions are likely to occur in the industrial and construction
sector, for heating, transport and in the commercial sector. The highest fossil resource use saving
is also likely to be achieved in the industrial and construction sector. This is also, because the
energy intensity in the industrial and construction sectors will decline faster than in other sectors
due to additional measures such as introducing a higher level of cleaner fuels to replace coal.
Costs are assumed to increase by about 10% due to renewable energy transitions compared to the
baseline scenario in 2020. Transitions to renewable energy might be most cost-effective in
households, agriculture, commerce and heating. Even in 2020, it is expected that there will be
significant differences between urban and rural areas in the municipality of Beijing in terms of
income, life style and energy consumption. For the future, it is therefore important to promote
sustainable and equitable energy growth both in rural and urban areas. In urban areas, it is
particularly important to ensure that both poorer and wealthier citizens gain equal access to
sustainable energy to avoid unequal consumption and distribution of energy.
117
As policy recommendations, it is suggested to increase the share of renewable energy,
particularly in the industrial, construction and transport sector where most effects can be
obtained, and in the household and commercial sector where renewable energy technology is
relatively easy and cost-effective to install. For Beijing‘s transport sector, clean and renewable
energy may only be one part of solving its heavy traffic problems. Another part is to re-designing
the transport infrastructure to reduce dependency on roads and private cars and to encourage the
local population to use public transport. Energy saving should also be promoted. Governmental
programs, financial incentives and/or environmental rewarding and taxation schemes should be
in place to achieve sustainable energy transitions.
7.4.3 Effects on rural residential India
Energy use in rural non-electrified households in India is still very low and inefficient.
Traditional biofuels, like fuel wood, dung and agricultural residues, are predominantly used due
to the absence of access to more efficient and cleaner energy, infrastructure and energy markets.
Electrifying India‘s rural households could be achieved through three major strategies: grid
extensions, decentral diesel systems and decentral renewable energy. If grid extensions and
diesel systems were to be used for rural electrification, CO2 emissions and resource use could
increase significantly, exceeding the baseline scenario several-fold. A decentral renewable
energy-based electrification might save about 99% of total CO2 emissions and up to 35% of total
primary energy use in 2030 compared to the baseline scenario. Rural electrification with
decentral diesel systems is likely to be the most expensive option, due to high oil dependence.
Rural electrification with decentral renewable energy tends to be the most cost-effective option
when renewable energy-based devices are predominantly used, but turns out to be more costly
than grid extensions when electric devices are predominantly used. Introducing electricity from
decentral renewable energy may also have positive effects on social issues like providing access
to electricity and improving the living conditions of the rural population. It might also be a way
of alleviating poverty and of reducing urban-rural differences.
Since renewable energy is considered climate- and resource-friendly, while diesel power
and coal-based grid power are not, policy-makers are advised to promote decentral renewable
energy for rural electrification. Policies may need to be adapted for financing access to electricity
for the rural poor, to increase technology transfer between India and the industrialised countries
and to increase sustainable rural electrification. Development assistance and Indian government
efforts are likely to be some of the key strategies to achieve rural electrification in India.
7.5 The role of energy modelling for developing countries
Most present-day energy models are developed in industrialised countries and are based
on the experience of energy systems in industrialised countries. Although these energy models
work usually very well for industrialised countries, it is mentioned in chapters 2 and 3 that many
energy models tend to neglect some of the main characteristics of developing countries‘ energy
systems. Their results might therefore be imprecise or in the worst case might even be
misleading, which might in some cases affect policy recommendations. This should be addressed
in a time of global climate change, when negotiations about emission caps for developing
countries are on the global agenda.
Hence, there is a need to adapt energy modelling approaches to make them more suitable
for the changing energy setting of developing countries, particularly for rapidly developing
countries like China and India. This is done for this thesis as elaborated in Chapters 4 to 6. The
118
thesis presents three case studies for China and India in which existing energy modelling
approaches are adapted to suit the rapidly changing energy systems of these countries. Main
characteristics of developing countries‘ energy systems, like the carbon-based and low efficient
power sector (Chapter 4), electrification (Chapters 4-6, especially Chapter 6), the prevailent use
of traditional biofuels (Chapters 5-6, especially Chapter 6) and the urban-rural divide (Chapters
4-6, especially Chapters 5 and 6) are modelled specifically for China and India.
The PowerPlan and REM models used in this research are adapted specifically for the use
in developing countries with focus on the Chinese power sector and rural non-electrified India.
The LEAP model is used specifically for modelling the energy setting Beijing. These models
take into account the level of detail needed to model the energy systems of these selected
developing regions. The modelling approach used in this thesis applies smaller geographic
scales, uses detailed disaggregated datasets, includes characteristics of developing countries´
energy systems (e.g. traditional biofuels, the urban-rural divide etc.), uses modelling techniques
which take into account the specific energy settings in developing countries (e.g. modelling
electrification/the performance of the power sector explicitly) and uses specific individual
assumptions for these regions. These adapted models are therefore likely to allow a more
detailed approach for specific developing regions than many generalised global energy models or
models which have not been adapted for developing countries. This could lead to improved
results.
The three different models in this thesis were chosen for being adapted individually based
on individual research questions and scales. Scales are important, as they determine the precision
of the model. Global energy models, like those used for the IPCC/SRES scenarios, tend to use
large scales by clustering geographic regions in a rather aggregated and generalised manner,
grouping continents and large regions such as Asia or (Formerly) Centrally Planned Asia into
one cluster without further disaggregation. This may result in lack of representing regional
differences. However, the energy systems within these geographic regions often differ
substantially. The energy system of China, with an electrification rate of about 99%, differs
substantially from the energy system of Laos, which is also a Formerly Centrally Planned Asian
country, but which has an electrification rate of only about 11% (UNDP, 2008). Large
differences exist within these countries as well, for example in urban and rural areas. A
disaggregated tailor-made modelling approach, as used in this thesis for the PowerPlan, LEAP
and REM models, could therefore be preferable for modelling energy transitions in developing
countries compared to an aggregated ―one fits all‖ approach. The ―one-fits all‖ approach showed
to be very useful and adequate for OECD countries: countries which have about the same level
of development and mostly follow market economic principles. Such an approach could however
be problematic for developing countries, because these countries are very varied compared to
each other and within each other, have different levels of development and different types of
economies. Also, such an aggregated ―one fits all‖ approach may work well for analysing
countries or continents, but might be problematic for smaller scales at local level. For modelling
energy transitions in developing countries, a detailed tailor-made approach is therefore likely to
be preferable due to smaller geographical scales, applicability for each country´s/region´s
specific settings, detailed representation of important development issues such as the urban-rural
divide, electrification, traditional fuels and specific individual assumptions for each
country/region. This tailor-made approach was followed in this thesis (see Chapters 4 to 6).
These tailor-made models which are adapted for developing countries could therefore be
119
potentially more useful than other models for serving as tools for international climate
negotiations.
Concerning the case study for rural India, it has to be noted that the Regional Energy
Model REM was used, which is not evaluated in Chapter 3, because it does not fulfill the
selection criteria (b): ―the model is widely used by institutions in developing regions or widely
used by institutions cooperating with developing regions‖ (Chapter 3). REM is however used for
rural India, because of its flexibility, which makes it possible to analyse the energy demand and
supply of a non-electrified developing region.
It was also noted during the modelling that each type of energy model brings along a
number of advantages and disadvantages. The bottom-up simulation models used in this thesis
have the advantage that they model very well technological processes, like electrification or the
performance of the power sector. It though becomes apparent that they tend to lack the depth and
disaggregation level which is often needed for modelling economic processes like electricity
prices or energy investment costs. Top-down economic equilibrium models or optimisation
models are preferable for cost-related energy research, but they often lack the technological
perspective needed to model technological processes. Using hybrid models for these integrated
tasks might be preferable; however they tend to be extensive so that substantially more time and
human resources are needed for performing similar research. Finally, not every model can be
used for every task; the usefulness of the result also depends on the purpose of the model, the
research question and the scale.
7.6 Overall conclusion and recommendations
This thesis aims a) at elaborating the differences between energy systems in (rapidly)
developing countries and in industrialised countries, b) at adapting energy modelling approaches
to increase their suitability for rapidly developing countries and c) at developing scenarios using
these adapted models to simulate sustainable energy transitions and their effects for rapidly
developing countries. The focus of this thesis is on China and India.
In Chapters 2 and 3, the various characteristics of the energy setting in developing
countries are elaborated and it is analysed how energy models could respond to these challenges.
Three models are adapted to suit the energy setting in China and India to ensure an improved
representation of their energy future and to model the possibilities and implications of energy
transitions to renewable and clean energy (Chapters 4-6). It is assumed that these adapted models
are likely to be more suited for modelling energy systems of developing countries than other
energy models which have not been adapted for developing countries.
It is found that low-carbon energy transitions could be possible in China and in India for
various sectors. It is found that CO2 emissions could be substantially reduced due to sustainable
energy transitions. This study shows that natural resources could be safeguarded and fossil
energy use could be reduced when renewable energy is employed. The future electricity system
is likely to stay stable even if a higher share of renewable energy will be installed. Sustainable
energy transitions might reduce social disparities such as urban-rural differences. Concerning
costs, the research outcomes suggest a rather mixed picture: In the Chinese power sector, energy
transitions to sustainable energy tend to be (much) more expensive than continued reliance on
fossil fuels. In Beijing‘s economy, energy transitions to sustainable energy tends to increase
costs only moderately, with households, agriculture, commerce and heating enabling the most
cost-effective energy transitions. In the non-electrified residential sector of rural India, rural
electrification with decentral renewable energy could be several times cheaper than
120
electrification by other energy sources, but only when off-grid renewable energy-based devices
are predominantly used like solar cookers, biogas stoves and solar water heaters. When
electricity from renewable energy-based mini-grids predominantly drives electric devices, like
electric stoves, electric geysers or other electronics, costs tend to increase to a greater extent than
for grid extensions. This may lead to the conclusion that for low-energy requiring processes and
small-scale processes, sustainable energy could be more cost-effective than other energy sources,
while for high-energy requiring processes and large-scale processes, sustainable energy tends to
be more costly than other energy sources. Costs for fossil fuels would however become more
expensive, if subsidies were reduced, in return making sustainable energy more competitive.
High oil price increases also showed recently that fossil fuel prices tend to be volatile and will
probably increase more and more, potentially making sustainable low-carbon-based energy more
attractive in the future. It also has to be considered that the system is highly complex, that high
uncertainties exist (as elaborated in the uncertainty chapters in Chapter 4-6) and that regional
differences prevail, with India differing from China and rural areas differing from urban areas.
As an overall conclusion, this thesis shows a) that energy modelling needs to take into
account the growing importance of rapidly developing countries. This can be done by adapting
energy modelling approaches to suit the energy systems of developing countries and by using a
specific tailor-made approach for each specific developing region, like done in this thesis. This
thesis also shows b) that renewable and clean energy could be viable options of climate change
mitigation for rapidly developing countries like China and India and c) that these sustainable
energy transitions to a low-carbon economy could also have other positive effects on the
environment and society. Hence, sustainable energy transitions are likely to have positive effects
in rapidly developing countries. To ensure an adequate planning of these energy transitions
adequate energy modelling is needed which is suited for developing countries.
To mitigate and to adapt to global climate change, several measures should be
implemented besides the introduction of sustainable energy, namely energy saving and energy
efficiency improvements. To achieve low-carbon transitions, rapidly developing countries should
implement stringent policies and might require the support from industrialised countries.
Development assistance and technology transfer might be suitable options of support, though
more research is needed in this area. More research is also needed for assessing the possibilities
of increased participation of developing countries in international climate policy and the
implications of having binding targets for developing countries. The main research
recommendation is to adapt more energy models for the use in developing countries.
Since climate change is a global problem, it is the responsibility of both developing and
industrialised countries to cooperate to achieve a sustainable energy future. Such cooperation is
crucial for the success of international climate policy negotiations. Energy models which are
adapted for the needs of developing countries might increase the success of international climate
policy negotiations, as they can be useful tools to support the energy and emission planning of
developing countries.
121
English summary:
Sustainable energy for developing countries
- Modelling transitions to renewable and clean energy in rapidly developing
countries
1. Background
1.1. Energy and its impacts
Energy is vital. Energy is needed for basic human needs: cooking, heating, lighting,
boiling water and for other household-based activities. Energy is also required to sustain and
expand economic processes like agriculture, electricity production, industries, services and
transport. It is commonly suggested that access to energy is closely linked with development and
economic well-being.
Today about 80% of the world‘s primary energy comes from polluting fossil fuels such as
coal, oil and natural gas. However, fossil energy resources are not endlessly abundant, but can be
depleted. Energy has thus become a major geo-political and socio-economic issue. Recent oil
price shocks have shown the world‘s dependency on a scarce fuel. Fossil energy use is also
associated with a number of negative environmental effects like air pollution and global climate
change. During the combustion of fossil fuels large amounts of carbon dioxide (CO2) and other
so-called greenhouse gases (GHG) are emitted, which are reported to contribute to global climate
change. Global climate change, sometimes also called global warming, is a phenomenon which
is indicated to have multiple impacts. The United Nations‘ Intergovernmental Panel on Climate
Change (IPCC) reports that some of the observed impacts are an increase in global surface
temperatures, increases in heavy precipitation events, higher frequency of droughts, changes in
the large-scale atmospheric circulation and increases in tropical cyclone activity. This could
mean increased water stress, flood risks, drought risks, food insecurity, reduction of living
standards and health risks. Developing countries are likely to be most vulnerable to climate
change, due to their limited financial and structural means which could hinder quick adaptation
and mitigation.
1.2. Energy transitions and the role of renewable and clean energy These energy-climate implications put pressure on all countries around the world. The
pressure on developing countries may be even greater, because they are currently in the process
of development which requires substantial energy resources for achieving higher living
standards. High population levels and high fossil fuel reliance increase this pressure even more.
The share of low-polluting renewable and clean energy should therefore be increased to meet
energy security, to reduce pressure on fossil energy resources, to mitigate climate change and to
ensure a higher environmental quality. Renewable and clean energy are likely to spur sustainable
energy transitions.
Energy transitions can be defined as shifts from a country‘s economic activities based on
fossil fuels to an economy partially based on renewable and low-polluting clean energy sources.
This means that substitutions take place from fossil fuel-based technologies to clean energy
technologies. Such transitions can take place in every sector of a country‘s or a region‘s
122
economy. For example, electricity can be generated from wind instead of being generated from
coal. Sustainable energy transitions could open up new possibilities for developing countries to
achieve higher development and higher living standards while at the same time safeguarding
energy resources, the environment and human health due to lower pollution levels.
1.3. Energy modelling
Energy models can be important tools for analysing and planning energy transitions.
Computer models are simplifications of the real world and can also be useful for energy
planning. Complex real-life problems can be observed and analysed by computer models. The
future can be simulated with these models to assist the energy planning of years and decades to
come. Since most present-day energy models are developed by and for industrialised countries,
they often tend to be biased towards the energy systems of these countries and they may thereby
overlook that the situation is very different in developing countries. Developing countries usually
differ from industrialised countries in terms of energy consumption, production and distribution,
energy infrastructure and energy economy. For example, in many developing countries a large
part of the rural population uses fuel wood for cooking meals and heating homes. In
industrialised countries, the majority of the population uses electricity or natural gas for cooking
and heating. These differences in energy systems between developing countries and
industrialised countries result in the need to adapt energy modelling approaches for the use in
developing countries.
2. Objective of the thesis and research approach
The main objective of this thesis is first to adapt energy models for the use in developing
countries and second to model sustainable energy transitions and their effects in rapidly
developing countries like China and India.
The focus of this thesis is three-fold: a) to elaborate the differences between energy
systems in (rapidly) developing countries and in industrialised countries, b) to adapt energy
modelling approaches to improve their suitability for rapidly developing countries and c) to
develop scenarios using these adapted models to simulate sustainable energy transitions for
rapidly developing countries and to assess the implications of these energy transitions. The core
of this research is to develop scenarios for sustainable energy transitions for China and India.
China and India are chosen, because they are currently considered the most rapidly developing
countries, and thereby also the most energy-consuming, most climate-relevant and most
economically-growing developing countries. Their development is expected to have global
impacts. Implementing renewable and clean energy sources in these countries is likely to
mitigate climate change. Three case studies are chosen for China and India which assess
different levels and scales of energy transitions: national/regional, urban/rural and
supply/demand. These three case studies are corresponding with current energy policy in China
and India. A case study for Beijing was developed based on the local government‘s renewable
energy target for 2020 and was performed in cooperation with Chinese researchers.
The sustainable energy technologies which are assessed in these case studies are
renewable energy sources coming from the sun, wind, water, biomass and so-called ―clean‖
energy technologies which emit less greenhouse gases than conventional coal and oil, such as
nuclear energy, natural gas and more efficient fossil fuel technology. It has to be noted that the
term ―clean‖ energy actually describes less polluting energy, keeping in mind that there is no
completely clean energy. Sustainable energy scenarios are compared to business-as-usual
123
scenarios or baseline scenarios in which unsustainable fossil fuel technologies prevail as it is the
case today in China and India. Energy models are specifically adapted in this thesis for the use in
developing countries with a focus on the Chinese power sector, Beijing‘s economy and rural
non-electrified India. These models take into account important characteristics and the level of
detail needed to model the energy systems of the developing regions selected.
3. Findings
3.1 Energy systems of developing countries: characteristics and modelling approaches
In chapters 2 and 3, the various characteristics of the energy setting in developing
countries are elaborated and it is analysed how energy models address these.
The energy systems of developing countries tend to differ from those of industrialised
countries. It is found that the energy systems of developing countries are usually characterised
among others by a high dependence on traditional biofuels such as fuel wood and dung, by low
electrification rates and limited access to modern energy sources, by supply shortages, poor
performance of the power sector and high differences in energy access, supply and demand
between urban and rural areas. Some economic issues, like the prevalence of the so-called
unofficial or informal (thus non-taxed) economy and changes in the structure of the economy,
can also influence the energy setting. These characteristics can generally be observed in
developing countries, but the extent to which these characteristics play a role varies between
countries and regions. Factors which influence the energy systems and trigger changes are
among others population growth, economic growth, fuel switching, technological change and
policies. Concepts of energy and development are elaborated in Chapter 2, like the Energy
Ladder (which relates increasing income to the use of cleaner and more efficient energy) and the
Environmental Kuznets Curve (which relates income levels to pollution levels). These concepts
can be observed in the results of the IPCC/Special Report on Emission Scenarios (SRES)
models, but improvements can be made in modelling the issues that underlie these concepts.
Most present-day energy models were built by and for industrialised countries and are
based on the experience of energy systems in these countries. Although these energy models
work usually very well for industrialised countries, it is found that many of them tend to oversee
the different energy setting in developing countries. Their results might therefore be imprecise or
at worst even misleading, which might in some cases affect policy recommendations. This
should be addressed in a time of global climate change, when negotiations about potential
emission caps for developing countries are on the global agenda. Hence, there is a need to adapt
energy modelling approaches to make them more suitable for the changing energy systems of
developing countries, particularly for rapidly developing countries like China and India. Chapter
3 concludes that particularly those characteristics of developing countries‘ energy systems need
to be modelled for which reliable data are available and the system dynamics are sufficiently
understood. As a result of the energy model comparison in Chapter 3, which tests the suitability
of models for developing countries, it is suggested that for an improved use in developing
countries adapted energy models should preferably follow a bottom-up or hybrid approach and
be scenario-simulation models or toolbox models. In Chapters 4 to 6, three existing energy
models were adapted for the use in developing countries according to this approach.
3.2 Energy transitions in rapidly developing countries
124
In chapters 4 to 6, three case studies for China and India are presented in which existing
energy modelling approaches are adapted to suit the rapidly changing energy systems of these
countries. Some of the main characteristics of developing countries‘ energy systems are
modelled, like the fossil fuel-based and low efficient power sector, electrification, the prevailing
use of traditional biofuels and the urban-rural divide.
The energy models used for this thesis are specifically adapted for China and India. With
these models, it is found that sustainable energy transitions could be possible in China and in
India for various sectors.
For the Chinese power sector, energy transitions to renewable energy might save between
17-57% of total CO2 emissions from electricity generation compared to the business-as-usual
scenario in 2030, depending on type and share of renewable energy technology installed. 20%
renewable energy among the total installed capacity might reduce total CO2 emissions from
electricity generation by up to 27%, while 30% renewable energy installed might save up to 57%
CO2 emissions compared to the business-as-usual scenario in 2030. A combination of biogas and
small-hydro power plants is likely to achieve the highest CO2 emission savings, compared to
mixed renewables and a combination of PV and wind power. 20% nuclear energy among the
total installed capacity could reduce total CO2 emissions from electricity generation by up to
38% compared to the business-as-usual scenario in 2030. The electricity system is likely to stay
stable in the future also when higher shares of low-carbon energy will be implemented. Fossil
resources are expected to be safeguarded, while costs are likely to rise (Chapter 4).
Possible energy transitions are elaborated for the economic sectors of Beijing, including
agriculture, industry, residences, services and transport. The Government of Beijing‘s targets to
implement 6% of renewable energy among the total energy demand in 2020 could save 23% of
total GHG emissions in 2020. The fossil resource use saving is expected to be 16% in the
renewable energy scenario compared to the business-as-usual scenario in 2020. Local air
pollution, which is a serious problem in Beijing, is likely to decline modestly due to renewable
energy transitions in Beijing. Costs are assumed to increase by about 10% due to renewable
energy transitions compared to the business-as-usual scenario in 2020. Even in 2020, it is
expected that there will be significant differences between urban and rural areas in the
municipality of Beijing in terms of income, life style and energy consumption (Chapter 5).
Electrifying India‘s rural households could be achieved by three major strategies: grid
extensions, decentral diesel systems and decentral renewable energy systems. If grid extensions
and diesel systems were to be used for rural electrification, CO2 emissions and resource use
could increase significantly, exceeding the business-as-usual scenario several-fold. A decentral
renewable energy-based electrification might save about 99% of total CO2 emissions and up to
35% of total primary energy use in 2030 compared to the business-as-usual scenario. Rural
electrification with decentral diesel systems is likely to be the most expensive option, due to high
oil dependence. Concerning whole system costs, rural electrification with decentral renewable
energy could be the most cost-effective option when renewable energy-based devices are
predominantly used, but could be more costly than grid extensions when electric devices are
predominantly used. Rural electrification may have positive effects on social issues like
providing access to electricity, improving the living conditions of the rural population and
reducing urban-rural differences (Chapter 6).
In summary, it is found that CO2 emissions could be substantially reduced due to
sustainable energy transitions. This thesis shows that natural resources could be safeguarded and
fossil energy use could be reduced when renewable energy is used. The electricity system is
125
likely to stay stable in the future even if a higher share of sustainable energy will be installed.
Sustainable energy transitions might reduce social disparities such as urban-rural differences.
Concerning costs, the research outcomes suggest a rather mixed picture: In the Chinese power
sector, energy transitions to sustainable energy tend to be (much) more expensive than continued
reliance on fossil fuels. In Beijing‘s economy, energy transitions to sustainable energy tend to
increase costs only moderately, with households, agriculture, services and heating enabling the
most cost-effective energy transitions. In the non-electrified residential sector of rural India, rural
electrification with decentral renewable energy could be several times cheaper than
electrification with grid extensions or decentral diesel systems. This is however only the case
when renewable energy-based devices are predominantly used like solar cookers, biogas stoves
and solar water heaters. When electricity is generated from decentral renewable energy and
predominantly drives electric devices, like electric stoves, electric geysers or other electronics,
costs increase to a greater extent than for grid extensions. This may lead to the conclusion that
for low-energy requiring processes and small-scale processes sustainable energy could to be
more cost-effective than other energy sources. For high-energy requiring processes and large-
scale processes, sustainable energy tends to be more costly than other energy sources. However,
costs for fossil fuels would increase if subsidies were reduced, in return making sustainable
energy more competitive. High oil price increases also recently showed that fossil fuel prices
tend to be volatile and are likely to increase even more, potentially making sustainable non-fossil
energy more attractive in the future. Moreover, the system is highly complex, high uncertainties
exist and regional differences prevail, with India differing from China and rural areas differing
from urban areas.
4. Conclusion
This thesis aims a) at elaborating the differences between energy systems in (rapidly)
developing countries and in industrialised countries, b) at adapting energy modelling approaches
to increase their suitability for rapidly developing countries and c) at developing scenarios using
these adapted models to simulate sustainable energy transitions for rapidly developing countries
and to assess the impacts of these energy transitions. The focus of this thesis is on China and
India.
As an overall conclusion, the thesis shows a) that energy modelling needs to take into
account the growing importance of rapidly developing countries. This can be done by adapting
energy modelling approaches to suit the energy systems of developing countries as was done in
the thesis. This thesis also shows b) that renewable and clean energy could be viable options of
climate change mitigation for rapidly developing countries like China and India and c) that these
energy transitions to a sustainable economy could also have other positive effects on the
environment and society. Hence, sustainable energy transitions are likely to have positive effects
in rapidly developing countries. To ensure an adequate planning of these energy transitions
adequate energy modelling is needed which is suited for developing countries.
Since climate change is a global problem, it is the responsibility of both developing and
industrialised countries to cooperate to achieve a sustainable energy future. Such cooperation
could be crucial for the success of international climate policy negotiations. Energy models
which are adapted to the needs of developing countries are likely to increase the success of
climate policy negotiations, as they can be useful tools to support the energy planning of
developing countries.
126
Nederlandse samenvatting:
Duurzame energie voor ontwikkelingslanden
- Modellering van transities naar hernieuwbare en schone energie in zich snel
ontwikkelende landen
1. Achtergrond
1.1 Energiegebruik en de gevolgen hiervan
Energie is essentieel. Energie is nodig voor de basisbehoeften van de mens: koken,
verwarming, licht maar ook voor de productie van o.a. voedsel en onderdak. Energie is dus
nodig in die economische sectoren die deze goederen produceren zoals landbouw,
elektriciteitsproductie, industrie, diensten en vervoer. Men neemt aan dat de toegang tot energie
nauw verbonden is met ontwikkeling en economisch welzijn.
Vandaag de dag komt ongeveer 80% van het mondiale primaire energiegebruik uit
fossiele brandstoffen zoals steenkool, olie en aardgas. Fossiele energiebronnen zijn echter niet
eindeloos beschikbaar, zij kunnen uitgeput raken. Energie is daarom een belangrijk geopolitiek
en sociaaleconomisch vraagstuk geworden. De gevolgen van de recente olieprijsschokken laten
goed zien hoe afhankelijk we zijn van schaarse brandstoffen. Het fossiele energieverbruik wordt
ook geassocieerd met een aantal negatieve milieugevolgen zoals luchtvervuiling en mondiale
klimaatverandering. Door de verbranding van fossiele brandstoffen worden veel kooldioxide
(CO2) en andere zogenaamde broeikasgassen (GHG) uitgestoten. Deze broeikasgassen dragen bij
aan de mondiale klimaatverandering. De mondiale klimaatverandering, ook bekend als
opwarming van de aarde, is een verschijnsel met meerdere gevolgen. Het Intergouvernementele
Comité voor de Klimaatverandering van de Verenigde Naties (IPCC) rapporteert enkele
waargenomen effecten: een stijging van mondiale oppervlaktetemperaturen, toename van zware
neerslag, meer kans op droogten, grootschalige veranderingen in de atmosferische circulatie en
een toename van tropische cycloonactiviteit. Dit kan een verhoogd risico betekenen op
overstromingen en extreme droogten, voedselonzekerheid, vermindering van de levensstandaard
en gezondheidsrisico's. Ontwikkelingslanden zijn waarschijnlijk de kwetsbaarste landen bij de
klimaatverandering, vanwege hun beperkte financiële middelen, die snelle aanpassing (o.a.
dijkverhoging) moeilijk of onmogelijk maken.
1.2. Energie transities en de rol van hernieuwbare en schone energie
De huidige energie– en klimaatproblematiek zet alle landen in de wereld onder druk. De
druk op ontwikkelingslanden is misschien nog groter, omdat zij momenteel in een fase verkeren,
waarin grote hoeveelheden energie nodig zijn voor het bereiken van een hogere levensstandaard.
Een toenemende bevolking en een sterke afhankelijkheid van fossiele brandstof verhogen deze
druk nog meer. Het aandeel van minder vervuilende hernieuwbare en schone energie zou daarom
moeten worden verhoogd om de levenszekerheid van energie te garanderen, de druk op fossiele
energiebronnen te verminderen, klimaatverandering tegen te gaan en een hogere milieukwaliteit
te waarborgen. Hernieuwbare en schone energie kunnen een stimulans zijn voor de transitie naar
duurzame energie.
127
Energietransities kunnen worden gedefinieerd als verschuivingen van op fossiele
brandstoffen gebaseerde economische activiteiten, naar die op (deels) hernieuwbare en minder
vervuilende energiebronnen. Dit betekent dat op fossiele brandstof gebaseerde technologieën
worden vervangen door schone(re) energietechnologieën. Dergelijke transities kunnen in elke
economische sector van een land of regio plaatsvinden. Zo kan Elektriciteit kan met behulp van
windenergie worden geproduceerd in plaats van met steenkool. Duurzame energietransities
kunnen ontwikkelingslanden nieuwe mogelijkheden bieden voor ontwikkeling en verhoging van
de levensstandaard terwijl tegelijkertijd energiebronnen, milieu en volksgezondheid beschermd
worden door lagere energiegebruik en emissies.
1.3 Energiemodellering
Energiemodellen kunnen belangrijke hulpmiddelen zijn om energietransities te
analyseren en te plannen. Computermodellen zijn vereenvoudigingen van de echte wereld.
Complexe problemen in de echte wereld kunnen met computermodellen worden doorgerekend
en worden geanalyseerd. De toekomst kan met deze modellen worden gesimuleerd om de
energieplanning van de komende jaren en decennia te ondersteunen.
De meeste huidige energiemodellen zijn door en voor industrielanden ontwikkeld en
nemen de energiesystemen van deze landen als uitgangspunt en kunnen daardoor niet
onderkennen dat de situatie in ontwikkelingslanden heel anders is. Industrielanden en
ontwikkelingslanden verschillen ondermeer in energiegebruik, productie en distributie, energie-
infrastructuur en energie-economie. In veel ontwikkelingslanden bijvoorbeeld, gebruikt een
groot deel van de plattelandsbevolking hout voor het koken van de maaltijd en het verwarmen
van de huizen. In industrielanden gebruikt de meerderheid van de bevolking elektriciteit of
aardgas voor het koken en het verwarmen. Deze verschillen in energiesystemen tussen
ontwikkelingslanden en industrielanden maken het noodzakelijk om gangbare energiemodellen
aan te passen voor het gebruik in ontwikkelingslanden.
2. Doel van het proefschrift en de onderzoeksbenadering
De belangrijkste doelstelling van dit proefschrift is ten eerste om energiemodellen voor
het gebruik in ontwikkelingslanden aan te passen en ten tweede om daarmee duurzame
energietransities en hun gevolgen in zich snel ontwikkelende landen zoals China en India te
onderzoeken.
Het doel van dit proefschrift is drieledig: a) de verschillen tussen energiesystemen in zich
(snel) ontwikkelende landen en industrielanden uit te werken b) energiemodellen aan te passen
zodat hun geschiktheid voor deze ontwikkelingslanden wordt verbeterd en c) scenario‘s te
ontwikkelen die deze aangepaste modellen gebruiken om duurzame energietransities voor deze
ontwikkelingslanden te simuleren en de implicaties van deze energietransities te beoordelen. De
kern van dit onderzoek is het ontwikkelen van scenario‘s voor duurzame energietransities voor
China en India.
China en India zijn gekozen, omdat zij zich economisch momenteel het snelst
ontwikkelen, en daardoor ook de meest energieverbruikende, meest klimaat-relevante
ontwikkelingslanden zijn. Hun ontwikkeling kan gevolgen op wereldschaal hebben.
Implementatie van hernieuwbare en schone energiebronnen in deze landen zal waarschijnlijk de
klimaatverandering in gunstige zin beïnvloeden. Drie case studies zijn gekozen in China en India
die verschillende niveaus en schalen van energietransities beoordelen: nationaal/regionaal,
128
stedelijk/landelijk en energievraag/-aanbod. Deze drie cases corresponderen met het huidige
energiebeleid in China en India. Een case die voor Peking werd ontwikkeld is gebaseerd op de
doelstelling voor hernieuwbare energie van de lokale regering voor 2020 en werd uitgevoerd in
samenwerking met Chinese onderzoekers.
De duurzame energietechnologieën die in deze cases worden beoordeeld zijn gebaseerd
op hernieuwbare energiebronnen zoals zon, wind, water, biomassa dan wel behoren tot de
zogenaamde „schone― technologieën. ―Schone‖ energietechnologieën zijn technologieën zoals
kernenergie, aardgas en efficiëntere fossiele brandstoftechnologieën, die minder broeikasgassen
uitstoten dan conventionele technologieën met steenkool en olie. De term „schone― energie
betekent hier eigenlijk minder vervuilende energie, want er is geen volledig schone energie. De
duurzame energiescenario‘s worden vergeleken met ‗business-as-usual‘ of referentie scenario‘s
waarin de niet-duurzame fossiele brandstoftechnologieën de overhand hebben zoals op dit
moment het geval is in China en India. De energiemodellen zoals gebruikt in dit proefschrift, zijn
aangepast aan de landen en sectoren waarvoor ze gebruikt worden: de Chinese
elektriciteitssector, De Beijing regio en het nog niet geëlektrificeerde platteland van India.
3. Resultaten
3.1 Energie systemen van ontwikkelingslanden: kenmerken en modelleringsbenaderingen Eerst (hoofdstukken 2 en 3) worden de diverse kenmerken van het energiesysteem
uitgewerkt en wordt geanalyseerd hoe energiemodellen hier mee omgaan.
De energiesystemen van ontwikkelingslanden verschillen van die van industrielanden.
Energiesystemen van ontwikkelingslanden worden gekenmerkt o.a. door een hoge
afhankelijkheid van traditionele biobrandstoffen zoals hout en mest, een lage elektrificatie,
beperkte toegang tot moderne energiebronnen, leveringstekorten van de elektriciteitssector en
door grote verschillen tussen stedelijke en plattelandsgebieden m.b.t. de energievraag en -
aanbod. Het bestaan van een sterke informele economie en de veranderingen in de structuur van
de economie, kunnen het energiesysteem ook beïnvloeden. Deze kenmerken gelden over het
algemeen in ontwikkelingslanden, maar de mate waarin deze kenmerken een rol spelen varieert
tussen landen en gebieden. De factoren die de energiesystemen beïnvloeden en veranderingen
teweegbrengen zijn o.a. bevolkingstoename, de economische groei, brandstofsubstitutie,
technologische verandering en beleid. Concepten aangaande energie en ontwikkeling zoals de
‗Energy Ladder‘ (die stijgend inkomen en het gebruik van schonere en efficiëntere energie met
elkaar in verband brengt) en de ‗Environmental Kuznets Curve‘ (die inkomensniveaus en
verontreinigingniveaus met elkaar in verband brengt), worden uitgewerkt in Hoofdstuk 2. Deze
concepten worden geïllustreerd m.b.v. de resultaten van de IPCC/Speciaal Rapport over Emissie
Scenarios (SRES) modellen.
De meeste huidige energiemodellen werden ontwikkeld door en voor industrielanden en
zijn gebaseerd op de ervaring met energiesystemen in deze landen. Hoewel deze
energiemodellen gewoonlijk zeer goed werken voor de industrielanden zelf, gaan deze modellen
voorbij aan de verschillen van de energiesystemen met de ontwikkelingslanden. De resultaten
van deze modellen zouden daarom onnauwkeurig of in het slechtste geval zelfs misleidend
kunnen zijn. Deze modelonzekerheden kunnen weer leiden tot verkeerde beleidsaanbevelingen.
In een tijd van mondiale klimaatverandering zou deze onzekerheden aan de orde moeten komen,
omdat de onderhandelingen over potentiële emissiebegrenzingen voor ontwikkelingslanden thans
129
hoog op de wereldagenda staan. Daarom is het belangrijk om bestaande energiemodellen
geschikter te maken voor de energiesystemen van ontwikkelingslanden, in het bijzonder voor die
van de zich snel ontwikkelende landen als China en India. Hoofdstuk 3 concludeert dat in het
bijzonder die kenmerken van de energiesystemen van ontwikkelingslanden moeten worden
gemodelleerd waarvoor betrouwbare gegevens beschikbaar zijn en waarvan de systeemdynamica
voldoende wordt begrepen. In Hoofdstuk 3, waarin de geschiktheid van modellen voor
ontwikkelingslanden is onderzocht, wordt gesteld, dat de energiemodellen bij voorkeur een
‗bottom-up‘ of hybride benadering zouden moeten volgen en dat het scenario simulatiemodellen
of toolboxmodellen zouden moeten zijn. In Hoofdstukken 4 t/m 6 zijn volgens deze benadering
drie bestaande energiemodellen aangepast voor het gebruik in ontwikkelingslanden.
3.2 Energie transities in zich snel ontwikkellende landen
Vervolgens (hoofdstukken 4 t/m 6) worden drie cases uitgewerkt voor China en India
waarin de bestaande energiemodellen worden aangepast om de snel veranderende
energiesystemen van deze landen goed te kunnen simuleren. Enkele belangrijke kenmerken van
de energiesystemen van ontwikkelingslanden worden hier bestudeerd, bijvoorbeeld de lage
efficiëntie van de op fossiele brandstof gebaseerde elektriciteitssector, de elektrificatie van het
platteland, het overheersende gebruik van traditionele biobrandstoffen en de stad-platteland
tegenstelling.
De energiemodellen die voor dit proefschrift worden gebruikt zijn specifiek aangepast
voor China en India. De resultaten van modelberekeningen tonen aan dat duurzame
energietransities in China en India voor diverse sectoren mogelijk zijn.
De CO2-emissie van de Chinese elektriciteitssector zou tot 57% kunnen afnemen als
resultaat van de energietransitie naar hernieuwbare energiebronnen. Wanneer 20% van de totale
geïnstalleerde capaciteit vervangen wordt door hernieuwbare energiebronnen neemt de CO2-
emissie van de elektriciteitssector maximaal 27% af, terwijl 30% hernieuwbare energiebronnen
de CO2-emissie tot 57% zal doen afnemen. Beiden in vergelijking met het ‗business-as-usual‘
scenario in 2030. De CO2 reductie is ook afhankelijk van het gebruikte type hernieuwbare bron.
Een combinatie van biogas en kleinschalige waterkracht centrales zal waarschijnlijk de hoogste
CO2-emissiereductie opleveren, meer dan een mix van hernieuwbare energiebronnen en een
combinatie van PV (Photo Voltaisch) en windenergie. Wanneer 20% van de totale geïnstalleerde
capaciteit door kernenergie wordt vervangen zal de CO2-emissie van de elektriciteitssector
maximaal met 38% afnemen in vergelijking met het ‗business-as-usual‘ scenario in 2030. De
stabiliteit van het elektriciteitssysteem zal waarschijnlijk in de toekomst ook goed blijven,
ondanks de toename van minder betrouwbare hernieuwbare bronnen.
In de tweede case worden mogelijke energietransities voor de gemeente Peking
gemodelleerd voor de economische sectoren: landbouw, industrie, huishouden, diensten en
vervoer. In deze case is de doelstelling van de overheid van Peking om 6% van de totale
energiebehoefte in 2020 te voorzien met hernieuwbare bronnen gemodelleerd. Het resultaat is
een besparing van 23% op de totale broeikasgasemissies in 2020. Deze overheidsdoelstelling
levert een besparing van 16% op het fossiele brandstofgebruik in vergelijking met het ‗business-
as-usual‘ scenario in 2020. De lokale luchtvervuiling, een ernstig probleem in Peking, zal
waarschijnlijk licht dalen vanwege de transitie naar hernieuwbare energiebronnen. De kosten
zullen in dit scenario met ongeveer 10% stijgen vanwege de toename van hernieuwbare
energiebronnen in vergelijking met het ‗business-as-usual‘ scenario in 2020. Zelfs in 2020
130
verwacht men significante verschillen tussen stedelijke en plattelandsgebieden in de gemeente
van Peking, bijvoorbeeld in inkomen, levensstijl en energiegebruik (Hoofdstuk 5).
In de derde case worden drie belangrijke strategieën om de plattelands huishoudens van
India van elektriciteit te voorzien met elkaar vergeleken. Deze drie strategieën zijn: uitbreidingen
van het centrale net, decentrale dieselsystemen en decentrale hernieuwbare energiesystemen. Als
de netuitbreidingen en de dieselsystemen worden gekozen voor de elektrificatie van het
platteland dan zullen de CO2-emissies en het brandstofgebruik aanzienlijk stijgen, en zelfs hoger
uitkomen dan het ‗business-as-usual‘ scenario. Een decentrale, op hernieuwbare energie
gebaseerde elektrificatie zou ongeveer 99% van de totale CO2-emissies kunnen vermijden en tot
35% van het totale primaire energieverbruik kunnen besparen in vergelijking met het ‗business-
as-usual‘ scenario in 2030. De elektrificatie van het platteland met decentrale diesel systemen zal
waarschijnlijk de duurste optie zijn, dit vanwege de hoge olieafhankelijkheid. Als naar het geheel
van systeemkosten wordt gekeken dan kan de elektrificatie van het platteland met decentrale
hernieuwbare energiebronnen de meest rendabele optie zijn, wanneer hoofdzakelijk op
hernieuwbare energie gebaseerde apparaten gebruikt worden. Het kan echter duurder zijn dan
netuitbreidingen wanneer hoofdzakelijk elektrische apparaten gebruikt worden. De elektrificatie
van het platteland kan positieve gevolgen hebben voor sociale vraagstukken, zoals toegang tot
elektriciteit, het verbeteren van de levensomstandigheden van de plattelandsbevolking en het
verminderen van verschillen tussen stad en platteland (Hoofdstuk 6).
Samengevat kan men stellen dat de CO2-emissies wezenlijk kunnen worden verminderd
door duurzame energietransities.. Dit proefschrift toont aan dat natuurlijke hulpbronnen kunnen
worden behoed voor uitputting en het fossiele energieverbruik kan worden verminderd wanneer
hernieuwbare energie wordt gebruikt. Het elektriciteitssysteem zal waarschijnlijk in de toekomst
betrouwbaar blijven zelfs met een hoger aandeel van duurzame energie. Duurzame
energietransities zouden sociale ongelijkheden zoals verschillen tussen stad en platteland kunnen
verminderen. Wat betreft de kosten geven de onderzoekresultaten een gemengd beeld te zien: In
de Chinese elektriciteitssector lijken energietransities naar duurzame energie (veel) duurder te
worden dan een op fossiele brandstoffen gebaseerd productiepark. In de economie van Peking
lijken energietransities naar duurzame energie de kosten slechts matig te verhogen.
Energietransities in de huishoudens, landbouw, dienstensector en ruimteverwarming lijken het
meest rendabel te zijn. In de niet-geëlektrificeerde plattelands huishoudens van India, zou de
elektrificatie van het platteland met decentrale hernieuwbare energie veel goedkoper kunnen zijn
dan elektrificatie met netuitbreidingen of decentrale diesel systemen. Dit is slechts het geval
wanneer hoofdzakelijk op hernieuwbare energie gebaseerde apparaten worden gebruikt zoals
zonnekooktoestellen, biogasfornuizen en zonneboilers. Wanneer echter de elektriciteit ook wordt
gebruikt om te koken, voor verwarming en warm water e.d , stijgen de kosten boven die van de
netuitbreidingen uit. Dit leidt tot de conclusie dat voor processen met een lage energievraag en
kleinschalige processen duurzame energie rendabeler is dan energie uit andere bronnen. Voor
processen die veel energie vragen en grootschalige processen wordt duurzame energie duurder
dan die uit andere bronnen. Als de kosten voor fossiele brandstoffen zouden stijgen of als de
subsidies worden verminderd, dan wordt hierdoor duurzame energie concurrerender. De
olieprijsverhogingen van de laatste tijd tonen aan dat de fossiele brandstofprijzen instabiel zijn
en mogelijk op termijn nog meer zullen stijgen, wat het duurzame energie potentieel kan
vergroten. Verder is het systeem hoogst complex, er bestaan grote onzekerheden en grote
131
regionale verschillen, zoals tussen India en China en tussen plattelandsgebieden en stedelijke
gebieden.
4. Conclusie
Dit proefschrift had als doel a) het bepalen van de verschillen in energiesystemen tussen
ontwikkelingslanden en industrielanden, b) het aanpassen van energiemodellen om hun
geschiktheid voor de zich snel ontwikkelende landen te verhogen en c) het ontwikkelen van
scenario's, m.b.v. deze aangepaste modellen om duurzame energietransities voor de zich snel
ontwikkelende landen te simuleren en de effecten van deze energietransities te beoordelen. De
nadruk van dit proefschrift ligt op China en India.
Als algemene conclusie toont dit proefschrift aan dat a) energiemodellering rekening
moet houden met het groeiende belang van de zich snel ontwikkelende landen en
ontwikkelingslanden. Dit kan worden gedaan door energiemodellen aan te passen aan de
energiesystemen van ontwikkelingslanden zoals in dit proefschrift wordt beschreven Dit
proefschrift toont ook aan dat b) hernieuwbare en schone energie technologieën haalbare opties
zijn voor het beperken van de klimaatverandering door de zich snel ontwikkelende landen zoals
China en India en dat c) deze energietransities naar een duurzame economie mogelijk ook andere
positieve gevolgen voor het milieu en de maatschappij kunnen hebben. Daarom zullen duurzame
energietransities waarschijnlijk positieve gevolgen hebben in de zich snel ontwikkelende landen.
Om een adequate planning van deze energietransities te garanderen is een adequate
energiemodellering nodig die voor ontwikkelingslanden geschikt is.
Aangezien de klimaatverandering een mondiaal probleem is, is het de
verantwoordelijkheid van zowel de zich ontwikkelende landen als ook van de industrielanden om
samen te werken teneinde een duurzame energietoekomst te realiseren. Een dergelijke
samenwerking zou van essentieel belang kunnen zijn voor het succes van het internationale
klimaatbeleid. De energiemodellen die worden aangepast aan de behoeften van
ontwikkelingslanden zullen het succes van de onderhandelingen over het klimaatbeleid
waarschijnlijk kunnen verhogen, aangezien het nuttige hulpmiddelen zijn om de energieplanning
van ontwikkelingslanden te ondersteunen.
132
Kurze Deutsche Zusammenfassung:
Nachhaltige Energie für Entwicklungsländer
- Modellierung von Übergangen zu erneuerbarer und sauberer Energie in
Schwellenländern
Die rasant wachsende Wirtschaft der Schwellenländer China und Indien ist sehr stark abhängig
von fossilen Brennstoffen, besonders von verschmutzender Kohle. Fossile Brennstoffe sind mit
einer Anzahl von Umweltproblemen verbunden, wie zum Beispiel dem globalen Klimawandel,
Raubbau an Ressourcen und Luftverschmutzung. Eine Art und Weise die Abhängigkeit von
fossilen Brennstoffen zu vermindern, ist der Ausbau nachhaltiger kohlenstoffarmer Energie, wie
zum Beispiel erneuerbare Energie (z.B. Solar, Wind, Wasserkraft) und so genannte saubere
Energie, die weniger verschmutzend ist als konventionelle Kohle und Erdöl (z.B. Erdgas,
Atomenergie).
Diese Doktorarbeit befasst sich deshalb mit der Modellierung von Übergängen zu nachhaltiger
Energie für die Schwellenländer China und Indien. Diese Forschung beschäftigt sich mit dem
Chinesischen Elektrizitätssektor, der Wirtschaft von Peking und armen ländlichen Haushalten in
Indien, die keinen Zugang zu Elektrizität haben.
Die meisten der heutigen Energiemodelle sind in und für Industrieländer entwickelt. Diese
Modelle gehen daher oft nur unzureichend auf die sehr unterschiedlichen Energiesysteme von
Entwicklungsländern ein. Diese Forschung hat als Ziel, von den auf Erfahrungen in
Industrieländern basierenden Modellen abzuweichen und Energiemodelle für die spezifischen
Konditionen in Entwicklungsländern anzupassen. Diese verbesserten Modelle werden benutzt,
um Übergänge zu nachhaltigen Energien für China und Indien zu modellieren.
Diese Doktorarbeit deutet auf das hohe Potential zur Verminderung des Klimawandels hin,
welches durch nachhaltige Energien ermöglicht werden kann in China und Indien. Die
Ergebnisse dieser Forschung könnten nützlich sein für Energieexperten, Energiebetriebe und
auch Politiker und Gesetzgeber, die sich mit diesen Themen befassen, vor allem in China und
Indien. Die Ergebnisse dieser Studie könnten ebenfalls dazu beitragen, das nötige Wissen für
nachhaltige nationale Energieplanung in beiden Ländern zu erhöhen. Gleichzeitig könnten die
Ergebnisse notwenige Informationen liefern als Unterstützung für China und Indien für die
internationalen Klimaverhandlungen.
133
List of Abbreviations
CCGT Combined-Cycle-Gas-Turbine
CDM Clean Development Mechanism
CER Certified Emission Reduction
CHP Combined Heat and Power
CNG Compressed Natural Gas
EKC Environmental Kuznets Curve
GDP Gross Domestic Product
GHG Greenhouse Gas
GNI Gross National Income
GNP Gross National Product
IPCC Intergovernmental Panel on Climate Change
GT peak peak Gas Turbines
LED Light Emitting Diode
LDC Load Duration Curve
LOLP Loss-Of-Load-Probability
LPG Liquid Petroleum Gas
MER Market Exchange Rates
NG Natural Gas
NIMBY Not In My BackYard
O&M Operation & Maintenance
PPP Purchasing Power Parity
PV PhotoVoltaic
R&D Research & Development
SHP Small Hydro Power
SMD Simultaneous Maximum Demand
SRES Special Report on Emission Scenarios
TED Technology and Environmental Database
UED Useful Energy Demand
UNFCCC United Nations Framework Convention on Climate Change
WDI World Development Indicators
134
References
Abe, H., Katayama, A., Bhuwneshwar P.S., Toriu, T., Samy, S., Pheach, P., Adams M.A., Grierson, P.F., 2007.
Potential for rural electrification based on biomass gasification in Cambodia. Biomass and Bioenergy, Volume
31(9): 656-664.
Alam, M., Sathaye, J. and Barnes, D., 1998. Urban household energy use in India: efficiency and policy
implications. Energy Policy, Volume 26(11): 885-891.
APERC Asia-Pacific Energy Research Center, 2006. APEC Energy Demand and Supply Outlook 2006.
http://www.ieej.or.jp/aperc/outlook2006.html. Last accessed: 13th
November 2007.
Arnold, J. E. M., Kohlin, G., Persson, R., 2006. Woodfuels, livelihoods, and policy interventions: Changing
Perspectives. World Development, Volume 34(3): 596-611.
Baker and McKenzie (2007) RELaw Assist: Renewable Energy Law in China – Issues Paper.
http://www.frankhaugwitz.info/doks/policy/2007_06_China_RE_Law_Assist_issues_paper_AusAid_CRED_CREI
A_BakerMcKenzie.PDF. Last accessed: 3rd April 2008.
Barnes, D. F., Floor, W. M., 1996. Rural Energy in Developing Countries:: A Challenge for Economic
Development. Annual Review of Energy and the Environment, Volume 21(1): 497-530.
Bashmakov, I., 2007. Three laws of energy transitions, Energy Policy, Vol. 35(7): 3583-3594.
Bastakoti, B.P., 2003 Rural electrification and efforts to create enterprises for the effective use of power. Applied
Energy, Volume 76(1-3): 145-155.
Beaujean, J.M., Charpentier, J.P., Nakicenovic, N., 1977. Global and international energy models: a survey. Annual
Review of Energy, Volume 2, 153–170.
Beeck Van, N., 1999. Classification of Energy Models. Tilburg University, Tilburg.
Beeck Van, N., 2003. A new method for local energy planning in developing countries. Ph.D. Thesis, Tilburg
University, Tilburg.
Beijing Municipal Transportation Commission, 2007. Information on transport modes in Beijing.
http://www.bjjtw.gov.cn/. Last accessed: 12th
December 2007.
Benders, R.M.J., Biesiot, W., 1998. Planning models show comparative results. IEEE, Computer Applications in
Power, Volume 11(1):64-68.
Benders, R.M.J., 1996. Interactive simulation of electricity demand and production. Ph.D. Thesis, University of
Groningen, Groningen.
Benders, R.M.J., Vries De, H.J.M, 1989. Electric Power Planning in a Gaming Context. Simulation and Games,
Volume 20(3):227-244.
Bernardini, O., Galli, R., 1993. Dematerialization: Long-term trends in the intensity of use of materials and energy.
Futures, Volume 25(4): 431-448.
Bhattacharyya, S.C., 1996. Applied general equilibrium models for energy studies: a survey. Energy Economics,
Volume 18, 145–164.
Bhattacharyya, S.C., 2006a. Energy access problem of the poor in India: is rural electrification a remedy? Energy
Policy, Volume 34(18): 3387-3397.
135
Bhattacharyya, S.C., 2006b. Renewable energy and the poor: niche or nexus? Energy Policy, Volume 34(6): 659-
663.
Bigsten, A., Kebede, B., Shimeles, A., Taddesse, M., 2003. Growth and Povety Reduction in Ethopia: Evidence
from Household Panel Surveys. World Development, Volume 31(1): 87-106.
BMBS Beijing Municipal Bureau of Statistics, 2007. Beijing Statistical Yearbook 2006. BMBS, Beijing.
Bollen, J., van der Zwaan, B., Eerens, H. E., Brink, C., 2007. Local Air Pollution and Global Climate Change, A
Combined Cost-Benefit Analysis. Netherlands Environmental Assessment Agency (MNP): 42, Bilthoven.
Boudri, J. C., Hordijk, L., Kroeze, C., Amann, M., Cofala, J., Bertok, I., Junfeng, L., Lin, D., Shuang, Z., Runquing,
H., Panwar, T. S., Gupta, S., Singh, D., Kumar, A., Vipradas, M. C., Dadhich, P., Prasad, N. S., Srivastava, L, 2002.
The potential contribution of renewable energy in air pollution abatement in China and India. Energy Policy,
Volume 30(5): 409-424.
Bouwman, A. F., Hartman, M. P. M., Klein Goldewijk, C. G. M., Eds., 2006. Integrated modelling of global
environmental change. An overview of IMAGE 2.4. MNP, Bilthoven.
Brouwer, R., Falcao, M. P. M. P., 2004. Wood fuel consumption in Maputo, Mozambique. Biomass and Bioenergy,
Volume 27(3): 233-245. Charpentier, J.P., 1974. A review of energy models: No 1. RR-74-10. IIASA, Laxenburg.
Buruku B, 2005. Chinese Renewable Energy Law. Refocus, May/June 2005:56-57.
Castles, I., Henderson, D., 2003. The IPCC Emission Scenarios: An Economic-Statistical Critique, Energy &
Environment, Volume 14(2-3): 159-185.
CEA Central Electricity Authority, 2008. http://cea.nic.in/. Data on Indian electricity sector. Last accessed: 20th
May
2008.
CEC Commission of Environmental Cooperation, DG XI, 1992. Development of a framework for the Evaluation of
Policy Options to deal with the Greenhouse Effect. A scientific description of the ESCAPE model: Version I.I. CEC,
Brussels.
Chakrabarti, S. and Chakrabarti, S., 2002. Rural electrification programme with solar energy in remote region – a
case study in an island. Energy Policy, Volume 30(1): 33-42.
Chakravorty, U., Magné, B., Moreaux, M., 2007. A dynamic model of food and clean energy
Journal of Economic Dynamics and Control. In Press. Doi:10.1016/j.jedc.2007.04.009
Chang, J., Leung, D.Y.C., Wu, C. Z. and Yuan, Z. H., 2003. A review on the energy production, consumption, and
prospect of renewable energy in China. Renewable and Sustainable Energy Reviews: 7(5): 453-468.
Charpentier, J.P., 1975. A review of energy models: No 2. RR-75-35. IIASA, Laxenburg.
Charpentier, J.P., Beaujean, J.M., 1976. A review of energy models: No 3. RR-76-18. IIASA, Laxenburg.
Chaudhuri, K., Schneider, F., Chattopadhyay, S., 2006. The size and development of the shadow economy: An
empirical investigation from states of India. Journal of Development Economics, Volume 80(2): 428-443.
Chontanawat, J., Hunt, J.C., Pierse, P., 2008. Does energy consumption cause economic growth?: Evidence from a
systematic study of over 100 countries. Journal of Policy Modelling, Volume 30: 209–220.
Cleveland, C. J., Ruth, M., 1998. Indicators of Dematerialization and the Materials Intensity of Use.
Journal of Industrial Ecology, Volume 2(3): 15-50.
136
Cypher, J. M., Dietz, J. L., 1997. The Process of Economic Development. Routledge, London.
Devi, R., Singh,V., Dahiya, R.P. and Kumar, A., 2007. Energy consumption pattern of a decentralized community in
northern Haryana. Renewable and Sustainable Energy Reviews, in press.
DFID Department For International Development, 2002. Energy for the Poor: Underpinning the Millenium
Development Goals. http://www.DFID.gov.uk/pubs/files/energyforthepoor.pdf. Last accessed: 14th
May 2008.
Dijkstra, T., 2007. Photovoltaic panels as an alternative to fossil fuel energy sources in rural areas of India. IVEM
student report. IVEM, University of Groningen, Groningen.
Edmonds, J., Wise, M., Pitcher, H., Richels, R., Wigley, T., MacCracken, C., 1997. An integrated assessment of
climate change and the accelerated introduction of advanced energy technologies—an application of MiniCAM 1.0.
Mitigation and adaptation strategies for global change, Volume 1, 311–339.
Edmonds, J., Pitcher, H., Sands, R., 2004. Second Generation Model 2004: An Overview. JGCRI, College Park.
Ehrlich, P.R., Holdren, J.P., 1971. Impacts of Population Growth. Science, Volume 171: 1212-1217.
EIA Energy Information Administration, 2007. Assumptions to the annual energy outlook 2007. Report #DOE/EIA-
0554. http://www.eia.doe.gov/oiaf/aeo/assumption/pdf/electricity.pdf#page=3. Last accessed: 31st May 2007.
Elzen, den M., Höhne, N., Moltmann, S., 2008. The Triptych approach revisited: A staged sectoral approach for
climate mitigation. Energy Policy, Volume 36(3):1107-1124.
Enercon, 2007. Windblatt 4/2007. E-126 prototype: The world‘s most powerful wind
turbine installed near Emden.
http://www.enercon.de/www/en/windblatt.nsf/vwAnzeige/66BD14BABA22BCA2C12573A7003FA82E/$FILE/WB
-0407-en.pdf. Last accessed: 27th August 2008.
EPA Environmental Protection Agency, 1990. Policy options for stabilizing global climate: Report to Congress.
Technical Appendices. EPA Doc: EPA-600/8-90-079. EPA, Washington, DC.
ERI Energy Research Institute, 2003. China's sustainable energy future: Scenarios of Energy and Carbon Emissions.
ERI, Beijing. ERI, 2003.
ESMAP, 2003. India: Access of the poor to clean household fuels. ESMAP report 263/03. World Bank.
ETSAP Energy Technology Systems Analysis Programme, 2002. Description of MARKAL model.
http://www.etsap.org/markal/main.htmlS. Last accessed: 15th
October 2005.
Evans, A., Strezov, V., Evans, T.J., 2008. Assessment of sustainability indicators for renewable energy technologies.
Renewable and Sustainable Energy Reviews, DOI: 10.1016/j.rser.2008.03.008.
FAO Food and Agricultural Organisation, 2005. FAO Statistics Database (FAOSTAT). http://faostat.fao.org/
Last accessed: 23rd
June, 2008.
Fearnside, 2002. Greenhouse Gas emissions from a hydroelectric reservoir (Brazil‘s Tucurui dam) and the energy
policy implications. Water, Air and Soil Pollution, Vol. 133: 69-96.
Focacci, A., 2005. Emperical analysis of the environmental and energy policies in some developing countries using
widely employed macroeconomic indicators: the cases of Brazil, China and India. Energy Policy, Volume 33: 543
554.
Fonkych, K., Lempert, R., 2005. Assessment of Environmental Kuznets Curves and Socioeconomic Drivers in
137
IPCC's SRES Scenarios. The Journal of Environment Development, Volume 14(1): 27-47.
Ghali, K. H., & El-Sakka, M. I. T., 2004. Energy use and output growth in Canada: A multivariate cointegration
analysis. Energy Economics, Volume 26: 225–238.
Glomm, G., 1997. Whatever happened to the Kuznets curve? Is it really upside down? Journal of Income
Distribution, Volume 7(1): 63-87.
Goldemberg, J., 2000. Rural energy in developing countries. World Energy Assessment, Energy and the Challenge
of Sustainability. UNDP, New York.
Greenpeace, 2006a. Greenpeace Reacts To International Energy Agency: Nuclear Power Irrelevant In Solving
World Energy Problems. http://www.greenpeace.org/international/press/releases/greenpeace-reacts-to-internati. Last
accessed: 9th September 2007.
Greenpeace, 2006b. Nuclear waste management. The lesson from the CSM disposal site.
http://www.greenpeace.org/raw/content/international/press/reports/nuclear-waste-management-
the.pdf. Last accessed: 9th September 2007.
Grubler, A., 2002. Trends in Global Emissions: Carbon, Sulfur, and Nitrogen. Encyclopedia of Global
Environmental Change. T. Chichester, John Wiley & Sons Ltd., Munn.
Grubler, A., Nakicenovic, N., Alcamo, J., Davis, G., Fenhann, J., Hare, B., Mori, S., Pepper, B., Pitcher, H., Riahi,
K., Rogner, H. H., Rovere, E. L. L., Sankovski, A., Schlesinger, M., Shukla, P. R., Swart, R., Victor, N., Jung, T. Y.,
2004. Emissions Scenarios: A Final Response, Energy & Environment, Volume 15(1): 11-24.
Gupta, G. and Köhlin, G., 2006. Preferences for domestic fuel: Analysis with socio-economic factors and rankings
for Kolkata, India. Ecological Economics, Volume (57): 107-121.
Guo, B., Wang, Y. and Zhang, A., 2003. East Asia Energy Futures (EAEF)/Asia Energy Security Project. Energy
Paths Analysis/Methods Training Workshop, Vancouver.
Halsnæs, K., Kühl, J., Olesen, J., 2007. Turning climate change information into economic and health impacts.
Climatic Change, Volume 81: 145-162.
Holdren, J. P., Smith, K. R., 2000. Energy, the environment and health. World Energy Assessment, Energy and the
Challenge of Sustainability. UNDP, New York.
Hoogwijk, M.M., 2004. On the Global and Regional Potential of Renewable Energy Sources. Ph.D. Thesis.
University of Utrecht, Utrecht.
Hosier, R. H., Dowd, J., 1987. Household fuel choice in Zimbabwe : An empirical test of the energy ladder
hypothesis. Resources and Energy, Volume 9(4): 347-361.
Hulme, M., Raper, S.C.B., Wigley, T.M.L., 1995. An integrated framework to address climate change (ESCAPE)
and further developments of the global and regional climate modules (MAGICC). Energy Policy, Volume 23(4/5):
347-355.
Hulme, M., 1992a. A Scientific Description of the ESCAPE Software. Climatic Research Unit, Norwich.
Hulme, M., 1992b. A User Manual for the ESCAPE Software. Climatic Research Unit, Norwich.
IEA International Energy Agency, 2008. IEA Statistics. http://www.iea.org/Textbase/stats/index.asp
Last accessed: 17th
June 2008.
IEA International Energy Agency, 2007. World Energy Outlook 2007. OECD/IEA, Paris
138
IEA International Energy Agency, 2006. World Outlook 2006. OECD/IEA, Paris
IEA International Energy Agency, 2005. World Energy Model 2005. OECD/IEA, Paris.
IEA International Energy Agency, 2004. World Energy Outlook 2004. OECD/IEA, Paris.
IEA International Energy Agency, 2002a. World Energy Outlook 2002. Energy and Poverty. IEA/OECD, Paris.
IEA International Energy Agency, 2002b. Electricity in India: Providing Power for the Millions. OECD/IEA, Paris.
Ignaciuk, A., Vöhringer, F., Ruijs, A., Van Ierland, E.C., 2006. Competition between biomass and food production
in the presence of energy policies: a partial equilibrium analysis. Energy Policy, Volume 34(10): 1127-1138.
IIASA Institute for Applied System Analysis, 2005. Model for energy supply strategy alternatives and their general
environmental impact (MESSAGE). Model Description.
http://www.iiasa.ac.at/Research/ECS/docs/models.html/#MESSAGE. Last accessed: 27th
Januar 2006.
IMAGE-team, 2001. The IMAGE 2.2 implementation of the IPCC/SRES scenarios. A comprehensive analysis of
emissions, climate change and impacts in the 21st century. RIVM, Bilthoven.
INET Institute of Nuclear and New Energy Technology, 2004. China Energy Outlook 2004. Tsinghua University
Press, Beijing.
IPCC Intergovernmental Panel on Climate Change, 2007a. Fourth Assessment Report of the Working Group III:
"Mitigation of Climate Change". Chapter 4, p. 253. http://www.ipcc.ch/ipccreports/ar4-wg3.htm
Last accessed: 2nd
January 2008.
IPCC Intergovernmental Panel on Climate Change, 2007b. Fourth Assessment Report of the Working Group I: "The
Physical Science Basis". http://www.ipcc.ch/ipccreports/ar4-wg1.htm. Last accessed: 2nd
January 2008.
IPCC Intergovernmental Panel on Climate Change, 2007c. Fourth Assessment Report of the Working Group II:
"Impacts, Adaptation and Vulnerability". http://www.ipcc.ch/ipccreports/ar4-wg2.htm. Last accessed: 2nd
January
2008.
IPCC Intergovernmental Panel on Climate Change, 2006. IPCC Guidelines for National Greenhouse Gas
Inventories. Volume 1. http://www.ipcc-nggip.iges.or.jp/public/2006gl/index.htm. Last accessed on 11th
December
2007.
IPCC Intergovernmental Panel on Climate Change, 2005. IPCC Special Report on Emissions Scenarios (SRES). The
multiregional approach for resource and industry allocation model (MARIA).
http://www.grida.no/climate/ipcc/emission/153.htm. Last accessed on 13th
December 2005.
IPCC Intergovernmental Panel on Climate Change, 2000a. Special Report on Emision Scenarios. Cambridge,
Intergovernmental Panel on Climate Change (SRES). Cambridge University Press, Cambridge.
IPCC Intergovernmental Panel on Climate Change, 2000b. SRES final data access, Center for International Earth
Science Information Network CIESIN. http://sres.ciesin.columbia.edu/. Last accessed: 23rd
June 2008.
IPCC Intergovernmental Panel on Climate Change, 1996. Revised 1996 IPCC Guidelines for National Greenhouse
Gas Inventories. Volume 3: Reference Manual. Intergovernmental Panel for Climate Change.
IVEM Institute for Energy and Environmental Studies, 2006. Description of PowerPlan.
http://www.rug.nl/ees/onderzoek/ivem/publicaties/software/PowerPlan. Last accessed: 2nd
February 2006.
JGCRI Joint Global Change Research Institute, 2006. Brief overview of the second generation model
(SGM).http://www.globalchange.umd.edu/?models&page=sgm. Last accessed: 22nd
April 2006.
139
Jung, T.Y., La Rovere, E.L., Gaj, H., Shukla, P.R., Zhou, D., 2000. Structural changes in developing countries and
their implication for energy-related CO2 emissions. Technological Forecasting and Social Change, Volume 63, 111–
136.
Kadian, R., Dahiya, R.P. and Garg, H.P., 2007. Energy-related emissions and mitigation options from the household
sector in Delhi. Energy Policy, Volume 35(12): 6195-6211.
Kahn, M.E., Pfaff, A.S.P., 2000. Informal economies, information and the environment. Journal of International
Affairs, Volume 53, 525–544.
Kainuma, M., Matsuoka, Y., Morita, T., 2003. Climate Policy Assessment. Asia-Pacific Integrated Modelling.
Springer, Tokyo.
Kainuma, M., Matsuoka, Y., Morita, T., 2005. Asian-Pacific Integrated Model: Introduction. http://www-
iam.nies.go.jp/aim/information.htm. Last accessed on 5th
May 2006.
Kander, A., 2002. Economic Growth, Energy Consumption and CO2 emissions in Sweden 1800-
2000. Almqvist & Wiksell International, Stockholm.
Kander, A., 2005. Baumol's disease and dematerialization of the economy. Ecological Economics, Volume 55(1):
119-130.
Kanoria, H., 2006. Financing the end users of solar energy systems. In: Sastry, E.V.R., Reddy, D.N. (Eds.),
International Congress on Renewable Energy ICORE 2006 Proceedings. Allied Publishers Pvt. Ltd., Hyderabad,
pp.186–190.
Kituyi, E., Marufu, L., Huber, B., O. Wandiga, S., O. Jumba, I., O. Andreae, M., Helas, G., 2001. Biofuel
consumption rates and patterns in Kenya. Biomass and Bioenergy, Volume 20(2): 83-99.
Kooijman, A., 2005. Energy choices in SME‘s in rural areas. UNDP expert meeting on Productive Uses of
Renewable Energy, Bangkok.
Kuznets, S., 1955. Economic Growth and Income Inequality. The American Economic Review, Volume 45(1): 1-28.
Lafrance, R., Schembri, L., 2002. Purchasing Power Parity: Definition, Measurement and Interpretation. Bank of
Canada Review.
Larson, E.D., Zongxin, W., DeLaquil, P., Wenying, C., Pengfei, G., 2003. Future implications of China's energy
technology choices. Energy Policy, Volume 31:1189-1204.
LBNL Lawrence Berkeley National Laboratory, 2004. China Energy Databook, Version 6.0. Lawrence Berkeley
National Laboratory, Berkeley.
Lee, T.J., Lee, K.H., Oh, K.B., 2007. Strategic environments for nuclear energy innovation in the next half century.
Progress in Nuclear Energy, Volume 49(5): 397-408.
Li, J., Wang, Z., and Shi, J., 2005. China review: Status and potential of renewable energy in China. Refocus: 6(6),
42-4.
Liming, H, 2008. Financing rural renewable energy: A comparison between China and India. Renewable and
Sustainable Energy Reviews, doi:10.1016/j.rser.2008.03.002.
Lin, J., Zhou, N., Levine, M.D., Fridley, D., 2006. Achieving China‘s Target for Energy Intensity Reduction in
2010: An Exploration of Recent Trends and Possible Future Scenarios. China Energy Group, Environmental Energy
Technologies Division, Lawrence Berkeley National Laboratory, Berkeley.
140
Lindmark, M., 2004. Patterns of historical CO2 intensity transitions among high and low-income countries.
Explorations in Economic History, Volume 41(4): 426-447.
Lofgren, H., Richards, A., 2003. Food security, poverty, and economic policy in the Middle East and North Africa.
Research in Middle East Economics, volume 5: 1-31.
Lucon, O., Painuly, J. P., Fifita, S., Arvizu, D. E., Tsuchiya, H., Wohlgemuth, N., 2006. Is
renewable energy cost-effective? Natural Resources Forum, Volume 30(3): 238-240.
Lysen, E.H., 1996. The Trias Energica: Solar Energy Strategies for Developing Countries. NOVEM, Utrecht.
http://www.senternovem.nl/mmfiles/Trias%20Energica%20Eurosun961_tcm24-187424.pdf
Last accessed: 16th June 2008.
Martinot, E., 2008. Renewable Energy in China. Future Development Targets. http://www.martinot.info/china.htm.
Last accessed: 4th April 2008.
Martins, J., 2005. The Impact of the Use of Energy Sources on the Quality of Life of Poor Communities. Social
Indicators Research, Volume 72(3): 373-402.
Masera, O. R., Saatkamp, B. D., Kammen, D. M., 2000. From Linear Fuel Switching to Multiple Cooking
Strategies: A Critique and Alternative to the Energy Ladder Model. World Development, Volume 28(12): 2083
2103.
Meier, P.M., 1984. Energy Systems Analysis for Developing Countries. Springer, Berlin.
Ministry of Power of India, 2008. http://www.powermin.nic.in/. Data on Indian electricity sector. Last accessed: 20th
May 2008.
MNES Ministry of New and Renewable Energy, 2008. www.mnes.nic.in/. Data on renewable energy in India. Last
accessed: 20th
May 2008.
Mori, S., 2000. The development of greenhouse gas emissions scenarios using an extension of the MARIA model
for the assessment of resources and energy technologies. Technological Forecasting and Social Change, Volume 63,
289–311.
Mosley, S., 2001. The Chimney of the World: A History of Smoke Pollution in Victorian and Edwardian
Manchester. The White Horse Press, Isle of Harris.
Mulugetta, Y., Nhete, T., Jackson, T., 2000. Photovoltaics in Zimbabwe: lessons from the GEF Solar project.
Energy Policy, Volume 28(14): 1069-1080.
Nakicenovic, N., Riahi, K., 2003. Model Runs with MESSAGE in the Context of the Further Developments of the
Kyoto-Protocol. WBGU Special Assessment Report. IIASA, Laxenburg.
National People‘s Congress of China, 2005. The Renewable Energy Law of the People‘s Republic of China.
http://www.martinot.info/China_RE_Law_Beijing_Review.pdf. Last accsssed: 31st March 2008.
Nature, 2008. China declares ambitious alternative-energy plans. Nature, Volume 452:399.
NBS National Bureau of Statistics of China, 2007. China Statistical Yearbook 2006. NBS, Beijing.
NDRC National Development and Reform Commission of China, 2007.
Medium and Long-Term Development Plan for Renewable Energy in China (Abbreviated Version, English Draft).
http://www.martinot.info/China_RE_Plan_to_2020_Sep-2007.pdf. Last accessed: 3rd April 2008.
141
NEA Nuclear Energy Agency, 2002. Society and Nuclear Energy; Towards a Better Understanding. OECD/NEA,
Paris.
Nonhebel, S., 2007. Energy from agricultural residues and consequences for land requirements for food production.
Agricultural Systems, Volume 94(2): 586-59.
Nonhebel, S., 2005. Renewable energy and food supply: will there be enough land? Renewable & Sustainable
Energy Reviews, 9: 191-201.
Nordhaus, W., 2007. Alternative measures of output in global economic-environmental models: Purchasing power
parity or market exchange rates? Energy Economics, Volume 29(3): 349-372.
Nouni, M.R., Mullick, S.C. and Kandpal, T.C., 2008. Providing electricity access to remote areas in India: An
approach towards identifying potential areas for decentralised electricity supply. Renewable and Sustainable Energy
Reviews, Volume 12(5): 1187-1220.
O'Brien, K., Leichenko, R., Kelkar, U., Venema, H., Aandahl, G., Tompkins, H., Javed, A.,Bhadwal, S., Barg, S.,
Nygaard, L., West, J., 2004. Mapping vulnerability to multiple stressors: climate change and globalization in India.
Global Environmental Change Part A, Volume 14(4): 303-313.
Pandey, R., 2002. Energy policy modelling: agenda for developing countries. Energy Policy, Volume 30(2): 97-106.
Pachauri, S., 2007. An energy analysis of household consumption: Changing patterns of direct and indirect use in
India. Springer.
Pachauri, S, 2004. An analysis of cross-sectional variations in total household energy in requirements in India using
micro survey data. Energy Policy, Volume 32(15): 1723-1735.
Pachauri, S., Mueller, A., Kemmler, A. and Spreng, D., 2004. On Measuring Energy Poverty in Indian Households.
World Development, Volume 32(12): 2083-2104.
Philippe, C., 2007. Clean and sustainable energy technologies development in Beijing between 2005 and 2010.
Tsinghua University, Beijing / MINES, Paris.
Puri, S., 2006. Bridging the divide: The role of renewable energy-based rural electrification in India. Refocus,
Volume 7(4): 40-2.
Reddy, B.S. and Balachandra, P., 2006. Dynamics of technology shifts in the household sector – implications for
Clean Development Mechanism. Energy Policy, Volume 34(16): 2586-2599.
Reddy, B.S., 2003. Overcoming the energy efficiency gap in India‘s household sector. Energy Policy, Vol. 31:
1117-1127.
Reddy, A. K. N., 2000. Energy and social issues. World Energy Assessment, Energy and the Challenge of
Sustainability. UNDP, New York.
RETScreen International, 2005a. RETScreen Clean Energy Project Analysis Tool.
http://www.retscreen.net/ang/home.php. Last accessed: 7th
April 2006.
RETScreen International, 2005b. RETScreen User Manual. http://www.retscreen.net/ang/d_t_guide.php
Last accessed: 7th
April 2006.
RIVM National Institute for Public Health and the Environment, 2001. IMAGE/TIMER Model on CD-ROM.
RIVM, Bilthoven.
Rogner, H.-H., 1997. An Assessment of World Hydrocarbon Resources. Annual Review of Energy and the
142
Environment 22(1): 217-262.
Rosa, L.P., Dos Santos, M.A., Matvienko, B., Dos Santos, E.O., Sikar, E., 2004. Greenhouse Gas Emissions from
Hydroelectrical Reservoirs in Tropical Regions. Climatic Change, Vol. 66 (1-2): 9-21.
Rotmans, J., Hulme, M., Downing, T.E., 1994. Climate change implications for Europe. An application of the
ESCAPE model. Global Environmental Change, Volume 4(2): 97-124.
Rozelle, S., Park, A., Benziger, V., Ren, C., 1998. Targeted poverty investments and economic growth in China.
World Development, Volume 26 (12): 2137-2151.
Saith, A., 1983. Development and distribution: A critique of the cross-country U-hypothesis. Journal of
Development Economics, Volume 13(3): 367-382.
Sarmah, R., Bora, M.C. and Bhattacharjee, D.J., 2002. Energy profiles of rural domestic sector in six
un-electrified villages of Jorhat district of Assam. Energy, Volume 27(1): 17-24.
Schenk, N.J., 2006. Modelling energy systems: a methodological exploration of integrated resource management.
Ph.D. Thesis, University of Groningen, Groningen.
Schneider, F., 2006. Personal Communication. Johannes Kepler University of Linz, Austria.
Schneider, F., 2005. Shadow economies around the world: what do we really know? European Journal of Political
Economy, Volume 21, 598–642.
Schneider, F., Enste, D.H., 2000. Shadow economies: size, causes and consequences. Journal of Economic
Literature, Volume 38, 77–114.
Schramm, G., 1990. Electric power in developing countries: status, problems, prospects. Annual Review of Energy,
Volume 15, 307–333.
SEDAC SocioEconomic Data and Applications Center, 1996a. Thematic Guide to Integrated Assessment
Modelling: The Atmospheric Stabilization Framework (ASF) Model.
http://sedac.ciesin.columbia.edu/mva/iamcc.tg/TGsec4-2-13.html. Last accessed: 5th
May 2006.
SEDAC SocioEconomic Data and Applications Center, 1996b. Technical Description of MiniCAM.
http://sedac.ciesin.columbia.edu/mva/minicam/MCTech.html. Last accessed: 19th
April 2006.
SEI Stockholm Environmental Institute, 2007a. LEAP: History and Credits.
http://www.energycommunity.org/default.asp?action=75. Last accessed on 3rd
November 2007.
SEI Stockholm Environmental Institute, 2007b. Introduction to LEAP. TED: The Technology and Environmental
Database. http://www.energycommunity.org/default.asp?action=47. Last accessed on 19th
November 2007.
SEI Stockholm Environmental Institute, 2006a. LEAP User Guide.
http://www.energycommunity.org/documents/Leap2006UserGuideEnglish.pdf. Last accessed on 3rd
May 2008.
SEI Stockholm Environmental Institute, 2006b. LEAP Software Documentation.
http://forums.seib.org/leap/default.asp?action=47. Last accessed: 3rd
May 2006.
Seebregts, A.J., Goldstein, G.A., Smekens, K., 2001. Energy/Environmental Modelling Using the MARKAL Family
of Models. http://www.uni-duisburg.de/or2001/pdf/Sek%2002%20 %20Seebregts%20Goldstein%20Smekens.pdf
Last accessed: 14th
March 2006.
Shukla, P.R., 1995. Greenhouse gas models and abatement costs for developing nations. A Critical Assessment,
Energy Policy, Volume 8, 677–687.

143
Sinha, C.S. and Kandpal, T.C., 1991. Decentralized v grid electricity for rural India: The economic
factors. Energy Policy, Volume 19(5): 441-8.
Sluijs Van der, J. P., Potting, J., Risbey, J., Vuuren Van, D., de Vries, B., Beusen, A., Heuberger, P., Quintana, S.
C., Funtowicz, S., Kloprogge, P., Nuijten, D., Petersen, A., Ravetz, J., 2001. Uncertainty assessment of the IMAGE
TIMER B1 CO2 emissions scenario, using the NUSAP method. Dutch National Research Program on Climate
Change: 225.
Smith, K. R., Apte, M. G., Yuqing, M., Wongsekiarttirat, W., Kulkarni, A., 1994. Air pollution and the Energy
Ladder in Asian cities. Energy, Volume 19(5): 587-600.
Smith, S., Pitcher, H., Wigley, T., 2005. Future Sulfur Dioxide Emissions. Climatic Change, Volume 73(3): 267-
318.
Srivastava, L., Misra, N., 2007. Promoting regional energy co-operation in South Asia. Energy Policy, Volume
35(6): 3360-3368.
Stern, D. I., 2004. The Rise and Fall of the Environmental Kuznets Curve. World Development, Volume 32(8):
1419-1439.
Storchmann, K., 2005. Long-Run Gasoline demand for passenger cars: the role of income distribution. Energy
Economics, Volume 27(1): 25-58.
Study Team of the Development Strategy of Renewable Energy in Beijing DSRE, 2006. Beijing Renewable Energy
Development Study. Tsinghua University, Beijing.
Top, N., Mizoue, N., Kai, S., Nakao, T., 2004. Variation in woodfuel consumption patterns in response to forest
availability in Kampong Thom Province, Cambodia. Biomass and Bioenergy,
Volume 27(1): 57-68.
UN United Nations, 1998. Kyoto Protocol to the United Nations Framework Convention on Climate Change, Article
10, p.9. http://unfccc.int/resource/docs/convkp/kpeng.pdf. Last accessed: 7th
January 2008.
UN United Nations, 1987. Report of the World Commission on Environment and Development. General Assembly
Resolution 42/187, p.1. http://www.un.org/documents/ga/res/42/ares42-187. html. Last accessed: 7th
January 2008.
UNDP United Nations Development Programme, 2008. Human Development Report 2007/08. Energy and the
environment. Electrification rates. http://hdrstats.undp.org/indicators/210.html. Last accessed: 19th
August 2008.
UN PRB, United Nations Population Reference Bureau, 2006. World population Data Sheet. United Nations´
Population Reference Bureau, Washington.
Urban, F., Moll, H.C., Benders, R.M.J., 2006. Modelling transitions to renewable energy in developing countries. In:
Sastry, E.V.R., Reddy, D.N. (Eds.), International Congress on Renewable Energy ICORE 2006 Proceedings. Allied
Publishers Pvt. Ltd., Hyderabad, pp. 497–502.
Varun, S.K.S., 2007. Review of augmentation of energy needs using renewable energy sources in India. Renewable
and Sustainable Energy Reviews, Volume 11(7): 1607-1615.
Victor, N.M., Victor, D.G., 2002. Macro Patterns in the Use of Traditional Biomass Fuels. Program on Energy and
Sustainable Development. Stanford University, Stanford.
Viguier, L.L., 2004. A proposal to increase developing country participation in international climate policy.
Environmental Science & Policy, Volume 7, 195–204.
144
Viswanathan, B. and Kumar, K.S.K., 2005. Cooking fuel use pattern in India: 1983-2000. Energy Policy, Volume
33(8): 1021-1036.
Vries, De H. J. M., Revi, A., Bhat, G. K., Hilderink, H., Lucas, P. L., 2007. India 2050: scenarios for an uncertain
future. MNP, Bilthoven.
Vries De, H.J.M., Vuuren van, D., Elzen den, M. and Janssen, M., 2001. The TIMER-Image Energy Regional
(TIMER) Model. National Institute for Public Health and the Environment RIVM, Bilthoven: 188.
Vries De, H.J.M., Benders, R.M.J., 1994. Powerplan: an Interactive Simulation Tool to Explore Electric Power
Planning Options. In: Almeida AT (ed) NATO ASI series E Applied Sciences, Kluwer Academic Publishers,
Dortrecht.
Vries De, H.J.M., Dijk D., Benders R.M.J., 1991. PowerPlan: an interactive simulation model about electric power
planning. Report 45, IVEM, University of Groningen.
Vries De, H.J.M., 1990. Energy and environmental consequences and prospects, Taiwan's miracle. Energy Policy,
Volume 18(10):949-961.
Vuuren Van, D.P, Elzen den, M., Lucas, P., Eickhout, B., Strengers, B., van Ruijven, B., Wonink, S. Houdt van, R.,
2007. Stabilizing greenhouse gas concentrations at low levels: an assessment of reduction strategies and costs.
Climatic Change, Volume 81(2): 119-159.
Vuuren Van, D.P, Alfsen, K., 2006. PPP Versus MER: Searching for Answers in a Multi-Dimensional Debate.
Climatic Change, Volume 75(1): 47-57.
Vuuren Van, D. P., Cofala, J., Eerens, H. E., Oostenrijk, R., Heyes, C., Klimont, Z., den Elzen, M. G. J., Amann,
M., 2006. Exploring the ancillary benefits of the Kyoto Protocol for air pollution in Europe. Energy Policy, Volume
34(4): 444-460.
Vuuren, Van, D. P., Strengers, B. J., Vries De, H. J. M., 1999. Long-term perspectives on world metal use-a system
dynamics model. Resources Policy, Volume 25(4): 239-255.
Wang, Y., 2007. Energy-related objectives of China‘s 11th
Five-Year Plan and Estimates on Beijing‘s energy-
economic development by government officials and experts. Personal communication.
Wang, T., Watson, J., 2007. Who owns China‘s carbon emissions? Tyndall Briefing Note No 23. Tyndall Centre for
Climate Change Research, Brighton.
WEC World Energy Council, 2005. The Challenge of Rural Energy Poverty in Developing Countries.
http://www.worldenergy.org/ wec-geis/publications/reports/rural/exec_summary/exec_summary.asp
Last accessed: 10th
April 2006.
WEC World Energy Council, 2004. Survey of Energy Resources for China. http://www.worldenergy.org/wec-
geis/publications/reports/ser04/countries.asp. Last accessed: 23st April 2007.
WEC World Energy Council, 2001. Living in one world: sustainability from an energy perspective. World Energy
Council, London.
WEC World Energy Council, 2000. Energy for tomorrow‘s world – acting now. World Energy Council, London.
Werff Van der, R., Benders, R.M.J., 1987. Power planning in India. Adaptment of a simulation model to the
electricity supply system in the state Maharashtra. IVEM Work Report no.6. IVEM, University of Groningen,
Groningen.
145
WHO World Health Organisation, 2006. Indoor air pollution. Fuel for life: household energy and health.
http://www.who.int/indoorair/publications/fuelforlife/en/index.html. Last accessed: 30th
April 2008.
WHO World Health Organisation, 2005. Indoor air pollution and health.
http://www.who.int/mediacentre/factsheets/fs292/en/. Last accessed: 2nd
January 2008.
WHO World Health Organisation, 2000. Addressing the Links between Indoor Air Pollution, Household Energy and
Human Health. WHO, Washington D.C.
World Bank, 2004-2008. World Development Indicators. CD, Data Query and Quick Query. http://ddp-
ext.worldbank.org/ext/DDPQQ/member.do?method=getMembers
Last accessed: 7th
June 2008.
World Bank, 2007. Beijing Renewable Energy Development Study. Tsinghua University, Beijing.
World Nuclear Association, 2008. Nuclear Power in China. http://www.world-nuclear.org/info/inf63.html, p.1. Last
accessed: 30th June 2008.
Yamin, F., 2007. Strengthening the capacity of developing countries to prepare for and participate in negotiations on
future actions under the UNFCC and its Kyoto Protocol. The BASIC Project Final Report. IDS, Brighton.
Yao, S., Zhang, Z., Hanmer, L., 2004. Growing inequality and poverty in China. China Economic Review, Volume
15, 145–163.
Xiaohua, W., Zhenmin, F., 2005. Study on affecting factors and standard of rural household energy consumption in
China. Renewable and Sustainable Energy Reviews, Volume 9(1): 101-110.
Xinhua, 2007a. Millions more face relocation from Three Gorges Reservoir Area.
http://news.xinhuanet.com/english/2007-10/11/content_6864252.htm. Last accessed: 7th January 2008.
Xinhua, 2007b. China warns of environmental "catastrophe" from Three Gorges Dam.
http://news.xinhuanet.com/english/2007-09/26/content_6796234.htm. Last accessed: 7th January 2008.
Xu Yi-chong, 2002. Powering China. Reforming the electric power industry in China. Ashgate Publishing Limited,
Hants.
Xu Yi-chong, 2005. The myth of a single solution: electricity reforms and the World Bank. Energy, Volume 31,
802–814.
Zhang, S., Jiang, K., Deshun, L., 2007. Passenger transport modal split based on budgets and implication for energy
consumption: Approach and application in China. Energy Policy, Volume 35( 9): 4434-444.
Zhang, X. and Martinot, E., 2007. The Role of Renewable Energy Development in China‘s Energy System
Transformation. Submitted to International Journal of Energy.
Zhang, Z.X., 2000. Can China afford to commit itself an emissions cap? An economic and political analysis. Energy
Economics, Volume 22, 587-614.