sustainable growth through asv - ajinomoto.com thailand more talent diversity ... contribute to the...
TRANSCRIPT

Ajinomoto Co., Inc. (2802)
FY2017–2019 (for 2020) Medium-Term Management PlanProgress and Prospects Going Forward
Takaaki NishiiPresident & CEO
May 10, 2018

Contents
I. FY2017–2019 (for 2020) Medium-Term Management Plan
II. Growth Strategy and Structural Reform
III. FY2018 Financial Strategy
Reference Material
Appendix: Consolidated Results FY2017 Ended March 31, 2018
FY2018 Forecast by Segment
Note: Business profit (consolidated) in this material:
Sales - Cost of sales - Selling expenses, Research & development expenses and General & administrative expenses + Share of profit of associates and joint ventures

0
20
40
60
80
100
120
140
0
500
1,000
1,500FY16
Actual
FY17
Actual
FY18
Forecast
FY19
Projected
FY19
Plan
(¥ bil.)(¥ bil.)
Sales (left scale) Business profit (rignt scale) Profit attributable to owners of the parent company (right scale)
(+5%)(+2%)
(+5%)
(+5%)
(+12%)
(+0%)
(+14%) (+0%) (+6%) 65.8
1,311.2
1,150.2
96.8
1,091.1
97.3
53.060.7
103.0
124.0
61.0
FY16Actual
FY17Actual
FY18Forecast
FY19Projected
FY19Plan
ROE 8.7% 9.7% 9.5% 9.8% 9.8%
EPS ¥92.81 ¥106.84 ¥110.09 ¥118.09 ¥116.71
FY2017 had increased sales and profit was level with the previous year, but businesses with issues were apparent. In FY2018 we will continue to expand businesses with good performance and complete the reorganization of businesses with issues and progress rapidly in FY2019. We project to achieve the FY2017–2019 MTP sales and business profit one year late.
Copyright © 2018 Ajinomoto Co., Inc. All rights reserved. 1
1,184.0
I-1. Progress on the FY2017–2019 (for 2020) Medium-Term Management Plan
64.7
116.0
1248.0% (YoY change)

2Copyright © 2018 Ajinomoto Co., Inc. All rights reserved.
96.8
3.6 1.5 0.1
102.0
0.1 -1.3 -3.5
0.0
97.3
70
75
80
85
90
95
100
105
110
FY16actual
Businessfactors
Fermentationraw materials
and fuel prices
Exchange rate(translations +
trade)
FY17 forecast Businessfactors
特殊要因 Fermentationraw materials
and fuel prices
Exchange rate(translations +
trade)
FY17 actual
(¥ Billion)Primarily write-down ofinventory at affiliated companies related to the packaging business
FY16actual
Business factors
Fermentationraw materials, fuel prices, etc.
Exchange rate(translations +
trade)
FY17forecast
(announced Nov. 2017)
Business factors
Fermentationraw materials, fuel prices, etc.
Exchange rate
(translations +trade)
FY17actual
Special factors
I-2. Factors Influencing FY2017 Business Profit (vs. forecast)
Exchange rate$=110.0
Exchange rate$=108.3
Average exchange rate
$=110.8
Steep increase of main fermentation raw material prices

97.3
9.0
5.7 -8.2 -0.8
103.0
7.9 2.0 0.1
116.0 124.0
70
80
90
100
110
120
130
FY17actual
Businessfactors
Costreductions and
priceincreases
Fermentationraw materialsand fuel prices
Exchange rate(translations +
trade)
FY18forecast
Businessfactors
Fermentationraw materials
and fuel prices
Exchange rate(translations +
trade)
FY19projected
FY19 plan
(¥ Billion)
FY2018 forecast, FY2019 projection & plan
3Copyright © 2018 Ajinomoto Co., Inc. All rights reserved.
+12%+5%
・Resolution of business issues・Organic growth
Exchange rate$=110.0
Exchange rate$=100.0
I-3. Factors Influencing FY2018 Business Profit (YoY)
Includes improvement of business issues
Fermentationraw materials,
fuel prices, etc.
Exchange rate(translations +
trade)
Primarily cost reductions
FY19plan

(¥ Billion) -: lossesFY18
ForecastFY17Actual
Difference Main factors
Sales 1,184.0 1,150.2 33.7
Business profit 103.0 97.3 5.6FY17 actual: Share of profit of associates and joint ventures3.9
Other operating income & expenses (-: losses) -5.7 -14.0 8.3
Impairment losses - -11.6 11.6 FY17 actual: Animal nutrition 7.4 (Thailand MSG 2.6)
Other -5.7 -2.4 -3.3 FY17 actual: Animal nutrition structural reform expense 0.7
Operating profit 97.3 83.3 14.0
Financial income & expenses ()-: losses) -0.7 2.1 -2.8
Profit before income taxes 96.6 85.4 11.1
Income taxes 25.5 16.6 8.8 Tax rate: FY17 actual 19%, FY18 26%
Profit 72.2 68.7 3.4
Profit attributable to owners of the parent company 61.0 60.7 0.2
Profit attributable to non-controlling interests 11.2 8.0 3.1
Increased profits expected for FY2018, despite the reactionary effect of the tax revision in America in the previous year.
4Copyright © 2018 Ajinomoto Co., Inc. All rights reserved.
I-4. Profit for FY2018

Copyright © 2018 Ajinomoto Co., Inc. All rights reserved. 5
Board of Directors decided on a concrete reduction plan for in-house production of animal nutrition commodities. Recorded FY2017 impairment loss of ¥7.4 billion and other structural reform expenses of ¥0.7 billion for a total of ¥8.1 billion.
Recorded ¥4.0 billion as “conversion to Specialties” in FY2017–2019 MTP.
◆ Full stop of lysine production facilities in Thailand and Brazil, partial stop in France.
◆ Proceed with conversion to Specialty products by making threonine production facilities flexible.
Item Expense(¥ bil.)*
Impairment loss: Thailand 0.7
Impairment loss: Brazil 3.1Impairment loss: France 3.4
Sub-total(Impairment losses)
7.4
Other structural reform expenses
0.7
Total(Structural reform expenses)
8.1
I-5. Animal Nutrition Structural Reform Expenses
*Each amount is approximate

Contents
I. FY2017–2019 (for 2020) Medium-Term Management Plan
II. Growth Strategy and Structural Reform
III. FY2018 Financial Strategy
Reference Material
Appendix: Consolidated Results FY2017 Ended March 31, 2018
FY2018 Forecast by Segment
Note: Business profit (consolidated) in this material:
Sales - Cost of sales - Selling expenses, Research & development expenses and General & administrative expenses + Share of profit of associates and joint ventures

Copyright © 2018 Ajinomoto Co., Inc. All rights reserved. 6
II-1. Growth StrategyFood Products Business: Seasonings & Processed Foods in Japan
Steady sales and profit growth through creation of new meal scenes in major brands
1) Knorr®Continued expansion of sales of the Hot Breakfast series and “made with cold milk” series, and awakening demand for Soup Gohan, a new product.*1
2) Cook Do® menu-specific seasoningsFY2018 is the 40th anniversary of Cook Do® going on sale. Add noodle varieties, renewpackage design and communications, and re-expand Chinese category.
*2: New varieties launched in Feb. 2018
*1: New products launched in Feb. 2018
Seasonings & Processed FoodsFY2017-2019 sales CAGR: 4%

Copyright © 2018 Ajinomoto Co., Inc. All rights reserved. 7
Continue stable growth of core categories and attempt to create new frozen food categories capturing the changes in diet
1) Home-use• Strengthen core products and expand the top line
of main products such as Gyoza and The★Chahanthrough collaborative measures with other industries.
• Launch new products that respond to new demand, such as menus that appear frequently on the dinner table and appetizers.
• Strengthen ability to respond to channels such as convenience stores and drugstores where there is a lot of leeway to develop the category.
Onigiri (rice ball) filling
Appetizers
New product: Yoru kuji no hitori nomi(Enjoy Drinking Alone at 9PM)
Went on sale in Feb. 2018
II-2. Growth StrategyFood Products Business: Frozen Foods in Japan
Frozen Foods FY2017-2019 sales CAGR: 4%
2) Restaurant and Industrial-use• Strengthen product line-up in major categories such as
desserts and gyoza.• Resolution of operation issues with major customers
by strengthening development and sales capability.
Copyright © 2017 Ajinomoto Co., Inc. All rights reserved. 8
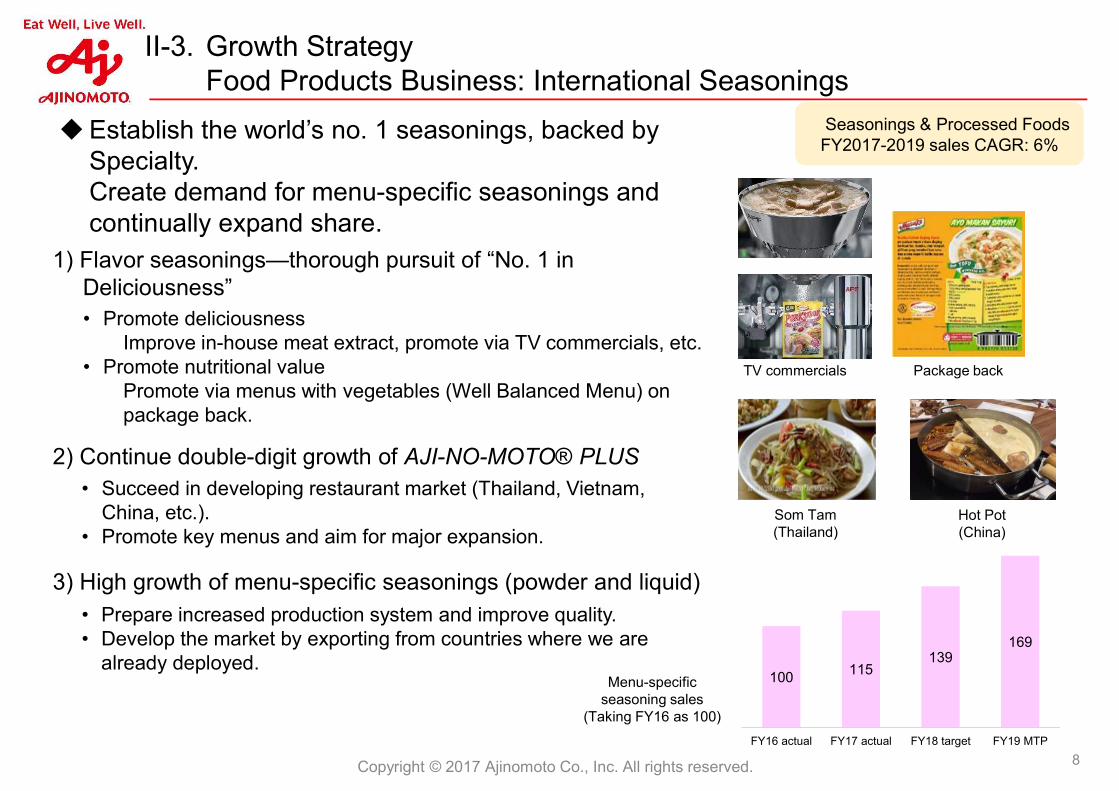
2) Continue double-digit growth of AJI-NO-MOTO® PLUS• Succeed in developing restaurant market (Thailand, Vietnam,
China, etc.).• Promote key menus and aim for major expansion.
1) Flavor seasonings—thorough pursuit of “No. 1 in Deliciousness”• Promote deliciousness
Improve in-house meat extract, promote via TV commercials, etc.• Promote nutritional value
Promote via menus with vegetables (Well Balanced Menu) on package back.
Establish the world’s no. 1 seasonings, backed by Specialty. Create demand for menu-specific seasonings and continually expand share.
Menu-specific seasoning sales
(Taking FY16 as 100)
100 115 139
169
FY16 actual FY17 actual FY18 target FY19 MTP
TV commercials Package back
II-3. Growth StrategyFood Products Business: International Seasonings
Seasonings & Processed Foods FY2017-2019 sales CAGR: 6%
3) High growth of menu-specific seasonings (powder and liquid)• Prepare increased production system and improve quality.• Develop the market by exporting from countries where we are
already deployed.
Som Tam(Thailand)
Hot Pot(China)
Significant growth through Specialty products that have improved quality and deliciousness.Quickly establish stable production that supports growth and concentrate on the strategy for Asian food, Appetizers, and Mexican food.
1) Expand top line in 3 key categoriesAsian food
Expand no. 1 share by expanding handling of Ling Ling®, TAI PEI®, and TOKYO STYLE SHOYU RAMEN.
AppetizersEstablish supply system in FY2018, achieve rapid growth in FY2019.Advance towards strong no. 2 position in the restaurant market.
Mexican foodExpand sales by adding new products based on an improved supply system.
2) Restructure production system over one year to stabilize productionAsian food Portland and Oakland factories (investment completed FY2016) contributed to
expansion of sales.Appetizers Complete concentration of production in new Joplin, Missouri factory and stabilize
production.Mexican food May 2018, will obtain contract manufacturer’s factory and production facilities and
start production. (San Diego new factory)*FY2017–2019 MTP: CapEx plan of ¥20.0 bil./3 year, proceeding according to plan
Copyright © 2018 Ajinomoto Co., Inc. All rights reserved. 9
II-4. Growth StrategyFood Products Business: International Frozen Foods (North America)
Frozen FoodsFY2017-2019 sales CAGR: 11%

1) Market environmentShifted to low growth due to the excise tax introduced in September 2017, growth in variety of drink preferences.*1 Growth on value basis due to impact of
excise/sugar tax introduced in FY2017*2 RTD: Ready to drink
28,859 30,454
32,716 33,102 33,260
11,01111,717
12,37012,321
13,550
4,000
6,000
8,000
10,000
12,000
14,000
10,000
15,000
20,000
25,000
30,000
35,000
CY14 CY15 CY16 CY17 CY18forecast
Volume Value
Value (M THB)Qty. (1 k cases) 0.5% 1.2%
7.4% 5.5%
10.0%*1 - 0.4%
5.6% 6.4%
Source: Ajinomoto Co. estimates based on Nielsen Data
Copyright © 2018 Ajinomoto Co., Inc. All rights reserved. 10
RTD *2 Market Trend in Thailand
2) Change in strategy to low-growth market• Revise product. Improve quality and
deliciousness.• Secure profit by procuring coffee beans
together with Ajinomoto AGF, Inc. • Strengthen communication with loyal
Birdy® users.
Stabilization of profit foundation focusing on a value strategy based on improved quality and deliciousness for loyal users
II-5. Growth StrategyFood Products Business: Canned Coffee, Birdy® (Thailand)

Copyright © 2018 Ajinomoto Co., Inc. All rights reserved. 11
(10 k tons)
(growth, %)2005 = 100
◆ No growth for market overall. The personal market and away-from-home (restaurant and industrial-use) trend are growing. Strive to concentrate strategies on both personal and restaurant and industrial-use markets.
Coffee bean consumption in Japan(¥ bil.)
100%
150%
200%
250%
300%
350%
0.0
50.0
100.0
150.0
200.0
05 06 07 08 09 10 11 12 13 14 15 16 17
Home-use coffee market Home-use coffee market growth rate
Stick-type growth rate
42
45 46
35
40
45
11 12 13 14 15 16 17
Source: All Japan Coffee Association Ajinomoto AGF, Inc.: home vs. industrial ratio (FY17 actual)Home: 75%; Industrial: 25%
Home-use coffee market and growth rate of stick-type
II-6. Growth StrategyFood Products Business: Coffee Products 1
Source: SRI (sales)

Copyright © 2018 Ajinomoto Co., Inc. All rights reserved. 12
1) Home-usei. Continue to grow the stick-type market over the
medium- to long-term.• Enhancement of product line-up (flavor varieties)
and strengthening of communication including digital methods.
ii. Secure growth equivalent to the market in the medium term by recovering share in categories with issues.• Instant coffee: accelerate shift to personal• Liquid coffee: introduce new personal size targeting working women
iii.Respond to consumer needs and changes in purchasing channel by strengthening EC strategy.
2) Restaurant and industrial-usei. Improve quality and increase counter business opportunities and product
line-up.ii. Move into food service and expand office-use.
II-6. Growth StrategyFood Products Business: Coffee Products 2
Coffee ProductsFY2017-2019 sales CAGR: 5%

◆ Pharmaceutical custom manufacturingFrom small molecule API*1 to large molecule oligonucleotides and ADC,*2
create highly profitable CDMO*3 business via continuous investment and strengthen our service system via One Team for each of the group companies.
Copyright © 2018 Ajinomoto Co., Inc. All rights reserved. 13
Ajinomoto Althea, Inc. (U.S.)• Contract development and manufacturing of
biopharmaceutical products (API manufacturing, formulation and filling, analysis, etc.)
S.A. Ajinomoto OmniChem N.V. (Belgium)• Manufacturing and sale of pharmaceutical
intermediates and API
GeneDesign, Inc. (Japan)• Contract development and manufacturing of
oligonucleotides and nucleotide therapeutic materials
• Decision made to invest in strengthened production, Jan. 2018
*3 CDMO: Contract Development & Manufacturing Organization*2 ADC: Antibody-Drug Conjugate
One Team
Target contracts in FY18No. of pharmaceutical products and drug development projects Ajinomoto Group expects
Commercial pharmaceuticals 40 or more
Drug development 150 or more
II-7. Growth StrategyAminoScience Business: Healthcare 1
Pharmaceutical Custom Manufacturing
FY2017-2019 sales CAGR: 3%
・ Althea: establish ADC production site (expected completion: FY2018 Q4)・ GeneDesign: build Oligonucleotide Drug API Development Center (expected start of operation: FY2018 Q4)
*1 API: Active Pharmaceutical Ingredients
Copyright © 2018 Ajinomoto Co., Inc. All rights reserved. 14
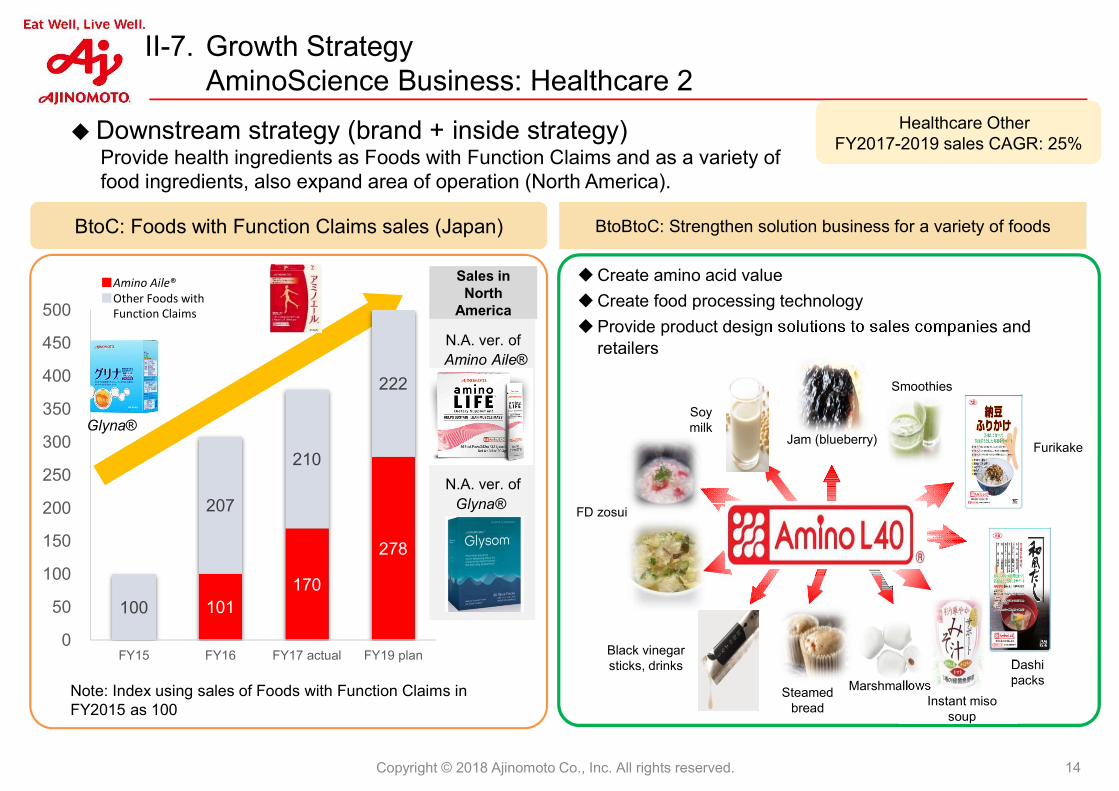
◆Downstream strategy (brand + inside strategy)Provide health ingredients as Foods with Function Claims and as a variety of food ingredients, also expand area of operation (North America).
BtoC: Foods with Function Claims sales (Japan) BtoBtoC: Strengthen solution business for a variety of foods
Create amino acid value
Create food processing technology
Provide product design solutions to sales companies and retailers
Black vinegar sticks, drinks
Soy milk
Marshmallows
Jam (blueberry)
Smoothies
Steamed bread
Furikake
Dashi packs
Instant miso soup
FD zosui
Note: Index using sales of Foods with Function Claims in FY2015 as 100
Amino Aile®
Glyna®
101 170
278
100
207
210
222
0
50
100
150
200
250
300
350
400
450
500
FY15 FY16 FY17 actual FY19 plan
■Amino Aile®■Other Foods with
Function Claims
Glyna®
Sales in North
America
II-7. Growth StrategyAminoScience Business: Healthcare 2
Healthcare OtherFY2017-2019 sales CAGR: 25%
N.A. ver. of
N.A. ver. of

◆ Animal nutrition1) Switch lysine and threonine to OEM
Incrementally reduce in-house production of lysine and threonine and replace with OEM. Aim for below 50% in-house production rate by FY2020.
2) Business profit targetsi. Shrink commodity losses by
switching to OEMii.Expand Specialty
Aim to expand Specialty ratio(AjiPro®-L, low-limiting amino acids, etc.)
Copyright © 2018 Ajinomoto Co., Inc. All rights reserved. 15
FY17 FY18 FY19 FY20
Lysine Threonine
In-h
ous
e p
rod
uctio
n ra
tio
II-8. Structural Reform: Animal Nutrition
0.0%
1.0%
2.0%
3.0%
4.0%
5.0%
-1.0
0.0
1.0
2.0
3.0
4.0
5.0
6.0
FY16 FY17 actual FY18 forecast Plan fromFY2020
Commodity Specialty Business profit margin
0.6
3.0
1.8
5.0
Animal nutrition business profit and profit margin trends
Business profit(¥bil.)
Business profit margin
Animal NutritionFY2017-2019 sales CAGR: 10%

Copyright © 2018 Ajinomoto Co., Inc. All rights reserved.
• CO2 emissions ◎, renewable energy ◎, water resource conservation ◎• Sustainable procurement △, food loss reduction (introduction of 122 products
displaying year and month) 〇• 3R for waste material ○• New for FY2018: investigate measures for ocean plastic problem
16
・Promote various initiatives in line with environmental targets
・Attain innovation by improving engagement (productivity)
II-9. Non-Financial Initiatives
ASV* Value CreationStories
Social
Environ-mental
Gover-nance
S
E
G
We contribute to health and well-being by utilizing our leading-edge bioscience and fine chemical technologies which also leads to deliciousness technologies, and by delivering good and healthy food
We contribute to the development of a society that enables strong family/social bonds and diverse lifestyles through eating well
We contribute to the sustainability ofsociety and the earth, with ourcustomers and local communities,across the value chain fromproduction to consumption
We co-create value with each regionthrough the perspectives of thecustomers, with our global, top-classand diverse talents
3
4
1
2
Content of major initiatives
・Promote nutrition improvement initiatives• In Japan, increasing presence of nutrition improvement initiatives resulted in increased
sales of low sodium/nutrition care products ○• Increase in meals with good nutritional balance overseas due to appeal of menus using
seasonings ◎
・Steadily increase smart cooking
• Popularization of smart cooking using simple to prepare foods such as frozen foods and soups ◎
• Growth via expansion of menu-specific seasonings• Growth via business expansion of Integrated Food Solutions for food services in Japan
Progress toward FY2020 target: Exceeded ◎; In-line 〇; Below △
• Ajinomoto Group Engagement Survey (approx. 29,000 respondents) results: “Employees with high engagement” 79%〇- Good points: Increased motivation due to ASV activities, customer orientation, etc.- Points for improvement: Diversity, decision-making process, career development, etc.
*ASV: Ajinomoto Group Shared Value
Contents
I. FY2017–2019 (for 2020) Medium-Term Management Plan
II. Growth Strategy and Structural Reform
III. FY2018 Financial Strategy
Reference Material
Appendix: Consolidated Results FY2017 Ended March 31, 2018
FY2018 Forecast by Segment
Note: Business profit (consolidated) in this material:
Sales - Cost of sales - Selling expenses, Research & development expenses and General & administrative expenses + Share of profit of associates and joint ventures

16 1618
20
2428 30 32 32
36.7
26.1
24.229.1 30.6
33.9 32.6 30.0 30
0
10
20
30
40
50
60
70
14
16
18
20
22
24
26
28
30
32
34Dividends persharePayout ratio
Dividend per share (¥)Payout ratio
(%)
17Copyright © 2018 Ajinomoto Co., Inc. All rights reserved.
III. FY2018 Financial Strategy 1
Based on the policies of the FY2017–2019 MTP, generate cash flow, invest for growth and provide stable shareholder returns to realize business strategy.
Cash Flow
Operating cash flow: approx. ¥350 bil. (3 yrs.)
EBITDA to sales ratio:upper half of 13% level
Shareholder Returns
Payout ratio: target 30% per FYFY17 forecast: ¥32 (annual)
FY18 forecast: ¥32 (annual)
Total shareholder return: aim for 50%+
Flexibly consider share repurchases
Investments for Growth
Engage in integrated management of CapEx, R&D, M&A
- R&D: approx. ¥29.0 bil. per FY
- CapEx: FY18 forecast, approx. ¥94.5 bil.
(¥ bil.) FY17 actual FY18 plan
Operating cash flow 126.6 120.3
CapEx 79.4 94.5
Free cash flow 27.5 25.8
Return to shareholders(dividend) 17.0 18.4
Return to shareholders(share repurchases) - 40.0
Cash and deposits 187.8 154.1
Net debt is interest-bearing debt -Cash on hand and in banks x 75%
・M&A: finance by using interest-bearing debt (aim for D/E ratio of 50%)March 31, 2018 actual: 31.7%・Aim to repurchase non-
controlling interests by FY2019.

18Copyright © 2018 Ajinomoto Co., Inc. All rights reserved.
Decision to conduct a share repurchase to increase the level of shareholder returns and improve capital efficiency.
1. Class of shares: Common stock
2. Total number of shares to be repurchased: 2.5 million* (maximum)*4.39% of total shares outstanding, excluding treasury stock
3. Total amount to be paid for repurchase: JPY 40.0 billion (maximum)
4. Period of share repurchase: May 11, 2018 to September 20, 2018
5. Method of repurchase: Market purchase in the Tokyo Stock Exchange
6. Other: Ajinomoto Co. plans to retire all of the shares repurchased under this program by resolution of the board of directors, pursuant to Article 178 of the Corporation Law.
For reference (as of March 31, 2018)
Total number of shares outstanding (excluding treasury stock): 568,863,328
Number of shares of treasury stock: 3,000,026
III. FY2018 Financial Strategy 2

Contents
I. FY2017–2019 (for 2020) Medium-Term Management Plan
II. Growth Strategy and Structural Reform
III. FY2018 Financial Strategy
Reference Material
Appendix: Consolidated Results FY2017 Ended March 31, 2018
FY2018 Forecast by Segment
Note: Business profit (consolidated) in this material:
Sales - Cost of sales - Selling expenses, Research & development expenses and General & administrative expenses + Share of profit of associates and joint ventures

FY17 Actual
778USD mil.
79%
FY20 Target (Organic growth)FY19 MTP
-
-
-
-
--
FY18 Forecast
Appendix 1Copyright © 2018 Ajinomoto Co., Inc. All rights reserved.
FY19 Expected
-
-
- -
-
-
--
-
-
-
-
-
--
II-5. Roadmap to a "Genuine Global Specialty Company"
Sustained growth as a global top 101)
class food companyBecome a global
top 10 class food company
Sustainable value creation as aGenuine Global Specialty Company
Global top 10 class food company level1)
Become a global top 10 class company with robust business structure
¥130 bil.
¥150 bil.
3)
Fin
an
cia
lN
on
-fin
an
cia
l3)
Inte-grated
Resolution of environmental issues
Brand value5)
Contribution to eating together
Comfortable lifestyles (AminoScience)
EPS growth rate
ROE
Business profit margin
Business profit
Intl. sales growth rate2)
Spare time created
Meats and vegetables consumption
Employees with high engagement
1. Global top 10 class status defined as business profit of ¥130.0 billion or higher with IFRS accounting standards.; 2. Consumer foods, local currency basis 3. Refer to FY2017-2019 MTP (Feb. 17, 2017); 4. Includes Frozen foods; 5. Measured by Interbrand
¥97.3 bil.
8.5%
9.7%
15%
5%4)
Meats: 7.2 mil. tons; 17.0%(8.3 kg/person/yr)
Veg.: 4.4 mil. tons; 7.4% (5.1 kg/person/yr)
60 occasions / household / yr
37 mil. hrs / yr (5 hrs / household)
19.80 mil. people
¥103.0 bil. ¥116.0 bil.
6%Double-digit annual growth
¥124.0 bil.
9.8%
9.4%¥137.0 bil.–
1,500 mil. USD or more
70 occasions / household / yr
22 mil. people
10% or higher
10%
38 mil. hrs / yr (6 hrs / household)
80%
Double-digit annual growthDouble-digit annual growth
Meats: 8.6 mil. tons; 19%(9.7 kg/person/yr)
Veg.: 5.5 mil. tons; 8% (6.2 kg/person/yr)
FY2017 being totaled.
To be reported in
the Integrated Report and
Sustainability Data Book
8.7%
9.5%
3%
7%
9.3%
9.8%
7%Previous year growth rate + α

Assumed exchange rate (vs. JPY) * Average rate during the period
4Q 3Q 2Q 1QUSD 110.00 108.22 112.98 111.00 111.09 108.3 100.0EUR 130.00 133.14 133.02 130.37 122.26 118.7 110.0THB 3.28 3.43 3.42 3.32 3.24 3.08 2.80BRL 33.85 33.37 34.79 35.09 34.54 32.8 30.3
FY18Forecast
FY17 Actual FY17-19MTP
FY16
Actual*
Appendix 2Copyright © 2018 Ajinomoto Co., Inc. All rights reserved.
Foreign exchange rates (vs JPY)
Avg. rate
USD 110.00 ±¥1 → approx. ¥100 million
EUR 130.00 ±¥1 → approx. ¥50 million
THB 3.28 ±¥0.01 → approx. ¥100 million
BRL 33.85 ±¥1 → approx. ¥200 million
Sensitivity of translation effectsto full year B.P.
- 1 JPY vs USD → approx. ¥0 million
- 0.1 EUR vs USD → approx. - ¥1 million
- 1 THB vs USD → approx. + ¥500 million
- 0.1 BRL vs USD → approx. + ¥400 million
Impact of exchange rate for trade(Sensitivity of translation effects to full year B.P.)
FY2018 Assumed Exchange Rate and Exchange Rate Sensitivity
Exchange Rate Sensitivity

Copyright © 2018 Ajinomoto Co., Inc. All rights reserved.
Forward-looking statements, such as business performance forecasts, made in these materials are based on management's estimates, assumptions and projections at the time of publication. A number of factors could cause actual results to differ materially from expectations.
This material includes summary figures that have not been audited so the numbers may change.
Amounts presented in these materials are rounded off.