sustainable land management at ramu sugar plantation ...alfredhartemink.nl/pdf/2001 - slm ramu...
TRANSCRIPT
344
Sustainable Land Management at Ramu Sugar Plantation: Assessment and Requirements
Alfred E. Hartemink*
Abstract
Ramu Sugar Plantation was established in 1979. This paper presents an overview of changes in soil chemicaland physical properties that have resulted from continuous sugarcane cultivation since that time. Between1979 and 1996, the soil pH decreased from about 6.5 to 5.8 and this acidification was accompanied by adecrease in cation exchange capacity and exchangeable cations. Organic carbon levels declined from about56 grams per kilogram in 1979 to 32 grams per kilogram in 1996. The inter-row of the sugarcane wascompacted and had significantly higher bulk densities and a very slow water intake. Semiquantitative nutrientbudgets showed a shortfall in nitrogen, phosphorus and potassium, and levels of these nutrients in thesugarcane leaves significantly decreased between the mid-1980s and 1990s. Yields at the plantation arelargely determined by insect pests, diseases and weeds. It is concluded that significant soil changes occurredthat may affect the sustainability of sugarcane growing in the long term if such trends continue.
THE term ‘sustainable land management’ is difficultto define, but in essence refers to the combination ofproduction and conservation of the natural resourceson which the production depends (Young 1997). Thesoil is the most important component in sustainableland management as indicated by pedologists (Bouma1994), soil fertility experts (Scholes et al. 1994) andsoil biologists (Swift and Sanchez 1984). Assessingsustainable land management is as difficult asdefining it. Key problems are choosing the spatial andtemporal borders for assessment (Fresco and Kroo-nenberg 1992) and the indicators for evaluating sus-tainability in a given locality (Smyth and Dumanski1995). Long-term data are imperative to evaluate the
sustainability of land management practices but theyare scarce for tropical regions (Greenland 1994).
Most studies dealing with sustainable land manage-ment have focused on subsistence agriculture. Rela-tively little attention has been given to high externalinput or plantation agriculture, which constitutes amajor segment of the national economies in manytropical countries (Hartemink 1998b). An importantplantation crop is sugarcane (interspecific hybrids ofSaccharum spp.), which is mostly monocropped.Sugarcane production has dramatically increased inthe past few decades. In the 1960s, sugar productionin the world was about 64 million tonnes, of whichhalf was produced in developing countries (FAO1996). By the mid-1990s, production had increased to119 million tonnes. About 76 million tonnes was pro-duced in developing countries, of which 40 milliontonnes was produced in Asia and the Pacific. Betweenthe mid-1960s and 1990s, the largest expansion of
* International Soil Reference and Information Centre, PO Box 353, 6700 AJ, Wageningen, The Netherlands. Email:[email protected]

345
sugar production occurred in India (from about 3 to 15million tonnes ) and Brazil (from 5 to 10 milliontonnes). In some sugarcane-producing countries likeCuba and Barbados there has, however, been adecline in production in the past decades (Anderson etal. 1995). Part of the increase in sugar production hasresulted from improved agronomic practices, but inmany countries increased production has resultedfrom having a larger area under sugarcane.
There are few plantation crops in the tropics that putsuch heavy demand on soil resources as sugarcane.Most commercial sugarcane is grown intensively on alarge scale, and many of the husbandry practices aresimilar to intensive agricultural systems in temperateregions (Hartemink and Wood 1998). Heavymachinery is used for land preparation, planting,spraying and harvesting. Biocides are widely used tocontrol pests and diseases and herbicides are used tocontrol weeds. Sugarcane also makes heavy demandson soil nutrient reserves, because large amounts ofnutrients are removed with the harvest. Unlessreplaced, either naturally through weathering and bio-geocycling or artificially through inorganic fertiliserswith, for example, filter press cake, the soil nutrientpool will decline. In summary, commercial sugarcanecultivation is likely to affect soil conditions.
Sugarcane is indigenous in PNG. Plans for estab-lishing a sugarcane plantation in PNG date back to the1930s when Singara Sugar Estates Ltd proposed toestablish a plantation near Buna in what is now calledOro (Northern) Province (van der Veer 1937). Theplantation was never established. In the decades thatfollowed, various reports suggested that commercialsugarcane production was technically feasible. It wasemphasised that it would be a great risk because of abroad range of pests and diseases (Li 1985). In themid-1970s the demand for sugar increased, worldmarket prices fluctuated strongly, and the PNG Gov-ernment decided to establish a national sugar industry.Initial investigations were carried out in the MarkhamValley to identify a suitable site. Several potential siteswere identified, but the Gusap–Dumpu area on thenorth bank of the Ramu River was favoured because itdid not need irrigation or flood protection works andland preparation costs were lower (Chartres 1981). In1979, a detailed soil survey was undertaken and about7000 hectares (ha) of suitable or moderately suitableland in the Gusap–Dumpu area was identified. Thefirst sugarcane was planted in 1979 and the plantationwas named Ramu Sugar Ltd.
Initially, most attention was paid to the establish-ment of the plantation and factory, but in 1987 a soil
management plan was developed based on expertknowledge (Booker Agriculture International 1987).The plan has received only lip-service by the planta-tion management because they mainly focused on thecontrol of insect pests and diseases, which severelyaffected sugarcane production. Hence, soils were notregarded as a limiting factor in sugarcane production.Such differences in perception between the users ofthe soil and soil experts is common (Bouma 1993) andnot unique to plantation agriculture.
In this paper, an assessment is made of the sustain-ability of land management at Ramu Sugar Plantation.The hypothesis tested was simple. If it could be proventhat soil properties have changed significantly and thatsuch changes could be attributed to the effect of con-tinuous sugarcane cultivation, sugarcane cultivation atthe plantation would not be sustainable. Although theterm ‘sustainable land management’ is usedthroughout this paper, it usually refers only to soilaspect. Indicators of sustainable land managementwere based on the availability of historical soil datafrom the plantation, supplemented with data that couldbe relatively easily collected. Soil survey data of 1979were also used, providing useful information to assesschanges in soil properties (Young 1991). No historicaldata were available for the soil physical properties, andchanges were assessed by comparing measurements insugarcane plantations with those on uncultivated land.
The Environment at Ramu Sugar Plantation
Ramu Sugar Plantation (6°S, 146°E) is located inMadang Province. Before sugarcane was planted in1979, the site was natural grassland with some forestand swamp vegetation in poorly drained and low-lyingareas. The grassland was dominated by Imperatacylindrica (kunai), which was found on the deeper andfine-textured soils (Booker Agriculture International1979). Its dominance was probably due to annualburning, as Imperata regenerates rapidly comparedwith other species (Henty and Pritchard 1988). Onshallower and stony soils Themeda australis (kan-garoo grass) dominated the natural vegetation,whereas Saccharum spontaneum and Ophiuros sp.occurred in the wetter sites along streams and rivers(Chartres 1981).
Climate
The plantation is in an area that is directly affected bythe passage of the ‘Inter-Tropical Convergence Zone’,
346
which occurs twice yearly (Chartres 1981). Conse-quently, there is a seasonal rainfall pattern (unimodal)with a dry season from May to November and a rainyseason from December to April. The average rainfall atthe plantation is 1998 millimetres (mm) per year, butbetween 1980 and 1995 annual rainfall varied from1531 to 2560 mm. June to September are the driestmonths, with an average of less than 90 mm of rain permonth. March is the wettest month, with an averagerainfall of 284 mm. Evaporation (class A open pan) isabout 2281 mm per year and exceeds rainfall from Mayto November. Mean annual temperatures are 26.7°C,with only minor fluctuations through the year. Theclimate is classified as Am (Köppen system)—tropicalrainy climate with a short dry season.
There is very little relation between total annualrainfall and sugarcane yield (Hartemink et al. 1998).An index often used in the evaluation of water and sug-arcane is the production of sugar per millimetre of rain(Fauconnier 1993). These values were calculated fromyield and climatic data. In the past 15 years, between21.2 and 40.9 mm of rain was required to produce1 tonne of sugarcane per hectare(ha), which is equiva-lent to 2–4.2 kilograms (kg) sugarcane/ha/mm of rain(Hartemink et al. 1998).
Land management under sugarcane
The first 3 ha of sugarcane were planted in 1979 butthe total area grew rapidly from 1592 ha in 1981, to5011 ha in 1983 and to 6030 ha in 1995. The planta-tion was established for rainfed sugarcane production.Feasibility studies for irrigation have been conductedin the past but it was soon realised that other con-straints were more important. About 1800 ha of sugar-cane are planted mechanically each year. Up to 1994,planting took place at the beginning of the wet season(September to November) but currently most of thecane is planted from late February to May as thisreduces the risk of certain insect pests. The harvestingseason lasts from May to October and cutter–chopper–loader harvesters are used, with 20-tonne tractors andtrailers transporting the cane to the factory. Most ofthis equipment has conventional tyres. About half ofthe sugarcane is trash harvested (no burning beforeharvesting). Up to five crops (i.e. plant cane plus fourratoons) are sometimes obtained, after which the landis replanted; at other times, cowpea (Vigna unguicu-lata) may be sown and ploughed under after one year.Before 1989, nitrogen (N) fertiliser was applied asurea (46% N), but when trash harvesting replaced pre-harvest burning it was suggested that considerable
amounts of urea-N would be lost through volatilisa-tion. Therefore N fertiliser supplied after 1989 was inthe form of sulfate of ammonia (21% N); on average,90 kg N/ha/year was applied during the period 1991–95. N applications are usually broadcast betweenAugust and November. Phosphorus (P) and potassium(K) fertilisers are not applied.
Geomorphology
The Ramu Valley is drained by the perennial RamuRiver and several tributaries with erratic flow charac-teristics. The valley covers an area of about7500 square kilometres and forms, together with theMarkham Valley, a large graben that has been a zoneof subsidence since the Late Tertiary period (Löffler1977). At the site of the plantation, the valley is about10 kilometres wide. The Ramu Valley contains about2000 metres (m) of unconsolidated and poorly consol-idated Quaternary marine and terrestrial clastic sedi-ments overlying Tertiary sedimentary rocks(Hartemink 1998b). The valley comprises a series ofalluvial fans, some of which are incised by theirstreams, forming deep gullies (> 20 m). Slopes are upto 5% on the higher parts of the fans but decreasedownslope to less than 0.5%. The plantation is about400 m above sea level. Since the plantation is situatedin a tectonically active area, geomorphologic proc-esses are currently visible. In November 1993, a land-slide dammed an important drainage way in the lowerpart of a catchment area of the Finisterre Mountains,with a lake formed behind the dam. The dam collapsedafter several days of heavy rain. The massive mudflowthat followed filled the deeply incised Gusap and Borastreams and washed out the Lae–Madang road andseveral hectares of sugarcane. Drainage of soils adja-cent to the Gusap stream was then retarded and somesugarcane land had to be abandoned because of poorworkability. Although such mudflows catastrophi-cally affect the sustainability of sugarcane growing,they do not affect large areas and are not further con-sidered in this study.
Soils
The parent material of the soils at the plantation isalluvium. The soils have been developed in clayey,silty and sandy sediments and from the weatheringproducts of the water-worn stones and boulders ofvarying lithology. The stones and boulders originatefrom sandstone, siltstone and limestone, but also frombasalt and igneous rocks with coarser textures. Thecoarse material is generally poorly sorted and there is

347
a gradual decrease in grain size from the FinisterreMountains towards the Ramu River. Although deepand nearly gravel, free soils (> 1.2 m depth) occur, andextensive areas have gravelly (5–15%) topsoils andvery gravelly (15–40%) or stony subsoils. The pHw(pH in water) indicates no apparent danger fromexchangeable aluminium (Al) or excess calcium car-bonate (CaCO3). Soil salinity is not a problem in thetopsoils but the deeper subsoils are slightly alkaline.Sheet and gully erosion are a threat in some areas butterraces have been dug across the contour to controlsurface water (Hartemink 1998b).
Fluvisols are the dominant major soil grouping atthe plantation. At the soil unit at the Food and Agricul-ture Organization–United Nations Educational, Scien-tific and Cultural Organization (FAO–UNESCO), theFluvisols are Eutric or Mollic, equivalent to the greatgroup of Tropofluvents (Entisols) in United StatesDepartment of Agriculture (USDA) Soil Taxonomy.Some Entisols classify as Tropopsamments (Bleeker1983). The soil temperature regime is isohyperthermicand the soil moisture regime udic, indicating that, inmost years, the soils are dry for less than 90 cumula-tive days per year.
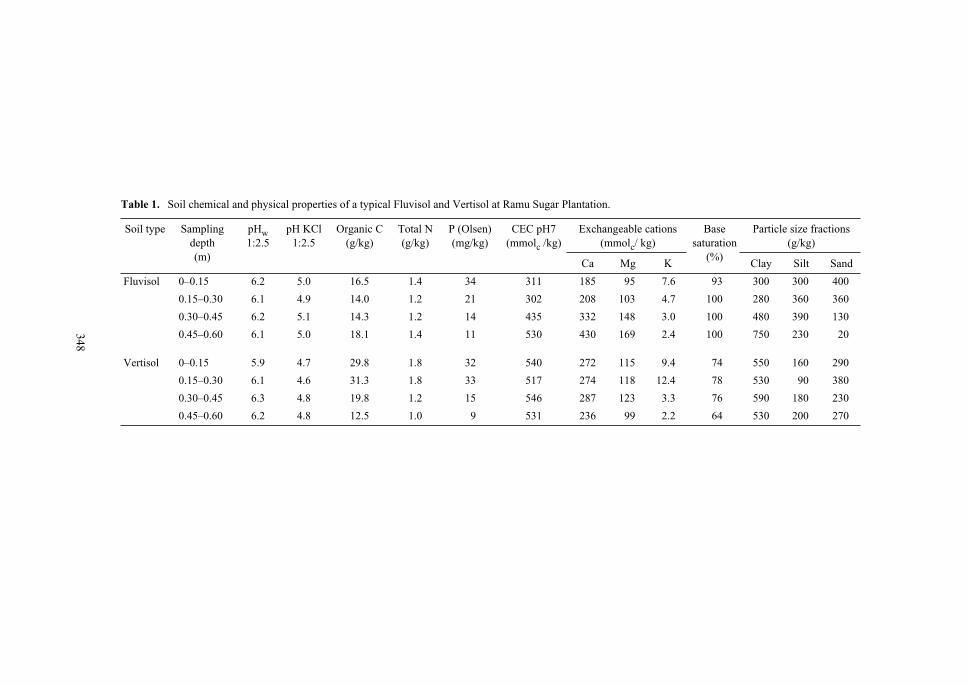
Shrinking and swelling dark clay soils (Vertisols)cover about one-quarter of the plantation. These soilsare dominated by montmorillonite or some othersmectite mineral. During the fieldwork (January,August and October 1996, April 1997) cracks wereobserved in these soils, but not to 0.5 m depth as isrequired for the soils to be classified as Vertisols(FAO–UNESCO 1988). The absence of deep cracksmay have been caused by frequent tillage and the highcontent of stable aggregates that commonly occur inVertisols when the organic matter content is30 grams (g)/kg or more (Ahmad 1984). The soils are,however, likely to be Vertisols, because of the pres-ence of wedge-shaped structural elements, slicken-sides in the subsoil, a fine texture (> 500 g clay/kgsoil), a hard consistency and cracks when dry. Thesoils contain no calcareous concretions, which arecommonly absent in Vertisols under high rainfall(Blokhuis 1980). At the soil unit of FAO–UNESCO,these soils are Eutric Vertisols, equivalent to the greatgroup of Hapluderts in USDA Soil Taxonomy. Soilchemical and physical data of a representative EutricFluvisol and Eutric Vertisol are given in Table 1.
In some low-lying areas, soils with poor internaldrainage occur and these are classified as Gleysols atFAO–UNESCO (1988). According to Booker Agri-culture International (1987), they cover only a smallarea of the plantation (about 3% or 180 ha) and data
from these soils were not included in this study. Somesugarcane is planted on the footslopes of the FinisterreMountains in soils derived from a mixture of alluvialand colluvial deposits. Very locally, these soils havebeen enriched with tephra, probably originating fromLong Island in the Bismarck Sea (Parfitt and Thomas1975). Such soils may contain up to 10% allophaneand have high P retention capacities (Hartemink1998b). Since these soils are confined to a small areaand have not received much research attention, theywere excluded from this study.
Materials and Methods
Data types
The literature describes two methods to studychanges in soil properties under cropping. Firstly, soildynamics can be monitored over time on the same site.This is called chronosequential sampling (Tan 1996)or type I data (Sanchez et al. 1985). Differences in soilproperties are hence attributable to the management ofthe soil during the period of observation. Althoughtype I data are extremely useful to assess the sustaina-bility of land management practices, few such data setsexist for tropical regions (Greenland et al. 1994).
In the second method, soils under adjacent differentland-use systems are sampled at the same time andcompared. These are called type II data (Sanchez et al.1985), biosequential sampling (Tan 1996) or ‘sam-pling from paired sites’ in the literature from Australia(e.g. Garside et al. 1997; McGarry et al. 1996). Themain underlying assumption is that the soils of the cul-tivated and uncultivated land are similar and that dif-ferences observed in soil properties are attributed tothe cultivation. Obviously, this is not always the case,as the uncultivated land may have been of inferiorquality. Such situations are likely to occur when landpressure is low, so that areas with poorer soils (e.g.patches which are waterlogged, stony or with low fer-tility) remain uncultivated. When carefully taken,however, biosequential samples provide useful infor-mation, and such a sampling strategy has been fol-lowed in much of the literature reviewed on soilchanges under sugarcane cultivation.
To investigate changes in soil chemical propertiesand leaf nutrient concentrations, all available analyt-ical data from 1978 to 1995 were collected (type Idata). For the changes in soil physical properties, nohistorical data could be used and we made bulk densityand water intake measurements in areas under sugar-cane and adjoining grasslands (type II data).
348
Table 1. Soil chemical and physical properties of a typical Fluvisol and Vertisol at Ramu Sugar Plantation.
Soil type Sampling depth(m)
pHw1:2.5
pH KCl1:2.5
Organic C(g/kg)
Total N(g/kg)
P (Olsen)(mg/kg)
CEC pH7(mmolc /kg)
Exchangeable cations(mmolc/ kg)
Base saturation
(%)
Particle size fractions (g/kg)
Ca Mg K Clay Silt Sand
Fluvisol 0–0.15 6.2 5.0 16.5 1.4 34 311 185 95 7.6 93 300 300 400
0.15–0.30 6.1 4.9 14.0 1.2 21 302 208 103 4.7 100 280 360 360
0.30–0.45 6.2 5.1 14.3 1.2 14 435 332 148 3.0 100 480 390 130
0.45–0.60 6.1 5.0 18.1 1.4 11 530 430 169 2.4 100 750 230 20
Vertisol 0–0.15 5.9 4.7 29.8 1.8 32 540 272 115 9.4 74 550 160 290
0.15–0.30 6.1 4.6 31.3 1.8 33 517 274 118 12.4 78 530 90 380
0.30–0.45 6.3 4.8 19.8 1.2 15 546 287 123 3.3 76 590 180 230
0.45–0.60 6.2 4.8 12.5 1.0 9 531 236 99 2.2 64 530 200 270
349
Soil chemical data
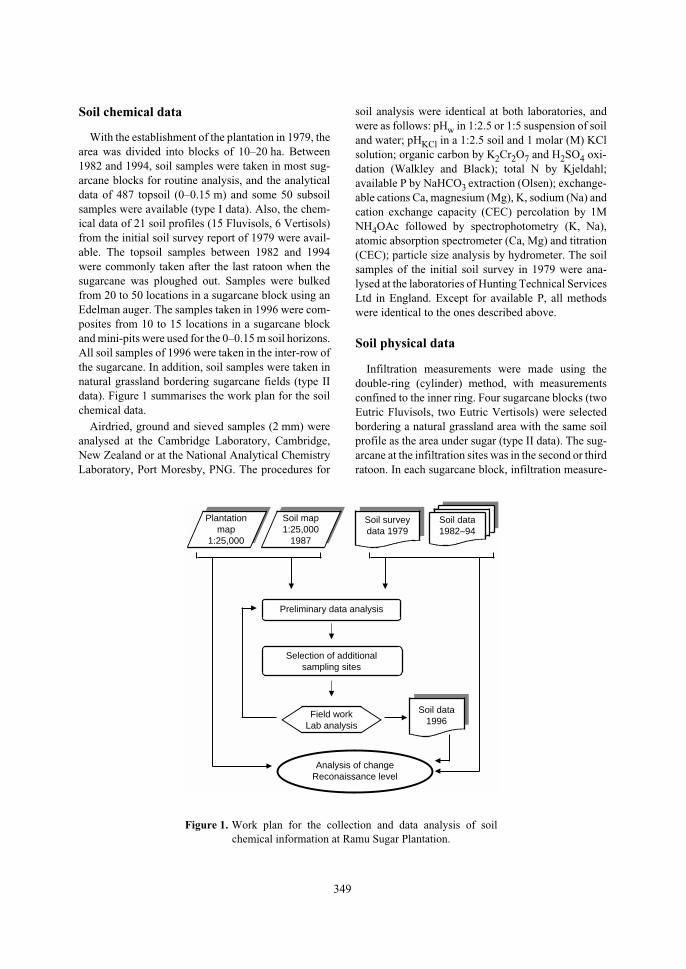
With the establishment of the plantation in 1979, thearea was divided into blocks of 10–20 ha. Between1982 and 1994, soil samples were taken in most sug-arcane blocks for routine analysis, and the analyticaldata of 487 topsoil (0–0.15 m) and some 50 subsoilsamples were available (type I data). Also, the chem-ical data of 21 soil profiles (15 Fluvisols, 6 Vertisols)from the initial soil survey report of 1979 were avail-able. The topsoil samples between 1982 and 1994were commonly taken after the last ratoon when thesugarcane was ploughed out. Samples were bulkedfrom 20 to 50 locations in a sugarcane block using anEdelman auger. The samples taken in 1996 were com-posites from 10 to 15 locations in a sugarcane blockand mini-pits were used for the 0–0.15 m soil horizons.All soil samples of 1996 were taken in the inter-row ofthe sugarcane. In addition, soil samples were taken innatural grassland bordering sugarcane fields (type IIdata). Figure 1 summarises the work plan for the soilchemical data.
Airdried, ground and sieved samples (2 mm) wereanalysed at the Cambridge Laboratory, Cambridge,New Zealand or at the National Analytical ChemistryLaboratory, Port Moresby, PNG. The procedures for
soil analysis were identical at both laboratories, andwere as follows: pHw in 1:2.5 or 1:5 suspension of soiland water; pHKCl in a 1:2.5 soil and 1 molar (M) KClsolution; organic carbon by K2Cr2O7 and H2SO4 oxi-dation (Walkley and Black); total N by Kjeldahl;available P by NaHCO3
extraction (Olsen); exchange-able cations Ca, magnesium (Mg), K, sodium (Na) andcation exchange capacity (CEC) percolation by 1MNH4OAc followed by spectrophotometry (K, Na),atomic absorption spectrometer (Ca, Mg) and titration(CEC); particle size analysis by hydrometer. The soilsamples of the initial soil survey in 1979 were ana-lysed at the laboratories of Hunting Technical ServicesLtd in England. Except for available P, all methodswere identical to the ones described above.
Soil physical data
Infiltration measurements were made using thedouble-ring (cylinder) method, with measurementsconfined to the inner ring. Four sugarcane blocks (twoEutric Fluvisols, two Eutric Vertisols) were selectedbordering a natural grassland area with the same soilprofile as the area under sugar (type II data). The sug-arcane at the infiltration sites was in the second or thirdratoon. In each sugarcane block, infiltration measure-
Plantationmap
1:25,000
Soil map1:25,000
1987
Soil surveydata 1979
Preliminary data analysis
Selection of additionalsampling sites
Field workLab analysis
Soil data1996
Analysis of changeReconaissance level
Soil data1982–94
Figure 1. Work plan for the collection and data analysis of soilchemical information at Ramu Sugar Plantation.
350
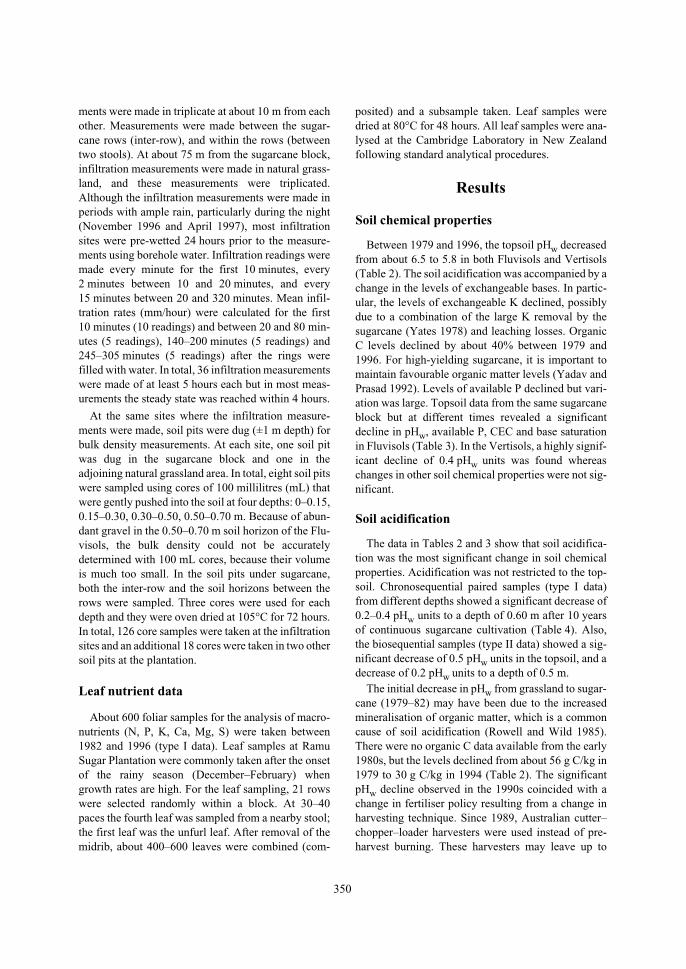
ments were made in triplicate at about 10 m from eachother. Measurements were made between the sugar-cane rows (inter-row), and within the rows (betweentwo stools). At about 75 m from the sugarcane block,infiltration measurements were made in natural grass-land, and these measurements were triplicated.Although the infiltration measurements were made inperiods with ample rain, particularly during the night(November 1996 and April 1997), most infiltrationsites were pre-wetted 24 hours prior to the measure-ments using borehole water. Infiltration readings weremade every minute for the first 10 minutes, every2 minutes between 10 and 20 minutes, and every15 minutes between 20 and 320 minutes. Mean infil-tration rates (mm/hour) were calculated for the first10 minutes (10 readings) and between 20 and 80 min-utes (5 readings), 140–200 minutes (5 readings) and245–305 minutes (5 readings) after the rings werefilled with water. In total, 36 infiltration measurementswere made of at least 5 hours each but in most meas-urements the steady state was reached within 4 hours.
At the same sites where the infiltration measure-ments were made, soil pits were dug (±1 m depth) forbulk density measurements. At each site, one soil pitwas dug in the sugarcane block and one in theadjoining natural grassland area. In total, eight soil pitswere sampled using cores of 100 millilitres (mL) thatwere gently pushed into the soil at four depths: 0–0.15,0.15–0.30, 0.30–0.50, 0.50–0.70 m. Because of abun-dant gravel in the 0.50–0.70 m soil horizon of the Flu-visols, the bulk density could not be accuratelydetermined with 100 mL cores, because their volumeis much too small. In the soil pits under sugarcane,both the inter-row and the soil horizons between therows were sampled. Three cores were used for eachdepth and they were oven dried at 105°C for 72 hours.In total, 126 core samples were taken at the infiltrationsites and an additional 18 cores were taken in two othersoil pits at the plantation.
Leaf nutrient data
About 600 foliar samples for the analysis of macro-nutrients (N, P, K, Ca, Mg, S) were taken between1982 and 1996 (type I data). Leaf samples at RamuSugar Plantation were commonly taken after the onsetof the rainy season (December–February) whengrowth rates are high. For the leaf sampling, 21 rowswere selected randomly within a block. At 30–40paces the fourth leaf was sampled from a nearby stool;the first leaf was the unfurl leaf. After removal of themidrib, about 400–600 leaves were combined (com-
posited) and a subsample taken. Leaf samples weredried at 80°C for 48 hours. All leaf samples were ana-lysed at the Cambridge Laboratory in New Zealandfollowing standard analytical procedures.
Results
Soil chemical properties
Between 1979 and 1996, the topsoil pHw decreasedfrom about 6.5 to 5.8 in both Fluvisols and Vertisols(Table 2). The soil acidification was accompanied by achange in the levels of exchangeable bases. In partic-ular, the levels of exchangeable K declined, possiblydue to a combination of the large K removal by thesugarcane (Yates 1978) and leaching losses. OrganicC levels declined by about 40% between 1979 and1996. For high-yielding sugarcane, it is important tomaintain favourable organic matter levels (Yadav andPrasad 1992). Levels of available P declined but vari-ation was large. Topsoil data from the same sugarcaneblock but at different times revealed a significantdecline in pHw, available P, CEC and base saturationin Fluvisols (Table 3). In the Vertisols, a highly signif-icant decline of 0.4 pHw units was found whereaschanges in other soil chemical properties were not sig-nificant.
Soil acidification
The data in Tables 2 and 3 show that soil acidifica-tion was the most significant change in soil chemicalproperties. Acidification was not restricted to the top-soil. Chronosequential paired samples (type I data)from different depths showed a significant decrease of0.2–0.4 pHw units to a depth of 0.60 m after 10 yearsof continuous sugarcane cultivation (Table 4). Also,the biosequential samples (type II data) showed a sig-nificant decrease of 0.5 pHw units in the topsoil, and adecrease of 0.2 pHw units to a depth of 0.5 m.
The initial decrease in pHw from grassland to sugar-cane (1979–82) may have been due to the increasedmineralisation of organic matter, which is a commoncause of soil acidification (Rowell and Wild 1985).There were no organic C data available from the early1980s, but the levels declined from about 56 g C/kg in1979 to 30 g C/kg in 1994 (Table 2). The significantpHw decline observed in the 1990s coincided with achange in fertiliser policy resulting from a change inharvesting technique. Since 1989, Australian cutter–chopper–loader harvesters were used instead of pre-harvest burning. These harvesters may leave up to

351
Table 2. Topsoil (0–0.15 metres) chemical properties of Fluvisols and Vertisols (arithmetic mean ±1 SD) (type I data), 1979–96.
Major soilgroupings
Year Number ofsamplesa
pHw 1:2.5
Organic C(g/kg)
Available P(mg/kg)
CEC pH 7(mmolc /kg)
Exchangeable cations(mmolc/ kg)
Base saturation
(%)Ca Mg K
Fluvisols 1979b 15 6.5 ± 0.4 58 ± 15 na 389 ± 43 228 ± 78 93 ± 41 13.0 ± 5.0 79 ± 17
1982 14 6.2 ± 0 1 na 36 ± 4 459 ± 55 275 ± 35 113 ± 24 12.9 ± 2.0 87 ± 2
1983 44 6.3 ± 0.1 na 37 ± 10 435 ± 48 256 ± 35 100 ± 16 12.4 ± 2.8 85 ± 3
1984 9 6.1 ± 0.1 na 42 ± 10 437 ± 52 266 ± 45 102 ± 21 12.9 ± 3.8 87 ± 4
1994 12 5.9 ± 0.1 35 ± 6 28 ± 9 384 ± 65 232 ± 47 101 ± 22 10.8 ± 2.3 90 ± 5
1996 8 5.8 ± 0.2 31 ± 7 28 ± 12 374 ± 33 220 ± 30 99 ± 13 8.0 ± 2.0 88 ± 8
Vertisols 1979b 6 6.6 ± 0.1 52 ± 9 na 421 ± 21 293 ± 69 123 ± 39 15.5 ± 2.7 93 ± 17
1982 17 6.2 ± 0.1 na 43 ± 5 490 ± 29 286 ± 22 131 ± 16 16.1 ± 2.9 89 ± 2
1983 40 6.3 ± 0.2 na 40 ± 13 477 ± 94 290 ± 83 114 ± 33 12.9 ± 2.3 87 ± 9
1986 7 6.2 ± 0.2 na 37 ± 18 490 ± 108 307 ± 77 112 ± 37 12.3 ± 5.6 88 ± 3
1994 12 5.9 ± 0.1 32 ± 3 32 ± 11 452 ± 79 273 ± 50 129 ± 34 13.4 ± 3.9 92 ± 5
1996 12 5.8 ± 0.2 32 ± 6 28 ± 11 421 ± 102 276 ± 73 115 ± 38 9.0 ± 3.0 92 ± 8
na = not availablea Composite topsoil samples of continuously cultivated fields, except for 1979.b Soil samples taken prior to the establishment of the plantation; sampling depths varied from 0–0.12 m to 0–0.28 m (mean 0.18 m).

352
10 tonnes/ha of crop residues or trash (Ng Kee Kwonget al. 1987). In Australia, it has been found that, whenurea is applied to trash-covered fields, ammonia lossesof 40% can be expected (Freney et al. 1992). Accord-ingly, in the early 1990s, urea was replaced by sulfateof ammonia, which is less vulnerable to ammoniumion volatilisation. The theoretical acidity produced bysulfate of ammonia is, however, twice that from urea-N, and that may explain the significant increase in soilacidity observed in the 1990s. Contributing causes arepossibly the end of burning, by which no more pH-increasing ashes are returned to the soil, and the yearlyaddition of sugarcane trash, which increases theorganic matter content, resulting generally in a low-ering of the pH (Dalal 1989; Moody and Aitken 1997).
Although the trash harvesting method may favour theorganic matter content (Vallis et al. 1996), in theyoung alluvial soils of Ramu Sugar Plantation it islikely to have resulted in significant acidification.
As mentioned, an important cause for the soil acid-ification trend is the yearly application of urea,sulfate of ammonia and diammonium phosphate.Since these fertilisers contain N in the ammoniumform, nitrification reactions result in acid residues.The acid residue of urea is 71 g protons (H+)/kg N,which is at its maximum equivalent to about 3.6 kgCaCO3 (Adams 1984). For sulfate of ammonia, thepotential soil acidity produced through nitrification isequivalent to 143 g H+/kg N. Diammonium phos-phate has intermediate levels.
Table 3. Changes in soil chemical properties (0–0.15 metres) of Fluvisols and Vertisols under sugarcane (type Idata), 1980s and 1990s.
Fluvisols(n = 7 pairs)
Vertisols(n = 5 pairs)
1982–83 1991–94 Difference 1982–84 1991–94 Difference
pH H2O (1:2.5 w/v) 6.3 5.9 P < 0.001 6.4 6.0 P < 0.001
Available P (mg/kg) 37.2 29.0 P = 0.04 35.4 24.6 ns
CEC (mmolc/kg) 412 354 P < 0.001 450 403 ns
Exchangeable Ca (mmolc/kg) 229 213 ns 269 250 ns
Exchangeable Mg (mmolc/kg) 100 94 ns 109 95 ns
Exchangeable K (mmolc/kg) 11.0 9.5 ns 13.0 10.1 ns
Base saturation (%) 83 88 P = 0.02 87 88 ns
ns = not significant
Table 4. Change in pHw with depth, based on samples from the same site at different times (chronosequential), andfrom different land use sampled at the same time (biosequential).
Chronosequential samples(Type I data)
Biosequential samples(Type II data)
Samplingdepth (m)
Number of sample pairs
1986 1996 Difference Sampling depth (m)
Number of sample pairs
Natural grassland
Continuous sugarcanea
Difference
0–0.15 9 6.2 5.8 P < 0.001 0–0.15 5 6.3 5.8 P = 0.02
0.15–0.30 9 6.2 5.9 P < 0.001 0.15–0.30 5 6.3 6.1 P = 0.02
0.30–0.45 7 6.5 6.1 P = 0.02 0.30–0.50 5 6.6 6.4 P = 0.05
0.45–0.60 7 6.6 6.4 P = 0.01 0.50–0.70 5 6.7 6.6 ns
0.70–0.90 5 6.9 6.8 ns
ns = not significanta Soils were continuously cultivated with sugarcane for at least 10 years.

353
Data on fertiliser application rates from the planta-tion were available only for 1991–95. Records wereincomplete for other years and could not be used.Based on the fertilisers applied at the plantation, thetheoretical produced acidity in kilomoles (kmol) perhectare was calculated for each year from 1991 to1995 (Table 5). Up to 1991, urea was the main ferti-liser applied (L.S. Kuniata, Ramu Sugar Ltd., pers.comm.) but most of the N fertilisers in the mid-1990swere applied as sulfate of ammonia. Diammoniumphosphate was applied only in a very few sugarcaneblocks where P deficiency was suspected.
The total theoretical acidity produced between 1991and 1995 was 57.8 kmoles H+/ha, of which 88% wasproduced by sulfate of ammonia. The average annualaddition of protons with the N fertilisers was11.6 kmol H+/ha. Net changes in soil acidity duringthis period were calculated from the antilog differ-ences between the pHs in 1991 and 1996. The changesin soil pHw were found to be only a small fraction ofthe acidity added with the fertiliser (Table 6).
The resistance of a soil to pH changes after the addi-tion of acid or base is the buffer capacity (pH BC),which generally increases with increasing clay andorganic matter content. The pH BC is a measure of thenumber of protons required to decrease the soil pH,and it is commonly expressed in kmol H+/ha/unit pHor millimoles (mmol) H+/litre (L) soil/unit pH (Helyar
et al. 1990). For alluvial soils under sugarcane, pH BCcan be estimated by dividing the acidity added by thenet changes in soil pHw. Between 1991 and 1996, thesoils had received 57.8 kmol H+/ha (Table 5) whereasthe mean pHw decreased from 6.2 to 5.7. From this, theapproximate pH BC for topsoil (0–15 centimetresdepth) was estimated to be 125 kmol H+/ha/unit pH,which is equivalent to 84 mmol H+/L/unit pH, or96 mmol H+/kg/unit pH, with a topsoil bulk density of1.15 tonnes/cubic metre (m3). This value (125 kmolH+/ha/unit pH) agrees well with values calculated forsimilarly textured soils in New South Wales, Australia(Helyar et al. 1990).
The pH BC allows some estimates of future soilpHw levels to be made. If the current application ratesof 90 kg N/ha in the form of sulfate of ammonia con-tinue, 12.8 kmol/ha/year are added to the soil and thepHw may decrease by one unit in 10 years. Thisimplies that the mean pHw of the soils will havedecreased to 4.7 by the year 2006. However, with thechange to trash harvesting and the expected increase insoil organic matter levels, the pH BC may increase andrates of soil acidification are therefore hard to predict.
In addition to the pH BC, the uptake of nitrate inexcess of cations may also have neutralised some ofthe acidity produced by nitrification (Pierre 1928).Furthermore, it was found that significant acidificationoccurred up to 0.60 m depth (Table 4), which explains
Table 5. Mean annual fertiliser applications at the sugarcane plantation and their theoretical acidity produced.
Year kg N/ha kmoles H+/ha
Urea Diammonium phosphate
Sulfate ofammonia
Total Urea Diammoniumphosphate
Sulfate ofammonia
Total
1991 23 8 0 31 1.6 0.9 0 2.5
1992 27 3 92 122 1.9 0.3 13.2 15.4
1993 10 1 87 98 0.7 < 0.1 12.4 13.1
1994 7 < 0.5 89 96 0.5 < 0.1 12.7 13.2
1995 5 3 90 98 0.4 0.3 12.8 13.5
Source: modified from Hartemink (1998a)
Table 6. Applied acidity and actual changes in soil pHw, 1991–95.
Period Applied aciditykmoles H+/ha/y
Annual decrease intopsoil pHw
Increase in soil acidity moles H+/ha/y
1991–93 10.4 0.10 0.328
1994–95 13.4 0.08 0.398
Mean 11.6 0.09 0.356
Source: modified from Hartemink (1998a)

354
some of the calculated difference between the theoret-ical and net acidity of the topsoils. The decrease insubsoil pH was, however, lower than in the topsoil.Apparently, the acidification front is slowlydescending (Hartemink 1998a).
The decline in topsoil and subsoil pH has a numberof unwanted consequences. Although sugarcane toler-ates a pH range of 5 to 8 (Blackburn 1984), somestudies have shown that optimum yields are obtainedwhen the pH is about 6.0 (Coale and Schueneman1993). In some of the soils under sugarcane, the pHwhad decreased below 5.5, the point at which Albecomes soluble. Although sugarcane is relativelymore tolerant to Al in solution than, for example, maize(Hetherington et al. 1988), a decline in productivitymay be expected. Cation availability is decreased at alower pH because the increase in protons displacescations from the exchange sites, which are subse-quently leached (Haynes and Swift 1986).
Rates of change in soil chemical properties
From 30 sugarcane blocks (13 Fluvisols, 17 Verti-sols), soil chemical data (pHw, CEC, exchangeableCa, Mg, K and base saturation %) were available fromdifferent sampling times. These data were used to cal-culate the rates of change. The difference in yearsbetween the initial soil sample at t0 and the secondsample at t1 was plotted against the difference in themeasured value for each soil chemical property. Dif-ferent functions (linear, logarithmic, polynomial)were fitted through the data, and the function with thehighest correlation coefficient (R) was used to calcu-
late the rates of change. Clear trends with time werefound for pHw, available P, CEC and exchangeable K.
In Fluvisols and Vertisols, the pHw decreased withtime (pHw at t1 minus pHw at t0 < 0), and from a linearequation fitted through the data it was calculated thatthe pHw decrease was about 0.5 and 0.3 units after10 years (t1–t0=10), and 0.7 and 0.4 units after15 years (t1–t0=15) in the topsoils of Fluvisols andVertisols, respectively (Table 7). Rates of change for Pwere higher in Fluvisols (–20 mg/kg after 15 years)than in Vertisols (–11 mg/kg after 15 years) and alsothe decline in CEC was larger in Fluvisols. Changes inexchangeable K were, however, larger in Vertisols (–6.6 mmol charge (mmolc) /kg after 15 years) than inFluvisols (–2.6 mmolc /kg after 15 years).
Field scale heterogeneity
Samples were taken in sugarcane fields in the inter-row and within the rows, and in adjoining naturalgrassland areas that had never been cultivated(Table 8). A pHw difference of 0.6 units was observedbetween topsoils (0–0.15 m) under natural grasslandand within the sugarcane rows. The pHw values of theinter-row were slightly higher than within the sugar-cane rows. Below 0.3 m depth, there were only slightdifferences between sugarcane and natural grassland.
Organic C levels in the topsoils within the sugarcanerows were about 8 g/kg lower than under natural grass-land but on average 2.1 g/kg higher than within the sug-arcane rows. Although the difference between theinter-row and within the rows is small, it may signifi-cantly affect the susceptibility of the soil to compaction
Table 7. Approximate rates of changes in some topsoil (0–0.15 metres) chemical properties of Fluvisols andVertisols.
Major soil groupings
Soil chemical property Line fitteda
aLine fitted through: t1 minus t0 (x-axis) vs value at t1 minus value at t0 (y-axis).
r2 Approximate change after
5 years 10 years 15 years
Fluvisols pHw 1:2.5 pHw = -0.048x 0.301 –0.2 –0.5 –0.7
(13 pairs) Available P (mg/kg) P = –0.098x2 + 0.159x 0.607 –2 –8 –20
CEC (mmolc/kg) CEC = –0.531x2 + 0.374x 0.212 –11 –49 –114
Exchangeable K (mmolc/kg) K = –0.172x 0.182 –0.9 –1.7 –2.6
Vertisols pHw 1:2.5 pHw = –0.029x 0.471 –0.1 –0.3 –0.4
(17 pairs) Available P (mg/kg) P = –0.734x 0.914 –4 –7 –11
CEC (mmolc/kg) CEC = –4.553x 0.265 –23 –46 –68
Exchangeable K (mmolc/kg) K = –0.439x 0.224 –2.2 –4.4 –6.6

355
Table 8. Soil fertility status under sugarcane (within and inter-row) and natural grassland. Values are the arithmeticmean of five samples ± 1 SD (type II data).
Sampling depth (m)
Sugarcane within rows
Sugarcane inter-rows
Natural grassland
pHw (1:5) 0–0.15 6.1 ± 0.3 6.2 ± 0.4 6.7 ± 0.2
0.15–0.30 6.4 ± 0.2 6.6 ± 0.2 6.8 ± 0.3
0.30–0.50 6.8 ± 0.1 6.8 ± 0.3 6.9 ± 0.2
0.50–0.70 6.9 ± 0.1 7.0 ± 0.2 7.1 ± 0.2
0.70–0.90 6.9 ± 0.6 7.0 ± 0.2 7.1 ± 0.2
Organic C (g/kg) 0–0.15 34.1 ± 3.6 32.0 ± 2.4 41.9 ± 9.1
0.15–0.30 29.0 ± 2.8 22.0 ± 7.4 28.7 ± 1.9
0.30–0.50 18.7 ± 4.6 14.6 ± 7.4 17.2 ± 3.3
0.50–0.70 12.7 ± 6.6 10.1 ± 6.6 10.5 ± 4.2
0.70–0.90 9.0 ± 5.1 8.1 ± 4.2 7.9 ± 4.2
Total N (g/kg) 0–0.15 2.3 ± 1.6 1.8 ± 0.3 2.4 ± 0.7
0.15–0.30 1.4 ± 0.2 1.2 ± 0.5 1.6 ± 0.1
0.30–0.50 0.9 ± 0.3 0.7 ± 0.4 0.9 ± 0.2
0.50–0.70 0.6 ± 0.3 0.4 ± 0.4 0.6 ± 0.2
0.70–0.90 0.3 ± 0.3 0.3 ± 0.1 0.3 ± 0.2
Available P (mg/kg) 0–0.15 22 ± 10 22 ± 11 27 ± 10
0.15–0.30 17 ± 10 11 ± 7 16 ± 11
0.30–0.50 7 ± 5 6 ± 4 7 ± 6
0.50–0.70 6 ± 4 6 ± 4 5 ± 3
0.70–0.90 4 ± 2 4 ± 1 5 ± 2
Exchangeable Ca (mmolc/kg) 0–0.15 278 ± 73 280 ± 49 283 ± 48
0.15–0.30 280 ± 61 249 ± 74 246 ± 34
0.30–0.50 283 ± 71 262 ± 70 257 ± 33
0.50–0.70 275 ± 52 274 ± 57 263 ± 24
0.70–0.90 251 ± 21 250 ± 17 270 ± 66
Exchangeable Mg (mmolc/kg) 0–0.15 104 ± 16 91 ± 12 92 ± 15
0.15–0.30 104 ± 19 93 ± 26 83 ± 18
0.30–0.50 116 ± 13 94 ± 21 97 ± 18
0.50–0.70 119 ± 28 101 ± 19 109 ± 21
0.70–0.90 103 ± 9 93 ± 14 106 ± 40
Exchangeable K (mmolc/kg) 0–0.15 10.8 ± 4.9 10.3 ± 5.5 12.8 ± 6.3
0.15–0.30 6.4 ± 5.8 4.1 ± 1.8 5.8 ± 4.4
0.30–0.50 2.5 ± 1.2 2.9 ± 1.2 4.5 ± 4.6
0.50–0.70 2.5 ± 0.7 2.5 ± 0.9 4.3 ± 4.8
0.70–0.90 2.0 ± 0.4 2.5 ± 0.6 4.6 ± 5.1
Source: Hartemink (1998c)

356
as resistance to deformation and soil elasticity isdecreased (see below). The inter-row had a lowerorganic C content in the subsoil, whereas organic C innatural grassland and within the row was comparablewith depth. For the total N content, a similar patternwas followed, with lower content in the topsoils of thesugarcane inter-row as compared to within the rows.
Levels of available P in the topsoils were similar inthe inter-row and within the rows but were lower in thesubsoil of the inter-row. Soils under natural grasslandhad higher levels of available P in the topsoil (+5 mg/kg), but small differences were found with depthbetween grassland and within the sugarcane rows. Theconsiderably higher exchangeable Mg content withinthe sugarcane rows was striking, compared with theinter-row and natural grassland. Also, exchangeableCa levels appeared to be slightly higher within the sug-arcane rows. Exchangeable K was highest undernatural grassland and similar in the topsoils within andbetween the rows of sugarcane. Overall, the datasuggest a similar degree of soil acidification and fer-tility decline as was found with the data from differentsampling times (type I data, see Tables 2, 3 and 4).
Soil compaction
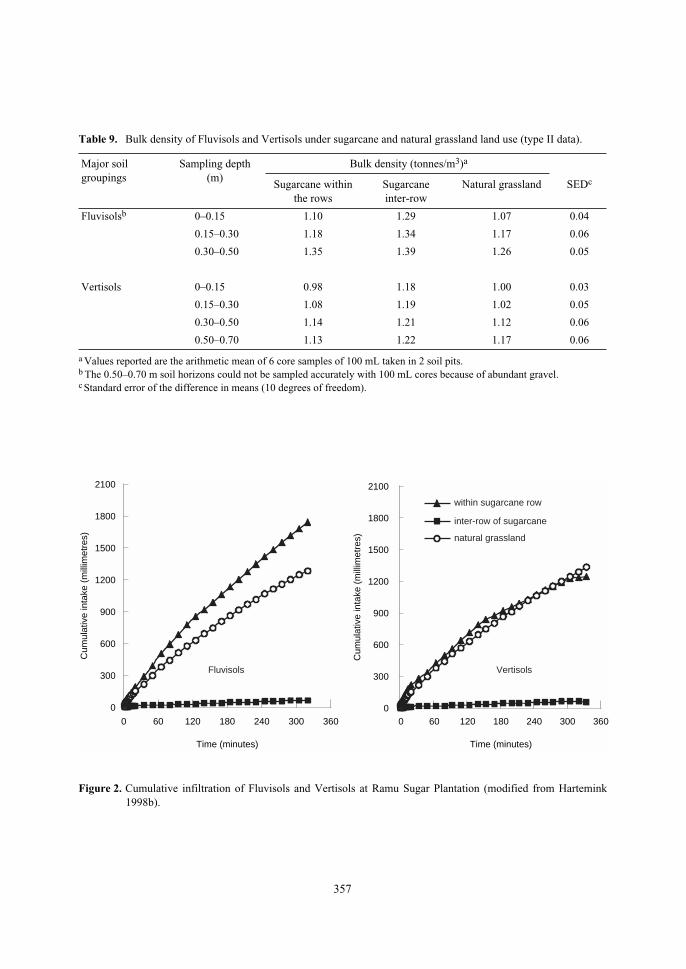
Bulk densities under natural grassland and within thesugarcane rows were similar for all depths of both Flu-visols and Vertisols (Table 9). The bulk densities in theinter-row were, however, significantly higher in the twomajor soil groupings, and in all soil pits it was observedthat roots were absent in the inter-row, a common obser-vation in compacted soils under sugarcane (Harteminkand Wood 1998). The compaction in the inter-row ofthe sugarcane was caused by wheel traffic during har-vesting and other field operations. In the Vertisols, therewas no difference below 0.3 m depth, whereas in theFluvisols the bulk density of the inter-row was alsohigher in the 0.30–0.50 m soil horizon. The absoluteincrease in the topsoil bulk density of the inter-row ascompared to natural grassland was 0.22 tonnes/m3
(+21%) in the Fluvisols and 0.18 tonnes/m3 (+18%) inthe Vertisols. Overall, Fluvisols had significantly higherbulk densities than the finer textured Vertisols.
Water infiltration
Cumulative water intake of natural grassland andwithin the sugarcane rows was very high in both majorsoil groupings (Fig. 2). The high water intake of theVertisols is puzzling as it is commonly found that suchsoils have a low water intake when wet (Ahmad 1983).There may have been some lateral flow, which is
common in double-ring infiltrometers (Lal 1979), andthis may be enhanced in crops like sugarcane that aregrown on ridges. Variation in cumulative water intakewas larger in the Fluvisols than in Vertisols, possiblydue to the non-uniformity of the Fluvisol profile, withlayers having different hydraulic conductivities(Bouwer 1986). Within the sugarcane rows, cumula-tive infiltration rates after five hours were 1322 mm inthe Fluvisols compared to 1200 mm in the Vertisols.Water intake in the inter-row was very low and had notexceeded 105 mm in Fluvisols and 59 mm in Vertisolsafter five hours. Among other consequences, the slowwater intake in the inter-rows may result in soil erosion,which can be particularly high on Vertisols (Unger andStewart 1988) and under sugarcane (Prove et al. 1995)but there were no data available to verify this.
Table 9 and Figure 2 provide evidence for signifi-cantly higher bulk densities and lower infiltration ratesin the inter-row of sugarcane. To investigate the rela-tion between the two parameters, mean infiltrationrates were plotted against topsoil bulk densities for Flu-visols and Vertisols (figure not shown). A negativeexponential relation was observed (i.e. a rapid decreasein water intake with increasing bulk densities). For bothFluvisols and Vertisols, a high correlation (r2 > 0.8)was found between bulk density and mean infiltrationrates. Bulk densities at which mean infiltration wasabove 100 mm/hour after 4 hours were 1.15 tonnes/m3
for Fluvisols and 1.04 tonnes/m3 for Vertisols. Bulkdensities at which infiltration rates were 50 mm/hourduring the first 10 minutes were 1.20 tonnes/m3 forFluvisols and 1.16 tonnes/m3 for Vertisols.
Nutrient budgets
Changes in soil chemical properties indicated adecline in plant nutrient availability. In this section acomparison is made between nutrient inputs andnutrient outputs. Yield data (tonnes/ha) from 1991 to1995 were multiplied with a range of nutrient removaldata (kg nutrient/tonnes/hectare). These were com-pared with the nutrients applied in the fertilisers and thedifference was calculated for the low and high range(Table 10). It appeared that the difference between Nremoval and N applied was positive, that is, more N wasapplied than removed. However, for P and K a negativedifference between removal and fertiliser applicationwas found. Table 11 presents the mean differences forthe three major nutrients. However, this assumes a100% recovery of the fertilisers, which never occurs. Inreality, the balance is therefore much more negative,that is, more nutrients were lost than the data suggest.
357
within sugarcane row
inter-row of sugarcane
natural grassland
VertisolsFluvisols
2100
1800
1500
1200
900
600
300
0
Cum
ulat
ive
inta
ke (
mill
imet
res)
2100
1800
1500
1200
900
600
300
0
Cum
ulat
ive
inta
ke (
mill
imet
res)
0 60 120 180 240 300 360 0 60 120 180 240 300 360
Time (minutes) Time (minutes)
Table 9. Bulk density of Fluvisols and Vertisols under sugarcane and natural grassland land use (type II data).
Major soilgroupings
Sampling depth (m)
Bulk density (tonnes/m3)a
a Values reported are the arithmetic mean of 6 core samples of 100 mL taken in 2 soil pits.
Sugarcane within the rows
Sugarcane inter-row
Natural grassland SEDc
Fluvisolsb 0–0.15 1.10 1.29 1.07 0.04
0.15–0.30 1.18 1.34 1.17 0.06
0.30–0.50 1.35 1.39 1.26 0.05
Vertisols 0–0.15 0.98 1.18 1.00 0.03
0.15–0.30 1.08 1.19 1.02 0.05
0.30–0.50 1.14 1.21 1.12 0.06
0.50–0.70 1.13 1.22 1.17 0.06
b The 0.50–0.70 m soil horizons could not be sampled accurately with 100 mL cores because of abundant gravel.c Standard error of the difference in means (10 degrees of freedom).
Figure 2. Cumulative infiltration of Fluvisols and Vertisols at Ramu Sugar Plantation (modified from Hartemink1998b).
358
Leaf nutrients
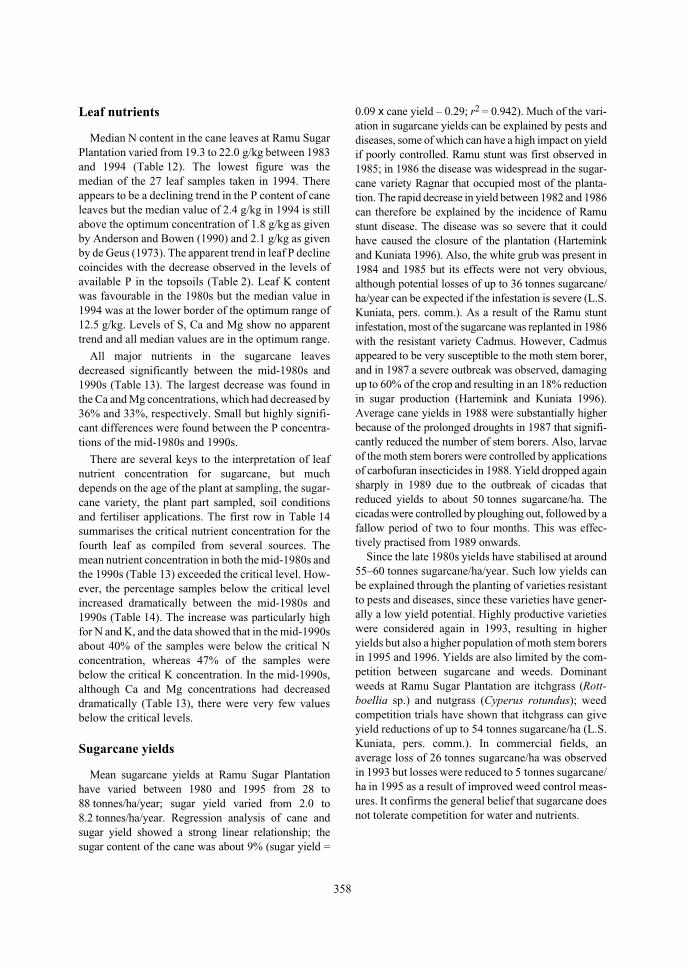
Median N content in the cane leaves at Ramu SugarPlantation varied from 19.3 to 22.0 g/kg between 1983and 1994 (Table 12). The lowest figure was themedian of the 27 leaf samples taken in 1994. Thereappears to be a declining trend in the P content of caneleaves but the median value of 2.4 g/kg in 1994 is stillabove the optimum concentration of 1.8 g/kg as givenby Anderson and Bowen (1990) and 2.1 g/kg as givenby de Geus (1973). The apparent trend in leaf P declinecoincides with the decrease observed in the levels ofavailable P in the topsoils (Table 2). Leaf K contentwas favourable in the 1980s but the median value in1994 was at the lower border of the optimum range of12.5 g/kg. Levels of S, Ca and Mg show no apparenttrend and all median values are in the optimum range.
All major nutrients in the sugarcane leavesdecreased significantly between the mid-1980s and1990s (Table 13). The largest decrease was found inthe Ca and Mg concentrations, which had decreased by36% and 33%, respectively. Small but highly signifi-cant differences were found between the P concentra-tions of the mid-1980s and 1990s.
There are several keys to the interpretation of leafnutrient concentration for sugarcane, but muchdepends on the age of the plant at sampling, the sugar-cane variety, the plant part sampled, soil conditionsand fertiliser applications. The first row in Table 14summarises the critical nutrient concentration for thefourth leaf as compiled from several sources. Themean nutrient concentration in both the mid-1980s andthe 1990s (Table 13) exceeded the critical level. How-ever, the percentage samples below the critical levelincreased dramatically between the mid-1980s and1990s (Table 14). The increase was particularly highfor N and K, and the data showed that in the mid-1990sabout 40% of the samples were below the critical Nconcentration, whereas 47% of the samples werebelow the critical K concentration. In the mid-1990s,although Ca and Mg concentrations had decreaseddramatically (Table 13), there were very few valuesbelow the critical levels.
Sugarcane yields
Mean sugarcane yields at Ramu Sugar Plantationhave varied between 1980 and 1995 from 28 to88 tonnes/ha/year; sugar yield varied from 2.0 to8.2 tonnes/ha/year. Regression analysis of cane andsugar yield showed a strong linear relationship; thesugar content of the cane was about 9% (sugar yield =
0.09 x cane yield – 0.29; r2 = 0.942). Much of the vari-ation in sugarcane yields can be explained by pests anddiseases, some of which can have a high impact on yieldif poorly controlled. Ramu stunt was first observed in1985; in 1986 the disease was widespread in the sugar-cane variety Ragnar that occupied most of the planta-tion. The rapid decrease in yield between 1982 and 1986can therefore be explained by the incidence of Ramustunt disease. The disease was so severe that it couldhave caused the closure of the plantation (Harteminkand Kuniata 1996). Also, the white grub was present in1984 and 1985 but its effects were not very obvious,although potential losses of up to 36 tonnes sugarcane/ha/year can be expected if the infestation is severe (L.S.Kuniata, pers. comm.). As a result of the Ramu stuntinfestation, most of the sugarcane was replanted in 1986with the resistant variety Cadmus. However, Cadmusappeared to be very susceptible to the moth stem borer,and in 1987 a severe outbreak was observed, damagingup to 60% of the crop and resulting in an 18% reductionin sugar production (Hartemink and Kuniata 1996).Average cane yields in 1988 were substantially higherbecause of the prolonged droughts in 1987 that signifi-cantly reduced the number of stem borers. Also, larvaeof the moth stem borers were controlled by applicationsof carbofuran insecticides in 1988. Yield dropped againsharply in 1989 due to the outbreak of cicadas thatreduced yields to about 50 tonnes sugarcane/ha. Thecicadas were controlled by ploughing out, followed by afallow period of two to four months. This was effec-tively practised from 1989 onwards.
Since the late 1980s yields have stabilised at around55–60 tonnes sugarcane/ha/year. Such low yields canbe explained through the planting of varieties resistantto pests and diseases, since these varieties have gener-ally a low yield potential. Highly productive varietieswere considered again in 1993, resulting in higheryields but also a higher population of moth stem borersin 1995 and 1996. Yields are also limited by the com-petition between sugarcane and weeds. Dominantweeds at Ramu Sugar Plantation are itchgrass (Rott-boellia sp.) and nutgrass (Cyperus rotundus); weedcompetition trials have shown that itchgrass can giveyield reductions of up to 54 tonnes sugarcane/ha (L.S.Kuniata, pers. comm.). In commercial fields, anaverage loss of 26 tonnes sugarcane/ha was observedin 1993 but losses were reduced to 5 tonnes sugarcane/ha in 1995 as a result of improved weed control meas-ures. It confirms the general belief that sugarcane doesnot tolerate competition for water and nutrients.

359
Table 10. Nutrient removal (rangea) and nutrient input with fertilisers, 1991–95.
aHighest and lowest removal values as given by Hunsigi (1993) multiplied by the sugarcane yield from the plantation.
Nutrient removal (kg/ha)
Fertiliser applications(kg/ha)
Difference(kg/ha)
N P K N P K
low high low high low high N P K low high low high low high
1991 27 57 8 17 48 119 34 12 0 7 –23 4 –5 –48 –119
1992 33 71 9 21 59 148 115 4 0 82 44 –6 –17 –59 –148
1993 28 60 8 17 50 124 105 1 0 77 46 –7 –16 –50 –124
1994 35 75 10 22 62 156 81 0 0 47 7 –10 –22 –62 –156
1995 35 75 10 22 63 156 83 3 0 48 8 –7 –19 –63 –156
Table 11. Mean difference between nutrientremoval and nutrient input (kg/ha).
Year N P K
1991 –8 –1 –84
1992 +63 –12 –104
1993 +62 –12 –87
1994 +27 –16 –109
1995 +28 –13 –110
Table 12. Macronutrient concentrations (g/kg) of sugarcane leaves at Ramu Sugar Plantation (median valueswith CV%) (type I data).
Year Number of samples
N P K S Ca Mg
1983 481a 22.0 (11%) 3.5 (16%) 15.0 (14%) 1.3 (12%) 2.9 (16%) 1.8 (12%)
1987 69 20.0 (13%) 2.7 (9%) 16.0 (15%) 1.8 (14%) 4.4 (16%) 2.5 (14%)
1989 24 21.0 (12%) 2.9 (17%) 16.1 (15%) 1.8 (30%) 3.5 (21%) 1.7 (13%)
1994 27 19.3 (10%) 2.4 (7%) 12.5 (11%) na 3.1 (20%) 1.3 (17%)
na = not available
a There were only 11 samples of sulfur, calcium and magnesium in 1983.

360
Discussion
In the previous section, evidence was presented forchanges in young alluvial soils under sugarcane cultiva-tion since 1979. Figure 3 summarises the major changesbrought about by continuous sugarcane cultivation atRamu Sugar Plantation. Soil erosion and surface sealingwere not measured but soil compaction and reducedwater infiltration suggest that they may be occurring.
What do these changes in soil properties indicate forthe sustainability of sugarcane cultivation at the plan-tation? Discussion of this question includes sectionson indicators of sustainable land management,threshold values in soil properties, and requirementsfor sustainable land management under sugarcane.
Indicators of sustainability
Sustainability, although a dynamic concept, impliessome sort of equilibrium or steady state (O’Callaghanand Wyseure 1994). Indicators, defined as attributesthat measure or reflect conditions of sustainability(Smyth and Dumanski 1995), should therefore notshow a significant declining trend (Larson and Pierce1994). Zinck and Farshad (1995) have argued that agood indicator is free of bias, sensitive to temporalchanges and spatial variability, and is predictive andreferenced to threshold values. In addition, a usefulindicator is a clear measure of a cause having a wellunderstood effect that can be measured and expressed
in numerical terms (Smyth and Dumanski 1995). Oneof the best indicators of sustainable land management iscrop yield. Yields at the plantation were largely deter-mined by insect pests, diseases and weeds (Harteminkand Kuniata 1996). These caused large variation, andoverall no declining yield trend could be observed.
The significant decrease in soil chemical propertiesat Ramu Sugar Plantation indicates, however, that soilmanagement has not been sustainable. Changes in soilphysical properties give a similar indication. Thesechanges reflect the way in which the soils weremanaged including continuous cultivation with the useof acidifying N fertilisers, the absence of P and K fer-tilisers, and the use of heavy machinery. The long-term data on soil chemical properties indicate agradual decline, but the rates of change in soil physicalproperties are unknown. They may have been broughtabout much faster, although it could not be ascertainedwhether the soil compaction had accumulated withtime (Bakker and Davis 1995) or resulted from onefield operation when the soils were too wet. Moreover,the seasonal effect on bulk density and water intake isunknown. Therefore, soil chemical properties areeasier to use as indicators of sustainable land manage-ment than are soil physical properties.
There were only a limited number of soil chemicalproperties available from the plantation’s recordsthat could be used as indicators. Other data wouldhave been helpful—total N content of the soil or
Table 13. Macronutrient concentrations (g/kg) of sugarcane leaves in the 1980s and 1990s (type I data).
Period Number of samples
N P K Ca Mg
1985–1987 93 20.3 2.8 14.7 4.4 2.4
1994–1996 160 19.4 2.6 13.8 2.8 1.6
Difference P < 0.001 P < 0.01 P < 0.001 P < 0.001 P < 0.001
Source: Hartemink (1998c)
Table 14. Critical nutrient concentration (g/kg) and percentage samples below this level, 1980s and 1990s.
N P K Ca Mg
Critical nutrient concentration 19.0 2.0 13.0 1.5 1.0
% samples < critical level in mid-1980s 17 1 23 0 0
% samples < critical level in mid-1990s 40 17 47 1 3
Source: Hartemink (1998c)

361
microbial biomass, to list two examples (Doran andParkin 1996). In addition, data on surface sealing andwater erosion would have been helpful. There is,however, a cost to collect such data, and for thegeneral assessment presented here the extra cost isunlikely to have been justified by the extra informa-tion obtained. For plantation management, obtainingspatial information on the changes in soil propertiesis probably more useful.
Threshold values
Soil chemical and physical properties have changed,but did they reach levels (thresholds) which affect thesugarcane? The pH levels in 1996 were about 5.8.Although the optimum pH for sugarcane is about 6.5(Yates 1978), sugarcane is successfully grown on soilswith pH 4, as in Guyana, andils with pH over 7, as inmany parts of Barbados. It is therefore unlikely that thecurrent pH levels adversely affect sugarcane produc-tion. Levels of available P (Olsen determination) wereon average over 25 mg/kg, which is a high level forsugarcane (Blackburn 1984). Also, the exchangeablecations remained at favourable levels for sugarcanecultivation. This suggests that the soil chemical prop-erties had not reached threshold values for sugarcanecultivation despite their significant decline. Threshold
values in bulk density were, however, reached,because in all soil pits it was observed that roots wereabsent in the inter-row. These values are about1.3 tonnes/m3 for the Fluvisol topsoils and 1.2 tonnes/m3 for the Vertisol topsoils, and only slightly higherfor the subsoils. Absolutely seen, they are low(< 1.4 tonnes/m3) and most studies with sugarcanehave indicated critical bulk densities of up to 1.8 and1.9 tonnes/m3 for rooting (Blackburn 1984).
A surrogate but more quantitative way to investigatewhether threshold values were reached is by the anal-ysis of tissue samples from the sugarcane, reflectingthe nutrient availability. It was shown that all majornutrients were significantly lower in the sugarcaneleaves in the 1990s (n = 160) compared to the 1980s(n = 93) (Table 9). The number of samples below thecritical nutrient concentration increased dramaticallyin the 1990s: more than two-thirds of the leaf sampleswere deficient in N, about one-fifth were deficient inP, and nearly one-half were deficient in K (Table 10).Although P and K levels in the soil were still favour-able (Tables 2 and 3), the increase in leaf nutrient defi-ciencies provides circumstantial evidence that nutrientavailability was reduced in the 1990s as compared tothe 1980s. This may be the result of soil compactionand acidification.
Trash harvesting
Soilacidification
Ammonium sulfate replaces
urea
No burningno ashes
Addition of organic matter
Continuous sugarcane cultivation
Soil physical changes Soil chemical changes
Reduced nutrientavailability
Decrease in soilorganic matter
Reduced infiltration
Surfacesealing?
Compaction
Reduced wateravailability
Soilerosion
Figure 3. Changes in soil properties under continuous sugar cultivation at Ramu Sugar Plantation(see text for explanation).

362
Requirements for sustainable land management
Changes in soil chemical properties will continue ifcurrent management strategies remain unchanged, butit is not possible to predict at what pace that willhappen. It is likely that the P and K content of the soilwill continue to decrease, since they are not replen-ished by inorganic fertilisers. Applying these nutrientsto maintain favourable levels is, however, only usefulif the soil compaction is dealt with. The regular appli-cation of small quantities of lime prevents the devel-opment of topsoil and subsoil acidity. Liming isusually economical, but may depress the sucrosecontent of the sugarcane (Kingston et al. 1996). Appli-cation rates of 1–2 tonnes of lime/ha when the cane isploughed out may be sufficient to maintain favourablepH levels. Another possibility is to apply non-acidi-fying fertilisers such as calcium–ammonium nitrate,which will not reverse the decrease in pHw, but mayprevent further soil acidification.
Since 1979, organic matter levels have been shownto have decreased by about 40%, but the current prac-tice of trash harvesting is likely to increase soil organicmatter (Wood 1991). Such an increase would affectmany soil properties. For example, the pH BC mayincrease, reducing the acidifying effects of sulfate ofammonia (Hartemink 1998a) but also reducing thecompactibility of the soil by increasing resistance todeformation (Soane 1990). Trash harvesting is there-fore an important step to achieve sustainable landmanagement and is likely to improve sugarcane yields(Yadav and Prasad 1992).
The risk of soil compaction at the plantation couldbe reduced if the overhaul equipment had high flota-tion instead of conventional (small) tyres. Also, striptillage involving smaller tractors and reduced tillageare helpful (de Boer 1997). The topsoil compaction isalleviated when the sugarcane is ploughed out, butdeep tillage or subsoiling is required for the subsoil. Itis recommended for the Fluvisols, but subsoilingcannot be recommended for the Vertisols as it is likelyto result in more compaction (Ahmad 1996). Thesubsoil compaction in the Vertisols (up to 0.3 m) ispossibly one of the only changes in soil properties thatis hard to reverse.
There is a cost to these measures that may notdirectly be compensated for by extra sugarcane. How-ever, the costs to restore degraded soils may be sub-stantially higher than those required to maintain the soilin a favourable condition for sugarcane production.
Acknowledgments
The study on the sustainability of sugarcane cultiva-tion at Ramu Sugar Plantation was undertaken while Iwas soil science lecturer at the PNG University ofTechnology in Lae. I am indebted to Dr Lastus Kuniatafor his overall support and the many interesting discus-sions we have had on sugarcane. Mr Johnson Nero, MrOtto Ngere and Mr Moses Woruba were of greatassistance during the fieldwork.
References
Adams, F. 1984. Crop responses to lime in the southernUnited States. In: Adams, F., ed., Soil Acidity andLiming. Madison, American Society of Agronomy, 211–265.
Ahmad, N. 1983. Vertisols. In: Wilding, L.P., Smeck, N.E.and Hall, F.G., eds, Pedogenesis and Soil Taxonomy. II.The Soil Orders. Amsterdam, Elsevier, 91–123.
Ahmad, N. 1984. Tropical clay soils, their use andmanagement. Outlook on Agriculture, 13, 87–95.
Ahmad, N. 1996. Management of Vertisols in rainfedconditions. In: Ahmad, N. and Mermut, A., eds, Vertisolsand technologies for their management. Developments inSoil Science 24. Amsterdam, Elsevier, 363–428.
Anderson, D.L. and Bowen, J.E. 1990. Sugarcane Nutrition.Norcross, Canada, Potash and Phosphate Institute.
Anderson, D.L., Deboer, H.G. and Portier, K.M. 1995.Identification of nutritional and environmental factorsaffecting sugarcane production in Barbados.Communications in Soil Science and Plant Analysis, 26,2887–2901.
Bakker, D.M. and Davis, R.J. 1995. Soil deformationobservations in a Vertisol under field traffic. AustralianJournal of Soil Research, 33, 817–832.
Blackburn, F. 1984. Sugar-Cane. Harlow, Longman.
Bleeker, P. 1983. Soils of Papua New Guinea. Canberra,Australian National University Press.
Blokhuis, W.A. 1980. Vertisols. In: Land Reclamation andWater Management. Developments, Problems andChallenges. Wageningen, International LandReclamation Institute, Publication 27, 43–72.
Booker Agriculture International. 1979. Ramu Sugar Ltd,Soil Survey Report. London, Booker AgricultureInternational Ltd.
Booker Agriculture International. 1987. Final Report: SoilManagement at Ramu Sugar Plantation Ltd. London,Booker Agriculture International Ltd.
Bouma, J. 1993. Soil behavior under field conditions—differences in perception and their effects on research.Geoderma, 60, 1–14.

363
Bouma, J. 1994. Sustainable land use as a future focus forpedology (a guest editorial). Soil Science Society ofAmerica Journal, 58, 645–646.
Bouwer, H. 1986. Intake Rate: Cylinder Infiltrometer,Methods of Soil Analysis, Part 1, Physical andMineralogical Methods, 2nd edition. Madison, AmericanSociety of Agronomy—Soil Science Society of America,822–844.
Chartres, C.J. 1981. Land resource assessment for sugar-cane cultivation in Papua New Guinea. AppliedGeography, 1, 259–271.
Coale, F.J. and Schueneman, T.J. 1993. Sugarcane responseto limestone and gypsum application on acidic sandysoils. Journal of the American Society of SugarcaneTechnologists, 13, 73–86.
Dalal, R.C. 1989. Long-term effects of no-tillage, cropresidue, and nitrogen application on properties of aVertisol. Soil Science Society of America Journal, 53,1511–1515.
de Boer, H.G. 1997. Strip tillage in sugar cane agriculture:techniques and challenges. Zuckerindustrie, 5, 371–375.
de Geus, J.G. 1973. Fertilizer Guide for the Tropics andSubtropics. Zurich, Centre d’Etude de l’Azote.
Doran, J.W. and Parkin, T.B. 1996. Quantitative indicatorsof soil quality: a minimum data set. In: Doran, J.W. andJones, A.J., eds, Methods for Assessing Soil Quality.Madison, Soil Science Society of Australia, 25–37.
FAO (Food and Agriculture Organization of the UnitedNations). 1996. The State of Food and Agriculture, FAOAgriculture Series No. 29. Rome, FAO.
FAO–UNESCO (FAO–United Nations Educational,Scientific and Cultural Organization) 1988. Soil Map ofthe World, Revised Legend. World Soil ResourcesReport 60, Technical paper 20. Wageningen,International Soil Reference and Information Centre.
Fauconnier, R. 1993. Sugarcane. London, Macmillan;Wageningen, Technical Centre for Agricultural and RuralCooperation.
Freney, J.R., Denmead, O.T., Wood, A. W., Saffigna, P.G.,Chapman, L.S., Ham, G.J., Hurney, A.P. and Stewart,R.L. 1992. Factors controlling ammonia loss from trashcovered sugarcane fields fertilized with urea. FertilizerResearch, 31, 341–349.
Fresco, L.O. and Kroonenberg, S.B. 1992. Time and spatialscales in ecological sustainability. Land Use Policy, 9,155–168.
Garside, A.L., Bramley, R.G.V., Bristow, K.L., Holt, J.A.,Magarey, R.G., Nable, R.O., Pankhurst, C. E. andSkjemstad, J.O., 1997. Comparisons between paired oldand new land sites for sugarcane growth and yield and soilchemical, physical, and biological properties. In: Egan,B.T., ed., Proceedings of the 1996 Conference of theAustralian Society of Sugarcane Technologists. Mackay,60–66.
Greenland, D.J. 1994. Soil science and sustainable landmanagement. In: Syers, J.K. and Rimmer, D.L., eds, SoilScience and Sustainable Land Management in theTropics. Wallingford, CAB International, 1–15.
Greenland, D.J., Bowen, G., Eswaran, H., Rhoades, R. andValentin, C. 1994. Soil, Water, and Nutrient ManagementResearch—A New Agenda. Bangkok, InternationalBoard for Soil Research and Management.
Hartemink, A.E. 1998a. Acidification and pH bufferingcapacity of alluvial soils under sugarcane. ExperimentalAgriculture, 34, 231–243.
Hartemink, A.E. 1998b. Soil chemical and physicalproperties as indicators of sustainable land managementunder sugar cane in Papua New Guinea. Geoderma, 85,283–306.
Hartemink, A.E. 1998c. Changes in soil fertility and leafnutrient concentration at a sugar cane plantation in PapuaNew Guinea. Communications in Soil Science and PlantAnalysis, 29, 1045–1060.
Hartemink, A.E. and Kuniata, L.S. 1996. Some factorsinfluencing yield trends of sugarcane in Papua NewGuinea. Outlook on Agriculture, 25, 227–234.
Hartemink, A.E., Nero, J., Ngere, O. and Kuniata, L.S. 1998.Changes in soil properties at Ramu Sugar Plantation1979–1996. Papua New Guinea Journal of Agriculture,Forestry and Fisheries, 41, 65–78.
Hartemink, A.E. and Wood, A.W. 1998. Sustainable LandManagement in the Tropics: the case of sugarcaneplantations. 16th World Congress of Soil Science.Montpellier, International Society of Soil Science, 7.
Haynes, R.J. and Swift, R.S. 1986. Effects of soilacidification and subsequent leaching on levels ofextractable nutrients in a soil. Plant and Soil, 95, 327–336.
Helyar, K.R., Cregan, P.D. and Godyn, D.L. 1990. Soilacidity in New South Wales—current pH values andestimates of acidification rates. Australian Journal of SoilResearch, 28, 523–537.
Henty, E.E. and Pritchard, G.H. 1988. Weeds of NewGuinea and Their Control. Lae, PNG, Department ofForests, Botany Bulletin No. 7.
Hetherington, S.J.C., Asher, C.J. and Blamey, F.P.C. 1988.Comparative tolerance of sugarcane, navybean, soybeanand maize to aluminum toxicity. Australian Journal ofAgricultural Research, 38, 171–176.
Hunsigi, G., 1993. Production of Sugarcane, Theory andPractice. Berlin, Springer-Verlag.
Kingston, G., Hurney, A.P. and Aitken, R.L. 1996.Depression of CCS in sugarcane after use of limingproducts: economic significance and associations withsoil chemistry and leaf nutrient composition. In: Egan,B.T., ed., Proceedings of the 1996 Conference of theAustralian Society of Sugarcane Technologists. Mackay,164–173.

364
Lal, R. 1979. Physical characteristics of soils of the tropics:Determination and management. In: Lal, R. andGreenland, D.J., eds, Soil Physical Properties and CropProduction in the Tropics. Chichester, John Wiley &Sons, 7–44.
Larson, W.E. and Pierce, F.J. 1994. The dynamics of soilquality as a measure of sustainable management. In:Doran, J.W., Coleman, D.C., Bezdicek, D.F. and Stewart,B.A., eds, Defining Soil Quality for a SustainableManagement. Madison, Soil Management SupportService—American Society of Agronomy, 37–51.
Li, C.S. 1985. Sugar cane pests with special reference tomoth borers in the Markham Valley, Papua New Guinea.Mushi, 50, 3–13.
Löffler, E. 1977. Geomorphology of Papua New Guinea.Canberra, Australian National University Press.
McGarry, D., Bigwood, R.C., Pillay-McGarry, U.P., Bray,S.G. and Moody, P.W. 1996. Is cane damaging the soil? Acomparison of a ten-year old block with the adjoiningtreeline. In: Egan, B.T., ed., Proceedings of the 1996Conference of the Australian Society of SugarcaneTechnologists. Mackay, 189–194.
Moody, P.W. and Aitken, R.L. 1997. Soil acidificationunder some tropical agricultural systems. 1. Rates ofacidification and contributing factors. Australian Journalof Soil Research, 35, 163–173.
Ng Kee Kwong, K.F., Deville, J., Cavalot, P.C. and Riviere,V. 1987. Value of cane trash in nitrogen nutrition ofsugarcane. Plant and Soil, 102, 79–83.
O’Callaghan, J.R. and Wyseure, G.C.L. 1994. Proposals forquantitative criteria in the management of sustainableagricultural systems. In: Syers, J.K. and Rimmer, D.L.,eds, Soil Science and Sustainable Land Management inthe Tropics. Wallingford, CAB International, 27–39.
Parfitt, R.L. and Thomas, A.D. 1975. Phosphorusavailability and phosphate fixation in Markham Valley.Science in New Guinea, 3, 123–130.
Pierre, W.H. 1928. Nitrogenous fertilizers and soil acidity: I.Effect of various nitrogenous fertilizers on soil reaction.Journal of the American Society of Agronomy, 20, 254–269.
Prove, B.G., Doogan, V.J. and Truong, P.N.V. 1995. Natureand magnitude of soil erosion in sugarcane land on thewet tropical coast of north-eastern Queensland.Australian Journal of Experimental Agriculture, 35, 641–649.
Rowell, D.L. and Wild, A. 1985. Causes of soilacidification: a summary. Soil Use and Management, 1,32–33.
Sanchez, P.A., Palm, C.A., Davey, C.B., Szott, L.T. andRussel, C.E. 1985. Tree crops as soil improvers in the
humid tropics? In: Cannell, M.G.R. and Jackson, J.E.,eds, Attributes of Trees as Crop Plants. Huntington,Institute of Terrestrial Ecology, 79–124.
Scholes, M.C., Swift, M.J., Heal, O.W., Sanchez, P.A.,Ingram, J.S.I. and Delal, R. 1994. Soil fertility research inresponse to the demand for sustainability. In: Woomer,P.L. and Swift, M.J., ed., The Biological Management ofTropical Soil Fertility. Chichester, John Wiley & Sons, 1–14.
Smyth, A.J. and Dumanski, J. 1995. A framework forevaluating sustainable land management. CanadianJournal of Soil Science, 75, 401–406.
Soane, B.D. 1990. The role of organic matter in soilcompactibility: a review of some practical aspects. Soiland Tillage Research, 16, 179–201.
Swift, M.J. and Sanchez, P.A. 1984. Biological managementof tropical soil fertility for sustained productivity. Natureand Resources, 20, 2–10.
Tan, K.H. 1996. Soil Sampling, Preparation, and Analysis.Books in soils, plants and the environment. New York,Marcel-Dekker, 408 p.
Unger, P.W. and Stewart, B.A. 1988. Conservationtechniques for Vertisols. In: Wilding, L.P. and Puentes,R., eds, Vertisols: their distribution, properties,classification and management. Texas, Soil ManagementSupport Service—Texas A&M University, 165–181.
Vallis, I., Parton, W.J., Keating, B.A. and Wood, A.W.1996. Simulation of the effects of trash and N fertilizermanagement on soil organic matter levels and yields ofsugarcane. Soil and Tillage Research, 38, 115–132.
van der Veer, K. 1937. Land- en Tuinbouw. In: Klein, W.C.,ed., Nieuw Guinee—Deel II. Amsterdam, J.H. de Bussy.
Wood, A.W. 1991. Management of crop residues followinggreen harvesting of sugarcane in north Queensland. Soiland Tillage Research, 20, 69–85.
Yadav, R.L. and Prasad, S.R. 1992. Conserving the organicmatter contents of the soil to sustain sugarcane yield.Experimental Agriculture, 28, 57–62.
Yates, R.A. 1978. The environment for sugarcane: landevaluation for standards for rainfed agriculture. WorldSoil Resources Report No. 49. Rome, Food andAgriculture Organization of the United Nations, 58–72.
Young, A. 1991. Soil monitoring: a basic task for soil surveyorganizations. Soil Use and Management, 7, 126–130.
Young, A. 1997. Agroforestry for Soil Management, 2nd
edition. Wallingford, CAB International.
Zinck, J.A. and Farshad, A. 1995. Issues of sustainabilityand sustainable land management. Canadian Journal ofSoil Science, 75, 407–412.