sustainable management of school meals programme …
TRANSCRIPT
SUSTAINABLE MANAGEMENT OF SCHOOL MEALS
PROGRAMME FOR NON-FORMAL SCHOOLS IN KIBERA
SLUMS
BY
CHRISTINE A. OMONDI
UNITED STATES INTERNATIONAL UNIVERSITY- AFRICA
SUMMER 2018

SUSTAINABLE MANAGEMENT OF SCHOOL MEALS
PROGRAMME FOR NON-FORMAL SCHOOLS IN KIBERA
SLUMS
BY
CHRISTINE A. OMONDI
A Project Report Submitted to the Chandaria School of Business
in Partial Fulfilment of the Requirement for the Degree of Master
of Science in Management and Organizational Development
(MOD)
UNITED STATES INTERNATIONAL UNIVERSITY -AFRICA
SUMMER 2018
i
STUDENT’S DECLARATION
I, the undersigned, declare that this is my original work and has not been submitted to any
other college, institution or university other than the United States International University in
Nairobi for academic credit.
Signed: ________________________ Date: _____________________
Christine Omondi (ID 638146)
This project has been presented for examination with my approval as the appointed
supervisor.
Signed: ________________________ Date: _____________________
Dr Oliver Amwayi
Signed: _______________________ Date: _____________________
Dean, Chandaria School of Business

ii
COPYRIGHT
No part of this project may be produced or transmitted in any form or by any means
electronic, magnetic tape or mechanical including photocopy, recording on any information
storage and retrieval system without prior written permission from the author. Only the
United States International University-Africa can make copies for academic purposes
©Copyright by Christine A. Omondi, 2018

iii
ABSTRACT
The purpose of this study was to examine the sustainability of the School Meals Programme
management in Non-formal schools in Kenya’s Kibera slums. Kibera is home to about
200,000 people living in a 2.5 km2 area most of whom survive on less than a dollar a day.
The study sought to answer the following research questions: Who are the stakeholders in the
School Meals Programme (SMP) in the Non-formal schools of Kibera Slums and what are
their roles? What management structures are used by the Non-formal schools in Kibera and
how do they affect the implementation of the program? What challenges are faced by such
schools in implementing the School Meals Programme and how can they be resolved?
The study adopted a descriptive survey research design where a sample of 17 was drawn
from the population of the Non-formal schools in Kibera. Data was collected through
interviews using a questionnaire which was augmented by secondary data from official
Government of Kenya, World Food Programme and Feed the Children sources. The
respondents were teachers and pupils from the selected schools. Since the data collected was
largely quantitative, descriptive analysis technique was employed. After collection, the data
was cleaned and analysed using the Statistical Package for Social Sciences (SPSS) and excel.
The results were presented using tables, figures and graphs.
The findings revealed that the stakeholders in the SMP in Kibera slums included teachers,
donors, parents, the community, cooks, Nairobi City County Education Department (CED),
Ministry of Education and the School Management Committee. Their roles included training,
monitoring curriculum implementation and management of the SMP to ensure quality of
food supplies and sustainability of the programme. The study also found out regarding the
management structures, that the schools had governing bodies that took different forms and
met at varying intervals of time. The challenges faced by the schools in implementing the
programme included inadequate financial and in-kind support for the School Meals
Programme by parents, minimal follow up by the City Education Department as well as over-
reliance on donors to provide food and training for efficient management of the program.

iv
It was concluded from the study that: Non-formal schools in Kibera slums rely heavily on
donors to support the School Meals Programme through monitoring, trainings and provision
of commodities; secondly, the school management structures are not engaging adequately in
the School Meals Programme resulting in inconsistent remittance of funds by parents hence
the over reliance on donor support. The study recommends that because the School Meals
Programme in the non-formal schools, just like in the formal schools is so critical in ensuring
that pupils from such under privileged backgrounds are educated, all the stakeholders should
work together to put in place the necessary structures to ensure the programme is sustainable.
This could be achieved by reducing over-reliance on donors, enhancing parent’s commitment
and the Government intensifying its supervisory and supportive role in the schools. Since
pupils attending these schools are as needy as those being supported in the Arid and Semi-
Arid areas of Kenya, the Government need to also consider including the urban needy
schools, both formal and non-formal with a catchment of the informal settlements, into the
national school feeding programme. Indeed, this will go a long way in assuring a child at
least one meal per school day while the country makes big steps in achieving its education
for all agenda. Along with the School Meals Programme in the schools, partnerships should
be enhanced towards sustainable community income generating projects for the parents to
enable them to provide for their pupils’ needs.
v
ACKNOWLEDGEMENT
I wish to acknowledge the support given to me by different people enabling my completion
of this study.
To my family members, I acknowledge your support in understanding and encouraging me at
all levels even in times when I felt like giving up. Special thanks to my husband for moral
support, insightful advice and contributions given along the way.
Others I wish to acknowledge are my USIU-AFRICA group two members for continuous
encouragement and moral support, the research enumerators for leaving the comfort of your
premises to go out into the Kibera slums to collect the data that was so useful for this study.
Finally, I wish to acknowledge the help from my supervisor Dr Oliver Amwayi whose
expertise and dedication enabled me to complete this study.
All glory to God for his strength and grace through all times.

vi
DEDICATION
Dedication to my dear husband Elly and lovely children, Leroy, Jeanette and Jeremy.

vii
TABLE OF CONTENTS
ABSTRACT .......................................................................................................................................... iii
ACKNOWLEDGEMENT ...................................................................................................................... v
DEDICATION ...................................................................................................................................... vi
TABLE OF CONTENTS ..................................................................................................................... vii
LIST OF TABLES ................................................................................................................................ ix
LIST OF ABBREVIATIONS ................................................................................................................ x
CHAPTER ONE ..................................................................................................................................... 1
1.0 INTRODUCTION ...................................................................................................................... 1
1.1 Background of the Problem ..................................................................................................... 1
1.2 Statement of the Problem ......................................................................................................... 5
1.3 Purpose of the Study ................................................................................................................ 6
1.4 Research Questions .................................................................................................................. 6
1.5 Significance/Importance of the Study ...................................................................................... 7
1.6 Scope of the Study ................................................................................................................... 8
1.7 Definition of Terms .................................................................................................................. 8
1.8 Chapter Summary..................................................................................................................... 9
CHAPTER TWO .................................................................................................................................. 10
2.0 LITERATURE REVIEW.......................................................................................................... 10
2.1 Introduction ............................................................................................................................ 10
2.2 Stakeholders of the School Meals Programme in Non-formal Schools and their Roles ........ 10
2.3 Management Structures of Non-formal Schools and their Effect on Implementation of
School Meals Programme ...................................................................................................... 14
2.4 Challenges faced by Non-formal schools in the Implementation of the School Meals
Programme ............................................................................................................................. 17
2.5 Chapter Summary................................................................................................................... 20
CHAPTER THREE .............................................................................................................................. 21
3.0 RESEARCH METHODOLOGY .............................................................................................. 21
3.1 Introduction ............................................................................................................................ 21
3.2 Research Design ..................................................................................................................... 21
3.3 Population and Sampling Design ........................................................................................... 22
3.4 Data Collection Methods ........................................................................................................ 25
3.5 Research Procedures .............................................................................................................. 26

viii
3.6 Data Analysis Methods .......................................................................................................... 27
3.7 Chapter Summary................................................................................................................... 27
CHAPTER FOUR ................................................................................................................................ 28
4.0 RESULTS AND FINDINGS .................................................................................................... 28
4.1 Introduction ............................................................................................................................ 28
4.2 General Information ............................................................................................................... 28
4.3 The Stakeholders of the School Meals Programme (SMP) in the Non-formal Schools of and
their Roles .............................................................................................................................. 32
4.4 Management Structures used by the Non-formal Schools and how they Affect the
Implementation of the Program ............................................................................................. 36
4.5 Challenges Faced by Non-formal Schools in Implementing the School Meal Program and
how they can be solved .......................................................................................................... 39
4.6 Chapter Summary................................................................................................................... 46
CHAPTER FIVE .................................................................................................................................. 47
5.0 DISCUSSIONS, CONCLUSIONS AND RECOMMENDATIONS ........................................ 47
5.1 Introduction ............................................................................................................................ 47
5.2 Summary ................................................................................................................................ 47
5.3 Discussions ............................................................................................................................. 49
5.4 Conclusions ............................................................................................................................ 55
5.5 Recommendations .................................................................................................................. 56
REFERENCES ..................................................................................................................................... 58
APPENDIX I: Sampling frame ............................................................................................................ 63
APPENDIX II: Guided Questionnaire ................................................................................................. 64

ix
LIST OF TABLES
Table 3.1: Population Distribution of Non-Formal Schools under the SMP
in Kibera …………………………………………………………… .23
Table 3.2: Sample Size Distribution Table …..................................................... .25
Table 4.1: Age of the Schools and the School Meals Programme …....................... .29
Table 4.2: School Enrolment Before and After the Introduction of SMP............ .30
Table 4.3: Comparison between Current School Enrolment and Attendance
with SMP ……………………………………………………………. .32
Table 4.4: Sponsors of the School Meals Programme..........................…………. .33
Table 4.5: Frequency Table on Training on SMP Management............................ .34
Table 4.6: Frequency of Monitoring of the School Meals Programme....................... .35
Table 4.7: Frequency of Stakeholders Ensuring Quality of Food Supply............. .35
Table 4.8: Role of Initiation of Projects to Sustain SMP....................................... .36
Table 4.9: School Registration Type and Registering Ministry............................. .37
Table 4.10: Crosstab Frequency of Meetings and Parents Contribution to SMP…. .37
Table 4.11: Supervisory Visits by External Officials............................................... .38
Table 4.12: Pupils’ Perception of the Meals.......................................................... .39
Table 4.13: Rate of Parents’ Payments and Reasons for Non-Payment................... .40
Table 4.14: Cross Tabulation of Frequency of Management Meeting and Percentage
of Parents Contributing........................................................................... .41
Table 4.15: School Kitchen Standards........................................................................ .42
Table 4.16: Cooks Adherence to Hygienic Standards................................................. .42
Table 4.17: Training on SMP Management................................................………… .43
Table 4.18: Ability of Schools to sustain SMP after Donor’s Withdrawal....……… .44

x
LIST OF ABBREVIATIONS
APBET - Alternative Basic Education and Training
CBO - Community Based Organisation
CED - City Education Department
EFA - Education for All
FBO - Faith Based Organisation
FPE - Free Primary Education
FTC - Feed the Children
GCNF - Global Child Nutrition Foundation
IMF - International Monetary Fund
KESSP - Kenya Education Sector Support Programme
MDG - Millennium Development Goals
MOEST - Ministry of Education Science and Technology
NEPAD - New Partnership for African Development
NFE - Non-Formal Education
NFS - Non-Formal Schools
NGO - Non- Governmental Organisation
PCD - Partnership for Child Development
SDG - Sustainable Development Goals
SMP - School Meals Programme
UNDP - United Nations Development Programme
UNESCO - United Nations Educational Scientific and Cultural Organisation
UPE - Universal Primary Education
WFP - World Food Programme
1
CHAPTER ONE
1.0 INTRODUCTION
1.1 Background of the Problem
The Non-Formal Settlements of Kibera, the area within which the schools under study are
located, is East Africa's largest slum. It is home to about 200,000 people from Kenya’s 42
tribes and many religious groups. These Kibera residents have for the most part peacefully
co-existed in the 2.5 square kilometre area. The common underlying factor facing them is
poverty. Space for expansion of houses, schools and latrines is also limited. Indeed, access
roads are narrow making it difficult for rescue teams to reach the residents during disasters
leading to massive losses which in many cases can be avoided (Bary, 2011).
The unplanned urban settlements have many vulnerable children who are poverty stricken
and malnourished. They include HIV/AIDS orphans, street children and under-age domestic
workers. Most of these children come from families that live below the poverty line and are
therefore not able to afford adequate meals. School attendance is below the national average
as most children in these settlements spend most of the time hawking and scavenging in
dumping sites. Inevitably they end up in prostitution or drug abuse, Ministry of Education
[MOE] and World Food Programme[WFP] (2007). These challenges often keep them within
the cycle of poverty which education can help them break.
Illiteracy is a global problem especially in the developing world. Development workers
across the globe have recognized education as a major pillar in achieving development in any
country. During the Millennium Declaration Summit in 2000, the then President of Kenya
was among 147 Heads of States who adopted the eight Millennium Development Goals
(MDGs) that were to be achieved by 2015. One of the MDGs applicable to this study is the
achievement of Universal Primary Education for all. Before this, Kenya had introduced the
cost-sharing policy in the late 1980s in response to the International Monetary Fund (IMF)-
promoted Structural Adjustment Programs. Each school set its own contribution level
through its Parents-Teachers Association which parents had to pay, leading to many poor
children not being able to go to school (MOE and WFP, 2007).

2
According to the Kenya National Bureau of Statistics (2010) in the Kenya Economic Survey
(2010), for Kenya to achieve the second Millennium Development Goal (MDG 2) of
Universal Primary Education for all by 2015, key programs were to be put in place including;
the introduction of the Free Primary Education in 2003 and the School Meals Programme
which was initiated in 1980. The benefiting schools were expected to offer quality and
standard education because of these interventions (MOE and WFP, 2007).
Schools situated in marginalized locations such as the Arid and Semi-Arid Lands and the
informal settlements did not achieve increased pupil enrolment even after scrapping the
costs. This phenomenon was attributed to other factors including lack of food for the children
even in their homes. It was then realized that introduction of school meals would play a key
role in sustaining the gains of Free Primary Education. The 2005 Sessional Paper on Policy
Framework for Education, approved by Parliament, highlighted the need for school meals,
called for expansion of the programme and encouraged communities to provide mid-day
meals to needy pupils (MOE and WFP, 2007).
The Kenya Education Support Programme (KESSP) also provided an institutional framework
with School Meals being one of the four components of the School Health, Nutrition and
Feeding Program. The 2008 National Nutrition and Food Security Policy, includes a section
on school meals, citing the need to enhance and expand the School Meals Programme (MOE,
2008).
School Meals Programme acts as critical safety net for chronically food insecure
communities. In Kenya, for example, an external evaluation of the School Meals Programme
by WFP revealed that the benefits of school meals were numerous. The importance of school
meals as a safety net was also demonstrated by the fact that for more than half of the
supported school children, the mid-day meal provided by the school was the only meal they
had (MOE and WFP, 2007).

3
According to the WFP (2009), the immediate objectives of the School Meals Programme are;
to increase enrolment, prevent drop-out and stabilize attendance in assisted pre-primary and
primary schools, improve the attention span and ultimately the learning capacity of pupils by
relieving short-term hunger, provide a significant contribution to the nutrient intakes of pre-
primary and primary school pupils and assist school committees and communities in the
identification and development of enterprises to sustain the School Meals Programme.
At the national level, as highlighted by the Global Child Nutrition Foundation-Partnership for
Child Development (GCNF-PCD) meeting on Home-Grown School Meals Programme, held
in Accra in June 2010. The plan was to shift school meals ownership to National
Governments and mainstream it into National Policies. The Government of Kenya launched
a Home-Grown School Meals initiative which targeted 550,000 pupils previously assisted
directly by World Food Programme, clearly demonstrating its commitment to supporting the
School Meals Programme. The initiative involves cash transfers to schools for local purchase
of food towards a long-term handover strategy to the Government (WFP, 2009). The
programme however only targets public formal schools and not those that are non-formal.
Kiura (2008), defines Non-formal education as any organized learning activity outside the
structure of the formal system that is consciously aimed at meeting specific learning needs of
sub-groups in the community, be they children, youth or adults. Out of the 411 Non-formal
schools mapped out in Nairobi, only 9.5percent (39) were registered with the Ministry of
Education. Majority of these institutions are registered with other Government Ministries
such as the Ministry of Sports, Culture and Social Services as self-help groups, Ministry of
Home Affairs as NGOs, the Attorney General’s Office as private enterprises, while some are
registered by the NGOs Bureau. As is true for many developing countries, administrative
data in Kenya is only available for schools, teachers and students in the formal Government
sector. Low-cost private and Non-formal educational institutions serving the slums are often
not covered by administrative statistics (Epari, Ezeh, Mugisha and Ogollah, 2008).

4
Establishment of a School Meals Programme in the slum schools has led to more children
being attracted and retained to complete their basic education. These children have hope for a
better future, with a better chance to build a career that will contribute to lifting their parents’
and siblings’ lives from the vicious cycle of poverty. However, this program also faces
several challenges including: seasonal migration affecting school attendance; lack of
sustainable funding for maintenance and expansion of school meals; lack of uniformity in
standards and meal provisions; weak institutional arrangements; lack of stable infrastructure
and political instability. There is also a need to improve the cooking, food safety and
preparation standards (MOE and WFP, 2007).
According to MOE, (2008). The main challenge of Non-formal schools in informal urban
settlements such as Kibera is the dependence on donations and parents’ contributions to
sustain the School Meals Programmes as opposed to the formal schools which are more
structured and tend to benefit more from initiatives championed through the Government.
Relying on donations means that the program can only run when the funds or food are
available. It is important to note that most of these community schools are managed by one
founder or are faith-based without frequent monitoring by Government education officers
who are already overstretched with monitoring the formal schools. This has resulted in most
of these schools offering substandard education to the pupils.
MOE and WFP, (2007) explains that the shortcoming of education standards in non-formal
schools has been escalated by reliance on donors for the payment of teachers, building of
school infrastructure and purchase of learning materials. The schools rely on the few teachers
that they can afford who are mainly untrained and this to a large extent, compromises the
quality of education offered. The benefits of a sustainable School Meals Programme in these
schools would include; high enrolment, retention, performance, better health, more girls
enrolled and retained will be realized, and ultimately the Sustainable Development Goal
number four, which the (United Nations Development Programme [UNDP], 2016),
highlights as focusing on quality education that ensures inclusive, equitable, quality
education and promotion of lifelong learning opportunities for all.

5
1.2 Statement of the Problem
The realisation that globally, 103 million youths still lack basic literacy skills was the driving
force for the Sustainable Development Goal number four which focuses on quality education
that ensures inclusive, equitable, quality education and promotion of lifelong learning
opportunities for all UNDP (2016). According to Jomaa, McDonell, and Probart (2011),
School Feeding Programs (SFPs) are intended to alleviate short-term hunger, improve
nutrition and cognition of pupils, and transfer income to families. The program is therefore a
key strategy for attracting and maintaining the pupils in school as they learn and address the
hunger problem. According to Cook and Karen (2009), child hunger is an educational
problem because the pupils cannot concentrate in school, leading to low academic
performance. They also end up with social and behavioural problems because they cannot
adapt to environmental stress. Unfortunately for children growing up and schooling in the
slums, stress is part of their daily life, from lack of food, sick or no parents and violence
amongst other factors.
Cook and Karen (2009), further highlights that child hunger is also a workforce and job
readiness problem, noting that workers who experience hunger during childhood are less
competitive and efficient because of their limited education and technical skills. The pupils
from the slums go without meals often because of poverty and the feeding program serve as
the only nutritious meal they have in a day. It is therefore critical for stakeholders to
emancipate this generation by investing in a sustainable School Meals Programme both in the
formal and non-formal schools. With the government effort to encourage free primary
education, the formal schools in the slums are overwhelmed by the number of pupils yet the
infrastructure and teachers are not commensurate with the need. The number of Non-formal
schools have since continued to rise taking opportunity of the increased pressure in the
public-school facilities.
6
This study sought to discover how sustainable the management of the School Meals
Programme was in Non-formal schools given the unique challenges and context faced by
these schools. This was because, studies have been carried out on the impact and challenges
faced in the non-formal schools in slums including Kibera such as that conducted by Elias
(2014) on factors influencing the functioning of non-formal schools. However, no study was
identified during the literature review that delved specifically into the subject of sustainable
management of School Meals Programme amongst the non-formal schools, hence the need
for this study.
Secondly, the Non-formal settlements of Kibera, where this study was undertaken has Non-
Formal schools which have been having School Meals Programmes in one form or another
though not consistently over time. With better management and sustainable School Meals
Programme in these schools, the benefits of the program including high enrolment, retention,
performance, better health and more girls enrolled and retained can be realized and ultimately
contribute to the sustainable development goal of quality education for all by 2030.
1.3 Purpose of the Study
The purpose of this study was to assess the sustainability of the School Meals Programme
management in the Non-Formal schools in the Kibera slums of Nairobi.
1.4 Research Questions
The study sought to answer the following research questions:
1.4.1. Who are the stakeholders in the School Meals Programme (SMP) in Kibera Slums
and what are their roles?
1.4.2. What management structures are used by the Non-formal schools in Kibera
and how do they affect the implementation of the program?
1.4.3. What challenges do Non-formal schools in Kibera face in implementing the
School Meals Programme and how they can be resolved?

7
1.5 Significance/Importance of the Study
The findings of this study will be important to the following groups of people:
1.5.1. Ministry of Education (MOE)
The Ministry will be informed on the importance and need to provide oversight and support
to the Non-formal schools, by the identification of existing gaps in the implementation of the
program and how to address them, with the realisation that they contribute to the
achievement of the SDG number four on quality education for all and ultimately also
significantly, contribute to educating the country’s labour force.
1.5.2. The School Administration
The study is expected to identify gaps in the management of the program as well as make
recommendations on improving the management structures of the non-formal schools with a
view to making the School Meals Programme more sustainable.
1.5. 3. Sponsors and Donors
The findings of the study will give feedback to the sponsors or donors on how their
assistance is making a difference and may stimulate them to find better ways of offering
support especially with consideration of strengthening the capacities of schools’ community
and the Government.
1.5. 4. Parents
The study is expected to contribute to a better understanding by parents on the need to take
up their role in the management of the program and participate more in innovations towards
having sustainable local solutions to feeding the pupils regularly.
1.5.5. Academicians and Researchers.
The study has also generated useful data and information that will be of interest to both
academicians and researchers working in quality education for all as captured in goal number
four of the Sustainable Development Goals. Moreover, it will lead to the growth of
knowledge within the field of organizational development.

8
1.6 Scope of the Study
The study was undertaken in the informal settlements of Kibera in Nairobi City County.
Kibera slum is the biggest Non-formal settlement in Kenya and has a sizeable number of
Non-formal schools. The study conducted was limited to a sample of 23 schools, drawn from
the list of the Non-formal schools in Kibera. The main limitation of the study was that most
of the Non-formal schools are managed by individuals who were the only ones with reliable
information or with permission to give out information about how the program runs in that
specific school. Their presence in the school at the time of data collection was crucial to the
success of this study. To ensure this, appointments were booked in advance with them.
1.7 Definition of Terms
1.7.1. Formal Schools
According to the Basic Education Act (2017), A formal or public school is a school
maintained or assisted out of public funds (NCLR, 2017).
1.7.2. Home-Grown School Meals Programme
Home-Grown School Meals Programme (HGSMP) is a school feeding program modality that
provides food produced and purchased within a country to the extent possible (WFP, 2009).
1.7.3. Non-formal Schools
Non-formal education is any organized, systematic, educational activity, conducted outside
the framework of the formal system, to provide selected types of learning to sub-groups in
the population (Gathumbi, 2013).
1.7.4. School Meals Programme
School Meals Programme is a program that alleviates hunger while supporting education,
health and community development. School feeding can take different forms: providing
school meals or snacks to be eaten during school hours or distributing dry take home food
rations to pupils at the end of each month or school term if they attended school regularly
WFP (2009). In this document the term is used interchangeably with School Feeding
Programme.

9
1.7.5. Sustainability
Sustainability is ensuring that future generations have at least the same value of capital
available to allow them to attain at least the same level of utility as the current generation
(UNDP, 2011).
1.7.6. Donor
A donor is a person who gives money or something else of value to an organisation. The
donation is often in line with the donor’s agenda or mandate (Cambridge, 2008).
1.8 Chapter Summary
This chapter has covered the background of the study by highlighting the importance of
encouraging the increase of school enrolment towards the achievement of goal number four
of the Sustainable Development Goals which focuses on quality education for all. It also
brings out the importance of the School Meals Programme in educational performance and
the need to enhance its sustainability in the Non-formal schools. It lays down the purpose,
research questions and significance of the study as well as the scope of the study in terms of
the population, location and limitations of the study. The chapter concludes with a brief but
concise definition of the key terms used in the study. Chapter two covers the literature
review, presenting and discussing both conceptual and empirical literature on the topic of the
study.

10
CHAPTER TWO
2.0 LITERATURE REVIEW
2.1 Introduction
This chapter presents and discusses literature that is relevant to the research questions: Who
are the stakeholders of the School Meals Programme (SMP) in the Non-formal schools of
Kibera Slums and what are their roles? What management structures are used by the Non-
formal schools in Kibera and how do they affect the implementation of the program? What
challenges do Non-formal schools in Kibera face in implementing the School Meals
Programme and how can they be resolved? The discussion has cited conceptual and
empirical works by various scholars highlighting their relevance to this study.
2.2 Stakeholders of the School Meals Programme in Non-Formal Schools and their
Roles
The School Meals Programme in the Non-formal schools have several stakeholders who are
either direct or indirect beneficiaries of the program. These stakeholders have been
recognised by various writers as highlighted in this chapter.
2.2.1 Pupils
The first stakeholder group in the School Meals Programme are the pupils, the direct
beneficiary who need food provided for them to learn without hunger pangs, be healthy
enough to remain in school without illnesses related to lack of good nutrition and be able to
concentrate and understand what is being taught ultimately translating to an empowered
person. The Kenya Bureau of Statistics (2008) reiterates this by explaining that education
empowers a person to be able to participate in the development process by inculcating in
them the knowledge and skills needed to improve their income generating potential and
subsequently their quality of life. Moreover, education of girls and women help in improving
other human development indicators. The pupils should also be involved in matters affecting
them as stipulated in Article 12 of the United Nations Convention on the Rights of the Child
(UNCRC), that sets out the rights of children and young people to express an opinion and to
have that opinion taken into account on any matter that affects them (United Nations High
Commission for Human Rights [UNHCHR], 1990).

11
The role of pupils is to attend school and by doing so, benefit from the food which enables
them to concentrate in class and ultimately perform well in their studies. In addition, the
pupils should be able to engage the school administration on issues of the quality and
quantity of the meals provided. Although literature on the roles of pupils in the School Meals
Programme especially in the Non-formal school set up is scanty, a study commissioned by
the Welsh Government (2011) suggested that developing children and young people’s
participation is beneficial for individuals, organisations and communities. The study noted
that pupils who participate in decision-making enjoy enhanced self-esteem and motivation,
gain important personal, social and organisational skills, and become familiar with group and
democratic processes. The study also found that at the organisational level, pupil
involvement in decision-making leads to better relationships, more relevant and effective
policies, and better learning. Ideally, pupils and adults should work together as partners to
ensure that their school provides the best possible learning environment for all (Welsh
Government, 2011).
2.2.2 Parents
The second stakeholder group are the parents of the pupils attending the schools
implementing the School Meals Programme. The World Food Programme identifies parents
as important stakeholders to the School Meals Programme, through the Parents Teachers
Association, where they play the role of ensuring the school is run professionally, standards
of education are maintained, and the School Meals Programme is sustained in the school
(WFP and MOE, 2007). The Basic Education Act (2017), also recognises that parents are
members of the School Management Committee and that their wishes must be considered in
the decisions concerning the school (NCLR, 2017).
2.2.3 School Management
The third stakeholder is the school management including; the head teacher, the other
teachers, the Schools Management Committee (SMC) members and the Board of
Management (BOM). They are responsible for ensuring that the School Meals Programme
meets its objectives leading to the school performance improving with more children being
attracted to attend the schools and participate in learning actively.
12
According to the WFP and MOE (2007), the role of the school management is to ensure
smooth running of the School Meals Programme by ensuring the resources coming into the
school are efficiently and transparently collected, utilized and accounted for. This includes
provision of the food, water, fuel, storage facilities, kitchens, cooks and ensuring
sustainability of the School Meals Programme. The Basic Education Act (2017) has also
outlined the roles of the School committee which includes advising on matters related to the
management of the school (NCLR,2017).
2.2.4 The Community
The fourth stakeholder is the community that hosts the school. The Basic Education Act
(2017) recognises that the community greatly influences decisions made concerning the
school. The World Food Programme concurs with this, reiterating that the community should
support the School Meals Programme by providing security for the school, its pupils and
food stocks. It is with their good will that the school activities including the School Meals
Programme can move on successfully. Using locally sourced food, school feeding programs
benefits not only pupils, but also farmers, communities and local economies (WFP, 2013).
2.2.5 The Government
The fifth stakeholder is the Government-both national and county-which is interested in the
development of the workforce of the country. According to the Government of Kenya
Economic Survey (2010), the role of the Government is seen through the Ministry of
Education with the Government putting in place several policies to ensure education for all
by year 2030, and to guide the implementation of the endorsed curriculum and School Meals
Programmes in the supported schools. The Basic Education Act (2017) spells out the role of
the Government in education as that of ensuring quality basic education that is conforming to
the set standards and norms. They monitor functioning of schools as well as coordinate the
various partners in the education sector (NCLR, 2017).
Through the Nairobi City County Education Department, the city schools both formal and
Non-formal should be monitored to ensure they meet required education standards. It is
however important to note as indicated in the report on the Kenya education management
capacity assessment, that the education officers are constrained in number and do not have
13
adequate skills to support learning of pupils, MOE (2008). Due to this limitation, the Non-
formal schools are bound to suffer lack of adequate oversight, negatively impacting on their
performance. According to Ministry of State for Planning, National Development and Vision
2030 (2012) the Government supports the School Meals Programme by provision of funds,
encouraging the donors, ensuring accountability of resources provided to the targeted
schools, creating and enforcing policies and laws encouraging all children to be taken to
schools. The Government is also committed to the provision of quality education, training
and research for all Kenyans, towards achievement of vision 2030.
2.2.6 Donors
The sixth key stakeholder group are the donors and other development partners such as Feed
the Children (FTC) and WFP, which is the largest donor of school feeding programmes in the
world. Globally in 2008, WFP reached an average of 22 million school going children in 70
countries. The WFP’s School Meals Programme in Kenya is one of the largest and most
long-standing since 1980 (WFP, 2009).
Donors are interested in value for their money. Their role in the School Meals Programme is
to provide the food support in kind or through cash donations used to purchase food for the
school going children. The donors also offer technical support to the School Meals
Programme as needed. The development partners have also played a big role in pushing for a
more sustainable School Meals Programme that is Government led (WFP and MOE, 2007).
This study sought to understand the roles of each of these stakeholders specifically
concerning the Non-formal schools and the existing gaps in the execution of their roles.
These may then be addressed to improve the sustainable management of School Meals
Programme in these schools. The literature cited above provides evidence that the
Government, communities, parents, school management and the pupils play a more
significant role in ensuring sustainability of the School Meals Programme than the donors,
given that donor support sometimes is discontinued when least expected. The enhancement
of the capacities and synergies between the stakeholders, will ensure sustainability of the
programme

14
2.3 Management Structures of Non-Formal Schools and their Effect on Implementation
of School Meals Programme
The Basic Education Act (2017) categorizes schools as; public schools established, owned or
operated by the Government including the sponsored schools established, owned or operated
by sponsors and those that are private which are owned or operated by private individuals or
institutions. The operations of all schools in Kenya must however follow the Ministry of
Education, Science and Technology’s regulations laid down in the Education Act including
the administration of exams approved by the Kenya National Examinations Council (NCLR,
2017).
2.3.1 Ownership
Allavida Kenya, (2013), in their study established that 52% of children accessing primary
education in Kibera are learning in the ‘non-formal’ schools, 62.5% of these schools are
owned either by community-based organizations and local groups. Thirty (30) percent by
Religious institutions and 7.5% by individuals. All these as indicated in the Basic Education
Act are considered as privately owned with the Government not providing any direct
resources for their running but have provided guidelines that the management should use in
running these institutions.
2.3.2 Registration
Concerning the registration of the non-formal schools, the government recognizes the critical
role that the Non-formal schools or Alternative Basic Education and Training (APBET) plays
in increasing access to basic education, especially in informal settlements and other
marginalized areas. However, the Ministry of Education, Science and Technology (MoEST)
in the past has not legally recognized these institutions since they do not meet schools’
registration requirements including; acreage, staffing, facilities among others. As a result,
over half a million children, youth and adults are receiving education in institutions that are
operating informally (MoEST, 2015).

15
Gathumbi (2013), in his study on factors affecting implementation of basic education
curriculum in non-formal schools found that Non-formal schools were established to provide
both education and other services such as shelter, health, nutrition, counselling and protection
to school age children. This compendium of services may explain their popularity with
parents even with existence of schools offering free formal education close to them. Indeed,
the Government in the guidelines for registration of Alternative Basic Education and training
(APBET) recognises the role of these institutions as a viable option of responding to
educational needs of childre, youth and adults who are unable to join formal educational
institutions. MOEST (2015). Their acceptance is further noted in the registration of pupils
from these schools for the national examination as private students or through the nearest
public government schools.
2.3.3 Management
In his study on factors affecting functioning of Non-formal schools in Kibera slums, Elias
(2014), found that most of the Non-formal schools are run and managed by individuals who
are responsible for collecting the fees and paying teachers’ salaries. These schools are run by
churches, women groups or self-help groups. Most of the schools had no registration
certificate from the Ministry of Culture and Social Services. This makes the schools
vulnerable to closure at any time when a crackdown is carried out by the authorities which
eventually interferes with the continuity of learning and any program introduced to support
learning such as the School Meals Programme. The locations of most of these schools were
also found to be in pathetic environments that are congested, unhygienic, untidy and insecure
without fencing. This finding strengthens the argument that ownership and registration
contributes to sustainability of programmes run in these institutions.
According to a UNESCO and UNICEF (2014) study, most of the schools are managed by
school committees composed of parents, sponsor, head teacher and local administrator (chief
or area councillor). They hold meetings at least once a term or as need arises. The headmaster
and the Chairperson of the school board are the most important participants. The role of
school committees includes: planning and implementation of school programmes on behalf
of parents, school management, budgeting, collection of school levies, determination of

16
teachers’ salaries, employment of both the teaching and non-teaching staff, discipline of
students, the teaching and non-teaching staff, overseeing construction of school buildings
including classrooms and toilets; settling legal issues affecting the school, soliciting for funds
from donors and sponsor and overseeing curriculum implementation. In the same study, it
was also noted that the efficiency of the committees in service delivery was constrained by
conflict of interest in the case of NGO-supported schools. All this goes to demonstrate the
importance of the School management committees, given the numerous roles they play on
behalf of the parents and founders in ensuring smooth running of operations in the school.
2.3.4 Supervision
Supervision is a crucial component in ensuring education facilities and services standards are
adhered to. Towards this end, the World Food Programme reiterates that the Quality
Assurance and Standards Officers should visit and evaluate the quality of education being
offered in both the formal and the Non-formal schools, WFP (2007). Legally it is also
stipulated in the Education Act (2017) that the function of the Inspectorate Department
within the Ministry of Education is to ensure that all educational institutions are supervised
through regular inspection visits. The primary purpose of inspection is to ensure the teacher’s
growth on the job, his/her learning of more efficient methods and better performance and
learning on the job (NCLR, 2017). Allavida (2013), in their study on access to quality
education in Kibera found that the non-formal schools lacked support from government
including supervision, mainly due to understaffing.
2.3.5 Teaching Staff
The study by Ngome and Kimiywe (2006), revealed that the Non-formal schools had
averages of between six and twelve teachers. More than 60 percent of whom were temporal
staff with only 12 percent having been trained formally. The male-female teacher ratio was
balanced in these schools. Most teachers had low motivation citing low remuneration, poor
working conditions, job insecurity, lack of adequate teaching facilities, overcrowding, lack of
textbooks and teaching aids and harassment by the administration or management. Language
barrier, slow learners, indiscipline among pupils, were found to be sources of frustration for
the teachers, negatively impacting their performance. This unpleasant situation of Non-

17
formal schools is aggravated by the fact that they are not recognized by the Ministry of
Education, Science and Technology because most of them are registered as self-help groups
by the Ministry of Culture and Social Services. The introduction of APBET regulations will
go a long way in standardizing the services offered in these low fee private schools.
This study sought to understand the management structures specific to Non-formal schools
and the shortcomings that if addressed, the School Meals Programmes will run smoothly.
2.4 Challenges faced by Non-formal schools in the Implementation of the School Meals
Programme
According to Ingubu, Kindiki and Wambua (2010), slums in Africa and other parts of the
world form a residence that is characteristic of the poor in society. Families in these informal
settlements are unlikely to receive the required levels of education due to both their poverty
and the unavailability of such infrastructure as schools, and if schools are available, poverty
itself is a deterring factor. The implication is that many children from the slums do not enrol
in schools and if they enrol at all, their completion rates are very low. The Non-formal
schools in Kibera generally face a myriad of challenges from the environment in which they
are located and the catchment area from where most of the pupils come from (Ingubu et al,
2010).
2.4.1 The Informal Settlements Environment
The informal settlements environment presents several challenges to education, including;
lack of adequate infrastructure, polluted environment and insecurity, parental negligence,
many needy children and orphans not accessing school due to the costs, inadequate
classrooms in some schools, lack of access to clean drinking water, lack of a lunch program
and inadequate teaching and learning resources, high daily absenteeism, learner delinquency,
teacher shortage, poor teacher salary, leading to high mobility and attrition rates among
teachers. Most of these challenges are driven by macro-level conditions that are beyond the
school. (Allavida Kenya, 2013).

18
2.4.2. Lack of Adequate Parental Support
Sava and Orodho (2014), in their study, found that parental support for education in the
informal settlements are affected by their level of education and income. Parents who do not
support education related programs may not realize the importance of their children
completing education. The level of income on the other hand deters them from being able to
contribute adequately to the fees requested by the school. They would rather pay rent, buy
food or pay hospital bills than pay fees. They are more concerned about the urgent than for
long term benefit. They further suggest that these problems can be addressed by enhancing
education and income opportunities for the adult.
2.4.3. Inadequate Infrastructure
Inadequate school infrastructure including classrooms, sanitary facilities and chairs, is a
major constraint to the realization of quality education in the Non- formal schools of Kibera.
As found by Sava and Orodho (2014), the lack of adequate infrastructure can be attributed to
insufficient resources since the schools do not get any funding from the Government relying
on other donors and the parents. The parents as per their study do not have adequate income.
In addition, the schools according to Heyneman (2013), do not own the land on which they
reside, they therefore shy from constructing decent permanent structures especially since they
can be evicted from the premises any time either by the owners or by the Government official
for not meeting required standards.
2.4.4 Management and Supervision
As earlier discussed, Allavida (2013) in their study on access to quality education in Kibera
found that the non-formal schools lacked support from government including supervision.
This indicates the possibility of the teachers not following laid down curriculum and not
adhering to standards of facilities provided for effective learning for the pupils. Heyneman
(2013) confirms this saying that the non-formal schools have many teachers who are
unqualified. Since it is the mandate of the state to educate its citizens, there should be effort
to ensure that even these non-formal schools are supervised by the Government education
officers

19
2.4.5. The Elusive Sustainability
According to WFP (2009), sustainability must be built into School Meals Programmes from
the onset. It is important that sustainability is embodied in a transition strategy agreed by the
Government and stakeholders, which includes timing, targets and benchmarks for
achievement. The inclusion of school feeding in national policy frameworks increases the
potential for sustainability and quality of implementation. Stable funding is a prerequisite for
sustainability. The inclusion of school feeding in national planning and budgeting processes
will ensure that it receives resources from national budgets needed for long-term
sustainability. School feeding programmes must be based on needs and designed based on an
accurate assessment of the country context.
A Government institution or ministry should be responsible for the implementation of the
School Meals Programme. Adequate resources, staff capacity, management skills, knowledge
and technology must be made available. Robust implementation arrangements are necessary
to ensure that food and resources are managed transparently through adequate monitoring
and reporting mechanisms. Procuring food from local markets is crucial for achieving
sustainability and stimulating local economies. A balance of international, national and local
food procurement must be considered to support local economies without jeopardizing the
food pipeline (WFP, 2009).
Programmes that are well designed and multi-sectoral, links school feeding with health,
nutrition, agriculture and social protection programmes and include strong operational
partnerships and coordination mechanisms. Locally owned school feeding programmes that
respond to community needs and incorporate some form of parental or community
contributions, are the strongest WFP (2009). Cooking food in school involves considerable
costs to cater for water and sanitation, cooking facilities, cooks, stoves, firewood, pots, bowls
and spoons etc. Food supplies which require the development evidence-based programme
framework (Buhl, 2010)

20
Tomlinson (2007) notes that in East and Southern Africa, there are two main types of School
feeding programmes: programmes that are entirely funded by the National Government,
typified by countries such as South Africa and Botswana; and programmes that are
predominantly operated and funded by external sources (usually the WFP) and with only
partial Government funding, which are found in countries such as Lesotho and Malawi.
Active community participation is often cited as missing in many school feeding programmes
and is integral to both the NEPAD approach and the food sovereignty approach. Significant
community mobilization and cooperation is needed to broaden the scope of SMPs. As
reiterated by WFP (2009), School feeding is a way to reach the most vulnerable. In the face
of global crises, the school feeding programmes should be designed and implemented in a
cost-effective and sustainable way to benefit and to protect those most in need of help today
and in the future.
The authors’ discussions’ above, highlights the important considerations for the School Meal
Programme to be sustainable including, a legal framework though government policies,
contextualised choice of the feeding programme, adequate funding or resourcing to meet the
costs of the programme in terms of infrastructure, utensils, stakeholder engagement and
staffing and very importantly a monitoring and supervisory framework to evaluate the
progress and make relevant implementation adjustments as need be.
2.5 Chapter Summary
This Chapter has covered the discussion by different authors on management of Non-formal
schools, stakeholders of the School Meals Programme and their roles, the challenges faced in
the implementation of the School Meals Programme in the Non-formal slum schools and a
general approach on how to resolve the challenges. Chapter three highlights the research
methodology spelling out the research design, population and sampling design, sampling
frame, sampling technique, sample size, data collection methods, research procedures and
data analysis
21
CHAPTER THREE
3.0 RESEARCH METHODOLOGY
3.1 Introduction
This chapter covers the research design used in this study. It entails a description of the
population and the sampling design. The data collection methods, the research procedures
and data analysis methods have also been outlined with a chapter summary presented at the
end of the chapter.
3.2 Research Design
Wiersma and Jurs (2009) defines a research design as a plan or strategy for conducting
research. This includes selection of participants for the research and data collection
instruments. The research design is usually specific to the type of research to be conducted.
A descriptive survey research design was selected for use in this study. Ary, Jacobs and
Sorensen (2010) describe a survey as the study of a sample to investigate the incidence and
distribution of variables. They further explain that descriptive research asks questions about
the nature, incidence, or distribution of variables and that it involves describing but not
manipulating variables. According to Wiersma and Jurs (2009), a descriptive research design
is a non-experimental quantitative research. The variables are studied as they exist in their
natural situation with the data collection method being interviews or questionnaires to
establish the incidence, distribution, and relationships of educational, psychological, and
sociological variables.
Descriptive survey research design was chosen for this study because it was appropriate for
generating information, which enabled the researcher to gather data at a point in time and use
it to describe the nature of the existing school meals management structures in the schools
under study. The study was designed to collect data on variables of sustainable management
of the School Meals Programme from a sample of Non -formal schools in Kibera slums
implementing School Meals Programmes. The schools were the units of analysis with the
sample of 17 schools targeted for analysis being large enough to permit statistical analysis.
22
The survey research design was also most appropriate for this study because it focused only
on a selected sample of Non-formal schools from the twenty-three Non-formal schools in
Kibera slums that had a consistent feeding program sponsored by World Food Programme
and Feed the Children. The sample was selected since this is coherent with the descriptive
research design. The design also guided the study on the types of data collection instruments
to be used. The nature of the study necessitated the use of an interview questionnaire as a
data gathering instrument.
The independent variable was the non-formal schools in Kibera and the dependent variables
are the various sustainable management indicators of the School Meals Programme in these
schools. The diversity of the schools can be seen from the various registration types and
founders. The results will be used by the schools or other stakeholders to make management
decisions to improve on the current situation. The resultant information may also be used to
build on the existing resource-base for use by other researchers or stakeholders.
3.3 Population and Sampling Design
3.3.1 Population
Population refers to the universe of units from which a sample is selected (Bryman and Bell,
2010). The population investigated in this study, were Non-formal schools in Kibera slums
who at the time of the study were having a consistent school feeding program. They were 23
schools in total and had enrolment rates of between 248 and 894 pupils. These schools were
owned and run by either an individual, the community, a religious group or non-
governmental organizations as indicated in Table 3.1 below:

23
Table 3.1: Population Distribution of Non-Formal Schools under the SMP in Kibera
ID Name of Non-Formal School Total
Enrolment
Sponsor Ownership
1 Akili Complex Primary School 248 Feed the Children Community
2 Calvary Primary School 267 WFP Religious Group
3 Cheryl Children’s Home Primary
School
295 Feed the Children Individual
4 Glory Primary School 550 Feed the Children Religious Group
5 Joy Springs Education Center 450 WFP Religious Group
6 Kibera Church of God Primary School 283 Feed the Children Religious Group
7 Kibera Nazarene Self Help Primary
School
417 WFP Religious Group
8 Kisumu Ndogo Primary School 341 Feed the Children Individual
9 Laini Saba (Christ The King) Primary
School
464 WFP Individual
10 Makina Baptist Primary School 475 WFP Community
11 Makina Self Help Primary School 423 WFP Community
12 Mashimoni Primary School 582 WFP Community
13 Mashimoni Squatters Primary School 255 Feed the Children Community
14 Raila Educational Centre Primary
School
595 WFP Individual
15 Restoration Primary School 220 Feed the Children Community
16 Soda Academy Primary School 298 Feed the Children Community
17 Spurgeon Academy 404 Feed the Children Religious Group
18 St John’s Primary School 896 WFP Individual
19 St. Charles Lwanga Primary School 315 WFP Religious Group
20 St. Juliet Primary School 769 WFP Religious Group
21 Stara Rescue Centre 514 WFP Community
22 Victory Hope Community School 279 Feed the Children Individual
23 YMCA Primary School 298 Feed the Children NGO
Source: Feed the Children and World Food Programme food distribution plans for Term II 2013
3.3.2 Sampling Design
3.3.2.1 Sampling Frame
A sampling frame is a list or system that identifies members of the population, so the sample
can be drawn without having to physically assemble the population (Johnny et al, 2014). The
sample frame for this study consisted of 23 Non-formal schools in Kibera slums clustered
into four based on the ownership of the schools listed alphabetically as shown in Appendix I.

24
The list of these schools was obtained from Feed the Children and World Food Programme
food distribution plans and was cross-checked by the City Education Department, a major
stakeholder in the School Meals Programme.
3.3.2.2 Sampling Technique
Sampling technique is a method of selecting from the population the sample to be
investigated. This study adopted the stratified random sampling technique. In this technique,
the population is subdivided into smaller homogenous groups to get more accurate
representation. The elements are selected randomly from each group/stratum to form the
sample (Yogesh, 2007). Stratified random sampling technique was considered appropriate
because it was best suited to capture the diversity in terms of management capabilities and
constraints of the Non-formal schools since they are owned and run by different groups of
people which could have an implication on the programs sustainability.
In this study, the criteria for stratifying the schools was based on the type of ownership of the
schools namely; community, individuals, religious groups and NGOs. The 23 schools were
divided into the four strata, listed alphabetically and a sample of 17 was drawn using simple
random sampling as shown in Table 3.2. To ensure representativeness of the sample to the
population, each stratum was allocated a proportionate number of schools from the entire
population. The specific schools were then selected from each group using Stat trek random
number generator resulting in six owned by religious groups, six by the community, four by
individuals and one owned by an NGO.
3.3.2.3 Sample Size
The sample size selected from the sample frame was 17 Non-formal schools in Kibera slums.
This number was deemed adequate and representative enough to bring out salient features of
the population, because the implementation of the feeding program by Feed the Children and
World Food Programme was structured in a similar way. It was therefore deemed not
necessary to study all the schools to get the needed information. The sample of schools
within each stratum was also proportional to the entire population of the Non-formal schools
participating in the program. The selected schools are as indicated in Table 3.2.

25
Table 3.2: Sample Size Distribution Table
Strata of School by ownership type Total number Sample
Schools owned by religious groups 8 6
Community-owned schools 8 6
Schools owned by individuals 6 4
NGO owned School 1 1
Total 23 17
3.4 Data Collection Methods
The study used both primary and secondary data. Primary data was collected using a guided
questionnaire with both closed and open-ended questions (Appendix II) to capture more
details or clarify the responses.
The Questionnaire was the main tool for data collection. The questionnaire was divided into
four sections A, B, C and D with section A, focussing on information on demographics of the
Schools including: location, enrolment figures, boarding status, and the sponsors or founders
of the Schools. Section B captured information concerning the Stakeholders and their roles in
the management of the School Meals Programme while Section C sought information on the
Management structures of the Schools and how they affect the implementation of the School
Meals Programme. The final section focussed on the challenges faced by the Non-formal
schools in the implementation of the SMP and how they can be resolved. The Likert scale
was used in the structure of the questions. Nominal variables, covering registration and
ownership types, ordinal variables for comparison of performance of the schools on aspects
of management, interval variables, assessing the periods taken in between implementing
aspects of SMP management and finally ratio variables, to determine the magnitude or levels
of critical SMP management components. The Questionnaire was administered to the
teachers, school administration and pupils of the schools under study by the enumerators.

26
Finally, the study also made use of secondary data from reports related to the School Meals
Programme and documents from the Schools’ administration as well as from the programme
sponsors (WFP and FTC). Such information included school registration type, ownership,
year of establishment of the school and the enrolment data amongst others. The information
was used to guide the questionnaire formation and augment the information collected from
the questionnaires. The information sources were from officially recognized documents such
as the School Registration Certificates, copies of School Statistical returns to the Ministry of
Education, Food Distribution Plans, and relevant School Meals Programme monthly reports.
3.5 Research Procedures
The steps taken in the preparation and actual field work for this study began with the
development of the questionnaire. After this, the pretesting and reviewing of the
questionnaire was undertaken and the necessary adjustments as well as estimating the time
the questionnaire would take to administer. The enumerators, (all graduates to ensure better
comprehension of the research process and objectives) were then recruited and trained to
ensure they had adequate understanding of the questionnaire, interview skills, security issues
and how to conduct themselves while undertaking the exercise. A letter introducing the study
to the schools and concerned organizations was prepared and used to facilitate the study
within the sampled institutions.
The study was conducted while the schools were in session in term two of 2013, with the
field work taking one week involving three enumerators. It entailed a visit to each of the
schools for administering the questionnaires to the school administration, teachers and pupils.
To ensure that the respondents were available and prepared for the interviews, appointments
were made prior to the day of the interview especially with the teachers and administrators
which ensured their availability for the interviews. Alongside the field work, reports relevant
to the research questions were reviewed from the schools, World Food Programme and Feed
the Children records.
27
3.6 Data Analysis Methods
Data collected from the study was then cleaned up within one week of collection, identifying
gaps and filling them where applicable through verification from the school reports, and
clarification with the enumerators. The data was then analysed using the Statistical Package
for Social Sciences (SPSS) and used to produce descriptive statistics including frequencies,
sums, means and percentages. The presentation of the results was done using figures, tables,
graphs and charts. The results were then reported and interpreted based on the research
questions.
3.7 Chapter Summary
This Chapter covered the research methodology including the research design, population
and sampling design, sampling frame, sampling technique, sample size, data collection
methods, research procedures and data analysis methods for the study on the Non-formal
feeding schools of Kibera slums. Chapter four will present the results and findings of the
study.

28
CHAPTER FOUR
4.0 RESULTS AND FINDINGS
4.1 Introduction
This chapter describes the results and findings of the study after analysis of the data collected
from 17 Non-formal schools in Kibera’s Non-formal settlement of Nairobi. These schools
were selected through two stages of sampling. First the schools were clustered in terms of
their founders; religious group (eight schools), Community (eight schools), Individual (six
schools) or Non-Governmental Organisation (one School). Secondly from each group,
schools were selected using Stat trek random number generator to pick out the sampled
schools (six owned by religious groups, six by the community, four by individuals and the
one owned by and NGO). The 17 selected schools were found to be a good representation of
the whole population of 23 schools because of their homogeneity in terms of their
environment, ownership and years of implementation of the School Meals Programme
supported by the WFP and FTC organizations. The data was collected by trained enumerators
through guided interviews with head teachers, teachers and pupils. The responses were
verified through observation. The study findings are presented in form of tables and charts.
4.2 General Information
4.2.1 Type of School
The respondents who were mainly head teachers, teachers and pupils were asked to indicate
if the schools were day schools or boarding schools. All the 17 were reported to be day
schools, since most of the pupils came from homes that were a walking distance from the
school.
4.2.2. Age of the Schools and the School Meals Programme
The respondents from the schools under study were asked about the age of the school and the
duration the School Meals Programme had been going on in the school. Responses indicated
that the schools had been in existence for a mean of 21 years. The mode for the number of
years of implementation of the SMP was nine years as shown in Table 4.1

29
Table 4.1: Age of the Schools and the School Meals Programme
School Date Established SMP start date No of yrs. since
start of school
No of yrs.
with SMP
Calvary 1993 2004 23 12
St. Juliet 2002 2004 14 12
Akili Complex 1994 2005 22 11
Kibera Nazarene 1989 2005 27 11
Laini Saba 2002 2005 14 11
Mashimoni 1980 2005 36 11
St. Johns 2002 2005 14 11
Glory 1994 2006 22 10
Kibera Church 1989 2006 27 10
Kisumu Ndogo 1986 2006 30 10
Makina Baptist 1993 2006 23 10
Soda Academy 2005 2006 11 10
Spurgeon Aca 2000 2006 16 10
Stara Rescue Centre 2000 2008 16 8
Restoration 2000 2012 16 4
Victory Hope 2000 2012 16 4
YMCA Primary 1987 2012 29 4
Mean
21 9.3
Mode
N/A 10
4.2.3 Number of Pupils Enrolled before and after the Introduction of SMP
The respondents in the seventeen schools under study were asked the number of pupils
enrolled before the introduction of SMP and current number after the School Meals
Programme was introduced. The respondents in 80 percent of the schools under study
reported that they had recorded an increment in the school’s enrolment, with Makina Baptist
reporting the lowest increase of seven percent and St John’s reporting the highest increment
of 316 percent.

30
The mean enrolment was 261 pupils before and 383 pupils after. This was an average of 71
percentage increase in enrolment after the introduction of the School Meals Programme. It is
however worth noting that 18% of the sampled schools recorded a reduction in enrolment.
Table 4.2 indicates the responses.
Table 4.2: School Enrolment before and after the Introduction of SMP
School Enrolment
Before SMP
Enrolment
After SMP Increment
Percentage
Increase
Calvary 167 300 133 80%
St. Juliet 250 646 396 158%
Akili Complex 150 186 36 24%
Kibera Nazarene 182 424 242 133%
Laini Saba 320 464 144 45%
Mashimoni 205 253 48 23%
St. Johns 232 964 732 316%
Glory 422 480 58 14%
Kibera Church 308 222 -86 -28%
Kisumu Ndogo 300 349 49 16%
Makina Baptist 365 391 26 7%
Soda Academy 180 212 32 18%
Spurgeon Academy 292 384 92 32%
Stara Rescue 400 526 126 32%
Restoration 320 238 -82 -26%
Victory Hope 205 183 -22 -11%
YMCA Primary 145 290 145 100%
Total 4443 6512 2069 47%
Mean 261 383
71%

31
4.2.4. Girls Enrolment
The respondents were asked the enrolment of the girls before introduction of the School
Meals Programme and after the introduction of the School Meals Programme. From the
school enrolment data shared by the respondents, the girl’s enrolment had increased in 76%
of the schools under study after the introduction of School Meals Programme except in
Kibera Church, Kisumu Ndogo, Restoration and Victory hope Primary Schools. St John’s
recorded the highest increase of 296% from 120 to 476 girls in a span of 11 years. The
findings are as indicated in Figure 4.1.
Figure 4.1: Girls Enrolment before and after the Introduction of SMP
4.2.5. School Average Attendance Rate
The respondents from the 17 schools were asked to provide data on the current enrolment
and current average school attendance. The average school attendance in the schools under
study was 87 percent of the current enrolment. The lowest average attendance reported being
was 80 percent at Victory hope, while the highest average attendance was 97% per cent at
Calvary primary school. Their responses are tabulated in Table 4.3.

32
Table 4.3: Comparison between Current School Enrolment and Attendance with SMP
School Current Enrolment
with SMP
Current Average
Attendance with SMP
Percentage Average
Attendance
Calvary 300 292 97%
St. Juliet 646 620 96%
Akili Complex 186 169 91%
Kibera Nazarene 424 401 95%
Laini Saba 464 450 97%
Mashimoni 253 230 91%
St. John’s 964 892 93%
Glory 480 462 96%
Kibera Church 222 197 89%
Kisumu Ndogo 349 302 87%
Makina Baptist 391 384 98%
Soda Academy 212 206 97%
Spurgeon Academy 384 367 96%
Stara Rescue 526 514 98%
Restoration 238 220 92%
Victory Hope 183 147 80%
YMCA Primary 290 268 92%
Mean 383 360 87%
4.3 The Stakeholders of the School Meals Programme (SMP) in the Non-Formal
Schools of and their Roles
4.3.1. Founders of the Non-Formal Schools
The respondents from the 17 schools under study were asked who the founders of the schools
were. They responded that the founders in 35 percent of the schools were religious bodies, 35
percent of the schools were founded by Community Based Organizations, 24 percent were
founded by an individual while only six percent were founded by Non-governmental
organisations. These responses are as indicated in Figure 4.2.

33
Figure 4.2: Founders of the Non-Formal Schools in Kibera
4.3.2 School Meals Programme Sponsor
The study sought to find out who were the sponsors of the School Meals Programme in the
schools under study. Sixty-five (65) percent of the schools under study reported that the
School Meals Programme was supported by Feed the Children while 35 percent are
supported by the World Food Programme. All schools under study receive cereals, pulses,
vegetable oil and salt for lunch only. The findings are indicated in Table 4.4.
Table 4.4: Sponsors of the School Meals Programme
Sponsor Frequency Percent
World Food Programme. 6 35
Feed the Children 11 65
Total 17 100
4.3.3. Roles of Stakeholders
The respondents were asked about who conducts different roles related to the School Meals
Programme in the school. They indicated that 30 percent were taken up by teachers, 26
percent by donors, 12 percent by parents, 18 percent by the school management committee
and 11 percent by the cooks. The City Education Department (CED) and the community
played negligible roles rated at 1%. The findings were as indicated in Figure 4.3.

34
Figure 4.3: Stakeholders Roles in SMP in the Schools
4.3.4. School Meals Programme Training
Interviews were conducted in the 17 schools to establish which stakeholder took a lead role
in training on SMP management. Eight-eight (88) percent of the schools under study reported
that the role of training on SMP management was fully the responsibility of the supporting
donors. Table 4.5 below shows the findings.
Table 4.5: Frequency Table on Training on SMP Management
Frequency Percent
SMC 2 12
Donors/ Sponsors 15 88
Total 17 100.0
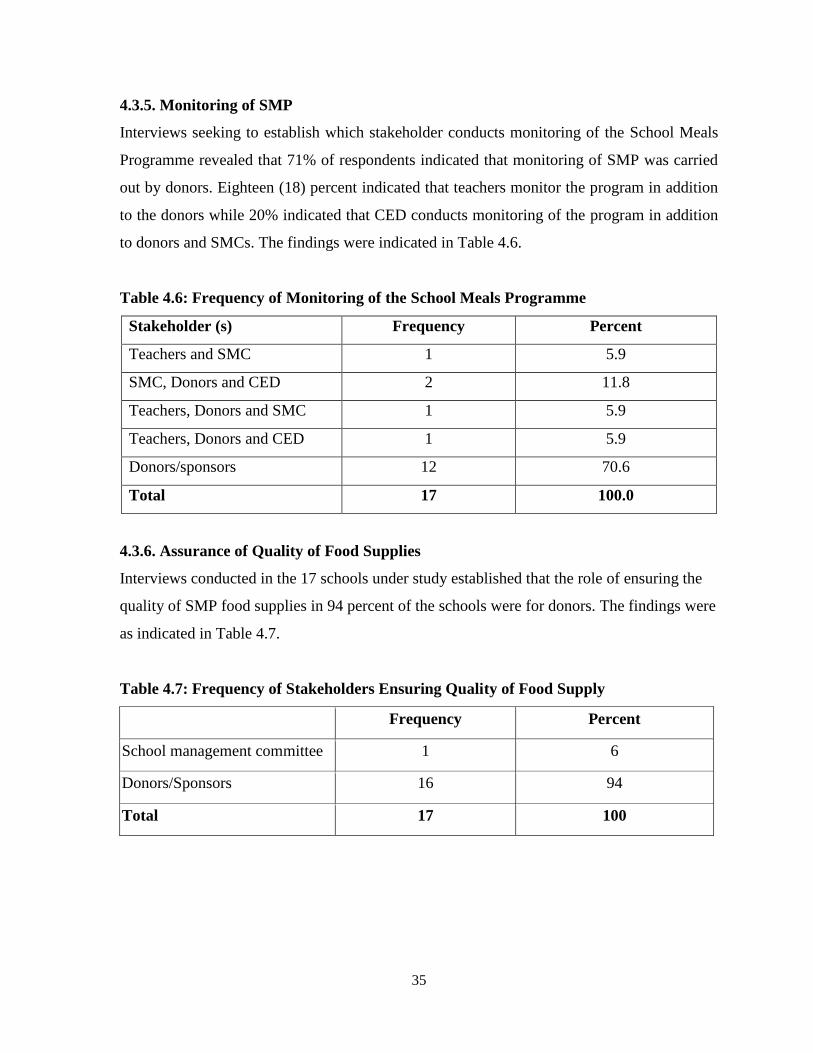
35
4.3.5. Monitoring of SMP
Interviews seeking to establish which stakeholder conducts monitoring of the School Meals
Programme revealed that 71% of respondents indicated that monitoring of SMP was carried
out by donors. Eighteen (18) percent indicated that teachers monitor the program in addition
to the donors while 20% indicated that CED conducts monitoring of the program in addition
to donors and SMCs. The findings were indicated in Table 4.6.
Table 4.6: Frequency of Monitoring of the School Meals Programme
Stakeholder (s) Frequency Percent
Teachers and SMC 1 5.9
SMC, Donors and CED 2 11.8
Teachers, Donors and SMC 1 5.9
Teachers, Donors and CED 1 5.9
Donors/sponsors 12 70.6
Total 17 100.0
4.3.6. Assurance of Quality of Food Supplies
Interviews conducted in the 17 schools under study established that the role of ensuring the
quality of SMP food supplies in 94 percent of the schools were for donors. The findings were
as indicated in Table 4.7.
Table 4.7: Frequency of Stakeholders Ensuring Quality of Food Supply
Frequency Percent
School management committee 1 6
Donors/Sponsors 16 94
Total 17 100

36
4.3.7. Initiation of Projects to Sustain SMP
Interviews were conducted in the 17 schools under study to establish which stakeholder plays
the role of initiation of projects to sustain the School Meals Programme. The study
established that the School Management Committees (SMC) in 53 percent of the schools
played the role of initiation of projects to sustain the School Meals Programme, 24 percent of
the schools reported that SMC among other stakeholders play a major role. Seventeen (17)
percent of the schools reported that teachers played a major role in the sustenance of the
School Meals Programme. The findings were as indicated in Table 4.8 below.
Table 4.8: Role of Initiation of Projects to Sustain SMP
Frequency Percent
Parents 1 5.9
Parents, Community and SMC 2 11.8
Teachers and SMC 1 5.9
SMC, Teachers and Donors 1 5.9
School Management Committee 9 52.9
Teachers 3 17.6
Total 17 100
4.4 Management Structures used by the Non-Formal Schools and how they Affect
the Implementation of the Program
4.4.1. School Registration
Interviews were conducted to establish which Government ministry the schools were
registered with and type of registration. The study established that 18 percent of the schools
were registered under the Ministry of Education while 82 percent were registered with the
Ministry of Culture and Social Affairs (MOCSA), 70 percent were registered as Community
Based Organisations (CBOs), 24 percent were registered as Self-Help Groups and six as
Faith Based Organizations (FBOs). The findings were as indicated in Table 4.9 below.
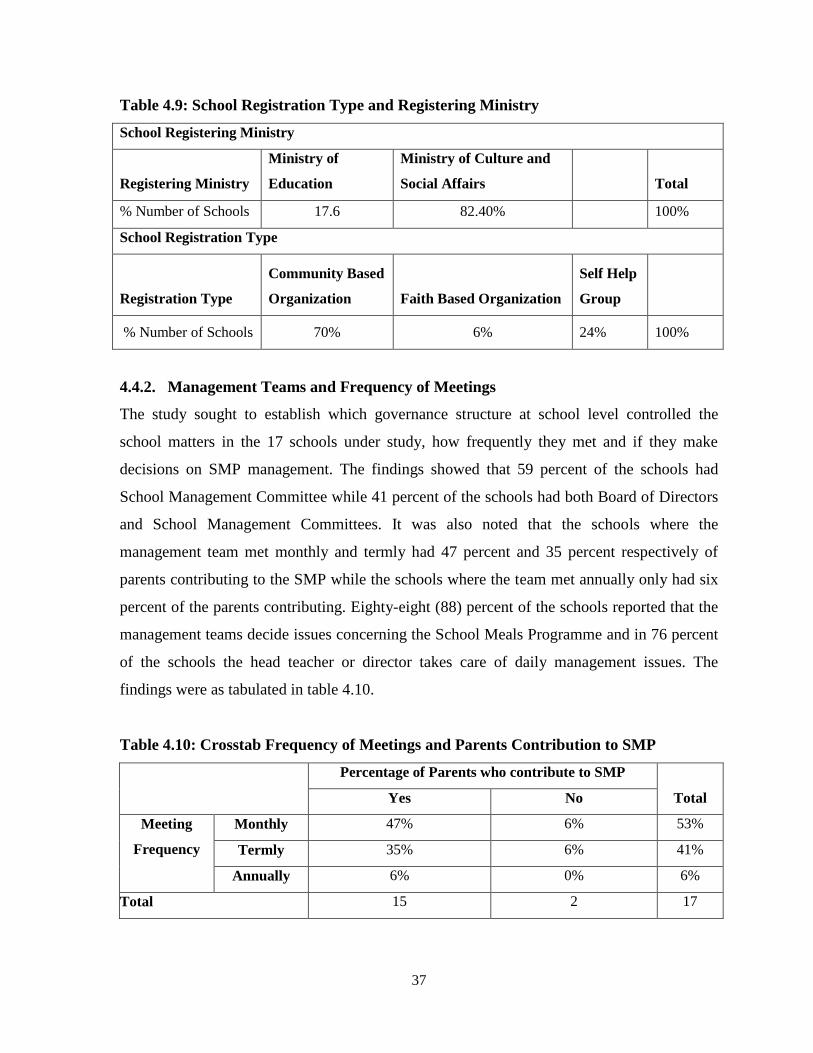
37
Table 4.9: School Registration Type and Registering Ministry
School Registering Ministry
Registering Ministry
Ministry of
Education
Ministry of Culture and
Social Affairs Total
% Number of Schools 17.6 82.40% 100%
School Registration Type
Registration Type
Community Based
Organization Faith Based Organization
Self Help
Group
% Number of Schools 70% 6% 24% 100%
4.4.2. Management Teams and Frequency of Meetings
The study sought to establish which governance structure at school level controlled the
school matters in the 17 schools under study, how frequently they met and if they make
decisions on SMP management. The findings showed that 59 percent of the schools had
School Management Committee while 41 percent of the schools had both Board of Directors
and School Management Committees. It was also noted that the schools where the
management team met monthly and termly had 47 percent and 35 percent respectively of
parents contributing to the SMP while the schools where the team met annually only had six
percent of the parents contributing. Eighty-eight (88) percent of the schools reported that the
management teams decide issues concerning the School Meals Programme and in 76 percent
of the schools the head teacher or director takes care of daily management issues. The
findings were as tabulated in table 4.10.
Table 4.10: Crosstab Frequency of Meetings and Parents Contribution to SMP
Percentage of Parents who contribute to SMP
Total Yes No
Meeting
Frequency
Monthly 47% 6% 53%
Termly 35% 6% 41%
Annually 6% 0% 6%
Total 15 2 17

38
4.4.3. School Standards and Supervision
4.4.3.1 School Standards
The respondents were asked, and documents perused on whether the schools followed the
Ministry of Education laid down curriculum and submitted statistics to the Ministry of
Education. 100 percent of the schools reported that they followed the Ministry of Education
laid down education curriculum and submitted statistics to the Ministry of Education.
4.4.3.2 Supervision
The respondents from the 17 schools were asked which external officials visited the school
for supervisory monitoring. The study established that the City Education Department visited
53 percent of the schools annually, 41 percent termly, and six percent monthly, County
Health Department did not visit 29 percent of the schools at all, but visited 35 percent
annually, 35 percent termly. WFP did not visit 65 percent of the schools at all, but visited 12
percent annually, 18 percent termly and six percent monthly, Feed the Children was reported
to have the most frequent visits to the schools with 71percent of the schools reporting
monthly visits, 24 percent termly visits and six percent annual visits. The findings were
summarized in Table 4.11 below.
Table 4.11: Supervisory Visits by External Officials
Frequency of
Visits
City Education
Department
(CED)
City Health
Department
(CHD)
World Food
Programme
(WFP)
Feed the
Children
(FTC)
Monthly 6% 0% 6% 71%
Termly 41% 35% 18% 24%
Annually 53% 35% 12% 6%
No visits 0% 29% 65% 0%
Total 100% 100% 100% 100%

39
4.4.4. Pupil’s Perception of Management of the Feeding Program
The pupils interviewed in the schools under study were asked if the food was cooked and
served on time, was fairly served and was of good quality. The respondents in 100 percent of
the schools studied reported that the food was cooked and served fairly. Pupils in 88 percent
of the schools reported that the quality of the cooked food was either excellent (71%) or good
(18%). Eleven (11) percent reported that the food was of fair quality while 60 percent
reported that the food was of good quality. Table 4.12 below shows the findings.
Table 4.12: Pupils’ Perception of the Meals
Pupil’s view on Fairness Pupils’ view on Timeliness Pupils’ view on Quality
Perception Fair Early On Time Excellent Good Fair
Number of Schools 17 2 15 3 12 2
Percentage Number
of Pupils 100% 12% 88% 18% 71% 11%
4.5 Challenges Faced by Non-Formal Schools in Implementing the School Meal
Program and how they can be solved
4.4.5. Parent’s Contribution of Funds for the School Meals Programme
4.4.5.1. Parents Rate of Payment
The study sought to establish whether parents contributed to the management of the School
Meals Programme in the 17 schools under study. The findings indicated that the main reason
for non-payment of dues in 70 percent of the schools was because of sickly or single parents
with no clear source of income. Thirty-five (35) percent of the schools reported 50 percent
defaulter rate. Twelve (12) percent of the schools reported that the parents do not pay at all
with donors or sponsors taking the responsibility of paying for the SMP costs. Table 4.13
summarizes the findings including reasons given for those not contributing.

40
Table 4.13: Rate of Parents’ Payments and Reasons for Non-Payment
Percentage of Parents contributing * Reasons For Not Paying Cross tabulation
Reasons For Not Paying
Total No Income
Others, Single
Parent
Sickly, No
Income, Single
Parent
No Parents,
No Income
Percentage Of
Parents
Contributing
Less Than 25% 6% 0% 6% 6% 18%
Less Than 50% 6% 0% 29% 0% 35%
Less Than 75% 0% 0% 18% 0% 18%
Over 75% 6% 0% 12% 0% 18%
None 0% 6% 6% 0% 12%
Total 18% 6% 70% 6% 100
4.4.5.2. Measures used to Ensure Parents Pay Dues
The respondents were asked what measures the school had put in place to ensure that most
parents pay up their SMP dues. The study showed that 82 percent of the schools held regular
meetings with the parents with 41 percent of them also organising for piecemeal payments by
parents. For these schools, over 18 percent of parents submit over 75 percent of the
contributions, 30 percent pay less than 50 percent of their payments. On the other hand, the
six percent of the schools reporting only relying on piecemeal payment and setting deadlines
for payments had six percent of parents who only pay less than 50 percent of the stipulated
contributions. Table 4.14 indicates the cross tabulation of findings in terms of percentage of
parents contributing and measures for parents to pay.

41
Table 4.14: Cross Tabulation of Frequency of Management Meeting and Percentage of
Parents Contributing
Percentage of Parents Contributing * Measures Put in Place For Parents to Pay Cross
Tabulation
Measures Put in Place For Parents to Pay
Percentage of
Parents
Contributing
Piecemeal
Payments
Meetings
With
Parents
Others, Setting
Deadlines,
School Covers
Meetings
and
Piecemeal
payments
School
Pays Total
Less Than 25% 0% 12% 0% 6% 0% 18%
Less Than 50% 6% 24% 0% 6% 0% 35%
Less Than 75% 0% 0% 0% 18% 0% 18%
Over 75% 0% 6% 0% 12% 0% 18%
None 0% 0% 6% 0% 6% 12%
Total 6% 41% 6% 41% 6% 100%
4.4.6. Food Storage Standards
The respondents were asked, and observations made on whether the school had a dedicated
food store and whether it met the standards. Seventy-six (76) percent of the schools under
study had a dedicated food store that met the standards of; security, spillage control,
ventilation, space, flood and leak proof and protection from rodent infestation. The other 24
percent had challenges of space, flooding or rodent control. Twelve (12) percent had the
storemen not trained on handling of spoilt commodities.
4.4.7. Kitchen Standards
The study sought to establish whether the schools had kitchens and whether they met the
required standards. The study established that 100 percent of the schools under study had
kitchens that were spacious. Further, 94, 88 and 82 percent of the schools were well
ventilated, clean and had adequate water respectively. Pupils practiced hand washing before
meals in 94% of the schools and 53 percent had adequate cooking utensils. The findings were
as indicated in Table 4.15.

42
Table 4.15: School Kitchen Standards
Standard Hygiene Attributes Yes No Total
Kitchen 100.0% 0% 100%
Spacious 100.0% 0% 100%
Ventilated 94.1% 5.9% 100%
Clean 88.2% 11.8% 100%
Water supply 82.4% 17.6% 100%
Pupils’ hand washing 94.1% 5.9% 100%
Cooking utensils 52.9% 47.1% 100%
4.4.8. Cooks’ Hygienic Standards
The interviews in the 17 schools were aimed at revealing the availability of a cook who was
medically fit and clean. The study established that 100 percent of the schools under study had
cooks, 47 percent had cooks with medical certificates while 53 percent did not have cooks
with valid medical certificates. Seventy-six (76) percent of the schools had clean and
appropriately dressed cooks while 24 percent had cooks that were not well groomed. Table
4.16 indicate the findings.
Table 4.16: Cooks Adherence to Hygienic Standards
With Cook Cook with Valid
Medical Certificate
Cook Clean and Well
Groomed
Percentage of schools
meeting standards 100% 47% 76%
Percentage of schools not
meeting standards 0% 53% 24%
Total 100% 100% 100%

43
4.4.9. Consistency in Meals Provision
The study sought to establish if there are days when school meals are not prepared and if
some pupils miss feeding though food is prepared. One hundred percent of the schools
reported that no days go without preparation of school meals. Sixty-five (65) percent reported
that the pupils who did not feed though food was prepared were because of allergies or
preference though these were minimal.
4.4.10. Training on School Meals Management
The study sought to establish if training on the management of SMP had been conducted for
the teachers, cooks and parents’ representatives. The schools under study reported that
training for teachers and parents’ representatives had been conducted in Sixty-five (65)
percent of the schools, while training for the cooks had been conducted only in Twenty-nine
(29) per cent of the schools. The results were as indicated in Table 4.17.
Table 4.17: Training on SMP Management
School SMP Training
for Teachers
SMP Training for
Parent Reps
SMP Training
for Cooks
Percentage of schools with
training 65% 65% 29%
Percentage of schools without
training 35% 35% 71%
Total 100% 100% 100%
4.4.11. Sustainability of the School Meals Programme
The respondents were asked about the ability of the schools to sustain the School Meals
Programme in case the current donors withdraw their support. This was to establish whether
the SMP program would continue should the current donors withdraw their support. One
hundred percent of the schools under study reported that they were not able to sustain the
feeding program. Thirty (30) percent of the schools suggested the introduction of a project to
sustain the feeding program, 35 percent stated that they would seek for an alternative donor.
The results were as shown in Table 4.18 below.

44
Table 4.18: Ability of Schools to Sustain SMP after Donor’s Withdrawal
Suggestion for Sustaining
Percentage of
School
Initiate Income generating project 30 %
Engage alternative donor 35 %
Initiate Income generating project and Engage Alternative donors 35 %
Total 100 %
4.4.12. Summary of Findings
The Non-formal schools in Kibera implementing the School Meals Programme are mainly
grouped into those initiated by Community Based Organizations and Faith Based
Organizations. Majority of the schools are under Community Based Organizations
accounting for 70 percent of the schools, 24 as Self-help Groups and six (6) percent
registered as Faith Based organisations. The schools have been in existence for a period of
between 11 to 36 years with implementation of the SMP being reported at an average of nine
years.
One hundred (100) percent of the schools under study reported that they have recorded an
increment in the school’s enrolment, ranging from 14 percent to 158 percent and average
attendance ranging from 80 to 98 percent. Girl’s enrolment had increased in 76 percent of the
schools under study after the introduction of School Meals Programme. However, Glory,
Restoration, Kibera Church, Victory Hope and Kisumu Ndogo primary schools reported a
reduction in girl’s enrolment. The main explanation was that parents had relocated the
children upcountry for fear of electoral violence.
The first objective of the study sought to identify stakeholders of the School Meals
Programme (SMP) in the Non-formal schools of Kibera and their roles. Thirty-five (35)
percent of the schools under study reported that the schools were founded by religious
bodies, 35 percent by Community Based Organizations while 29 percent were reported to be
founded by an individual and only six percent by NGOs. Feed the Children supports the SMP
in 65 percent of the schools while WFP supports the other 35 percent.

45
The roles in the School Meals Programme in the schools under study were thus; 30 percent
were taken up by teachers, 26 percent by donors, 26 percent by parents, 18 percent by the
school management committee and 11 percent by the cooks. The role of training on SMP
management was reported to be fully the responsibility of donors in 88% of the schools.
Monitoring of SMP and ensuring quality of food was also mainly carried out by the donors.
The School Management Committees (SMC) and teachers played a major role in the
initiation of projects to sustain the School Meals Programme.
The second objective of the study sought to identify the management structures used by the
Non-formal schools in Kibera and how they affect the implementation of the program. 82
percent of the schools were registered under the Ministry of Culture and Social Affairs
(MOCSA), as a school run by Community Based Organizations while 18% were registered
with the Ministry of Ministry of Education
School Management Committees were existent in 59 percent of the schools studied, while 41
percent had both a Board of Directors and School Management Committees. The
management team in 88 percent of the schools reported that the management teams decided
issues concerning the School Meals Programme and in 76 percent of the schools the head
teacher or director took care of daily management issues. The team that met monthly and
termly had 47 percent and 35 percent respectively of parents contributing to the SMP while
the schools where the team met annually only had only six percent of the parents
contributing. The schools followed the Ministry of Education laid down education
curriculum and submitted statistics to them. Supervisory visits were conducted by City
Education Department, City Health Department, World Food Programme and Feed the
Children officials. The meals were generally of good quality, served on time and fairly.
The third objective sought to identify the challenges faced by Non-formal schools in Kibera
in implementing the School Meal Program and how they can be resolved. The main
challenge was non-payment of dues in 70 percent of the schools because of sickly or single
parents with no source of income. In 12% of the schools, the parents did not pay at all with
donors or sponsors taking the responsibility of paying for the SMP costs.

46
The school with the governance organ meeting monthly and the SMC meeting every term
had the minimum 25 percent payment defaulter rate while the school where the management
meeting was only once annually had a higher payment defaulter rate of 75 percent.
A dedicated food store that met most of minimal standards of food storage was existent in 76
percent of the schools under study while only 12 percent of the schools had a storekeeper
who had not been trained on handling of spoilt commodities. 100 percent of the schools
under study had a kitchen, with over 82% of the schools having a spacious, well ventilated,
clean kitchen and adequate water. Pupils practiced hand washing before meals in 94 percent
of the schools. Though all the schools under study had cooks, only 47% had valid medical
certificates, 76% of the cooks were appropriately dressed. School meals were prepared daily,
however in 65% of the schools a minimal number of pupils did not eat because of medical
reasons. Training on SMP management was done for teachers and parent’s representatives in
65% of the schools while training for cooks were conducted in 29% of the schools.
All the Non-formal schools under study were not able to sustain the feeding program if the
current sponsored program was withdrawn. Thirty (30) percent of the schools suggested
introduction of a project to sustain the feeding program while 35% of the schools would seek
for an alternative donor or employ the combined strategy of seeking an alternative donor and
initiating projects.
4.6 Chapter Summary
Chapter four has presented the results and findings of the study highlighting the three
research questions by spelling out who the stakeholders in the School Meals Programme
(SMP) in Kibera slums are and their roles, the management structures used by the Non-
formal schools in Kibera and how they affect the implementation of the program and the
challenges Non-formal schools in Kibera face in implementing the School Meal Program and
how they can be resolved. Chapter five discusses these findings and results, giving
conclusions and recommendations of the study.

47
CHAPTER FIVE
5.0 DISCUSSIONS, CONCLUSIONS AND RECOMMENDATIONS
5.1 Introduction
This chapter discusses the findings of the study. Based on the findings, a discussion of the
results is presented, and conclusions drawn giving recommendations for improving
sustainable management of School Meals Programmes in the Non-formal schools.
5.2 Summary
The main purpose of this study was to assess the sustainability of the management of School
Meals Programme in the Non-formal schools in the Non-formal settlement of Kibera in
Nairobi County. The first question the study sought to answer was who the stakeholders of
the School Meals Programme (SMP) in Kibera Slums were and what their roles were.
Secondly, the study sought to find out the management structures used by the Non-formal
schools in Kibera and how they affect the implementation of the program. Finally, it sought
to identify the challenges faced by Non-formal schools in Kibera during the implementation
of the School Meal Program and how they can be resolved.
To undertake the study, a survey research design was employed. A Sample of 17 schools was
selected from 23 Non-formal schools in Kibera implementing the School Meals Programme
supported by United Nations World Food Programme and Feed the Children using a
stratified random sampling technique. A structured questionnaire was used as an instrument
for the collection of data. The questionnaire was administered by trained enumerators who
interviewed the teachers and pupils in the schools under study. Secondary data including
school files and reports were referred to and observations made by the enumerators and the
researcher to authenticate the answers given by the respondents where necessary, to further
enrich the study. The data was then analysed using the Statistical Package for Social Sciences
(SPSS) and used to produce descriptive statistics including frequencies, sums, means and
percentages. The presentation of the results was done using figures, tables, graphs and charts.
The results were then reported based on the research questions.

48
The study found that 35% of the schools under study were founded by religious bodies, 35%
by Community Based Organizations, 24% by individuals and 6% by NGOs. All the schools
under study had a School Meals Programmes supported by either Feed the Children or the
World Food Programme.
The stakeholders undertook their roles in the School Meals Programme in the schools under
study as follows; Teachers took up 30 percent of the roles, mainly teaching and supervision
at the schools, Donors took 26 percent of the roles mainly provision of food, training and
monitoring, The parents and School management committee took up 18 percent for the roles
which were mainly decision making concerning the schools’ management, while the cooks
took 11 percent of the roles mainly preparing the meals and in some cases cleaning of the
food stores. The City Education Department, community and pupils played a minimal role at
1% each. The role of training on SMP management, monitoring and ensuring quality of
meals was reported to be mainly the responsibility of donors. The School Management
Committees (SMC) and teachers were reported to play a major role of initiating projects to
sustain the School Meals Programme.
Eighty (80) percent of the schools under study were registered under the Ministry of Culture
and Social Affairs as schools run by Community Based Organizations and the other 20
percent are registered under the Ministry of Education as schools run by Faith Based
Organizations. Hundred percent of the schools have governance organs that meet monthly
termly or annually and decide on issues concerning the School Meals Programme while the
head teacher takes care of daily management issues. The schools were all reported to follow
the Ministry of Education laid down education curriculum and submit statistics to them.
Supervisory visits were conducted by City Education Department, City Health Department,
World Food Programme and Feed the Children officials, though at different intervals
Payment for the School Meals Programme requirements was a challenge in all the schools
with 25 to 75 percent of the parents contributing. The main reason for non-payment of dues
being lack of income. 100 percent of the schools under study had a dedicated food store and

49
kitchen that met most of the minimal standards of food storage and preparation with the store
manager having been trained on handling of spoilt commodities. It is worth noting that
though the school meals were prepared daily, 47% of the schools did not have adequate
cooking utensils. The schools also reported that they were not able to sustain the feeding
program if the current sponsored program is withdrawn. Eighty percent of the schools under
study suggested introduction of a project to sustain the feeding program while 20 percent
would seek for an alternative donor.
5.3 Discussions
The purpose of this research study was to establish the sustainability of the current
management of School Meals Programme in the Non-formal schools in the Non-formal
settlements of Kibera. The following discussions highlight the findings according to the three
specific objectives also linking with findings from other literature.
5.3.1 The stakeholders in the School Meals Programme (SMP) in Kibera Slums and
their Roles
The study established that the Non-formal schools were mainly founded by religious bodies,
community-based organizations or individuals. This agrees with Ngome and Kimiywe (2006)
who in their study, found that the Non-formal schools were mainly owned by churches,
individuals or community organisations. Sixty (60) percent of the schools under study
reported that the School Meals Programme was supported by Feed the Children while 40
percent were supported by the World Food Programme. Apart from these two donors, the
community or parents were not reported to chip in to provide locally available foods to
enrich the meals, the supplies were entirely from donors. This finding was far from the ideal
recommended by World Food Programme, (2013) that for sustainability it is crucial that the
food should be supplied or sourced from the local economies. This is explained by the
findings of this study that the parents from the slums do not have much income to facilitate
adequate support to the programme. Other poverty reduction programmes for the community
should perhaps be considered alongside income generation activities within the school if the
parents are to engage their resources towards the programme.
50
The study established that 30 percent of the roles in the School Meals Programme were taken
up by teachers, 26 percent by donors, 26 percent by parents, 18 percent by the school
management committee and 11 percent by the cooks. City Education Department (CED), the
community and pupils played a negligible role. The significant contribution by donors noted,
agrees with World Food Programme (2009) that the organisation contributes significantly to
the School Meals Programme. The Parents Contribution, which is also significant is backed
by the Education Act (2017) which requires that parents should be members of the School
Management Committee and their wishes must be recognised in the decisions concerning the
school. It is worth noting that negligible role played by the City Education Department is was
also noted by Ngome and Kimiywe (2006) that some of the Non-formal schools were not
recognized by the Ministry of Education because of their registration with the Ministry of
culture and Social Services. The City Education Officials were also few and over stretched
further reducing their chances of visiting most of the Non-formal schools regularly as
indicated in the ministry of education’s report on the Kenya education management capacity
assessment carried out in 2008.
The education of a country’s population is ultimately the responsibility of the Government,
and the Ministry of Education officials should therefore play their supervisory and guidance
role to ensure that standards are adhered to as stipulated in the Education Act (2017), even in
the Non-formal schools. This will ensure that the schools are not just feeding centres but
institutions that produce quality pupils who ultimately will be useful to their society even as
the education they have help them to break out of the cycle of poverty.
All schools under study revealed that the role of training on SMP management and
monitoring the quality of food supplies and implementation of the program was mainly the
responsibility of donors. This poses an ownership problem which is a key component of
sustainability. The donors train and monitor because of the resources they have injected into
the schools, but the parents and school community seem not to have fully grasped the value
of monitoring of the programme. This finding does not depict the ideal as outlined by MOE
and WFP (2007) that the School Management Committee should play a significant role of
ensuring smooth running of the School Meals Programme by ensuring that resources

51
contributed to the school are efficiently and transparently collected, utilized and accounted
for. The participation of parents in monitoring would provide a check on pilferage and ensure
there is a succession plan by having a forum for share information learned from the donors
and seeking to localize the same if agreeable through future generations.
The study revealed that School Management Committees (SMC) were reported to play a
major role of initiation of projects to sustain the School Meals Programme. This is indeed
how it should as according to Tomlinson (2007) active community participation is often
missing in many School Meals Programmes yet it should be an integral part. Significant
community mobilization and cooperation is needed to broaden the scope of School Meals
Programmes.
5.3.2 The Management Structures used by the Non-Formal Schools and their Effect
on the Implementation of the SMP
The study established that only 18 percent of the schools under study were registered under
the Ministry of Education as a school run by a Faith Based Organization, while 82 percent
were registered under the Ministry of Culture and Social Services. This alludes to Alternative
Basic Education and Training (APBET) guidelines which noted that the Ministry of
Education in the past has not legally recognized these institutions since they do not meet
schools’ registration requirements including; acreage, staffing, facilities among others
(MoEST, 2015). It is however important to note that the investment in these guidelines are a
strong indication that the government is recognising the critical role of these institutions in
promoting education, thus the drive to ensure some level of controls are in place.
The study found that 59 percent of the schools had a School Management Committee only,
while 41 percent of the schools had both Board of Directors and School Management
Committee. It was also noted that the schools where the management team meets monthly
and termly had 47 percent and 35 percent respectively of parents contributing to the SMP
while the schools where the team meets annually only had only six percent of the parents
contributing. Eighty-eight (88) percent of the schools reported that the management teams
decide issues concerning the School Meals Programme and in 76 percent of the schools,

52
the head teacher or director takes care of daily management issues. The schools where the
management met less frequently were most likely controlled by individuals. This agrees with
Elias (2014), who found that the schools run and managed by individuals who are
responsible for collecting the fees and paying teachers’ salaries, often makes the schools
vulnerable to closure at any time when crackdown is carried out by the authorities and
eventually interferes with the continuity of learning and any program introduced to support
learning such as the School Meals Programme. Where a board or a committee exists there
exists more controls and a platform for creative ideas on how to better manage school affairs.
The schools follow the Ministry of Education laid down education curriculum and submit
statistics to them. This is in line with the Basic Education Act (2017) which has provided
guidelines for all education institutions including non-formal schools to follow. Supervisory
visits were conducted by City Education Department, City Health Department, World Food
Program and Feed the Children officials. It is worth noting that FTC officials who were
reported to be the most frequent officials visiting 71 percent of the schools under study
weekly or monthly, was because they were both sponsors of the School Meals Programme in
60 percent of the schools under study and an implementing partner for the WFP sponsored
School Meals Programme in 40 percent of the schools under study. WFP conducts random
monitoring visits to these schools explaining the termly or annual visits by WFP established
by the study. Visits to the schools by all stakeholders is critical. However, the minimal visits
by the City Education department agrees with Allavida (2013) whose study on access to
quality education in Kibera, found that the non-formal schools lacked support from the
government including supervision. This is despite World Food Programme reiterating that
the Quality Assurance and Standards Officers should visit and evaluate the quality of
education and programs being offered in both the formal and the non-formal schools (MOE
and WFP, 2007).
The constant supportive supervision provided by the donors may have contributed to the
meals being found to be generally of good quality, served on time and fairly. For sustained
monitoring and supervision, systems should be inbuilt for continuous supervision from the
parents, school management and government officials for efficient program implementation.

53
5.3.3 Challenges Faced by Non-Formal Schools in Implementing the School Meals
Programme and their Solutions.
The parents of the pupils in Non-formal schools often default in the payment of dues for
supporting the School Meals Programme. The defaulter rate established by this study ranged
from 25 percent to 75 percent. The main reason for non-payment of dues in 70 percent of the
schools was because of lack of income, pupils who were orphans and those whose parents
were sick. This finding agrees with the MOE and WFP (2007) which noted that there are
several challenges to school meals including: seasonal migration affecting school attendance;
lack of sustainable funding for maintenance and expansion of school meals; lack of
uniformity in standards and meal provisions; weak institutional arrangements; lack of stable
infrastructure and political instability. In addition to these challenges, Andrew and Orodho
(2014), found that parental support for education in the informal settlements are affected by
their level of education, level of income and diseases including the HIV/AIDs scourge. As
earlier discussed, programmes for emancipating the communities from poverty are crucial
alongside education related programmes for holistic development to be realised.
The research study established that the most effective way of ensuring that the parents pay up
is by having regular management meetings to resolve challenges. Where regular management
meetings were held, less than 25 percent payment defaulter rate was reported while the
schools where the management met only once annually had a higher payment defaulter rate
of 75 percent and above. This agrees with Education Act (2017) which recognises that
parents are members of the School Management Committee and their wishes must be
recognised in the decisions concerning the school. As members of the SMC if they meet
regularly they will actively participate and cooperate in supporting development agenda for
the school.
Because of donor support prerequisite, training and frequent supervisory visits by Feed the
Children officials and occasionally visits by WFP and CED officials, 100 percent of the
schools had a dedicated food store with 76 percent of school stores meeting most of the
minimal standards required including; security, spillage control, ventilation, space, flood and

54
leak-proof and protection from rodent infestation and a store manager who is trained on
handling of spoilt commodities. The percentage of the schools that did not meet all the
standards could also be because of the temporal infrastructure of some of the institutions
given that they do not own the land and risk demolition according to Heyneman (2013). In
addition, high mobility and attrition leaving a skill gap within the school also explains this
reality (Allavida Kenya, 2013).
All the schools also had dedicated spacious kitchens. However only 82% met standards of
cleanliness, water adequacy, practice of hand washing by pupils before meals and adequate
cooking utensils. Though all the schools under study had cooks, only 76% were well
groomed and 47 percent had valid medical certificates. School meals were prepared daily,
however in 65 percent of the schools, some pupils do not feed because of medical conditions.
Training on SMP management was done only for teachers and parent representatives in 65
percent of the schools while training for cooks was conducted in only in 29 percent of the
schools under study. Since the Donors are not able to train all new staff, the schools should
have a transition plan including adequate handover process to avoid a knowledge gap.
The schools under the study were not able to sustain the feeding program if the current
sponsored program is withdrawn. 65 percent know that the introduction of income generating
projects would support the continuation of the program while 70 percent however would look
for other donors should the current donors withdraw their support. This agrees with World
Food Programme (2009) who indicated that locally owned school feeding programs that
respond to community needs and incorporate parental or community contributions are the
strongest but there are challenges since the current program is donor initiated and centred.

55
5.4 Conclusions
The following were the major conclusions derived from the study;
5.4.1 The Stakeholders in the School Meals Programme (SMP) and their Roles
The teachers and donors play a leading role in the School Meals Programme, with donors
taking up the critical roles of training on SMP management, monitoring and ensuring quality
of meals. The parent’s main role is to support in the payment of SMP dues although they
were struggling with it. The School Management Committees (SMC) and teachers have the
role of initiation of projects to sustain the School Meals Programme, although they too
seemed not to have much success in this and were hoping that when the current donors exit,
another one would come.
5.4.2 The Management Structures used by the Non-Formal Schools and their Effect
on the implementation of the SMP
Although all the schools surveyed had governance organs, most were not engaging
adequately with matters of school meals resulting in a fragile survival mode that can easily
end when external assistance is withdrawn. The general management of the feeding
programme was left mainly to the head teacher, who in most cases is busy with other school
matters. Since food supply exists while the donors are supporting, discussion towards
sustainability does not regularly feature within management discussions
5.4.3 Challenges faced by Non-formal schools in Kibera in implementing the School
Meal Program and how they are resolved
The main challenge faced by these Non-formal schools is the inability of parents to remit
funds to support the School Meals Programme due to lack of income. However, through
regular reminders and sensitization meetings some parents do pay. The other challenge is
over-dependence on donors to provide food for the School Meals Programme; failure to
which the program will come to a halt. The management of the school were aware that
initiating school projects to raise income would help sustain the program, though most had
not initiated the projects. They indeed still hoped that if one donor for the feeding program
withdraws, another would come.

56
5.5 Recommendations
The following are the recommendations for practice and further research.
5.5.1 Recommendations for Improvement
5.5.1.1 The Stakeholders in the School Meals Programme (SMP) and their Roles
Non-formal schools should conduct a strategic planning process identifying all the key
stakeholders and their critical roles. This will enable follow-up to ensure that all parties play
their role thus ensuring sustainability of the School Meals Programme and other related
programmes. With the knowledge of each stakeholder and their specific roles, the Non-
formal school management should seek for sustainable capacity building of their human
resource to be able to continue in implementation beyond donor support. Most importantly
there needs to be a succession plan in place to ensure that should a staff or one of the other
stakeholders becomes unavailable, there is continuity.
5.5.1.2 The Management Structures used by the Non-formal schools and their Effect on
the Implementation of the Program
The governance organs of the Non-formal schools need to meet regularly to review the
implementation of the School Meals Programme. When challenges are identified, actions to
remedy the situation should be put in place for adequate follow-up, tasking the relevant
persons for follow up. The school management committee especially should be regularly
engaged in monitoring the program identifying ways of improving its implementation. The
City Education Department should play a more active role in supervision and monitoring of
the schools to ensure they keep to the standards of the Ministry of Education. This is because
they are the only ones charged with ensuring quality in running of primary education
institutions as learning institutions and not just as feeding centres.

57
5.5.1.3 Challenges Faced by Non-Formal Schools in Implementing the School Meal
Program and the Solutions.
The school governance organs should engage with the local community to identify income
generating projects for supporting the School Meals Programme with or without the donors’
support. They can mobilise locally available resources to supplement the food basket being
offered by the donors. Indeed, it would be better for projects to be initiated while they are
still receiving supplies from the donors so that the schools can make some savings. Such
projects can include urban farming, art and craft and entertainment including song, dance and
drama groups. Parents should be regularly engaged to identify ways of ensuring they
continue to support the School Meals Programme payments. Income generating projects at
community level can be identified and implemented towards a sustained income source for
the parents too. The schools can be demonstration sites for the parents to practice
skills/projects to be replicated in the community or homes.
Further partnerships should be sought for community led programs within the informal
settlements to ensure that the parents are also emancipated from poverty even as their
children continue with meaningful education without hunger. Indeed, with less pressure on
where the next meal will come from, the parents can provide more required support in the
quest for their children’s education
Finally, the Government should consider including needy schools with catchment of the
informal settlements into the national school feeding programme. This is because the
children attending these schools are as needy as those being supported in the Arid and Semi-
Arid areas of Kenya. Indeed, this will go a long way of assuring a child at least one meal per
school day while the country makes big steps in achieving its education for all agenda.
5.5.2. Recommendations for Further Research
Further research should be conducted to identify the place of other factors unique to the Non-
formal set up that contributes to the schools not having self-sustaining programs. In addition,
it would be worthwhile to carry out a research on the leadership and governance capacity of
the Non-formal schools and if it has a relationship to the overdependence on donor support.
This is important because in this study most schools cited not being able to sustain the School
Meals Programme if the current donors were to withdraw.

58
REFERENCES
Allavida, K. (2013). Access to and quality of education in Kibera, Nairobi. Retrieved August
2, 2017, from http://www.uwezo.net/wp-
content/uploads/2013/01/KE_COMM_Networks_AllavidaReport.pdf
Ary, D., Jacobs, C., & Sorensen, K. (2010). Introduction to research in education, (8th Ed.).
Canada: Wardsworth.
Bary, F. (2011). Kibera: Posted October 20th, 2011. Retrieved February 20, 2017, from
http://blog.voiceofkibera.org/?p=189
Bryman, A., & Bell, E. (2010). Business Research Methods,(2nd Ed.). New York: Oxford
University Press.
Buhl, A. (2010). Meeting nutritional needs through school feeding, Global Child Nutrition
Foundation (GCNF), University of Washington, School of Public Health. Retrieved
February 10, 2017, from http://www.gcnf.org/library/Meeting-Nutritional-Needs-
Through-School-Feeding.pdf
Cambridge. (2008). Cambridge Advanced Learner’s Dictionary (3rd Ed), Cambridge:
Cambridge University Press.
Cook, J., & and Karen, B. (2009). Child food insecurity: The economic impact on our nation.
Retrieved June 15, 2017, from http://www.nokidhungry.org/sites/default/files/child-
economy-study.pdf
Elias, N. I. (2014). An assessment of factors that influence the functioning of non-formal
schools in Kibera’s informal settlement, Nairobi. Retrieved February 13, 2017, from
http://erepository.uonbi.ac.ke/bitstream/handle/11295/74163/Elias-An-Assessment-
Of-Factors-That-Influence-The-Functioning-Of-Non-formal-Schools.
59
Epari, C., Ezeh, A., Mugisha, F., & Ogollah, R. (2008). Oh! So ‘we’ have been under-
reporting Nairobi’s primary school enrolment rates? Nairobi: African Population and
Health Research Centre (APHRC) Working Paper No. 35.
Feed the Children and World Food Programme. (2013). Term II 2013 food distribution plans.
Nairobi: Feed the Children.
Gathumbi, A. M. (2013). Factors influencing implementation of non-formal basic education
curriculum at the non-formal education centres in Nairobi, Mombasa and Kisumu
cities, Kenya. Retrieved February 10, 2017, from
http://erepository.uonbi.ac.ke/bitstream/handle/11295/56222/Gathumbi_Factors
influencing implementation of Non-formal basic education
Heyneman, P. (2013). Low-fee private schooling: The case of Kenya. Low-fee private
schooling: Aggravating equity or mitigating disadvantage? Retrieved August 2,
2017, from https://my.vanderbilt.edu/stephenheyneman/files/2011/09/Kenya-chapter-
published-version.pdf
Ingubu, S., Kindiki, N., & Wambua, B. (2010). The global economic crisis, setbacks to
educational agenda for the minority in Sub-saharan Africa. Retrieved February 10,
2017, from http://www.eric.ed.gov/ERICWebPortal/recordDetail?accno=EJ889565
Johnny, B., Ronald, F. C., & Edward, A. B. (2014). Designing survey; A guide to decisions
and procedures, (3rd Ed). Los Angeles; SAGE publications Inc.
Jomaa, H., McDonell, E. and Probart, C. (2011). School feeding programs in developing
countries: impacts on pupils’ health and educational outcomes. Retrieved February
15, 2017, from https://www.ncbi.nlm.nih.gov/pubmed/21294742
Kenya National Bureau of Statistics. (2008). Well-being in Kenya - a socio-economic profile.
Nairobi: Government Printer.
60
Kiura, N. B. (2008). Non-formal education, the missing link in the elimination of worst forms
of child labour in Kenya. Nairobi: International Labour Organization.
Ministry of Education & World Food Programme. (2007). School feeding programme hand
book. Nairobi, KIE.
Ministry of Education Science and Technology (2015). Registration guidelines for
Alternative Provision of Basic Education and Training (APBET). Nairobi.
Government Printer.
Ministry of Education. (2008). Report on the Kenya education management capacity
assessment. Retrieved February, 3, 2017, from
http://datatopics.worldbank.org/hnp/files/edstats/KENdprep08.pdf
Ministry of State for Planning, National Development, & Vision 2030 and Office of the
Deputy Prime Minister and Ministry of Finance. (2012). Kenya: Poverty Reduction
Strategy Paper—Progress Report, IMF Country Report No. 12/10. Washington:
International Monetary Fund.
National Council for Law Reporting. (2017). Basic education act No. 14 of 2013, (2017
Revised Edition). Nairobi. Government printer
Ngome, C., & Kimiywe, J. (2006). Baseline Survey on Non-Formal Schools in Korogocho
and Kariobangi Slums. Retrieved January 2, 2017, from
http://www.kutokanet.com/slum_ministry/edu/0607korschsurvey.doc
Sava, A. & John, A. O. (2014). Socio-economic factors influencing pupils’ access to
education in informal settlements: A Case of Kibera, Nairobi County, Kenya.
International Journal of Education and Research. Vol. 2 No. 3 March 2014. Retrieved
August 30, 2017, from http://www.ijern.com/journal/March-2014/02.pdf

61
Tomlinson, M. (2007). School feeding in east and southern Africa: Improving food
sovereignty or photo opportunity? EQUINET discussion paper number 46, (Health
Systems Research Unit, Medical Research Council Regional Network for Equity in
Health in Southern Africa (EQUINET). Retrieved August 2, 2017, from
http://www.equinetafrica.org/bibl/docs/DIS46nutTOMLINSON.pdf
UNESCO, & UNICEF. (2007). A human rights-based approach to quality education for all:
A framework for the realization of children’s’ right to education and rights within
education. Retrieved August 2, 2017, from
http://www.unicef.org/publications/files/A_Human_Rights_Based_Approach_to_Edu
cation_for_All.
United Nations Development Programme. (2011). Human development reports, Human
Development Research Paper No.2011/04 on sustainability and inequality in human
development by Eric Neumayer. Retrieved August 2, 2017, from
http://hdr.undp.org/sites/default/files/hdrp_2011_04.pdf
United Nations Development Programme. (2016). Sustainable development goals. Retrieved
August 2, 2017, from http://www.undp.org/content/undp/en/home/sustainable-
development-goals.html
United Nations High Commission for Human rights. (1990). Convention on the rights of the
child. Retrieved January 22, 2017, from
http://www.ohchr.org/EN/ProfessionalInterest/Pages/CRC.aspx
Welsh Government. (2011). Pupils participation; Good practice guide. Cardiff, Crown.
Wiersma, W., & Jurs, S. G. (2009). Research Methods in Education: An introduction, (9th
Ed.). New York: Pearson.

62
World Food Programme. (2009). Home-grown school feeding: A framework to link school
feeding with local agricultural production, Rome, World Food Programme.
World Food Programme. (2009). Learning from experience: Kenya case study. Retrieved
June 30, 2017, from
http://documents.wfp.org/stellent/groups/public/documents/newsroom/wfp207488.
World Food Programme. (2009). WFP school feeding policy. Retrieved June 30, 2017, from
http://one.wfp.org/eb/docs/2009/wfp208224~1.pdf
World Food Programme. (2010). Tool kit for sustainable school feeding lifting school pupils
out of the hunger trap: GCNF-PCD Meeting on HGSF, Accra 1-5 June 2010.
Retrieved August 8th, 2017, from http://hgsf-
global.org/en/bank/downloads/doc_download/65-toolkit-for-sustainable-school-
feeding-lifting-school-pupils-out-of-the-hunger-trap
World Food Programme. (2013). School meal program. Retrieved June 30, 2017 from
http://www.wfp.org/school-meals
Yogesh. K. S. (2007). Research Methodology. New Delhi, A.P.H. Publishing Corporation

63
APPENDICES
APPENDIX I: SAMPLING FRAME
Ownership Clusters Name of School in Alphabetical Order
Community 1 Akili Complex Primary School
2 Makina Baptist Primary School
3 Makina Self Help Primary School
4 Mashimoni Primary School
5 Mashimoni Squatters Primary School
6 Restoration Primary School
7 Soda Academy Primary School
8 Stara Rescue Centre
Religious group
1 Calvary Primary
2 Glory Primary School
3 Joy Springs Education Center
4 Kibera Church of God Primary School
5 Kibera Nazarene Self Help Primary School
6 Spurgeon Academy
7 St. Charles Lwanga Primary School
8 St. Juliet Primary School
Individual 1 Cheryl Children’s Home Primary School
2 Kisumu Ndogo Primary School
3 Laini Saba (Christ The King) Primary School
4 Raila Educational Centre Primary School
5 St John’s Primary School
6 Victory Hope Community School
NGO 1 YMCA Primary School

64
APPENDIX II: GUIDED QUESTIONNAIRE
This is a questionnaire with guidance notes on how to administer the questionnaire on
Sustainable Management of School Meals Programme in Non-Formal Schools of
Kibera Slums
A. Basic Data
For this section interview the head teacher/ deputy or senior teacher who are authorised
to provide information or records concerning the school, call to book an appointment
prior to the visit, request to also interview a parent and a pupil for purposes of
triangulation
Name of
District
Name of Division Name of
Location
Sub-
Location
Name of School ID/Sample
number
Date when interview took place (mm/dd/yy) ___/___/___
Name of Interviewer (Print name)
Main Respondent (tick one)-triangulate
where necessary with questions for pupils or
parents
Teacher Parent Head Teacher /Director
Is the school a day school? YES [ ] or NO [ ]
1. When was the school established (state year) ______
2. When did the School Meals Programme start in the school? (State year) ______
3. Total number of pupils enrolled before the School Meals
Programme started
Girls______ Boys______ Total_____
4. Number of pupils currently enrolled in the school pre and
primary section
Girls______ Boys______ Total _____
5. Total current average attendance (Preschool and primary) Girls______ Boys______ Total _____
(For part A ask to confirm the numeric data from school statistical returns to the Ministry
of education)

65
B. The stakeholders in the School Meals Programme (SMP) in Kibera Slums and what
are their roles (This can be verified from the list of members of the board of management)
6. Who are the founders of the school (tick as appropriate and name)?
a) Religious group [ ] c) Individual [ ]
b) Community [ ] d) NGO [ ]
e) Others_____________ [ ]
(to clarify confirm how the school started and by who)
7. Do they currently support the school? YES [ ] or NO [ ] (there may be cases of the
school having changed ownership for one reason or the other, if No explain the reason)
8. Who is sponsoring the School Meals Programme in the school (tick appropriately)
a) World Food Programme [ ]
b) Feed the Children [ ]
c) Community/Parents [ ]
d) Religious group [ ]
e) Founder/individuals [ ]
f) Other NGOs (specify) ______________________[ ] –
(The support may be in kind or through cash as long as there is some form of feeding within
the school, indicate source of support)
9. What types of commodities are regularly supplied to the school? (tick as appropriate]
(refer to at least the last two terms)
a) Cereals e.g. Maize, rice, etc. [ ]
b) Pulses e.g. Beans, Yellow peas etc. [ ]
c) Vegetable oil [ ]
d) Others (specify) ___________________[ ]
(this is to confirm the diversity of food types provided to the pupils, is it a balanced diet?)
10. Is there an allocation for every school day based on enrolment/attendance? YES [ ] or
NO [ ]. If Yes, Which meals are catered for? (tick one] (confirm number of school days
the pupils were fed, the pupils can confirm, this will confirm if the support is one off,
regular or irregular)
a) Breakfast [ ],
b) Mid-morning snack [ ],

66
c) Lunch [ ],
d) Dinner [ ]
e) Take home ration [ ]
f) Others (please specify)____________________
11. Who conducts the following roles in the management of the School Meals Programme
(Pick from the list provided indicating (A, B, C or D); a role can have more than one
players list them beginning with the one playing the biggest part (ask the parents and
some pupils the same questions, for pupils pick one from lower primary and another
from upper primary interview them separately)
Role By who Role By who
a) Construction of food store
and kitchen
[ ] b) Maintenance (repairs) of food store and
kitchen
[ ]
c) Provision of cooking and
feeding utensils
[ ] d) Receipt of food and management of
commodities
[ ]
e) Request for food [ ] f) Purchase of firewood
[ ]
g) Payment of cooks [ ] h) Cleanliness of food store and kitchen [ ]
i) Serving the pupils ensuring
they wash their hands
[ ] j) Supervision and record keeping ensuring
adherence to standards
[ ]
k) Cooking for the pupils [ ] l) Training of teachers, cooks and school
management committees on SMP
management and sustainability of the
program
[ ]
m) Monitoring [ ] n) Reporting theft, losses and anomalies to
relevant parties
[ ]
o) Ensuring security of food
store
[ ] p) Initiating projects to ensure sustainability
of the School Meals Programme
[ ]

67
q) Ensure quality of food
supplies to the schools
[ ]
A. Parents
B. Community
C. School management committee
D. Teachers
E. Pupils
F. Cooks
G. Donors/sponsors
H. City Education Department
C. The management structures used by the Non-formal schools in Kibera and how do
they affect the implementation of the program (Tick as appropriate-confirming from
records)
12. Under which ministry listed below is the school registered, (tick appropriately)
a) Ministry of Education, Science and Technology [ ]
b) Ministry of Gender, Youth, Sports and Social affairs [ ]
c) Others (specify) ________________________ [ ]
13. The school is registered with the Government authorities as (tick appropriately).
a) Community Based Organisation, [ ]
b) Faith based Organisation, [ ]
c) Self Help Group [ ]
d) Other (specify)_________________ [ ]
14. Which of these does the school have? (tick appropriately)
a) Board of Directors/ Governors [ ]
b) School management committee, [ ]
c) Other (specify)_________________ [ ]
15. How frequently do they meet to address matters concerning the school? (tick most
common)
a) Weekly [ ]
b) Monthly [ ]
c) Termly [ ]

68
d) Bi-annually [ ]
e) Annually [ ]
f) Others (specify)_______________[ ]
Comment______________________________________________________-
16. Do they make decisions concerning the implementation of the School Meals
Programme?
YES [ ] NO [ ] (confirm from the school meals records, meetings held)
17. Who makes decisions about daily management of the school including the School Meals
Programme (tick appropriately)
a) Director [ ]
b) Founder [ ]
c) Head teacher [ ]
d) Others (specify) _____________________[ ]
18. Does the school follow the education curriculum approved by the Ministry of education?
YES [ ] NO [ ]
19. Does the school submit school statistical reports on enrolment, attendance, facilities and
performance to the Ministry of Education? YES [ ] or NO [ ]
20. Do officials from the following offices frequently visit your school for monitoring (tick
appropriately). (this is to confirm supervision of the school feeding programme by the
Government officials and donors)
Officials Do they visit If yes how frequently (indicate with
codes listed below)
a) City Education Department YES [ ] NO [ ]
b) City health department YES [ ] NO [ ]
c) World Food Programme YES [ ] NO [ ]
d) Feed the Children officials YES [ ] NO [ ]
e) Others YES [ ] NO [ ]

69
(specify)____________
A. Frequency:
B. Weekly
C. Monthly
D. Termly
E. Annually
Comment__________________________________________________________
21. What are the Pupils’ view on the management of the School Meals Programme? (tick
appropriately)
A. Quality B. Fairness C. Timeliness
a) Excellent [ ] a) Fair [ ] a) Early [ ]
b) Good [ ] b) 50/50 [ ] b) On time [ ]
c) Fair [ ] c) Unfair [ ] c) Late [ ]
d) Poor [ ] d) Very unfair [ ] d) Very late [ ]
(If feeding is ongoing you can confirm the quality fairness and timeliness of serving of the
meals)
D. Challenges faced by Non-formal schools in Kibera slums in implementing the School
Meal Program and how can they be resolved
22. Do parents contribute funds towards the School Meals Programme e.g. for the payment
of cooks and the purchase of firewood YES [ ] or NO [ ] (confirm from pupils)
23. If NO who covers for these costs? (mention)_____________________
24. If YES, what percentage of the parents remits these payments? Tick as appropriate
a) Less than 25 percent [ ]
b) Less than 50 percent [ ]
c) Less than 75 percent [ ]
d) Over 75 percent [ ]
25. What are the most recurrent reasons for non-remittance of payments? (tick one) (confirm
from pupils)
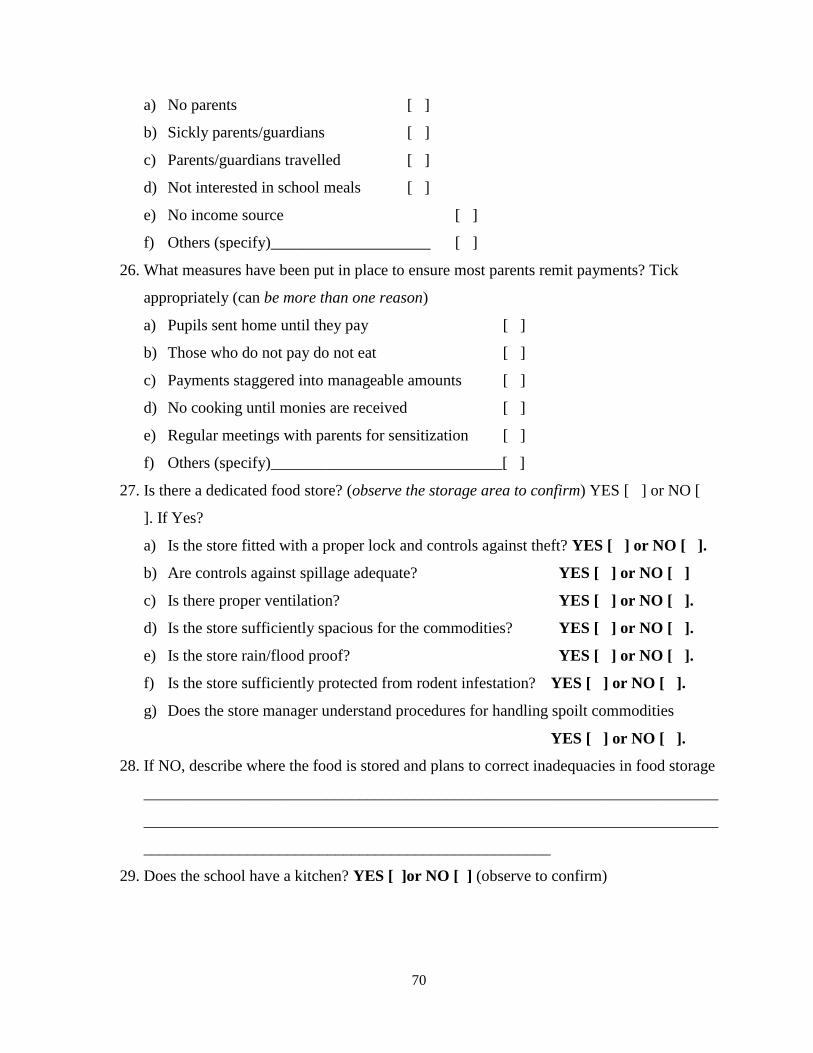
70
a) No parents [ ]
b) Sickly parents/guardians [ ]
c) Parents/guardians travelled [ ]
d) Not interested in school meals [ ]
e) No income source [ ]
f) Others (specify)____________________ [ ]
26. What measures have been put in place to ensure most parents remit payments? Tick
appropriately (can be more than one reason)
a) Pupils sent home until they pay [ ]
b) Those who do not pay do not eat [ ]
c) Payments staggered into manageable amounts [ ]
d) No cooking until monies are received [ ]
e) Regular meetings with parents for sensitization [ ]
f) Others (specify)_____________________________[ ]
27. Is there a dedicated food store? (observe the storage area to confirm) YES [ ] or NO [
]. If Yes?
a) Is the store fitted with a proper lock and controls against theft? YES [ ] or NO [ ].
b) Are controls against spillage adequate? YES [ ] or NO [ ]
c) Is there proper ventilation? YES [ ] or NO [ ].
d) Is the store sufficiently spacious for the commodities? YES [ ] or NO [ ].
e) Is the store rain/flood proof? YES [ ] or NO [ ].
f) Is the store sufficiently protected from rodent infestation? YES [ ] or NO [ ].
g) Does the store manager understand procedures for handling spoilt commodities
YES [ ] or NO [ ].
28. If NO, describe where the food is stored and plans to correct inadequacies in food storage
________________________________________________________________________
________________________________________________________________________
___________________________________________________
29. Does the school have a kitchen? YES [ ]or NO [ ] (observe to confirm)

71
30. If YES, is the Kitchen
a) Spacious? YES [ ] or NO [ ]
b) Is it well ventilated? YES [ ] or NO [ ]
c) Is it clean and pest free? YES [ ]or NO [ ]
31. Is there constant supply of wholesome/clean water? YES [ ]or NO [ ] (observe to
confirm)
32. Do pupils wash their hands before the meal? YES [ ]or NO [ ]
33. Are there adequate cooking equipment and utensils? YES [ ]or NO [ ]
34. Does the school have a cook? YES [ ]or NO [ ], If Yes,
a) Do the cooks have valid medical certificates? YES [ ]or NO [ ]
b) Are the cooks clean and appropriately groomed? YES [ ] or NO [ ]
35. Are there days when no food is prepared during school days YES [ ] or NO [ ].
36. If YES what are the reasons why they missed feeding (Tick as appropriate.)
A. No cook to prepare the food, [ ]
B. Lack of cooking utensils [ ]
C. Lack of firewood therefore did not cook on certain days [ ]
D. Food was not delivered on time, [ ]
E. Over scooping/Food got finished earlier than planned [ ]
F. Less food was delivered to the school than required [ ]
G. Lack of water to prepare food, [ ]
H. Others specify_____________________________ [ ]
37. Do some pupils miss feeding despite food having been cooked, YES [ ] or NO [ ]. If
YES tick main reasons below
A. Absenteeism from school [ ]
B. Pupils do not like the taste of the food, [ ]
C. Pupils denied food due to non-payment of levies [ ]
D. Food runs out before all the pupils have received their ration [ ]

72
38. Has School Meals Programme management training been undertaken for the following
(tick appropriately)
a) Teachers? YES [ ] NO [ ]
b) Cooks? YES [ ] NO [ ]
c) Parent representatives? YES [ ] NO [ ]
39. If the sponsored School Meals Programme in your school is withdrawn, Can the school
community continue to sustain the feeding program? YES [ ] NO [ ] If YES how
(explain)
________________________________________________________________________
__________________________________________________________
40. If NO what should be put in place to ensure sustainability of the program
a) Seek for alternative donors to continue supporting the feeding program [ ]
b) Begin a school project with the community to raise funds for supporting the
School Meals Programme (suggest possible projects) [...]
c) Others explain______________________________________________________
APPRECIATE THE INTERVIEWEE FOR TAKING TIME TO ANSWER YOUR
QUESTIONS