sustainable mobility, practical city? - trolley-project.eu · without prejudice i tried... miskolc,...
TRANSCRIPT

Dr. István Tibor TÓTH
2012. Leipzig
Sustainable mobility,
Practical city?

Without prejudice I tried...
Miskolc, Debrecen, Szeged public transport from energy, emission and cost perspective.
- The specific energy consumption of different vehicles with the emission and the forms or sides of the sustainabilty.
- The modal split and the tendencies.
- The real data of Szeged public transport.
- Numerology, findings and questions, questions, questions.

1. table: some urban vehicle’sfinal and primary energy consumption in Germany
in 2000, and nowadays own data collection [ ].
Vehicle Energy sourceFinal energy
consumption
Final energy
(Mj/km)Energy (kWh/km) Passengers
Primer energy
(kJ/fhkm)
Car Gasoline6-15 l/100 km
(10,4) [9]1,9-4,8 (3,4) [3,1]
[0,861]5 460-1140 (790)
Car Diesel3,5-11 l/100 km
(8,3) [7,5]1,3-3,9 (3,0) [2,8]
[0,778]5 280-890 (670)
Bus 2000 Diesel43,8 l/100 km
[41,6]15,6 [15,3]
[4,25]75 235
12 m bus Diesel 40 l/100 km [36] 14,3 [12,9][3,583]
66 244
Articulated bus Diesel 55 l/100 km [50] 19,7 [17,8][4,944]
102 217
Bus 2000 CNG 54,4 m3/100 km 19,6[5,444]
75 315
12 m bus CNG 49,7 m3/100 km 17,9[4,9]
66 327
Articulated bus CNG 68,3 m3/100 km 24,6[6,833]
102 291
Tram Electricity(28 Wh/roomkm)
[0,8-3 kWh/km]
[1,6]
2,9-10,8 [5,8]
[1,6]
n. a. 309
Trolley Electricity[1,5-3,8 kWh/km]
[2,2]5,4-13,7 [7,9]
[2,2]75

2. table. Emission limits forcars under 3.5t with direct injection diesel and gasoline engine.
Harmful
emission,
g/km
EURO–1 1992 EURO–2 1996 EURO–3 2000 EURO–4 2005 EURO–5 2009 EURO–6 2014
CO 2,72 1,0 0,64 0,5 0,5 0,5
NOx - - 0,5 0,25 0,18 0,08
HC+NOx 0,97 0,9 0,56 0,3 0,23 0,17
Particulates 0,14 0,1 0,05 0,025 0,005 0,005
Harmful
emission,
g/km
EURO–1 1992 EURO–2 1996 EURO–3 2000 EURO–4 2005 EURO–5 2009 EURO–6 2014
CO 2,72 2,2 2,3 1,0 1,0 1,0
NOx - - 0,15 0,08 0,06 0,06
HC+NOx 0,97 0,5 - - - -
Particulates - - - - 0,005 0,005
HC - - 0,2 0,1 0,1 0,1

3. table. Emission limits for buses and turcks with diesel and gas engine
(CO) g/kWh (HC) g/kWh (NOx) g/kWh PM g/kWh Fumigation m-1
EURO I 4,5 1,1 8,0 0,361 -
EURO II 4,0 1,1 7,0 0,15 -
EURO III. 2,1 0,66 5,0 0,10 0,131 0,8
EURO IV 1,5 0,46 3,5 0,02 0,5
EURO V 1,5 0,46 2,0 0,02 0,5
EURO VI 1,5 0,13 0,4 0,01 -
Norm CO g/kWh HC g/kWh NOx g/kWh PM g/kWh CH4 g/kWh
EURO III 5,45 0,78 5 0,16 1,6
EURO IV 4 0,55 3,5 0,03 1,1
EURO V 4 0,55 2 0,03 1,1
EEV 3 0,4 2 0,02 0,65
EURO VI 4 0,16 0,4 0,01 0,5
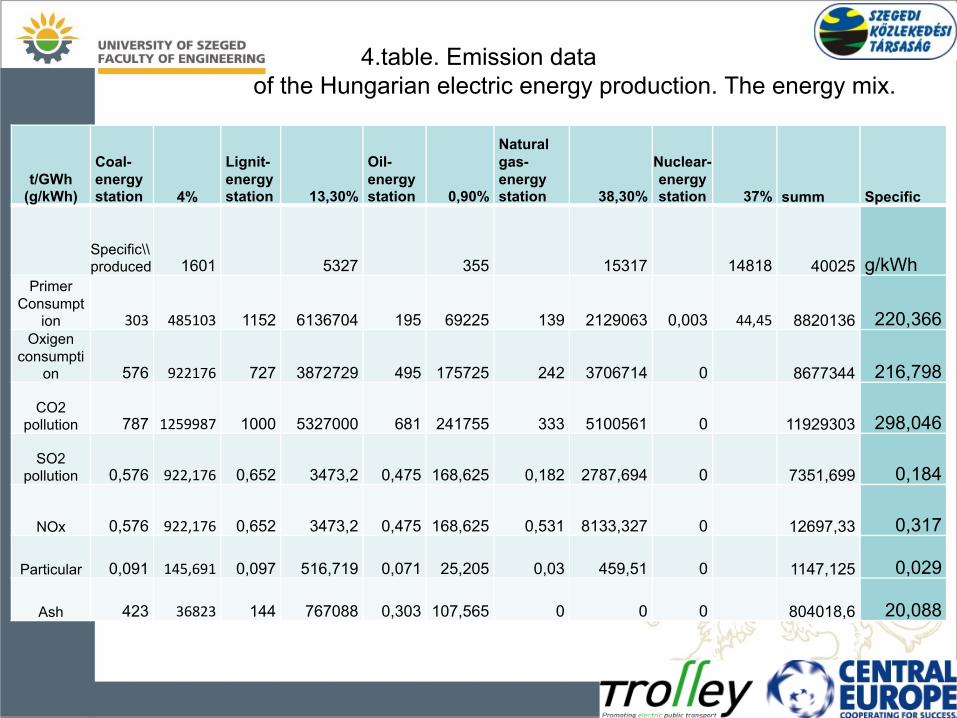
4.table. Emission dataof the Hungarian electric energy production. The energy mix.
t/GWh
(g/kWh)
Coal-
energy
station 4%
Lignit-
energy
station 13,30%
Oil-
energy
station 0,90%
Natural
gas-
energy
station 38,30%
Nuclear-
energy
station 37% summ Specific
Specific\\produced 1601 5327 355 15317 14818 40025 g/kWh
Primer Consumpt
ion 303 485103 1152 6136704 195 69225 139 2129063 0,003 44,45 8820136 220,366Oxigen
consumption 576 922176 727 3872729 495 175725 242 3706714 0 8677344 216,798
CO2 pollution 787 1259987 1000 5327000 681 241755 333 5100561 0 11929303 298,046
SO2 pollution 0,576 922,176 0,652 3473,2 0,475 168,625 0,182 2787,694 0 7351,699 0,184
NOx 0,576 922,176 0,652 3473,2 0,475 168,625 0,531 8133,327 0 12697,33 0,317
Particular 0,091 145,691 0,097 516,719 0,071 25,205 0,03 459,51 0 1147,125 0,029
Ash 423 36823 144 767088 0,303 107,565 0 0 0 804018,6 20,088

5. table. Comparison.Electric and diesel emissions in Europe (2004)
g/kWhelectric g/kWhdiesel
D A NL
CO 0,035 0,036 0,205
CO229,448 29,921 36,660
HC 0,134 0,136 0,279
NOx0,107 0,109 0,116
SO20,182 0,185 0,406
D A NL
CO 0,168 0,101 0,030
CO2637,3 227,2 506,0
HC 1,891 0,927 0,013
NOx0,580 0,246 0,471
SO20,595 0,159 0,227

6. table. The essence, the specific data on 1 km.
MJ/l
(MJ/m3) 34,2 37,3 35,75 37,3 37,3 37,3 39,128 39,128 39,128
co2 24 26,5 26,5 26,5 26,5 181,2462 181,2462 181,2462 298,046 298,046
car bus diesel bus CNG tram trolleybus
gasoline diesel average solo articulated average solo articulated average
l/100km 8,5 7,5 8 36 50 45
m3/100 km 49,7 68,3 54,4
kWh/km 0,808 0,777 0,794 3,730 5,181 4,663 5,402 7,423 5,913 1,6 2,2
CO2 204 198,75 954 1325 1192,5 979,0626 1345,472 1071,65 476,8736 655,7012
CO 1 0,5 5,595 7,770833 6,9938 0,334722 0,45999 0,366376 ? ?
HC 0,1 0,05 1,7158 2,383056 2,1448 0 0 0 ? ?
NOx 0,06 0,2 7,46 10,36111 9,325 0,769861 1,057978 0,842665 0,507576 0,697917
SO2 ? 0 0 0 0 0,008368 0,0115 0,009159 0,293884 0,404091
PM 0,005 0,005 0,0746 0,103611 0,0933 0,058576 0,080498 0,064116 0,045856 0,063052
Ft/km 29,155 24,525

Radial traway network
Feeder bus network
Public transport network in Szeged
Trolley network
On service of the housing estate

Passenger count in Szeged 2008.
• It was the 24. of April 2008 Thursday when the last complete, all-day-long cross-sectional passenger-count was accomplished in the town of Szeged.
• Busiest local transport line: 1. tram, 33.000 pass/day
• Among buses: 2. bus, 12.000 pass/day
• Heaviest passenger-loaded junction:• Széchenyi square
• Mars square

Line-
length
(km)
Number
of the
daily
trip
Daily
vehicle-
km
(km)
Daily
pasenger
number
(person)
Daily
passenger
-km
(pkm)
Average
tarvelling
distance
(m)
Daily
passenger
capacity-km
(pckm)
Capacity
utilizationDaily
energy
usage
(kWh)
Car
equivalent
(kWh)
Tram 37 730 3883 57421 92814 1616 554060 16,8 % 6213
Trolley 44 949 5310 50838 103263 2031 588435 17,5 % 11682
SZKT total
81 1679 9193 108259 196077 1811 1142495 17,2 % 17895 158414
Tisza Volán
490 2739 19682 112275 350970 3126 2029433 17,3 % 95359 283585
In total 571 4418 28875 220534 547047 2481 3171928 17,2 % 113254 441999
7. table. Rough comparision for Szeged
Daily 220534 passenger 28875 km public transport use about 100000 kWh , i.e. about 0,5 kWh/person
electric public transport 56000 kWh ~ 0,25 kWh/person220534 passengers 547145 km car 1 person about 400000 kWh, 2 kWh/person
car 2 person ~ 200000 kWh, 1 kWh/personcar 4 person ~ 100000 kWh, 0,5 kWh/person

Real measured public transport data in 2008
line length number of the daily daily daily daily average capacity
[km] daily trips vehiclekm capacitykm passengers pass.km distance[m] utilization
villamos 37 (49,2) 730 3 883 554 060 57421 92814 1616 16,8%
trolibusz 44 (69,1) 949 5 310 588 435 50838 103263 2031 17,5%
SZKT összesen 81 (118,3) 1 679 9 193 1 142 495 108259 196077 1811 17,2%
Tisza Volán 490 (?) 2 739 19 682 2 029 433 112275 350970 3126 17,3%
Mindösszesen 571 (?) 4 418 28 875 3 171 928 220534 547047 2481 17,2%
Trolley lines line length[m] person/day
5 Vértói út vá. 5300 2763
Újszeged gyermekkórház vá. 5400 2774
7 Bakay N. utca 4100 822
Újszegedi gyermekkórház vá. 4200 1273
8 Körtöltés u. vá. 4000 (5300) 3072
Dugonics tér (Klinikák vá.) 4200 (5800) 3440
9 Makkosház vá. 7400 5378
Lugas u. 7600 5465
19 Víztorony tér vá. 7500
Makkosháza vá. 7800
10 Víztorony tér vá. (4400)
Klinikák vá. (4400)

1993 1999 2005 2008
Passenger number 304489 252055 237589 220534
-tram 66662 58237 60463 57421
-trolley 76437 50052 50973 50838
-bus 161370 143730 126153 112275
Trips per day 5130 4453 4399 4418
-tarm 846 758 730
-trolley 767 880 949
-bus 2840 2761 2739
Daily passenger-km 753000 632570 589377 548991
-tram 102408 87432 88009 92814
-trolley 167919 103939 102872 103263
-bus 482673 441199 398496 350970
Average travelling-m 2473 2510 2481 2480
-tram 1536 1500 1456 1616
-trolley 2197 2077 2018 2031
-bus 2991 3070 3159 3126
Capacity utilization 14,1% 18,4% 18,3% 17,2%
-tram 11,0% 16,4% 13,6% 16,8%
-trolley 15,5% 20,3% 19,9% 17,5%
-bus 13,5% 18,5% 19,3% 17,3%

Reducing tendency

Changes of buses
Passengers:
• 1999-2005: -2,0%/year
• 2005-2008: -3,7%/year
Services:
1999-2008: -3,4% total

Changes of trams
Passengers:
- 1999-2005: increasing
- 2005-2008: reduction
Services:
- 1999-2005: 10% reduction
- 2005-2008: 3,7% decrease

Changes of trolley services
Passengers:
- 1999-2008: gentle rise
Services:
- 1999-2008: strongincrease

8. table. Szeged in the language of the emission
Car with 2 person has better CO, HC and PM emission than public transport.The higher comfort (cooling, heating, information serviceJ) of the electric public transport require more energy, can be doubled, at least necessary to consider and to determine the optimal „plant size”.
One Szeged size settlement with such transport structure and habit and vehicle fleet and service level already on the „green” limit.
Modal split (2008): 47% - 22% - 22% - 9%
(g/person) Public
transport
100 % electric
public
transport
Car
1 person
Car
2 person
Car
4 person
CO2 121,9144419 74,51157 503,4375 251,7188 125,8594
CO 0,9372381 ? 1,875 0,9375 0,46875
HC 0,172111 ? 0,1875 0,09375 0,046875
NOx 0,73212713 0,0793088 0,325 0,1625 0,08125
SO2 0,02950292 0,0459194 ? ? ?
PM 0,0098183 0,0071651 0,0125 0,00625 0,003125

CHANGES IN TRANSPORT
HABIT

CHANGES IN TRANSPORT
HABIT
Sold

MODAL SPLIT CHANGES2006. 2007. 2008.
Modal
split 2009. 2010. 2011.
Modal
split
2008. 2011.Total daily trip by
public transport 243 700 228 172 220 534 47% 203 195 190 001 182 365 37%
Total daily trip by car 103 229 22% 103 229 21%Total daliy trip on
foot 103 229 22% 113 551 23%Total daily trip by
bike 42 230 9% 93 537 19%
Total daily trip 469 222 100% 492 682 100%


The „pocket-emission” parameter, usually named as expense, but has immediate effect:- Until for a car driver 1 km cost 28-38 Ft, a public transport user for 3*30*2,48=223,2 km in a month buy coupon for 5925 Ft, so travels for 29.4 Ft/km. If buy ticket, cous financial collapse! (By car the same 223,2 km monthly cost max. 8284 Ft the 19 l gasoline, and the annual 2678 km will not cause more extra costs than the shoe-wear or garment wear.)
The „distance emission” parameter,the time, the parameter that sometimes unpayable:- in Szeged the biggest distance by car max. 20 minutes. By public transport needs about one hour. In traffic jam uniformly increasing the time.
Other relevant questions:
- What costs the public transport built-up?
- What costs the public transport vehicle?
- What vehicle damage more the roads and the stops?
- What costs the public transport?
- Who pays for it? Resources?

CONCLUDING QUESTIONS
• How the public transportation of Szeged can be in long-term kept up?
• It has to be decided what the aim of the public transportation is: competitive service comparing the cars, or social supply?
• In the name of the sustainability what kind of other incomes are needed to be built in the system beside the income from ticket-sales?
• With what kind of conditions can be reckoned on the income from parking fees and commercials?
• What is the awaited comfort level and how much more should we pay for the added service indeed?
• How to understand the Practical city definition? Practical as enterprising, accessible and safe, healthy and attractive. We have to force in every possible ways the citizens to use the optimal travelling manners with less volume, lower environment pollution etc. In that sense we must interest citizens in voluntary change of behaviors. Or –the payable, not prohibited, sponsorable city?
Thank You for Your attention!