sustainable reverse logistic network design for end-of
TRANSCRIPT

RAIRO-Oper. Res. 55 (2021) S503–S521 RAIRO Operations Researchhttps://doi.org/10.1051/ro/2019069 www.rairo-ro.org
SUSTAINABLE REVERSE LOGISTIC NETWORK DESIGN FOR END-OF-LIFEUSE-CASE STUDY
Suna Cinar∗
Abstract. Due to the increased interests in environmental issues along with stringent environmentallegislation and regulations, companies start taking a fresh look at the impact on their reverse logisticactivties on the environment. This paper is an example of the recovery of valuable material that can berecycled/recovered or remanufactured at the end of product useful life by designing an effective reverselogistics network. In this study, a mixed integer linear programming (MILP) model is proposed to deter-mine a long-term strategy for end-of-life (EOL). The mathematical model not only takes into accountthe minimization of system operating costs, but also considered minimization of carbon emissions re-lated to the transportation and processing of used products. Therefore, the objective in this model wasto minimize the transportation and operating cost as well as minimizing environmental effects theseactivities. The results of this study show the trade-off between the costs and carbon emissions, and costeffectiveness for improving environmental performance, all of which have great practical implication ondecision-making of network configurations a reverse logistics system. The proposed model is validatedby examining a case study from wind turbine (WT) sector.
Mathematics Subject Classification. 65C20.
Received November 29, 2018. Accepted June 20, 2019.
1. Introduction
Due to increasing environmental concerns, resource reduction, landfill capacity reduction, stricter governmentregulations, and global pressure to reduce carbon emissions, industries have started implementing end-of-lifestrategies in their reverse logistics network. Because reverse logistics by definition includes processes such asremanufacturing, refurbishment, recycling, reuse, and asset recovery, engaging in reverse logistics activitiesguarantees companies a certain level of green. Through effective reverse logistics operations, companies can alsocut out inefficient returns processes that result in unnecessary transportation moves, helping to reduce carbonemissions and improve air quality [31].
Consideration of carbon policies while optimizing supply chain operations has become vital as governmentsand regulatory bodies throughout the world have implemented different carbon policies to reduce emissions ofgreenhouse gasses, especially carbon-dioxide (CO2) emissions. The biggest international scheme for the trad-ing of greenhouse gasses is European Union Trading Systems (EU-ETS), which was initiated in 2005, follows
Keywords. Mixed-integer linear programming, optimization, reverse logistic, end-of-life use, carbon emissions,environmental policy, climate control.
Department of Industrial and Manufacturing Engineering, Wichita State University, Wichita, KS 67260, USA.∗Corresponding author: [email protected]
Article published by EDP Sciences c© EDP Sciences, ROADEF, SMAI 2021
S504 S. CINAR
the “cap-and-trade” concept, where companies get an upper limit on emissions and beyond this limit, com-panies are penalized. In 1997, the Kyoto Protocol to the United Nations Framework Convention on ClimateChange (UNFCCC) provided for carbon trading through three “flexible mechanisms” [40]. The Kyoto protocolintroduced three major mechanisms for carbon emissions reduction: namely carbon trading and joint imple-mentation [9]. The first mechanism serves as an economic incentive for companies to reduce carbon emissions.A central authority sets a limit (or CAP) on the permitted level of greenhouse gas emissions and allocates per-mits/allowances that bestow the right to emit greenhouse gases below the current or expected level of emissions[39]. The second and third mechanism allows countries to gain emission credits by financing emission reductionprojects in developing countries and allows specified countries to carry out emission reduction projects in othercountries to get emission credits [9].
As momentum builds to address climate change in every industry, the main objective of this study is toextend the existing mixed-integer-linear- program (MILP) [10] for a reverse logistic network design problemthat is able to (1) consider both economic and environmental aspects to reduce the greenhouse gas emissions,and to (2) investigate the impact of two most common carbon regulatory policies such as carbon credit andcarbon cap on reverse logistic operations in wind turbine (WT) industry.
In particular, there is a need for model-based research that extends and integrates current quantitativemodels which focus on minimizing cost by including carbon-footprint criteria under different policy situations.Therefore, the extended MILP model could then be used to understand how carbon emissions parameters affectoperational decisions. Such model could help policy makers to choose different policies related to reduction ofcarbon emission such as using emission CAP and trade, taxes, etc.
This proposed model closes the research gap by contributing to the WT reverse logistic network literature inthe following ways:
– The proposed MILP model is applicable to any types of assets. The model is illustrated on WTs over afinite horizon. Despite potential costs and benefits in optimally managing WTs, the literature does notconsider the different emissions reduction options, which has enormous implications for expected and costsand environmental effects.
– Computational studies and detailed sensitivity analysis of the proposed MILP model are performed. Theimpact of key cost drivers of recycling, and remanufacturing as well as considering different carbon emissionpolicies are analyzed to provide insights into an optimal reverse logistic network design for WT industry.
– The input data utilized in this study was gathered by employing various sources such as the literature andthe opinions of WT operators and manufacturers. Therefore, this paper also provides detailed cost and assetreplacement data to researchers and decision makers involved in WT industry.
– This paper provides a useful reference for wind farm operators involved in WT reverse logistic networkdecision making and could also be utilized as a decision support tool to minimize the total cost whileconsidering reducing environmental effects.
The remainder of this paper is organized as follows. Section 2 presents athe literature review. A case studythat used for the model application is given in Section 3. A description of the problem is outlined in Section 4,and the model notations, model assumptions, and models, which take the form of MILP, input parameters, andexperimental set-up are then presented in Sections 4.1–4.6 respectively. Section 5 presents the model resultsand Section 6 provides a sensitivity analysis to provide interesting insights into the problem and demonstrateits utility for answering key research questions. Finally, Section 7 summarizes the findings and conclusions withrecommendations for future research.
2. Literature review
In the last two decades, researchers have spent considerable effort studying how a reverse logistic can reducecost, and how to establish an effective and efficient reverse logistics structure for different industries, such asautomotive, electronics and recycling and reuse. Some of these studies conducted not only optimize the economic

SUSTAINABLE REVERSE LOGISTIC NETWORK DESIGN S505
benefits of the well-designed reverse logistic network, but also optimize environmental performances of differentoperations areas under different carbon policies [8, 13, 25, 27, 30, 45]. Some of these studies are summarized inthe following section.
A MILP model was formulated to find an optimal strategy for companies to meet their carbon CAP, whileminimizing costs by Diabat and Al-Salem [12]. Chaabane et al. [9] formulated a model of an aluminum firm andexamined the carbon emissions impact on designing a sustainable close-loop-supply-chain (CLSC) network basedon life-cycle-analysis (LCA) principles. They also evaluated the tradeoffs between economic and environmentaldimensions under various cost and strategies. Fahimnia et al. [16] evaluated the forward and reverse supplychain influences on the carbon footprint using MILP model, where carbon emissions are demonstrated in termsof dollar carbon cost. Benjaafar et al. [5] illustrated the impact of carbon emissions and introduced a series oflot sizing models to be integrated into operations decisions and showed how significant emissions reductionswithout increases in costs can be achieved by operational adjustments alone.
Bing et al. [6] presented a reverse supply chain network, which was applied on household plastic waste dis-tributed from Europe to China. A network optimization problem was modelled by using an integer programingapproach, allowing the re-allocation of intermediate processing plants under emission trading restrictions. Emis-sion trading restrictions were set on the processing plants in both Europe and China. Optimization results showthat global relocation of re-processors leads to both a reduction of total costs and total transportation emission.With a given carbon cap, the model also showed the effective carbon price range. It was concluded that themodel results can give an insight into the feasibility of building a global reverse supply chain for householdplastic waste recycling.
Diabat and Al-Salem [12] addressed a joint location-inventory problem and extend it to account for thereduction of carbon emissions. They also considered the uncertainty by including a new variable that reflectsthe probability of different demand scenarios. Solved the problem, a genetic algorithm (GA) was developed.Based on the model run, it was determined that the resulting model was high in complexity and required solvingwithin reasonable time.
Peng et al. [33] introduced a mixed integer linear programming formulation for modeling and solving amultiperiod one-stage supply chain distribution network design problem. The model was aimed to minimize twoobjectives, the total supply chain cost and the greenhouse gas emissions generated mainly by transportationand warehousing operations. Two carbon emissions regulatory policies were investigated, the tax or carboncredit and the carbon cap. Results demonstrated that for a certain range the carbon credit price incentivizesthe reduction of carbon emissions to the environment. On the other hand, modifying the carbon cap inside acertain range could lead to significant reductions of carbon emissions while not significantly compromising thetotal cost of the supply chain.
Purohit et al. [33] studied the inventory lot-sizing problem under non-stationary stochastic demand conditionwith emission and cycle service level constraints considering carbon cap-and-trade regulatory mechanism. Usinga MILP model, this study aimed to investigate the effects of emission parameters, product-and system-relatedfeatures on the supply chain performance through extensive computational experiments to cover general typebusiness settings and not a specific scenario. Results showed that cycle service level and demand coefficient ofvariation have significant impacts on total cost and emission irrespective of level of demand variability while theimpact of product’s demand pattern is significant only at a lower level of demand variability. The results of thestudy also show that increasing the value of carbon price reduces total cost, total emission and total inventoryand the scope of emission reduction by increasing carbon price is greater at higher levels of cycle service leveland demand coefficient of variation.
Yu and Solvang [44] provided an alternative approach to account both economic and environmental sustain-ability of reverse logistics system. The result of the study showed the trade-off between the costs and carbonemissions, cost effectiveness for improving environmental performance, and influences from resource utilization,all of which have great practical implication on decision making of network configurations and transportationplanning of reverse logistics system.

S506 S. CINAR
Rezaee et al. [36] presented a two-stage stochastic programming model to design a green supply chain in acarbon trading environment. The proposed model was applied to a real world case study. It was found that thesupply chain configuration can be highly sensitive to the probability distribution of the carbon credit price. Inaddition, it was observed that carbon price and budget availability for supply chain reconfiguration can bothhave a positive but a nonlinear relationship with the greening of the supply chain.
Xu et al. [43] proposed a MILP method along with robust optimization to develop the model, which isvalidated using a sample case study of e-waste management. The model results showed that using a robustmodel by taking the complex interactions characterizing global reverse supply chain networks into account,which can create a better global-reverse-supply-chain (GRSC). The effect of uncertainties and carbon constraintson decisions to reduce costs and emissions were also shown.
Fang et al. [16] incorporated reverse logistics into production routing problems and investigated the reductionof carbon emissions under carbon cap-and-trade. A MILP model was proposed for the production routingproblem with reverse logistics by considering simultaneous pickups and deliveries in vehicle routing subproblems.To solve this problem, a branch-and-cut guided search algorithm based on adaptation of known valid inequalitieswas proposed. Computational results showed that emission levels and operational costs of production, inventoryholding, fuel consumption, and drivers were the main performance indicators.
Alkhayyal and Gupta [1] addressed the design of reverse supply chain under the three common regulatorypolicies, strict carbon caps, carbon tax, and carbon cap-and-trade. The model proposed can be used for designingand analyzing a reverse supply chain in a carbon trading environment, and optimize not only costs but alsoemissions in the supply chain operations. The model results showed that carbon tax emissions, particularlyat higher taxes, affects transportation operations, which results in reduced transportation costs and emissions;whereas, the higher the carbon tax is, the lower emissions. It was concluded that applying an emissions capcombined with a carbon tax slightly increased total supply chain costs, but yielded a greener design.
Anvar et al. [2] developed a MILP to determine the amount of carbon emitted in a two-echelon supply chainin which one supplier delivers a single product to a group of retailers and attempts are made to integrate andcoordinate its different members. The objective of this research was to minimize the costs of transportation andthose engendered by material handling and inventory holding activities as well as to reduce carbon emissionsthroughout the supply chain. According to the results obtained, the supplier would opt for lower carbon vehicletypes if replenishment timing, distances between members of the supply chain, the rate of carbon tax or theamount of retailers increases.
Ghosh et al. [19] developed an unconstrained mixed integer non-linear programming (MINLP) problem tofind the optimal production rate, order quantity, number of shipments and reorder point while minimizing thetotal-expected-cost (TEC) of a two-echelon integrated supply chain with stochastic demand. Emissions from allthe major sources such as production, inventory and transportation have been taken into consideration. It wasassumed that the emission from production is a function of production rate, and emission from transportationdepends on the payload and vehicle type. The aim of the proposed model to help organizations to reduce costand emissions, and regulatory bodies to decide proper tax rate on carbon emissions.
Bottani and Casella [7] investigated the issue of minimizing the environmental burden of a real CLSC,consisting of a pallet provider, a manufacturer and several retailers. A simulation model was developed underMicrosoft Excel to reproduce the flow of returnable transport items (RTIs) to compute the correspondingenvironmental impact. The results of the study showed that the asset retrieving operations contribute to theenvironmental impact of the system to the greatest extent due to a quite relevant distance between Company Aand its customers. Conversely, emissions due to the purchase of new assets contributed to the total environmentalimpact of the system to a very limited extent. The results were expected to provide practical indications tologistics and supply chain managers, to minimize the environmental performance of the system.
In the literature, a significant number of studies focus on the RLND specially, facility location, productionplanning, green logistic, and end-of life use for different industries, such as automotive, electronics and recyclingand reuse. On the other hand, to the best of our knowledge very little research has been done regarding WTend of life options under the cap and credit policy. This paper is going to address this gap by considering the
SUSTAINABLE REVERSE LOGISTIC NETWORK DESIGN S507
uncertain recycling quality and quantity for modelling the low-carbon EOL management under these policies.Based on the environmental and economic factors, the supply chain would greatly benefit if the carbon emissionsconcept integrated into the whole reverse logistics network process. By doing so, the WT supply chain wouldbecome environmentally more responsible by recycling, reusing, or remanufacturing the WT. Therefore, wepropose a model that can be used for designing and analyzing a reverse supply chain in a carbon tradingenvironment, and optimize not only costs but also emissions in the supply chain operations. In addition. In thismodel, we propose to investigate the impact of the two most comman carbon regulatıry policies such as carbonemission cap and carbon tax on reverse logistic operations.
3. Case study wind turbine and carbon emissions
Due to the increased awareness of environmental issues and more restrictive environmental regulations, renew-able energy sources such as wind, solar, hydro, and geothermal are becoming more popular. The main driverfor interest in WTs is to produce electrical power with very low CO2 emissions, which is one of the largestcontributors of greenhouse gas emissions, the insidious cause of climate change [18].
Based on the environmental and economic factors, the supply chain would greatly benefit if a reverse logisticsnetwork was integrated into the whole supply chain process. By doing so, the WT supply chain would becomeenvironmentally more responsible by recycling, reusing, or remanufacturing the WTs reached their end-of-life(EOL) use. In addition, there is a possibility of economic gain from recycling and remanufacturing. Recoveryof products and parts can be good alternatives to manufacturing new products and parts and virgin resources[17, 28]. It is clear that an effective reverse logistics for WTs can generate direct gains by reducing the use ofraw materials, adding value with recovery, reducing disposal costs, recycling to save landfill space and energy,and reducing CO2 emissions, in turn providing a more sustainable supply chain.
Life expectancy for WTs is about 20 years [21, 32]. Due to increasing demand of using wind energy as arenewable energy source, at some point, many WTs will reach the end of their service life. Thus, a sustainableprocess that can be used when WTs reach the end of their service life is needed in order to maximize theenvironmental and economic benefits of wind energy and to minimize the environmental impact. In addition,because of the growing demand for energy in developing countries, and the interest in renewable energy sources,i.e., wind energy, which provides a sustainable and environmentally friendly power supply, remanufacturing ofEOL WTs could be helpful to satisfy this growing need for power. Most of these developing countries may notbe able to afford brand new WTs as a source of renewable energy. Therefore, providing used refurbished WTsin these locations offers several benefits, such as lower capital investment, shorter project duration, reductionof CO2 emissions, and a contribution to sustainable development [23].
Several studies discussed the reduction in CO2 by comparing different alternatives for treatment and replace-ment of old WTs. The highest amount of CO2 emissions for energy generation from WTs was found to be in thematerial production phase, which is 60%–64% of total emissions, and the next was in WT production. Trans-portation, disassembly, and renovation/maintenance contributes only 2%–3% of CO2 emissions [38]. Skrainka[41] analyzed the environmental impact of remanufacturing WTs and concluded that remanufacturing of thecomponent inside the nacelle has a smaller impact on the environment than manufacturing new components.Arvesen and Hertwich [3] assessed the life-cycle environmental impacts of wind power and estimated that theEOL phase of WTs reduces emissions, decreasing greenhouse gas emissions by 19%. Turbine 100 kWA producedthe majority of its emissions from manufacture, 30.6 tCO2eq (51%) and 28.7 tCO2eq (47%) from installation;transportation accounted for 1.18 tCO2eq (2%). For the 100 kWB turbine, an installation made up the majorityof emissions, 79.1 tCO2eq (59%); manufacturing accounted for 54 tCO2eq (41%), and transportation accountedfor 0.4 [42].
The study, completed by Ghenai [18] shows the benefits of recycling parts of the WTs at the end life oftheir useful life, producing less CO2 than the landfilling process. It can be seen that the dominant phase thatis consuming more energy and producing more CO2 emissions is the material phase and primary materialproduction of the WT parts. More energy is consumed and high amount of CO2 is released into the atmosphere
S508 S. CINAR
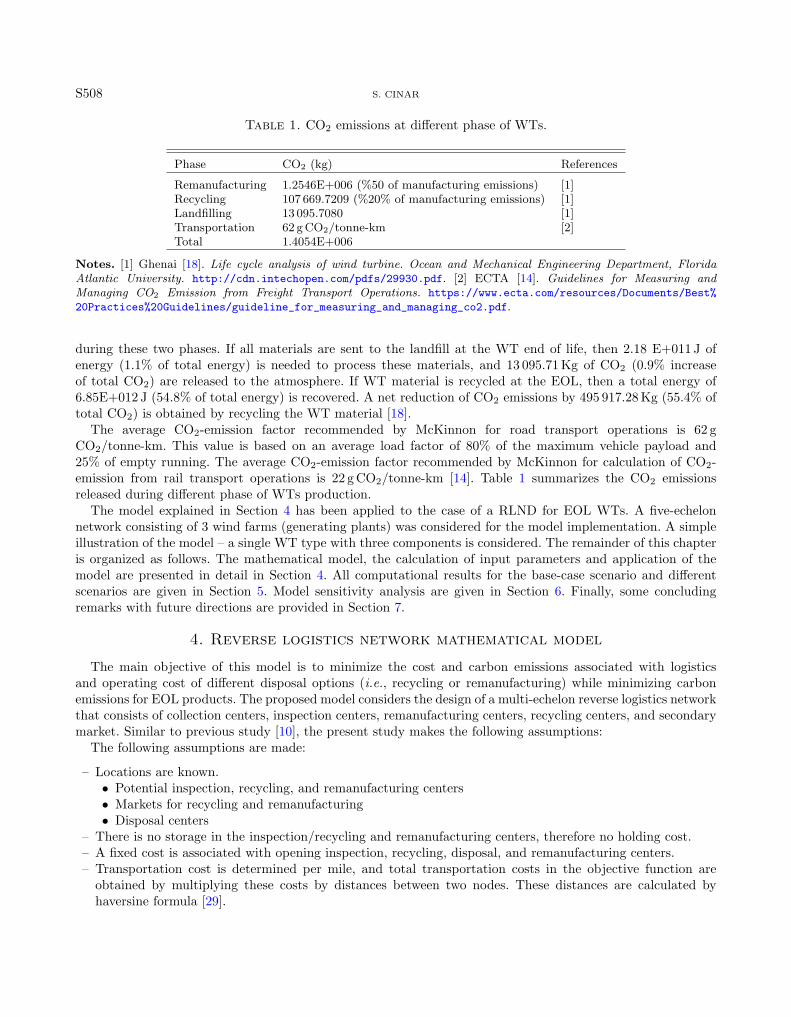
Table 1. CO2 emissions at different phase of WTs.
Phase CO2 (kg) References
Remanufacturing 1.2546E+006 (%50 of manufacturing emissions) [1]Recycling 107 669.7209 (%20% of manufacturing emissions) [1]Landfilling 13 095.7080 [1]Transportation 62 g CO2/tonne-km [2]Total 1.4054E+006
Notes. [1] Ghenai [18]. Life cycle analysis of wind turbine. Ocean and Mechanical Engineering Department, FloridaAtlantic University. http://cdn.intechopen.com/pdfs/29930.pdf. [2] ECTA [14]. Guidelines for Measuring andManaging CO2 Emission from Freight Transport Operations. https://www.ecta.com/resources/Documents/Best%
20Practices%20Guidelines/guideline_for_measuring_and_managing_co2.pdf.
during these two phases. If all materials are sent to the landfill at the WT end of life, then 2.18 E+011 J ofenergy (1.1% of total energy) is needed to process these materials, and 13 095.71 Kg of CO2 (0.9% increaseof total CO2) are released to the atmosphere. If WT material is recycled at the EOL, then a total energy of6.85E+012 J (54.8% of total energy) is recovered. A net reduction of CO2 emissions by 495 917.28 Kg (55.4% oftotal CO2) is obtained by recycling the WT material [18].
The average CO2-emission factor recommended by McKinnon for road transport operations is 62 gCO2/tonne-km. This value is based on an average load factor of 80% of the maximum vehicle payload and25% of empty running. The average CO2-emission factor recommended by McKinnon for calculation of CO2-emission from rail transport operations is 22 g CO2/tonne-km [14]. Table 1 summarizes the CO2 emissionsreleased during different phase of WTs production.
The model explained in Section 4 has been applied to the case of a RLND for EOL WTs. A five-echelonnetwork consisting of 3 wind farms (generating plants) was considered for the model implementation. A simpleillustration of the model – a single WT type with three components is considered. The remainder of this chapteris organized as follows. The mathematical model, the calculation of input parameters and application of themodel are presented in detail in Section 4. All computational results for the base-case scenario and differentscenarios are given in Section 5. Model sensitivity analysis are given in Section 6. Finally, some concludingremarks with future directions are provided in Section 7.
4. Reverse logistics network mathematical model
The main objective of this model is to minimize the cost and carbon emissions associated with logisticsand operating cost of different disposal options (i.e., recycling or remanufacturing) while minimizing carbonemissions for EOL products. The proposed model considers the design of a multi-echelon reverse logistics networkthat consists of collection centers, inspection centers, remanufacturing centers, recycling centers, and secondarymarket. Similar to previous study [10], the present study makes the following assumptions:
The following assumptions are made:
– Locations are known.• Potential inspection, recycling, and remanufacturing centers• Markets for recycling and remanufacturing• Disposal centers
– There is no storage in the inspection/recycling and remanufacturing centers, therefore no holding cost.– A fixed cost is associated with opening inspection, recycling, disposal, and remanufacturing centers.– Transportation cost is determined per mile, and total transportation costs in the objective function are
obtained by multiplying these costs by distances between two nodes. These distances are calculated byhaversine formula [29].

SUSTAINABLE REVERSE LOGISTIC NETWORK DESIGN S509
4.1. Model notation
In order to propose our model for the problem, the sets, indexes, parameters, cost, and decision variablesused in the model are given as follows:c: parts, c ∈ C = 1, . . ., |C|.j: all possible locations j ∈ J = 1, . . ., |J|.t: time periods, t ∈ T = 1, . . ., |T|.w: location of collection centers, w ∈W = 1, . . ., |J|.i: potential inspection centers, i ∈ I = 1, . . ., |I| ⊆ J.m: potential remanufacturing centers, m ∈M = 1, . . ., |M | ⊆ J .r: potential recycling centers, r ∈ R = 1, . . ., |R| ⊆ J .s: potential markets, s ∈ S = 1, . . ., |S| ⊆ J .ds: potential disposal centers, ds ∈ DS = 1, . . ., |DS| ⊆ J .CARP: carbon cap.
ParametersQwct: supply of WT component c at wind farm w in period t.DSMsct: demand of WT component c at market s in period t.DRrct: demand of WT component c at recycling center r in period t.DMmct: demand of WT component c at remanufacturing center m in period t.DLdsct: demand of WT component c at disposal center ds in period t.CAPIit: capacity of inspection center i in period t.CAPRrt: capacity of recycling center r in period t.CAPMmt: capacity of remanufacturing center m in period t.CAPDdst: capacity of disposal center ds in period t.α: % of WT component c sent from inspection center to recycling center.β: % of WT component c sent from inspection center to remanufacturing center.γ: % of WT component c sent from inspection center to disposal center.
CostsFIit: fixed cost opening inspection center i in period t ($).FMmt: fixed cost opening remanufacturing center m in period t ($).FRrt: fixed cost of opening recycling center r in period t ($).FAlt: fixed cost of opening disposal center l in period t ($).OIcit: cost of processing one unit of WT component c at inspection cen-
ter i in period t ($).ORcrt: cost of processing one unit of WT component c at recycling center
r in period t ($).OMcmt: cost of processing one unit of WT component c at remanufacturing
plant m in period t ($).CIcit: CO2 emission indicator of processing one unit of WT component
c at inspection center i in period t (gram).CRcrt: CO2 emission indicator of processing one unit of WT component
c at recycling center r in period t (gram).CMcmt: CO2 emission indicator of processing one unit of WT component
c at remanufacturing plant m in period t (gram).CAclt: CO2 emission indicator of processing one unit of WT component
c at disposal center m in period t (gram).Twict, Tirct, Timct, Tmsct, Tilct: transportation distance of one unit of WT component c at time
period t from w to i, i to r, i to m, m to s, or i to l (mile).θ : unit transpiration cost factor ($/mile).Ω : unit carbon emissions factor (gram/unit-mile) total CO2 emis-
sions/# units.# km’s.dr: inflation rate.
S510 S. CINAR
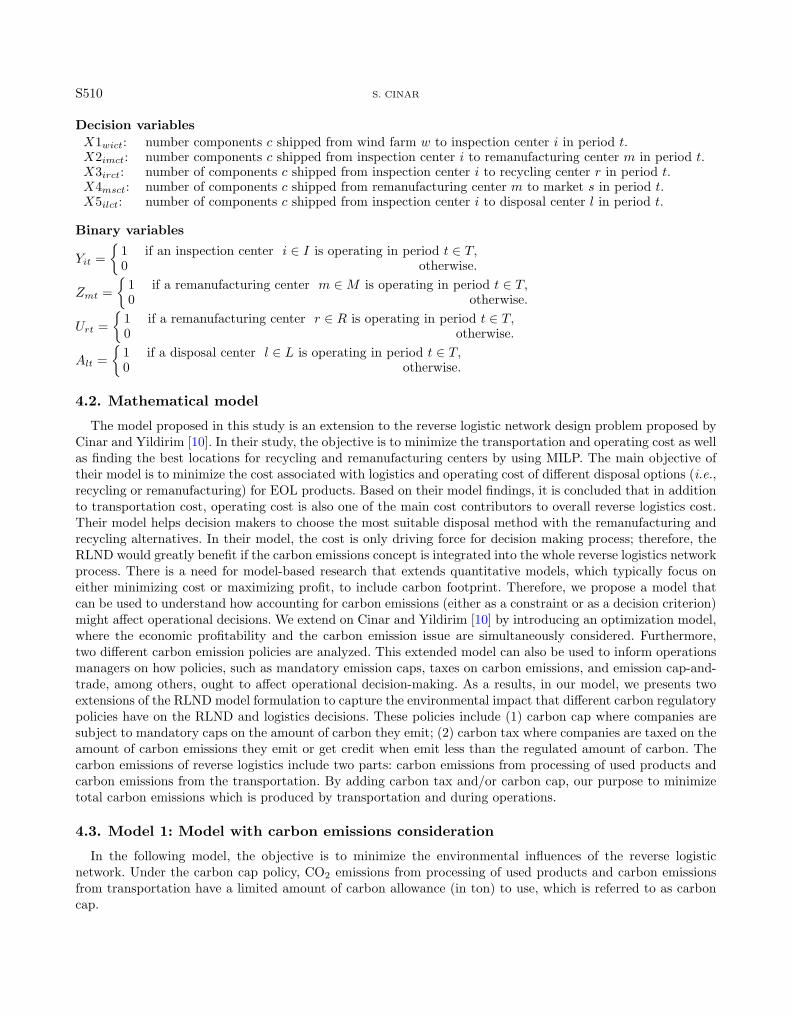
Decision variablesX1wict: number components c shipped from wind farm w to inspection center i in period t.X2imct: number components c shipped from inspection center i to remanufacturing center m in period t.X3irct: number of components c shipped from inspection center i to recycling center r in period t.X4msct: number of components c shipped from remanufacturing center m to market s in period t.X5ilct: number of components c shipped from inspection center i to disposal center l in period t.
Binary variables
Yit =
1 if an inspection center i ∈ I is operating in period t ∈ T,0 otherwise.
Zmt =
1 if a remanufacturing center m ∈M is operating in period t ∈ T,0 otherwise.
Urt =
1 if a remanufacturing center r ∈ R is operating in period t ∈ T,0 otherwise.
Alt =
1 if a disposal center l ∈ L is operating in period t ∈ T,0 otherwise.
4.2. Mathematical model
The model proposed in this study is an extension to the reverse logistic network design problem proposed byCinar and Yildirim [10]. In their study, the objective is to minimize the transportation and operating cost as wellas finding the best locations for recycling and remanufacturing centers by using MILP. The main objective oftheir model is to minimize the cost associated with logistics and operating cost of different disposal options (i.e.,recycling or remanufacturing) for EOL products. Based on their model findings, it is concluded that in additionto transportation cost, operating cost is also one of the main cost contributors to overall reverse logistics cost.Their model helps decision makers to choose the most suitable disposal method with the remanufacturing andrecycling alternatives. In their model, the cost is only driving force for decision making process; therefore, theRLND would greatly benefit if the carbon emissions concept is integrated into the whole reverse logistics networkprocess. There is a need for model-based research that extends quantitative models, which typically focus oneither minimizing cost or maximizing profit, to include carbon footprint. Therefore, we propose a model thatcan be used to understand how accounting for carbon emissions (either as a constraint or as a decision criterion)might affect operational decisions. We extend on Cinar and Yildirim [10] by introducing an optimization model,where the economic profitability and the carbon emission issue are simultaneously considered. Furthermore,two different carbon emission policies are analyzed. This extended model can also be used to inform operationsmanagers on how policies, such as mandatory emission caps, taxes on carbon emissions, and emission cap-and-trade, among others, ought to affect operational decision-making. As a results, in our model, we presents twoextensions of the RLND model formulation to capture the environmental impact that different carbon regulatorypolicies have on the RLND and logistics decisions. These policies include (1) carbon cap where companies aresubject to mandatory caps on the amount of carbon they emit; (2) carbon tax where companies are taxed on theamount of carbon emissions they emit or get credit when emit less than the regulated amount of carbon. Thecarbon emissions of reverse logistics include two parts: carbon emissions from processing of used products andcarbon emissions from the transportation. By adding carbon tax and/or carbon cap, our purpose to minimizetotal carbon emissions which is produced by transportation and during operations.
4.3. Model 1: Model with carbon emissions consideration
In the following model, the objective is to minimize the environmental influences of the reverse logisticnetwork. Under the carbon cap policy, CO2 emissions from processing of used products and carbon emissionsfrom transportation have a limited amount of carbon allowance (in ton) to use, which is referred to as carboncap.
SUSTAINABLE REVERSE LOGISTIC NETWORK DESIGN S511
Basic model formulation
Minimize Z1 = Z11 + Z12 + Z13. (1)Fixed cost Z11 =∑
i
∑t
FIit ∗ (Yit − Yi,t−1) ∗ (1 + dr)−t +∑m
∑t
FMmt ∗ (Zmt − Zm,t−1) ∗ (1 + dr)−t +∑
r
∑t
FRrt ∗ (Urt
− Ur,t−1) ∗ (1 + dr)−t +∑
l
∑t
FAlt ∗ (Alt −Al,t−1) ∗ (1 + dr)−t.
Transportation cost Z12 =∑t
∑c
∑w
∑i
Twict ∗Θ ∗X1wict ∗ (1 + dr)−t +∑
t
∑c
∑i
∑m
Timct ∗Θ ∗X2imct ∗ (1 + dr)−t
+∑
t
∑c
∑i
∑r
Tirct ∗Θ ∗X3irct ∗ (1 + dr)−t +∑
t
∑c
∑m
∑s
Tmsct ∗Θ ∗X4msct ∗ (1 + dr)−t
+∑
t
∑c
∑i
∑l
Tilct ∗Θ ∗X5ilct ∗ (1 + dr)−t.
Operations and disposal cost Z13 =∑t
∑c
∑w
∑i
OIcit ∗X1wict ∗ (1 + dr)−t +∑
t
∑c
∑i
∑m
OMcmt ∗X2imct ∗ (1 + dr)−t +∑
t
∑c
∑i
∑r
ORcrt
∗X3irct ∗ (1 + dr)−t +∑
t
∑c
∑i
∑l
OAcst ∗X5ilct ∗ (1 + dr)−t.
The followings are the constraints of the basic model:
Qwct =∑i∈I
X1wict w ∈W, c ∈ C, t ∈ T (2)
α+ β + γ = 1 (3)∑w∈W
α ∗X1wict =∑
m∈M
X2imct i ∈ I, c ∈ C, t ∈ T (4)∑c∈C
γ ∗X1cipt =∑l∈L
X5ilct i ∈ I, c ∈ C, t ∈ T (5)∑w∈W
β ∗X1wict =∑r∈R
X3irct i ∈ I, c ∈ C, t ∈ T (6)∑s∈S
X4msct =∑i∈I
X2imct m ∈M, c ∈ C, t ∈ T (7)∑s∈S
X4msct ≤∑s∈S
DSMsct m ∈M, c ∈ C, t ∈ T (8)∑r∈R
X3irct ≤∑r∈R
DRrct i ∈ I, c ∈ C, t ∈ T (9)∑m∈M
X2imct ≤∑
m∈M
DMmct i ∈ I, c ∈ C, t ∈ T (10)∑l∈L
X5ilpt ≤∑l∈L
DLlct i ∈ I, c ∈ C, t ∈ T (11)∑w∈W
∑c∈C
X1wict ≤ CAPIit ∗ Yit i ∈ I, t ∈ T (12)
S512 S. CINAR∑i∈I
∑c∈C
X3irct ≤ CAPRrt ∗ Urt r ∈ r, t ∈ T (13)∑i∈I
∑c∈C
X2imct ≤ CAPMmt ∗ Zmt m ∈M, t ∈ T (14)∑i∈I
∑c∈C
X5ilct ≤ CAPDlt ∗Alt l ∈ L, t ∈ T (15)
X1wict, X2imct, X3irct, X4msct, X5ilct ≥ 0 (16)Yit ∈ 0, 1, Zmt ∈ 0, 1, Urt ∈ 0, 1, Alt ∈ 0, 1 i ∈ I, r ∈ R,M ∈M, t ∈ T, l ∈ L (17)
Yit ≤ Yi,t+1 i ∈ I, t ∈ T (18)Urt ≤ Ur,t+1 r ∈ R, t ∈ T (19)
Zmt ≤ Zm,t+1 m ∈M, t ∈ T (20)Alt ≤ ZAl,t+1 l ∈ L, t ∈ T. (21)
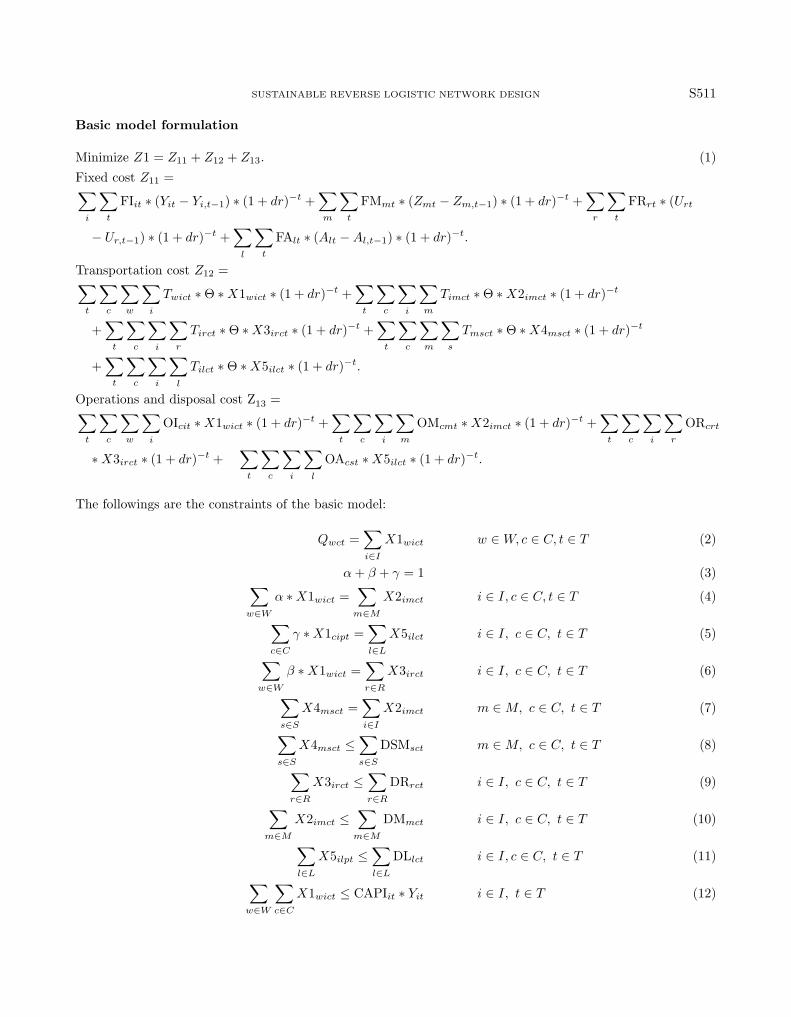
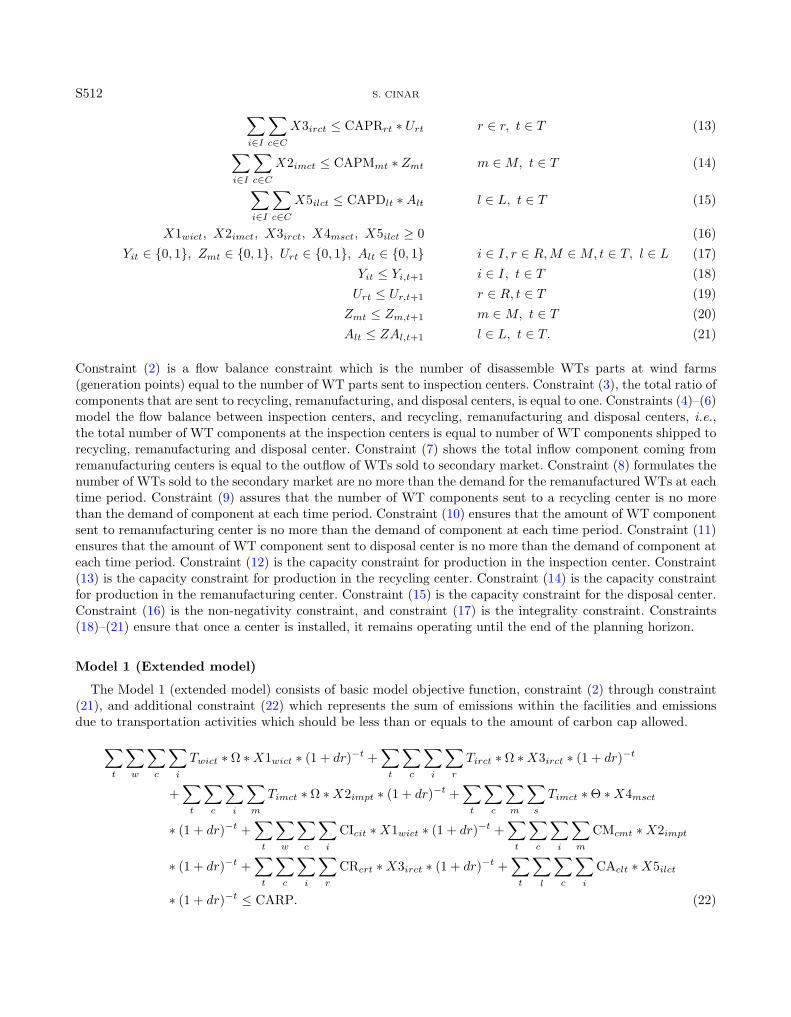
Constraint (2) is a flow balance constraint which is the number of disassemble WTs parts at wind farms(generation points) equal to the number of WT parts sent to inspection centers. Constraint (3), the total ratio ofcomponents that are sent to recycling, remanufacturing, and disposal centers, is equal to one. Constraints (4)–(6)model the flow balance between inspection centers, and recycling, remanufacturing and disposal centers, i.e.,the total number of WT components at the inspection centers is equal to number of WT components shipped torecycling, remanufacturing and disposal center. Constraint (7) shows the total inflow component coming fromremanufacturing centers is equal to the outflow of WTs sold to secondary market. Constraint (8) formulates thenumber of WTs sold to the secondary market are no more than the demand for the remanufactured WTs at eachtime period. Constraint (9) assures that the number of WT components sent to a recycling center is no morethan the demand of component at each time period. Constraint (10) ensures that the amount of WT componentsent to remanufacturing center is no more than the demand of component at each time period. Constraint (11)ensures that the amount of WT component sent to disposal center is no more than the demand of component ateach time period. Constraint (12) is the capacity constraint for production in the inspection center. Constraint(13) is the capacity constraint for production in the recycling center. Constraint (14) is the capacity constraintfor production in the remanufacturing center. Constraint (15) is the capacity constraint for the disposal center.Constraint (16) is the non-negativity constraint, and constraint (17) is the integrality constraint. Constraints(18)–(21) ensure that once a center is installed, it remains operating until the end of the planning horizon.
Model 1 (Extended model)
The Model 1 (extended model) consists of basic model objective function, constraint (2) through constraint(21), and additional constraint (22) which represents the sum of emissions within the facilities and emissionsdue to transportation activities which should be less than or equals to the amount of carbon cap allowed.∑
t
∑w
∑c
∑i
Twict ∗ Ω ∗X1wict ∗ (1 + dr)−t +∑
t
∑c
∑i
∑r
Tirct ∗ Ω ∗X3irct ∗ (1 + dr)−t
+∑
t
∑c
∑i
∑m
Timct ∗ Ω ∗X2impt ∗ (1 + dr)−t +∑
t
∑c
∑m
∑s
Timct ∗Θ ∗X4msct
∗ (1 + dr)−t +∑
t
∑w
∑c
∑i
CIcit ∗X1wict ∗ (1 + dr)−t +∑
t
∑c
∑i
∑m
CMcmt ∗X2impt
∗ (1 + dr)−t +∑
t
∑c
∑i
∑r
CRcrt ∗X3irct ∗ (1 + dr)−t +∑
t
∑l
∑c
∑i
CAclt ∗X5ilct
∗ (1 + dr)−t ≤ CARP. (22)

SUSTAINABLE REVERSE LOGISTIC NETWORK DESIGN S513
4.4. Model 2: Model with carbon emission CAP and carbon credit policy
In the following model, the objective is to minimize the total network cost under carbon emission cap/creditpolicy. Under the carbon emission cap policy, there is a restriction on emissions and emission is penalized byusing a carbon tax (penalty per unit of carbon emissions). This means that for every tonne of carbon dioxideemitted into the atmosphere, the producer may sacrifice a certain amount of capital. In terms of carbon credit,one carbon credit (or carbon “offset”) is a closely regulated certificate representing a reduction of one metricton of carbon dioxide being released into the atmosphere. In dollar terms, the price of carbon credits per ton isabout USD 15 to USD 40 [22].
Minimize Model 2 = Model 1 + cost of carbon emissions credit in $ per ton CO2 * (Total CO2 emission-Carbon emission cap (CARP))
Total Carbon Emissions =∑t
∑p
∑c
∑i
Tcipt ∗ Ω ∗X1cipt ∗ (1 + dr)−t +∑
t
∑c
∑i
∑r
Tirct ∗ Ω ∗X3irct ∗ (1 + dr)−t
+∑
t
∑c
∑i
∑m
Timct ∗ Ω ∗X2imct ∗ (1 + dr)−t +∑
t
∑c
∑m
∑s
Tmsct ∗Θ ∗X4msct ∗ (1 + dr)−t
+∑
t
∑c
∑i
∑m
CMcmt ∗X2imct ∗ (1 + dr)−t +∑
t
∑c
∑i
∑r
CRcrt ∗X3irct ∗ (1 + dr)−t
+∑
t
∑p
∑c
∑i
CIcit ∗X1cipt ∗ (1 + dr)−t.
Subject to:
Constraints (2)–(21) except constraint (22).
4.5. Input parameters
For each wind farm location, the number of WTs is determined randomly, and the distance matrix is createdbetween 5 wind farm locations. It is assumed that three types of WT components are sent to each center. Thecost data summarized in Table 2 is used for this study.
4.6. Experimental design
In this section, we present a RLND for one type WT under different cases by solving the proposed model. Weperform all computational experiments on a personal computer equipped with Windows 7, 1:80 GHz CPU and4 GB memory. This model is coded in the Generic Algebraic Modeling System (GAMS) as a front-end interfaceto CPLEX optimizer, which is used for solving MIP model over a 50-period (year) horizon.
To illustrate how the proposed MILP model can help wind farm operator to make optimal recy-cling/remanufacturing decisions, real world WT cost data is analyzed and incorporated into the model. Wecarried out scenario analysis, including three different cases, to understand how different disposal options affectthe WTs RLND. Before giving the model results, it would be ideal to explain the each Case/Scenario.
For the initial base run for both Model-1 and Model-2, it was assumed that 30% of the total supply would beremanufactured, 60% would be recycled and the remaining 10% of the parts would go to disposal centers. It wasassumed that this is not the case for all WTs, since several factors may affect their remaining life and that someof the WTs may still be in good conditions, or vise versa. Therefore, several other scenarios were modelled usingratio (α) values between 0.1 and 0.8, in increments of 0.1, to evaluate the effects of recycling/remanufacturingcosts during the decision-making process.
The sensitivity analysis for Model-1 and Model-2 involved the investigation of the impact of carbon emissionsrate, carbon cap amount and carbon credit provided for each kg CO2, which is not emitted to the atmosphere.

S514 S. CINAR
Table 2. Summary of cost data.
Item Cost Reference
Transportation cost $4.2 per mile [4]New wind turbine cost (GE 1.5 XLE 1.5 MW $1 400 000 [2], [3]Remanufactured turbine cost (GE 1.5 SL) $500 000 [2], [3]
Operating CostOperating cost at remanu-facturing center
[$10 000–$50 000] Estimated based on expertopinion (gearbox, generator,towers or blades) [1]
Operating cost at inspectioncenter plus added disman-tling cost
[$1000–$5000] [$35 000added dismantling cost]
Estimated based on expertopinion (gearbox, generator,towers or blades) [1]
Operating cost at recyclingcenter
[1000–5000] Estimated based on expertopinion (gearbox, generator,towers or blades) [1]
Installation cost ofcenters
Inspection, remanufactur-ing, and recycling centers
[15 000–70 000] Estimated based on expertopinion [1]
Remanufactured tur-bine
Gearbox 10–15% total costof WT
$50 000–$75 000 [2], [3]
component cost Generator 5–10% total costof WT
$25 000–$50 000
Tower cost 10–25% totalcost of WT
$50 000–$125 000
Blades 10–15% total cost ofWT
$50 000–$75 000
Recycling cost profitGenerator $12 500 Estimated based on typicalGear box $7000 materials and quantitiesTower $75 600 required for Vestas V82
1.65-MW turbine.
Notes. [1] Renew Energy Maintenance [34]. [2] Oliveira and Fernandes [11]. [3] Repowering Solutions [35]. [4] SandiaNational Laboratories [37].
5. Summary of numerical results
In this section, we illustrate how the models presented in the previous section can be used to obtain usefulinsights. The insights, presented in the form of a series of observations, are based on numerical results generatedfrom solving the models for examples of problems with varying parameter values. The details of the experimentalsetup can be found in Section 4.6.
5.1. Model 1: Results
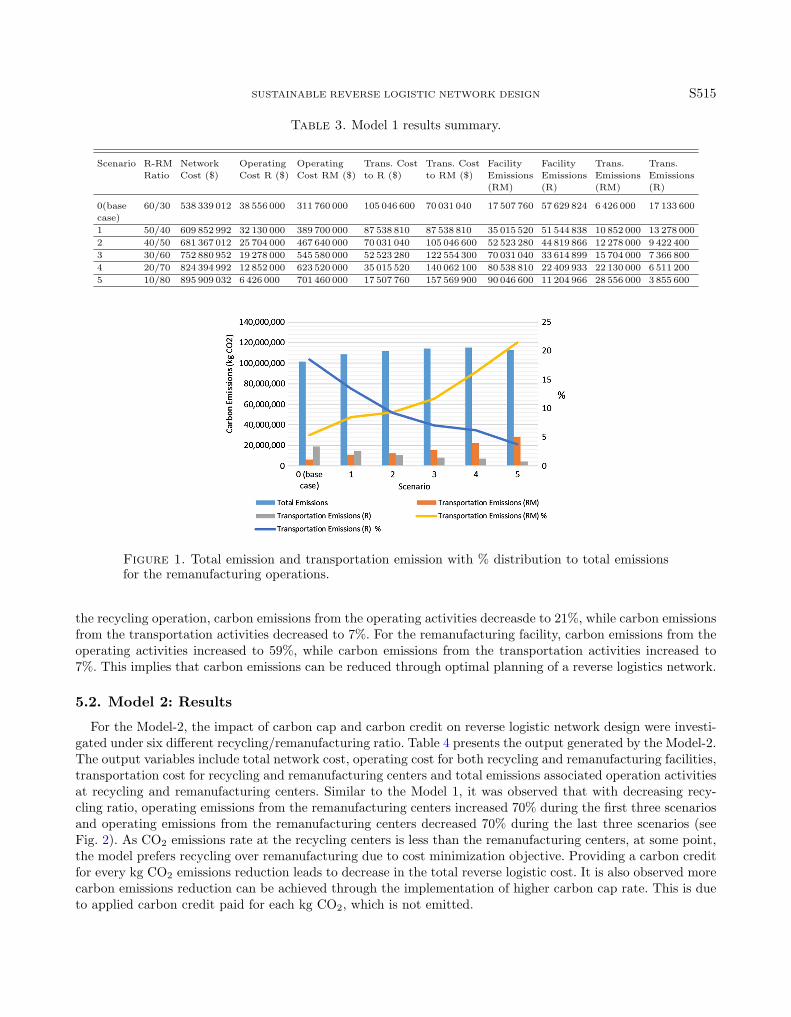
For the Model-1, to investigate the impact of emission control on the reverse logistic network design, severaldifferent recycling/remanufacturing ratio were used to analyze the effect of material flow on total emissions andthe total network cost. Table 3 presents the output generated by the Model-1. The output variables includetotal network cost, operating cost for both recycling and remanufacturing facilities, transportation cost forrecycling and remanufacturing centers and total emissions associated with operation activities at recyclingand remanufacturing centers. It is observed that when the recycling ratio decreases, the operating emissionsincreases up to 70% due to the higher emissions rate at the remanufacturing center. The percent contributionof the transportation emissions for recycling and remanufacturing centers stays between 3–17% and 6–21%,respectively (see Fig. 1). Therefore, it can be concluded that in addition to operating emissions, transportationemissions are also important factors in the design of a reverse logistics network. Comparing all the scenarios, for
SUSTAINABLE REVERSE LOGISTIC NETWORK DESIGN S515
Table 3. Model 1 results summary.
Scenario R-RM Network Operating Operating Trans. Cost Trans. Cost Facility Facility Trans. Trans.
Ratio Cost ($) Cost R ($) Cost RM ($) to R ($) to RM ($) Emissions Emissions Emissions Emissions
(RM) (R) (RM) (R)
0(base 60/30 538 339 012 38 556 000 311 760 000 105 046 600 70 031 040 17 507 760 57 629 824 6 426 000 17 133 600
case)
1 50/40 609 852 992 32 130 000 389 700 000 87 538 810 87 538 810 35 015 520 51 544 838 10 852 000 13 278 000
2 40/50 681 367 012 25 704 000 467 640 000 70 031 040 105 046 600 52 523 280 44 819 866 12 278 000 9 422 400
3 30/60 752 880 952 19 278 000 545 580 000 52 523 280 122 554 300 70 031 040 33 614 899 15 704 000 7 366 800
4 20/70 824 394 992 12 852 000 623 520 000 35 015 520 140 062 100 80 538 810 22 409 933 22 130 000 6 511 200
5 10/80 895 909 032 6 426 000 701 460 000 17 507 760 157 569 900 90 046 600 11 204 966 28 556 000 3 855 600
Figure 1. Total emission and transportation emission with % distribution to total emissionsfor the remanufacturing operations.
the recycling operation, carbon emissions from the operating activities decreasde to 21%, while carbon emissionsfrom the transportation activities decreased to 7%. For the remanufacturing facility, carbon emissions from theoperating activities increased to 59%, while carbon emissions from the transportation activities increased to7%. This implies that carbon emissions can be reduced through optimal planning of a reverse logistics network.
5.2. Model 2: Results
For the Model-2, the impact of carbon cap and carbon credit on reverse logistic network design were investi-gated under six different recycling/remanufacturing ratio. Table 4 presents the output generated by the Model-2.The output variables include total network cost, operating cost for both recycling and remanufacturing facilities,transportation cost for recycling and remanufacturing centers and total emissions associated operation activitiesat recycling and remanufacturing centers. Similar to the Model 1, it was observed that with decreasing recy-cling ratio, operating emissions from the remanufacturing centers increased 70% during the first three scenariosand operating emissions from the remanufacturing centers decreased 70% during the last three scenarios (seeFig. 2). As CO2 emissions rate at the recycling centers is less than the remanufacturing centers, at some point,the model prefers recycling over remanufacturing due to cost minimization objective. Providing a carbon creditfor every kg CO2 emissions reduction leads to decrease in the total reverse logistic cost. It is also observed morecarbon emissions reduction can be achieved through the implementation of higher carbon cap rate. This is dueto applied carbon credit paid for each kg CO2, which is not emitted.

S516 S. CINAR
Table 4. Model 2 results summary.
Scenario R-RM Network Operating Operating Trans. Cost Trans. Cost Facility Facility Trans. Trans.
Ratio Cost ($) Cost R ($) Cost RM ($) to RM ($) to R ($) Emissions Emissions Emissions Emissions
(RM) (R) (RM) (R)
0(base 60/30 533 339 012 38 556 000 311 760 000 70 231 040 104 846 600 14 006 208 63 392 806 6 426 000 14 133 600
case)
1 50/40 539 852 992 31 130 000 389 700 000 87 638 810 86 538 810 28 012 416 56 699 322 10 952 000 13 178 000
2 40/50 545 367 012 24 704 000 467 640 000 105 846 600 69 031 040 42 018 624 49 301 852 12 778 000 11 222 400
3 30/60 534 880 952 29 178 000 445 580 000 103 554 300 71 523 280 40 024 832 52 976 389 11 904 000 10 466 800
4 20/70 522 394 992 32 652 000 423 520 000 101 062 100 72 015 520 37 431 048 55 650 926 11 830 000 12 211 200
5 10/80 520 394 992 36 126 000 401 460 000 98 569 900 76 507 760 32 037 280 54 325 463 10 272 600 13 041 160
Figure 2. % Emission contribution at recycling and remanufacturing operations for each scenario.
6. Sensitivity analysis
The purpose of the sensitivity analysis is to investigate the influences of those key parameters on operatingcosts and carbon emissions of the reverse logistics network. It is clear that there is a relationship between totalcarbon emissions, operating emission rates of recycling and remanufacturing centers, carbon cap, and carboncredit. Therefore, a sensitivity analysis was performed to see the effect of carbon cap and carbon credit on thetotal carbon emissions.
6.1. Model 1: Sensitivity
6.1.1. Increasing emission rate at remanufacturing centers
In the first sensitivity analysis for the Model 1, the emission rate (i.e., 10%, 20%, and 30%) at remanufacturingcenters was increased in the interval of 10 and the other parameters remain the same. Figure 3 presents theoutput generated by the sensitivity analysis. The total carbon emission begins relatively high and continues todecrease with increasing emittion rate. Sensitivity analysis showed that as model tries to optimize both costand the carbon emissions, once we increased the emission rate at the remanufacturing centers, the model prefersto send more flow to recycling centers, which has low operating cost and low carbon emissions rate. Therefore,there an increase is observed in transportation and operating emissions at recycling centers whereas a decreaseis observed in transportation and operating emissions at remanufacturing centers.

SUSTAINABLE REVERSE LOGISTIC NETWORK DESIGN S517
Figure 3. Sensitivity analysis results for increasing emission rate at recycling center.
Figure 4. Model 1-Sensitivity analysis results for increasing cap rate.
6.1.2. Increasing carbon cap rate
In the second sensitivity analysis for the Model 1, the carbon cap rate was increased by 10%, 20% and 30%.As a result, the total emission increased by more than 20%. The carbon cap rate for the base case was selectedto be 500 000 kg CO2. This analysis indicates that in the assumed case, if the carbon cap rate was flexed, themodel acts as if there is no carbon limiting constraint exist and the model prefers sending most of the materialto the remanufacturing centers (see Fig. 4). Therefore, the total increase in total carbon emissions was due tothe high operating carbon emissions at remanufacturing centers.
6.2. Model 2: Sensitivity analysis
In the sensitivity analysis for the Model 2, we are interested in how the carbon cap and carbon creditinfluences decision-making in a reverse logistics network design and three scenarios with incremental carbon capand carbon credit rate (i.e., 10%, 20%, and 30%) are investigated.

S518 S. CINAR
Figure 5. Model 2-Sensitivity analysis results for increasing cap rate.
Figure 6. Model 2-Sensitivity analysis results for increasing credit amount.
6.2.1. Increasing carbon cap rate
In the first sensitivity analysis for the Model 2, the cap rate (i.e., 10%, 20%, and 30%) was decreased in theinterval of 10 and the other parameters remain the same. The sensitivity analysis showed (see Fig. 5) that oncewe decreased the cap rates at a certain level, as model tried to optimize both cost and the carbon emissions, themodel the preferred to send more flow to recycling centers, which has lower operating cost and lower emissionrates. When carbon cap is relatively high, the model was mostly sending most of the material to remanufacturingcenters. When the carbon cap was sufficiently low, the model started sending most of the material to recyclingcenters, as the model finds it advantageous to adjust its operations and emit less carbon.
6.2.2. Increasing carbon credit rate
In the second sensitivity analysis for the Model 2, the carbon credit rate (i.e., 10%, 20%, and 30%) wasincreased in the interval of 10 and the other parameters remain the same. Sensitivity analysis showed (seeFig. 6) that increasing carbon credit rate, the total carbon emissions decreases by 2% for the 10% and a 20%increase, respectively and for the 30% increase, the increase is only 0.1%. This means that increasing carboncredit rate may not be enough by itself. Therefore, along with carbon credit rate, increasing or decreasing ofcarbon cap rate may be effective to reach the minimum cost and minimum emission for the system.

SUSTAINABLE REVERSE LOGISTIC NETWORK DESIGN S519
Comparing the results of these different scenarios show that this current reverse logistics network fits allscenarios quite well, with the potential to be adjusted to fit the strategic change of recycling and remanufacturingoptions to optimize the total network cost and total carbon emissions. It was observed that emissions can bedirectly controlled by varying the carbon cap rate and carbon price. Therefore, the resulting emissions can becontrolled by adjusting these parameters to reach the optimum cost and emission values for the reverse logisticnetwork. Applying different carbon cap and carbon credit rates as well as different recycling and remanufacturingrates will provides guidance in decision making by quantifying the difference, in terms of total network cost andtotal carbon emissions of reverse logistics of WTs.
7. Conclusions and further research
In recent years, reverse logistics has been increasingly focused in order to capture the remaining values fromused products through recycling and remanufacturing. A significant number of previous studies have focusedon both theoretical development and mathematical modeling of reverse logistics problems. This paper haspresented a mathematical model includes two objectives (1) minimization of overall reverse logistics costs, and(2) minimization of carbon emissions of the transportation and processing of used products. To the best of ourknowledge, this paper is the first to study the RLN designed for EOL WT considering environmental factors(i.e, carbon cap and carbon credit rates). Therefore, the most significant contribution of this study is to takeinto account of environmental factors in order to improve both economic and environmental sustainability ofreverse logistics in the field of WT industry. The proposed model will help the decision maker to choose the mostsuitable disposal method with the remanufacturing and recycling alternatives by considering the environmentalimpact of each disposal alternative. Together with a baseline run of the current situation, various scenarios aremodeled. The results of this study show that due to the high operating emission rate at remanufacturing center,sending most WTs to remanufacturing centers has more environmental effect than sending them to recyclingcenters. In addition, it was shown that transportation emissions depend on the amount of flow that has been sentto the recycling or remanufacturing center. Two major carbon control policies are involved in this study, carboncap and carbon credit scheme. The carbon cap approach has a fixed number of annual allowances allocated tothe participants as a cap. The carbon credit approach is allowing participants to sell their surplus allowancesfor a profit. To identify potential business reactions or behavior with government carbon control policies, theanalysis is performed with different carbon credit rates as sensitivity analysis through the optimization model.For carbon cap policy, different carbon limits are used in the analysis. The analysis with the optimization modeluses different rates of carbon credit so that the sensitivity of the reverse logistic network performance of thecarbon policy can be reserved.
In summary, the computer results and analysis yielded the following conclusions:
(i) The rate of carbon cap and carbon credit is clearly an important factor in selecting different disposal optionsfor EOL WTs. The results shows (demonstrate that) low emission cap leads to higher total emissions limit.With carbon credit increasing in the amount of emissions that exceed the cap, the system is penalized fordoing so, with penalties. Companies are also rewarded for emitting less than their cap by receiving paymentsincreasing in the difference between their cap and their actual emissions.
(ii) It was determined that besides operating emissions, transportation emissions plays important role on totalcarbon emissions.
As the price of carbon emissions is affected by market dynamics and the total amount of carbon that can bebought and sold is limited by the sum of the cap imposed by the government, these factors can be also analyzedto see the difference market conditions. As such, in order to extend the current MILP formulation, the followingadditions to the model have been proposed for future work:
– It would be useful to carry out empirical work that can be used to validate or enrich the results from theanalytical models. For example, there is already carbon emission control legislation that has been in place invarious countries, such as those in the EU, for several years now. It might be possible to further document

S520 S. CINAR
the impact this legislation has had on the operations of various firms in those countries and on emissionlevels and carbon prices. In particular, it would be useful to identify the types of operational adjustmentsthat firms have made in response to climate control legislation and the impact these adjustments have hadon emissions and cost. It would also be of interest to compare how differences in legislation from country tocountry (e.g., those that have adopted a carbon tax versus those with a cap-and-trade system) have affecteddifferently operational decisions made in those countries.
– While our approach with the available information provided good solutions that certainly, improve decision-making to accommodate uncertainties in data, either a stochastic MILP model or a Stochastic DynamicProgramming model could be developed for current problem.
– Our approach takes into consideration environmental factors as to evaluate dynamic situations. Instead,proposed model can be modified as a multi-objective problem to trade-off between cost and environmentalobjective. In addition, there can be interest to social effects into the objective function.
Real-world reverse logistic network design for WTs are typically more complicated than the hypothetical testcase considered in this paper. During the decision-making process, technical, economic and legal aspect of eachoption should be considered. With respect to the legal aspect in terms of Cap-and-trade policy, there are severalcountry-specific uncertainties such as subsidy schemes, legal requirements, future demand for wind energy, windenergy prices, etc., that were not taken into account by the model presented here and can be considered asmanagerial implications. Due to impact of these uncertainties, it is necessary for companies to restructure theirsupply chains in terms of strategic and operational decisions to meet the targeted emissions.
It can be concluded that the trade-off between system operating costs and environmental impacts of reverselogistics activities, and it has also provided decision makers with deep managerial insights of the interactionsamong different parameters in the reverse logistics network design.
References
[1] B.A. Alkhayyal and S.M. Gupta, The impact of carbon emissions policies on reverse supply chain network design. Dogus
Universitesi Dergisi 19 (2018) 99–111.
[2] S.H. Anvar, A. Sadegheih and M.A.V. Zad, Carbon emission management for greening supply chain at the operation level.Environ. Eng. Manage. J. (EEMJ) 17 (2018) 1337–1347.
[3] A. Arvesen and E. Hertwich, Assessing the life cycle environmental impacts of wind power: a review of present knowledge andresearch needs. Renew. Sustainable Energy Rev. 16 (2012) 5994–6006. Assessing the life cycle environmental impacts of windpower: A review of present knowledge and research needs.
[4] AU, Waste Management of End-of-service Wind Turbines. Available from: https://projekter.aau.dk/projekter/files/213319772/Waste_management_of_end_of_service_wind_turbines.pdf (2015) [cited March 15, 2016].
[5] S. Benjaafar, Y. Li and M. Daskin, Carbon footprint and the management of supply chains: insights from simple models. IEEETrans. Automot. Sci. Eng. 10 (2013) 99–116.
[6] J. Bloemhof-Ruwaarda, A. Chaaba and X. Binga, Global reverse supply chain redesign for household plastic waste under theemission trading scheme. J. Cleaner Prod. 103 (2015) 28–39.
[7] E. Bottani and G. Casella, Minimization of the environmental emissions of closed-loop supply chains: A case study of returnabletransport assets management, Sustainability 10 (2018) 1–20.
[8] X. Chen and X. Wang, Effects of carbon emission reduction policies on transportation mode selections with stochastic demand.Transp. Res. Part E: Logistics Transp. Rev. 90 (2016) 196–205.
[9] A. Choudhary, S. Sarkar, S. Settur and M. Tiwa, A carbon market sensitive optimization model for integrated forward–reverselogistics. Int. J. Prod. Econ. 164 (2015) 433–444.
[10] S. Cinar and M. Yildirim, Reverse logistic network design for end-of-life wind turbines. In: Optimization and Dynamics withTheir Applications, edited by M. A icinde. Springer, Singapore. (2017).
[11] W.S. de Oliveira and A. Fernandes, Cost analysis of material composition of the wind turbine blades for Wobben Wind-power/ENERCON GmbH Model E-82. Cyber J.: Multi. J. Sci. Technol. J. Select. Areas Renew. Energy (JRSE) (2012) 1–7.
[12] A. Diabat, and M. Al-Salem, An integrated supply chain problem with environmental considerations. In: Advances in Sustain-able Manufacturing. Springer, Berlin, Heidelberg (2015) 330–338.
[13] S. Du, L. Hu and M. Song, Production optimization considering environmental performance and preference in the cap-and-tradesystem. J. Cleaner Prod. 112 (2016) 1600–1607.
[14] ECTA, Guidelines for Measuring and Managing CO2 Emission From Freight Transport Operations. Available from:https://www.ecta.com/resources/Documents/Best%20Practices%20Guidelines/guideline_for_measuring_and_managing_co2.pdf (2011) [cited March 12, 2018].
SUSTAINABLE REVERSE LOGISTIC NETWORK DESIGN S521
[15] B. Eleonora and G. Casella, Minimization of the environmental emissions of closed-loop supply chains: a case study of returnabletransport assets management. Sustainability 10 (2018) 329.
[16] X. Fang, Y. Du and Y. Qiu, Reducing carbon emissions in a closed-loop production routing problem with simultaneous pickupsand deliveries under carbon cap-and-trade. Sustainability 9 (2017) 2198.
[17] R. Geyer and T. Jackson, Supply loops and their constraints: the industrial ecology of recycling and reuse. California Manage.Rev. 46 (2004) 55–73.
[18] C. Ghenai, Life Cycle Analysis of Wind Turbine. Ocean and Mechanical Engineering Department, Florida Atlantic University.Available from: http://cdn.intechopen.com/pdfs/29930.pdf (2012) [cited April 24, 2018].
[19] A. Ghosh, S. Sarmah and J. Jha, Collaborative model for a two-echelon supply chain with uncertain demand under carbontax policy. Sadhana 43 (2018) 144.
[20] Goldstandard, Available from: https://www.goldstandard.org/blog-item/carbon-pricing-what-carbon-credit-worth(2018).
[21] K. Haapala and P. Prempreeda, Comparative life cycle assessment of 2.0 MW wind turbines. Int. J. Sustainable Manuf. 3(2014) 170–185.
[22] Helpsavenature, Available from: https://helpsavenature.com/carbon-credits-price (2018). [cited May 14, 2017].
[23] W. Hulshorst, Repowering and Used Wind Turbines. Leonardo Energy. Available from: http://www.leonardo-energy.org/sites/leonardo-energy/files/root/pdf/2008/repowering-wind.pdf (2008) [cited June 20, 2016].
[24] J. Humberto Ablanedo-Rosas, P. Fu and Y. Peng, A multiperiod supply chain network design considering carbon emissions.Math. Prob. Eng. 2016 (2016) 1–11.
[25] M. Jaber, C. Glock and A. El Saadany, Supply chain coordination with emissions reduction incentives. Int. J. Prod. Res. 51(2013) 69–82.
[26] B.-R. Jacqueline, A. Chaa and X. Bing, Global reverse supply chain redesign for household plastic waste under the emissiontrading scheme. J. Cleaner Prod. 103 (2015) 28–39.
[27] W. Jiang and X. Chen, Optimal strategies for manufacturer with strategic customer behavior under carbon emissions-sensitiverandom demand. Ind. Manage. Data Syst. 116 (2016) 759–776.
[28] H. Krikke, A. van Harten and P. Schuur, Business case Oce: reverse logistics network re-design for copiers. OR Spektrum 21(1999) 381–409.
[29] Longitude Store.com, The Haversine Formula. Available from: http://www.longitudestore.com/haversine-formula.html(2014) [cited June 10, 2018].
[30] Z. Luo, X. Chen and X. Wang, The role of co-opetition in low carbon manufacturing. Eur. J. Opera. Res. 253 (2016) 392–403.
[31] A. Partridge, Full Circle: Reverse Logistics Keeps Products Green to the End. Available from: https://www.inboundlogistics.com/cms/article/full-circle-reverse-logistics-keeps-products-green-to-the-end/ (2011) [cited September 17, 2018].
[32] W. Post, Energy from wind turbines actually less than estimated? The Energy Collective. Available from: http://www.theenergycollective.com/willem-post/169521/wind-turbine-energy-capacity-less-estimated (2013) [cited September11, 2018].
[33] A. Purohit, R. Shankar and P. Kumar, Non-stationary stochastic inventory lot-sizing with emission and service level constraintsin a carbon cap-and-trade system. J. Cleaner Prod. 113 (2016) 654–661.
[34] Renew Energy Maintenance, Available from: http://www.renewenergy.com/ (2012) [cited March 17, 2016].
[35] Repowering Solutions, Remanufactured wind turbines – New opportunities for the wind industry. Available from: http://www.repoweringsolutions.com/english/sales_brochure/Brochure_refurbished_wind_turbines.pdf (2011) [cited March13, 2017].
[36] A. Rezaee, F. Dehghanian and B. Fahimnia, Green supply chain network design with stochastic demand and carbon price.Ann. Oper. Res. 252 (2017) 463–485.
[37] Sandia National Laboratories, Cost study for large wind turbine blades: WindPACT blade system design studies. Sand Report.Available from: http://windpower.sandia.gov/other/031428.pdf (2003) [cited March 17, 2017].
[38] C. Rydh, M. Jonsson and P. Lindahl, Replacement of Old Wind Turbines Assessed From Energy, Environmental and EconomicPerspectives. Available from: http://citeseerx.ist.psu.edu/viewdoc/download?doi=10.1.1.524.8291andrep=rep1andtype=pdf (2004) [cited September 15, 2018].
[39] SEA, Carbon Trading-Literature Overview. Available from: http://www.seo.nl/uploads/media/2010-65__Carbon_Trading.pdf (2010) [cited July 17, 2018].
[40] SEO, Carbon Trading- Literature Review. Available from: http://www.seo.nl/uploads/media/2010-65__Carbon_Trading.pdf(2010) [cited June 10, 2018].
[41] S. Skrainka, Analysis of the environmental impact on remanufacturing wind turbines. Master’s thesis, Rochester Institute ofTechnology (2012).
[42] E. Smoucha, K. Fitzpatrick, S. Buckingham and O. Knox, Life cycle analysis of the embodied carbon emissions from 14 windturbines with rated powers between 50 Kw and 3.4 Mw. J. Fundam. Renew. Energy Appl. 6 (2016) 211.
[43] Z. Xu, A. Elomri, S. Pokharel and Q. Zhang, Global reverse supply chain design for solid waste recycling under uncertaintiesand carbon emission constraint. Waste Manage. 64 (2017) 358–370.
[44] H. Yu and W. Solvang, A general reverse logistics network design model for product reuse and recycling with environmentalconsiderations. Int. J. Adv. Manuf. Technol. 87 (2016) 2693–2711.
[45] B. Zhu and Y. Wei, Carbon price forecasting with a novel hybrid ARIMA and least squares support vector machines method-ology. Omega 41 (2013) 517–524.