sustainable sroi return on investment - otsego - denver... · cacs conversion factor ... other...
TRANSCRIPT

A Triple Bottom Line Decision Making Framework
Sustainability Round-Table, Denver
October 12th, 2011
Name: Eric Bill, M. Econ, MBA
Title: Senior Economist, HDR Decision Economics
SUSTAINABLE RETURN ON INVESTMENT SROI

Contents
1. Introduce Sustainable Return on Investment (SROI)
2. Provide Examples of Recent SROI Projects
3. Explain SROI Methodology
4. Examples of SROI Results/Outputs
2 2

3

Traditional Business Case Analysis
4
Traditional models often fall short:
Only consider cash impacts
Do not account for uncertainty
Lack transparency
Life-Cycle Cost Analysis involves the analysis of the costs of a system or a component over its entire life span
Financial Analysis involves evaluation of cash flow impacts to determine investment suitability

What is SROI? Triple Bottom Line Decision Making Framework
5
It’s best practice in Cost-Benefit Analysis and Financial Analysis over a project’s entire life-cycle, augmented by:
Accounting for uncertainty using state-of-the-art risk analysis techniques
Engaging stakeholders directly to generate consensus and transparency
Reduced Transport Air Emissions
Increased Transportation
Safety
Reduced O&M Costs
Transport Option Value
Transportation Time Savings /
Reliability
Higher Density / Higher Efficiency
Transportation Cost Savings
Economic Development
Benefits
Reduced Stormwater
Runoff
Public Expenditures

SROI: Origins
Elements of the SROI process have been used to evaluate the monetary value of sustainability programs and
projects valued at over $10B
6

“…to establish an integrated strategy towards sustainability in the Federal Government and to make reduction of greenhouse gas emissions a priority…agencies shall prioritize actions based on a full accounting of both economic and social benefits and costs”
Executive Order 13514
Sustainability: A Priority at the Federal Level
Federal Leadership In Environmental, Energy, and Economic Performance
7

Transportation Infrastructure Finance and Innovation Act (TIFIA)
Application: “emphasis on projects that minimize lifecycle costs and use environmentally sustainable practices and materials. For example, describe reductions in pollution (e.g., air, water,
noise, etc.) that would result from the project”
US Government Accountability Office (GAO)
“Surface Freight Transportation” – Jan 2011 Report
Summarizes efforts to do full cost accounting for freight modes: identifying and quantifying all “external costs”….
Assistant Secretary of the Treasury: National Infrastructure Bank will “improve the efficacy of our infrastructure investment by having a merit-based selection process”
Sustainability: Additional Priorities
8

SROI adds to traditional financial analysis the monetized value of non-cash benefits and externalities
9
The Triple Bottom Line Framework
Project’s
Cash
Impacts
Revenues /
Operational
Savings
Capital plus
O & M
Financial
Return
Financial &
Internal
SROI
Internal
Non-Cash
Benefits
Employee
Health &
Safety
Public
Acceptance
Value of
Time
External
Costs &
Benefits
Green
House
Gases
Criteria Air
Contaminant
Water
Quality
Public
Health &
Safety
Odor &
NoiseOtherReliability Regulatory Other

10
SROI Flow Diagram
Change in
Ridership
Capacity
Expansion
Modernization /
Enhancements
Communication /
Security
Preventative
Maintenance
PROJECT
TYPES
Access
Frequency of
Service
Vehicle Speed
Safety and
Comfort
BENEFITS
Time Savings
Out-of-pocket Cost Savings
Safety
User
Benefits
Non-user
Benefits
Congestion relief
Reduced Emissions
Reduced System Costs
Reduced Public Costs
Economic Development
Option Value
BENEFITS
SERVICE
ATTRIBUTES

From Both a Financial & SROI Perspective
Net Present Value (NPV)
Discounted Payback Period
(DPP)
Internal Rate of Return (IRR)
Benefit to Cost Ratio (BCR)
Return On Investment
(ROI)
11
Decision Metrics

Examples of Recent SROI Projects
Client Project
Department of Defense SROI analysis of the Fort Belvoir Community Hospital, USAG Humphreys in Korea , Fort Bliss in El Paso TX, etc.
BNSF, CSX & UP Railroads Proved the public benefit of dozens of new infrastructure projects resulting in over $700M in State & Federal grants
City and County of Honolulu SROI analysis of the merits of the local Waste-to-Energy plant as compared to alternative uses of the waste
Boston Redevelopment Authority
The city of Boston used SROI to analyze its portfolio of ARRA funded projects
Chicago Area Waterway System
Using SROI to help determine the most sustainable form of barrier between the Great Lakes and the Mississippi
Denver Metro Wastewater Reclamation District
Using SROI to make design & construction decisions on Denver’s proposed new wastewater treatment facility
Johns Hopkins University Provided SROI analysis of JHU’s Campus Sustainability Initiative project in order to secure LEED certification
Department of Energy SROI analysis of energy and water reduction initiatives at Argonne National Laboratory Energy Sciences Building
12

HDR Decision Economics and Transit Investment - Federal Agencies
Transit Benefits for Strategic Corridors, FTA
• Congestion management study of several corridors. Developed a model to measure the performance of transit in several cities, including: Washington DC, Portland, St. Louis, Sacramento, Dallas and Chicago.
Economic Development Benefits of Transit, FTA
• Applied hedonic land value methods to measure the direct and indirect benefits associated with doing business in transit accessible centers. Measured impact of mass transit on commercial property value.
Performed Analysis of Cost Escalation, FTA
• Analyses were associated with six FTA New Starts projects based on individual cost components.
Transit Investments Cost Benefit Analysis Tool, Transport Canada
• Conducted an economic study to establish a cost-benefit framework for the evaluation of various types of transit investments.
13

HDR Decision Economics and Transit Investment – State and Local Agencies
Benefits of Transit for WISDOT, PennDOT, VADRPT, MIDOT, SD DOT, SORTA (Cincinnati), MCTS (Milwaukee), GRTC (Richmond), Valley Metro (Roanoke)
• Conducted studies to identify the social and economic benefits of public transportation services to the main economic sectors in each State.
Transit Investments Cost Benefit Analysis Tool, VADRPT.
• Conducted an economic study to establish a cost-benefit framework for the evaluation of various types of transit investments.
Financial Plan for New Starts Projects
• Assisted in preparation of Financial Plans for New Starts projects in Cincinnati, Columbus, Austin, and Portland.
Paratransit Forecast for NYMTA, WMATA, SEPTA, OC Transpo, Access Services, RTA, King County Department of Metropolitan Services.
• Econometric forecast of demand for, and productivity of, paratransit services.
Conducted Risk Assessment for Transit Investments, Various Cities
• Projects located in Phoenix, Portland, Seattle, New York, and Boston 14

15
Thomas Menino Four-term Mayor of the City of Boston
“Public leaders need to understand the triple bottom line of the policy and programmatic choices before them. The ability to assign
monetary values to the full costs and benefits associated with sustainable initiatives will
unlock the door to additional public investment. Now, mayors can actually measure
and articulate the monetary value of green.”

SROI Methodology
“SROI reveals the hidden value in
projects.” David Lewis, PhD
Former Principal Economist at the US Congressional Budget Office
Author “Policy and Planning as a Public Choice: Mass Transit in the United States”
16
A Four Step Process

CostsBenefits
SROI
Discount Rate%
Social Cost of
CACs Production
$ / Year
Social Cost of
GHGs Production
$ / Year
Safety Costs
$ / Year
Net GHGs Impacts
Tons / Year
GHGs
Conversion Factor
Tons / MWh
CACs
Conversion Factor
Tons / MWh or MmBTU
Increased GHG’s from
Electricity Consumption
Tons / Year
Increased CAC’s from
Electricity Consumption
Tons / Year
Net CACs Impacts
Tons / Year
Social Cost of GHGs$ / Ton
Social Cost of CACs$ / Ton
Increased Electricity
ConsumptionMWh / Year
Potential Cost of
Safety from
Operations$ / Year
Reduced GHG’s from
Avoided Petroleum Diesel
Consumption
Tons / Year
GHGs: Petroleum
Diesel
Conversion Factor
Tons / Diesel Gallons
Reduced CAC’s from
Avoided Petroleum Diesel
Consumption
Tons / Year
CACs: Petroleum
Diesel Conversion
Factor
Tons / Diesel Gallons
GHG’s from Bio-Diesel
Consumption
Tons / Year
Avoided Petroleum
Diesel Consumption
(Adjusted for Biodiesel
Use)Gallons / Year
CAC’s from Bio-Diesel
Consumption
Tons / Year
Net GHGs Impacts
Tons / Year
Net CACs Impacts
Tons / YearSocial Cost of GHGs
$ / Ton
Social Cost of CACs$ / Ton
From Alt 3B FROI From Alt 3B FROI
Total Cost of O&M
$ / Year
Incremental Cost
of Capital
$
Benefit of Proper
FOG Management
$ / Year
Revenues
$ / Year
Benefit of GHGs
Decrease
$ / Year
Benefit of CACs
Decrease
$ / Year
Accident Cost per
Truck Mile$ / Truck mile
Safety Benefits
(Reduced Mileage)
$ / Year
Safety Benefits
$ / Year
From Alt 3B FROI From Alt 3B FROI
6
7
Decreased Hauling
Truck MilesMiles / Year
11 12
GHGs: Petroleum
Diesel
Conversion Factor
Tons / Diesel Gallons
CACs: Petroleum
Diesel Conversion
Factor
Tons / Diesel Gallons
11 12
13 14
13 14
Average Annual
MileageMiles / Year
Reduction in Annual
Mileage%
Avoided Petroleum
Diesel ConsumptionGallons / Year
8 9
Mean Truck Fuel
EfficiencyMiles / Gallon
10
17 18
28
32
33
SROI Methodology – Step 1 S&L depicts variables and cause/effect relationships Develop Structure and Logic Diagrams
Grease to Biodiesel Blending Facility: City of Tempe, AZ
Social Benefit of Reduced Accidents
Social Benefit of Reduced
Green House Gases

SROI Methodology – Step 2
18
Data
Sources
• Over 8,000 Engineers, Architects, Scientists & Economists
• Meta-analysis of third party research & data
• Financial & insurance markets
• Contingent valuation i.e. willingness to pay surveys
• Bayesian analysis/expert opinion
Quantifying Inputs – Sources of Data and Evidence

SROI Methodology – Step 2
19
Quantifying Inputs – Values & Distributions

SROI Methodology – Step 3
20
Sample Participants
Risk Analysis Process Session
Client: Project team Technical specialists Financial experts
HDR: Facilitator Economists Technical specialists
Outside Experts: Costing experts Energy modelers Other consulting firms Public agencies & officials

SROI Methodology – Step 4 Run the Model and Produce Results
21

22
Examples of SROI Results Ft Belvoir Hospital, VA – US Army
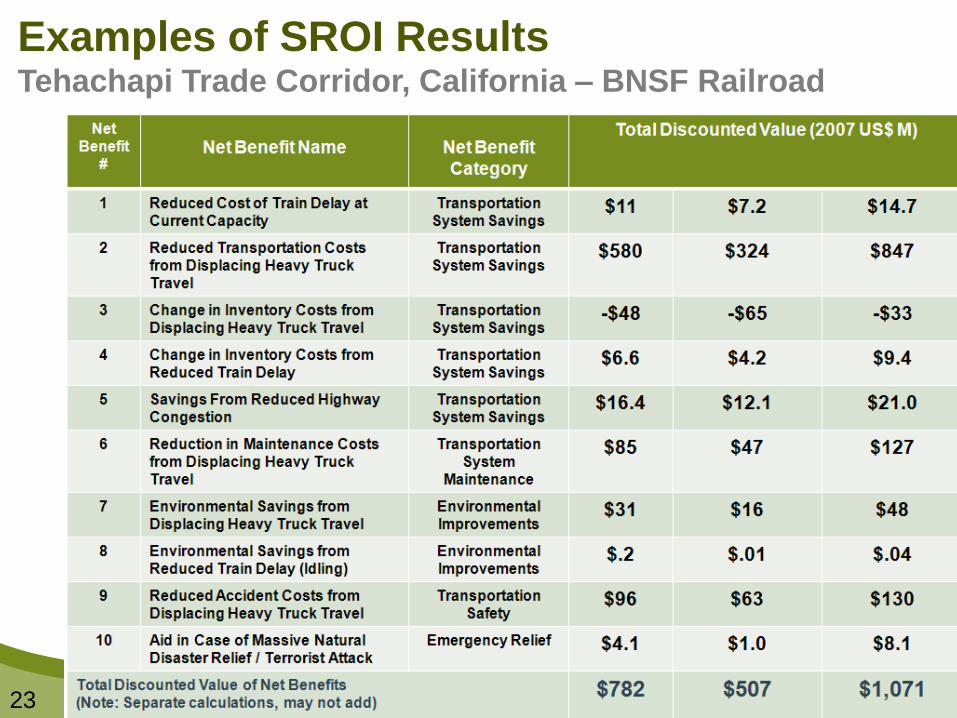
Examples of SROI Results Tehachapi Trade Corridor, California – BNSF Railroad
23

Sustainability S-Curve Diagram
24

Examples of SROI Results Campus Sustainability - John Hopkins University, Baltimore
Internal
Impacts
Externalities
25

0%
10%
20%
30%
40%
50%
60%
70%
80%
90%
100%
0.00 0.50 1.00 1.50 2.00 2.50
Pro
ba
bil
ity
of
Exce
ed
ing
Benefit-Cost Ratio
Mill Avenue Alignment Apache Alignment
Valley Metro, AZ: Tempe Street Car Alignment
Analysis
Project Characteristics
• Cost-benefit analysis for a streetcar project aimed to spur economic redevelopment activity in downtown Tempe
• Estimated life-cycle costs and benefits of each alignment option
• Alignment chosen has potential benefits of $181.1M and $45.3 NPV
• Over 80% of benefits are derived from economic development
Comparison of Net Benefits
26

NYCDOT: Fordham Bus Transit Plaza
Reconstruction
Project Characteristics
• Improvements to bus facility
• Cost-benefit analysis of feasibility and economic development
• Estimated the impacts of the planned improvements on accident rates, based on Federal Highway Administration data and guidelines
• Potential $77.5M in benefits
• NPV-TIGER grant awarded
Distribution of Benefits Long-Term Outcomes
Benefit Categories NPV
Economic Competitiveness
Travel Time Savings $12.7
Vehicle Operating Cost Savings
$0.3
Livability Low Income Mobility & Budgetary Savings to Low Income Households
$5.8
Environmental Sustainability
Reductions in Air Emissions
$0.02
Safety Accident Reduction $58.7
Total Benefit Estimates $77.5
27

SROI Applications for Master Planning
SROI reveals benefits in:
Community form: compact vs. sprawl
Economic development benefits
Environmental benefits
Modal mix
Congestion management
Cross-sector/social benefits
Reduced Highway Plan
Express Lanes
Blended Light / Commuter Rail
Central Indiana
Transportation Plan
28

Ensuring Success with SROI Project Screening of Alternatives
Desirable
Evaluation Stages
Technically
Feasible Affordable Acceptable
Pro
ject
Op
tio
ns
Engineering
Analyses
Financial
Analysis
Stakeholder
Assessment
Sustainable Return
on Investment
Scope /
Criteria
Best
Option
29

Prioritizing Projects – Hypothetical Example Projects on Project Project Profitability Project Capital Cumulative Project
Radar Screen Name Description IRR Rank Required ($M) Capital ($M) Grouping
Foxtrot Solar Caps 25% 1 58 $ 58 $
Delta Landfill Gas Collection 21% 2 321 $ 379 $
Victor WTE 1 20% 3 72 $ 451 $
Mike Long Haul Rail Option 19% 4 95 $ 546 $
Juliet MRF refurbishment 17% 5 150 $ 696 $
Capital Budget Line Sierra Anaerobic digestion of waste 17% 6 265 $ 961 $
Max Annual Capital $1B Quebec Autoclave 15% 7 250 $ 1,211 $
Lima Waste Park 14% 8 170 $ 1,381 $
Alpha Road haul Option 14% 9 60 $ 1,441 $
Whiskey WTE 2 13% 10 143 $ 1,584 $
November Additional MRF 1 12% 11 86 $ 1,670 $
NPV Break-Even Line
Uniform Standardized Garbage Bins 12% 12 77 $ 1,747 $
Hurdle Rate 7% IRR
Zulu Additional MRF 2 11% 13 99 $ 1,846 $
Golf Landfill 1 10% 14 112 $ 1,958 $
Tango Natural Gas Trucks 9% 15 41 $ 1,999 $
Charlie Solar Panels on HQ 8% 16 250 $ 2,249 $
India Wind Turbines on capped L/F 7% 17 14 $ 2,263 $
Bravo Hybrid Trucks 6% 18 87 $ 2,350 $
X-ray Landfill 2 5% 19 300 $ 2,650 $
Oscar Plasma Gasification 5% 20 12 $ 2,662 $
Hotel Wind Turbine for HQ 2% 21 357 $ 3,019 $
Romeo 3 R’s Education Program 1% 22 37 $ 3,056 $
Projects that
should be
implemented
Good projects
that lack funding
Projects that
aren't worth
pursuing
30

Alternatives Assessment Risk Ranking (Tornado Chart)
31
Decision Support & Risk Management

TIGER – Example Transportation Investments Generating Economic Recovery
• $2 billion awarded on a competitive basis (TIGER I&II)
• $525 million for TIGER III
• Part of ARRA (2009) and Appropriations Act (2010, 2011)
• Required a CBA and estimates of employment and production impacts (livability, safety, economic impacts, sustainability, etc.)
Highways, bridges, roadway (FHWA)
Public transportation including New Starts and Small Starts projects (FTA)
Passenger and freight rail projects (FRA)
Port infrastructure investments (MARAD)
32

3% of Applications 20% of Value ($300M)
TIGER I – 2009
TIGER II – 2010
20% of Value ($114M of $557M)
TIGER – HDR Results
33

34
New Project
Creating BCA Guidelines for US DOT: The Need

35
Decision makers want BCA-based information to enable budgetary decisions that reflect value-for-money comparisons of investment proposals among different modes and different geographic regions (more so, against a specific goal)
DOT CBA: Common Ground Comparison

It’s a proven Cost-Benefit Analysis based approach to
making planning & budgeting decisions
It fully incorporates non-cash benefits and externalities
into the decision making process
It provides a full range of possible outcomes using state-
of-the-art risk analysis techniques
It helps generate consensus by being both interactive and
transparent
It’s an invaluable tool to help organizations secure
funding, generate public support, generate internal
approval, etc.
So Why Use SROI?
36