sustainable tourism networks - texas a&m...
TRANSCRIPT
BEST EN Think Tank X Networking for Sustainable Tourism
237
Sustainable Tourism Networks
Seldjan Timur
Abstract
This study examines the existing pattern of stakeholder relationships representing major partners
of sustainable tourism development. By utilizing a network analysis lens the study also helps us
understand the impact of inter relationships of destination stakeholders on sustainable tourism
development. It is found that local DMOs are the stakeholders with a high centrality position in
destination networks. The positional characteristic of DMOs emphasizes that local tourism
organizations have important decisional roles not only for destination marketing but also
sustainable tourism development.
Introduction
The social network approach views organizations in a society as a system of objects where objects
could be people, groups, or organizations, and these objects are joined by a variety of relationships
(Tichy, Tushman and Fombrun, 1979). Objects could be directly or indirectly linked, not joined or
joined by multiple relationships. Network analysis is concerned with structure and patterning of
these relationships and seeks to identify both their causes and consequences (Tichy et al.,
1979:507).
The purpose of network analysis is to examine relational systems in which actors dwell through the
internal location of a set of nodes linked by a set of relationships and to determine how the nature
of relationship structures impacts behaviors (Lauman et al. 1978). Network analysts examine the
pattern of relationships between members of the relevant network, arguing that their positions in
networks influence their opportunities, constraints, and behaviors (Wasserman and Galaskiewicz,
1994).
The three concepts, which are important in understanding network analysis, are “nodes” (also
called actors), “links”, and “networks”. “Nodes” are entities, persons, organizations, or events that
define the network. In the current study actors are the stakeholders, more specifically potential
sustainable tourism development partners.
“Links” are the relationships between the actors and they can be any type of relationships. Links
may be money transfers among businesses, communication among people or organizations,
BEST EN Think Tank X Networking for Sustainable Tourism
238
exchange of resources, transfer of information, and so on. Links have content (Cobb, 1988). In this
study, joint tourism business contacts are analyzed. The link is having business contacts, and the
content of the link is the joint tourism programs or projects.
“Networks” are the patterns formed from the combination of all the actors and links within the
system. The pattern of network member relationships can be examined by measures such as
density and centrality (Rowley, 1997; Burt, 1980; Galaskiewicz, 1979; Scott, 2000; Krackhardt,
1990). Networks may be “dense” (having many links) or “sparse” (having few links) throughout the
system. Density refers to the number of connections between actors within the network. It is
argued that highly dense networks result in efficient communication and enhanced diffusion of
norms across networks because of many ties between network members (Meyer and Rowan,
1977; Galaskiewicz and Wasserman, 1989).
Another network characteristic is “centrality”. Network centrality refers to an individual actor's
position in the network relative to others. Networks may have one central actor with links from
many actors directed to it, which indicates high network centrality, or a network may have several
groups and no central actor that indicates low network centrality. Centrality tries to capture the
property of actors in terms of links with others (Freeman, 1979). Network centrality refers to power
obtained through the network's structure (Rowley, 1997; Barley et al, 1992). Highly central actors
in the network are those who have important decisional and meditative roles, and who are the key
to understanding the circulation of ideas and decisions to act collectively, particularly when the
individuals are in different organizations (John and Cole 1998). The network literature also
suggests that actors that are more central within a network have more influence (related to
increased legitimacy) than those that are more peripheral. A central position within the network
indicates the amount of power obtained through the structure, and capacity to access information
and other members.
There are various measures of centrality (Freeman, 1979; Scott, 2000; Wasserman and Faust,
1994). Freeman (1979) in his influential study operationalized centrality by “degree”,
“betweenness” and “closeness” measures. “Degree” based centrality is simply the number of other
actors to which the focal actor is tied (Krackhardt, 1990; Freeman, 1979). Degree centrality
measures an actor's involvement in a network by telling how many connections an actor has. It
corresponds to being well connected, that is, how well connected a point is within its local
environment (Scott, 2000). It could be computed for in-degree centrality and out-degree centrality
of the various stakeholders. While centrality measure based on in-degree measures how many ties
an actor receives, out-degree based centrality measures how many ties are made with other
actors. Actors who receive many ties have high in-degree centrality, which may indicate their

BEST EN Think Tank X Networking for Sustainable Tourism
239
importance since many others seek direct ties to them. Actors who make many ties with others
have high out-degree centrality, and they are able to exchange with many others and maybe make
many others aware of their views (Hanneman 2001). “Betweenness” centrality is the extent to
which actors fall between pairs of other actors on the shortest paths connecting them. It measures
the frequency with which an actor falls on the paths between pairs of other actors (Freeman,
1979). “Closeness” centrality defines an actor's ability to access independently all other members
of the network (Freeman, 1979). When the stakeholder is 'close' to all others (high closeness), it is
less dependent on others. Studies have found that the more other organizations are dependent
upon a focal organization for the resource they need, the more likely those organizations are going
to be viewed as influential.
This study uses a network analysis lens to examine structural characteristics of destination
stakeholders and the impact of stakeholder relations on destination’s sustainable tourism
development efforts. The interest of adapting network perspective in this study lies in the
recognition that destination stakeholder environment consists of multiple and interdependent
relations that are likely to influence stakeholder values and consequently sustainable tourism
processes. Employing network analysis can help more fully understand relationships between
destination stakeholders, analyze the characteristics of entire stakeholder structure, and examine
how the pattern of linkages between stakeholders can attain strategic leverage for destinations.
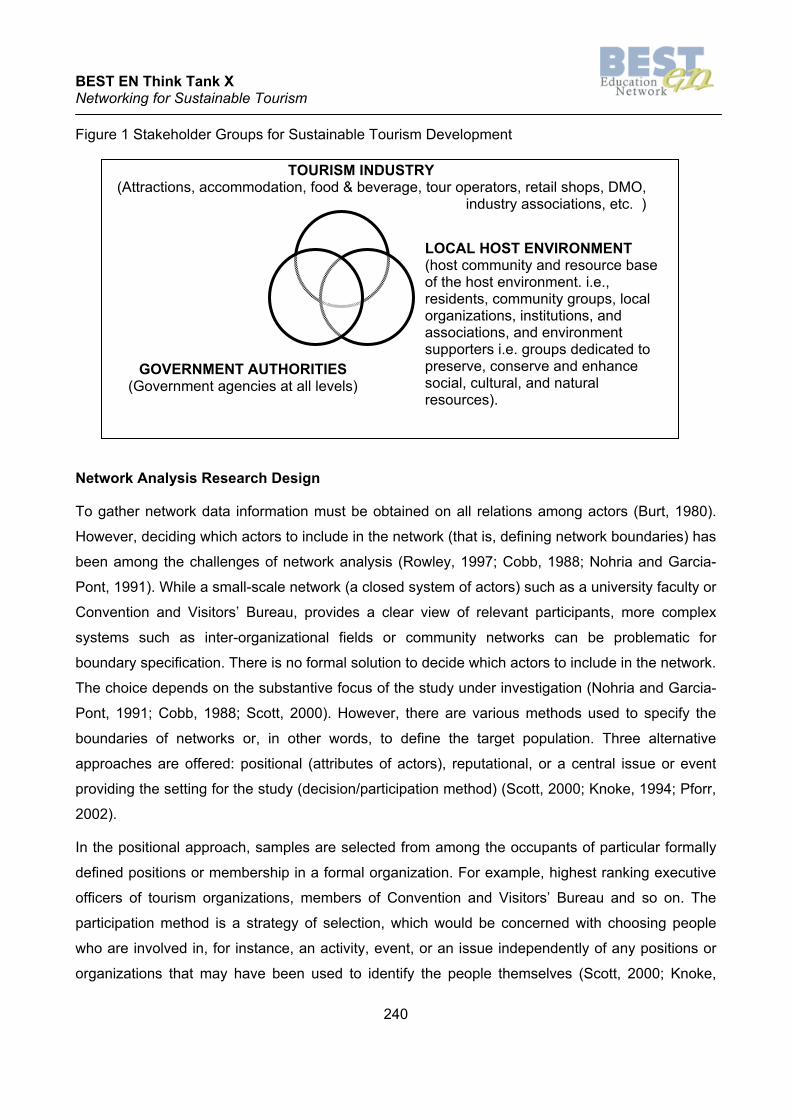
The WTO (1993) defines major partners for sustainable tourism development as the industry,
environment supporters and community/local authority. In this study, the community stakeholder
group is integrated with the environment supporters and this group is named as local host
environment. The local host environment group includes both local community and environment
supporters (groups dedicated to preserve, conserve and enhance social, cultural, and natural
resources). The community/local authorities group is renamed as government agencies and
represents all pertinent government agencies. The main clusters and potential key stakeholders in
each cluster are presented in Figure 1. This framework not only shows three major partners of
sustainable tourism development but also corresponds to the sample groups used in the study.
BEST EN Think Tank X Networking for Sustainable Tourism
240
Figure 1 Stakeholder Groups for Sustainable Tourism Development
Network Analysis Research Design
To gather network data information must be obtained on all relations among actors (Burt, 1980).
However, deciding which actors to include in the network (that is, defining network boundaries) has
been among the challenges of network analysis (Rowley, 1997; Cobb, 1988; Nohria and Garcia-
Pont, 1991). While a small-scale network (a closed system of actors) such as a university faculty or
Convention and Visitors’ Bureau, provides a clear view of relevant participants, more complex
systems such as inter-organizational fields or community networks can be problematic for
boundary specification. There is no formal solution to decide which actors to include in the network.
The choice depends on the substantive focus of the study under investigation (Nohria and Garcia-
Pont, 1991; Cobb, 1988; Scott, 2000). However, there are various methods used to specify the
boundaries of networks or, in other words, to define the target population. Three alternative
approaches are offered: positional (attributes of actors), reputational, or a central issue or event
providing the setting for the study (decision/participation method) (Scott, 2000; Knoke, 1994; Pforr,
2002).
In the positional approach, samples are selected from among the occupants of particular formally
defined positions or membership in a formal organization. For example, highest ranking executive
officers of tourism organizations, members of Convention and Visitors’ Bureau and so on. The
participation method is a strategy of selection, which would be concerned with choosing people
who are involved in, for instance, an activity, event, or an issue independently of any positions or
organizations that may have been used to identify the people themselves (Scott, 2000; Knoke,
TOURISM INDUSTRY (Attractions, accommodation, food & beverage, tour operators, retail shops, DMO,
industry associations, etc. )
LOCAL HOST ENVIRONMENT (host community and resource base of the host environment. i.e., residents, community groups, local organizations, institutions, and associations, and environment supporters i.e. groups dedicated to preserve, conserve and enhance social, cultural, and natural resources).
GOVERNMENT AUTHORITIES
(Government agencies at all levels)
BEST EN Think Tank X Networking for Sustainable Tourism
241
1994). For example, participation in tourism policy making in the Northern Territory of Australia was
used as the basis of actor selection by Pforr (2002).
The reputational approach is usually used where no relevant positions or comprehensive listing
available, or where the knowledge of agents themselves is crucial in determining the boundaries of
the population (Scott, 2000; Knoke, 1994). In the reputational approach, the researcher studies all
or some of those named on a list of nominees produced by knowledgeable informants.
In the present study, the participation and reputational approaches were combined to specify
network boundaries. The participation method identified a potential list of eligible organizations in
tourism destinations from existing sources. To determine the core actors involved in STD, public
documents such as the World Tourism Organization publications, economic development plans for
cities, annual reports of destination management organizations, and newspapers were reviewed.
The reputational approach was also employed. At the initial phase of the study, background
interviews in three sample cities were completed. During this initial study, lists of stakeholders were
developed through a "snowball technique." The initial interviewee list was composed of core
tourism actors. Information from these knowledgeable respondents was collected, and they were
also asked to nominate other stakeholders that either they were in regular contact with or any
others that they perceived to be important and powerful stakeholders for tourism planning,
development and policy formulation purposes. This process continued until no new stakeholder
names were suggested by interviewees (i.e., where a saturation point is reached). The final
stakeholder lists composed for each city included not only core tourism stakeholders but also their
nominees.
Data Collection
Once a network has been identified, network analysis requires collecting data from all members.
But, in some cases it might be necessary to use sample data (Ibarra, 1993; Scott, 2000). For
instance, when research on a large scale is undertaken a particular population of agents could be
involved in a complex system of relations of all types that make up the total network (Scott, 2000).
Three separate tourism networks were chosen for empirical investigation in this study. Data were
gathered from Calgary (Alberta, Canada), Victoria (BC, Canada) and San Francisco (California,
USA). The members of the tourism destination networks in three cities were identified. Three lists,
one for each city, were compiled. Each list included stakeholders from three clusters (Figure 1). It
was clear that it would be almost impossible to achieve a complete data and examine all relations
between destination stakeholders. Presumably, there were a finite number of government

BEST EN Think Tank X Networking for Sustainable Tourism
242
agencies, and a potentially infinite number of organizations and representatives in the tourism
industry and host environment clusters. Examining only the relationships between the tourism
industry members could be quite complicated. Moreover, analyzing one sub-sector of the tourism
industry such as accommodation or food and beverages could be considered quite complicated.
The aim of using a sampling technique in this study was to achieve a representative sample of the
target population from which all existing relationships between the members of the three clusters
could be examined.
A total of 578 questionnaires were mailed to government agents respectively in Calgary, Victoria
and San Francisco. The questionnaires were sent to the stakeholders representing organizations
and entities from tourism industry, government authorities and host environment.
The works of Galaskiewicz (1979), Tichy et al (1979), Cobb (1988), Krackhardt (1990), Ibarra
(1993), and John and Cole (1998) provided the structure of network analysis questions. To
measure existing inter-stakeholder relationships, the tourism contact networks based on joint
tourism projects or programs were selected. This would help describe the interconnectedness of
destination stakeholders.
To examine existing stakeholder relations across tourism contact network, a list of stakeholders
was developed. It was necessary to give a standard list because in a destination context, there are
numerous and various actors, groups, and organizations not only from different sub-sectors of
tourism industry (as product and service suppliers) but also from the public sector (such as
regulators, planners) and other local organizations, associations, and institutions. To help
respondents identify major stakeholders in three clusters (refer to Figure 1) a list was developed.
The classifications used by the World Tourism Organization and major tourism textbooks were
used to prepare a standard list. The alternative was to have a different list named by every
respondent. However, this list could have been unlimited and more time consuming to analyze.
Additionally, for the purposes of the study, identification of exact names of individual stakeholders
or stakeholder groups in contact was less important than their relevant categories, such as
attractions, transportation, or accommodation. Therefore, a standard list was given to respondents
not only to control but also categorize their responses. The standard list was presented to
respondents and they were asked to check off those stakeholders with which their organization
had joint programs or projects (such as joint product development, joint marketing, joint training,
etc.) in the last 12 months.
BEST EN Think Tank X Networking for Sustainable Tourism
243
Findings
One-hundred-eighty-eight surveys were returned. 70 out of 190, 65 out of 195, and 53 out of 193
surveys were returned respectively from Calgary, Victoria, and San Francisco. Fifteen of returned
responses could not be used due to missing data and incomplete responses. After incomplete
cases had been eliminated, the final sample consisted of 70 questionnaires from Calgary, 62
questionnaires from Victoria, and 41 questionnaires from San Francisco. The final sample size
was 173. This indicates a 29.9% response rate.
Their responses were used to construct an adjacency matrix by coding the presence (or absence)
of a formal business contact a matrix where the stakeholders are both rows and columns was
created. A ‘1’ stands for the presence of a formal business contact between stakeholder i and
stakeholder j, and a ‘0’ indicates the lack of relationship. A matrix for each urban destination was
created. Constructed adjacency matrices were entered into UCINET VI, a software package that
allows the computation of various network measures (Borgatti, Everett, and Freeman, 2002).
UCINET VI also allows the ‘collapsing’ of individual stakeholder responses into stakeholder groups.
In each city, responses from various hotels were collapsed into a ‘hotels’ stakeholder group;
responses from various cultural attractions were collapsed into a ‘cultural attractions’ stakeholder
groups; responses from educational, financial, and/or religious institutions were collapsed into an
‘institutions’ stakeholder group and so on.
Network Mapping
Network analysis provides a visual map to illustrate the structural connectivity. In other words, how
actors are related to one another based on the specific criterion under investigation is displayed.
Visual diagrams of these relational patterns are displayed for each city (Figures 2, 3, and 4). The
maps provided a summary of ties in each destination’s tourism contact networks. The maps
showed links among all destination stakeholders in three clusters from a whole network
perspective. The diagrams also display ego-centric links for each stakeholder. What maps did not
explicitly show were the relationships between clusters. However, in order to overcome this
difficulty and help reader identify stakeholders in each cluster, a different symbol (e.g., ‘○’ for
tourism industry, ‘∆’ for host environment, and ‘□’ for government) was used to represent
stakeholders in these clusters.
BEST EN Think Tank X Networking for Sustainable Tourism
244
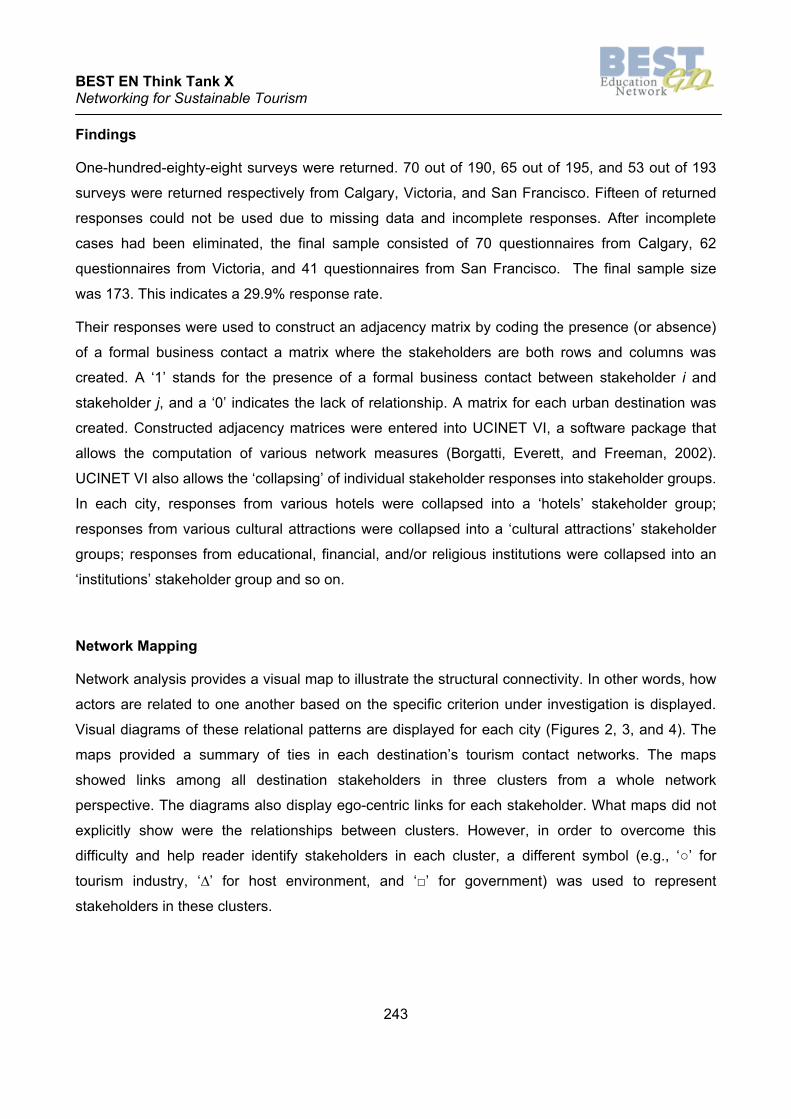
Figure 2 Calgary Network
KEY for Stakeholders : Tourism Industry : Government : Host environment
BEST EN Think Tank X Networking for Sustainable Tourism
245
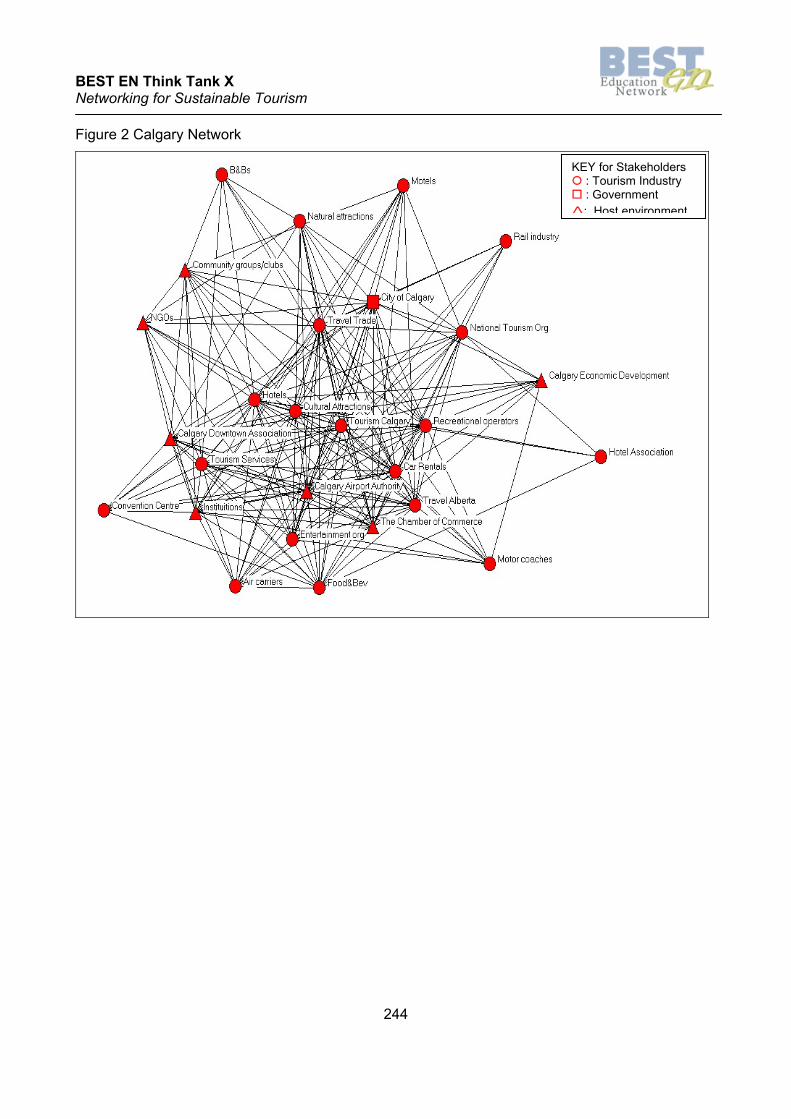
Figure 3: Victoria Network
KEY for Stakeholders : Tourism Industry : Government : Host environment
BEST EN Think Tank X Networking for Sustainable Tourism
246
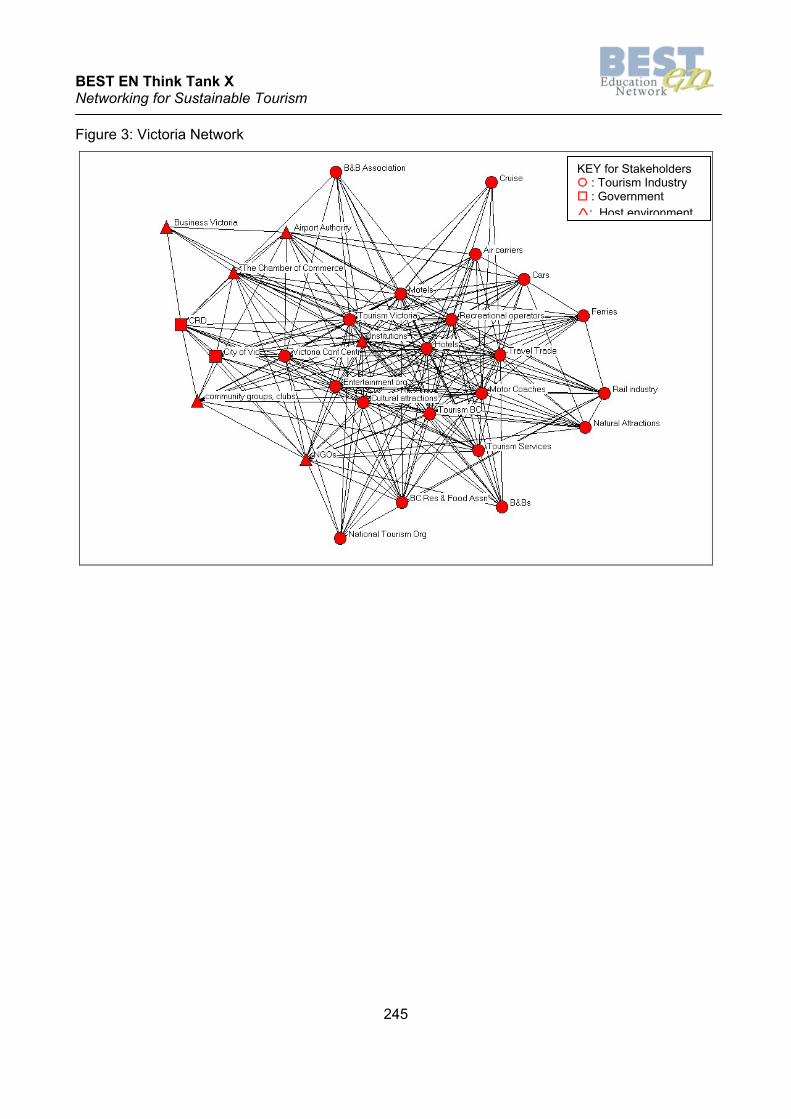
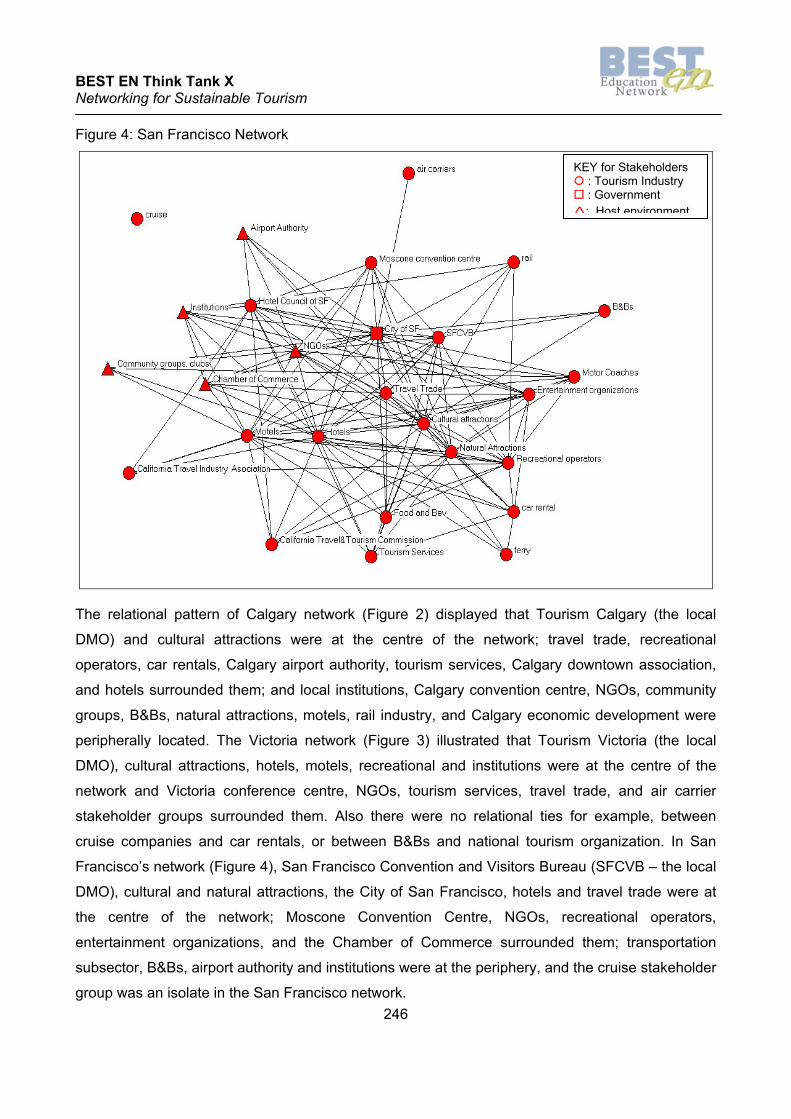
Figure 4: San Francisco Network
The relational pattern of Calgary network (Figure 2) displayed that Tourism Calgary (the local
DMO) and cultural attractions were at the centre of the network; travel trade, recreational
operators, car rentals, Calgary airport authority, tourism services, Calgary downtown association,
and hotels surrounded them; and local institutions, Calgary convention centre, NGOs, community
groups, B&Bs, natural attractions, motels, rail industry, and Calgary economic development were
peripherally located. The Victoria network (Figure 3) illustrated that Tourism Victoria (the local
DMO), cultural attractions, hotels, motels, recreational and institutions were at the centre of the
network and Victoria conference centre, NGOs, tourism services, travel trade, and air carrier
stakeholder groups surrounded them. Also there were no relational ties for example, between
cruise companies and car rentals, or between B&Bs and national tourism organization. In San
Francisco’s network (Figure 4), San Francisco Convention and Visitors Bureau (SFCVB – the local
DMO), cultural and natural attractions, the City of San Francisco, hotels and travel trade were at
the centre of the network; Moscone Convention Centre, NGOs, recreational operators,
entertainment organizations, and the Chamber of Commerce surrounded them; transportation
subsector, B&Bs, airport authority and institutions were at the periphery, and the cruise stakeholder
group was an isolate in the San Francisco network.
KEY for Stakeholders : Tourism Industry : Government : Host environment

BEST EN Think Tank X Networking for Sustainable Tourism
247
The government authorities in Calgary had connections with most of the host environment
stakeholders and some of the tourism industry stakeholders. A similar result was revealed in
Victoria. Though the government authorities have very little joint projects or programs with tourism
industry stakeholders, they had relationships with most of the host environment stakeholders.
When between cluster analysis was applied to the San Francisco network, it was found that San
Francisco government authorities had established joint tourism programs or projects with almost
every stakeholder in the host environment cluster and some relationships with tourism industry
stakeholders. Regarding the relationships between tourism industry and host environment clusters,
it was found that, in Calgary, most of the host environment stakeholders had ties with Tourism
Calgary, and tourism industry stakeholders had ties with Calgary Airport Authority, Calgary
Chamber of Commerce, and community groups or clubs. In Victoria, ties between tourism industry
and host environment cluster existed mainly through two channels; host environment stakeholders
established ties usually with Tourism Victoria, and tourism industry stakeholders generally
partnered with community groups for their joint tourism programs and projects. In San Francisco,
two clusters had ties with each other and it was noticed that tourism industry stakeholders
generally had joint tourism programs or projects with the San Francisco Chamber of Commerce.
The maps display relational patterns or structural connectivity in each city. From a whole network
perspective, the network maps identified different patterns of relationships between destination
stakeholders in each city. These patterns – affected by sampling – are likely to reflect how tourism
functions in each destination.
To more fully understand the networks, individual network member (i.e., ego-network) centrality
measures are computed. Centrality is concerned with the positions of destination stakeholders
within the contact network. Centrality can be measured by various measures. Of researchers who
tried to decide which centrality measure was most meaningful and valid for their research
purposes, some explored the conceptual foundations of centrality measures (Freeman 1979) and
others studied the empirical performance of centrality measures under different research scenarios
(Galaskiewicz, 1991; Costenbader and Valente, 2003). Costenbader and Valente (2003), who
studied how sampling affected the stability of various network centrality measures, found that some
centrality measures were more stable than the others, indicating that these measures would be
more appropriate to compute when respondents were not interviewed or did not respond. They
reported that, "in-degree centrality is relatively stable even at a low sampling level ... and as an
indicator of network position" (Costenbader and Valentele, 2003: 306). They argued that the in-
degree centrality measure was less affected by sampling because although respondents dropped
from the sample were no longer able to indicate their ties, they were still able to receive them.
BEST EN Think Tank X Networking for Sustainable Tourism
248
Therefore, to compute the most meaningful centrality measure for the current study, in-degree
based centrality, which is less affected by sampling, was used.
Based on the in-degree centrality measure, Tourism Calgary and Travel Alberta, Tourism Victoria
and cultural attractions, and San Francisco convention and visitors bureau (SFCVB) were the
stakeholders with a high centrality position in Calgary, Victoria and San Francisco networks,
respectively. Tourism Calgary and Travel Alberta had the highest number of links in Calgary
network. They were partners with 73% of stakeholder groups. In other words, they both had joint
projects or programs with 73% of stakeholders. The hotels stakeholder group was the next most
popular stakeholder group in Calgary. While these were the stakeholders with more ties to others,
B&B and motel stakeholder groups received very few connections from others. Based on
stakeholders’ connections to other stakeholders, B&Bs and motel stakeholder groups could be
interpreted as peripherals in network terms. So, not all industry members were equal.
In Victoria, centrality measures indicate that Tourism Victoria and cultural attractions are the two
stakeholder groups with the highest centrality measure. Sixty-seven percent of respondents chose
Tourism Victoria and cultural attractions (that includes industry stakeholders such as museums,
galleries, historical sites, cultural events and festivals, concerts and theatres) as their business
partners. Cultural attractions are significant tourism business partners because Victoria and
Calgary do not have major private attractions. Tourism BC was the next visible central stakeholder
in Victoria. The analysis also indicated that Capital Regional District (CRD) and Business Victoria
were peripheral stakeholder groups with few joint tourism projects with other stakeholders within
the Victoria contact network.
In San Francisco, the favored position belonged to SFCVB. The results indicated that SFCVB had
connections with 50% of stakeholders. The attractions sector and the City of San Francisco were
also among the destination stakeholders that had high centrality in San Francisco’s network. More
specifically, museums, galleries, architecture and historical sites of the “cultural attractions”
stakeholder group; coastlines, parks and gardens from the “natural attractions” stakeholder group;
and stakeholders such as shopping facilities, performing arts centers, sport complexes and casinos
from the “entertainment group” were significant tourism business partners in San Francisco. Unlike
the other two cities, the City of San Francisco had many ties to other stakeholders in the San
Francisco contact network, indicating its importance as a significant tourism partner. Results also
indicated that the cruise industry was an isolate in this network. In other words, none of the
respondents had joint projects with the cruise industry.
BEST EN Think Tank X Networking for Sustainable Tourism
249
In summary, it was found that in each city DMOs had many ties with other members of the
destination, indicating that DMOs had better access to all others in the destination. Given that most
of the respondents came from the tourism industry, this in part is a function of the sampling.
Conclusion
The existing structural positions of stakeholders representing three diverse clusters of STD in three
cities displayed that the stakeholders located at the center of networks in the three cities were the
DMOs. But, other stakeholders with high centrality were different in each city. However, they were
stakeholders with access to or possession of critical resources. It is argued that since each
destination faces a different set of key stakeholders, the interactions would probably aggregate into
unique patterns of influences in each city. As a result, sustainable destination development will be
as unique as their historical patterns of development, the nature of their industry, and
governmental and institutional culture.
The entity most likely to take active role in sustainable destination development is the local DMO.
The DMOs could be key players in not only marketing and/or management but also planning and
development, and linking planners, investors, developers, residents, local organizations, and the
industry for developing a sustainable policy for their destinations.
The power of DMOs arises not only from holding a high central position within the destination
network, but also from the dependency of stakeholders on DMOs for resources such as expertise,
information, and clientele. DMOs have the most crucial roles in achieving inter-stakeholder
collaboration for developing a shared tourism policy, particularly because the many and diverse
industry actors trust or depend on them. The other critical stakeholders in destination development
were hotels, attractions, and government agents. These critical stakeholders that had
advantageous positions in the structure of destination networks also have important decision-
making roles, and are key to understanding the circulation of ideas and decisions to act
collectively, particularly when the individuals are in different organizations. From this perspective,
the DMOs, hotels and attractions stakeholders can be used to communicate destination planning
and development issues, facilitate collaboration among stakeholders, increase awareness of
network members towards sustainability challenges, and coordinate efforts toward reaching shared
tourism and hospitality industry goals. In each city, all of these influential stakeholders came from
the industry cluster. This could be related to the sampling but at same time highlights the lack of
“bridges” between the clusters. The DMOs, hotels and attractions stakeholders have another major
role to play in between-cluster networking. They must partner with the bridging stakeholders so

BEST EN Think Tank X Networking for Sustainable Tourism
250
that contacts between clusters can be established. Establishing ties with less connected or isolated
stakeholders would help minimize the evident disconnect between clusters and improve legitimacy
for sustainable tourism development. Destinations can no longer ignore various stakeholder
concerns. On the contrary, they are challenged to create a more participative model. According to
network theory, to create an environment in which collective action can be realized, more contacts
have to be established. Thus, there is a need for sustainability networks. The term sustainability
networks is used to indicate the interactions of multiple stakeholders with varying degrees of
interest in sustainable destination development. The interconnectedness of diverse stakeholders
representing governmental bodies, business firms, persons or other entities on sustainability
dimensions can improve the process of sustainable destination development.
References
Barley, S. R., Freeman, J. & Hybels, R.C. (1992). Strategic alliances in commercial biotechnology. In N. Nohria & R. G. Eccles (Eds) Networks and Organizations: Structure, Form, and Action. Harvard Business School, Boston.
Borgatti, S.P., Everett, M.G. & Freeman, L.C.( 2002). Ucinet 6 for Windows. Harvard: Analytic Technologies.
Burt, R. S. (1980). Models of Network Structure. Annual Review of Sociology,.6, 79-141.
Burt, R. S. (1987). Social contagion and innovation: cohesion versus structural equivalence. American Journal of Sociology, 92, 1287-1335.
Cobb, M. (1988). Influence and exchange networks among tourism oriented business in four Michigan communities. Doctoral Dissertation, Michigan State University, East Lansing.
Costenbader, E. & Valente, T.W. (2003). The stability of centrality measures when networks are sampled. Social Networks, 25, 283-307.
Freeman, L.C. (1979). Centrality in social networks: I. Conceptual clarifications. Social Networks, 1, 215-239.
Galaskiewicz, J. (1979). The structure of community organizational networks. Social Forces, 57 (4), 1346-1364.
Galaskiewicz, J. (1991). Estimating point centrality using different network sampling techniques. Social Networks, 13 (4), 347-386.
Galaskiewicz, J. & Wasserman, S. (1989). Mimetic processes within an interorganizational field: An empirical test. Administrative Science Quarterly, 30, 454-479.
Hanneman, R. (2001) Introduction to Social Networks. Online book free on the web at http://www.analytictech.com/networks.pdf
Ibarra, H. (1993). Network centrality, power, and innovation involvement: determinants of technical and administrative roles. Academy of Management Journal, 36, 471-501.
John, P. & Cole, A. (1998). Sociometric mapping techniques and the comparison of policy networks: economic decision making in Leeds and Lille. In D. Marsh (ed.), Comparing Policy Networks. Buckingham: Open University Press.

BEST EN Think Tank X Networking for Sustainable Tourism
251
Knoke, D. (1994). Networks of elite structure and decision making. In S. Wasserman & J. Galaskiewicz (eds), Advances in Network Analysis: Research in the Social and Behavioral Sciences. Thousand Oaks, CA: Sage.
Krackhardt, D. (1990). Assessing the political landscape: structure, cognition and power in organization. Administrative Science Quarterly, 35 (2), 342-369.
Lauman, E.O and Pappi, F. (1973). New directions in the study of elites. American Sociological Review, 38, 212-230.
Lauman, E. Galaskiewicz, J. & Marsden, P. (1978). Community structure as interorganizational linkages. In R. Turner, J. Coleman, and R. Fox (eds.), Annual Reviews of Sociology, 4:455-484. Palo Alto, CA: Annual Reviews.
Meyer, J.W. & Rowan, B. (1977). Institutional organizations: formal structures as myth and ceremony. American Journal of Sociology, 80, 340-363.
Nohria, N. (1992). Is a network perspective useful way of studying organizations? In N. Nohria & R.G. Eccles (Eds), Networks and Organizations: Structure, form, and action. 1-22. Boston: Harvard Business School Press.
Nohria, N. & Garcia-Pont, C. (1991) Global Strategic Linkages and Industry Structure. Strategic Management Journal, 12, 105-124.
Oliver, C. (1991). Strategic responses to institutional processes. Academy of Management Review, 16, 145-179.
Pforr, C. (2002). The “makers and shakers” of tourism policy in the northern territory of Australia: a policy network analysis of actors and their relational constellations. Journal of Hospitality and Tourism Management, 9(2), 134-150.
Rowley, T. J. (1997). Moving beyond dyadic ties: a network theory of stakeholder influences. Academy of Management Review, 22 (4), 887-910.
Rowley, T. J. (1998). Moving beyond dyadic ties: A study of structural influences in stakeholder networks Doctoral dissertation, University of Pittsburgh.
Scott, J. (2000) (2nd edn) . Social Network Analysis: A Handbook. London: Sage.
Selin, S. & Beason, K. (1991). Interorganizational relations in tourism. Annals of Tourism Research, 18, 639-652.
Tichy, N.M., Tushman, M.L., & Fombrun, C. (1979). Social network analysis for organizations. Academy of Management Review, 4 (4), 507-519.
Wasserman, S. & Faust, K. (1994). Social network analysis: methods and applications. New York: Cambridge.
Wasserman, S. & Galaskiewicz, J. (1994). Advances in social network analysis: research in the social and behavioral sciences. Thousand Oaks, CA: Sage.
World Tourism Organization (1993). Sustainable Tourism Development Guide for Local Planners. Spain: WTO publication.