sustainable transport: how to meet local and global ... · how to meet local and global challenges...
TRANSCRIPT

Sustainable Transport: How to Meet
Local and Global Challenges ?
Sergio SanchezThe Clean Air Institute
Guadalajara, MexicoNovember 10, 2008

Contents
• Introduction
• Challenges
• Opportunities
• Summary

The Clean Air Institute
• The Clean Air Initiative for Latin American Cities (CAI-LAC) was launched by the World Bank in 1998.
• In 1996, CAI-LAC was transferred to the Clean Air Institute – a non profit organization.
• Mission: To improve air quality and reduce GHG emissions to protect and improve public health and welfare.

The Latin American and Caribbean Region
• 556 million inhabitants – 175 million in 1950
• 1.3% growth rate in 2006.• Most urbanized region of developing
world• Outlook 2030:
• 175 million people in addition living in urban areas.
• 9 /10 of population living in cities• Triple vehicle fleet• Double energy use (most growth
linked to transport sector

Sustainable Transport Challenges
Transport Services
Economic Growth
Transport Impacts
Environmental, Social and Economic
Impacts

Global Anthropogenic and Transport GHG Emissions
1992: UNFCCC
2005: Kyoto
Protocol
F-gases, 1%
N2O, 8%
CH4, 14%
CO2 def. and decay of biomass,
17%
CO2 other, 3%
CO2 transport
13%
CO2 other comb., 44%
CO2 fossil
fuel use; 57%
GHG Emission Share
Transport Emissions in 2004: 6.6 Gton CO2-eq
Source: IPCC 2007.

The transport sector is the fastest growing GHG source
• Between 1970 and 2004, global GHG emissions from the transport sector increased by 120% globally
• 1990-2002, CO2 emissions doubled in China, Indonesia and South Korea.
• By 2020, soaring increases expected in China (143%), Indonesia (122%), India (91%) and Mexico (71%) compared with current levels (IEA 2006).

Transport Sector: Largest air pollution source in LAC
• Otras zonas metropolitanas de ALC tienen perfiles similares.
Fuente: SMA, Gobierno del Distrito Federal, 2004b

Air Pollution is a common problem for cities all around the LAC region
Air pollution is a serious problem in an increasing number of Latin American
Cities.
Ozone and Respirable Particles are major air pollution issues

Costs of air pollution
• Air pollution costs in LAC: 1-2% of GDP (WB 2007). In China, up to 3.8 of GDP (OCDE).
• Exposure to PM10: 960k premature deaths worldwide in 2000, mainly from cardiopulmonary diseases.
• Premature deaths per million inhabitants linked to PM10 could double to 2030 per million inhabitants.– Loss of more than 25 million years of life
(DALYs) in 2030.
• Premature deaths caused by ozone would quadruple worldwide by 2030.
• Developing countries most affected.• In Latin America, more than 100 million
inhabitants are exposed to air pollution levels exceeding WHO standards.
Fuente: Cifuentes

Motorization• In 2007, a total of 71.9 million
new automobiles were sold worldwide:
• Markets in North America and Japan were stagnant, while those in South America and Asia grew strongly.
Source: "2008 Global Market Data Book",
Automotive News, p. 5

Traffic congestion:Among the worst in the world
Sao Paulo
37 percent increase on registered vehicles since 2003. Record gridlock of 266 km on May 9 2006. Daily average trip: 1 hour, 40 minutes Congestion economic cost: 4.1 billion reais/year.
Source: Sao Paulo Traffic Jams Mean Lost Business, Stress, Helicopters, Bloomberg, July 14, 2008
Mexico City
Rougly 4 million vehicles. Vehicle fleet has doubled in the last 15 years regardless economic
fluctuations. More than 300 thousand vehicles added to circulation each year, only
10% retires. Average speed at peak hour: less than 10 km/hr. Average time trip: 1 - 1.5 hrs.
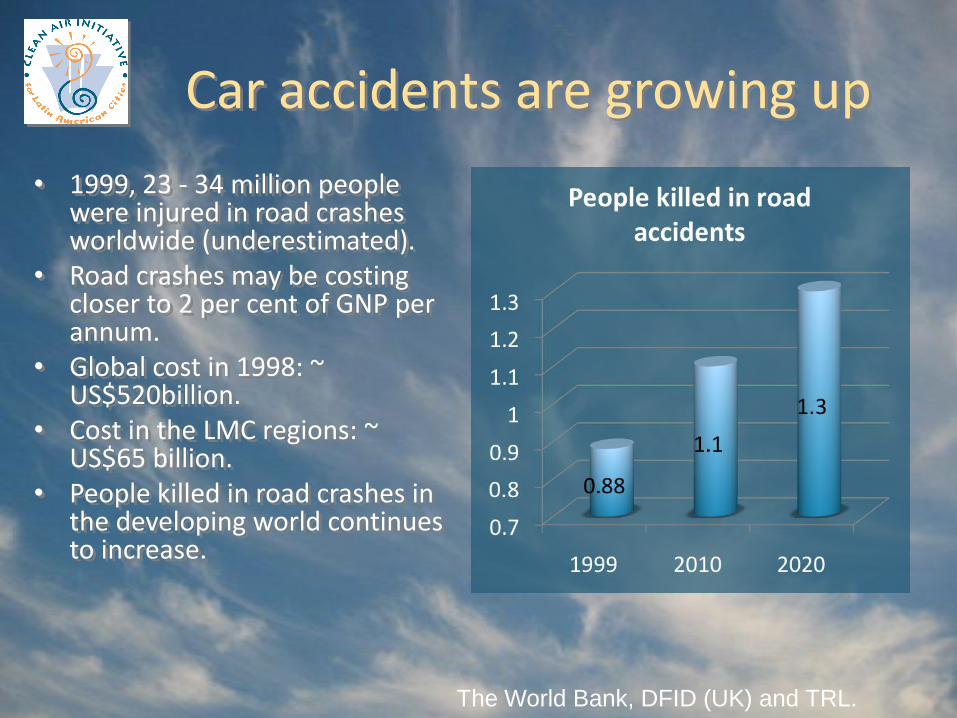
Car accidents are growing up
• 1999, 23 - 34 million people were injured in road crashes worldwide (underestimated).
• Road crashes may be costing closer to 2 per cent of GNP per annum.
• Global cost in 1998: ~ US$520billion.
• Cost in the LMC regions: ~ US$65 billion.
• People killed in road crashes in the developing world continues to increase.
The World Bank, DFID (UK) and TRL.

Source: Composed from various cities data compiled by the World Bank.

Public transport share is diminishing
CityEarlier year
Public transport as a percentage of motorzied trips Last year
Public transport as a percentage of motorzied trips
Bangkok 1970 53 1990 39
Buenos Aires 1993 49 1999 33
Kuala Lumpur 1985 34 1997 19
Mexico City 1984 80 1994 72
Moscow 1990 87 1997 83
Sao Paulo 1977 46 1997 33
Seoul 1970 67 1992 61
Tokyo 1970 65 1990 48
Shanghai 1986 24 1995 15
Warsaw 1987 80 1998 53

The vicious circle of urban transport
CARS MORE
ATTRACTIVE:
GROWING
MOTORIZATION
MORE
CONGESTION
AND DELAYS
PUBLIC
TRANSPORTA-TION
SLOWER AND
LESS ATTRACTIVE
LESS DEMAND,
DECREASING
REVENUE, HIGHER
COST PER PASS.
INCREASED
FARES, REDUCED
FREQUENCIES
LOW DENSITY
URBAN
EXPANSION
INCREASED POLLUTION,
ACCIDENTS and
CONGESTION.
POVERTY AND
SOCIAL EXCLUSION
RISE OF INFORMAL
TRANSPORTATION
TRANSPORT
OPERATORS IN
FINANCIAL CRISIS.
POSSIBLE SUBSIDIES
NEEDED

A complete analysis of external costs of transport is necessary for sound policy formulation
• Empirically external costs of climate change are not dominant form of external costs of transport , US 2000
17Source, Kopp 2008

How much does it cost to achieve global goals?
• To get global emissions in 2030 back to today’s levels, the additional investment and financial flows (I&FF) required are estimated to be around US$200-210 billion.
• The transport sector will require roughly 80 billion USD – around 42-44% of this I&FF-(UNFCCC 2007).

Enhance Accessibility: Key Goal of Sustainable Transport
Obtain goods and services
Participate in social & economic
activities
Accessibility
Proximity
put things near each other
Canalization
channel people’s movements toward hubs and corridors, and put things near
them
Mobility
- facilitate people to move around as much
as possible
Virtuallity
use telecommunications to substitute for physical
access
Interact with people
Fuente: Gorham R.

Transporte de carga mas eficiente
• Centros de transferencia de carga
• Estandares de flota
• Regulacion clara sobre circulacion de camiones
How can we break the vicious circle?

Integrated transport, land use and air quality strategies– Promote high-density land use along
public transport corridors
– Prevent urban sprawl
– Revitalize urban centers

Improve public transportation– Reorganize network layout – High capacity modes on trunk
corridors– Intra- & inter-modal service
integration

Travel demand management– Congestion pricing
– Traffic calming
– Parking policies

Promotion of non-motorized transport
– Promote bike use
– Finance bikeways and pedestrian facilities
– Promote intermodality NMT & public transport

Emission Control Measures• Vehicle technology
• Fuel quality
• Inspection
• Maintenance

Transport IndicatorsBogotá
1998 2005
Privateautomobile 17% 8%
Motorcycle 1% 3%
Taxi 10% 12%
Conventional bus 56% 42%
Bus rapid transit 0% 19%
Walk 7% 12%
Bicycle 1% 3%
Other 8% 1%
• TransMilenio– 84 km trunk lines
• 1,021 articulated buses
– 504 km feeders• 385 feeder buses
– 114 stations• 1,498 bicycle parking spaces
• 1.4 million trips per day
• 70,109 tons CO2 eq. reduced in 2007
• Positive land use impacts
Source: World BankSource: TransMilenio S.A., Rodriguez and Targa (2004); Mendieta and Perdomo (2007).
Good Results Are Possible!


Major barriers
• There are important barriers that need to be overcome if we are to succeed in moving on to more sustainable transport patterns.
• Nations and cities need support to overcome substantial barriers, by– Developing visions and policy frameworks, – developing more integrated programs,– strengthening and integrating transport agencies and land-
use planning agencies, and– Overcoming institutional fragmentation by improving
mechanisms between transport, environment and urban planning.

Regional GEF Sustainable Transport and Air Quality Program
• Purpose – Reduce GHG and improve air quality by
supporting policy development and barriers removal.
• Four Projects– A) Argentina, b) Brazil, c) Mexico and c) Regional.
• Financiamiento– Up to $79.3 million USD
• Includes $20.8 million USD 4-year funding from the GEF.

Regional GEF Sustainable Transport and Air Quality Program
Regional Project
Cobenefits Assessment, Technical Assistance and Training, Mainstreaming, Technical Monitoring
Mexico Project
Ciudad JuarezLeon
MonterreyPuebla
Integrated Land Use Transport
Planning
Freight Management
Public Transport Improvement
Non-Motorized Transport
Demand Management
Brazil Project
Belho HorizonteCampinhas
CuritibaSao Paulo
Argentina Project
CordobaMaipuRosario
Tucuman

Establish right priorities in public expenditures
How to improve transport financing to meet global and global goals
• Recognizing transport, air quality, climate change and related issues as high priorities in local and national agendas and public budgets;
• Promoting the development of regulatory and institutional capacity as well as an appropriate policy framework to enhance compliance and enforcement;
• Developing projects and business models aiming to foster private involvement;
• Supporting the efforts of cities and countries to maximize funding opportunities and generation of local and national resources; and
• Fostering coordination among international donors to promote complementarities and efficiencies, avoid duplication, and ensure better use of resources.
• Scalating international transport finance.

Summary
• Enhance a comprehensive understanding of the transport sector global and local challenges.
• Develop and implement evaluation methods that appropriately rate benefits and costs of transport policies, considering
– Local air pollution
– External crowding costs, i.e. congestion
– Road safety
– Climate change effects

Summary
• Apply a co-benefits approach to achieve win-win solutions in the transport sector
• Foster a broad policy dialogue with key stakeholders to adopt and implement solutions.
• Target high political commitments.
• Improve policy instruments and scale up cooperation and overall finance to sustainable transport interventions.

Summary
• Use existing regional air pollution networks, climate networks, transport networks, inter-governmental agencies and agreements to link and share expertise among interest communities at different scales.
• Enhanced collaboration and communication between key climate change and air pollution stakeholders at international, national and local scales.
• Strengthen support to enhance and build visions, capacities and institutions at all levels.

Contact information
Sergio Sanchez
Executive Director
Clean Air Institute
1 (202) 785 4222 x 30