sustainable transport safety theory · –we take sts theory, rs statistics, community-statistics...
TRANSCRIPT
Road Safety Overview
The scale of the problem
Evaluating levels of safety
Sustainable safety strategies
Advice on the Business Case
SWOV (Institute for Road Safety Research, NL):Dr Fred Wegman, former DirectorDr Divera Twisk, Road Safety Researcher
Further reading: Global Status Report on Road Safety (WHO.org, 2013)
Advancing Sustainable Road Safety (SWOV.nl, 2006)
Road Safety Planning: New Tools for Sustainable Development (Lovegrove, 2007)
Acknowledgements
The Road Safety Problem
An enormous social and economic burden:
• World Health Organization ranks injuries due to road crashes as the 9th leading epidemic
– Will be 3rd worst by 2020 at current trends
– Age group at highest risk – 0 to 40 years old
• Costs 2 to 5% of Gross Domestic Product
– Hospital costs, damage repair, lost wages, delays
– Productivity, congestion
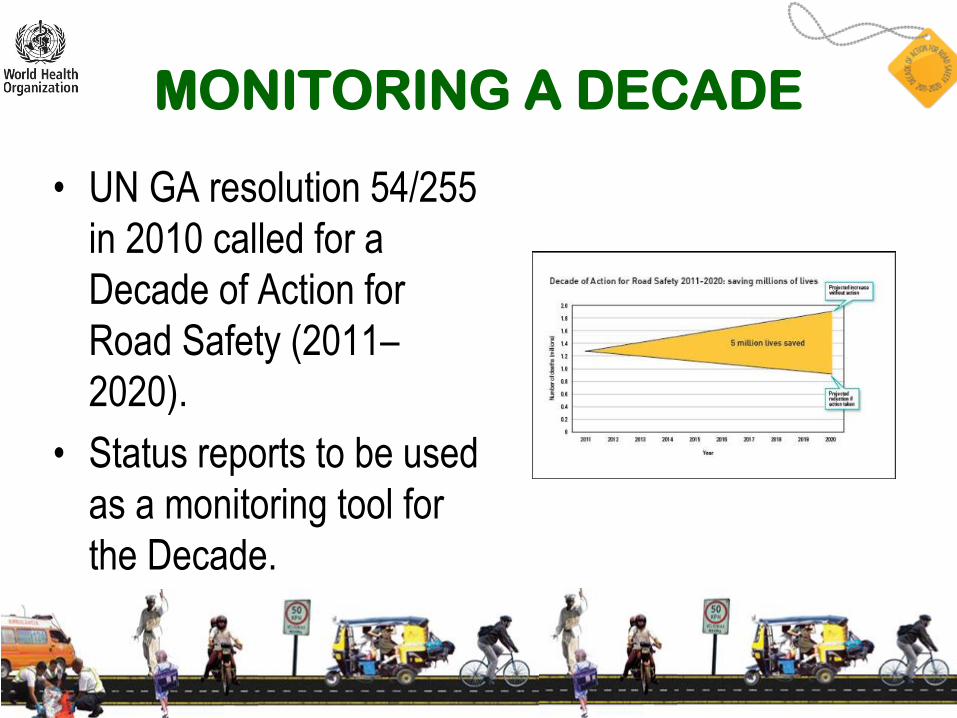
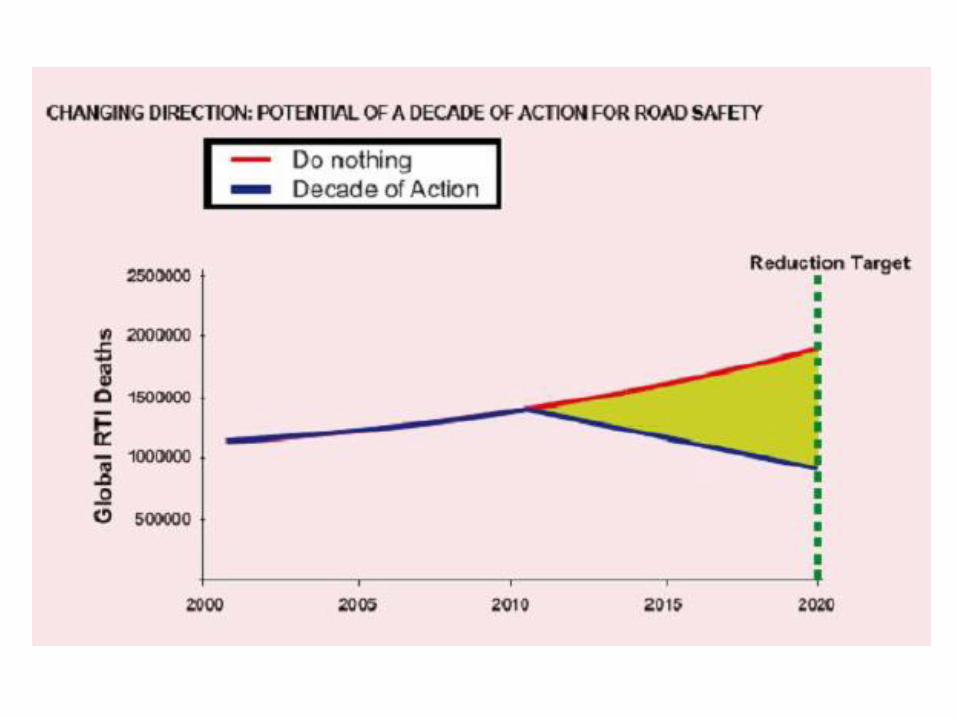
MONITORING A DECADE
• UN GA resolution 54/255
in 2010 called for a
Decade of Action for
Road Safety (2011–
2020).
• Status reports to be used
as a monitoring tool for
the Decade.
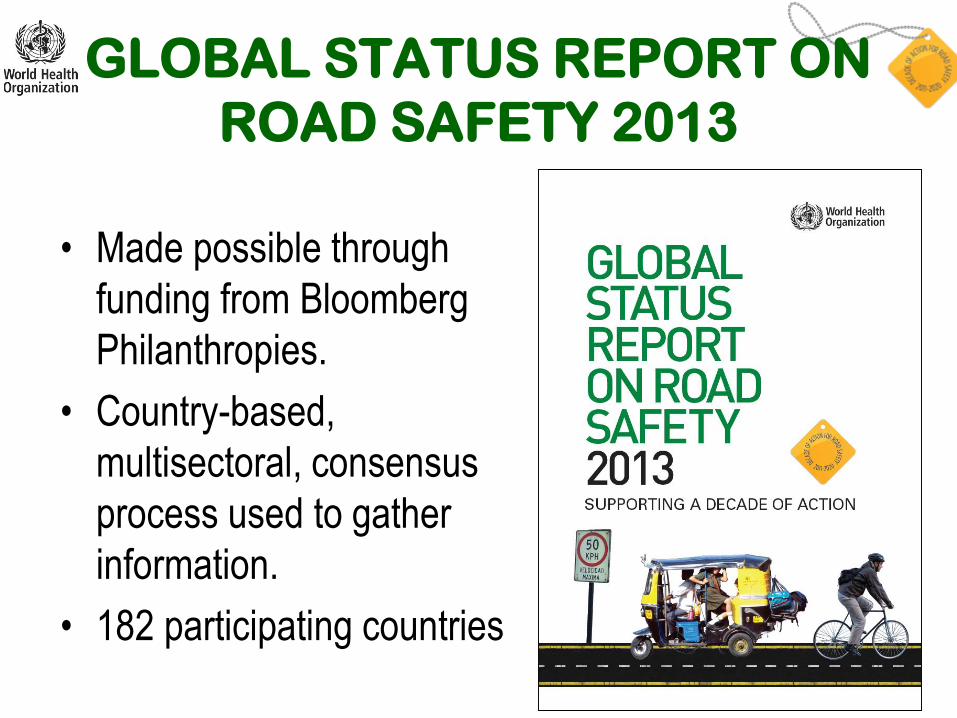
GLOBAL STATUS REPORT ON
ROAD SAFETY 2013
• Made possible through
funding from Bloomberg
Philanthropies.
• Country-based,
multisectoral, consensus
process used to gather
information.
• 182 participating countries
Every year, there are 1.24 million road traffic deaths worldwideYoung adults aged between 15 and 44 years account for 59% of global road traffic deaths.
92% of road traffic deaths occur in low- and middle-income countriesThese countries have only 53% of the world’s registered vehicles.
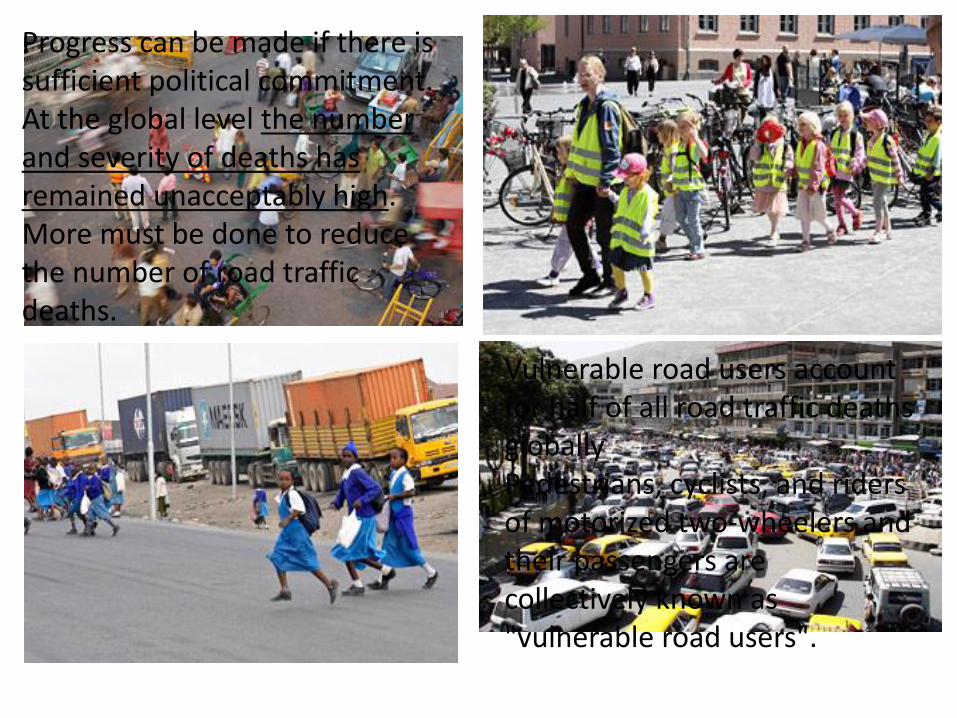
Vulnerable road users account for half of all road traffic deaths globallyPedestrians, cyclists, and riders of motorized two-wheelers and their passengers are collectively known as "vulnerable road users".
Progress can be made if there is sufficient political commitment. At the global level the number and severity of deaths has remained unacceptably high. More must be done to reduce the number of road traffic deaths.
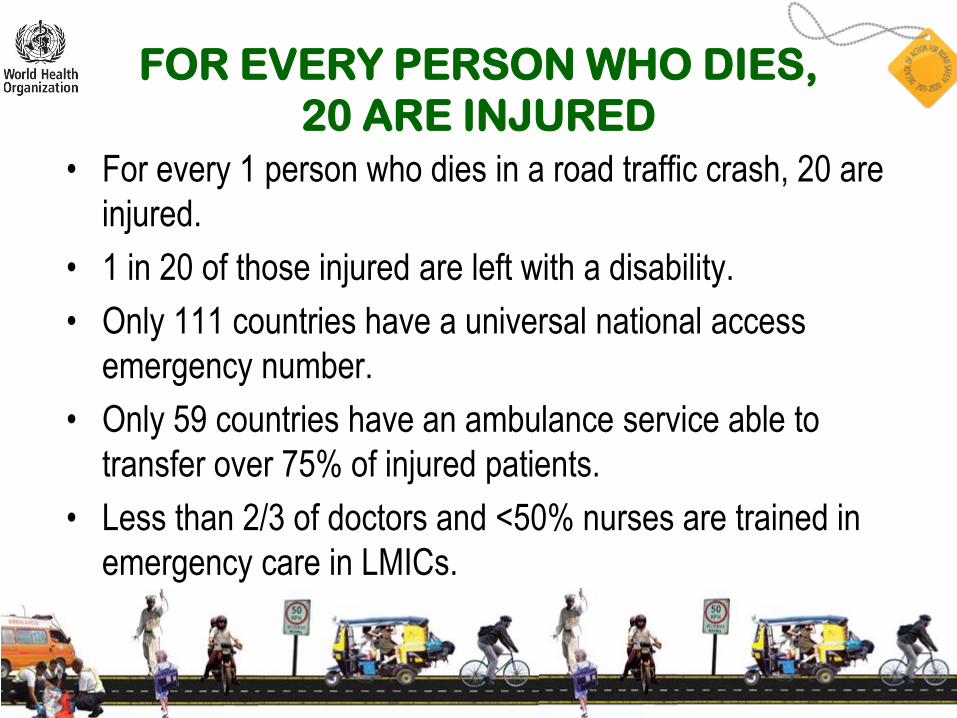
FOR EVERY PERSON WHO DIES,
20 ARE INJURED
• For every 1 person who dies in a road traffic crash, 20 are
injured.
• 1 in 20 of those injured are left with a disability.
• Only 111 countries have a universal national access
emergency number.
• Only 59 countries have an ambulance service able to
transfer over 75% of injured patients.
• Less than 2/3 of doctors and <50% nurses are trained in
emergency care in LMICs.
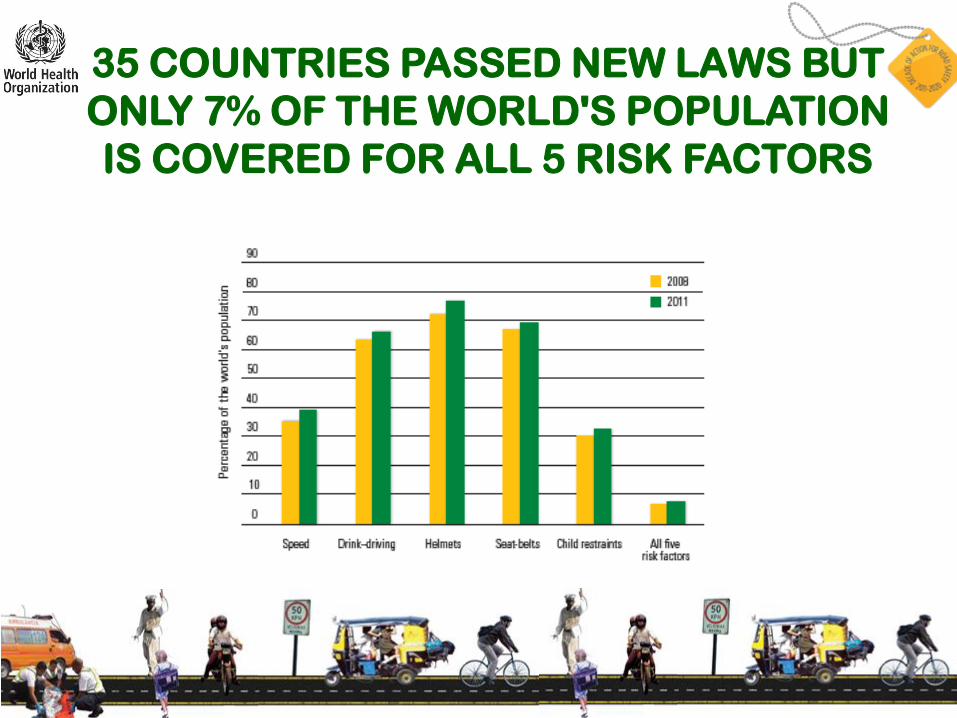
35 COUNTRIES PASSED NEW LAWS BUT
ONLY 7% OF THE WORLD'S POPULATION
IS COVERED FOR ALL 5 RISK FACTORS
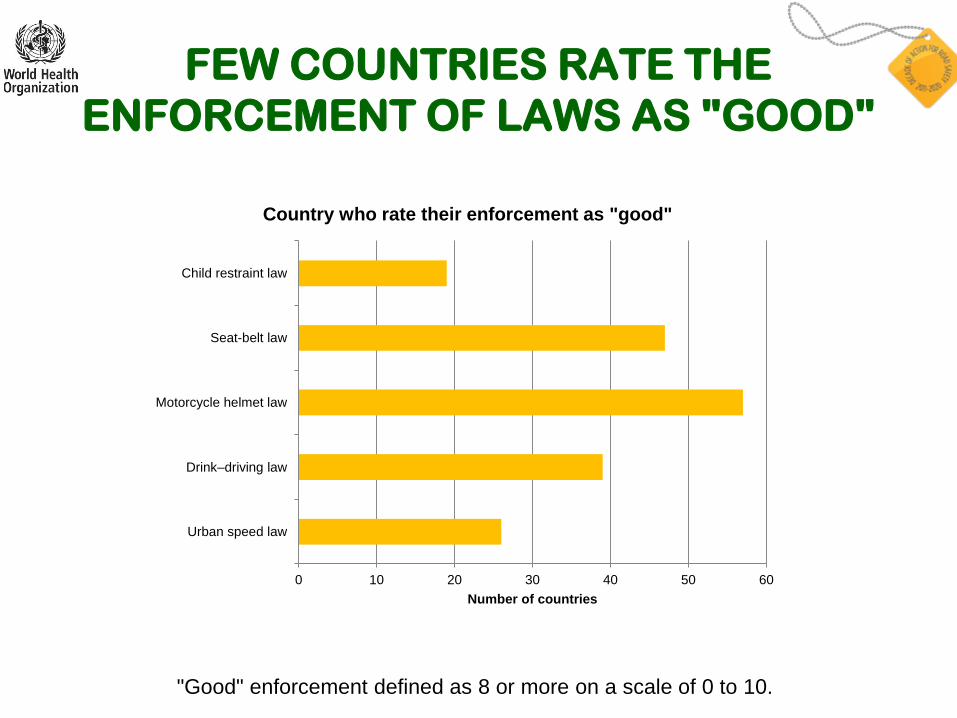
FEW COUNTRIES RATE THE
ENFORCEMENT OF LAWS AS "GOOD"
0 10 20 30 40 50 60
Urban speed law
Drink–driving law
Motorcycle helmet law
Seat-belt law
Child restraint law
Number of countries
Country who rate their enforcement as "good"
"Good" enforcement defined as 8 or more on a scale of 0 to 10.
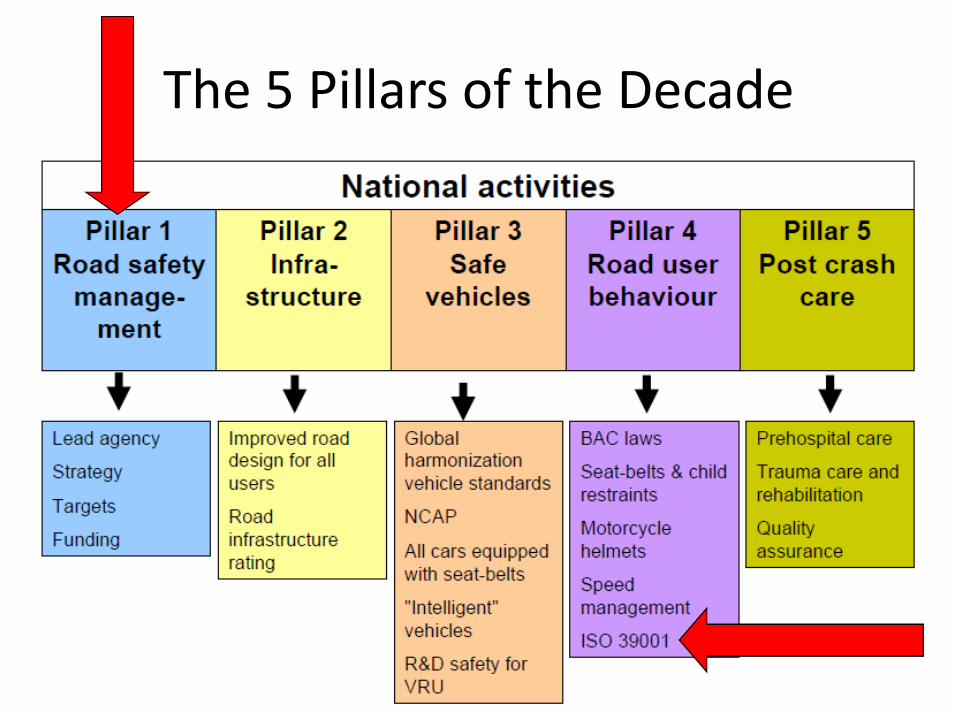
The 5 Pillars of the Decade
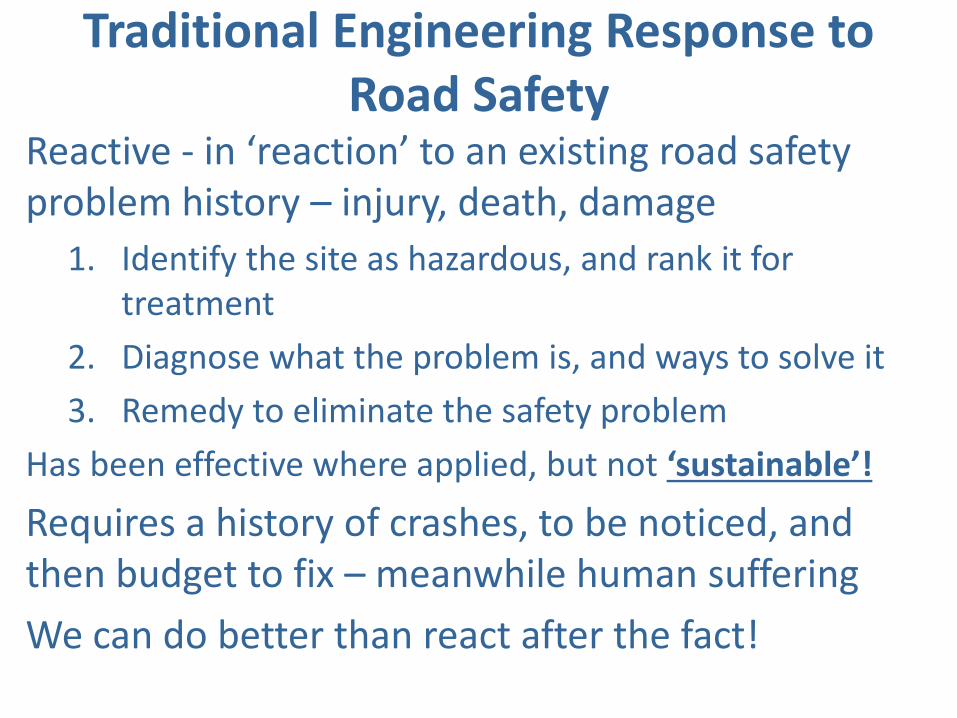
Traditional Engineering Response to Road Safety
Reactive - in ‘reaction’ to an existing road safety problem history – injury, death, damage
1. Identify the site as hazardous, and rank it for treatment
2. Diagnose what the problem is, and ways to solve it
3. Remedy to eliminate the safety problem
Has been effective where applied, but not ‘sustainable’!
Requires a history of crashes, to be noticed, and then budget to fix – meanwhile human suffering
We can do better than react after the fact!
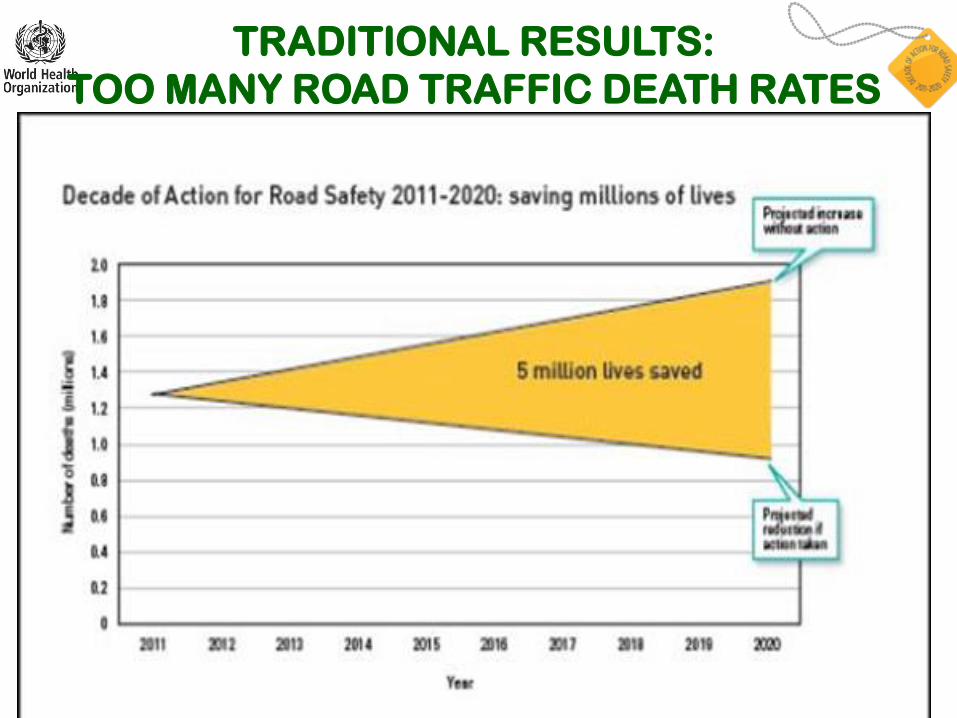
TRADITIONAL RESULTS:
TOO MANY ROAD TRAFFIC DEATH RATES
PER 100 000 POPULATION
Engineering sustainably safer systems
Proactive – before anything is built, to preclude road safety problems - injuries and death - from happening at all
– Done during planning stages of land use and transportation projects
– Through application of empirical predictive tools that quantify level of road safety of each project
Allows for permanent, sustainable solutions of safer roads and communities = Sustainable Safety
Stat: Over 90% of all crashes are due at least in part to driver error!? 10% due to vehicle failure, and 30% due to road environment failure.
An Integrated, Systems-based Approach:Driver, Vehicle, Road
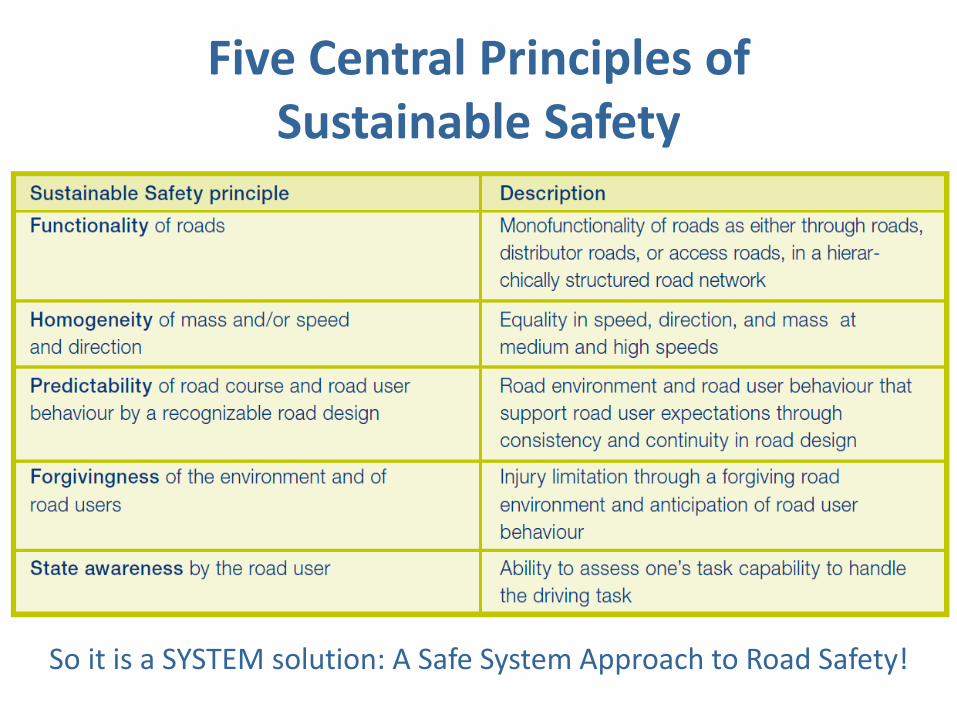
Five Central Principles ofSustainable Safety
So it is a SYSTEM solution: A Safe System Approach to Road Safety!
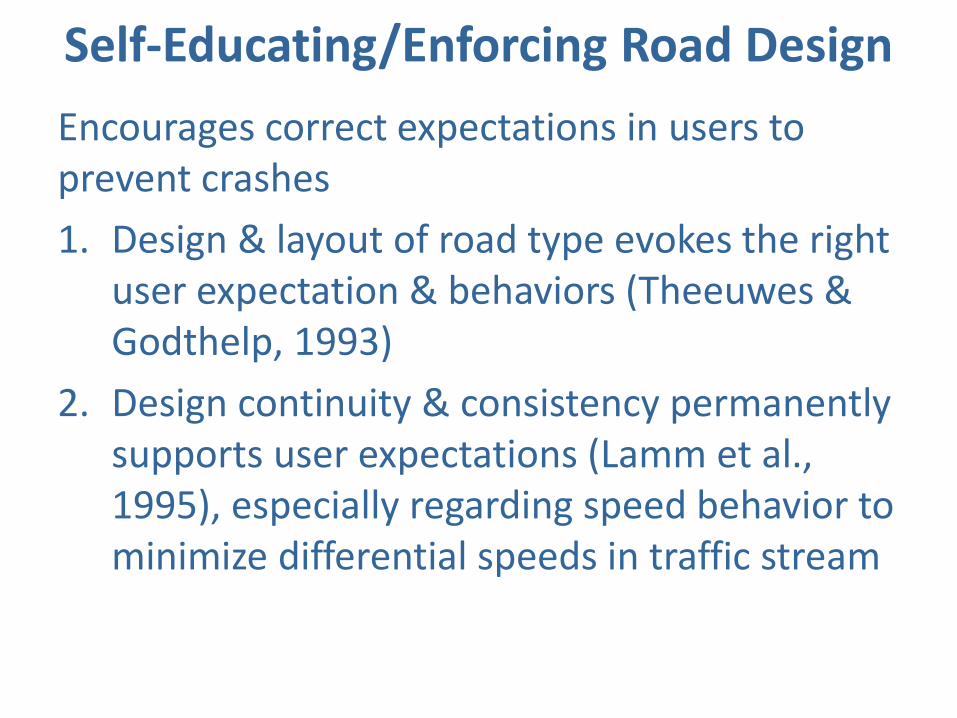
Self-Educating/Enforcing Road Design
Encourages correct expectations in users to prevent crashes
1. Design & layout of road type evokes the right user expectation & behaviors (Theeuwes & Godthelp, 1993)
2. Design continuity & consistency permanently supports user expectations (Lamm et al., 1995), especially regarding speed behavior to minimize differential speeds in traffic stream

Example: Design to Manage Your Speed

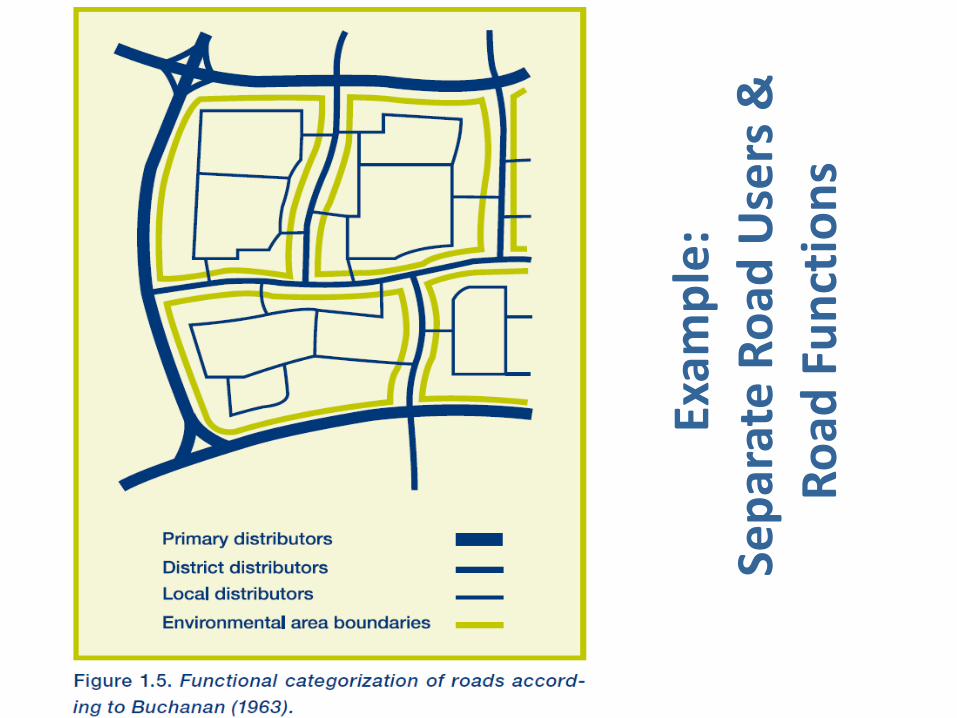
Exam
ple
:Se
par
ate
Ro
ad U
sers
&
Ro
ad F
un
ctio
ns
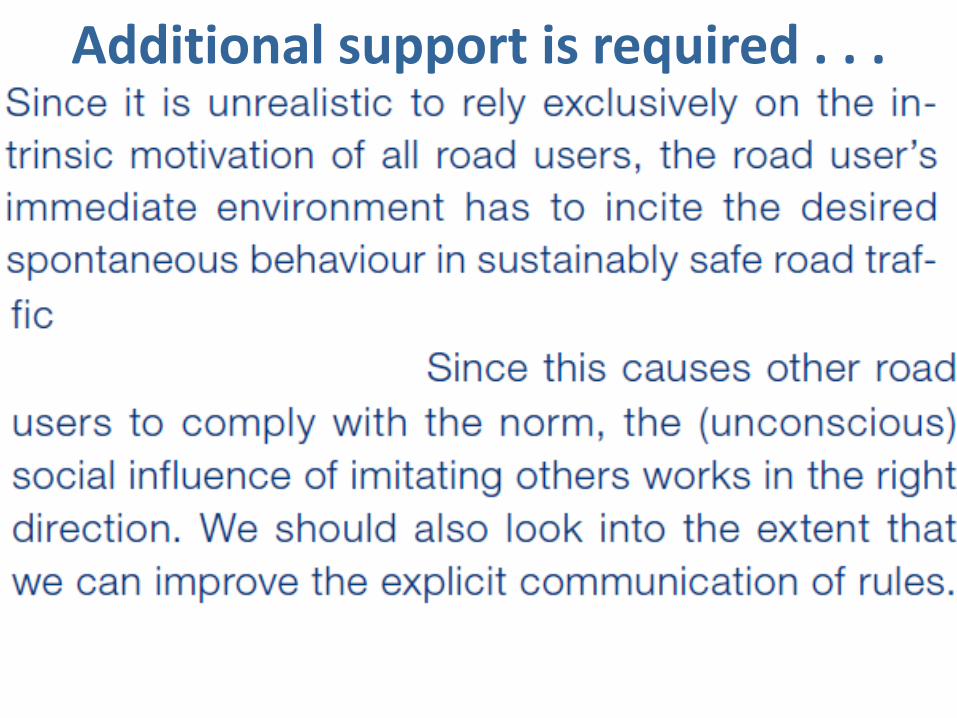
Additional support is required . . .

User – State AwarenessBalance Their Task Capability & Task Demands
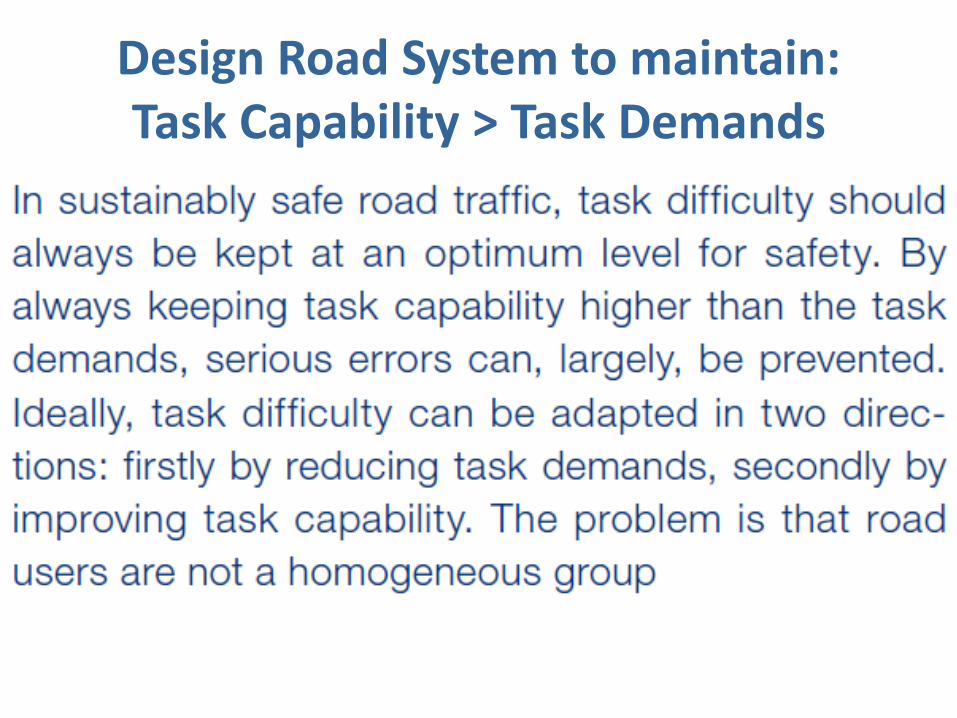
Design Road System to maintain:Task Capability > Task Demands
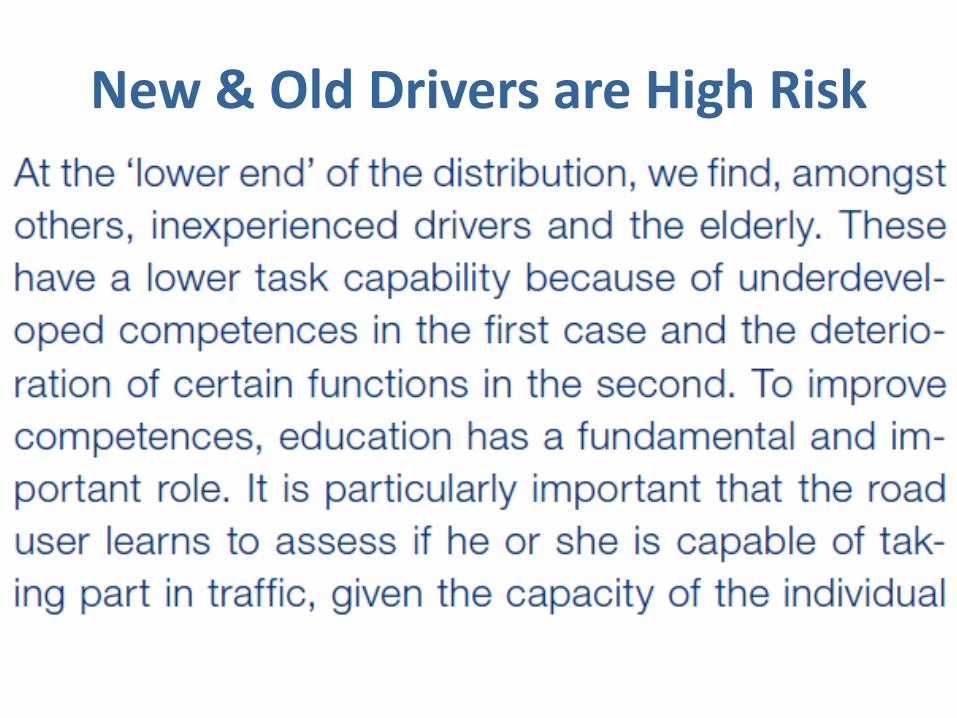
New & Old Drivers are High Risk
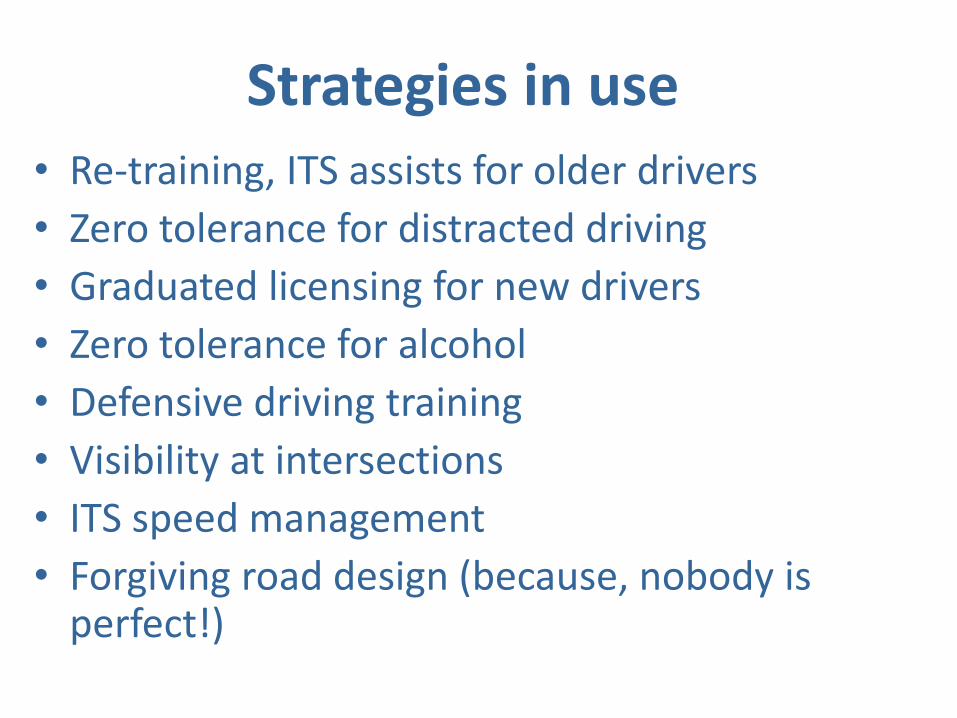
Strategies in use• Re-training, ITS assists for older drivers
• Zero tolerance for distracted driving
• Graduated licensing for new drivers
• Zero tolerance for alcohol
• Defensive driving training
• Visibility at intersections
• ITS speed management
• Forgiving road design (because, nobody is perfect!)
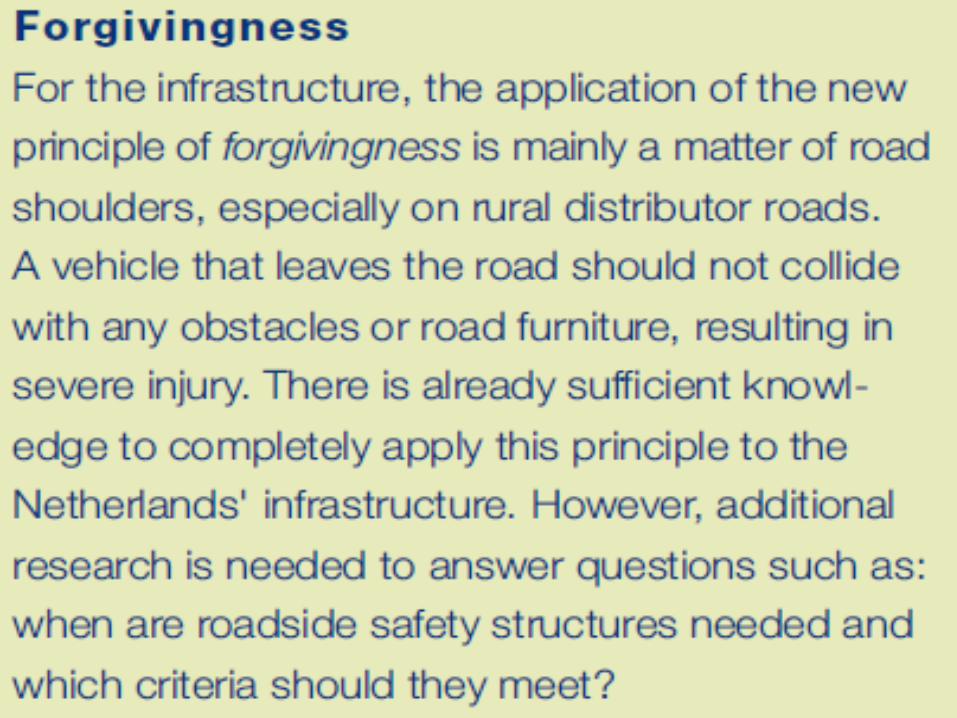
Forgiveness?
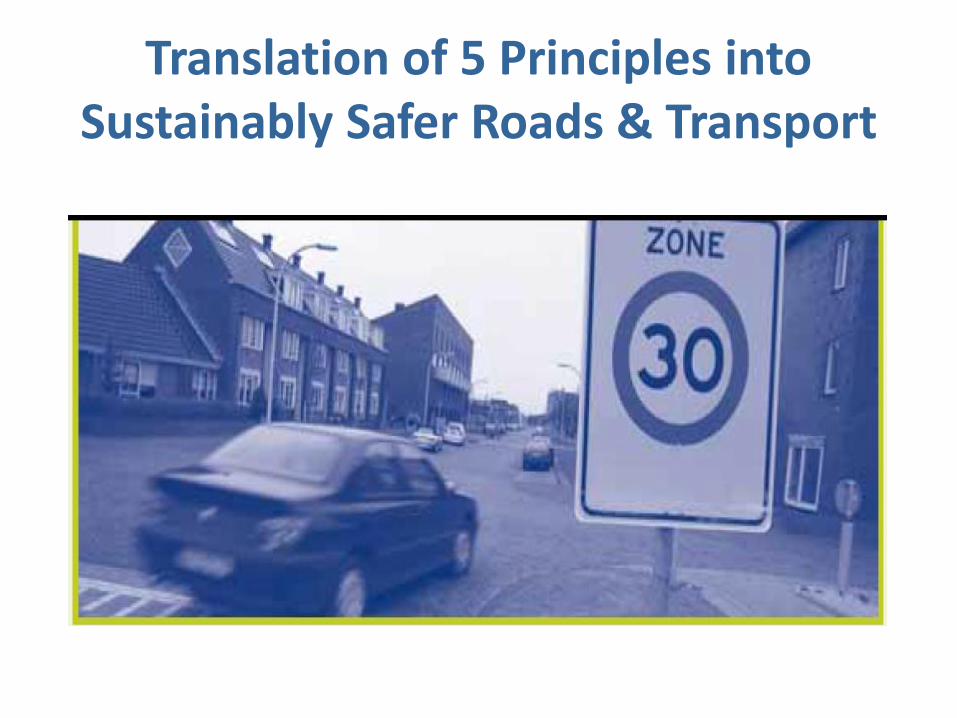
Translation of 5 Principles into Sustainably Safer Roads & Transport
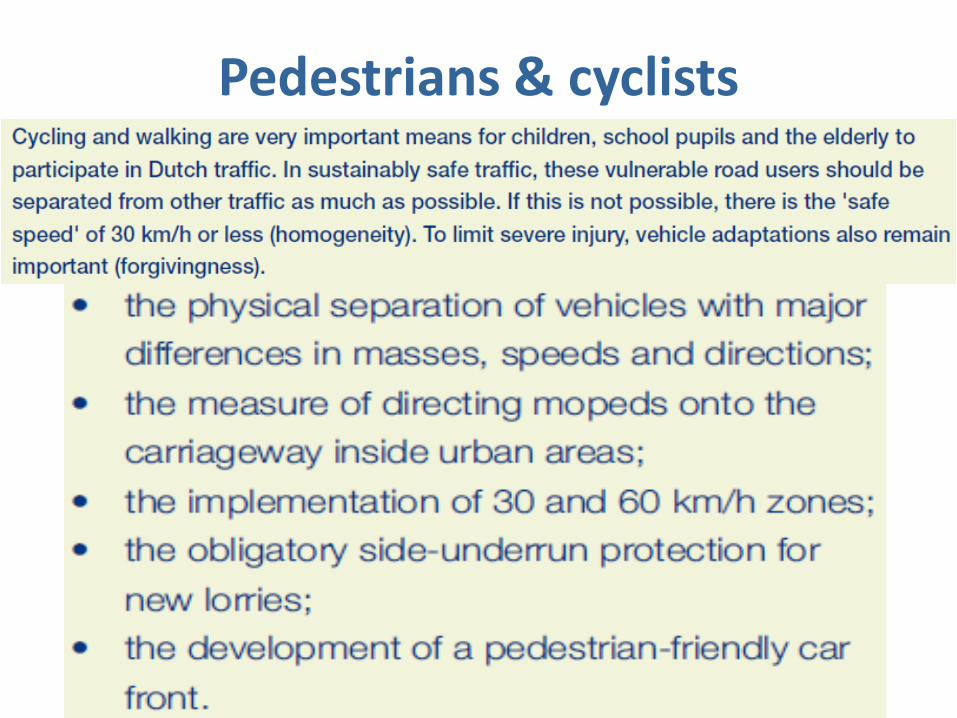
Pedestrians & cyclists
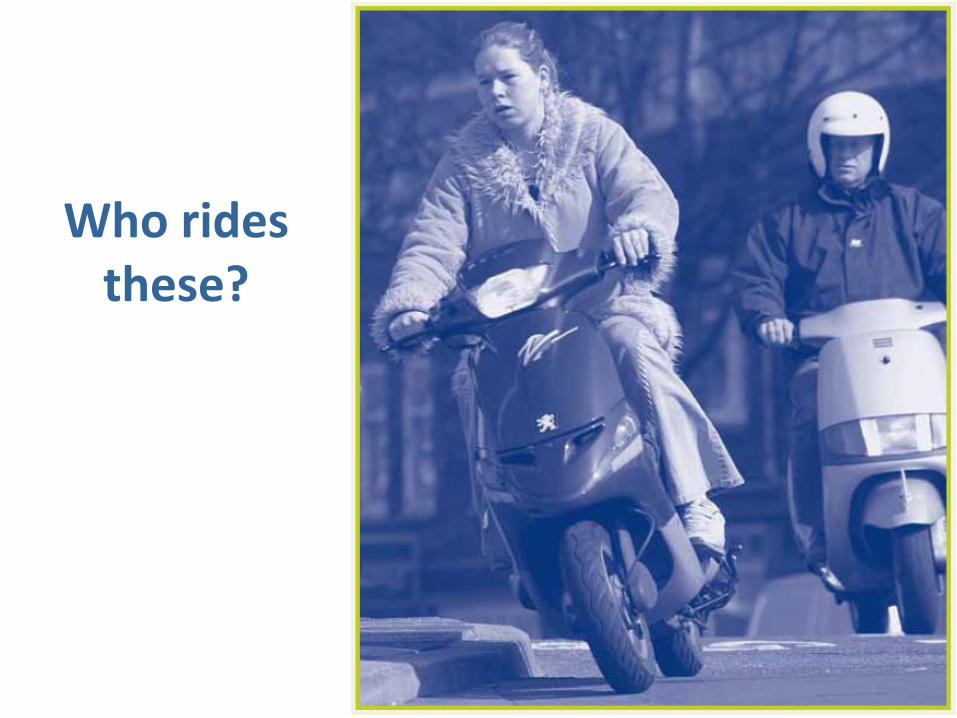
Who rides these?
Motorized 2-wheelers
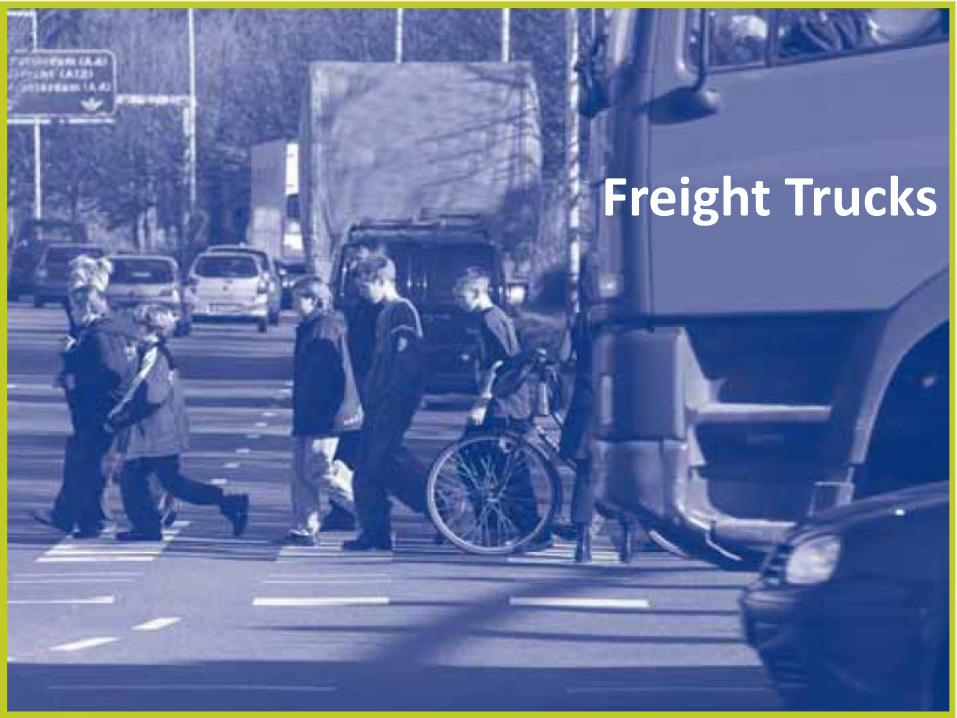
Freight Trucks
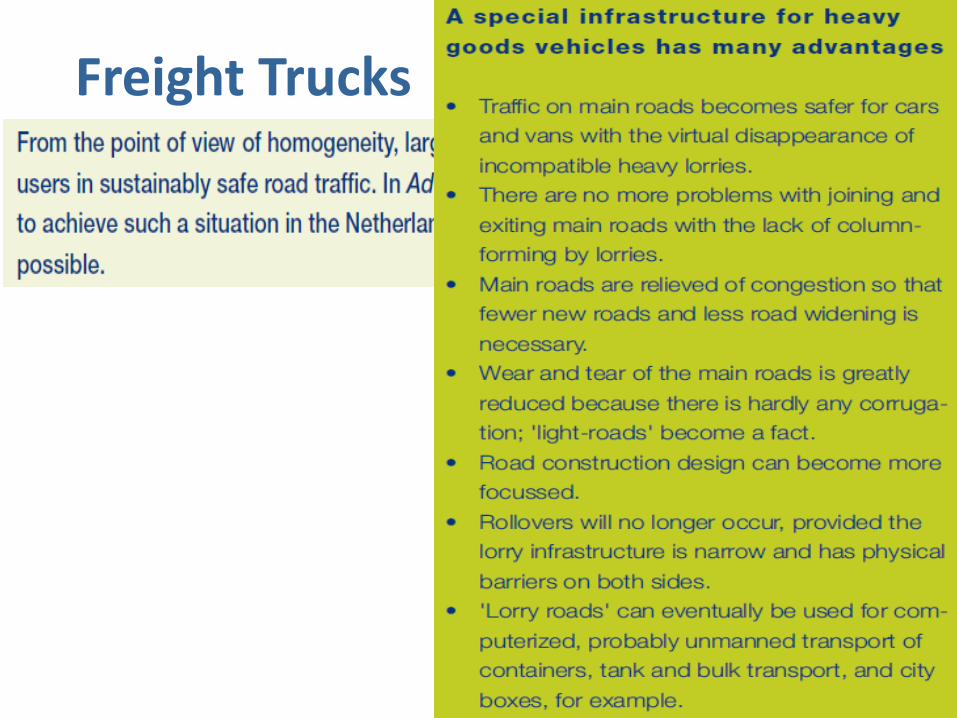
Freight Trucks
Other translations . . .• Keep road design homogeneous, simple to
understand, and cognizant of user expectations;
• The smallest proportion of the trip should occur on the least safe portion of the network;
• Design roads of each function to be unique, understandable, and recognizable to users;
• Reduce speed on approaches to and within potential conflict points or locations
Other translations . . . • Physically separate different transport modes, and
different road functions;
• Prevent conflicts with crossing traffic and pedestrians;
• The shortest and safest routes should be the same;
• Avoid obstacles alongside the roadway;
• Prevent conflicts with opposing traffic;
• All trip lengths should be minimized; and,
• Conduct before/after studies to ascertain effectiveness of investments; learn from mistakes!
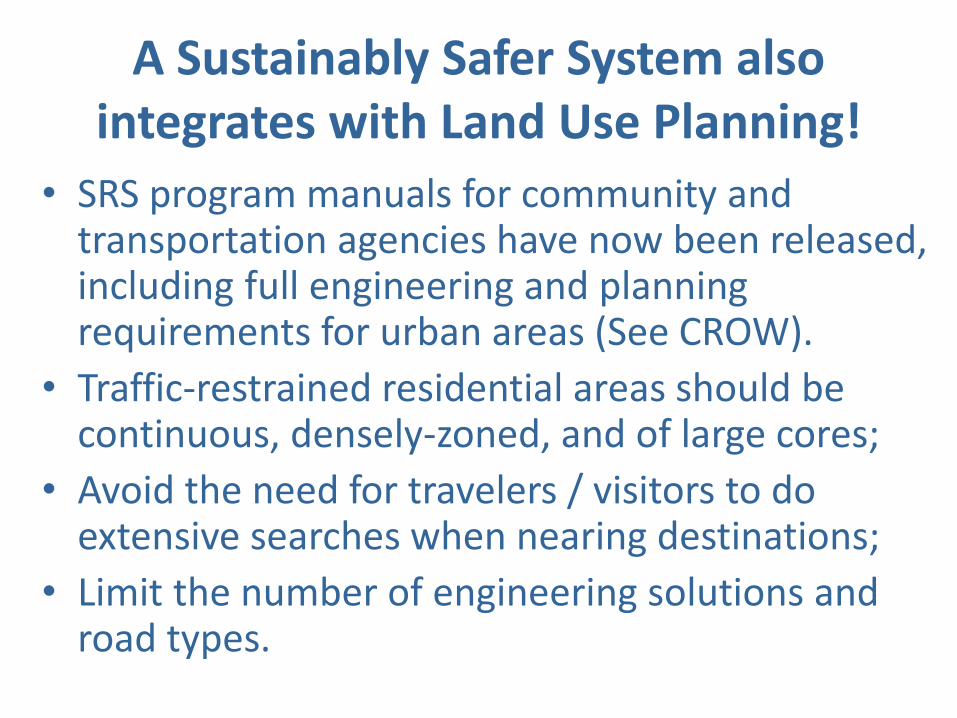
A Sustainably Safer System also integrates with Land Use Planning!
• SRS program manuals for community and transportation agencies have now been released, including full engineering and planning requirements for urban areas (See CROW).
• Traffic-restrained residential areas should be continuous, densely-zoned, and of large cores;
• Avoid the need for travelers / visitors to do extensive searches when nearing destinations;
• Limit the number of engineering solutions and road types.
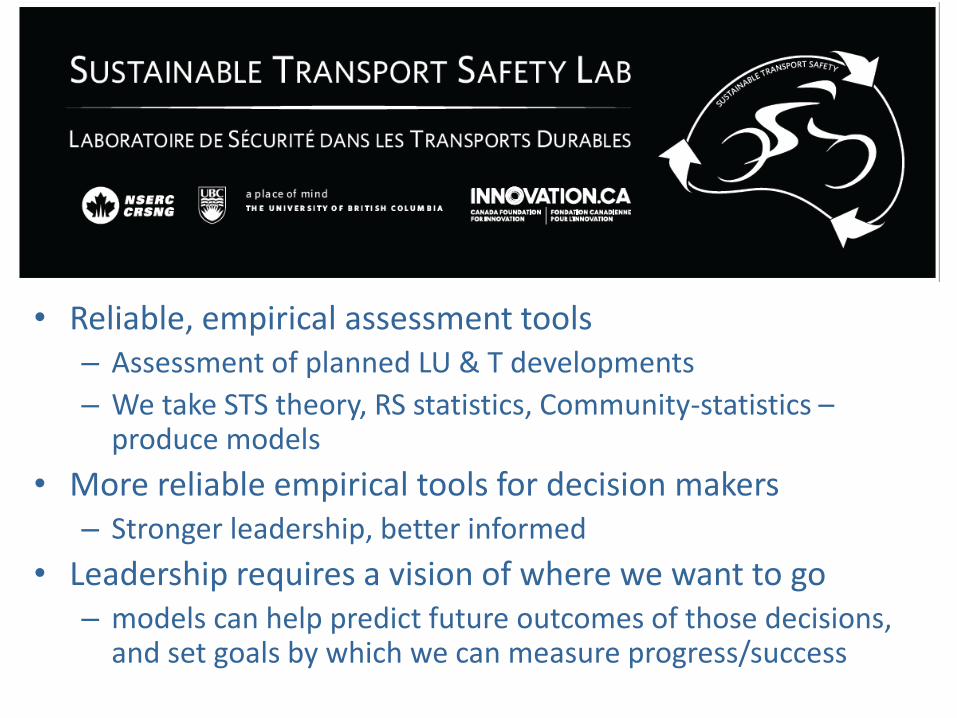
STS Research Lab Projects
• Reliable, empirical assessment tools– Assessment of planned LU & T developments
– We take STS theory, RS statistics, Community-statistics –produce models
• More reliable empirical tools for decision makers– Stronger leadership, better informed
• Leadership requires a vision of where we want to go– models can help predict future outcomes of those decisions,
and set goals by which we can measure progress/success

Instrumented Probe Bicycles for improved VRU data
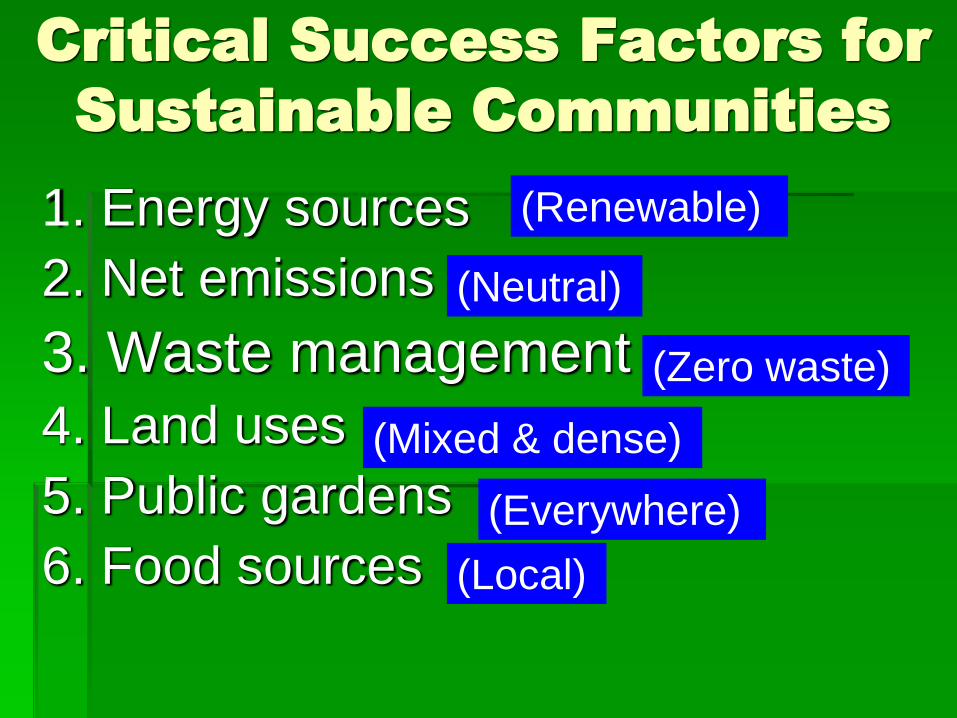
1. Energy sources
2. Net emissions
3. Waste management
4. Land uses
5. Public gardens
6. Food sources
Critical Success Factors for
Sustainable Communities
(Renewable)
(Neutral)
(Zero waste)
(Mixed & dense)
(Everywhere)
(Local)
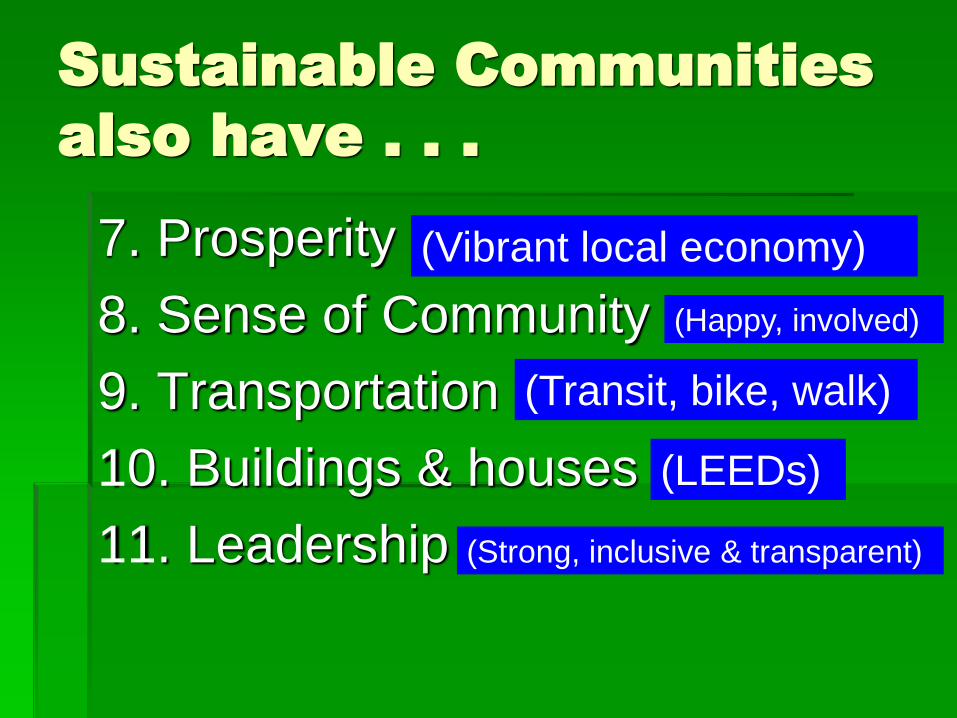
Sustainable Communities
also have . . .
7. Prosperity
8. Sense of Community
9. Transportation
10. Buildings & houses
11. Leadership
(Vibrant local economy)
(Happy, involved)
(Transit, bike, walk)
(LEEDs)
(Strong, inclusive & transparent)
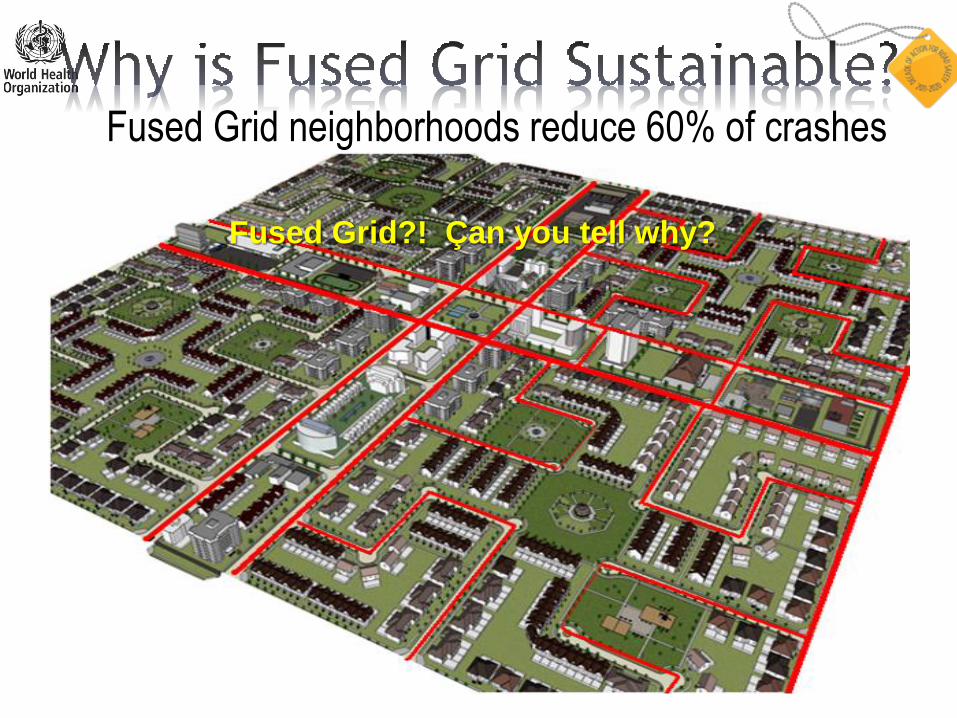
Fused Grid neighborhoods reduce 60% of crashes
Fused Grid?! Çan you tell why?

*
• Grid Network
42
• Culs-de-sac
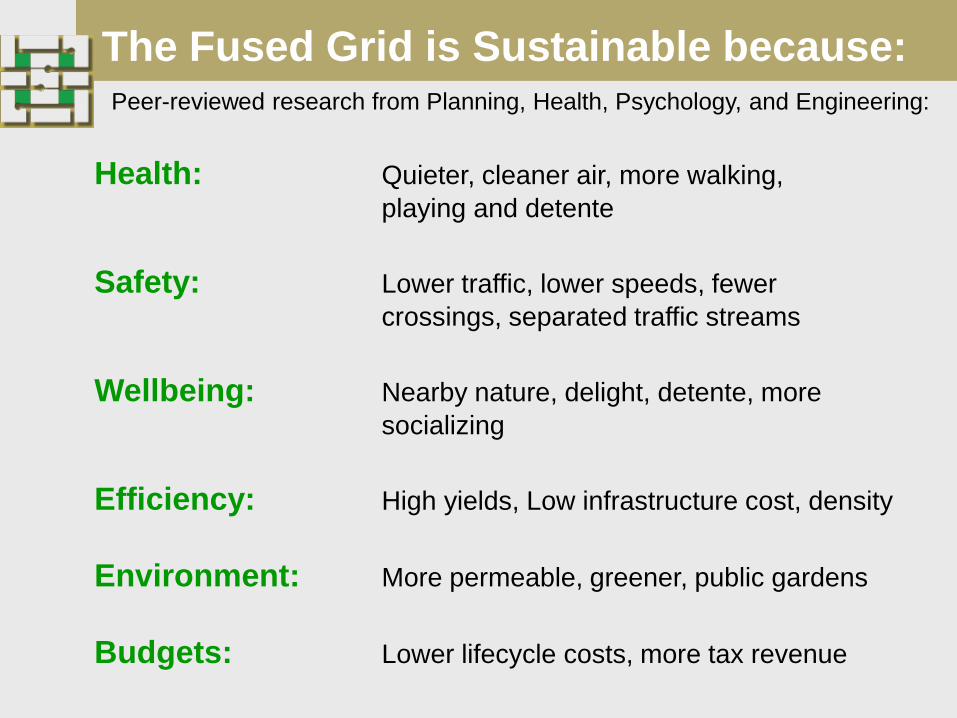
Health: Quieter, cleaner air, more walking,
playing and detente
Safety: Lower traffic, lower speeds, fewer
crossings, separated traffic streams
Wellbeing: Nearby nature, delight, detente, more
socializing
Efficiency: High yields, Low infrastructure cost, density
Environment: More permeable, greener, public gardens
Budgets: Lower lifecycle costs, more tax revenue
The Fused Grid is Sustainable because:Peer-reviewed research from Planning, Health, Psychology, and Engineering:
CANADA MORTGAGE AND HOUSING CORPORATION
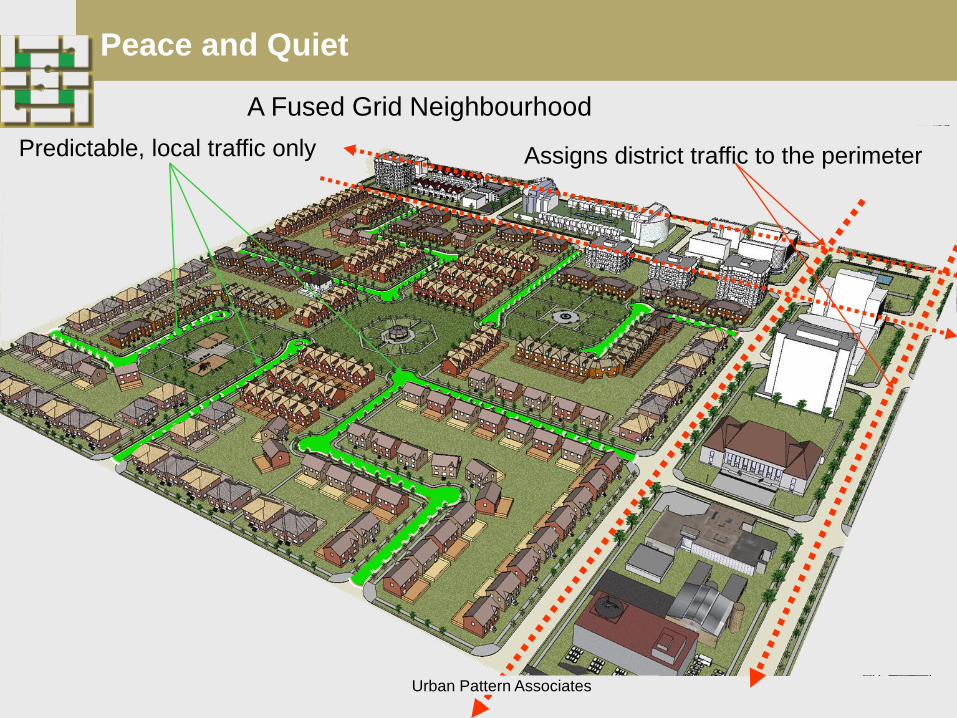
A Fused Grid Neighbourhood
Peace and Quiet
Predictable, local traffic only Assigns district traffic to the perimeter
Urban Pattern Associates
CANADA MORTGAGE AND HOUSING CORPORATION
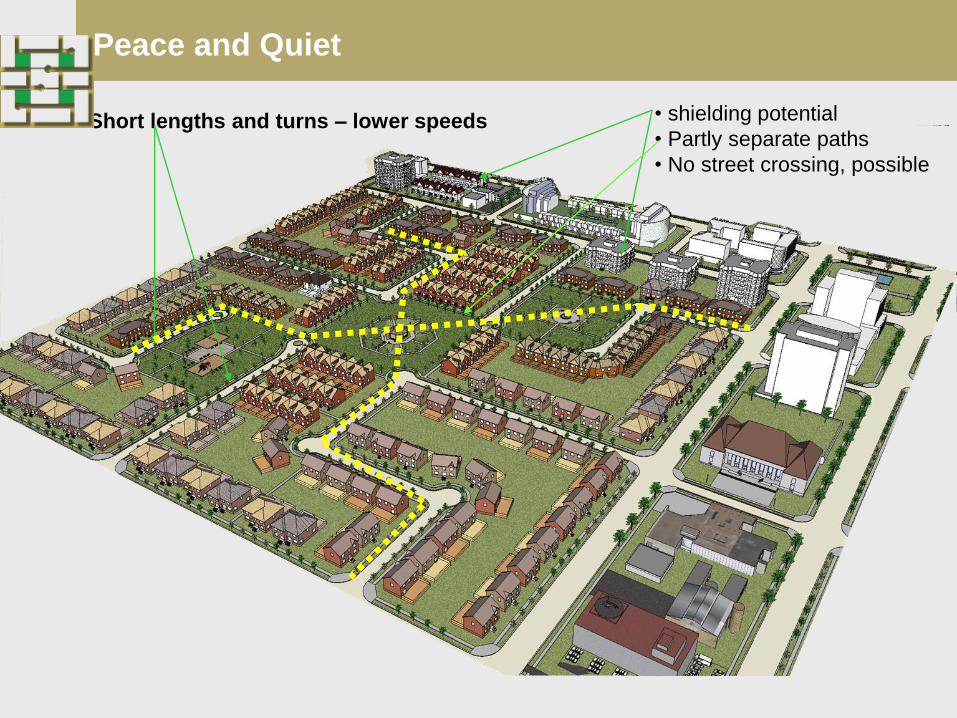
Peace and Quiet
Short lengths and turns – lower speeds • shielding potential
• Partly separate paths
• No street crossing, possible
CANADA MORTGAGE AND HOUSING CORPORATION
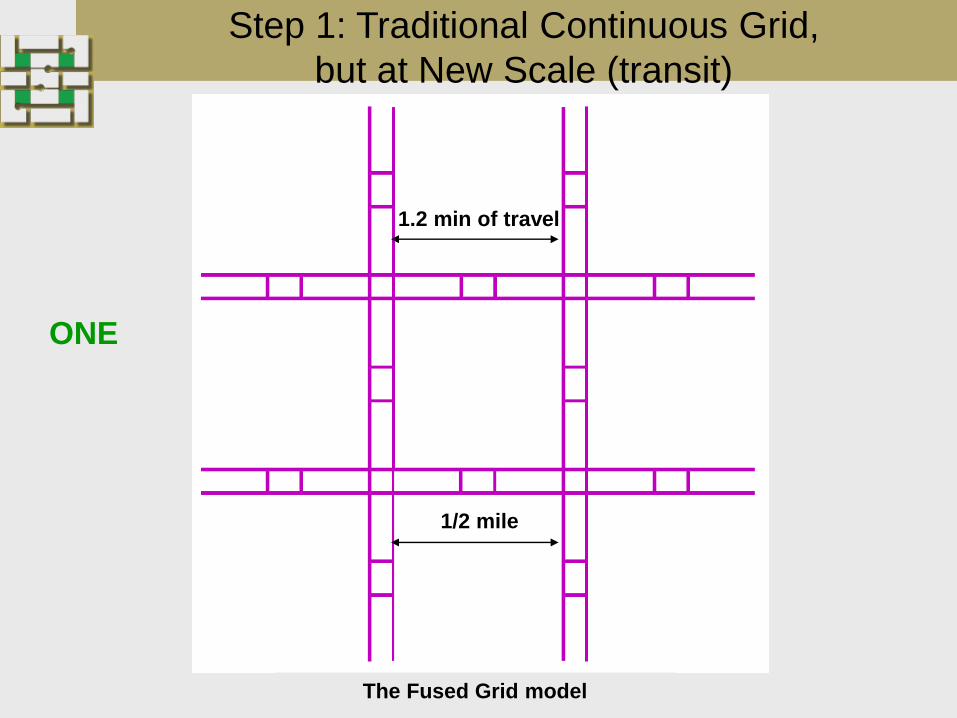
Step 1: Traditional Continuous Grid,
but at New Scale (transit)
1/2 mile
1.2 min of travel
The Fused Grid model
ONE

Step 2: New Discontinuous Grid, but
at Traditional scale (pedestrian)
260 feet or
1.2 min of walk
TWO
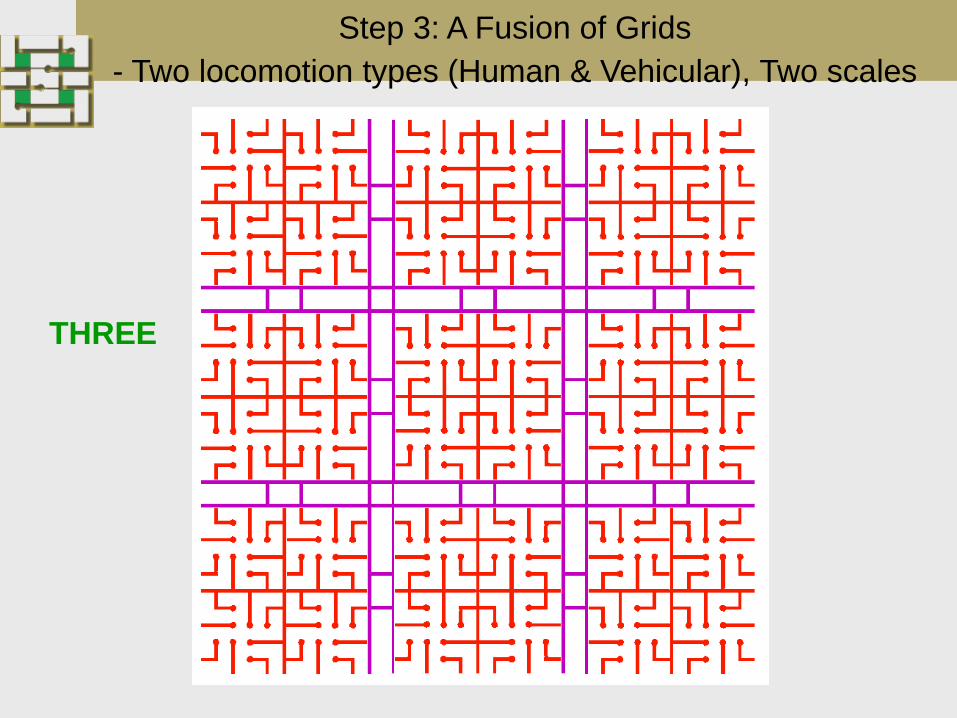
Step 3: A Fusion of Grids
- Two locomotion types (Human & Vehicular), Two scales
THREE
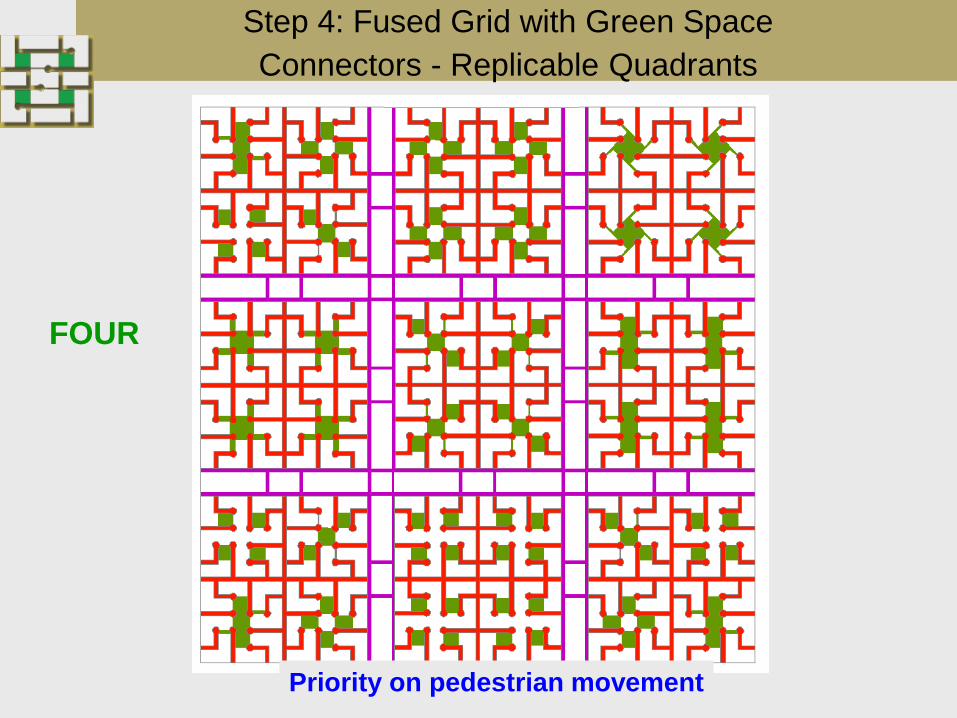
CANADA MORTGAGE AND HOUSING CORPORATION
Step 4: Fused Grid with Green Space
Connectors - Replicable Quadrants
Priority on pedestrian movement
FOUR
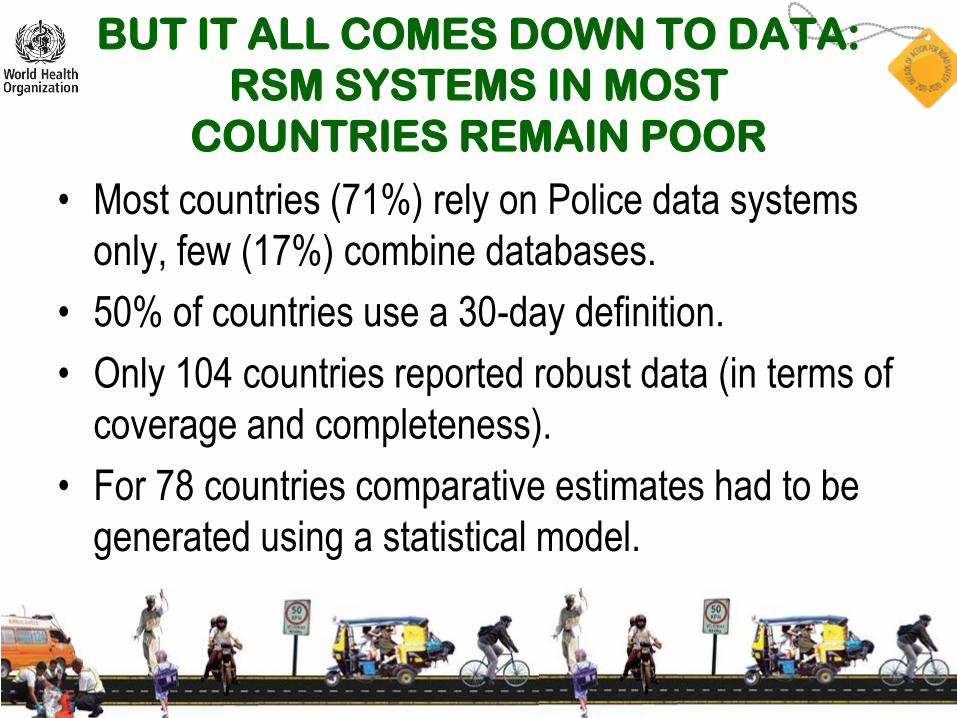
BUT IT ALL COMES DOWN TO DATA:
RSM SYSTEMS IN MOST
COUNTRIES REMAIN POOR
• Most countries (71%) rely on Police data systems
only, few (17%) combine databases.
• 50% of countries use a 30-day definition.
• Only 104 countries reported robust data (in terms of
coverage and completeness).
• For 78 countries comparative estimates had to be
generated using a statistical model.
ADVICE ON BUSINESS CASE1. Think BIG, but be realistic in your expectations – even with a good
business case, road safety improvement will take time – try to
anticipate barriers, and aim to overcome early – be pre-emptive in
your thinking, networks, and business case cost / benefit content.
2. Stick to two or three key messages – e.g.’s:
1. #9 worst epidemic; #3 by 2020 unless we change things.
2. For every 1 death, 20 more are injured – over 50% of which are our kids!
3. For each $1 invested in road safety, we save ## lives per YEAR!
3. It takes a generation or three to change land use/development form
and travel habits; in developing countries, survival is top priority,
poverty/equity/water/food/disease – AIDS, Ebola – so lower budgets
4. Therefore KISS – practical, easy to implement, self-
educating/enforcing – minimal admin and low-hanging strategies!
Good Summary Documents1. WHO (2013) Global Report on Road Safety,
http://www.who.int/features/factfiles/roadsafety/en/
2. Lovegrove, G. (2007) Road Safety Planning: New Tools for Sustainable Road Safety and Community Development, VDM Verlag Dr Muller, Berlin, Germany.
3. Wegman, F. (2006) Advancing Sustainable Road Safety, SWOV, The Hague, Netherlands.
4. Grammenos, F. & Lovegrove, G. (2014) Remaking the City Street Grid - A Model for Urban and Suburban Development, McFarland Publishers.
5. [email protected]/okanagan/engineering/faculty/gordonlovegrove.html