sustainable wash systems learning partnership ethiopia
TRANSCRIPT

Research Report
Sustainable WASH Systems Learning Partnership
ETHIOPIA MIDTERM ORGANIZATIONAL NETWORK ANALYSIS REPORT May 2020 LINC

Prepared by: Megan McDermott, LINC
Acknowledgements: This paper was prepared by Megan McDermott, with valuable contributions and support
from SWS colleagues Diana Harper, Rich Fromer, Lemessa Mekonta, Bethlehem Hailegiorgis, Muhammad
Ibrahim, Lucia Henry, and Desta Dimtse.
About the Sustainable WASH Systems Learning Partnership: The Sustainable WASH Systems Learning Partnership is a global United States Agency for International Development (USAID) cooperative agreement to identify locally driven solutions to the challenge of developing robust local systems capable of sustaining water, sanitation, and hygiene (WASH) service delivery. This report is made possible by the generous support of the American people through USAID under the terms of the Cooperative Agreement AID-OAA-A-16-00075. The contents are the responsibility of the Sustainable WASH Systems Learning Partnership and do not necessarily reflect the views of USAID or the United States Government. For more information, visit
www.globalwaters.org/SWS, or contact Elizabeth Jordan ([email protected]).
ii

.....................................................................................................................................
.................................................................................................................................................
................................................................................................................................................
.......................................................................................................................................................
.......................................................................................................................................
............................................................................................................................................
......................................................................................................................
................................................................................................................................................
......................................................................................................................................................
...................................................................................................................................................
......................................................................................................................................
.......................................................................................................................................................
.............................................................................................................................................
.............................................................................................................................................
.....................................................................................................................................
............................................................................
.................................................................................................................................................
......................................................................................................................................
.......................................................................................................................................................
.............................................................................................................................................
.......................................................
.................................................................................................................................................
......................................................................................................................................
.......................................................................................................................................................
...............................................................................................................................................
......................................................................................................................
..
..
..
..
..
..
..
..
..
..
..
..
..
..
Table of Contents
Executive Summary 1
Introduction 4
Methodology 4
Design 4
Data Collection 6
Data Analysis 6
Stakeholder Consultation 7
Limitations 8
Findings 10
Woliso 10
Debre Birhan 21
Mile 29
South Ari 38
Conclusions 47
Lessons Learned 48
Annex I: Baseline-Midterm Ego-Network Metrics 50
Woliso 50
Debre Birhan 52
Mile 54
South Ari 56
Annex II: Midterm Relationship Statistics (Relationship Type) 58
Woliso 58
Debre Birhan 58
Mile 60
South Ari 61
Annex III: Midterm Survey 62
iii

Executive Summary
Background
In Ethiopia, the Sustainable WASH Systems Learning Partnership (SWS) is using organizational
network analysis (ONA) to measure change over time in the relationships and network
structure of WASH actors in four separate locations. The analysis is being used to understand progress, as well as to inform continuing SWS efforts to improve local water and sanitation
service sustainability.
SWS activities are focused on rural water in the woredas (districts) of South Ari and Mile and focused on urban sanitation in the small towns of Woliso and Debre Birhan. In each of these
locations, SWS recruited organizations (NGOs, public institutions, academic institutions, and private sector organizations) actively providing or contributing to the provision of WASH
services to participate in a learning alliance. Learning alliances are locally led platforms brought
together to increase collaboration and knowledge sharing among stakeholders for improved efficiency, effectiveness, and sustainability of local WASH services. Improving the underlying
structure of the network of relationships among learning alliance participants is a critical part of
the learning alliance approach, with relevance to their current effectiveness and future
sustainability.
A baseline ONA was conducted before formation of the learning alliances to assess networking
behavior prior to any intervention. LINC conducted this midterm ONA to understand the current network of relationships among these organizations to identify strengths and
opportunities and to compare the current state to the networks that existed during the
baseline analysis. The midterm analysis will also be used to reflect on and inform learning alliance goals, activities, and associated relational structures. An endline analysis is planned for
FY 2021 to track further changes in each network over the life of the project.
Methodology
As in the baseline ONA assessment, the midline assessment used a whole network design to
assess relationships and network structure. This design uses a roster that surveys all actors on a pre-identified list. Each respondent was asked to identify whether their organization had
interacted with any other organization in the network among three different relationship types:
information sharing, coordination, and problem-solving support in alignment with the theory of change for the learning alliances. Minor updates to the baseline ONA survey were made for the
midterm analysis (such as removing the reporting relationship type, which was not determined
to be useful) to maximize the utility of the ONA results for the learning alliance, as well as to streamline data collection. These changes were based on feedback from SWS learning alliance
facilitators, other members of the SWS team, and learning alliance members. The survey was
administered in-person to representatives from all organizations currently in operation in the WASH sector that were identified at baseline for potential participation in the local learning
alliance.
Following an initial analysis of the data, the two small town sanitation learning alliances held an ONA validation and feedback workshop. In this session, participants reflected on their past and
current network structure, identified network strengths and areas for improvement, and took
steps to improve future sustainability of the learning alliance activities. These discussions further
1

-
-
-
-
-
informed the research team’s interpretation of the results and helped SWS understand how the ONA can be adapted for future iterations to maximize its usefulness to the learning alliance
participants and facilitators. Similar ONA validation and feedback workshops for the two rural
water learning alliances were held in early 2020.
Conclusions and Lessons Learned
The midterm ONAs revealed a number of changes in each of the four networks since the baselines
were conducted in 2017 and 2018. Although the
specific ONA findings differed between the locations, several themes and considerations
emerged from the analysis with implications across
the learning alliances.
Overall connectivity increased across the four
learning alliance locations, with the greatest
gains made in information sharing. Although there have been increases across relationship types
in each of the four locations, information sharing
increased most substantially from baseline to midterm. Reported quality of information received
— as measured by whether information was used
directly to inform the recipient’s WASH activities
— also improved in all four networks.
Coordination between network members is
most commonly associated with basic service provision and community engagement. Across
all four learning alliances, the types of coordination
reported among members follows a similar pattern. The types of coordination cited most frequently
were service provision and community
engagement, followed by monitoring. Those cited the least by respondents were capacity building and
maintenance.
Non-governmental actors identified as important WASH stakeholders at baseline have
not been actively engaged in the learning
alliances. The majority of local and international NGOs identified as prospective learning alliance
members do not actively engage in their respective
WASH networks. In most of the networks, identified community-based organizations (CBOs),
academic institutions, and private sector actors
also tend to remain on the network peripheries and have low levels of engagement with the
learning alliance members.
Summary of Network Changes
In Woliso, connectivity increased across all
three relationship types. Information
sharing, in particular, experienced notable
improvements, with network members reporting that 100 percent of information received was directly used to inform their
WASH related work. There are also small but noticeable shifts in the organizations occupying the network core. New core
organizations include the Kebele Administrations and the Culture and
Tourism Office.
In Debre Birhan, connectivity also increased across all three relationship types,
with the most growth in information
sharing. Few non governmental actors were
identified as network members, and they remain on the periphery of the information sharing and coordination sub networks.
Kebeles (wards) are significantly better connected to one another at midterm
compared to baseline.
In Mille, the learning alliance is the smallest and most homogenous of the four groups in
Ethiopia. There have been clear gains in networking among woreda offices, most notably in information sharing and
coordination. At the same time, there is a
corresponding decrease in the number of
out group ties between woreda offices and other types of organizations in the network.
In South Ari, overall connectivity among
learning alliance members has improved, primarily along government departmental
lines. The finance offices appear to be
serving as a stronger bridge among members, reflecting an opportunity to
support advocacy and financing for water activities. In addition, the connectivity and centrality of the two local academic
institutions emerged as a potential indication of the network approaching
water issues through a more multi disciplinary lens.
2

Small but important shifts in network and sub-network core groups are early indicators of systemic change. The increased movement of certain organizations to or from the core of
the network across the three relationship types surveyed (information sharing, problem solving,
and coordination) may suggest that learning alliances are thinking about and bringing more diverse actors to address local WASH issues. The lowest levels of government (kebeles and
woredas, depending on the network) are better represented and more central across the core
groups in each of the four WASH networks.
Increased user participation is needed to ensure the acceptability and actionability of
the research method. The participatory approach to validating and interpreting the ONA data
with local stakeholders has worked well. Each learning alliance held a workshop and, in some cases, accompanied this session with related action planning. Local stakeholders demonstrated
understanding and appreciation of the basic outputs of the ONA tool. Looking forward, while
SWS facilitators and learning alliance members have gained a general understanding of the ONA method, the current survey generates a large volume of data that would require additional
training and orientation for local ownership. Endline survey design should consider right-sizing
data collection to meet the needs of program implementers, local stakeholders, and funders. In addition, with the end of the project approaching, the endline survey presents an opportunity
to consider implementation approaches that increase local skills for network analysis and
ownership of the research method.
3

Introduction
In Ethiopia, the Sustainable WASH Systems Learning Partnership (SWS) is using organizational
network analysis (ONA) to understand the relationships, interactions, and changes over time among WASH actors in four locations. The analysis will be used to understand progress, as well
as inform continuing SWS efforts to improve local water and sanitation service sustainability.
SWS activities are focused on rural water in the woredas (districts) of South Ari and Mile and focused on urban sanitation in the small towns of Woliso and Debre Birhan. In each of these
locations, SWS recruited organizations (NGOs, public institutions, academic institutions, and
private sector organizations) actively providing or contributing to the provision of WASH services to participate in a learning alliance. The goal of each learning alliance is to increase
collaboration and knowledge sharing among stakeholders for improved efficiency, effectiveness,
and sustainability of local WASH services. Local SWS facilitators support each learning alliance
to develop and implement specific action plans to advance identified WASH goals.
Improving the underlying structure of the network of relationships among learning alliance
participants is a critical part of the learning alliance approach, with relevance to their current effectiveness and future sustainability. To this end, LINC conducted a midterm ONA of local
WASH stakeholder organizations selected for participation in each learning alliance. The
objective of this analysis was to understand the current network of relationships among these organizations to identify strengths and opportunities and to compare the current state to the
networks that existed during the baseline analysis, which was conducted prior to formation of
the learning alliances. The midterm analysis will also be used to reflect on and inform learning alliance goals, activities, and associated relational structures. An endline analysis is planned for
FY 2021 to track further changes in each network over the life of the project.
Methodology
Design
As in the baseline ONA assessment, the midline assessment used a whole network design to
assess relationships and network structure. This design uses a roster that surveys all actors on a pre-identified list. Each respondent was asked to identify whether their organization had
interacted with any other organization in the network (i.e., on the roster) for each of the
selected relationship types. This design has the benefit of improving the completeness of the responses and reducing potential biases. Because the networks are relatively small, this design
was also feasible to implement.
This design includes actors that were on the baseline roster, as well as those that were overlooked at baseline but have been engaged by the learning alliances since. Because the
baseline survey was administered to a list of prospective learning alliance members, some
organizations from the baseline are not participating in the respective learning alliance. To the extent possible, however, the survey was administered in-person to representatives from all
organizations from the baseline lists. It also included organizations that have joined the learning
alliance but were not surveyed at baseline.
4

Generally, the same survey questionnaire was used at midline as at baseline (see midterm survey in Annex 3). Minor updates to the baseline ONA survey were made for the midterm
analysis to maximize the utility of the ONA results for the learning alliance, as well as to
streamline data collection. These changes were based on feedback from SWS learning alliance facilitators, other members of the SWS team, and learning alliance members. Changes do not
fundamentally affect the comparability between the baseline and midline. Revisions and their
justifications are listed below.
• Removal of questions to measure reporting relationships. Reporting relationships
tended to follow a clear and predictable pattern according to local government procedures. Additionally, this relationship type was determined to be less significant and
less directly related to tracking change in the learning alliances.
• Removal of functional distinctions for problem-solving support and addition of a new
strength qualifier on the effectiveness of support provided in resolving the problem. The
baseline survey asked respondents to select the type(s) of support most closely associated with any reported problem-solving request, which included: expertise; supply
of parts and equipment; permits or authorizations; studies, assessments, or other
information; and funding or financing. These data were found to not be useful, as the type of support aligned closely with each organization’s institutional mandate, and it was
determined to be more useful to understand the quality of the problem-solving
relationship.
• Addition of five coordination categories related to relevant WASH sustainability
objectives. Based on feedback from learning alliance facilitators, SWS added the five coordination categories: capacity building, community engagement, maintenance and
rehabilitation, monitoring, and service provision. These categories were added to better
understand the nature of coordination relationships and to inform how facilitators could support the development of peer-to-peer support.
• Replacement of the term “WASH” with “water” or “sanitation,” according to the
respective learning alliance mandate (i.e., “water” in Mile and South Ari and “sanitation”
in Debre Birhan and Woliso).
The relationship types, definitions, and attributes captured in the survey are listed below.
Information-sharing and problem-solving relationships were collected to allow for an analysis of
the direction in which the relationship flowed, while coordination did not have a direction.
Table 1. Relationship Types Captured in the Midterm ONA
Relationship Type Definition Attributes
Information sharing (shared or received)
Providing or receiving water or sanitation-related information in the previous 6 months outside of learning alliance meetings
Frequency (less than once a month, more than once a month); Use of information (yes, no)
Problem-solving request (made or
received)
Making or receiving a request for support to solve a water/sanitation-related problem in the
previous 6 months
Support provided (yes, no); Problem resolution status (yes, no, ongoing)
Coordination Jointly planning (with significant input) or
implementing water/sanitation-related activities
in the previous 6 months outside of learning alliance meetings
Type of activities (capacity building,
community engagement, maintenance
and rehabilitation, monitoring, service provision)
5

Data Collection
Two local enumerators were engaged to complete the data collection. These enumerators were the same individuals engaged during the baseline survey. They received a refresher
training by LINC staff on the data collection tool and tablets. Field work to collect the data was
conducted in July and August 2019. Interviews were conducted with each organization’s primary representative, as determined by the learning alliance facilitators. For cases in which an
organization has several active learning alliance representatives, enumerators scheduled and
conducted a single group interview with all individuals from the organization available during the data collection period. No notable disagreements between organizational representatives were
raised or unresolved during any midterm group interviews.
In addition to the ONA questionnaire, the data collectors conducted a brief series of open-ended questions to capture participants’ perceptions of WASH issues. Findings from this
qualitative study will be presented in a separate research report from SWS.
Data Analysis
After data collection was complete, LINC conducted an initial analysis of the data to identify
notable changes, patterns, trends, and points of potential interest in the data, including:
● Deriving network-level metrics for each relationship type. These metrics measure
attributes of the entire network, rather than any one network member (see Annex 2);
● Deriving organization-level influence metrics, which measure attributes for each actor within each relationship type (see Annex 1);
● Identifying sub-groups of closely connected organizations within the overall network;
● Visualizing the network for each relationship type; and
● Comparing patterns in these analyses for attributes, such as sector and geographic level.
The analysis was completed by exporting the raw survey data from Egoweb as a .csv file, then converting this data into network analysis formats (i.e., edge lists, node lists, and matrix formats)
using Microsoft Excel. The network data was then analyzed using a combination of software tools,
including:
● Kumu.io to generate network and sub-network maps, network-level metrics, and actor-
level metrics;
● UCINET1 to derive core/periphery analysis; and
● NodeXL to derive communities within the network using the Clauset-Newman-Moore
algorithm.2
1 This analysis simultaneously fits a core/periphery model to the data network and identifies which actors belong in the core
and which belong in the periphery. See http://www.analytictech.com/ucinet/help/a8lapo.htm for more information.
2 Using the Clauset-Newman-Moore algorithm, the NodeXL software generates clusters based on relationship data alone with
no qualitative intervention in pre-defining them. The algorithm assigns each actor to a cluster, generally grouping more densely
connected actors into clusters. These clusters are mutually exclusive and collectively exhaustive, meaning that each actor is
assigned to one cluster, with none left behind and none repeated. See https://nodexl.codeplex.com/
and https://arxiv.org/abs/cond-mat/0408187 for more information.
6

Table 2. Standard Metrics Used for Analysis
Metric Explanation Example of Metric in Context
Size (number of nodes)
The number of actors or organizations in a network. The number of organizations in a learning alliance.
Ties (number of edges)
The number of reported connections among actors. In-degree ties are ties into a given node; out-degree ties are ties out of a given node.
The number of information-sharing relationships among learning alliance members.
Density The proportion of actual ties relative to all possible ties in a network.
The proportion of coordination relationships among learning
alliance members, as a percentage of total possible coordination relationships.
Average
Distance
The average steps required to get between any two
actors in a network.
The average number of steps for
information to be shared between
any two learning alliance members.
Average
Degree
The average number of ties of actors in the network. The average number of problem-
solving relationships among all learning alliance members.
Reciprocity The extent to which directed relationships are
reciprocated.
The extent to which a learning
alliance member sharing information with another member
also receives information from that other member.
Degree
Centrality
A normalized measure of the number of unique ties a
given actor has. Serves as an indication of importance or significance of an actor for the network. This can be
separated into in-degree (for incoming ties) and out-degree (for outgoing ties) centrality for directed relationship types.
The actors with the most and
least problem-solving connections within the learning alliance.
Betweenness
Centrality
The extent to which a node acts as a bridge along the
shortest path between two other nodes.
The actors serving as important
information-sharing “go-betweens” in the learning alliance.
Closeness Centrality
A normalized measure of the distance an element is from all other elements.
The actors able to spread information to the rest of the
network most easily and with high visibility into what is happening across the network.
Stakeholder Consultation
Following an initial analysis of the data, the two small town sanitation learning alliances held an
ONA validation and feedback workshop. As part of overall efforts to support and strengthen
the learning alliance networks, this workshop included a review of the baseline and midterm network structures and relationship patterns. Because each learning alliance is implementing
their own action plan to advance sanitation goals, this workshop offered an opportunity for
7

learning alliance members to better understand the utility of their network structure with relationship to the objectives and activities of the learning alliance. During the workshop,
members reflected on their past and current structure, identified network strengths and areas
for improvement, and took steps to improve future sustainability. The workshop was well
received, with high engagement from learning alliance members.
These discussions led to the creation of action plans for the design and execution of new
community awareness campaigns on waste management. The participants used a network lens to illustrate the ideal network for execution of these campaigns. The process of working
through the network analysis and visualizing the sub-network for a specific objective
encouraged a more thoughtful discussion around the importance of relationships in sanitation systems. The workshop also provided the research team with contextual understanding of the
results, including local limitations to and opportunities for collaboration, as well as further
adaptations to the method to improve the utility of the ONA results for both learning alliance participants and facilitators. Feedback from the workshop has been incorporated into the
relevant sections of this report. Similar ONA validation and feedback workshops for the two
rural water learning alliances were held in early 2020 alongside activities to improve water
monitoring and maintenance systems.
Limitations
Turnover
The baseline was conducted with prospective learning alliance members and appointed contacts
from the respective organizations. Since the formation of the learning alliances, organizational points of contact and learning alliance attendees have, in some cases, changed for various
reasons. The turnover of individuals within an organization has been known to occur at
different levels within the different learning alliances, and interventions have been put into place to help reduce turnover and to mitigate the effects of turnover on learning alliance operations.
In cases where multiple contacts were given for an organization, the enumerators attempted to
interview all available parties together. However, across the four learning alliances, 10 prospective member organizations were not surveyed at midterm because either (1) they are
no longer operating in the learning alliance locale or (2) the given point of contact could not be
reached.
Recency Bias
Respondents were asked to indicate the organizations with whom they have had a relationship
across the previous 6 months in order to understand lasting relationship structures. This can lead to bias in accurately recalling all interactions, as individuals are more likely to cite more
interactions that have occurred recently. The research team attempted to control for this bias
by using a complete roster of organizations. Enumerators were instructed to first ask participants to select all organizations with which their organization had any WASH-related
contact over the previous 6-month period. Following the initial selection, participants were
then asked to indicate the relationship type(s) and status for each organization, which served as
a prompt for recalling events that occurred less recently.
Attribution
While the intent of this effort is to measure and understand change over time, it is important to note that network changes cannot be solely attributed to learning alliance activities for several
8

reasons. Most notably, in each of the SWS locations, other WASH development efforts and projects have been implemented since the baseline ONA was conducted, and no counterfactual
is available to assess what changes would have occurred in the absence of an intervention. In
addition, the networks analyzed here are limited to those actors identified as prospective learning alliance participants at baseline, as well as any that have been added to the groups
since. Some of the organizations identified at baseline did not join the learning alliance, no
longer participate, or no longer operate in their respective geography. As a result of these three conditions, as well as normal external influences, network changes cannot be solely
attributed to learning alliance activities. Although it is plausible that SWS interventions have
contributed to the observed changes, other research designs would be necessary to directly
attribute change.
Interpretation
As previously described, the learning alliances held or planned to hold ONA workshops to review a selection of results. In addition, LINC worked with the learning alliance facilitators and
SWS team members to solicit more detailed feedback on key findings. These processes allowed
LINC to better interpret the ONA results and discern why different relationship patterns have or have not changed since the baseline was conducted. However, given time limitations, it was
only possible to share two to three results per learning alliance with the participants for
feedback. In these cases, the results can describe what the relationship structures are, but not necessarily why these structures exist, limiting the immediate ability to present concrete
implications for action for the full set of results.
Comparability
The four Ethiopia WASH networks are distinct in their composition, structure, and learning
alliance membership. Because of this, it is difficult to make strong networking comparisons
between locations. Certain similarities and differences between the networks are observed in
the analysis but are not meant to imply more- or less-desirable network connectivity.
9
Findings
Woliso
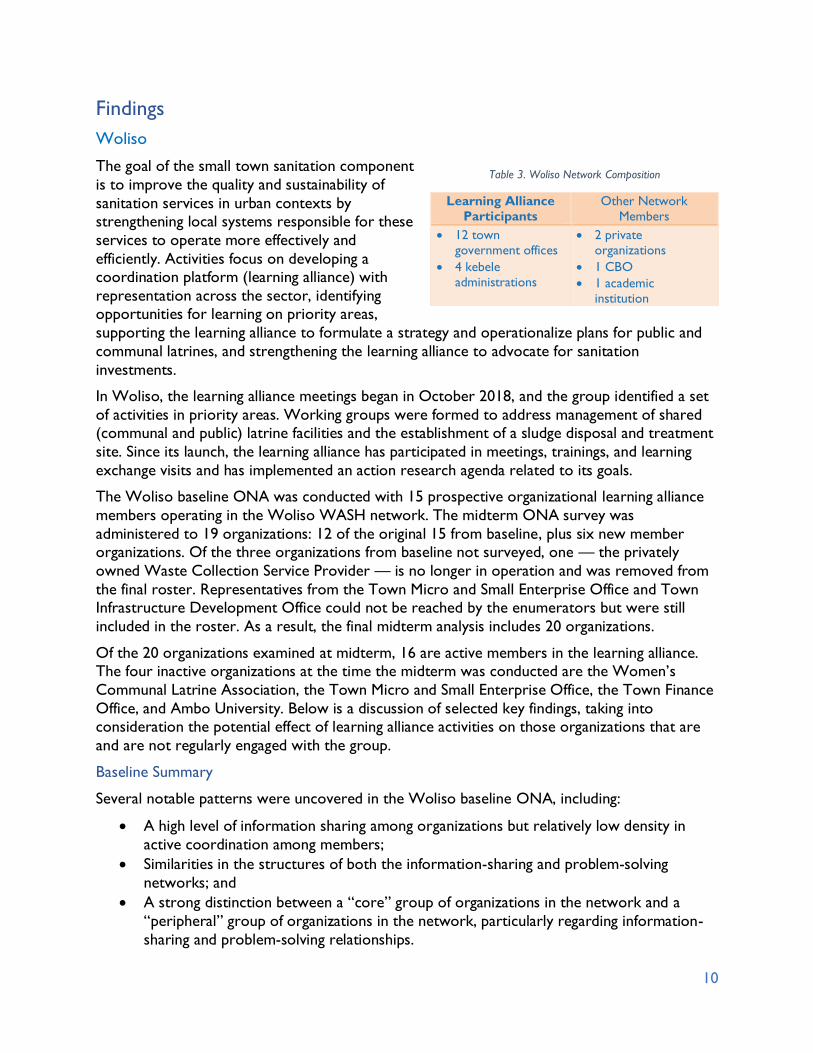
The goal of the small town sanitation component
is to improve the quality and sustainability of
sanitation services in urban contexts by strengthening local systems responsible for these
services to operate more effectively and
efficiently. Activities focus on developing a coordination platform (learning alliance) with
representation across the sector, identifying opportunities for learning on priority areas,
supporting the learning alliance to formulate a strategy and operationalize plans for public and
communal latrines, and strengthening the learning alliance to advocate for sanitation
investments.
Table 3. Woliso Network Composition
Learning Alliance Participants
Other Network Members
• 12 town government offices
• 4 kebele administrations
• 2 private organizations
• 1 CBO
• 1 academic institution
In Woliso, the learning alliance meetings began in October 2018, and the group identified a set
of activities in priority areas. Working groups were formed to address management of shared (communal and public) latrine facilities and the establishment of a sludge disposal and treatment
site. Since its launch, the learning alliance has participated in meetings, trainings, and learning
exchange visits and has implemented an action research agenda related to its goals.
The Woliso baseline ONA was conducted with 15 prospective organizational learning alliance
members operating in the Woliso WASH network. The midterm ONA survey was
administered to 19 organizations: 12 of the original 15 from baseline, plus six new member organizations. Of the three organizations from baseline not surveyed, one — the privately
owned Waste Collection Service Provider — is no longer in operation and was removed from
the final roster. Representatives from the Town Micro and Small Enterprise Office and Town Infrastructure Development Office could not be reached by the enumerators but were still
included in the roster. As a result, the final midterm analysis includes 20 organizations.
Of the 20 organizations examined at midterm, 16 are active members in the learning alliance. The four inactive organizations at the time the midterm was conducted are the Women’s
Communal Latrine Association, the Town Micro and Small Enterprise Office, the Town Finance
Office, and Ambo University. Below is a discussion of selected key findings, taking into consideration the potential effect of learning alliance activities on those organizations that are
and are not regularly engaged with the group.
Baseline Summary
Several notable patterns were uncovered in the Woliso baseline ONA, including:
• A high level of information sharing among organizations but relatively low density in
active coordination among members;
• Similarities in the structures of both the information-sharing and problem-solving
networks; and
• A strong distinction between a “core” group of organizations in the network and a
“peripheral” group of organizations in the network, particularly regarding information-
sharing and problem-solving relationships.
10

The gap between the level of information sharing and coordination was not surprising, as one would not expect all instances of information sharing to also include active coordination on
activities.3 However, the difference between these relationship levels was particularly notable in
Woliso relative to other learning alliances. It is clear from maps of the information sharing and
coordination networks that the baseline coordination network was particularly sparse.
The presence of a strong and distinct core group of stakeholders across relationship types
became clear when examining the relative density of relationships among this core group, consisting of the Town Department of Sanitation and Beautification, the Town Manager of
Municipal Services, the Water Supply and Sewage Utility, the two Kebele Administrators, and
the Town Health Extension Office.
Figure 1. Woliso Baseline Cores by Relationship Type
More specifically, this aspect of the analysis led to two conclusions by the local stakeholders: (1)
that the learning alliance should explicitly build on the existing core relationships by having a tiered structure with a core group that meets regularly and with a larger group that meets
more infrequently; and (2) that there should be a concerted effort to increase engagement with
some of the specific organizations currently in the periphery, such as the women’s association
responsible for the town communal latrine.
3 Note that the actual difference in densities under-represents the actual drop-off in relationships between information sharing
and coordination. Information sharing is directional in that information can be shared from Organization A to Organization B,
or vice versa. However, coordination does not have directionality because it must be engaged in by both organizations to exist.
Therefore, there are twice as many possible information-sharing relationships as coordination relationships, and since density is calculated as a function of the number of actual relationships relative to all possible relationships, the denominator for
information sharing is twice as large as for coordination.
11

Network Snapshot
Table 3 provides a comparative summary of basic network metrics for the Woliso sanitation
network at baseline and midterm. Network metrics should not be used as a singular determinant of changes in network strength over time. In conjunction with a more thorough
analysis of network structure, individual actor
or sub-group metrics, and additional qualitative information, the network metrics
can be used to derive general conclusions
about network strength.
Table 3. Whole of4 N etwork Metrics4
Baseline Midterm Change
Overall Network
Size 15 20 +33%
Ties 80 152 +90%
Information Sharing
Ties 68 136 +100%
Density 0.37 0.48 +30%
Average Degree 4.86 13.6 +180%
Average Distance 1.70 1.55 –9%
Reciprocity 0.77 0.49 –36%
Problem Solving
Ties 67 102 +52%
Density 0.31 0.27 –13%
Average Degree 4.27 10.20 +139%
Average Distance 1.79 1.59 –11%
Reciprocity 0.38 0.55 +45%
Coordination
Ties 31 81 +161%
Density 0.29 0.49 +69%
Average Degree 3.71 9.40 +153%
Average Distance 2.03 1.72 –15%
Reciprocity N/A N/A N/A
Overall, the network experienced substantive
increases in ties — and, as a result, average
degree — across all three relationship types. Average distance between any two actors in
the network also decreased. Density increased
in the information-sharing and coordination networks but decreased in the problem-
solving network. In contrast, reciprocity
decreased in the information-sharing network,
but increased in the problem-solving network.
Survey respondents were also asked to value
reported information-sharing and problem-solving relationships. The apparent quality of
both relationship types improved at midterm.
Although information-sharing reciprocity declined, all information received was
reported as being directly applied to the
recipient’s sanitation-related work. The success of problem-solving relationships
increased from 79 percent at baseline — prior
to formation of the learning alliance — to 87
percent at midterm.
4 Changes in the overall network size may directly influence changes in calculated network metrics. Instances where network
size may have affected certain network metrics are explained in the corresponding analysis.
12

Was requested support provided? If so, did it resolve the problem?
80%
62% Baseline
Midterm
0% 20% 40% 60% 80% 100%
Problem Solved or Support Ongoing
Problem Unsolved or Support Not Provided
Was the information received directly used?
Baseline
Midterm
0% 20% 40% 60% 80% 100%
100%
78%
Yes No
Figure 2. Value of Problem-Solving and Information-Sharing Relationships
Coordination relationships were not assigned a value. Instead, respondents were asked to
identify all relevant sanitation objectives (as determined in consultation with the learning alliance facilitators) associated with their reported coordination relationships. The most
frequently cited coordination objectives were regular service provision and community
engagement, followed by monitoring. Capacity building and maintenance and rehabilitation were
the least-cited coordination activities.
56
48
31
19
7
0
10
20
30
40
50
60
Service Community Monitoring Capacity Maintenance Provision Engagement Building and
Rehabilitation
Figure 3. Coordination Relationships by WASH Objective
Changing Network Core
At baseline, the Department of Sanitation and Beautification, the Manager of Municipal Services, the Land Administration Office, the Infrastructure Development Office, the Water Utility, and
the two kebele representatives were in the core across multiple types of relationships. Midterm
results show that organizations within the core group have shifted slightly from the baseline. The Town Municipal Services Office and the Town Department of Sanitation and Beautification
remain very central to the Woliso network and are members of the core group for each of the
13

three relationship types (information sharing, problem solving, and coordination). The four kebeles also have a consistent presence in the various sub-network cores. Kebele 01 is in the
core for all three relationship types, Kebeles 03 and 04 each appear in two of the three sub-
network cores, and Kebele 02 appears in the midterm coordination core.
One of the most significant changes is the disappearance of the Town Infrastructure
Development Office and the Town Land Administration Office from any of the sub-network
cores. Instead, at the town level, the Environmental Protection and Climate Change Authority Office is present in the core for all three relationship types. The Communications Affairs Office,
Culture and Tourism Office, and Health Office also each appear in one sub-network core each.
Information Sharing “Core”
Town Communications
Affairs Office
Kebele 01
Town Environmental
Protection and Climate Change
Town Manager of
Municipal Services
Department of Sanitation
and Beautification
Problem Solving “Core”
Coordination “Core”
Kebele 03
Kebele 04
Town Health Office
Water Supply and
Sewage Utility
Kebele 02
Town Culture and
Tourism Office
Figure 4. Woliso Midterm Cores by Relationship Type
These seemingly minor core group changes provide some of the clearest indications that systemic shifts are — even if difficult to observe with the naked eye — occurring in the
sanitation sector in Woliso. The focus of Woliso sector priorities at baseline was heavily
centered on developing new infrastructure, which is evidenced by the central positions occupied by the Infrastructure Development Office, Land Administration Office, and Water
Supply and Sewage Utility. The changes at midterm suggest an evolution of sanitation priorities
among the network members in Woliso.
It is also worth noting that the distinction between core and periphery at midterm is not quite
as strong. The density of the midterm core group is 0.73, compared to 0.90 at baseline. While there are two more organizations in the core at midterm, which may account for some of the
decrease in density, the density of the whole network (core and periphery organizations) is also
higher at midterm. The combination of a slightly higher overall network density and lower core
group density indicates increasing decentralization of the Woliso network.
14

Table 4. Woliso Baseline and Midterm Core Group Density Comparison
Baseline Midterm
All relationships among core group members 0.90 0.73
All relationships between core group and periphery members 0.46 0.54
All relationships among periphery group members5 0.27 0.21
Leveraging Kebele Influence
Closely related to the first finding, and highlighted as an observation during baseline, the
midterm ONA results further emphasize the important role that kebele administrations play in the local sanitation systems. Kebeles oversee the health extension workers who are key, front-
line actors for monitoring and promoting good sanitation and hygiene practices in their
communities. The kebele role is even more critical in the absence of regular learning alliance participation by non-governmental actors — like the Women’s Communal Latrine Association
— who have direct, day-to-day insight into sanitation sustainability issues in their communities.
Although plans were made by the group at baseline to more deliberately involve the Women’s Association and other similar actors in the learning alliance because of the critical perspective
they provide, participation from these groups is lacking. Kebeles, however, are most closely
situated — and maintain some of the only direct relationships with community service providers — making them best able to communicate the needs and experiences of local civil
society organizations, community groups, and other important local service providers and
recipients.
5 Density calculation includes “orphans,” or organizations that are not connected to any other organization in the periphery
sub-network.
15

Figure 5. Midterm Coordination Network in Woliso
As mentioned previously, the inclusion of three of the four kebele learning alliance members in
the midterm information-sharing core is also likely a reflection of their function as information
bridges between local community sanitation actors and the town-level government. Relationships between the kebeles themselves, however, are few: only Kebele 04 reported
providing information to Kebele 02 and Kebele 03. Given the kebeles’ strategic positions,
coupled with the likelihood that they have similar sanitation-related goals and experience similar sanitation-related challenges, it is worth considering whether there is the demand and interest
for more intentional approaches for information sharing among kebeles.
Figure 6. Midterm Network of All Inter-Kebele Relationships in Woliso
16

Formal Institutional Structures and Communication Channels
Formal institutional hierarchies are important structural
determinants of coordination and collaboration in Woliso.
Based on both the ONA results and discussions during the ONA workshop, the Town Manager of Municipal Services is
highly central in the network. There were sensitivities
expressed in the workshop about the need for all town-level information to flow to and operational decisions to come from
the Town Manager in Woliso. This gatekeeper function is
Closeness centrality measures the
distance each element is from all other
elements. In general, elements with high closeness can spread information to the
rest of the network most easily and
usually have high visibility into what is
happening across the network.
most obvious in the problem-solving network, where 12 of the 16 government organizations in the network (town and kebele) indicated making a request for problem-solving support to the
Town Manager in the past 6 months. Compared to the baseline, the hierarchy appears stronger
with the Town Office of Municipal Services occupying an even more central position — as can be seen in both the Office’s position in the network map, as well as in the increase in
betweenness and closeness centrality metrics — at midterm.
Figure 7. Baseline Problem-Solving Network in Woliso Figure 8. Midterm Problem-Solving Network in Woliso
The institutional hierarchy does not appear to hinder regular communication and information
sharing between other government offices at both the town and kebele level. Information-
sharing relationships (both provided and received) increased by 100 percent from 68 at baseline to 136 at midterm. Additionally, 100 percent of information received was reported as being
directly used by the recipient. However, the increases in information sharing, especially
increases in closeness centrality metrics of Woliso network members, may warrant a discussion about whether there is redundant information sharing occurring between organizations. The
quality improvements suggest that members are more aware of what information is necessary
and useful, but there may still be room for improvement to make sharing information even
17
more efficient and open, as well as inclusive of those organizations that do not regularly
participate in learning alliance meetings.
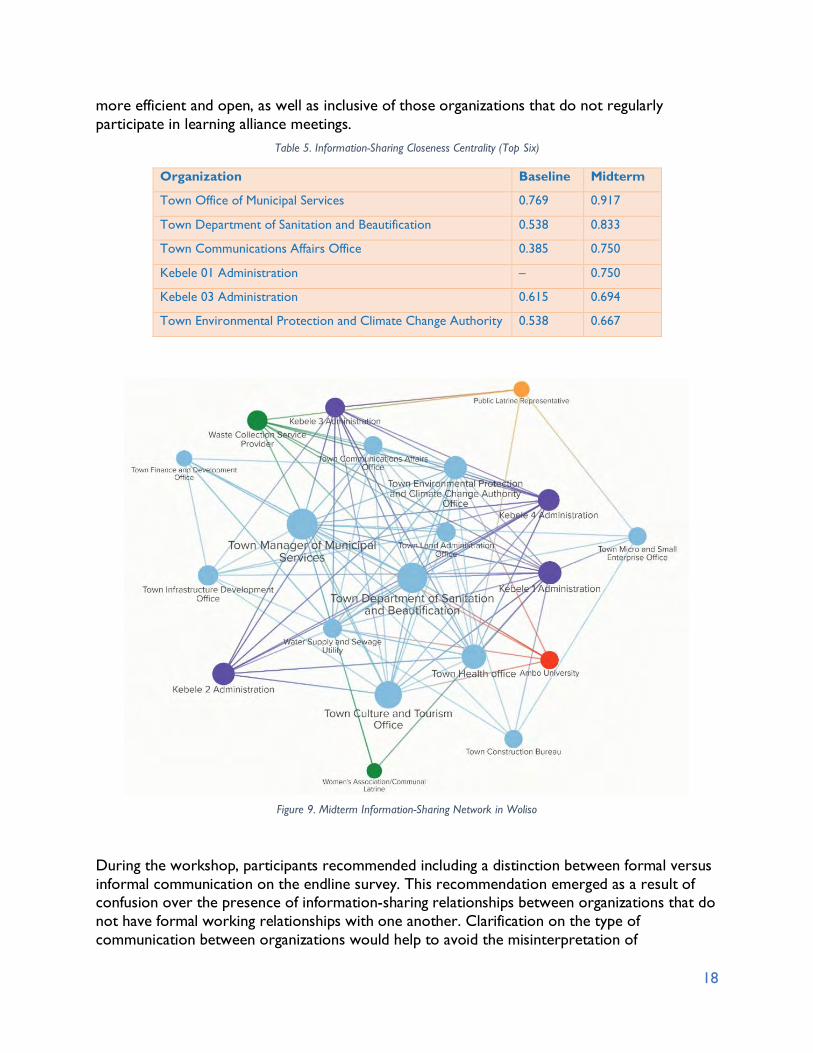
Table 5. Information-Sharing Closeness Centrality (Top Six)
Organization Baseline Midterm
Town Office of Municipal Services 0.769 0.917
Town Department of Sanitation and Beautification 0.538 0.833
Town Communications Affairs Office 0.385 0.750
Kebele 01 Administration – 0.750
Kebele 03 Administration 0.615 0.694
Town Environmental Protection and Climate Change Authority 0.538 0.667
Figure 9. Midterm Information-Sharing Network in Woliso
During the workshop, participants recommended including a distinction between formal versus
informal communication on the endline survey. This recommendation emerged as a result of confusion over the presence of information-sharing relationships between organizations that do
not have formal working relationships with one another. Clarification on the type of
communication between organizations would help to avoid the misinterpretation of
18

relationships, as well as any perception of activities occurring outside of the formal, prescribed government channels between municipal offices or departments. Offering open and transparent
opportunities for less-formal communication and collaboration — such as a WhatsApp thread
or Facebook Workplace group — may be useful for this learning alliance.
Network Strength
There are evident changes in the Woliso midterm network compared to baseline. Gross
connectivity increased across all three relationship types. Information sharing, in particular, experienced notable improvements, with network members reporting that 100 percent of
information received was directly used to inform their sanitation-related work. The number of
ties increased across all relationship types. Overall network ties increased 90 percent (80 to 152), information-sharing ties increased 100 percent (from 68 to 136), problem-solving ties
increased 52 percent (from 67 to 102), and coordination ties increased 161 percent (from 31
to 81). Quality of relationships increased, as reflected in use of information received (78 percent to 100 percent) and the support provided for problem solving (62 percent to 80
percent).
There are also small but noticeable shifts in the organizations occupying the network core. New core organizations include the kebele administrations and the Culture and Tourism Office.
In contrast, the Infrastructure Development Office and Construction Bureau that were
previously in the baseline core groups no longer appear in the Woliso sanitation core at midterm. These changes are promising when taken alongside some of the learning alliance’s
accomplishments to date, including their successful collaboration to obtain land for a fecal
sludge dumping site.
In terms of organization types, the network is quite homogenous and dominated by town-level
government offices, with only four NGOs in the network. In spite of group discussions at
baseline considering the importance of these organizations to local sanitation sustainability, none of them actively participated in the learning alliance, and they remained on the network
periphery at the time of data collection. However, following the ONA, the learning alliance
leaders realized the added value of Ambo University and Woliso Technical and Vocational
Training College and agreed to bring them on board for their next meeting.
In addition, the ONA results showed that the learning alliance structure may be reinforcing
institutional hierarchies. Specifically, the Town Office of Municipal Services is in an even more central position at midterm compared to baseline. The kebeles are also still clearly influential
and well connected to town-level offices but have not built relationships among themselves.
Follow-up after the ONA showed that kebele administrators greatly value exchanges with other urban areas, including Addis Ababa and Awassa, but demonstrate less interest in learning
from other kebeles within Woliso.
Further discussions with learning alliance members can provide better insight into these findings, including the evolving role of non-governmental actors; whether the single, highly
central actor in the network is effectively acting as a broker or a gatekeeper; and what types of
exchange are most useful to kebele administrators. In the absence of additional qualitative information, the ONA results show improvements in Woliso network strength, with
opportunities for further growth.
19

Debre Birhan
The goal of the small town sanitation
component is to improve the quality and sustainability of sanitation services in urban
contexts by strengthening local systems
responsible for these services to operate more effectively and efficiently. Activities focus on
developing a coordination platform (learning
alliance) with representation across the sector, identifying opportunities for learning on priority
areas, supporting the learning alliance to formulate a strategy and operationalize plans for public
and communal latrines, and strengthening the learning alliance to advocate for sanitation
investments.
Table 5. Debre Birhan Network Composition
woLearning Alliance Debre Birhan NetParticipants
Other Network Composition Members
• 9 town government offices
• 6 kebele administrations
• 1 academic institution
• 1 NGO
• 1 Micro, Small, and Medium Enterprise
(MSME)
• 1 CBO
rk
In Debre Birhan, learning alliance meetings began in early 2019, and the group identified a set of
activities in priority areas. These areas were improving the management of public toilets and commissioning a new municipal effluent disposal site for both fecal and industrial waste, because
the old site closed in 2018. Since its launch, the learning alliance has participated in meetings,
trainings, and learning exchange visits and has implemented an action research agenda related to
its goals.
The Debre Birhan baseline ONA was conducted with 16 prospective organizational learning
alliance members operating in the local sanitation network. The midterm ONA survey was administered to 19 organizations: 14 of the original 16 from baseline, plus five new member
organizations.6 Of the two organizations from baseline not surveyed, one is no longer in
operation. Of the 19 organizations examined, 15 actively participate in the Debre Birhan learning alliance. Debre Birhan was selected as an SWS site after baseline ONAs were
conducted for the three other SWS Ethiopia locales. Therefore, the baseline was conducted
separately in April 2018 — several months after the first three — and the learning alliance did not convene its first meeting until early 2019. Network changes in Debre Birhan thus
correspond to a shorter implementation period than Woliso, Mile, and South Ari. Below is a
discussion of selected key findings from Debre Birhan, taking into consideration the potential impact of learning alliance activities on those organizations that are and are not regularly
engaged with the group.
Baseline Summary
The baseline ONA identified the nature of the relationships among actors and several key entry
points for SWS interventions aimed at sustainability of services and gaps in stakeholder
relationships. For example, there was a clear pattern of organizations that tend to make requests and those that tend to receive requests. Requests typically flowed up from kebeles to
town-level organizations. It is also worth noting that kebele governments played a critical role
in problem solving at the community level. The ONA showed that critical stakeholders involved in the day-to-day operations and maintenance of communal and public toilets, such as vacuum
6 At baseline, the Kebele 06 Administration Office and the Kebele 06 health extension worker were treated as separate
entities. For the midterm, the administration and health extension representatives were interviewed together as one
organization: Kebele 06 Administration.
20

truck operators and public and communal latrine operators, were notably disconnected from
the network of stakeholders in the town.
The network of information-sharing relationships was characterized by strong ties among
government stakeholders, both town and kebele; the one NGO, Amanuel Development Association; and Debre Birhan University, the academic institution. For problem-solving and
coordination relationships, the two key bridging organizations were the Health Office and
Kebele 06. When these organizations were removed, the network became highly fragmented.
Network Snapshot
Table 6. Whole of Network Metrics
Baseline Midterm Change
Overall Network
Size 16 19 +19%
Ties 95 208 +119%
Information Sharing
Ties 77 142 +82%
Density 0.28 0.47 +68%
Average Degree
4.53 7.10 +57%
Average
Distance
1.72 1.38 –20%
Reciprocity 0.78 0.47 –40%
Problem Solving
Ties 71 81 +14%
Density 0.26 0.21 –19%
Average Degree
4.18 4.05 –3%
Average Distance
1.59 1.68 +6%
Reciprocity 0.48 0.48 0%
Coordination
Ties 20 78 +295%
Density 0.22 0.35 +59%
Average Degree
1.43 3.16 +121%
Average Distance
2.05 1.63 –20%
Reciprocity N/A N/A N/A
Table 6 provides a comparative summary of basic network metrics for the Debre Birhan network at
baseline and midterm. Network metrics should
not be used as a singular determinant of changes in network strength over time. In conjunction
with a more thorough analysis of network
structure, individual actor or sub-group metrics, and additional qualitative information, the network
metrics can be used to derive general conclusions
about network strength.
The Debre Birhan baseline ONA was conducted
with 16 prospective organizational learning alliance
members operating in the local WASH network. The midterm ONA survey was administered to 19
organizations. Of the organizations included, 15
actively participate in the Debre Birhan learning alliance. The organizations not actively
participating in the learning alliance at the time of
midterm data collection are Debre Birhan University, Amanuel Development Organization,
the communal latrine operator (Selassie
Orthodox Church), and the public latrine chair. One organization from the baseline not included
in the analysis — the Vacuum Truck Emptying
Company — is no longer in operation.
Debre Birhan was selected as an SWS site after
baseline ONAs were conducted for the three
other SWS Ethiopia locales. Therefore, the baseline was conducted separately in April 2018
— several months after the first three — and the
learning alliance did not convene its first meeting until early 2019. Network changes in Debre
Birhan thus correspond to a shorter
implementation period than Woliso, Mile, and South Ari.
21

Below is a discussion of selected key findings from Debre Birhan, taking into consideration the potential impact of learning alliance activities on those organizations that are and are not
regularly engaged with the group.
More relationships were reported across all three relationship types, although average degree decreased marginally in the problem-solving network. Average distance between organizations
decreased in the information-sharing and coordination networks but increased in the problem-
solving network. Density increased in the information-sharing and coordination networks and decreased in the problem-solving network. Reciprocity decreased in the information-sharing
network and remained unchanged in the problem-solving network.
Survey respondents were also asked to value any reported information-sharing and problem-solving relationships. The quality of both relationship types improved at midterm. Although
information-sharing reciprocity declined at midterm, the reported utility of information shared
improved.
Was the received information Was requested support provided? If so, did directly used? it resolve the problem?
94%
83%
Midterm
Baseline
Yes
No 94%
77%
Midterm
Baseline
Problem Solved or Support Ongoing
Problem Unsolved or Support Not Provided
0% 50% 100% 0% 50% 100%
Figure 10. Value of Information-Sharing and Problem-Solving Relationships in Debre Birhan
Respondents indicated that 94 percent of information received was directly applied to their sanitation-related work: an increase of 11 percent since baseline. The success of problem-
solving relationships also increased from 77 percent at baseline — prior to formation of the
learning alliance — to 94 percent at midterm.
22

Coordination relationships were not assigned a value. Instead, respondents were asked to identify all relevant sanitation objectives (as determined in consultation with the learning
alliance facilitators) associated with their reported coordination relationships. Community
engagement was the most frequently cited coordination objective by a significant margin, with 30 more reported relationships than the next-closest objective, service provision. Service
provision, monitoring, and capacity building were reported with similar frequency, while
coordination related to maintenance and rehabilitation was cited the fewest times by
respondents.
70 65
35 34 32
11
0
10
20
30
40
50
60
Service Community Monitoring Capacity Maintenance
Provision Engagement Building and
Rehabilitation
Figure 11. Coordination Relationships by WASH Objective
Structural Dynamics of Different Relationship Types
In Debre Birhan, the information-sharing and coordination networks exhibited similar and
significant growth rates (2.6 and 2.5 times more ties, respectively) over the period from baseline to midterm. The rather dramatic increase in information-sharing and coordination
relationships contrasts with the comparatively small increase in reported problem-solving
relationships. The number of reported relationships in the problem-solving network increased by only 17 ties (35.4 percent), most of which (n = 14) are the result of four new organizations
— three kebeles and the North Shewa Zone Administration Office — that were added to the
network after the baseline analysis was completed.
Table 7. Debre Birhan Problem-Solving Core
Baseline Midterm
Amanuel Development Organization Amanuel Development Organization
Kebele 06 Kebele 06
Kebele 02 Kebele 02
Debre Birhan Town Health Office Debre Birhan Town Health Office
Water Supply and Sewage Enterprise Water Supply and Sewage Enterprise
Kebele 03 Sanitation and Beautification Core Process
Kebele 03
23

Figure 13. Baseline Problem-Solving Network in Debre Birhan Figure 12. Midterm Problem-Solving Network in Debre Birhan
While the problem-solving network has not changed significantly, it is possible to observe how
participation in the learning alliance may have influenced the network by examining changes in
the information-sharing core from baseline to midterm. Most notably, Amanuel Development Organization is no longer in the midterm information-sharing core, though it is in both the
problem-solving and coordination core groups. However, the organization is not a current
learning alliance member. This may present an opportunity to reflect on whether there is a need to increase information sharing with Amanuel Development Organization through learning
alliance activities.
24

Figure 14. Midterm Information-Sharing Network in Debre Birhan
Table 8. Debre Birhan Information-Sharing Core
Baseline Midterm
Water Supply and Sewage Enterprise Water Supply and Sewage Enterprise
Debre Birhan Town Health Office Kebele 06
Amanuel Development Organization Kebele 02
Kebele 06 Debre Birhan Town Health Office
Sanitation and Beautification Core Process Sanitation and Beautification Core Process
Urban Land and Housing Management Office Kebele 09
Kebele 02 Kebele 03
Kebele Connectivity
Unlike Woliso, the kebele administrations in the Debre Birhan network are very well
connected. The sub-network of inter-kebele relationships has a density of 0.63, with 19 total
25

connections reported among the six kebeles participating in the Debre Birhan learning alliance. The majority of reported relationships among the kebele sub-group are information sharing (n
= 17). Two coordination relationships were also reported by Kebele 05, with Kebele 06 and
Kebele 03.
The kebele connectivity in Debre Birhan is a new development. The baseline ONA showed
only one relationship between Kebeles 02 and 03. The midterm kebele sub-network, however,
includes all six kebeles connected in a single component. While kebeles do not tend to share information with each other frequently (5 of 17 ties reported frequent information sharing),
information received was directly applied by 100 percent of reported recipients.
Figure 15. Baseline Kebele Information-Sharing Network Figure 16. Midterm Kebele Information-Sharing Network
There is an opportunity to understand what kind of information kebeles in Debre Birhan are
sharing with one another and how the learning alliance can facilitate and further support
continued engagement among this group. Additional inquiry might also provide insights into how inter-kebele connectivity can be used to improve relationships among kebeles in the
Woliso network.
Non-Governmental Actors
Although there are several non-governmental actors — including a communal latrine operator,
a public latrine chair, Debre Birhan University, and Amanuel Development Organization — in
the Debre Birhan network, these organizations were not reported as regularly participating in the Debre Birhan learning alliance at the time of data collection. Further, the only privately
owned company identified as a prospective learning alliance member at baseline — the Vacuum
Truck Emptying Company — has since gone out of business.
It is not unexpected to see that hyper-local actors like the communal and public latrine
representatives remain on the network periphery. The cross-sectoral nature of Debre Birhan
University and Amanuel Development Organization, however, makes them prime information brokers and thought partners in the network. They also have broader, multi-disciplinary
26

mandates and access to additional human and financial resources that could be better leveraged
for impact in the Debre Birhan network.
Network Strength
Connectivity in Debre Birhan increased across all three relationship types. As in Woliso, information sharing experienced the most growth, although that growth did not extend to
network members not actively participating in the learning alliance. Overall network ties
increased 119 percent (95 to 208), information-sharing ties increased 82 percent (77 to 142), problem-solving ties increased 14 percent (from 71 to 81), and coordination ties increased 295
percent (from 20 to 78). Quality of relationships increased, as reflected in use of information
received (83 percent to 94 percent) and the support provided for problem solving (77 percent
to 94 percent).
Similar to Woliso, the few non-governmental network actors are the only identified network
members that are not engaged with the learning alliance group. Among these organizations, Amanuel Development Organization and Debre Birhan University still hold influential positions
in the network — particularly related to problem-solving relationships — but have moved to
the periphery of the information-sharing and coordination sub-networks. Following the ONA data collection, learning alliance leaders devoted significant effort to engage Debre Birhan
University, which is now coordinating research and community service activities with the
learning alliance.
In addition, the ONA showed that the kebeles are significantly better connected to one
another at midterm compared to baseline. This prompted a desire among the implementation
team for further inquiry into why this was happening. Follow-up visits showed that there was a strong perception among kebele administrators that what happens in one kebele with regard to
sanitation affects the others and that they cannot succeed unless they are all achieving the same
results. As a result, if one kebele is not performing well, the other administrators apply pressure to that kebele to catch up. Kebele administrators demonstrated a healthy competition
to achieve the best local sanitation conditions and status.
Additional qualitative research and discussion with learning alliance members and other network actors is needed to understand whether and how non-governmental actors can
effectively engage with the group to mutually support their local sanitation agendas. Continued
attention to the inter-kebele relationships and how they can be supported may also be worthwhile. The ONA results on their own indicate an overall improvement in the
strength of the Debre Birhan network.
27

Mile
The goal of the Mile learning alliance is to gain a
better understanding of the woreda’s water systems and to coordinate toward achieving the Growth and
Transformation Plan II (GTPII) targets by 2020 and
Sustainable Development Goals (SDGs) in the long run where only 5 percent of rural population have
no access, as well as to gain experiences through
sharing best practices within the woreda by working
on functionality, finance, and maintenance for the schemes for sustainability services.
Table 9. Mile Network Composition
Learning Alliance Participants
Other Network Members
• 7 Mile woreda government offices
• 1 Afar region government office
• 1 town public utility
• 4 Afar region government
offices
• 3 NGOs
The objectives of the learning alliance are to promote learning and capacity building, to guide
innovation and related activities to find solutions to critical challenges in the woreda in the delivery of sustainable water services, and to share lessons learned to complement existing
coordination structures and activities. Since its launch, learning alliance activities have included
the development of a learning plan on sustainable water service delivery in the woreda; meetings to share information, experiences, and reports on progress; the development and
implementation of coordinated activities to strengthen the capacity of the woreda; and other
activities to share results and learning.
In Mile, 16 organizations were surveyed for the midterm network analysis compared to 21 at
baseline. The five organizations not surveyed at midterm were not included because they either
could not be reached or no longer operate in Mile. The learning alliance is composed of 9 of the 16 network members and includes seven woreda government offices, one regional office,
and the Town Water Utility. The seven organizations that do not participate in the learning
alliance include four regional government offices and three NGOs. Below is a discussion of selected key findings, taking into consideration the potential influence of learning alliance
activities on those organizations that are and are not regularly engaged with the group.
Baseline Summary
The baseline analysis of Mile’s network structure revealed several important characteristics of
the local water network. It was observed that woreda government offices in Mile are generally
less influential in the network than NGOs and regional government offices and that NGOs have frequent information-sharing and coordination interactions with both government offices and
other NGOs. NGOs in Mile do not, however, tend to have problem-solving relationships with
other NGOs.
The overall influence of NGOs and regional government offices, rather than woreda
government offices, in the Mile network was clearly demonstrated through an analysis of
members in the core information-sharing organizations. Of this core group, all except one were either NGOs or regional government offices. Woreda government offices, on the other hand,
were nearly all members of the network periphery, with relatively few connections among
themselves or with the core group. In general, Mile’s baseline network structure contains a more even distribution of interactions between organization types compared to South Ari and
less clustering within group types.
28

One clear area of potential beneficial structural change noted as a result of these findings was improved information sharing and coordination from NGOs and regional government offices to
woreda government offices. The level of
integration of the woreda into the core network was seen as an important indicator of the extent
to which the learning alliance contributes to a
shift in relationships that will likely improve
sustainability of water services in Mile.
Network Snapshot
Table 10 provides a comparative summary of basic network metrics for the Mile network at
baseline and midterm. Network metrics should
not be used as a singular determinant of changes in network strength over time. In conjunction
with a more thorough analysis of network
structure, individual actor, or sub-group metrics, and additional qualitative information, the
network metrics can be used to derive general
conclusions about network strength.
The midterm Mile water network has five fewer
actors (n = 16) than the baseline network (n =
21). While network members reported more coordination relationships at midterm, there are
noticeable decreases in both information-sharing
and problem-solving relationships. Average distance between any two actors in the network
decreased across all three relationship types,
while density increased across all three. Reciprocity decreased in the information-sharing
network but increased in the problem-solving
network.
Table 10. Whole of Network Metrics
Baseline Midterm Change
Overall Network
Size 21 16 –24%
Ties 117 144 +23%
Information Sharing
Ties 122 109 –11%
Density 0.29 0.45 +55%
Average Degree
5.81 6.81 +17%
Average
Distance
1.91 1.31 –31%
Reciprocity 0.76 0.68 –11%
Problem Solving
Ties 67 61 –9%
Density 0.16 0.25 +56%
Average Degree
3.19 3.81 +19%
Average Distance
2.49 1.66 –33%
Reciprocity 0.45 0.62 +38%
Coordination
Ties 62 76 +23%
Density 0.26 0.42 +62%
Average Degree
5.14 6.25 +22%
Average Distance
1.98 1.55 –22%
Reciprocity N/A N/A N/A
29

Survey respondents were also asked to value reported information-sharing and problem-solving relationships. The apparent quality of both relationship types improved at midterm. Although
information-sharing reciprocity declined at midterm, the reported utility of information shared
improved. Respondents indicated that 94 percent of information received was directly applied to their water-related work, an increase of 5 percent since baseline. The success of problem-
solving relationships also increased from 79 percent at baseline — prior to formation of the
learning alliance — to 84 percent at midterm.
Was the received information Was requested support provided? If so, did it
directly used? resolve the problem?
Baseline
94%
89% Baseline
84%
79%
Problem Solved or
Support Ongoing
Midterm Problem Unsolved
Midterm or Support Not
Provided 0% 50% 100%
Yes No 0% 50% 100%
Figure 17. Value of Information-Sharing and Problem-Solving Relationships
Coordination relationships were not assigned a value. Instead, respondents were asked to identify any relevant water objectives (as determined in consultation with the learning alliance
facilitators) associated with their reported coordination relationships. Service provision was the
most frequently cited coordination objective, followed by community engagement and monitoring. Less frequently cited was capacity building. Maintenance and rehabilitation was the
least-reported objective of mutual coordination efforts among network members.
60 56
47 44
31
19
0
10
20
30
40
50
Service Community Monitoring Capacity Maintenance
Provision Engagement Building and
Rehabilitation
Figure 18. Mile Midterm Coordination Relationships by WASH Objective
Information Sharing
Although a number of regional offices and NGOs were identified as prospective members of
the Mile learning alliance, the current membership is almost entirely woreda offices (seven out
30

of nine). One of the major gaps in the network identified at baseline was information sharing with and between the woreda government. Midterm results indicate substantial improvement in
information sharing between woreda offices in the Mile water network. The core/periphery
analysis shows that four of the eight core organizations in the midterm information-sharing sub-network are woreda offices, compared to just one at baseline. The midterm information-
sharing core is also slightly smaller, with eight identified core members (compared to 10 at
baseline) and only one NGO (compared to four at baseline).
Table 11. Mile Information-Sharing Core
Baseline Midterm
AMREF Regional Education Bureau
Save the Children CARE
UNICEF Regional Health Bureau
CARE Regional Water Resources Bureau
Pastoralist Community Development Program Woreda Finance and Economic Development Office
Regional Water Resources Bureau Woreda Health Office
Regional Financing Bureau Woreda Water, Mine and Energy Office
Regional Health Bureau Woreda Administration Office
Regional Education Bureau
Woreda Education Office
A significant gap identified in the Mile baseline network was a lack of information sharing between NGOs and woreda offices. Connectivity, however, has not improved between these
two organizational groups since baseline. To the contrary, one of the most noticeable changes
in the midterm network is the reduced connectivity and influence of NGOs.
Figure 19. Midterm Information-Sharing Network between Woreda Offices and NGOs in Mile
31

Woreda Networking
Mile is also the only location where the total number of reported problem-solving requests
declined from baseline to midterm (decreasing from 67 to 61). There are, however, more
problem-solving relationships among woreda offices in the Mile learning alliance at midterm (n = 25) compared to the baseline (n = 15). Upon closer examination, however, a majority of
midterm problem-solving requests (64 percent) were made to either the Woreda
Administration Office or the Woreda Finance and Economic Development Office. These actors are considered locally to be those with the decision-making power and resources to solve
problems.
Figure 20. Midterm Problem-Solving Network in Mile
Coordination among woreda offices also increased significantly at midterm. The intra-woreda
coordination network has a density of 57 percent. The Woreda Administration Office has
coordination relationships with every other woreda office in the network. The Woreda Administration Office does not, however, have any reported coordination relationships with
regional offices or NGOs in the network. The majority of coordination between woreda and
regional government is by offices along the same technical areas of responsibility.
32

Figure 21. Midterm Coordination Network in Mile
In Table 12 coordination relationships are broken out by geographic level to show which
organizations coordinate within and between the two geographies — woreda and region —as a
proportion of all respective coordination relationships. Shaded cells indicate high (green),
medium (orange), or low (yellow) levels of coordination.
Table 12. Midterm Coordination Network among Learning Alliance Members in Mile
Service Provision
Monitoring Maintenance Capacity Building
Community Awareness
Woreda <—> Woreda 75% 54% 21% 21% 88%
Woreda <—> Region 81% 62% 33% 71% 57%
Region <—> Region 63% 56% 15% 41% 37%
33

Administrative Level Clustering
The Mile water network appears to be distinctly divided along geographic lines. At baseline,
NGOs were identified as important geographic and sectoral bridges whose positions in the
network could be leveraged to facilitate improved coordination and information dissemination between government levels and functions. The homogeneity of the learning alliance
composition — coupled with a lack of engagement by NGOs in both the learning alliance and
the water network as a whole — may be contributing to persistent geographic clustering. While woreda-level connectivity has increased across all three relationship types, connectivity
between geographies is mostly along strict sectoral lines.
Table 13 shows the proportion of information-sharing ties between organizations at the same level (in-group) compared to the proportion of information-sharing ties with organizations
operating at a different geographic level (out-group).
Table 13. In-Group and Out-Group Information-Sharing Ties
Baseline Midterm
In-Group Out-Group In-Group Out-Group
Regional or Zonal
Government Office
16.4% 83.6% 23.7% 76.3%
Woreda Government Office
12.0% 88% 44.1% 55.9%
Non-Governmental Organization
17.7% 82.3% 11.9% 88.1%
34

Figure 22. Midterm Information-Sharing Network in Mile
Network Strength
The Mile learning alliance is the smallest and most homogenous of the four groups in Ethiopia.
There have been clear gains in networking among woreda offices, most notably in information sharing and coordination. The midterm network had five fewer actors (16 compared to 21 at
baseline) but still showed a 23 percent increase in overall ties (117 to 133). Information-sharing
ties decreased 11 percent (122 to 109) and problem-solving ties decreased 9 percent (67 to 61), but collaboration ties increased 23 percent (62 to 76). Quality of relationships increased, as
reflected in use of information received (89 percent to 94 percent) and the support provided
for problem solving (79 percent to 84 percent). Improvements in how the learning alliance members work together is reflected in the field team’s reports that members have more
successfully been working on action research in between meetings and that there is increased
uptake of monitoring and maintenance interventions.
At the same time, the ONA showed a corresponding decrease in the number of out-group ties
between woreda offices and other types of organizations in the network. Given the decrease in
problem-solving relationships since baseline, the decline in out-group ties may indicate increasing insularity of learning alliance members from the broader network. In particular, there
are decreases in connectivity between NGOs and woreda offices, which was an identified
opportunity for network growth at baseline and a potential area for continued attention moving
forward.
35

Based on the ONA alone, there is not enough evidence to say whether the Mile network has strengthened or weakened since baseline. To determine changes in
network strength, additional validation from stakeholders and contextualization is needed.
36

South Ari
The South Ari learning alliance goal is to gain a better
understanding of the woreda’s water system by coordinating toward achieving the GTPII targets by
2020 and the SDGs in the long run, where 0 percent
coverage is no longer acceptable, by gaining experiences through sharing best practices within the woreda and
from other woredas in the zone, and by working on
functionality, finance, and maintenance for the schemes for sustainability of services.
Table 14. South Ari Network Composition
Learning Alliance Participants
• 8 woreda government offices
• 7 South Omo zone government offices
• 2 town public water utilities
• 2 academic institutions
• 1 NGO
• 1 CBO
The objectives of the learning alliance are to promote learning and capacity building, to guide
innovation and related activities to find solutions to critical challenges in the woreda in the
delivery of sustainable water services, and to share lessons learned to complement existing coordination structures and activities. Since its launch, learning alliance activities have included
the development of a learning plan on sustainable water service delivery in the woreda;
meetings to share information, experiences, and reports on progress; development and implementation of coordinated activities to strengthen the capacity of the woreda; and other
activities to share results and learning.
The structure of the South Ari learning alliance is slightly different from the other three. Based on significant geographic clustering observed at baseline and subsequent stakeholder feedback
reinforcing the tendency for organizations to interact within rather than between geographies,
two learning alliances were created in South Ari: one at the woreda level and one at the zone level. The woreda and zone Water Offices are the only two organizations with dual learning
alliance membership to act as brokers between their respective networks.
In South Ari, 21 organizations (11 zone learning alliance members and 10 woreda members) were surveyed at midterm, compared to 22 at baseline.7 The final roster of 21 includes two
new organizations — the Woreda Microfinance Enterprise and the Arkisha Kebele Federation
head — and excludes three organizations from the baseline that are no longer operating in the South Ari water network: AMREF, Catholic Development, and South Omo Development
Association. Below is a discussion of selected key findings, taking into consideration the
potential influence of learning alliance activities on those organizations that are and are not
regularly engaged with the group.
Baseline Summary
Key findings from the South Ari baseline ONA centered on the influence of geography on organizations’ relationships and the role of NGOs in the network. Specifically, government
offices tend to have much greater engagement on water issues with other offices at the same
geographic level — in other words, woreda offices tend to engage with other woreda offices, and zone offices tend to engage with other zone offices. This clustering within geographic levels
is a stronger structural feature in South Ari than in the other learning alliances, which have
structures more strongly defined by overall core and peripheral sets of organizations that each
7 This includes two new organizations added by IRC at midterm and four organizations that were removed from the baseline
analysis that either no longer exist or could not be reached.
37

include organizations from different geographic levels.8 As for NGOs, they tend to engage on water issues with both woreda and zone government offices, but there is very little engagement
among the NGOs in the network. The veracity and significance of this gap was discussed during
the South Ari learning alliance kickoff meeting and represents an area of potential value-add for
the learning alliance.
The significant clustering of organizational engagement within geographic levels was present
across relationship types. For example, a community detection technique that identifies clusters of densely connected actors in a network9 revealed that the largest cluster in the information-
sharing network consists almost entirely of zone government offices, with woreda government
offices, NGOs, and town-level government offices creating two other clusters.
The specific role of NGOs in the network was seen as a clear and actionable gap for the
learning alliance platform to fill. In the initial stakeholder interviews conducted during the
research design process, NGO representatives stated that water coordination mechanisms only exist during emergencies, and there is no standing platform for water engagement among
NGOs. At the same time, these representatives pointed out that they do in fact coordinate
their efforts with both woreda and zone-level government offices. The network analysis clearly illustrates this point, with NGOs tending to have significant engagement points with
government offices across all relationship types but very few engagement points with one
another.
8 One test of the strength of an overall core and peripheral group of stakeholders as a salient structural feature of the network
is the correlation of core/periphery class membership, which correlates actual core/periphery scores with the ideal scores of a
“1” for every core member and a “0” for actors in the periphery (see http://www.analytictech.com/ucinet/help/1gl1dj.htm). For information-sharing relationships, this correlation for South Ari is 0.5985, for Mille is 0.6964, and for Woliso is 0.866.
9 This analysis uses the Clauset-Newmann-Moore community detection technique in NodeXL.
38

Table 14. Whole of Network Metrics
Baseline Midterm Change
Overall Network
Size 22 21 –5%
Ties 148 229 +55%
Information Sharing
Ties 143 200 +40%
Density 0.31 0.48 +55%
Average
Degree
6.50 9.52 +46%
Average Distance
1.78 1.32 –26%
Reciprocity 0.87 0.70 –20%
Problem Solving
Ties 93 127 +37%
Density 0.20 0.30 +50%
Average
Degree
4.23 6.05 +43%
Average
Distance
2.16 1.53 –29%
Reciprocity 0.56 0.60 +7%
Coordination
Ties 87 104 +20%
Density 0.28 0.37 +32%
Average
Degree
3.78 4.95 +31%
Average
Distance
1.88 1.60 –15%
Reciprocity N/A N/A N/A
Network Snapshot
Table 14 provides a comparative summary of
basic network metrics for the South Ari water
network at baseline and midterm. Network metrics should not be used as a singular
determinant of changes in network strength
over time. In conjunction with a more thorough analysis of network structure,
individual actor, or sub-group metrics, and
additional qualitative information, the network metrics can be used to derive general
conclusions about network strength.
The midterm water network in South Ari contains two fewer organizations (n = 21) than
the baseline network (n = 23). At midterm,
more relationships were reported across all three relationship types. Average distance
between organizations decreased across all
three sub-networks. Density increased in each of the three sub-networks. Reciprocity
decreased in the information-sharing network
but increased in the problem-solving network.
Survey respondents were also asked to value
any reported information-sharing and problem-
solving relationships. The quality of both relationship types improved at midterm.
Although information-sharing reciprocity
declined at midterm, the reported utility of information shared improved. Respondents
indicated that 83 percent of information
received was directly applied to their water-related work — an increase of 10 percent since
baseline. The success of problem-solving
relationships also increased from 62 percent at baseline — prior to formation of the learning
alliance — to 80 percent at midterm.
39

Was the received information Was requested support provided? If so, did it
directly used? resolve the problem?
Baseline
83%
73% Problem Solved or
Support Ongoing Baseline
Midterm
80%
62%
Problem Unsolved Midterm or Support Not
0% 50% 100% Provided
Yes No 0% 50% 100%
Figure 23. Value of Information-Sharing and Problem-Solving Relationships
Coordination relationships were not assigned a value. Instead, respondents were asked to
identify all relevant water objectives (as determined in consultation with the learning alliance facilitators) associated with their reported coordination relationships. In South Ari, service
provision was the most frequently cited coordination objective, with 28 more reported ties
than the second most-frequent water coordination objective: community engagement. Coordination related to monitoring and capacity building were reported with similar frequency.
Maintenance and rehabilitation was the least-cited coordination objective.
81
53
38 33
23
0
10
20
30
40
50
60
70
80
90
Service Community Monitoring Capacity Maintenance
Provision Engagement Building and
Rehabilitation
Figure 24. Coordination Relationships by WASH Objective
NGOs
The two academic institutions in the South Ari water network — Jinka University and Jinka
TVET — bridge the zone and woreda learning alliances. Jinka University, in particular, is
connected to five of eight woreda offices and all seven zone government offices in the network. Jinka TVET is predominately connected to zone offices but also has reported connections to
the Woreda Administration Office and the Woreda Water, Mine and Energy Office. At
baseline, NGOs very clearly bridged the two geographies (zone and woreda). However, with the exit of all but one NGO from the network after completion of the baseline, the two
40

academic institutions have subsequently filled the former position of NGOs as bridge actors in
South Ari.
Figure 25. Midterm Network of Direct Connections to Academic Institutions (Jinka University, Jinka TVET) in South Ari
Betweenness centrality
measures how many times an
element lies on the shortest path between two other elements. In general, elements with high
betweenness have more control over the flow of information and
act as key bridges within the
network. They can also be potential single points of failure.
The International Rescue Committee (USAID Lowland WASH Activity) is the only NGO in the South Ari midterm
network. The organization participates in the zonal learning
alliance but appears fairly central to the overall network, with connections spanning both geographies. As a temporary
(or project-based) actor in a central network position, the
International Rescue Committee’s centrality metrics show that the organization is well positioned given its role in the
network. High closeness centrality (n = 0.850) indicates the
organization’s ability to coordinate and spread information quickly, and its lower betweenness centrality (n = 0.020)
indicates a lack of network reliance on the organization, which is important in the event that
the International Rescue Committee exits South Ari once the USAID Lowland WASH Activity
concludes.
Administrative-Level Clustering
Because of the geographic distinction made between the two South Ari learning alliances, relationship changes and patterns in the midterm South Ari water network are similar in nature
to those observed in Mile. Coordination and problem-solving relationships between
administrative levels (woreda and zone) tend to be along departmental lines. The Administration, Education, and Finance Offices — which have cross-sectoral mandates — are
exceptions to this observation. The other sectoral-specific woreda offices only report zone-
41

level relationships with their direct zone office counterpart (e.g., at the zone level, the Woreda
Agriculture Office is only connected to the Zone Agriculture Office).
Figure 26. Midterm Network of Relationships between Woreda and Zone Government Offices
The geographic network of all midterm relationships reported from woreda government to
zone government clusters determined at baseline are virtually identical at midterm. The only difference is elimination of the third baseline cluster that consisted of the three NGOs no
longer active in the network and Jinka TVET, which — in addition to Jinka University — now
belongs to the first cluster, comprised of all the zone-level learning alliance members. The two
clusters perfectly mirror the membership of the two South Ari learning alliances.
42

Cluster Cluster
Figure 27. Midterm Network Clusters in South Ari
Table 3 Midterm Network Clusters in South Ari
Cluster 1 Cluster 2
Jinka University Gazer Town Water Utility
Jinka Town Water Utility Woreda Microfinance Enterprise
Zone Water, Mine and Energy Department Arkisha Kebele Federation Head
Jinka TVETC Woreda Water, Mine and Energy Office
Zone Health Department Woreda Finance and Economic Development Office
Zone Finance and Economic Development Department Woreda Women and Children Affairs Office
Zone Women and Children Affairs Department Woreda Agriculture and Natural Resource Office
Zone Education Department Woreda Administration Office
Zone Administration Office Woreda Health Office
International Rescue Committee/USAID Lowland
WASH
Zone Agriculture and Natural Resource Department Woreda Education Office
43

Positionality of the Water, Mine and Energy Offices
The zone and woreda Water, Mine and Energy Offices each hold dual membership in the two
South Ari learning alliances in an effort to ensure effective and efficient information
dissemination between the two geographies. The comparative centrality metrics for the two offices, however, make it difficult to discern the utility of their participation in both learning
alliances with regard to strategic information sharing. Betweenness centrality for both offices
has declined, which may be the result of more overall connectivity in the network at both geographic levels but may also indicate that the water offices are not the most strategically
positioned in the network to bridge the two groups. In contrast, the closeness centrality for
both organizations increased. Again, this is likely indicative of an increase in overall network connectivity and information sharing. However, closeness values of other organizations in the
network — specifically the Zone Finance Office and the Woreda Administration Office —
increased by more significant margins to surpass both water offices. Both finance offices are also the only two organizations to experience increases in their betweenness centrality metrics
since baseline.
Table 16. Information-Sharing Centrality
Organization Betweenness Centrality Closeness Centrality
Baseline Midterm Baseline Midterm
Woreda Water, Mine
and Energy Office 0.189 0.111 0.700 0.850
Zone Water, Mine and
Energy Office 0.137 0.067 0.700 0.800
Woreda Administration Office
0.054 0.039 0.600 0.825
Zone Administration Office
0.093 0.047 0.636 0.750
Woreda Finance and Development Office
0.005 0.031 0.538 0.775
Zone Finance and
Development Office 0.013 0.030 0.568 0.925
Jinka University – 0.047 – 0.775
Network Strength
Overall connectivity among learning alliance members has improved in both South Ari learning alliances though it remains primarily along departmental lines. The midterm network had two
fewer actors (21 compared to 23 at baseline) but still showed a 55 percent increase in overall ties (148 to 229). Information-sharing ties increased 40 percent (143 to 200), problem-solving
ties increased 37 percent (93 to 127), and collaboration ties increased 20 percent (87 to 104).
Quality of relationships increased, as reflected in use of information received (73 percent to 83 percent) and the support provided for problem solving (62 percent to 80 percent). Improved
coordination in the learning alliance is also supported by field team reports showing that follow-
up between meetings is progressing and that the recruitment of a local facilitator based in Jinka
44

has helped with this process. The field team also reports increased continuity in the members
who participate in the meetings.
The ONA showed that the finance offices are among only a few organizations with
geographically diverse ego networks, and both appear influential in their respective learning alliances. The inclusion and integration of the two local government funding units is likely
important for effectively advocating for more financial resources to support water activities
and, as a result, the sustainability of the learning alliance itself. For example, the field team reports that the Woreda Water Office and Rural Job Creation and Microfinance Office formed
a committee to establish spare parts supply and maintenance service enterprises.
The full participation and importance of academic institutions is also unique to the South Ari learning alliances. The connectivity and centrality of the two local academic institutions —
especially that of Jinka University — may be an indication of network movement toward
approaching water issues through a more critical, multi-disciplinary lens. While further qualitative information is needed to confirm the reasons for and effect of the positionality of the
finance offices and academic institutions, the ONA results indicate improvements in
network strength since baseline.
45

Conclusions
Each of the learning alliances is unique in both organizational composition and objectives. There
are, however, a number of similar, cross-network conclusions that can be drawn from the
analyses.
Overall connectivity increased across the four learning alliance locations, with the
greatest gains made in information sharing. Although there have been increases across
relationship types in each of the four locations, information sharing increased most substantially
from baseline to midterm. The increases occurred most significantly among learning alliance
members, with less relationship growth among those network members that do not participate in the groups. Reported quality of information received — as measured by whether information
was used directly to inform the recipient’s WASH activities — also improved in all four
networks. Based on the rapid rise in information sharing, it is worth considering whether there are any efficiencies the group can incorporate to enhance sharing and dissemination practices
and reach. This also includes identifying communication strategies to more effectively engage
with other organizations that have important roles in the WASH network but that cannot or
do not need to have full membership in the learning alliance.
Coordination between network members is most commonly associated with basic
service provision and community engagement. Across all four learning alliances, the types of
coordination reported among members follows a similar pattern. The types of coordination cited most frequently were service provision and community engagement, followed by
monitoring. Those cited the least by respondents were capacity building and maintenance.
Given the action research agendas of the learning alliances focused on improving WASH system monitoring and maintenance, this finding is an important one for facilitators to consider as the
project enters its final year of implementation.
The trends in coordination from the ONA — especially the considerably lower levels of coordination associated with the learning alliance’s technical objectives — do not necessarily
imply areas of particular strength or weakness within the groups. For example, there may only
be a select few organizations with operational mandates to conduct WASH maintenance and monitoring, whereas supporting community engagement and awareness is the responsibility —
to varying degrees — of many organizations in the network. Thus, additional inquiry and follow-
up discussions with learning alliance members are necessary to shed more light on the coordination results and their implications for progress toward greater WASH system
sustainability.
Non-governmental actors identified as important WASH stakeholders at baseline have
not been actively engaged in the learning alliances. The majority of NGOs and INGOs
identified as prospective learning alliance members opted to not engage in their respective
WASH learning alliances. Based on the survey results, this lack of participation is contributing
to reduced influence of NGOs in their local WASH networks. Identified CBOs, academic institutions, and private-sector actors also tend to remain on the network peripheries and have
low levels of engagement with the learning alliances. Only in South Ari do academic institutions
appear central to the WASH network.
Each of these non-governmental stakeholders was identified at baseline because of their
important and unique perspective on understanding and addressing local WASH sustainability
46

issues. In addition to adding diverse perspectives, non-governmental actors also have the potential to provide access to diversified resources — human, financial, or otherwise — that
can be leveraged to support local WASH initiatives. That said, the list of non-governmental
actors identified in each network remains quite small. Efforts to engage a more diverse stakeholder group should also include a more comprehensive landscape assessment of
additional private, academic, and civil society stakeholders that significantly affect or are affected
by the local WASH system. Determining how to best facilitate improved participation by known organizations, as well as identification of additional network actors, is important for
developing improved awareness, local buy-in, and sustainability of WASH initiatives.
Small but important shifts in network and sub-network core groups are early indicators
of systemic change. The increased movement of certain organizations to or from the core of
the network across the three relationship types surveyed (information sharing, problem solving,
and coordination) may suggest that learning alliances are thinking about and bringing more
diverse actors to address local WASH issues. The lowest levels of government (kebeles and woredas, depending on the network) are better represented and more central across the core
groups in each of the four WASH networks.
In the small town sanitation learning alliances (Woliso and Debre Birhan), shifts in centrality among the town-level government offices may also demonstrate shifting priorities in the groups.
The movement of organizations associated with physical infrastructure development toward the
periphery and the movement of more socially oriented offices (like the Office of Culture and Tourism) and the lowest levels of government toward the center may indicate shifting sectoral
prioritization from new construction to longer-term, but less cost-intensive, changes to social
and behavioral structures underpinning the system.
In South Ari, the two local academic institutions have taken on central positions in the network.
In contrast to Debre Birhan and Woliso, the zone and woreda Finance Offices also hold
influential positions in their respective learning alliances. These organizations do not hold the network together, and their removal from the network would not create overwhelming
structural change. However, their levels of connectivity and positioning may be indicative of
increasing network value on addressing WASH issues with more systemic, multi-disciplinary
thinking and a commitment to securing the necessary resources to do so.
Lessons Learned
Increased user participation is needed to ensure the acceptability and actionability of the
research. The ONA would have benefited from increased engagement at the local level, as part
of both the design and the analysis. Local engagement is critical to the validity of the findings, as well as to promoting use of the research findings. However, this level of engagement requires a
level of familiarity and basic training on network analysis to understand what can and cannot be
measured with the method and to understand the data required to do so.
SWS facilitators and learning alliance members have gained a general understanding of the ONA
method through individual consultations and through the ONA workshops. During these
workshops, learning alliance members were able to quickly understand and discuss the midterm results with limited methodological clarification required. The ONA visuals are a particular
47

asset of the method that allow an audience to more easily orient themselves around and engage
with results.
However, the current survey generates a large volume of data, and feedback from the learning
alliance members and facilitators indicates that the survey tool could be simplified further. Attributional granularity — like category of coordination — adds a level of complication to the
interpretation of results with the survey participants that can be more effectively and accurately
assessed with accompanying qualitative research. Simplifying the questions to include only the basic relationship type and strength qualifier (if applicable), coupled with a greater level of
engagement with stakeholders in the design and interpretation process, will contribute to local
ownership of the process.
Endline design should consider right-sizing data collection to meet the needs of program
implementers, local stakeholders, and funders. In addition, with the end of the project
approaching, the endline presents an opportunity to consider implementation approaches that increase local ownership of the research method. Examples from both the SWS project and
other activities in low-resource settings have shown that local partners can lead their own
analyses with the appropriate support and coaching.
Measuring changes in the networks over t ime requires additional research. ONA is a
valuable approach to assess relational and structural changes over time, even in populations as small and homogenous as the current Ethiopia WASH networks. The comparative baseline and
midterm ONAs have clearly shown changes in each of the WASH networks. However, if the
learning alliances are not planning to increase engagement with the current list of non-governmental actors in the network and/or identify additional and more-diverse network
members, it is unlikely that continued and substantive changes in networking structures will
occur. If this is the case, adaptations to the endline network analysis may be appropriate. Further, in order to best interpret the changes over time, additional research methods should
be integrated. These may include qualitative data collection, enhanced stakeholder validation,
and triangulation with other project data sources.
48

Annex I: Baseline-Midterm Ego-Network Metrics
Woliso
Baseline Midterm
Organization Problem
Solving In-
Degree
Closeness
Centrality
Information
Sharing
Betweenness
Centrality
Coordination
Closeness
Centrality
Problem
Solving In-
Degree
Closeness
Centrality
Information
Sharing
Betweenness
Centrality
Coordination
Closeness
Centrality
Town Department of
Sanitation and
Beautification
0.519 0.258 0.692 0.868 0.093 0.895
Women's
Association/Communal
Latrine
0.2 0 0 0.526 0 0.465
Waste Collection
Service Provider 0.2 0 0.577 0.570 0.009 0.605
Town Land
Administration Office
0.538 0 0.718 0.675 0.029 0.658
Town Municipal
Services Office 0.737 0.194 0.846 0.921 0.165 0.921
Town Finance and
Development Office
0.609 0 0.481 0.570 0.004 0.535
Town Environmental
Protection and
Climate Change
Authority Office
0.5 0.008 0.564 0.737 0.038 0.728
Water Supply and
Sewage Utility 0.636 0.132 0.526 0.763 0.086 0.649
Kebele 03
Administration
0.538 0.088 0.577 0.684 0.053 0.649
Town Health
Extension Office 0.636 0.016 0.494 0.649 0.077 0.763
Town Infrastructure
Development Office
0.737 0.003 0.641 0.596 0.006 0.632
Town
Communications
Affairs Office
0.412 0.004 0.679 0.658 0.011 0.640
Town Micro and Small
Enterprise Office
0.212 0 0.442 0.570 0.020 0.596
Kebele 02
Administration
0.519 0.06 0.577 0.649 0.003 0.667
Town Culture and
Tourism Office
– – – 0.623 0.068 0.842
Public Latrine
Representative
– – – 0.421 0.072 0.465
49

Baseline Midterm
Organization Problem
Solving In-
Information
Sharing
Coordination
Closeness
Problem
Solving In-
Information
Sharing
Coordination
Closeness
Degree Betweenness Centrality Degree Betweenness Centrality
Closeness Centrality Closeness Centrality
Centrality Centrality
Ambo University – – – 0.623 0 0.588
Kebele 04
Administration
– – – 0.640 0.008 0.667
Kebele 01
Administration – – – 0.781 0.039 0.816
Town Construction
Bureau
– – – 0.596 0.037 0.623
50

Debre Birhan
Baseline Midterm
Organization Problem
Solving In-
Degree
Closeness
Centrality
Information
Sharing
Betweenness
Centrality
Coordination
Closeness
Centrality
Problem
Solving In-
Degree
Closeness
Centrality
Information
Sharing
Betweenness
Centrality
Coordination
Closeness
Centrality
Water Supply
and Sewage
Enterprise
0.646 0.245 0.469 0.329 0.201 0.620
Health Office 0.781 0.195 0.563 0.463 0.174 0.574
Kebele 06 0.740 0.151 0.615 0 0.086 0.435
Amanuel Development
Organization
0.677 0.089 0.510 0.639 0 0.676
Urban Land and
Housing Management
Office
0.646 0.076 0.521 0.343 0.024 0.519
Kebele 02 0.781 0.074 0.333 0.315 0.003 0.491
Sanitation and Beautification
Core Process
0.615 0.065 0.469 0.417
0.185
0.560
Debre Berhan
University
0.573 0.031 0.370 0.281 0.187 0.514
Sustainable
Environmental
Protection Land
and Construction Management
Core Process
0.688 0.011 0.375 0.500 0.084 0.435
Housing
Development
Core Process
0.656 0.005 0.422 – – –
Health Extension
Office (Kebele
06)
0.583 0.004 0.370 – – –
Finance and Local
Economic
Development
Office
0.552 0.003 0.396 0 0.001 0.398
Trade and
Industry Office 0.510 0.003 0 0.343 0.007 0.477
Kebele 03 0.677 0.001 0.396 0.287 0.058 0.435
Public Latrine
Operator
0 0 0 0 0 0.375
Communal
Latrine Operator
0.505 0 0.370 0.315 0 0.331
51

Baseline Midterm
Organization Problem
Solving In-
Degree
Closeness
Centrality
Information
Sharing
Betweenness
Centrality
Coordination
Closeness
Centrality
Problem
Solving In-
Degree
Closeness
Centrality
Information
Sharing
Betweenness
Centrality
Coordination
Closeness
Centrality
(Selassie
Orthodox
Church)
Vacuum Truck
Emptying
Company
0.432 0 0 – – –
Kebele 07 – – – 0.398 0.035 0.602
Kebele 05 – – – 0 0.108 0.565
Kebele 09 – – – 0.284 0.237 0.435
Culture and
Tourism Office
– – – 0 0.063 0.505
North Shewa
Zone Land
Administration
and Use
– – – 0.398 0.081 0.616
52

Mile
Baseline Midterm
Organization Problem
Solving In-
Degree
Closeness
Centrality
Information
Sharing
Betweenness
Centrality
Coordinati
on
Closeness
Centrality
Problem
Solving In-
Degree
Closeness
Centrality
Informatio
n Sharing
Betweenne
ss
Centrality
Coordination
Closeness
Centrality
Pastoralist Community
Development Program
0.253 0.288 0.667 – – –
Regional Health Bureau 0.377 0.101 0.645 0.222 0.096 0.756
Regional Water
Resource Bureau 0.526 0.092 0.667 0.267 0.141 0.700
Woreda Water Office 0.333 0.091 0.465 0.500 0.143 0.656
CARE Ethiopia 0.444 0.086 0.606 0.222 0.073 0.778
AMREF 0.417 0.083 0.513 0.222 0 0.494
Regional Finance and
Economic
Development Bureau
0.455 0.048 0.455 0 0.014 0.611
Save the Children 0.417 0.045 0.5 – – –
Woreda Education
Office
0.256 0.043 0.571 0.467 0.013 0.369
Regional Education
Bureau 0.317 0.024 0.526 0.300 0.055 0.539
Woreda Finance and
Economic
Development Office
0.143 0.023 0.435 0.356 0.129 0.722
Pastoralist and
Agriculture Bureau
0.313 0.009 0.488 0 0.011 0.450
UNICEF 0.426 0.008 0.476 0.178 0.021 0.494
Woreda
Administration Office 0.282 0.006 0.426 0.456 0.108 0.678
Lay Volunteers
International
Association (LVIA)
0.143 0.004 0.5 – – –
Woreda Health Office 0.328 0.002 0.541 0.422 0.093 0.800
Mile Town Water
Utility
0.333 0.001 0.323 0.444 0.006 0.589
Woreda Pastoralist
Development Office 0.364 0 0.5 0.361 0.017 0.483
Woreda Women and
Children Affairs Office
0.351 0 0.426 0.389 0.016 0.633
Afar Community
Initiative Sustainable
Development
Association
0.25 0 0.4 – – –
53

Baseline Midterm
Organization Problem
Solving In-
Degree
Closeness
Centrality
Information
Sharing
Betweenness
Centrality
Coordinati
on
Closeness
Centrality
Problem
Solving In-
Degree
Closeness
Centrality
Informatio
n Sharing
Betweenne
ss
Centrality
Coordination
Closeness
Centrality
Semera University 0.345 0 0.351 – – –
54

South Ari
Baseline Midterm
Organization Problem
Solving In-
Degree
Closeness
Centrality
Information
Sharing
Betweenness
Centrality
Coordination
Closeness
Centrality
Problem
Solving In-
Degree
Closeness
Centrality
Information
Sharing
Betweenness
Centrality
Coordination
Closeness
Centrality
AMREF 0.568 0.058 0.568 – – –
Catholic
Development
0.457 0.011 0.6 – – –
Gazer Town Water
Utility 0.368 0.004 0.42 0.533 0.068 0.617
International Rescue
Committee
0.618 0.053 0.568 0.621 0.005 0.658
Jinka Town Water
Utility
0.477 0.053 0.412 0.493 0.043 0.563
Jinka TVETC 0.42 0 0.438 0.427 0 0.512
Save the Children 0.488 0.015 0.525 – – –
South Omo
Development
Association
0.429 0.002 0.488 – – –
Woreda
Administration
Office
0.477 0.054 0.568 0.433 0.054 0.492
Woreda Agriculture and Natural
Resource office
0.368 0 0.447 0.554 0.031 0.725
Woreda Education
Office
0.447 0.011 0.525 0.550 0.065 0.650
Woreda Finance and
Economic
Development Office
0.568 0.005 0.568 0.400 0.048 0.567
Woreda Health
Office
0.525 0.049 0.553 0.493 0.143 0.700
Woreda
Microfinance
Enterprise
– – – 0.318 0 0.360
Woreda Water,
Mine and Energy
office
0.568 0.189 0.7 0.508 0.208 0.504
Woreda Women and Children Affairs
office
0.389 0.008 0.467 0.439 0.023 0.692
Zone
Administration
Office
0.457 0.093 0.583 0.377 0.084 0.438
55

Baseline Midterm
Organization Problem
Solving In-
Degree
Closeness
Centrality
Information
Sharing
Betweenness
Centrality
Coordination
Closeness
Centrality
Problem
Solving In-
Degree
Closeness
Centrality
Information
Sharing
Betweenness
Centrality
Coordination
Closeness
Centrality
Zone Agriculture
and Natural
Resource
Department
0.382 0.012 0.538 0.418 0.016 0.347
Zone Education
Department
0.382 0.012 0.553 0.600 0.031 0.683
Zone Finance and Economic
Development
Department
0.568 0.013 0.656 0.683 0.047 0.733
Zone Health
Department
0.488 0.058 0.6 0.487 0.011 0.487
Zone Water, Mine
and Energy
Department
0.618 0.137 0.677 0.492 0.071 0.525
Zone Women and
Children Affairs
Department
0.42 0.01 0.5 0.452 0.023 0.508
56

Annex II: Midterm Relationship Statistics (Relationship Type)
Woliso
Baseline Midterm Change
Information Provided
Rarely (less than
once per month) 24 (52%) 79 (63%) 55 (+229%)
Frequently (more than once per
month)
22 (48%) 46 (37%) 24 (+109%)
Information Received
Used information 32 (78%) 84 (100%) 52 (+163%)
Did not use
information
9 (22%) 0 (0%) N/A
Problem Solving Requested
Problem resolved or
support ongoing
32 (71%) 74 (89%) 42 (+131%)
Problem unresolved
or support not
provided
13 (29%) 9 (11%) −4 (−31%)
Problem-Solving Relationships
(Requests Made
and Received)
Agreement on Problem-Solving
Relationship
Agreement on Problem-Solving
Status
102 58 (57%) 31 (53%)
Coordination
Relationships
Agreement on
Coordination
Relationship
94 52 (55%)
Service
Provision
Maintenance
and
Rehabilitation
Monitoring Capacity
Building
Community
Engagement
56 (60%) 7 (7%) 31 (33%) 19 (20%) 48 (51%)
57

Debre Birhan
Baseline Midterm Change
Information Provided
Rarely (less than
once per month)
30 (55%) 78 (55%) 48 (+160%)
Frequently (more
than once per
month)
25 (45%) 65 (45%) 40 (+160%)
Information Received
Used information 34 (83%) 79 (%) 45 (+132%)
Did not use
information
7 (17%) 5 (%) −2 (−29%)
Problem Solving Requested
Problem resolved or
support ongoing
36 (75%) 59 (%) 23 (+64%)
Problem unresolved
or support not
provided
12 (25%) 6 (%) −6 (−50%)
Problem-Solving Relationships
(Requests Made
and Received)
Agreement on Problem-Solving
Relationship
Agreement on Problem-Solving
Status
81 38 (47%) 18 (47%)
Coordination
Relationships
Agreement on Coordination
Relationship
80 36 (45%)
Service
Provision
Maintenance
and
Rehabilitation
Monitoring Capacity
Building
Community
Engagement
35 (43%) 11 (14%) 34 (42%) 32 (40%) 65 (80%)
58

Mile
Baseline Midterm Change
Information Provided
Rarely (less than
once per month)
52 (63%) 64 (61%) 12 (+23%)
Frequently (more
than once per
month)
21 (37%) 41 (39%) 20 (+95%)
Information Received
Used information 58 (89%) 79 (94%) 21 (+36%)
Did not use
information
7 (11%) 5 (6%) −2 (−29%)
Problem Solving Requested
Problem resolved or
support ongoing
39 (81%) 31 (82%) 8 (+21%)
Problem unresolved
or support not
provided
9 (19%) 7 (18%) −2 (−22%)
Problem-Solving Relationships
(Requests Made
and Received)
Agreement on Problem-Solving
Relationship
Agreement on Problem-Solving
Status
61 38 (62%) 9 (24%)
Coordination
Relationships
Agreement on Coordination
Relationship
76 68%
Service
Provision
Maintenance
and
Rehabilitation
Monitoring Capacity
Building
Community
Engagement
56 (74%) 19 (25%) 44 (58%) 31 (41%) 47 (62%)
59

South Ari
Baseline Midterm Change
Information Provided
Rarely (less than
once per month)
82 (81%) 118 (60%) 36 (+44%)
Frequently (more
than once per
month)
19 (19%) 78 (40%) 59 (+311%)
Information Received
Used information 62 (74%) 94 (91%) 32 (+52%)
Did not use
information
22 (26%) 19 (9%) −3 (−14%)
Problem Solving Requested
Problem resolved or
support ongoing
46 (65%) 66 (76%) 20 (+43%)
Problem unresolved
or support not
provided
25 (35%) 21 (24%) −4 (−16%)
Problem-Solving Relationships
(Requests Made
and Received)
Agreement on Problem-Solving
Relationship
Agreement on Problem-Solving
Status
127 80 (63%) 29 (36%)
Coordination
Relationships
Agreement on Coordination
Relationship
104 52 (50%)
Service
Provision
Maintenance
and
Rehabilitation
Monitoring Capacity
Building
Community
Engagement
81 (78%) 23 (22%) 38 (37%) 33 (32%) 53 (51%)
60

Annex III: Midterm Survey
Ethiopia SWS ONA
Questionnaire
Please read to respondent before starting survey:
My name is [NAME]. I am working with a consortium including IRC WASH, Tetra Tech, LINC, and the
University of Colorado Boulder, conducting a survey of organizations involved in water/sanitation service
delivery in [TOWN OR WOREDA NAME]. The results from this survey will support the development of a local learning alliance to help facilitate improved sustainability of local water/sanitation services. Your
organization has been identified as a key local stakeholder for this local learning alliance.
[For stakeholder understanding interviews]
There are two parts to this interview. For the first part, we are interested in learning about your
perspective on how to make water/sanitation services more sustainable in [TOWN OR WOREDA
NAME]. I will ask you three questions, which should take about 15 minutes. These questions are about your opinion of challenges to achieving sustainable water and sanitation services, solutions to these
challenges, and how you think they can be overcome. The second part of the survey will include
questions on how your organization interacts with other organizations in the water/sanitation sector.
Your participation in this survey is entirely voluntary. I am going to record the first part of this interview,
but the recording will only be shared with IRC WASH, Tetra Tech, and the University of Colorado
Boulder for this project. They may use your responses to advise the activities for the learning alliance, but your responses will not be connected to your name, and so your information will be protected.
Knowing this, do I have your permission to record this interview?
Do you have any questions before we begin?
I will start the recording now [HIT RECORD].
Pre-survey: Factor Analysis Questions
Read: Can you please state your name, the organization and your role there, and today’s date?
1) In your opinion, what do you think are the main problems to sanitation/water service sustainability in your woreda? [Note to enumerators: If shallow response, such as “limited
capacity,” follow up to make this clear: “Limited capacity of what?” One way to also get more
information is to ask this as, “Why is that challenging to sustainability?”]
2) What ideas or recommendations do you have about solutions to these problems?
3) Of the solutions you listed, which is the most important? Can you walk me through what
next steps would happen if the solution occurs?
Read: Thank you for sharing your perspective on this. I will now stop the recording and begin the
second part of the interview.
61

[STOP RECORDING]
For the second part of this interview, you will not be recorded. This section will help the project team map relationships among learning alliance member organizations in [LOCATION NAME]. These data
will be used to understand how relationships have changed since the learning alliance was formed and
to help develop new learning alliance activities that take into account the complex relationships between key stakeholders such as [ORGANIZATION NAME]. This should take about 30 minutes to
complete.
The analysis based on this survey will be presented to the learning alliance, which you are a part of. Because the analysis will be focused on relationships between organizations, there will be parts of the
analysis that include looking at specific organizations, and therefore your responses to this section
should not be considered as fully anonymous. In presenting the information, however, we will always refer to the organization names rather than specific respondent names; for example, we would refer to
the answer from the “Woreda Water Office” rather than the person who responded on behalf of that
office.
Do you have any questions before we begin?
Section 1: Respondent and Organizational Information
Read: First, I would like to get some information on you and your organization. Your personal
information will not be shared outside of the analysis team and will be used for the purposes of being
able to contact you for any follow-up, as well as to track if the respondent from your organization
changes when we repeat the survey in future years.
Instructions: Read aloud each prompt. Record the response exactly as stated by the
respondent. For all names, ask to ensure the spelling is correct.
Roster Data (Short Answer):
1. Organization (from pre-populated list):
2. Individual Name: 3. Position:
4. Individual Phone:
5. Individual Email: 6. Is anyone else from this organization present?
a.[IF YES] Please enter the names and positions of all other individuals present from the
organization.
7. Did [ORGANIZATION NAME] participate in the baseline survey?
a. Yes
b. No
62

Instructions: The questions in Section 2 should only be asked to organizations that did not participate in the baseline survey. For any organization that participated in the baseline survey,
please make sure you respond “yes” to the previous question to skip directly to Section 3.
Section 2: Organization Attributes
Instructions: Read each question to the respondent. After reading the question, read all
responses and ask the respondent to name either one or all that apply (this will be noted in the
question). If necessary, repeat some or all answer choices.
Read: Now I will ask you a few basic questions about your organization. This organizational
information will be used to understand how different types of local organizations interact and work
together in the [LOCATION NAME] water/sanitation sector. For each question below, I will read a set
of potential responses and ask you the response or responses that best match your organization.
Questions:
1) What category best describes the nature of your organization? (Select only one; please
read all responses before finalizing selection)
a. Government Office
b. Public Enterprise (such as water utility) c. Non-Governmental Organization
d. Community-Based Organization
e. Academic Institution (including TVET) f. Private Sector (including formal companies and MSMEs)
g. Other (specify)
2) What is the geographic coverage area of your water/sanitation-related activities in this
region? (Select only one) Note: If an organization works across multiple woredas, they should
indicate “zone,” and if they operate across multiple zones in the region, they should indicate “region.”
a. Kebele
b. Town c. Woreda
d. Zone
e. Region f. Other (specify)
3) In what sector are you implementing or supporting activities in [GEOGRAPHY OF LEARNING ALLIANCE]? (Check all that apply)
a. Water Supply
b. Sanitation c. Hygiene
d. Institutional Water/Sanitation
63

4) Please indicate your organizational functions or missions with regards to
water/sanitation in [GEOGRAPHY OF LEARNING ALLIANCE]. (Check all that apply)
a. Permitting, Monitoring, and Regulation b. Capacity Building
c. Advocacy
d. Coordination e. Financing
f. Community Mobilization
g. Hygiene Promotion h. Research
i. Water/Sanitation Service Provision (including hygiene extension workers)
j. Water/Sanitation Maintenance Support (including spare parts provision, water supply maintenance, and removal of waste)
k. Water/Sanitation Infrastructure Development
l. Other
Section 3: Organizational Relationships
Read: Now I will ask you some questions about the nature of the ways in which [ORGANIZATION NAME] interacts with other learning alliance member organizations and stakeholders in [LOCATION
NAME]. These questions will be used to understand how different types of local organizations interact
and work together, and where there may still be gaps, as well as strengths in collaboration, among or between different types of organizations that could be addressed or built upon through the learning
alliance. The results will be presented back to the learning alliance, and we hope to use them to help
the local water/sanitation sector function more effectively. We understand that you may not know all of the interactions that members of your organization have with other organizations outside of the
learning alliance, but please answer to the best of your knowledge. If you feel unable to answer a
question on behalf of your organization, please let me know and I will note this and seek to follow up
with another member of your organization.
These data will not be used to compare organizations in terms of their effectiveness, but rather to
understand the nature of the interactions among water/sanitation sector stakeholders like yourselves and how those interactions may have been impacted by participation in your local learning alliance. It is
important that your answers honestly reflect the nature of your organizations’ interactions.
Instructions: Share with the respondent a laminated list with all the organizations on the
roster.
Read: First, please identify all the organizations on this list with which your organization had a
relationship over the past 6 months in terms of sharing information, reporting, coordinating, or problem solving. I will then ask you questions about these relationships. If you forget an organization for now, I
can add it as we go through the questions.
64

Questions:
1) To whom has your organization provided information on water/sanitation issues in the
past 6 months, outside of the formal reports and learning alliance meetings? This includes face-to-face meetings, phone calls, emails, and any other method of providing
information outside of the formal reports and learning alliance meetings; however,
please do not include instances in which this information was shared with a broad group rather than directly with the other organization (for example, a general presentation at
a steering committee meeting).
[For each organization] 1a. How frequently did your organization provide information: once
per month or less, or more than once per month?
Organization
Name
Provided
Information?
(If Yes)
Rarely (Less
than Once per Month)
(If Yes)
Frequently
(More than Once per
Month)
Organization X
Organization Y
2) From whom has your organization received information in the past 6 months outside of learning alliance meetings?
[For each organization] 2a. Did your organization apply this information directly to your
water/sanitation work? For example, information that your organization used in making decisions around budgets, strategy, or planning.
Organization
Name
Received Information?
(If Yes) Did Not
Directly Apply
Information
(If Yes) Directly Applied
Information
Organization X
Organization Y
3) With whom did your organization directly coordinate planning or activities outside of
learning alliance meetings in the past 6 months? This includes planning your own activities
with significant input and communication with one another, as well as planning joint activities.
3a. Did the coordination contribute to your objectives in water/sanitation? If yes, did it
contribute to any of the following: service provision; maintenance and rehabilitation; monitoring; capacity building; community engagement? (Check all that apply.)
65

Organization
Name
Coordinate
d Planning
or Activities?
(If Yes)
Activities
Contribut ed to
Service
Provision
(If Yes)
Activities
Contributed to
Maintenance
and Rehabilitation
(If Yes)
Activities
Contributed to
Monitoring
(If Yes)
Activities
Contributed to Capacity
Building
(If Yes)
Activities
Contributed to
Community
Engagement
Organization X
Organization Y
4) In the past 6 months, who have you requested support from to solve a problem?
[For each organization named] 4a. Did they provide support?
4b. Was the problem resolved to your satisfaction?
Organization
Name
Support Requested
but Not
Provided
Support Provided but
Problem Not
Resolved
Support Provided and
Problem
Resolved
Support Is Ongoing
Organization
X
Organization Y
5) In the past 6 months, who has requested support from your organization to solve a
problem?
[For each organization named] 5a. Did your organization provide support?
5b. Was the problem resolved from your perspective? (Check appropriate box.)
Organization
Name
Support
Requested
but Not Provided
Support
Provided but
Problem Not
Resolved
Support
Provided
and Problem Resolved
Support Is
Ongoing
Organization X
Organization Y
[FOR ENUMERATORS]: Please include any notes and other feedback on the interview, including information on any other members of the organization who provided input into any
responses.
66

Final: Notes
[FOR ENUMERATORS]: Please include any notes and other feedback on the interview,
including information on any other members of the organization who provided input into any
responses.
67

To learn more about the Sustainable WASH Systems Learning Partnership, visit: www.globalwaters.org/SWS