sustainably invested hk-he hsbc global investment funds ... · investment strategy ... fund...
TRANSCRIPT
Sustainably Invested
HK-HE
Share Class AD
AD 29 Feb 2020
Yes
Distributing
-9.53 1.36 - - Annually
Daily
USD 1,000
4.50%
0.80%
-
Luxembourg
LU1674673691
USD 10.39
Fund Size
HSGLCAD LX
1Result is cumulative when calculation period
is over one year. 2The calendar year return of the first year is
calculated between share class inception date
and calendar year end of first year if the share
class has less than 5-year history.
Share Class Details
• The Fund invests mainly in equities.
• Because the Fund’s base currency, investments and classes may be denominated in different currencies, investors may be affected
adversely by exchange controls and exchange rate fluctuations.
• The Fund may invest in financial derivative instruments for investment purpose which may lead to higher volatility to its net asset value.
• The Fund’s investments may involve substantial credit, currency, volatility, liquidity, interest rate, ESG investment policy risk, tax and
political risks. Investors may suffer substantial loss of their investments in the Fund.
• Unit trusts are NOT equivalent to time deposits. Investors should not invest in the Fund solely based on the information provided in this
document and should read the offering document of the Fund for details.
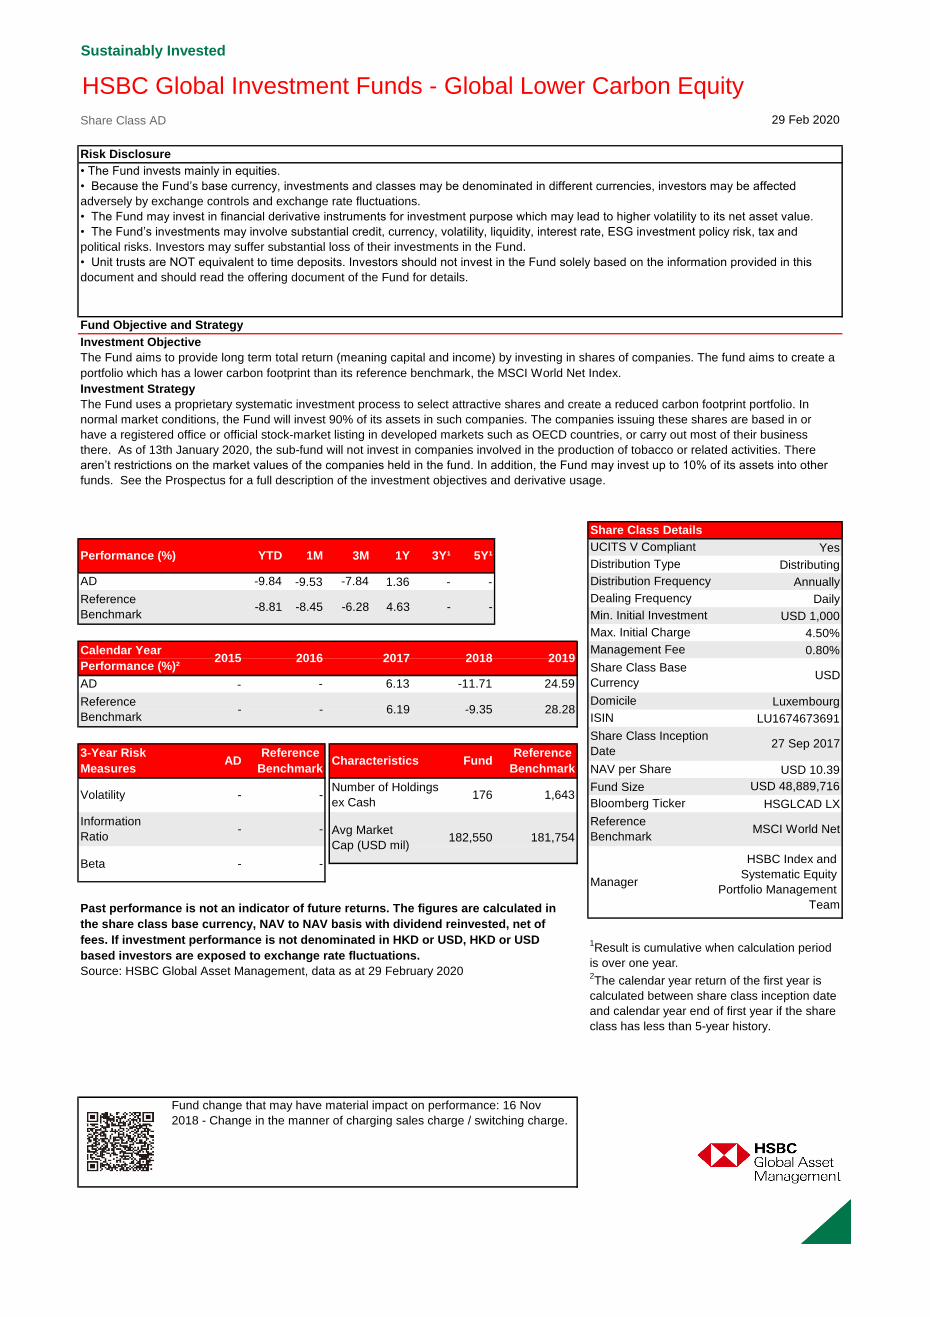
Investment Objective
The Fund aims to provide long term total return (meaning capital and income) by investing in shares of companies. The fund aims to create a
portfolio which has a lower carbon footprint than its reference benchmark, the MSCI World Net Index.
Investment Strategy
The Fund uses a proprietary systematic investment process to select attractive shares and create a reduced carbon footprint portfolio. In
normal market conditions, the Fund will invest 90% of its assets in such companies. The companies issuing these shares are based in or
have a registered office or official stock-market listing in developed markets such as OECD countries, or carry out most of their business
there. As of 13th January 2020, the sub-fund will not invest in companies involved in the production of tobacco or related activities. There
aren’t restrictions on the market values of the companies held in the fund. In addition, the Fund may invest up to 10% of its assets into other
funds. See the Prospectus for a full description of the investment objectives and derivative usage.
Risk Disclosure
Fund Objective and Strategy
HSBC Global Investment Funds - Global Lower Carbon Equity
29 Feb 2020
3M 1Y 3Y¹ 5Y¹Performance (%) YTD 1M
2017 2018 2019Management Fee
AD -9.84 -7.84
Calendar Year
Performance (%)²2015 2016
AD - 6.13 -11.71 24.59
Fund change that may have material impact on performance: 16 Nov
2018 - Change in the manner of charging sales charge / switching charge.
USD 48,889,716
NAV per Share
Bloomberg Ticker
Reference
Benchmark
Past performance is not an indicator of future returns. The figures are calculated in
the share class base currency, NAV to NAV basis with dividend reinvested, net of
fees. If investment performance is not denominated in HKD or USD, HKD or USD
based investors are exposed to exchange rate fluctuations.
Source: HSBC Global Asset Management, data as at 29 February 2020
Reference
Benchmark-8.81 -8.45 -6.28 4.63 -
MSCI World Net
Manager
HSBC Index and
Systematic Equity
Portfolio Management
Team
Share Class Base
CurrencyUSD
Domicile
ISIN
Share Class Inception
Date27 Sep 2017
Dealing Frequency
Min. Initial Investment
Max. Initial Charge
3-Year Risk
MeasuresAD
Reference
Benchmark
Volatility - -
Characteristics Fund
28.28Reference
Benchmark- - 6.19 -9.35
Information
Ratio- -
Beta - -
Avg Market
Cap (USD mil)182,550 181,754
Reference
Benchmark
Number of Holdings
ex Cash176 1,643
-
UCITS V Compliant
Distribution Type
Distribution Frequency

Monthly Performance Commentary
Market Review
Global equity markets sold off in February as reports of spread of coronavirus outside China and fears of potential negative effects on
global growth prompted another wave of market risk-off sentiment and a surge in market volatility, in particular at the end of the month
when global equity markets saw one of the sharpest corrections in recent history. From a regional perspective, emerging market (EM)
equities fell in February but outperformed developed markets as contagion rates in mainland China appeared to stabilise and a number of
EM central banks moved to ease their monetary policies in order to mitigate coronavirus impact. This was despite headwinds from a
stronger US dollar and a double-digit fall in oil price, which weighed on EM returns. China equity market was the only market in the world to
end February with a positive return amidst significant government stimulus, the People Bank of China’s cut of its loan prime rate by 10bps,
and signs of improvement in some activity indicators. In the developed world, virus-related uncertainties dominated market sentiment and
drove the strong investor risk aversion. At country level, the US equity market marked a new record earlier in the month, on robust US
macro data releases and a better-than-expected US Q4 earnings season, before the sharp sell-off towards the end of February. In Europe,
COVID-19 outbreak in Italy and the potential risks of contagion across the European block amplified recession concerns. Japanese
equities also declined, while the Japanese yen strengthened sharply in the last four days of February. In monetary policy news, a number
of emerging market central banks delivered accommodative policy decisions, with some in response to COVID-19 risks – this included rate
cuts by central banks of Russia, Brazil, Turkey, Indonesia and Thailand.
Fund Review
In February, the fund outperformed its market cap weighted index. Our allocation to style factors contributed to performance, while country
and sectors attributed largely in line with the benchmark.
On a sector basis, our overweight allocations to Communication Services and Information Technology coupled with an underweight
exposure to Energy contributed to performance. Conversely, our underweight allocations to Financials and Utilities along with an
overweight exposure to Industrials detracted performance. On a country basis, our overweight allocations to Israel and Sweden coupled
with an underweight exposure to the United States contributed to performance. Conversely, our underweight allocations to Hong Kong and
Canada along with an underweight exposure to Australia weighed on performance.
In February, the equity markets continued on the defensive path as the spread of COVID-19 outside China elevated worries over potential
ramifications and impact of the virus on global economic growth, which prompted another wave of market risk-off sentiment. This
increasingly risk-averse environment supported the outperformance of the typically more defensive low beta and quality factors, along with
the positive performance of group momentum factor. At the other end, value and size factors lagged, as the more cycle-sensitive and
higher risk stocks took another hit in February. Looking at factor attribution in the portfolio, our exposures to low beta, group momentum
and quality factors contributed to performance, while our allocations to value and size proved a headwind.
At the stock level, overweighting Regeneron Pharms Inc. and Biogen Inc. along with underweighting JP Morgan Chase Co contributed to
performance. Conversely, overweighting Copart Inc., Citrix Systems Inc. and Walt Disney Co weighed on performance.
Outlook
We believe global equities still offer attractive rewards despite the near-term risks to the growth outlook, whilst corporate fundamentals
remain strong. The recent COVID-19 outbreak has raised volatility in markets and, despite short-term economic challenges, global
monetary and fiscal policy support is likely to help cushion the blow to the global economy and financial markets. For now, we still favour a
pro-risk investment strategy.
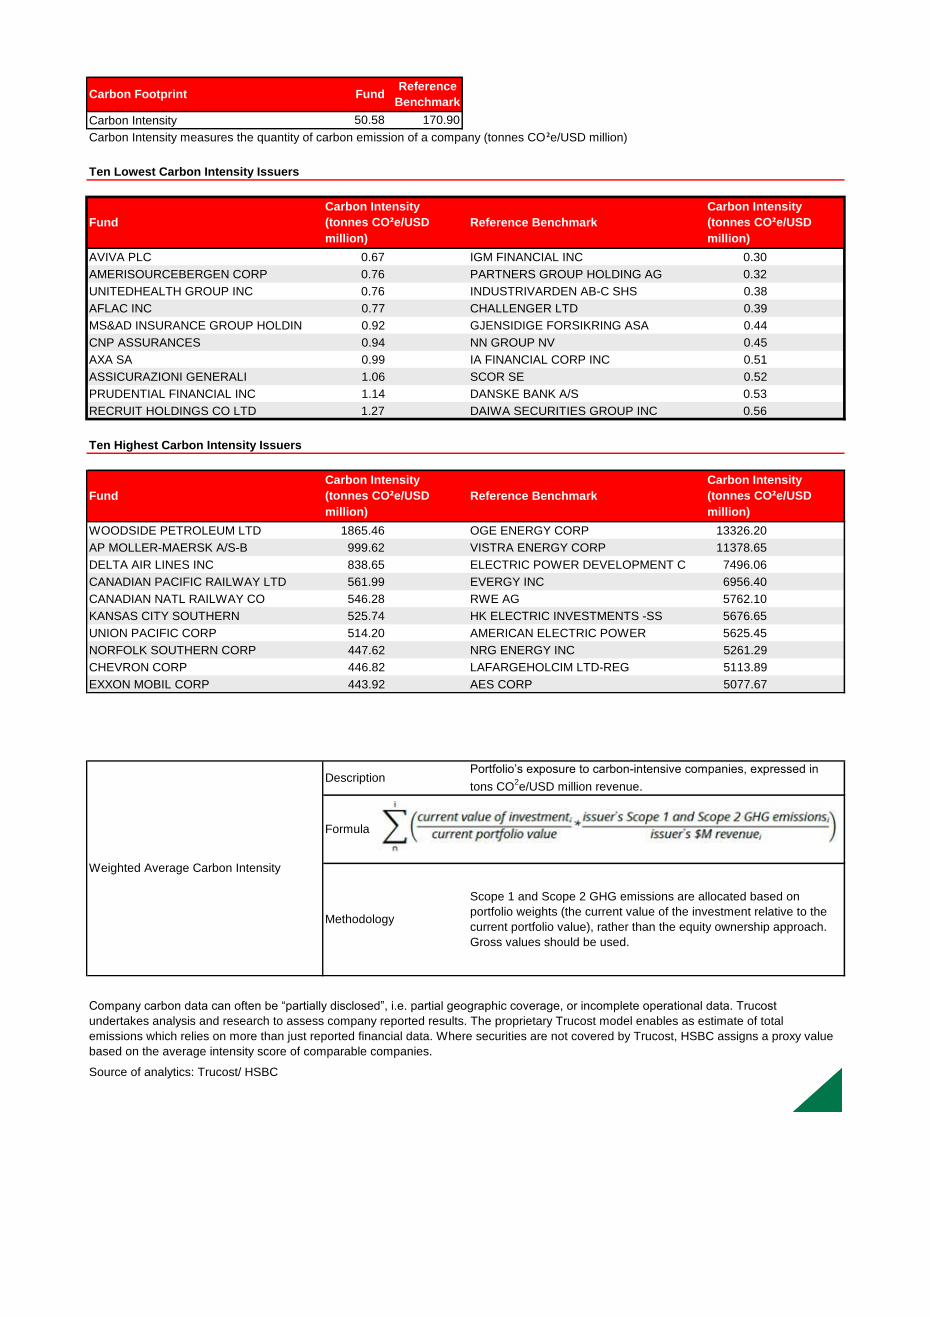
Carbon Intensity 50.58 170.90
Carbon Intensity measures the quantity of carbon emission of a company (tonnes CO²e/USD million)
Ten Lowest Carbon Intensity Issuers
AVIVA PLC 0.67 IGM FINANCIAL INC 0.30
AMERISOURCEBERGEN CORP 0.76 PARTNERS GROUP HOLDING AG 0.32
UNITEDHEALTH GROUP INC 0.76 INDUSTRIVARDEN AB-C SHS 0.38
AFLAC INC 0.77 CHALLENGER LTD 0.39
MS&AD INSURANCE GROUP HOLDIN 0.92 GJENSIDIGE FORSIKRING ASA 0.44
CNP ASSURANCES 0.94 NN GROUP NV 0.45
AXA SA 0.99 IA FINANCIAL CORP INC 0.51
ASSICURAZIONI GENERALI 1.06 SCOR SE 0.52
PRUDENTIAL FINANCIAL INC 1.14 DANSKE BANK A/S 0.53
RECRUIT HOLDINGS CO LTD 1.27 DAIWA SECURITIES GROUP INC 0.56
Ten Highest Carbon Intensity Issuers
WOODSIDE PETROLEUM LTD 1865.46 OGE ENERGY CORP 13326.20
AP MOLLER-MAERSK A/S-B 999.62 VISTRA ENERGY CORP 11378.65
DELTA AIR LINES INC 838.65 ELECTRIC POWER DEVELOPMENT C 7496.06
CANADIAN PACIFIC RAILWAY LTD 561.99 EVERGY INC 6956.40
CANADIAN NATL RAILWAY CO 546.28 RWE AG 5762.10
KANSAS CITY SOUTHERN 525.74 HK ELECTRIC INVESTMENTS -SS 5676.65
UNION PACIFIC CORP 514.20 AMERICAN ELECTRIC POWER 5625.45
NORFOLK SOUTHERN CORP 447.62 NRG ENERGY INC 5261.29
CHEVRON CORP 446.82 LAFARGEHOLCIM LTD-REG 5113.89
EXXON MOBIL CORP 443.92 AES CORP 5077.67
Source of analytics: Trucost/ HSBC
Weighted Average Carbon Intensity
DescriptionPortfolio’s exposure to carbon-intensive companies, expressed in
tons CO2e/USD million revenue.
Formula
Methodology
Scope 1 and Scope 2 GHG emissions are allocated based on
portfolio weights (the current value of the investment relative to the
current portfolio value), rather than the equity ownership approach.
Gross values should be used.
Company carbon data can often be “partially disclosed”, i.e. partial geographic coverage, or incomplete operational data. Trucost
undertakes analysis and research to assess company reported results. The proprietary Trucost model enables as estimate of total
emissions which relies on more than just reported financial data. Where securities are not covered by Trucost, HSBC assigns a proxy value
based on the average intensity score of comparable companies.
Carbon Footprint FundReference
Benchmark
Fund
Carbon Intensity
(tonnes CO²e/USD
million)
Reference Benchmark
Carbon Intensity
(tonnes CO²e/USD
million)
Fund
Carbon Intensity
(tonnes CO²e/USD
million)
Reference Benchmark
Carbon Intensity
(tonnes CO²e/USD
million)
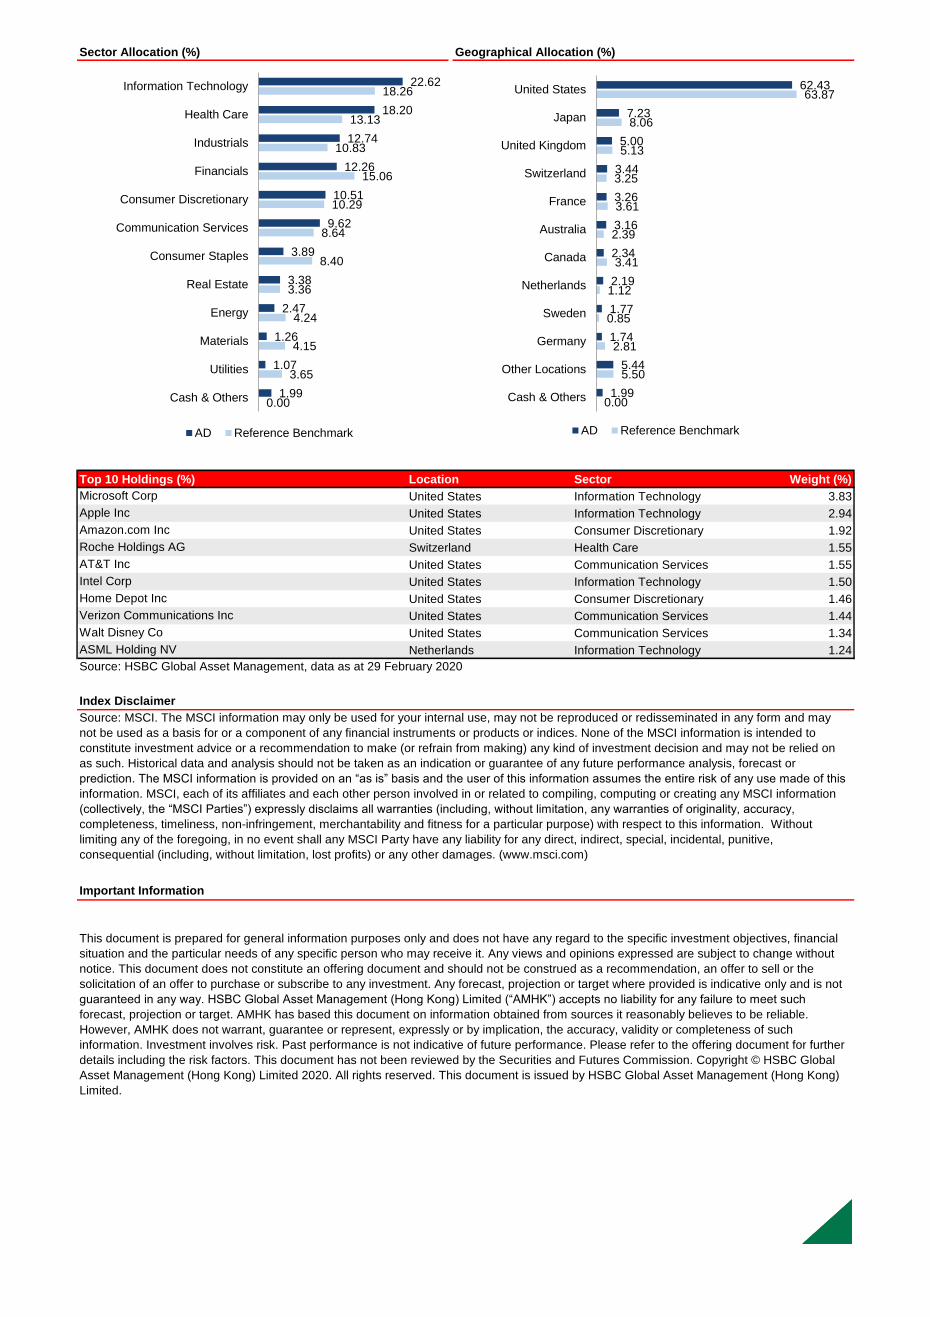
Sector Allocation (%) Geographical Allocation (%)
Top 10 Holdings (%) Location Sector Weight (%)
United States Information Technology 3.83
United States Information Technology 2.94
United States Consumer Discretionary 1.92
Switzerland Health Care 1.55
United States Communication Services 1.55
United States Information Technology 1.50
United States Consumer Discretionary 1.46
United States Communication Services 1.44
United States Communication Services 1.34
Netherlands Information Technology 1.24
Amazon.com Inc
Roche Holdings AG
Apple Inc
Microsoft Corp
Verizon Communications Inc
Home Depot Inc
AT&T Inc
Intel Corp
Source: HSBC Global Asset Management, data as at 29 February 2020
Walt Disney Co
ASML Holding NV
Index Disclaimer
Source: MSCI. The MSCI information may only be used for your internal use, may not be reproduced or redisseminated in any form and may
not be used as a basis for or a component of any financial instruments or products or indices. None of the MSCI information is intended to
constitute investment advice or a recommendation to make (or refrain from making) any kind of investment decision and may not be relied on
as such. Historical data and analysis should not be taken as an indication or guarantee of any future performance analysis, forecast or
prediction. The MSCI information is provided on an “as is” basis and the user of this information assumes the entire risk of any use made of this
information. MSCI, each of its affiliates and each other person involved in or related to compiling, computing or creating any MSCI information
(collectively, the “MSCI Parties”) expressly disclaims all warranties (including, without limitation, any warranties of originality, accuracy,
completeness, timeliness, non-infringement, merchantability and fitness for a particular purpose) with respect to this information. Without
limiting any of the foregoing, in no event shall any MSCI Party have any liability for any direct, indirect, special, incidental, punitive,
consequential (including, without limitation, lost profits) or any other damages. (www.msci.com)
Important Information
This document is prepared for general information purposes only and does not have any regard to the specific investment objectives, financial
situation and the particular needs of any specific person who may receive it. Any views and opinions expressed are subject to change without
notice. This document does not constitute an offering document and should not be construed as a recommendation, an offer to sell or the
solicitation of an offer to purchase or subscribe to any investment. Any forecast, projection or target where provided is indicative only and is not
guaranteed in any way. HSBC Global Asset Management (Hong Kong) Limited (“AMHK”) accepts no liability for any failure to meet such
forecast, projection or target. AMHK has based this document on information obtained from sources it reasonably believes to be reliable.
However, AMHK does not warrant, guarantee or represent, expressly or by implication, the accuracy, validity or completeness of such
information. Investment involves risk. Past performance is not indicative of future performance. Please refer to the offering document for further
details including the risk factors. This document has not been reviewed by the Securities and Futures Commission. Copyright © HSBC Global
Asset Management (Hong Kong) Limited 2020. All rights reserved. This document is issued by HSBC Global Asset Management (Hong Kong)
Limited.
0.00
5.50
2.81
0.85
1.12
3.41
2.39
3.61
3.25
5.13
8.06
63.87
1.99
5.44
1.74
1.77
2.19
2.34
3.16
3.26
3.44
5.00
7.23
62.43
Cash & Others
Other Locations
Germany
Sweden
Netherlands
Canada
Australia
France
Switzerland
United Kingdom
Japan
United States
AD Reference Benchmark
0.00
3.65
4.15
4.24
3.36
8.40
8.64
10.29
15.06
10.83
13.13
18.26
1.99
1.07
1.26
2.47
3.38
3.89
9.62
10.51
12.26
12.74
18.20
22.62
Cash & Others
Utilities
Materials
Energy
Real Estate
Consumer Staples
Communication Services
Consumer Discretionary
Financials
Industrials
Health Care
Information Technology
AD Reference Benchmark
Terms of Glossary
Accumulation Share: a type of share where the income earned by the Fund is retained in the Fund
ACD: HSBC Global Asset Management (UK) Limited, the Authorised Corporate Director of the Company
Actively Managed: where the fund manager uses their expertise to pick investments to achieve the fund’s objectives
Beta: an historical measure of volatility to measure how a fund moves versus its benchmark (i.e. an Index)
Collective Investment Scheme: a fund that more than one person contributes to with the aim of increasing the value of their investments
or receiving income from a pooled investment. A fund manager will invest the pooled money into one or more types of asset, such as
stocks, bonds or property
Developed Markets: countries with relatively high levels of personal income and established economies
Emerging Markets (EM): countries that are progressing toward becoming advanced, usually shown by some development in financial
markets, the existence of some form of stock exchange and a regulatory body
Equities: shares issued by a company
Futures: a financial contract obligating the buyer to purchase an asset (or the seller to sell an asset), such as a physical commodity or a
financial instrument, at a predetermined future date and price
Growth: the increase in the value of investments
Hedge Funds: an investment fund that pools money from investors and invests in a variety of assets, often with complex investment
strategies and risk management techniques
Hedge or Hedging: using derivative type investments as a way to reduce risk
Income: money generated by a fund, such as interest from a bond or a dividend from a share, which can be paid out to its investors or
paid back into the fund and reinvested
Income Share: the type of Share where the income earned by the Fund is paid out to you
Information Ratio: a measure of the risk-adjusted return of a fund against its benchmark
Market Capitalisation: the total dollar market value of a company’s outstanding shares. Commonly referred to as “market cap”, it is
calculated by multiplying a company’s shares outstanding by the current market price of one share
Net Asset Value (NAV): the value of the scheme property of a fund less the liabilities of the fund
Ongoing Charges Figure: a measure of what it costs to invest in a fund. It includes the fee paid to the ACD and other operating costs
Price Earnings (P/E) Ratio: the price paid for a share divided by the annual profit earned by the firm per share
Preference Shares: shares of a company which entitle the holder to a fixed dividend, whose payment takes priority over that of ordinary
share dividends. Preference shares may be convertible to the ordinary shares of a company
Property-related securities: shares of property companies that own, manage or develop property and Real Estate Investment Trusts
(REITs), which are investment companies that own buildings and land
Return(s): the money made or lost on an investment
Share(s): an equally valued holding in a fund of a company, representing part ownership of that fund, (including larger denomination
shares and smaller denomination shares)
Sharpe ratio: a measure for calculating risk-adjusted return, and this ratio has become the industry standard for such calculations
Volatility: a measure of the size and frequency of changes in the value of an investment over a short space of time
Yield: the income from an investment, usually stated as a percentage of the value of the investment
Carbon Intensity Description: Portfolio's exposure to carbon-intensive companies, expressed in tons CO²e/USD million revenue.
Carbon Intensity Formula: Σ((current value of investment/current portfolio value)*(issuer's Scope 1 and Scope 2 GHG emissions/issuer's
$M revenue))
Carbon Intensity Methodology: Scope 1 and Scope 2 GHG emissions are allocated based on portfolio weights (the current value of the
investmnet relative to the current portfolio value), rather than the equity ownership approach. Gross values should be used.
Company carbon data, can often be “partially disclosed”, i.e. partial geographic coverage, or incomplete operational data. Trucost*
undertakes analysis and research to assess company reported results. The proprietary Trucost model enables an estimate of total
emissions which relies on more than just reported financial data. Where securities are not covered by Trucost, HSBC assigns a proxy
value based on the average intensity score of comparable companies.*Trucost are a division of S&P Global; they assess risks relating to
climate change, natural resource constraints, and broader environmental, social, and governance factors.
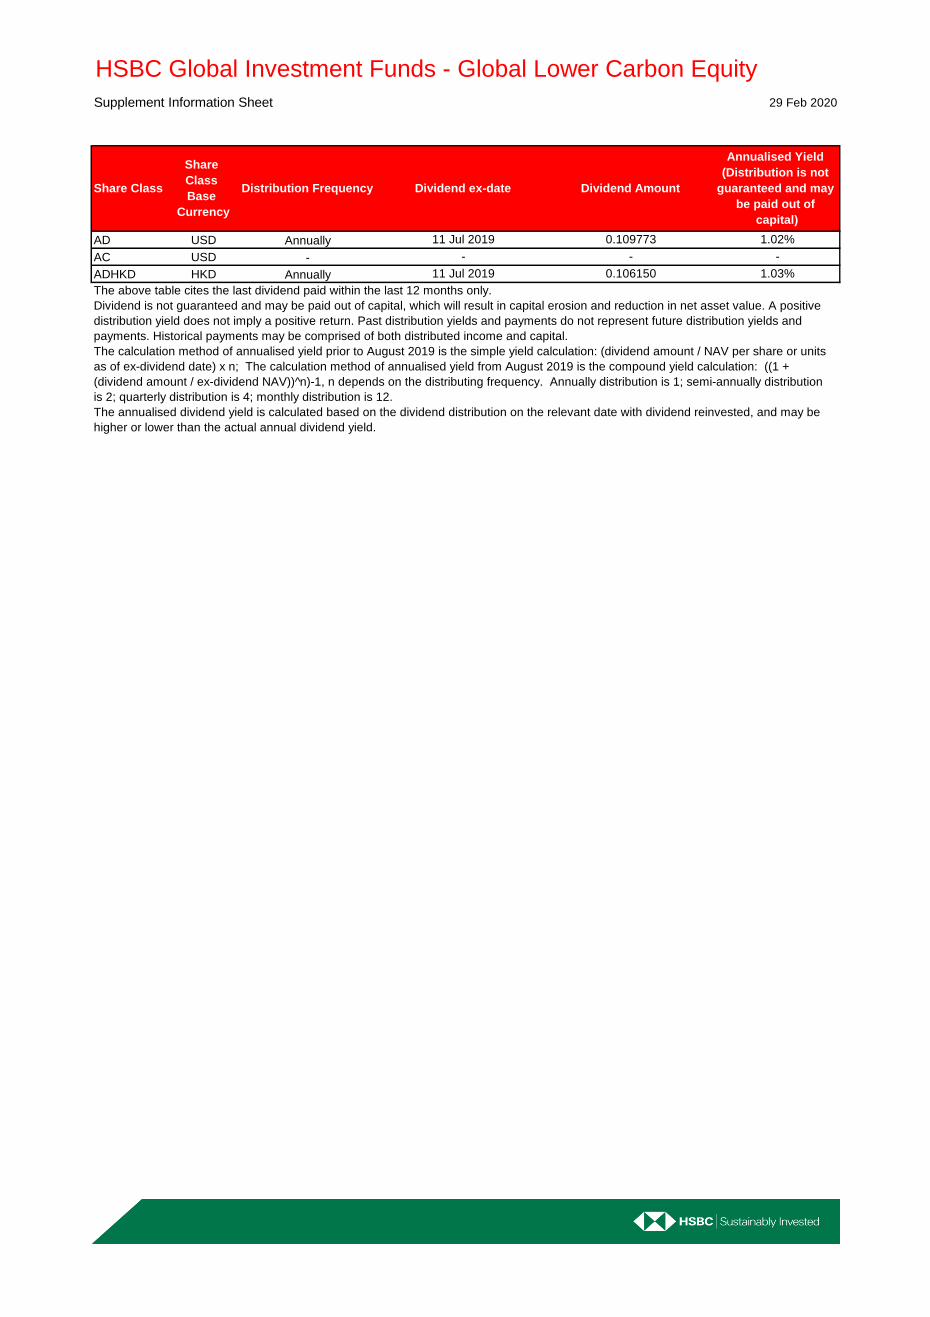
Supplement Information Sheet
AD USD
AC USD
ADHKD HKD
0.109773
HSBC Global Investment Funds - Global Lower Carbon Equity
29 Feb 2020
1.03%
The above table cites the last dividend paid within the last 12 months only.
Dividend is not guaranteed and may be paid out of capital, which will result in capital erosion and reduction in net asset value. A positive
distribution yield does not imply a positive return. Past distribution yields and payments do not represent future distribution yields and
payments. Historical payments may be comprised of both distributed income and capital.
The calculation method of annualised yield prior to August 2019 is the simple yield calculation: (dividend amount / NAV per share or units
as of ex-dividend date) x n; The calculation method of annualised yield from August 2019 is the compound yield calculation: ((1 +
(dividend amount / ex-dividend NAV))^n)-1, n depends on the distributing frequency. Annually distribution is 1; semi-annually distribution
is 2; quarterly distribution is 4; monthly distribution is 12.
The annualised dividend yield is calculated based on the dividend distribution on the relevant date with dividend reinvested, and may be
higher or lower than the actual annual dividend yield.
Annually 11 Jul 2019 0.106150
- - - -
Annually 11 Jul 2019
Distribution Frequency Dividend ex-date Dividend Amount
Annualised Yield
(Distribution is not
guaranteed and may
be paid out of
capital)
Share Class
Share
Class
Base
Currency
1.02%

可持續投資HK-HT
股份類別 AD
AD 29/02/2020
是
派息
-9.53 1.36 - - 每年
-8.45 4.63 - - 每日
美元 1,000
4.50%
0.80%
- 美元
- 盧森堡
LU1674673691
基金 2017年9月27日
美元 10.39
波幅 基金規模
資訊比率 - - HSGLCAD LX
貝他值 - -
風險披露
基金投資目標及策略
滙豐環球投資基金 - 環球低碳股票2020年2月29日
參考基準 -8.81 -6.28
AD -9.84 -7.84
5年¹
股份類別詳情
•本基金主要投資於股票。
•由於本基金的基本貨幣、投資及份額類別可按不同的貨幣計值,故此,外匯管制及匯率波動可能對投資者構成不利影響。
•本基金可投資於金融衍生工具作投資用途,可能使本基金的資產淨值較波動。
•本基金之投資可能涉及重大的信貸、貨幣、波動性、流動性、利率、ESG投資政策風險、稅務及政治風險。投資者投資於本基金可能蒙受重
大損失。
•基金產品並不等同於定期存款。投資者不應僅就此文件提供之資料作出投資決定,而應細閱本基金之銷售文件。
投資目標
本基金旨在投資於碳排放強度低於摩根士丹利環球浄回報指數的公司股票,提供長期資本增長及收益。
投資策略
在正常市況下,本基金至少將其資產的90%投資於駐於成熟市場或在成熟市場開展大部分業務的公司(無論規模大小)的股票。
本基金的投資流程自可投資股票範圍中識別股票,並基於特定因素如價值、質素、動能、低風險及規模按吸引力由低至高進行排名。本基金對
投資組合中所有股票進行碳排放強度評估,並創建投資組合,力求將排名較高股票的持倉最大化,並減少本基金的碳排放強度。本基金不會投
資從事煙草生產及相關業務的公司。
本基金最多可將其資產的10%投資於其他基金,包括滙豐基金。
請參閱基金說明書,了解關於投資目標及衍生工具使用的完整說明。
-11.71 24.59 股份類別基本貨幣
3個月 1年 3年¹
投資組合特點 參考基準 股份類別成立日期
每股資產淨值
- -
基金表現 (%)年初
至今1個月
參考基準 - 6.19 -9.35 28.28 註冊地
ISIN代號
AD - 6.13
對本基金表現可能有重大影響的變動:2018 年11 月16 日 -
變更收取銷售費/轉換費用的方式。
查閱基金文件請掃描二維碼
美元 48,889,716
彭博代號
參考基準摩根士丹利環球淨回報指
數
過去的業績並不代表將來的表現。表現以股份類別基本貨幣計算,資產淨值對資產淨值,將
股息再作投資,並已扣除費用。如投資業績非以港元或美元計算,以港元或美元作投資的投
資者須承受匯率波動的風險。
資料來源:滙豐環球投資管理,數據截至2020年2月29日
UCITS V合規
派息類型
派息頻率
交易頻率
最低初始認購額
首次認購費最高達
管理費年度回報表現 (%)² 2015 2016 2017 2018
1當計算期超過一年,業績為累積表現。 2如股份類別成立少於五年,其首年年度表現為成立日至年底。
182,550 181,754
3年風險衡量
指標AD 參考基準
持倉數量(不包括現
金)176 1,643
平均市值(美
元 百萬)
基金經理
HSBC Index and
Systematic Equity
Portfolio Management
Team
2019

每月表現評論
市場回顧
2月環球股市遭遇拋售潮,因為新冠肺炎疫情在中國境外蔓延的報道以及對環球經濟增長可能受到負面影響的擔憂,導致市場避險氣氛再度
高漲,市場波動亦大幅增加,特別是月底環球股市經歷了近年來最大幅度的整固。
從地區角度而言,新興市場股票於2月下跌,但由於中國內地的發病率似乎趨於穩定,而一批新興市場國家的央行為緩解新冠肺炎疫情的影
響而推行寬鬆貨幣政策,新興市場股票表現領先於成熟市場。這是在美元走強和油價雙位數跌幅的不利因素拖累新興市場股票回報的情況下
所實現的。在政府大力實施刺激措施,中國人民銀行將貸款市場報價利率下調10個基點,且若干經濟活動指標呈現好轉跡象的情況下,中國
股票市場是全球唯一在2月份錄得正回報的市場。在成熟國家中,與新冠肺炎有關的不確定性主導著市場氣氛,並激起投資者的大規模風險
規避行動。縱觀各國,在2月底出現拋售潮之前,美國宏觀數據穩健以及第四季企業盈利超出預期,刺激美國股市在本月早些時候創下新高
。歐洲方面,意大利爆發新冠肺炎疫情以及疫情在歐洲蔓延的潛在風險加劇了經濟衰退方面的憂慮之情。日本股市亦下跌,但2月的最後4天
日圓大幅走強。貨幣政策消息方面,一批新興市場國家的央行頒布寬鬆貨幣政策,其中一些是對新冠肺炎疫情風險作出的回應,包括俄羅斯
、巴西、土耳其、印度尼西亞和泰國央行減息。
基金回顧
2月份,基金表現領先其市值加權指數。我們對風格因數的配置利好基金表現,而國家和行業配置的貢獻與基準指數大致上一致。
行業方面,我們持重通訊服務及資訊科技以及持輕能源業,為基金表現帶來貢獻。相反,我們持輕金融業及公用事業以及持重工業,則拖累
基金表現。國家方面,我們持重以色列和瑞典以及持輕美國,為基金表現帶來貢獻。相反,我們持重香港及加拿大以及持輕澳洲,則拖累基
金表現。
2月份,隨着新冠肺炎在中國境外蔓延,加重民眾對疫情可能大流行及其對環球經濟增長的潛在影響的擔憂,導致市場避險氣氛再度高漲,
因此股市繼續處於避險氣氛 中。日益避險的環境提供支持,促使通常較具防守性的低貝他值和質素因數表現領先,而組別動能因數錄得正
回報。另一方面,價值和規模因數表現落後,因為對週期敏感度較高以及風險較高的股票2月再次受到重創。歸因方面,在投資組合內,低
貝他值、組別動能和質素因數的持倉為表現帶來貢獻,價值和規模因數則構成不利因素。
在股票層面上,持重Regenon Pharms Inc.和Biogen Inc.以及持輕摩根大通為表現作出貢獻。相反,持重Copart Inc.、Citrix Systems
Inc.和迪士尼拖累表現。
展望
我們認為,雖然經濟增長前景面臨短期風險,但環球股票仍會提供具吸引力的回報,同時公司基本因素保持強勁。最近的新冠肺炎疫情爆發
加劇市場波動,雖然面臨短期經濟挑戰,環球貨幣和財政政策支持很可能有助於減緩環球經濟和金融市場受到的打擊。目前我們仍看好趨險
投資策略。
碳強度 50.58 170.90
碳強度衡量一家公司的碳排放量(噸二氧化碳/百萬美元)
最低碳強度證券發行人前十
AVIVA PLC 0.67 IGM FINANCIAL INC 0.30
AMERISOURCEBERGEN CORP 0.76 PARTNERS GROUP HOLDING AG 0.32
UNITEDHEALTH GROUP INC 0.76 INDUSTRIVARDEN AB-C SHS 0.38
AFLAC INC 0.77 CHALLENGER LTD 0.39
MS&AD INSURANCE GROUP HOLDIN 0.92 GJENSIDIGE FORSIKRING ASA 0.44
CNP ASSURANCES 0.94 NN GROUP NV 0.45
AXA SA 0.99 IA FINANCIAL CORP INC 0.51
ASSICURAZIONI GENERALI 1.06 SCOR SE 0.52
PRUDENTIAL FINANCIAL INC 1.14 DANSKE BANK A/S 0.53
RECRUIT HOLDINGS CO LTD 1.27 DAIWA SECURITIES GROUP INC 0.56
最高碳強度證券發行人前十
WOODSIDE PETROLEUM LTD 1865.46 OGE ENERGY CORP 13326.20
AP MOLLER-MAERSK A/S-B 999.62 VISTRA ENERGY CORP 11378.65
DELTA AIR LINES INC 838.65 ELECTRIC POWER DEVELOPMENT C 7496.06
CANADIAN PACIFIC RAILWAY LTD 561.99 EVERGY INC 6956.40
CANADIAN NATL RAILWAY CO 546.28 RWE AG 5762.10
KANSAS CITY SOUTHERN 525.74 HK ELECTRIC INVESTMENTS -SS 5676.65
UNION PACIFIC CORP 514.20 AMERICAN ELECTRIC POWER 5625.45
NORFOLK SOUTHERN CORP 447.62 NRG ENERGY INC 5261.29
CHEVRON CORP 446.82 LAFARGEHOLCIM LTD-REG 5113.89
EXXON MOBIL CORP 443.92 AES CORP 5077.67
分析來源:Trucost / 滙豐環球投資管理
投資組合對碳密集型企業的風險敞口,以噸CO2e
/百萬美元收入表示。
計算公式
研究方法
範圍1和範圍2溫室氣體排放量是根據投資組合權重(投資相對於當前
投資組合價值的當前價值)而非股權所有權方法進行分配的。計算中
應該使用總值。
公司碳排放數據通常可能只披露一部分,例如部分地理覆蓋或不完整的運營數據。Trucost進行分析和研究以評估公司報告的結果。Trucost的
專有模型能夠估計總排放量,如果證券不被Trucost覆蓋,滙豐環球投資管理會根據可比公司的平均強度評分來設置代理數值。
碳足跡 基金 參考基準
基金碳強度(噸二氧化碳/百
萬美元)參考基準
碳強度(噸二氧化碳/百
萬美元)
基金碳強度(噸二氧化碳/百
萬美元)參考基準
碳強度(噸二氧化碳/百
萬美元)
加權平均碳強度
方法表述

行業分佈 (%) 地區分佈 (%)
十大持倉 (%) 地區 股票行業 比重 (%)
美國 資訊科技 3.83
美國 資訊科技 2.94
美國 可選消費品 1.92
瑞士 健康護理 1.55
美國 通信服務 1.55
美國 資訊科技 1.50
美國 可選消費品 1.46
美國 通信服務 1.44
美國 通信服務 1.34
荷蘭 資訊科技 1.24
Intel Corp
Amazon.com Inc
Roche Holdings AG
Apple Inc
Microsoft Corp
ASML Holding NV
Verizon Communications Inc
Home Depot Inc
AT&T Inc
指數免責聲明
資料來源:MSCI。MSCI數據僅可供經理人內部使用,不得以任何形式複製或再傳播,亦不得用作任何金融工具或產品或指數的基礎或作為其成
分。MSCI數據不擬構成投資意見或作出(或不作出)任何種類投資決定的建議,故不得加以依賴。歷史數據和分析不應被視作任何未來表現分
析、預測或預估的指示或保證。MSCI數據乃以「按原狀」的基礎提供,而使用此等數據的人士需承擔任何使用此等數據的全部風險。MSCI、其
聯屬機構及曾參與或涉及編制、計算或創造任何MSCI數據的他方(統稱「MSCI有關各方」)各自特此明確就此等數據的所有保證(包括但不限於此
等數據的原創性、準確性、完整性、適時性、非侵權性、適銷性及任何特定用途的適用性)作出免責聲明。不受限於前述的情況,MSCI有關各方
在任何情況下不會有任何直接的、間接的、特殊的、附帶性的、懲罰性的、相應性的(包括但不限於利益損失)或其他任何損害賠償的責任。(w
ww.msci.com)
資料來源:滙豐環球投資管理,數據截至2020年2月29日
Walt Disney Co
重要資訊
本文件只提供一般性資料,並不針對任何可能收到本文件的人士的具體投資目標、財務狀況和特別需求。在此表達之意見可因應情況修改而不作
另行通知。本文件並非銷售文件,且不構成建議、要約出售或招攬購買或認購任何投資。本文件所載任何預測、預計或目標僅供説明用途,且並
非任何形式的保證。滙豐環球投資管理(香港)有限公司(「滙豐環球投資管理」)就預測、預計或目標未能達成概不承擔任何責任。本文件內
的資料乃取自滙豐環球投資管理合理地相信可靠的來源。然而,無論明示或暗示,滙豐環球投資管理不保證、擔保或代表本文件內該等資料的準
確性、有效性或完整性。投資附帶風險,過去的業績並不代表將來的表現。請參閱銷售文件以便獲取其它資料,包括風險因素。此文件並未經證
券及期貨事務監察委員會批閱。版權 © HSBC Global Asset Management (Hong Kong) Limited
(滙豐環球投資管理(香港)有限公司)2020。版權所有。本文件由HSBC Global Asset Management (Hong Kong) Limited
(滙豐環球投資管理(香港)有限公司)刊發。
0.00
5.50
2.81
0.85
1.12
3.41
2.39
3.61
3.25
5.13
8.06
63.87
1.99
5.44
1.74
1.77
2.19
2.34
3.16
3.26
3.44
5.00
7.23
62.43
現金及其他
其他地區
德國
瑞典
荷蘭
加拿大
澳洲
法國
瑞士
英國
日本
美國
AD 參考基準
0.00
3.65
4.15
4.24
3.36
8.40
8.64
10.29
15.06
10.83
13.13
18.26
1.99
1.07
1.26
2.47
3.38
3.89
9.62
10.51
12.26
12.74
18.20
22.62
現金及其他
公用事業
物料
能源
房地產
消費必需品
通信服務
可選消費品
金融
工業
健康護理
資訊科技
AD 參考基準

詞彙表
累積股份: 基金賺取的收益留存於基金的股份類別
授權公司董事(ACD): HSBC Global Asset Management (UK) Limited,本公司的授權公司董事
主動管理: 基金經理利用其經驗篩選投資項目以實現基金目標
貝他值: 衡量過往波幅的指標,用於衡量某一基金相對於其基準(即某一指數)的走勢
集合投資計劃:
超過一人出資、其目標為增加投資價值或自集合投資中所收取收益的基金。基金經理將集合資金投資於一個或多個類別的資產,如股票、債
券或房地產
成熟市場: 個人收入較高且經濟成熟的國家
新興市場: 正在向成熟市場邁進的國家,通常表現為金融市場出現一定程度的發展、存在某種形式的證券交易所及監管機構
股票: 一間公司所發行的股份
期貨: 一種金融合約,據此買方(賣方)有責任於預定的未來日期按預定的價格購買(出售)某一項資產,例如實物商品或金融工具
增長: 投資價值增加
對沖基金: 集合投資者的資金並投資於各類資產的投資基金,通常包含複雜的投資策略和風險管理技術
對沖: 採用衍生工具類投資以減少風險的一種途徑
收益: 基金所產生的資金回報,例如債券利息或股份股息,可派付予投資者或歸還予基金進行再投資
收益股份: 基金賺取的收益派付予投資者的股份類別
資訊比率: 衡量某一基金相對於其基準的經風險調整回報的指標
市值: 一間公司已發行股份的市場價值總額。按公司的已發行股份數乘以每股當前市價計算
資產淨值: 基金的計劃資產價值減去該基金的負債
經常性開支: 對基金進行投資的成本的衡量指標。 其包含支付予ACD的費用及其他營運成本
市盈率: 就一股股份支付的價格除以公司一年所賺取的每股利潤
優先股: 持有人可享有固定股息的公司股份,該股息的派付優先於普通股股息。 優先股可轉換為公司的普通股
房地產相關證券: 擁有、管理或發展房地產及房地產投資信託(擁有樓宇及土地的投資公司)的房地產公司股份
回報: 投資賺取或損失的資金
股份: 某間公司的基金等價持倉,代表該基金的一部分所有權,包括較大面值股份及較小面值股份
夏普比率: 計算經風險調整回報的指標,此比率已成為該等計算的行業標準
波幅: 某一投資在短期內的變動幅度及頻率的衡量指標
孳息(率): 投資的收益,通常以投資價值的百分比表示
碳強度說明,投資組合對碳密集型公司的持倉以CO²e∕百萬美元收入表示。
碳強度公式,Σ((投資現值∕投資組合現值)*(發行商範圍1和範圍2溫室氣體排放∕發行商的百萬美元收入)
碳強度方法,範圍1和範圍2溫室氣體排放基於投資組合權重(相對於當前投資組合價值的投資現值)而非權益所有權方法。應使用總價值。
公司碳數據往往可「局部披露」,即局部地理覆蓋或不完整營運資料。Trucost*負責分析和研究,以評估公司所報告的結果。專屬Trucost模型
能夠估算總排放量,而不僅只依賴報告的財務資料。對於Trucost未覆蓋的證券,滙豐根據可比公司的平均強度分數分配代理值。*
Trucost為隸屬於S&P_Global的部門,主要評估與氣候變化、自然資源限制以及更廣泛的環境、社會和治理因素相關的風險。

補充資料
AD 美元
AC 美元
ADHKD 港元
除息日
滙豐環球投資基金 - 環球低碳股票2020年2月29日
1.03%
上表僅引用過去12個月內支付的最後一次股息。
並不保證會支付股息,且可能自資本中支付,這會導致資本侵蝕及資產淨值減少。正分派收益率並不表示正回報率。過往分派收益率和付
款並不代表未來的分派收益率和付款。過往付款可能同時包含分派收益及資本。
2019年8月之前的年化收益率的計算方法為簡單收益率計算法:(股息金額/ 除權日的每股或每單位資產淨值) x n;
2019年8月起的年化收益率的計算方法為複合收益率計算法: ((1 +(股息金額/ 除權後資產淨值))^n)-1,n取決於分派頻率。
每年分派為1;每半年分派為2;每季分派為4;每月分派為12。
年化股息收益率根據相關日期的股息分派計算(股息再投資),並可能高於或低於實際每年股息收益率。
每年 2019年7月11日 0.106150
0.109773 1.02%
- - - -
每年 2019年7月11日
每股股息
年化股息率
(派息不獲保證及可
從股本中分派)
股份類別股份類別
基本貨幣派息頻率
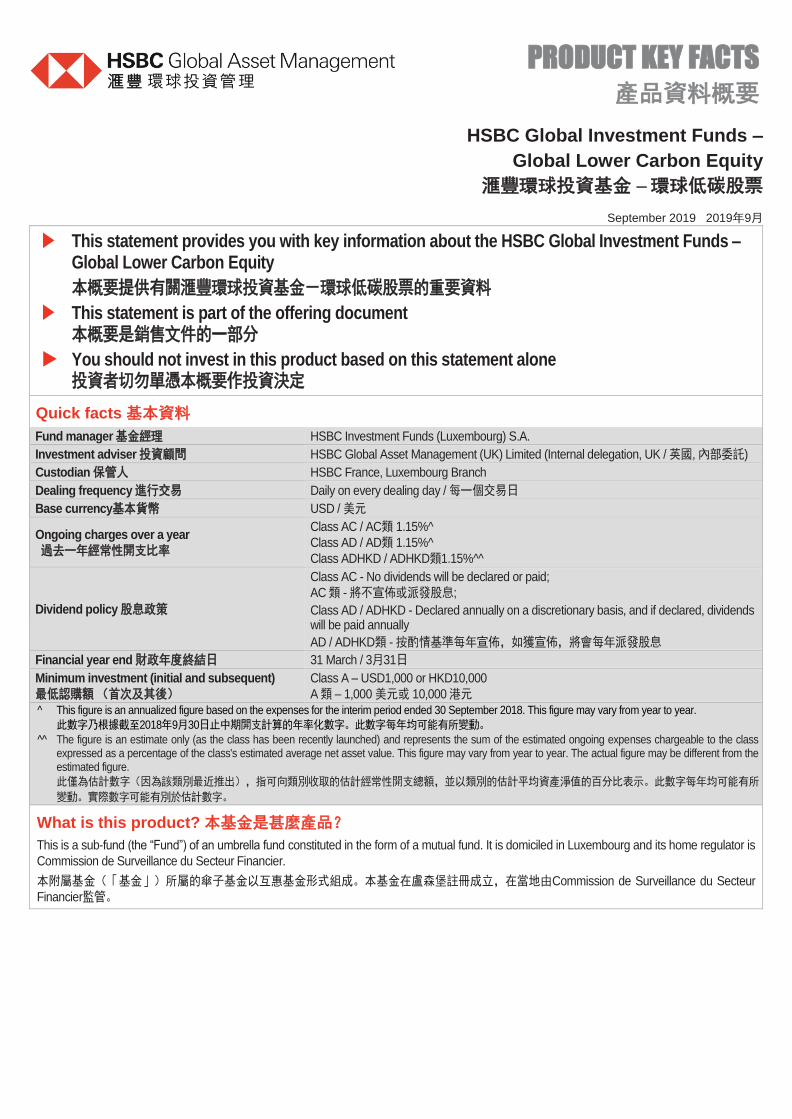
PRODUCT KEY FACTS
產品資料概要
HSBC Global Investment Funds –
Global Lower Carbon Equity
滙豐環球投資基金 – 環球低碳股票
September 2019 2019年9月
This statement provides you with key information about the HSBC Global Investment Funds –Global Lower Carbon Equity
本概要提供有關滙豐環球投資基金-環球低碳股票的重要資料
This statement is part of the offering document 本概要是銷售文件的一部分
You should not invest in this product based on this statement alone 投資者切勿單憑本概要作投資決定
Quick facts 基本資料
Fund manager 基金經理 HSBC Investment Funds (Luxembourg) S.A.
Investment adviser 投資顧問 HSBC Global Asset Management (UK) Limited (Internal delegation, UK / 英國, 內部委託)
Custodian 保管人 HSBC France, Luxembourg Branch
Dealing frequency 進行交易 Daily on every dealing day / 每一個交易日
Base currency基本貨幣 USD / 美元
Ongoing charges over a year
過去一年經常性開支比率
Class AC / AC類 1.15%^
Class AD / AD類 1.15%^
Class ADHKD / ADHKD類1.15%^^
Dividend policy 股息政策
Class AC - No dividends will be declared or paid;
AC 類 - 將不宣佈或派發股息;
Class AD / ADHKD - Declared annually on a discretionary basis, and if declared, dividends will be paid annually
AD / ADHKD類 - 按酌情基準每年宣佈,如獲宣佈,將會每年派發股息
Financial year end 財政年度終結日 31 March / 3月31日
Minimum investment (initial and subsequent) 最低認購額 (首次及其後)
Class A – USD1,000 or HKD10,000
A 類 – 1,000 美元或 10,000 港元
^ This figure is an annualized figure based on the expenses for the interim period ended 30 September 2018. This figure may vary from year to year.
此數字乃根據截至2018年9月30日止中期開支計算的年率化數字。此數字每年均可能有所變動。
^^ The figure is an estimate only (as the class has been recently launched) and represents the sum of the estimated ongoing expenses chargeable to the class expressed as a percentage of the class's estimated average net asset value. This figure may vary from year to year. The actual figure may be different from the estimated figure.
此僅為估計數字(因為該類別最近推出),指可向類別收取的估計經常性開支總額,並以類別的估計平均資產淨值的百分比表示。此數字每年均可能有所
變動。實際數字可能有別於估計數字。
What is this product? 本基金是甚麼產品?
This is a sub-fund (the “Fund”) of an umbrella fund constituted in the form of a mutual fund. It is domiciled in Luxembourg and its home regulator is
Commission de Surveillance du Secteur Financier.
本附屬基金(「基金」)所屬的傘子基金以互惠基金形式組成。本基金在盧森堡註冊成立,在當地由Commission de Surveillance du Secteur
Financier監管。
2
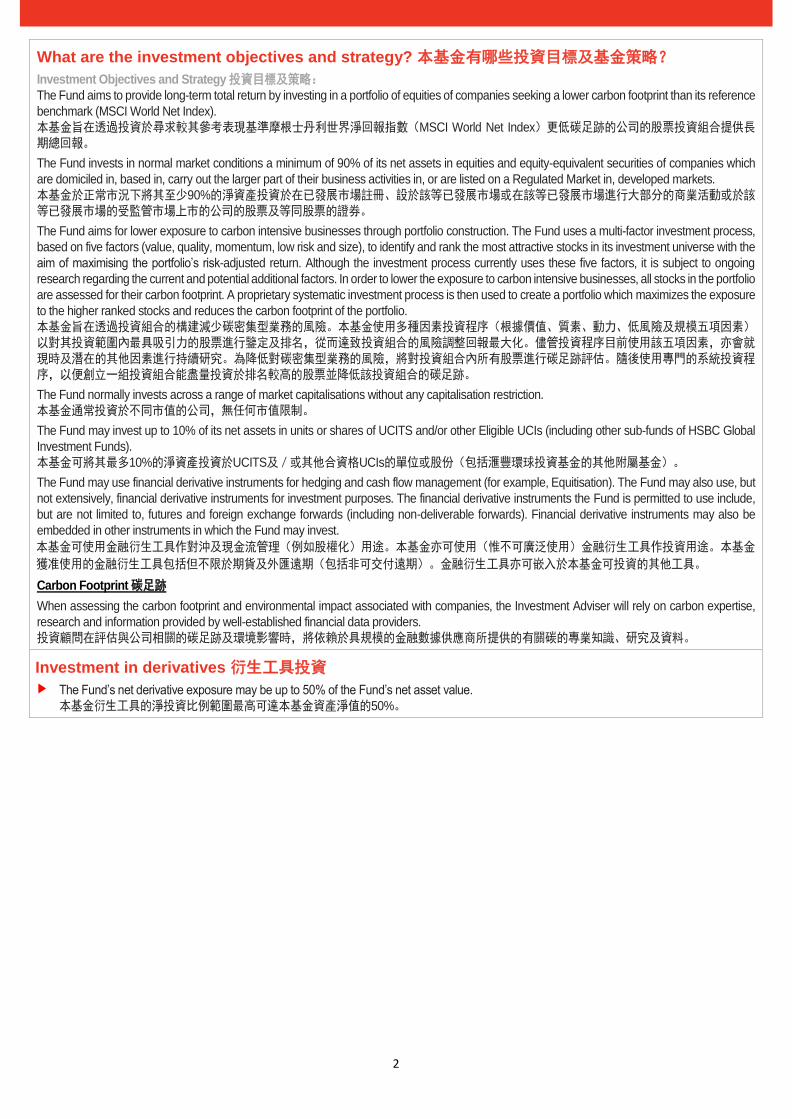
What are the investment objectives and strategy? 本基金有哪些投資目標及基金策略?
Investment Objectives and Strategy 投資目標及策略:
The Fund aims to provide long-term total return by investing in a portfolio of equities of companies seeking a lower carbon footprint than its reference
benchmark (MSCI World Net Index).
本基金旨在透過投資於尋求較其參考表現基準摩根士丹利世界淨回報指數(MSCI World Net Index)更低碳足跡的公司的股票投資組合提供長期總回報。
The Fund invests in normal market conditions a minimum of 90% of its net assets in equities and equity-equivalent securities of companies which
are domiciled in, based in, carry out the larger part of their business activities in, or are listed on a Regulated Market in, developed markets.
本基金於正常市況下將其至少90%的淨資產投資於在已發展市場註冊、設於該等已發展市場或在該等已發展市場進行大部分的商業活動或於該等已發展市場的受監管市場上市的公司的股票及等同股票的證券。
The Fund aims for lower exposure to carbon intensive businesses through portfolio construction. The Fund uses a multi-factor investment process,
based on five factors (value, quality, momentum, low risk and size), to identify and rank the most attractive stocks in its investment universe with the
aim of maximising the portfolio’s risk-adjusted return. Although the investment process currently uses these five factors, it is subject to ongoing
research regarding the current and potential additional factors. In order to lower the exposure to carbon intensive businesses, all stocks in the portfolio
are assessed for their carbon footprint. A proprietary systematic investment process is then used to create a portfolio which maximizes the exposure
to the higher ranked stocks and reduces the carbon footprint of the portfolio.
本基金旨在透過投資組合的構建減少碳密集型業務的風險。本基金使用多種因素投資程序(根據價值、質素、動力、低風險及規模五項因素)以對其投資範圍內最具吸引力的股票進行鑒定及排名,從而達致投資組合的風險調整回報最大化。儘管投資程序目前使用該五項因素,亦會就現時及潛在的其他因素進行持續研究。為降低對碳密集型業務的風險,將對投資組合內所有股票進行碳足跡評估。隨後使用專門的系統投資程序,以便創立一組投資組合能盡量投資於排名較高的股票並降低該投資組合的碳足跡。
The Fund normally invests across a range of market capitalisations without any capitalisation restriction.
本基金通常投資於不同市值的公司,無任何市值限制。
The Fund may invest up to 10% of its net assets in units or shares of UCITS and/or other Eligible UCIs (including other sub-funds of HSBC Global
Investment Funds).
本基金可將其最多10%的淨資產投資於UCITS及/或其他合資格UCIs的單位或股份(包括滙豐環球投資基金的其他附屬基金)。
The Fund may use financial derivative instruments for hedging and cash flow management (for example, Equitisation). The Fund may also use, but
not extensively, financial derivative instruments for investment purposes. The financial derivative instruments the Fund is permitted to use include,
but are not limited to, futures and foreign exchange forwards (including non-deliverable forwards). Financial derivative instruments may also be
embedded in other instruments in which the Fund may invest.
本基金可使用金融衍生工具作對沖及現金流管理(例如股權化)用途。本基金亦可使用(惟不可廣泛使用)金融衍生工具作投資用途。本基金
獲准使用的金融衍生工具包括但不限於期貨及外匯遠期(包括非可交付遠期)。金融衍生工具亦可嵌入於本基金可投資的其他工具。
Carbon Footprint 碳足跡
When assessing the carbon footprint and environmental impact associated with companies, the Investment Adviser will rely on carbon expertise,
research and information provided by well-established financial data providers.
投資顧問在評估與公司相關的碳足跡及環境影響時,將依賴於具規模的金融數據供應商所提供的有關碳的專業知識、研究及資料。
Investment in derivatives 衍生工具投資
The Fund’s net derivative exposure may be up to 50% of the Fund’s net asset value.
本基金衍生工具的淨投資比例範圍最高可達本基金資產淨值的50%。
3
What are the Key Risks? 本基金有哪些主要風險?
Investments involve risks. Please refer to the offering document for details including the risk factors.
投資附帶風險。請參閱銷售文件以便獲取其他資料,包括風險因素。
Investment risk 投資風險
The Fund's investment portfolio may fall in value due to any of the key risk factors below and therefore your investment in the Fund may suffer
losses. There is no guarantee of the repayment of principal.
本基金的投資組合價值可能因下列任何主要風險因素而下跌,故閣下於本基金的投資可能會蒙受虧損。概不保證可償還本金。
General liquidity risk 一般流動性風險
The Fund’s investment portfolio will be exposed to liquidity risks – meaning it may take time to sell assets and/or assets may need to be sold at
a discount. This risk is greater in exceptional market conditions when a large number of market participants may seek to liquidate their
investments which may include the Fund. The Fund may employ a number of techniques to manage liquidity including pricing adjustments and
temporarily suspending redemptions.
本基金的投資組合將承受流動性風險-意味著其需時出售資產及/或資產可能需以折讓價出售。當出現大量市場參與者尋求變現其投資
(可能包括本基金)的特殊市況時,此風險便較大。本基金可運用若干技巧管理流動性,包括定價調整及暫時停止贖回。
Currency risk 貨幣風險
Where the currency of the underlying assets differs to the currency used to quote a share’s price, such price may be affected unfavourably by
fluctuations in exchange rates between these currencies.
若相關資產的貨幣有別於用作股份報價的貨幣,該價格可能因此等貨幣之間的匯率波動而受到不利影響。
Exchange rates may be affected by changes to exchange rate controls amongst other political and economic events.
除其他政治和經濟事件外,匯率亦可能受匯率管制的變動所影響。
Geographic concentration risk 地域集中風險
The Fund’s investments are concentrated in a certain geographical region(s). The value of the Fund may be more volatile than that of a fund
having a more diverse portfolio of investments.
本基金集中投資於若干地區。本基金的價值可能比具有更廣泛投資組合的基金更反覆波動。
Further, the value of the Fund may be more susceptible to adverse economic, political, policy, foreign exchange, liquidity, tax, legal or regulatory
event affecting such geographical region(s).
此外,本基金的價值可能較容易受到影響有關地區的不利經濟、政治、政策、外匯、流動性、稅務、法律或監管事件的影響。
Risk associated with small/mid-capitalisation companies 與中/小型公司有關的風險
The stock of small/mid-capitalisation companies may be exposed to greater liquidity risk, be more volatile and be more sensitive to adverse
economic developments than those of larger capitalisation companies in general.
一般而言,相比較大型公司,中/小型公司的股票可能承受較高的流動性風險、較為波動及對經濟的不利發展較為敏感。
Derivative instrument risk 衍生工具風險
Risks associated with financial derivative instruments include counterparty/credit risk, greater liquidity risk, valuation risk and volatility risk.
與金融衍生工具相關的風險包括對手方/信貸風險、更大的流動性風險、估值風險及波動性風險。
The use of derivatives for investment purposes may involve leverage. Leverage can result in a loss significantly greater than the amount invested
in derivatives by the Fund leading to a higher risk of significant loss by the Fund.
使用衍生工具作投資用途可能涉及槓桿。槓桿可能導致損失遠遠大於本基金對衍生工具的投資金額,令本基金遭受重大損失的風險增加。

4
How has the Fund performed? 本基金過往的業績表現如何?
Past performance information is not indicative of future performance. Investors may not get back the full amount invested.
過去業績並不代表將來的表現。投資者可能不能取回全部投資金額。
The computation basis of the performance is based on the calendar year end, NAV-to-NAV, with dividend reinvested.
業績表現以曆年末的資產淨值作為比較基礎,股息會滾存再作投資
These figures show by how much the share class increased or decreased in value during the calendar year being shown. Performance data
has been calculated in USD including ongoing charges and excluding subscription fee and redemption fee you might have to pay.
數據顯示股份類別於上述曆年的價值升跌。業績數據以美元計算,包括經常性開支但不包括您可能需支付的認購費用及贖回費用。
Where no past performance is shown there was insufficient data available in that year to provide performance.
假如並無顯示過往表現,則表示該年度並無足夠數據以提供表現。
The Fund has formally adopted MSCI World Net as the reference performance benchmark of the Fund. The reference performance
benchmark is shown for comparison purposes only and the Fund may not be managed to the reference performance benchmark.
本基金正式採用摩根士丹利世界淨回報指數(MSCI World Net)作為本基金的參考表現基準。所示參考表現基準僅供比較用途,而本基金不一定依據參考表現基準予以管理。
Fund launch date: 27/09/2017
基金成立日期:27/09/2017
Class AC launch date: 27/09/2017
AC 類成立日期:27/09/2017
Class AC is a share class open for investment by Hong Kong retail investors and denominated in the Fund’s base currency.
AC 類乃開放予香港零售投資者投資及以本基金的基本貨幣計價的股份類別。
Is there any guarantee? 本基金有否提供保證?
The Fund does not have any guarantees. You may not get back the full amount of money you invest.
本基金並不提供任何保證。閣下未必能全數取回投資本金。
-11.7
-9.4
-14.0
-12.0
-10.0
-8.0
-6.0
-4.0
-2.0
0.0
2014 2015 2016 2017 2018
%
HSBC Global Investment Funds - Global Lower Carbon Equity (AC)
滙豐環球投資基金 –環球低碳股票 (AC)
Fund 基金 Benchmark 基準
5 Issued by HSBC Global Asset Management (Hong Kong) Limited
由滙豐環球投資管理(香港)有限公司刊發
What are the fees and charges? 本基金涉及哪些費用?
Charges which may be payable by you 認購本基金時閣下或須支付的費用
You may have to pay the following fees when dealing in the Fund. 閣下買賣本基金時可能須要支付以下費用。
Fees 費用 What you pay 您須支付
Subscription fee 認購費 Up to 4.50% of the total subscription amount* 最高達認購總額的4.50%*
Switching fee 轉換費 Up to 1% of the Switch-Out proceeds* 最高達轉出所得款項的1%*
Redemption fee 贖回費 Nil* 無*
* You may need to bear additional costs under certain situations in order to mitigate any adverse impacts to the Fund caused by the transactions. Please refer
to the offering document for further details.
為減輕交易可能對本基金造成的不利影響,閣下可能在某些情況下承擔額外費用。進一步詳情請參閱銷售文件。
Ongoing fees payable by the Fund 本基金持續繳付的費用
The following expenses will be paid out of the Fund. They affect you because they reduce the return you get on your investments.
以下收費將從本基金總值中扣除,閣下的投資回報將會因而減少。
Fees 費用 Annual rate (as a % of the Net Asset Value of the Fund) 年率(以本基金資產淨值之%)
Management fee 管理費 0.80%^
Custodian fee 保管費 Not applicable, included in Administrative fee 不適用,已包括在行政費內
Administrative fee 行政費 0.35%#
Performance fee 表現費 Not applicable 不適用
^ The fees and charges may be increased up to maximum level as specified in the offering document by giving at least one month’s prior notice to investor.
Please refer to the offering document for further details.
費用可增至銷售文件所定的最高水平,但須予最少1個月預先通知投資者。進一步詳情請參閱銷售文件。 # The fees and charges may be increased up to maximum level as specified in the offering document by giving at least one month’s prior notice to investor.
Please refer to the offering document for further details.
費用可增至銷售文件所定的最高水平,但須予最少1個月預先通知投資者。進一步詳情請參閱銷售文件。
Other fees 其他收費
You may have to pay other fees and charges when dealing in the Fund.
閣下買賣本基金時可能須要支付其他費用。
Additional information 其他資料
You generally buy and redeem shares at the Fund’s next-determined subscription price and redemption price with reference to the Net Asset
Value (NAV) after the intermediaries receive your request in good order on or before 4:00pm (HK Time), being the Fund’s dealing cut-off time.
一般而言,閣下認購及贖回本基金股份的價格,是在中介人於香港時間下午4時或之前(即本基金的交易截止時間)收到閣下的完整指示後,參照本基金資產淨值而釐定的下一個認購價及贖回價。
Intermediaries who sell the Fund may impose earlier cut-off times for receiving instructions for subscriptions, redemptions or switching.
Investors should pay attention to the arrangements of the intermediary concerned.
銷售本基金的中介人可能就接受認購、贖回或轉換指示實施較早的截止時間。投資者須注意有關中介人的安排。
Investors may obtain the past performance information of other share classes offered to Hong Kong investors (if available) at
www.assetmanagement.hsbc.com/hk (the website has not been reviewed by the SFC).
投資者可瀏覽 www.assetmanagement.hsbc.com/hk(網頁並未經證監會批閱)以取得向香港投資者發售的其他股份類別的往績表現資料。
The net asset value of the Fund is calculated and the price of the Fund is published on each dealing day. The Fund prices are available online
at www.assetmanagement.hsbc.com/hk (the website has not been reviewed by the SFC).
本基金的資產淨值及價格均於每個交易日計算及刊登。本基金價格刊登於 www.assetmanagement.hsbc.com/hk (網頁並未經證監會批閱)。
Important 重要資料
If you are in doubt, you should seek professional advice.
閣下如有疑問,請應諮詢專業意見。
The SFC takes no responsibility for the contents of this statement and makes no representation as to its accuracy or completeness.
證監會對本概要的內容並不承擔任何責任,對其準確性或完整性亦不作出任何陳述。