sustaining change in healthcare: learning from local successes
TRANSCRIPT

Sustaining change in healthcare:
learning from local successes
6 May 2015
Sustaining Change in HealthcareGetting under the skin of the problem and remaining relevant to local context in the Knee High Design Challenge
Mat Hunter
Chief Design Officer, Design Council

Pop up parks

Creative Homes

Kids Connect

Framing the challenge
1

Double Diamond

Ethnographic
research


Convening diverse talent
2


Supporting trial and error
3


Staged Investment

In summary:
1. Framing the challenge
2. Convening diverse talent
3. Supporting trial and error

Thank You

Sustaining change in healthcare:
learning from local successes
6 May 2015

Sustaining change
Jane Stopher
www.dmi-diabetes.org.uk
June 2014 20
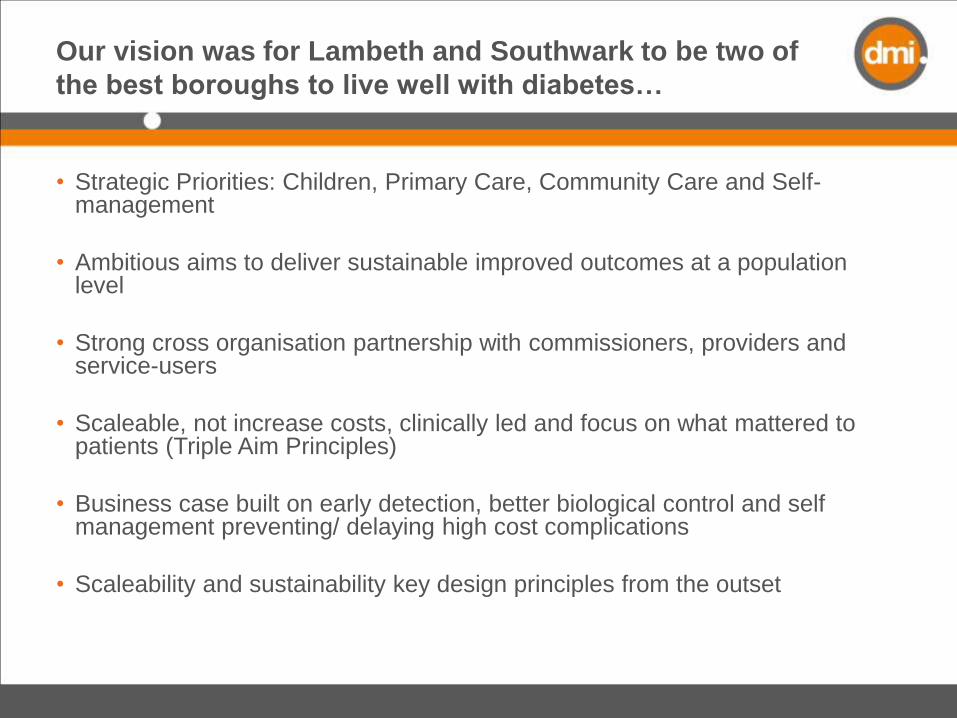
Our vision was for Lambeth and Southwark to be two of
the best boroughs to live well with diabetes…
• Strategic Priorities: Children, Primary Care, Community Care and Self-management
• Ambitious aims to deliver sustainable improved outcomes at a population level
• Strong cross organisation partnership with commissioners, providers and service-users
• Scaleable, not increase costs, clinically led and focus on what mattered to patients (Triple Aim Principles)
• Business case built on early detection, better biological control and self management preventing/ delaying high cost complications
• Scaleability and sustainability key design principles from the outset

June 2014 21
Measurement as legacy
• Lambeth and Southwark and the DMI cited as a London exemplar in London’s Blood Sugar Rush report, 2013
• Quality in Care winners for “Best CCG initiative” and “Best Cross-organisational partnership” 2014
• Chair of Voluntary Group, highly commended, NHS Participant of the year, 2014
• The Commonwealth Fund, case study 2014
• IHI presentation, 2015: “Achieving triple aim in inner London”
• External economic evaluation (OPM)
• Direct reductions in service delivery and indirect benefits from long term health improvements.
• In total, savings are expected:
• £1.34m in year 1 (ranging from £933k to £1.68m).
• £10.10m over the next 5 years(ranging from £5.54m to £14.13m) and
• £29.38m over 10 years(ranging from £12.25m to £45.40m).

June 2014 22
How do you measure a system of excellence?

June 2014 23
Focus the system on population health:
• The combined register size has grown by 23% since 2009/10; 16.6% since 2010/11.
• While growth over the past year slowed to 3% (compared with 9% the year before), this still represents around 800 additional patients on the registers.
Lambeth
Southwark
10,000
11,000
12,000
13,000
14,000
15,000
16,000
2009/10 2010/11 2011/12 2012/13 2013/14
Lambeth and Southwark diabetes patient registers 2009/10 to 2013/14

June 2014 24
Focus the system on flow through care settings: Specialist
diabetes care in the community
0
50
100
150
200
250
300
350
Qtr1 Qtr2 Qtr3 Qtr4 Qtr1 Qtr2 Qtr3 Qtr4 Qtr1 Qtr2 Qtr3 Qtr4
2011/12 2012/13 2013/14
Outpatients: GP-initiated 1st attendances
Lambeth CCG
Southwark CCG
020406080
100120140160180200
Qtr
4
Qtr
1
Qtr
2
Qtr
3
Qtr
4
Qtr
1
Qtr
2
Qtr
3
Qtr
4
Qtr
1
Qtr
2
Qtr
3
Qtr
4
Qtr
1
Qtr
2
Qtr
3
Qtr
4
2010/11 2011/12 2012/13 2013/14
Nu
mb
er
of
em
erg
en
cy a
dm
issi
on
s
Emergency Admissions - Primary Diagnosis: DiabetesLambeth & Southwark registered patients
GSTT & KING'S
June 2014 25
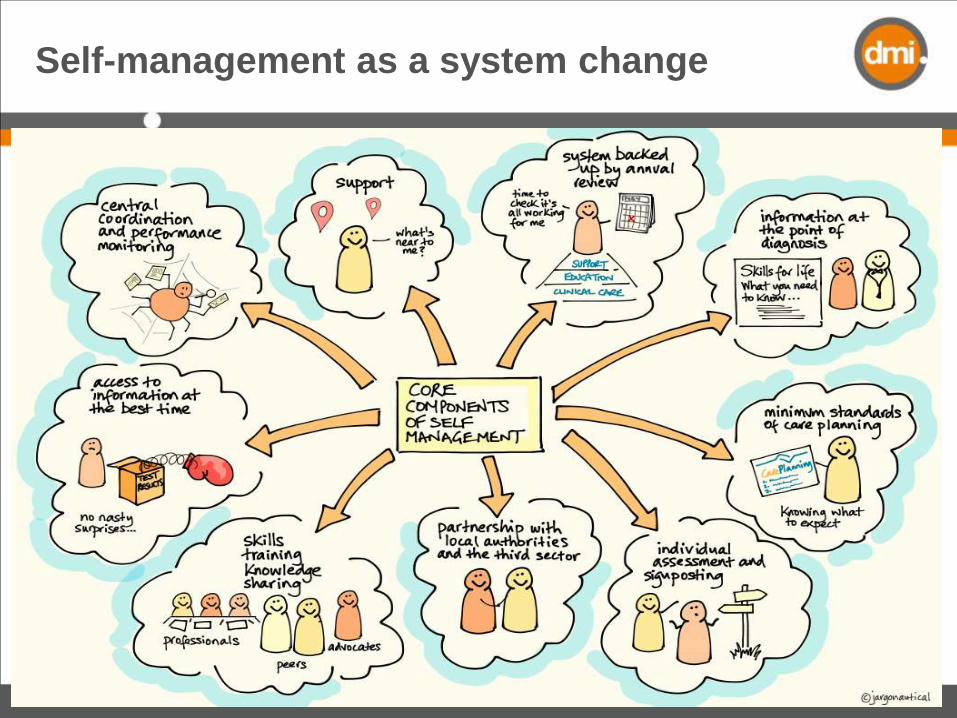
Self-management as a system change

June 2014 26
Setting Minimum Standards for care
planning enabled routine adoption
• 2013/14 data are numbers of care plans coded with GP systems
• Assessment of quality is included in Southwark CCG scheme in 2014/15
• Care planning advocates quality assure in eye screening services
17%
39%
0% 10% 20% 30% 40% 50%
Lambeth & Southwark
combined
% of people on diabetes registers with a collaborative care plan
2013/14
2012/13

June 2014 27
2011/12 2013/14 Change Annual
DMI 719.0 1294.8 80.1% 40.0%
Lambeth 418.0 829.2 98.4% 49.2%
2010/11 2013/14 Change Annual
Southwark 266.0 465.6 75.0% 25.0%
0
200
400
600
800
1000
1200
1400
2010/11 2011/12 2012/13 2013/14
An
nu
al A
tte
nd
ance
s
Attendances at structured education
DMI Lambeth Southwark
Attendances at structured education: the number of patients attending structured education, note for Lambeth this includes DESMOND and alternative courses.
Source: Local DMI data
No comparator
Systematically offer people education on diagnosis

June 2014 28
Support primary care to deliver best practice

June 2014 29
60%
65%
70%
75%
80%
2010/11 2011/12 2012/13 2013/14Pe
rce
nta
ge o
f p
eo
ple
on
dia
bet
es
regi
ste
r (a
ged
17
+)
HbA1c ≤ 64mmol/mol
DMI ONS group Blue group London England
ONS group: Brent, City &
Hackney, Haringey, Lewisham, Newham
Blue group: Barnet, Camden,
Croydon, Enfield, Greenwich, Hammersmith & Fulham, Haringey, Hillingdon, Islington, Kensington & Chelsea, Kingston, Lewisham, Richmond, Sutton & Merton, Waltham Forest, Wandsworth, Westminster
Source: National data – QOF
2010/11 2012/13 Change Annual
DMI 67.3% 67.8% 0.7% 0.3%
ONS group 67.0% 65.1% -2.8% -1.4%
Blue group 68.9% 66.0% -4.1% -2.1%
London 68.5% 66.3% -3.2% -1.6%
England 70.5% 68.5% -2.8% -1.4%
Better glucose control for over 5,500 people

June 2014 30
Healthy blood pressure control for over 6000
people
60%
65%
70%
75%
80%
2010/11 2011/12 2012/13 2013/14Pe
rce
nta
ge o
f p
eo
ple
on
dia
bet
es
regi
ste
r (a
ged
17
+)
Blood pressure ≤ 140/80
DMI ONS group Blue group London EnglandONS group: Brent, City &
Hackney, Haringey, Lewisham, Newham
Blue group: Barnet, Camden,
Croydon, Enfield, Greenwich, Hammersmith & Fulham, Haringey, Hillingdon, Islington, Kensington & Chelsea, Kingston, Lewisham, Richmond, Sutton & Merton, Waltham Forest, Wandsworth, Westminster
Source: National data – QOF
2011/12 2012/13 Change Annual
DMI 61.8% 66.4% 7.5% 7.5%
ONS group 64.6% 66.2% 2.4% 2.4%
Blue group 63.1% 65.3% 3.6% 3.6%
London 64.0% 66.3% 3.6% 3.6%
England 65.2% 67.2% 3.0% 3.0%

June 2014 31
• 3,951 more people with diabetes received all 9 care processes in 2013/14
• Greatest improvements in ACR, foot checks and smoking status
Big improvements in people receiving all
Nine Care Processes in primary care
31.53%
45.50%
34%
47.71%
0% 10% 20% 30% 40% 50% 60%
2012/13
2013/14
Percentage of diabetes register receiving all 9 care processes
Southwark Lambeth

June 2014 32
Learnings
• Measurement tells the story of change and helps the
“flame shine bright”- macro, meso and micro levels
• Creates shared purpose and ambition, and a route map
• System measures shine light into the shadows and
across our “borders”
• User led measures truly test the process or experience
• Draw on multiple expertise and methodology
• Accept the data isn’t perfect

Sustaining change in healthcare:
learning from local successes
6 May 2015

Sustainability – establishing and maintaining the right relationships
Dr Nigel Hewett Medical Director Pathway


Hewett et al. A general practitioner and nurse led
approach to improving hospital care for homeless people
BMJ 2012;345:e5999


Establishing Relationships
• Needs assessment – gathered data and opinions from all stakeholders in hospitals and community, especially service users
• Steering group for needs assessment became steering group for the project – key clinical managers from the 3 Trusts, KHP and Lambeth CCG (commissioners)

Maintaining Relationships
• Continuous process of progress reports, launch events, annual reports
• Data and outcomes presented in a way which chimes with current drivers for the particular audience

Homeless people attend A&E 5 times as much, are admitted 3 times as often, and stay 3 times as long as the general public. Overall they cost 8 times as much.1
The average age of death for homeless people is just 47 years.2
Why target homeless people?

• Marmot review –‘proportionate universalism’
• Public Health Outcomes Framework
• Health and Social Care Act 2012
and the policy reasons…

• Tri-morbidity• Lack of follow-up care
Lack of local connection and/or lack of appropriate accommodation options
Chaos in the client group
Why the poor outcomes….?

The ‘Pathway’ approach
Bed days reduced by 30%... and
a better patient experience

How was this achieved?
• Maximising the benefit of admissions
• Expert and sensitive support team with specific skill sets
• Team fully linked in to homeless community services
• Delayed discharges

Homeless attendance data 2011
A&E
attendances
Hospital
admissions
Cost
GSTT 4923 1379 £5,623,810
KCH 718 240 £947,289
SLAM 148 £2,670,553

Page 49
A pilot service involving 13 staff
•Multi-agency…

Page 50A new pathway for homeless patients
• Attending St Thomas’,Guy’s or King’s
Homeless person
• GSTT base: GP 0.4 wte; RN 2 wte; OT 1wte; HSW 3 wte; Admin 1wte
• KCH base: GP 0.4 wte; MHP 1 wte; SW 0.4wte; HSW 1 wte
KHP Pathway
Homeless Team
• Practical assistance
• Health review
• Housing
• Reconnections
• Frequent attender work
• Safeguarding
Integrated,
multi-professional assistance
•Outreach teams
•Day centres
•Homeless health teams
•GP practices
Community support
• Peer advocate support with physical health appointments and GP registration
Groundswell

Page 51
What do we do?
• Practical assistance
• Comprehensive health reviews
• Linking in with community services
• Help to find housing
• Reconnection work
• Frequent attender casework
• Safeguarding of vulnerable adults
• Tap-dancing, juggling, stand-up…

Maintaining Relationships
• “Integration”, “KHP”, “Mental and Physical Health”, “Health Inequalities”, “Value”, “Efficiency” A&E frequent attenders etc etc.
• Encourage ownership by partners – share the benefits – look at this fabulous thing you have done!

Page 53
Data at 4 weeksGSTT Kings
No of referrals 116 (109 people)
40(39 people)
% on CHAIN 75% 22%
Key referral routes 39% from A&E
22 wards
Community
25% from A&E
19 wards
Community

Page 54
Data at 4 weeks
GSTT Kings
% seen / casework
undertaken
93% 82%
% improved
housing status at
discharge
28.5% 32.5%
Reconnections 8 1
Feedback
questionnaires
19 returned –
16 ‘excellent’,
3 ‘good’
1 returned –
‘excellent’

Page 55
Borough links on dischargeGSTT Kings
Westminster 18.9% -
Lambeth 15.8% 18.1%
Southwark 13.1% 27.5%
Lewisham 3.7% 9%
Other London 14.9% 12.1%
Outside London 19.6% -
Unknown 14% 33.3%

Case Studies – tell the stories
Page 56

Thank you

Sustaining change in healthcare:
learning from local successes
6 May 2015