sustaining momentum reports/2007annualreport.pdf · 1 sustaining momentum 2 vision mission values...
TRANSCRIPT
Sustaining Momentum2007 Annual Report

Table of Contents1 Sustaining Momentum2 Vision Mission Values3 Company Profi le4 Message to our Stockholders8 Operating Highlights26 Corporate Governance30 Audit Committee Report31 Financial Highlights35 Statement of Management’s Responsibility36 Report of Independent Auditors37 Consolidated Statements of Financial Position38 Consolidated Statements of Income39 Consolidated Statements of Comprehensive Income40 Consolidated Statements of Changes in Equity41 Consolidated Statements of Cash Flows42 Notes to Consolidated Financial Statements 77 List of Banks and Financial Institutions78 Board of Directors80 Management Committee 82 Terminals and Depots 83 Product List84 Information and Assistance
Net Income Market Share (In Million Pesos) (In Percent)
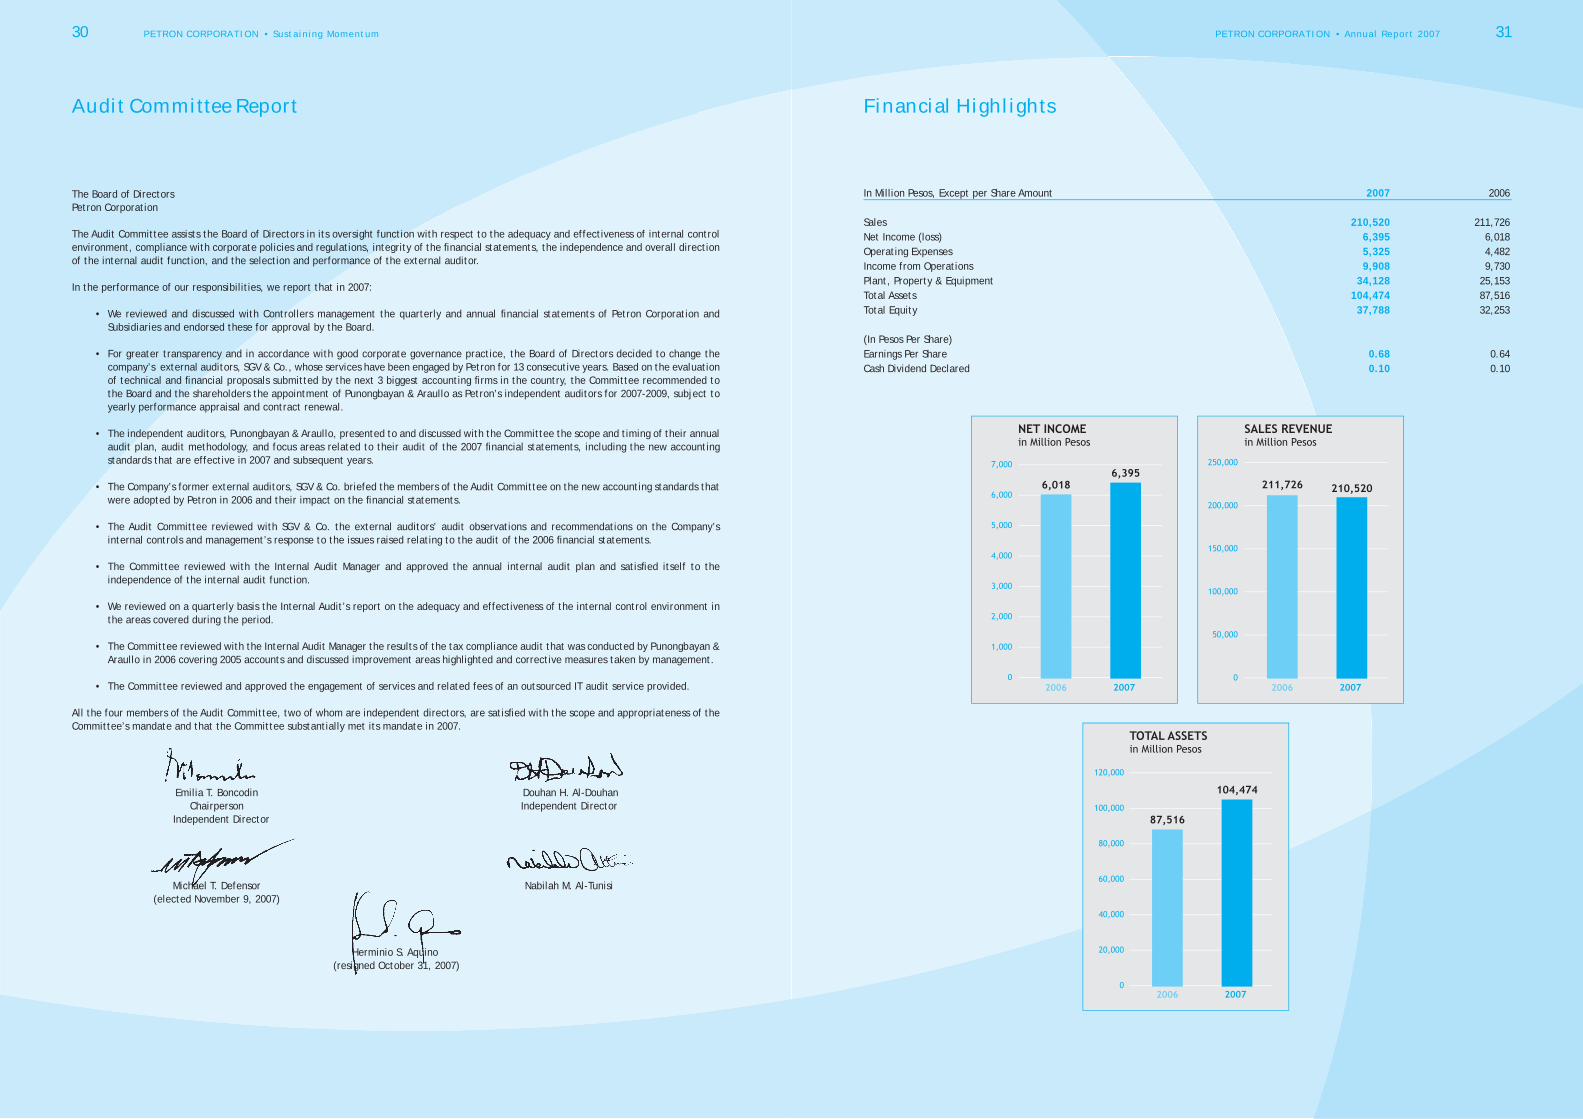
2007 6,395 38.9
Sustaining Momentum
Petron continually strives to be a more people-and planet-friendly organization as it builds more modern facilities that comply with the strictest global environmental standards, succeeding to generate more employment and help the local economy fl ourish.
2006 6,018 38.8
2005 6,051 38.1
2004 4,101 37.7
2003 3,114 33.8
2002 2,921 32.9
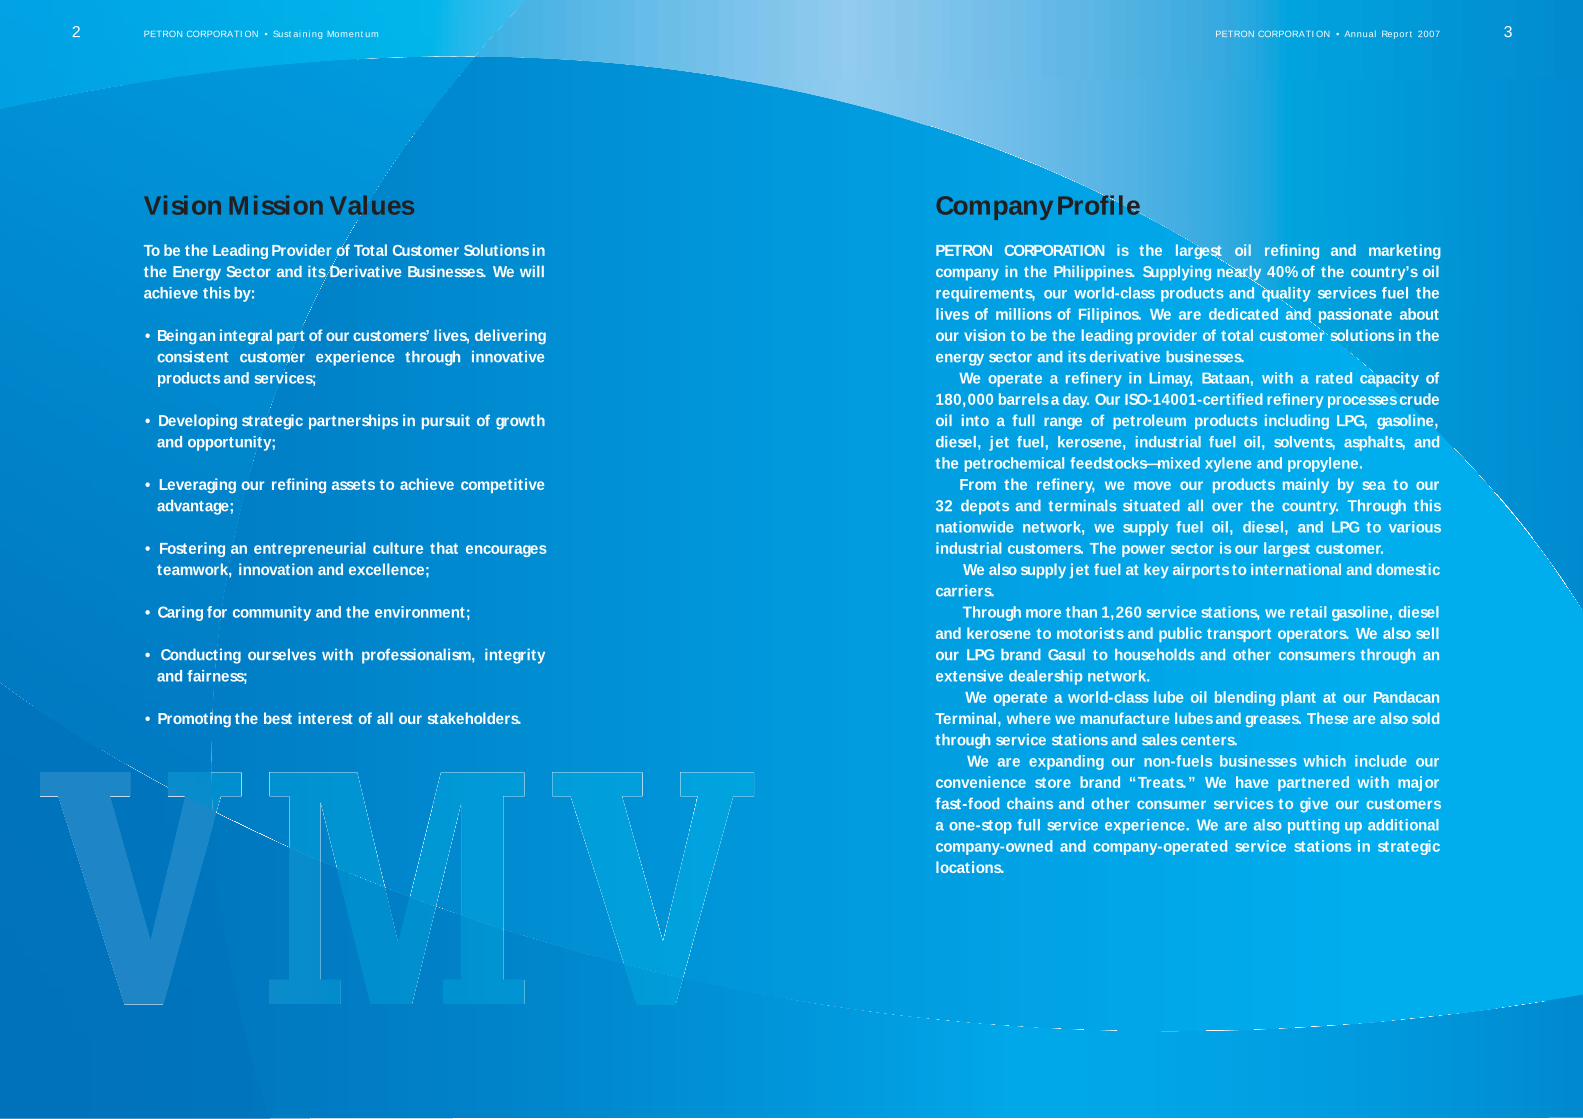
Vision Mission Values
To be the Leading Provider of Total Customer Solutions in the Energy Sector and its Derivative Businesses. We will achieve this by:
• Being an integral part of our customers’ lives, delivering consistent customer experience through innovative products and services;
• Developing strategic partnerships in pursuit of growth and opportunity;
• Leveraging our refi ning assets to achieve competitive advantage;
• Fostering an entrepreneurial culture that encourages teamwork, innovation and excellence;
• Caring for community and the environment;
• Conducting ourselves with professionalism, integrity and fairness;
• Promoting the best interest of all our stakeholders.
Company Profi le
PETRON CORPORATION is the largest oil refi ning and marketing company in the Philippines. Supplying nearly 40% of the country’s oil requirements, our world-class products and quality services fuel the lives of millions of Filipinos. We are dedicated and passionate about our vision to be the leading provider of total customer solutions in the energy sector and its derivative businesses.
We operate a refi nery in Limay, Bataan, with a rated capacity of 180,000 barrels a day. Our ISO-14001-certifi ed refi nery processes crude oil into a full range of petroleum products including LPG, gasoline, diesel, jet fuel, kerosene, industrial fuel oil, solvents, asphalts, and the petrochemical feedstocks—mixed xylene and propylene.
From the refi nery, we move our products mainly by sea to our 32 depots and terminals situated all over the country. Through this nationwide network, we supply fuel oil, diesel, and LPG to various industrial customers. The power sector is our largest customer.
We also supply jet fuel at key airports to international and domestic carriers.
Through more than 1,260 service stations, we retail gasoline, diesel and kerosene to motorists and public transport operators. We also sell our LPG brand Gasul to households and other consumers through an extensive dealership network.
We operate a world-class lube oil blending plant at our Pandacan Terminal, where we manufacture lubes and greases. These are also sold through service stations and sales centers.
We are expanding our non-fuels businesses which include our convenience store brand “Treats.” We have partnered with major fast-food chains and other consumer services to give our customers a one-stop full service experience. We are also putting up additional company-owned and company-operated service stations in strategic locations.
2 PETRON CORPORATION • Sustaining Momentum PETRON CORPORATION • Annual Report 2007 3
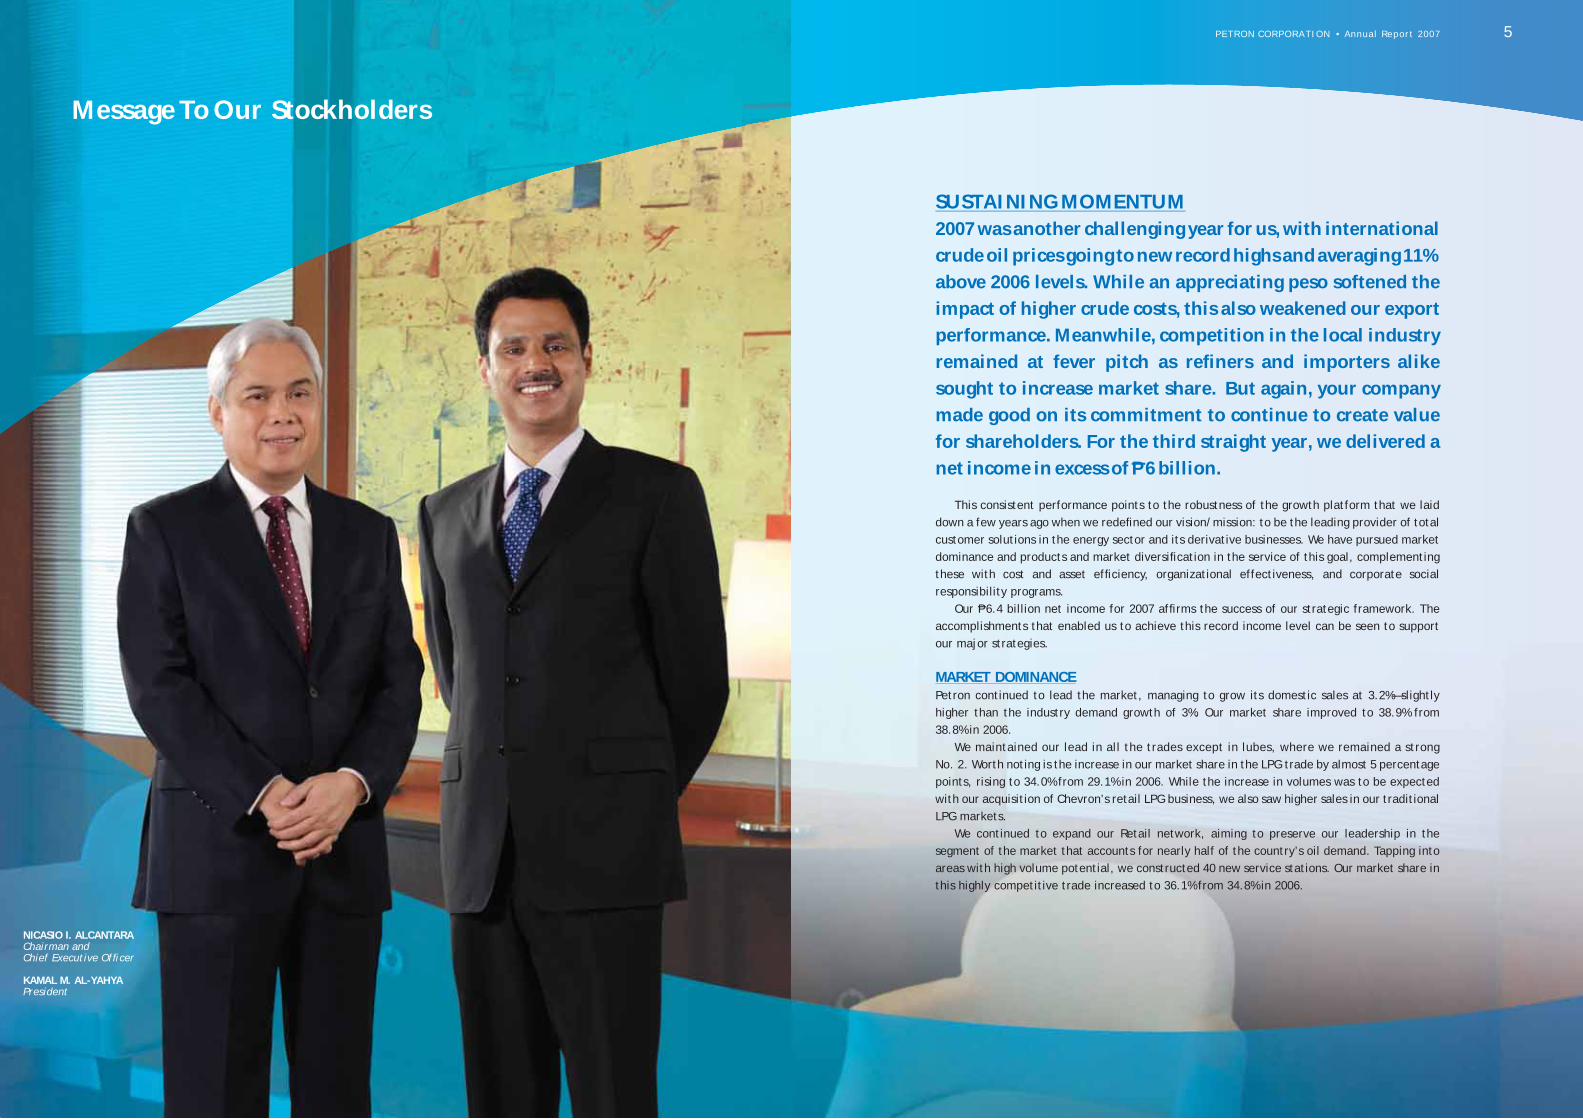
SUSTAINING MOMENTUM2007 was another challenging year for us, with international
crude oil prices going to new record highs and averaging 11%
above 2006 levels. While an appreciating peso softened the
impact of higher crude costs, this also weakened our export
performance. Meanwhile, competition in the local industry
remained at fever pitch as refi ners and importers alike
sought to increase market share. But again, your company
made good on its commitment to continue to create value
for shareholders. For the third straight year, we delivered a
net income in excess of P 6 billion.
This consistent performance points to the robustness of the growth platform that we laid down a few years ago when we redefi ned our vision/mission: to be the leading provider of total customer solutions in the energy sector and its derivative businesses. We have pursued market dominance and products and market diversifi cation in the service of this goal, complementing these with cost and asset effi ciency, organizational effectiveness, and corporate social responsibility programs.
Our P6.4 billion net income for 2007 affi rms the success of our strategic framework. The accomplishments that enabled us to achieve this record income level can be seen to support our major strategies.
MARKET DOMINANCEPetron continued to lead the market, managing to grow its domestic sales at 3.2%—slightly higher than the industry demand growth of 3%. Our market share improved to 38.9% from 38.8% in 2006.
We maintained our lead in all the trades except in lubes, where we remained a strong No. 2. Worth noting is the increase in our market share in the LPG trade by almost 5 percentage points, rising to 34.0% from 29.1% in 2006. While the increase in volumes was to be expected with our acquisition of Chevron’s retail LPG business, we also saw higher sales in our traditional LPG markets.
We continued to expand our Retail network, aiming to preserve our leadership in the segment of the market that accounts for nearly half of the country’s oil demand. Tapping into areas with high volume potential, we constructed 40 new service stations. Our market share in this highly competitive trade increased to 36.1% from 34.8% in 2006.
NICASIO I. ALCANTARAChairman andChief Executive Offi cer
KAMAL M. AL-YAHYAPresident
Message To Our Stockholders
PETRON CORPORATION • Annual Report 2007 5

PRODUCTS AND MARKET DIVERSIFICATION Our diversifi cation efforts continued to pay off in 2007.
Sales from our non-fuel businesses grew nearly 33%, with franchises (e.g., Jollibee, Chowking, Gloria Jean’s) showing a revenue growth of around 53% and convenience (Treats) stores, 23%.
Our entry into non-traditional outlets for our lubes has likewise been highly successful. Our lube exports to Cambodia increased by almost 75% in 2007. Domestically, sales generated by Petron Service Centers were up 17.5% while those of distributors more than doubled. To further boost our lube sales, we also opened 5 Petron Car Care Centers during the year.
In the autoLPG market, we have the highest market share at nearly 30%, which is 7 percentage points ahead of our nearest competitor. Our share is nearly double than what we had in 2006, when we were only the second largest player in this sub-sector.
COST AND ASSET EFFICIENCYDuring the year, we continued our efforts to improve effi ciency and manage costs in our supply chain and other key areas.
Our Bataan refi nery met its target for processing effi ciency and did better than target for operational availability. Mixed xylene production was higher than planned, and improved from solvent grade to the more valuable isomer grade in the second quarter.
Petron had signifi cantly lower crude freight costs compared to the other refi ner in the country, sustaining a historical trend. By entering into contracts of affreightment to guarantee availability of quality vessels, we also enjoyed better-than-market freight rates and obtained savings of over $3 million.
In domestic product transshipment, we proceeded with our Shipping Alliance Project, which aims to replace our contracted marine fl eet with modern, high-performance, and safer vessels while managing costs. Three out of 6 vessels in the program were in service by end 2007, with the remaining 3 for commissioning in early 2008.
In the area of fi nance, our costs for the year were signifi cantly lower than in 2006. Working capital fi nancing was obtained at better-than-market lending rates. Furthermore, agility in the timing of hedging activities resulted in P1.1 billion in forex gains.
Asset management and other fi nancial transactions contributed around P193 million to the bottom line, while our insurance subsidiaries brought in P177 million in income.
ORGANIZATIONAL EFFECTIVENESSPetron continued to pursue programs designed to enhance employee productivity, including initiatives in information technology and human resource management.
Attesting to the success of its HR programs, Petron was one of the top fi nalists for the Personnel Management Association of the Philippines (PMAP) Employer of the Year Award.
In an employee opinion survey done across Asia by a global company, Petron scored higher than the Asian norm in 14 out of 15 categories. The survey results highlighted employees’ pride in the company, as well as understanding of business goals and alignment of their work to these goals.
CORPORATE SOCIAL RESPONSIBILITY (CSR)Our commitment to CSR programs remained a major theme in Petron’s corporate agenda.
Under our fl agship project which is HOPE or Helping Filipino Children and the Youth Overcome Poverty through Education, the company’s support extended to over 6,000 school children in public elementary schools. In the school year ending in 2007, there were 380 outstanding and 55 fi rst honor students among these children. The fi rst batch of more than 1,000 students will be graduating in March 2008.
The company also built 8 Petron Schools in 2007, bringing the total of such schools to 21, with a total of 81 classrooms.
2007 also marked the launch of our new major environmental initiative called “Life and Livelihood: Sustaining the Tubbataha Reefs and the Sulu Sea.” In partnership with World Wide Fund (WWF) Philippines, Petron aims to help preserve what is considered an invaluable resource for marine biodiversity in the country.
MOVING TO THE PETROCHEMICAL DECADEThe next phase of Petron’s growth is anchored on diversifi cation into petrochemicals. While our fuels business will continue to provide a stable earnings base, petrochemical feedstocks—with the global market premiums they command relative to fuels—will take us to a new growth trajectory.
At the end of 2007, construction work on phase one of our Refi nery Masterplan was well advanced. Both the Petro Fluidized Catalytic Cracker (PFCC) and the Propylene Recovery Unit (PRU) were close to 100% completion. The remaining work is focused on the Benzene-Toluene-Xylene (BTX) unit, where construction is expected to be completed by early 2009.
Succeeding phases of our Refi nery Masterplan are on the drawing board. We are aiming to complete the strategic transformation of Petron within the next decade. But even as early as 2008, we expect to see the dawn of our petrochemical age. Your company is headed for exciting new horizons.
NICASIO I. ALCANTARA KAMAL M. AL-YAHYAChairman and Chief Executive Offi cer President
6 PETRON CORPORATION • Sustaining Momentum PETRON CORPORATION • Annual Report 2007 7
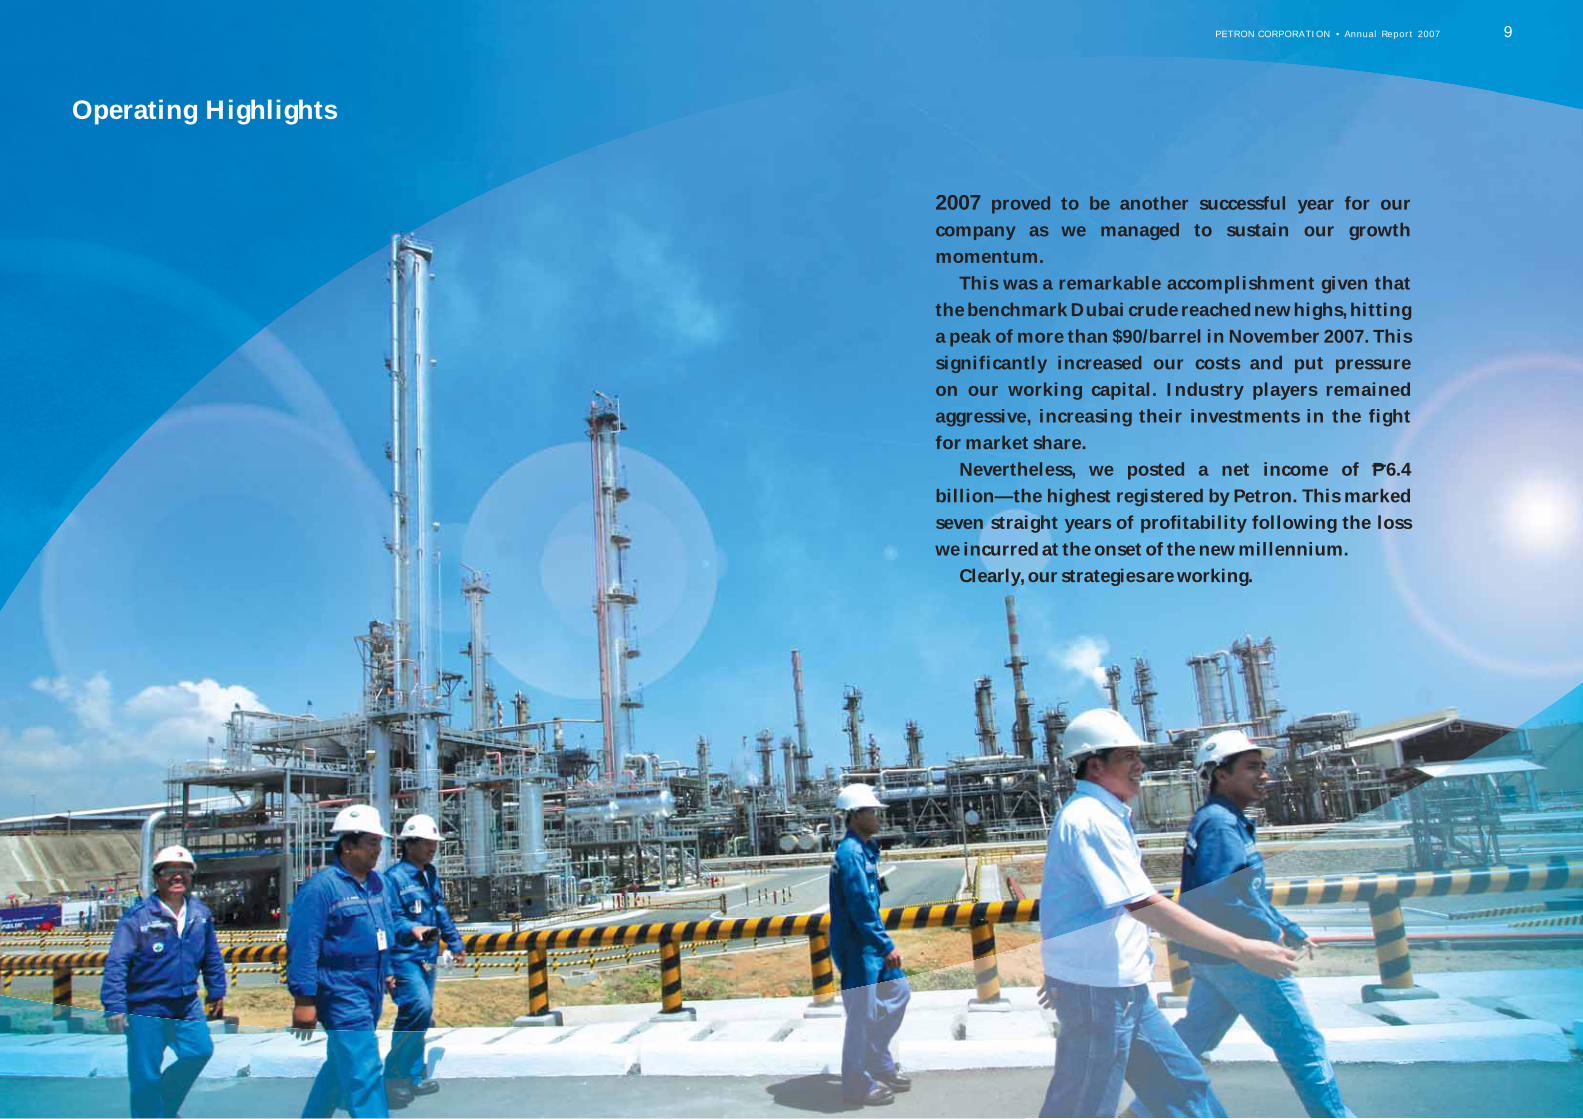
Operating Highlights
2007 proved to be another successful year for our
company as we managed to sustain our growth
momentum.
This was a remarkable accomplishment given that
the benchmark Dubai crude reached new highs, hitting
a peak of more than $90/barrel in November 2007. This
significantly increased our costs and put pressure
on our working capital. Industry players remained
aggressive, increasing their investments in the fight
for market share.
Nevertheless, we posted a net income of P 6.4
billion—the highest registered by Petron. This marked
seven straight years of profi tability following the loss
we incurred at the onset of the new millennium.
Clearly, our strategies are working.
PETRON CORPORATION • Annual Report 2007 9

Petron refuses to be complacent despite its strong leadership
position. We continue to broaden our horizons by exploring
other avenues for growth while unlocking the potential of
our existing resources.
NETWORK EXPANSIONWe added more Petron service stations across the country to bring our products and services
closer to consumers. With 1,269 service stations nationwide at the end of 2007, our company
continues to have the largest retail network in the country. Petron service stations comprise
30% of the oil industry’s total station count.
With our extensive network and marketing campaigns such as Sandosenang Milyonaryo,
Petron remains the No.1 player in the highly-competitive Reseller trade with 36.1% of the
market. This segment comprises nearly 50% of total domestic consumption.
We also expanded our market in the LPG sector with the acquisition of Chevron’s LPG
retail business in May 2007. This acquisition—involving both dealerships and branded refi llers
—resulted in a remarkable 24.2% growth in our LPG volumes, the strongest posted in the
sector. This was complemented by the establishment of 84 Gasul branch stores, bringing the
total to 275.
Our LPG sales were also boosted by the increase in autoLPG facilities in Petron service
stations. This enabled us to capture around 30% of the autoLPG market, making us the sales
leader in this segment.
With a 34.0% market share by yearend, our Gasul and Xtend brands continue to be the most
preferred LPG products.
We likewise managed to sustain our edge over our competitors in other trades.
While there was a slight drop in our Industrial sales as some customers shifted to alternative
fuels or decreased operations, this was mitigated by our acquisition of several major accounts
such as United Parcel Services (UPS), La Farge Cement and Malaysian Airlines. We remained the
dominant player in this segment with 41% of total volumes.
Our sales to National Power Corporation (NPC) jumped by nearly 18% with the increased
utilization of oil-fi red power plants. Petron supplied 57.6% of NPC’s requirements—which is
36% more than our nearest competitor. We also maintained a 100% share of fuel supply for the
national government, the Armed Forces of the Philippines and the Philippine National Police.
Meanwhile, Petron posted growth in the lubes and greases sector with a 7.3% increase in
volumes—the highest in the industry. This allowed us to remain a strong second as we shaved
off the lead of our closest competitor by 1.1 percentage points by the end of 2007.
We continued to build up our market dominance
10 PETRON CORPORATION • Sustaining Momentum

This was supported by the establishment of more Petron Car Care Centers (PCCC) in
strategic, high-traffi c areas. PCCC is Petron’s branded and franchiseable vehicle maintenance
center that provides affordable, convenient, reliable, and effi cient upkeep and repair services
at par with or even better than casa service quality.
All our efforts resulted in a 3.2% increase in our domestic sales, further cementing our
leadership in the industry with 38.9% share of the total market.
WORLD-CLASS PRODUCTSProduct quality continuously evolves in Petron. Our products are constantly tested and
improved to give our customers more value for their money.
In 2007, we introduced three new variants of Sprint 4T Motor Oil: Enduro, Rider, and
Extra. While each is formulated to suit particular driving situations, all provide outstanding
lubrication performance and reliable engine-cleaning action that consumers have come to
trust through the years.
We also improved on the formulation of our XCS Plus premium gasoline. The New Petron
XCS Complete Combustion System is the only gasoline in the Philippine market with organic
combustion enhancers that promote a cleaner and better burn. This translates to reduced
emissions, smoother acceleration, and better fuel economy.
Other new products include Hydrotour SW 68 oil for machines and tools lubrication, and
Octapower CI-9150 fuel additive which is used to optimize heavy fuel oils through more
effi cient combustion and improved heat transfer.
Meanwhile, Petron also began blending 1% Coco Methyl Ester (CME) for its automotive and
industrial diesel fuels in compliance with the Biofuels Act of 2006.
PETRON CORPORATION • Annual Report 2007 13

We believe that maintaining the efficiency of our
operations and our people is just as vital as expanding
markets and boosting sales in our quest for business
sustainability. We make it a point to preserve and fortify
our internal resources so that when faced with adverse
external situations, we are able to thrive and meet
unexpected challenges.
OPERATIONAL EFFICIENCY AND SAFETYOne of our more notable achievements for 2007 is the improved operational availability of
our process units at our Petron Bataan Refi nery to 95.7%. This is 2.5% better than 2006. This
was made possible by the continuous implementation of plant reliability and maintenance
programs, as well as the continuing training of our refi nery personnel.
We also managed to extract more value from our refi nery by improving the quality of our
mixed xylene (MX) production. We replaced our heat exchanger in one of our refi nery units
to improve our MX from solvent grade to isomer grade which fetches a better price in the
international market.
Processing effi ciency of crude oil at our Bataan refi nery stood at 99.3%, while we continued
to reduce fuel and power consumption to improve energy effi ciency.
We have also put in place tighter monitoring procedures in line with inter-island or crossbay
product deliveries. This allowed us to promptly determine the necessary vessel repairs and
upgrades, improve product measuring accuracy, and readily spot abnormal product losses
during transport. As a result, there has been a signifi cant reduction of our shore-to-shore oil
losses in the last three years.
Another major part of supply chain improvement is the acceleration of our Shipping Alliance
Project. Under this project, we aim to contract modern, high-performance and safer vessels.
This refl ects our commitment to transport products across the country in a safe and effi cient
manner. Already in service are double-hull and double-bottom vessels M/T Ashton, M/T Petro
Anica, M/T Daniela Natividad and M/T Cecilia Luisa.
NEW MARKETING VENTURES While we ensure that our core business remains intact and well-supported, we also continue to
embrace other markets and broaden our business within the petroleum retail industry in order
to sustain our growth momentum.
In 2007, we continued to strengthen our network of non-fuel retail establishments, mostly
food-related, through our subsidiary Petron Marketing Corporation.
We added four more outlets to our convenience store chain Treats, bringing the total
outlet count to 48 nationwide. We also franchised outlets of Jollibee and Chowking, two of
the most popular fastfood chains in the country. Other food stores with new outlets in our
service stations include Subway, Monterey, Ineng’s BBQ, and Lapid’s Chicharon. Non-food retail
outlets, on the other hand, include Cool Toyz and even a Nike outlet store.
Both our fuels and non-fuels businesses were further supported by a 28% growth in the
number of Petron Fleet Card holders. The Petron Fleet Card is still the one and only motorist
card with microchip technology that allows more effi cient fl eet management.
Collectively, our non-fuels businesses contributed nearly P390 million to our revenues
in 2007.
W
e focused on further operational enhancements
PETRON CORPORATION • Annual Report 2007 15
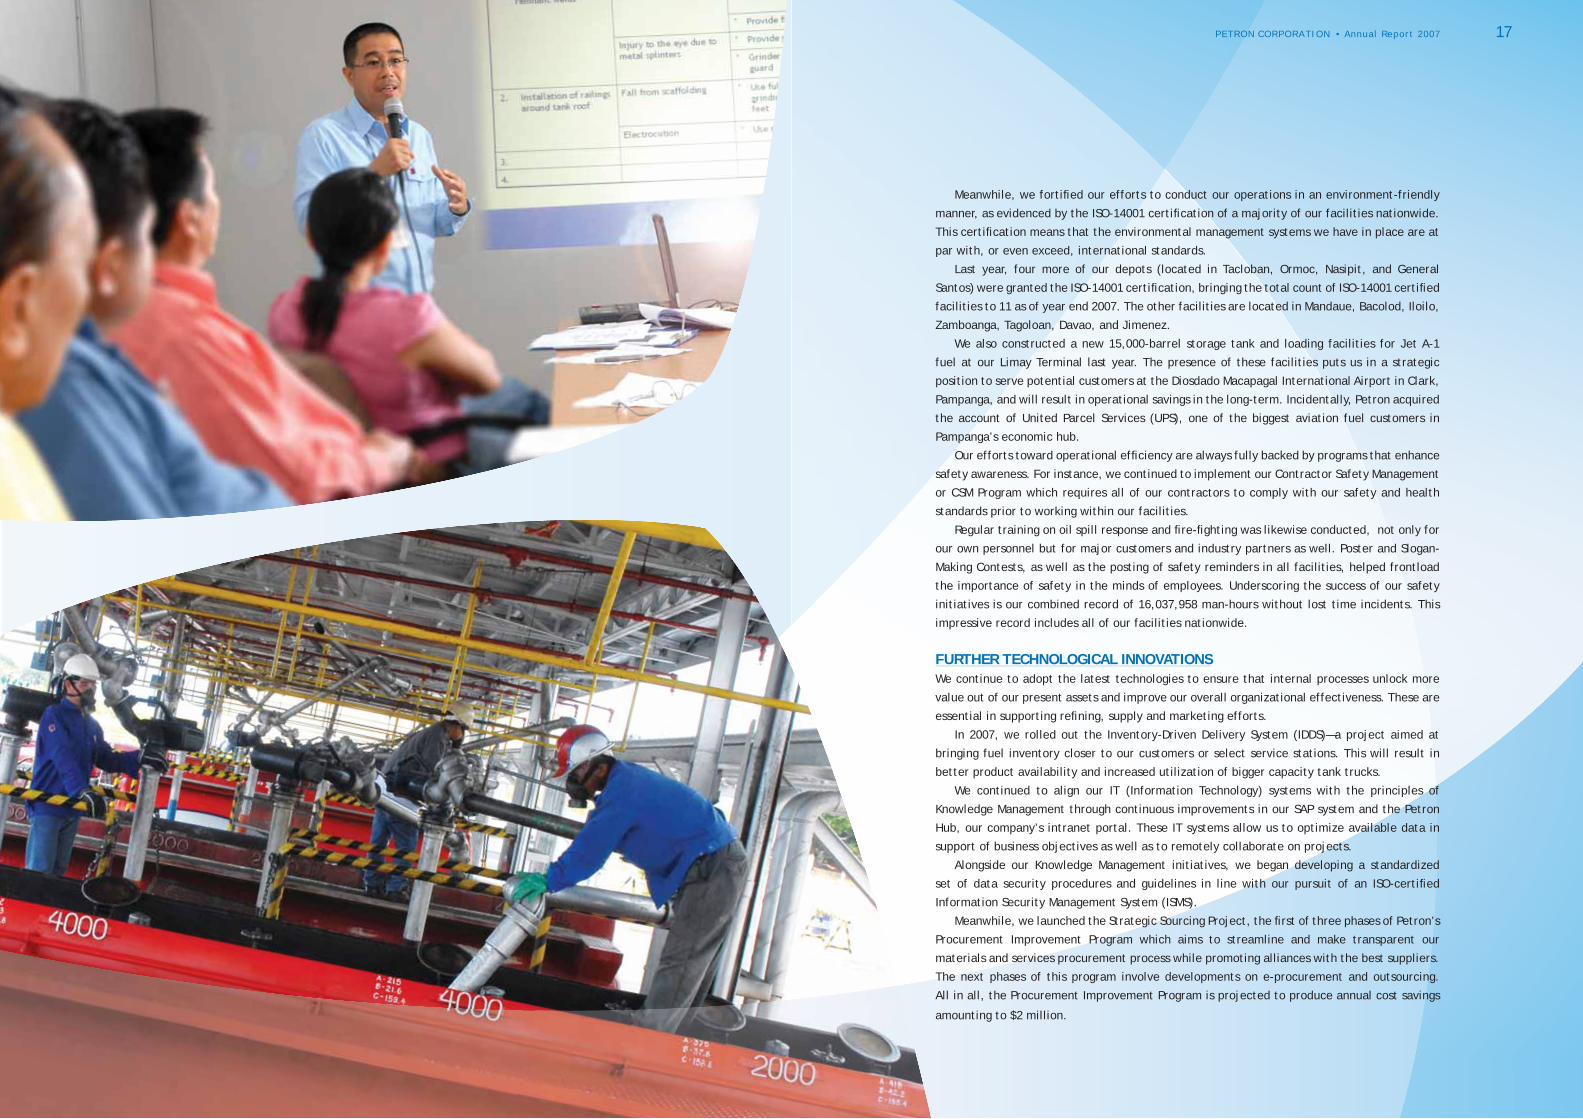
Meanwhile, we fortifi ed our efforts to conduct our operations in an environment-friendly
manner, as evidenced by the ISO-14001 certifi cation of a majority of our facilities nationwide.
This certifi cation means that the environmental management systems we have in place are at
par with, or even exceed, international standards.
Last year, four more of our depots (located in Tacloban, Ormoc, Nasipit, and General
Santos) were granted the ISO-14001 certifi cation, bringing the total count of ISO-14001 certifi ed
facilities to 11 as of year end 2007. The other facilities are located in Mandaue, Bacolod, Iloilo,
Zamboanga, Tagoloan, Davao, and Jimenez.
We also constructed a new 15,000-barrel storage tank and loading facilities for Jet A-1
fuel at our Limay Terminal last year. The presence of these facilities puts us in a strategic
position to serve potential customers at the Diosdado Macapagal International Airport in Clark,
Pampanga, and will result in operational savings in the long-term. Incidentally, Petron acquired
the account of United Parcel Services (UPS), one of the biggest aviation fuel customers in
Pampanga’s economic hub.
Our efforts toward operational effi ciency are always fully backed by programs that enhance
safety awareness. For instance, we continued to implement our Contractor Safety Management
or CSM Program which requires all of our contractors to comply with our safety and health
standards prior to working within our facilities.
Regular training on oil spill response and fi re-fi ghting was likewise conducted, not only for
our own personnel but for major customers and industry partners as well. Poster and Slogan-
Making Contests, as well as the posting of safety reminders in all facilities, helped frontload
the importance of safety in the minds of employees. Underscoring the success of our safety
initiatives is our combined record of 16,037,958 man-hours without lost time incidents. This
impressive record includes all of our facilities nationwide.
FURTHER TECHNOLOGICAL INNOVATIONSWe continue to adopt the latest technologies to ensure that internal processes unlock more
value out of our present assets and improve our overall organizational effectiveness. These are
essential in supporting refi ning, supply and marketing efforts.
In 2007, we rolled out the Inventory-Driven Delivery System (IDDS)—a project aimed at
bringing fuel inventory closer to our customers or select service stations. This will result in
better product availability and increased utilization of bigger capacity tank trucks.
We continued to align our IT (Information Technology) systems with the principles of
Knowledge Management through continuous improvements in our SAP system and the Petron
Hub, our company’s intranet portal. These IT systems allow us to optimize available data in
support of business objectives as well as to remotely collaborate on projects.
Alongside our Knowledge Management initiatives, we began developing a standardized
set of data security procedures and guidelines in line with our pursuit of an ISO-certifi ed
Information Security Management System (ISMS).
Meanwhile, we launched the Strategic Sourcing Project, the fi rst of three phases of Petron’s
Procurement Improvement Program which aims to streamline and make transparent our
materials and services procurement process while promoting alliances with the best suppliers.
The next phases of this program involve developments on e-procurement and outsourcing.
All in all, the Procurement Improvement Program is projected to produce annual cost savings
amounting to $2 million.
PETRON CORPORATION • Annual Report 2007 17
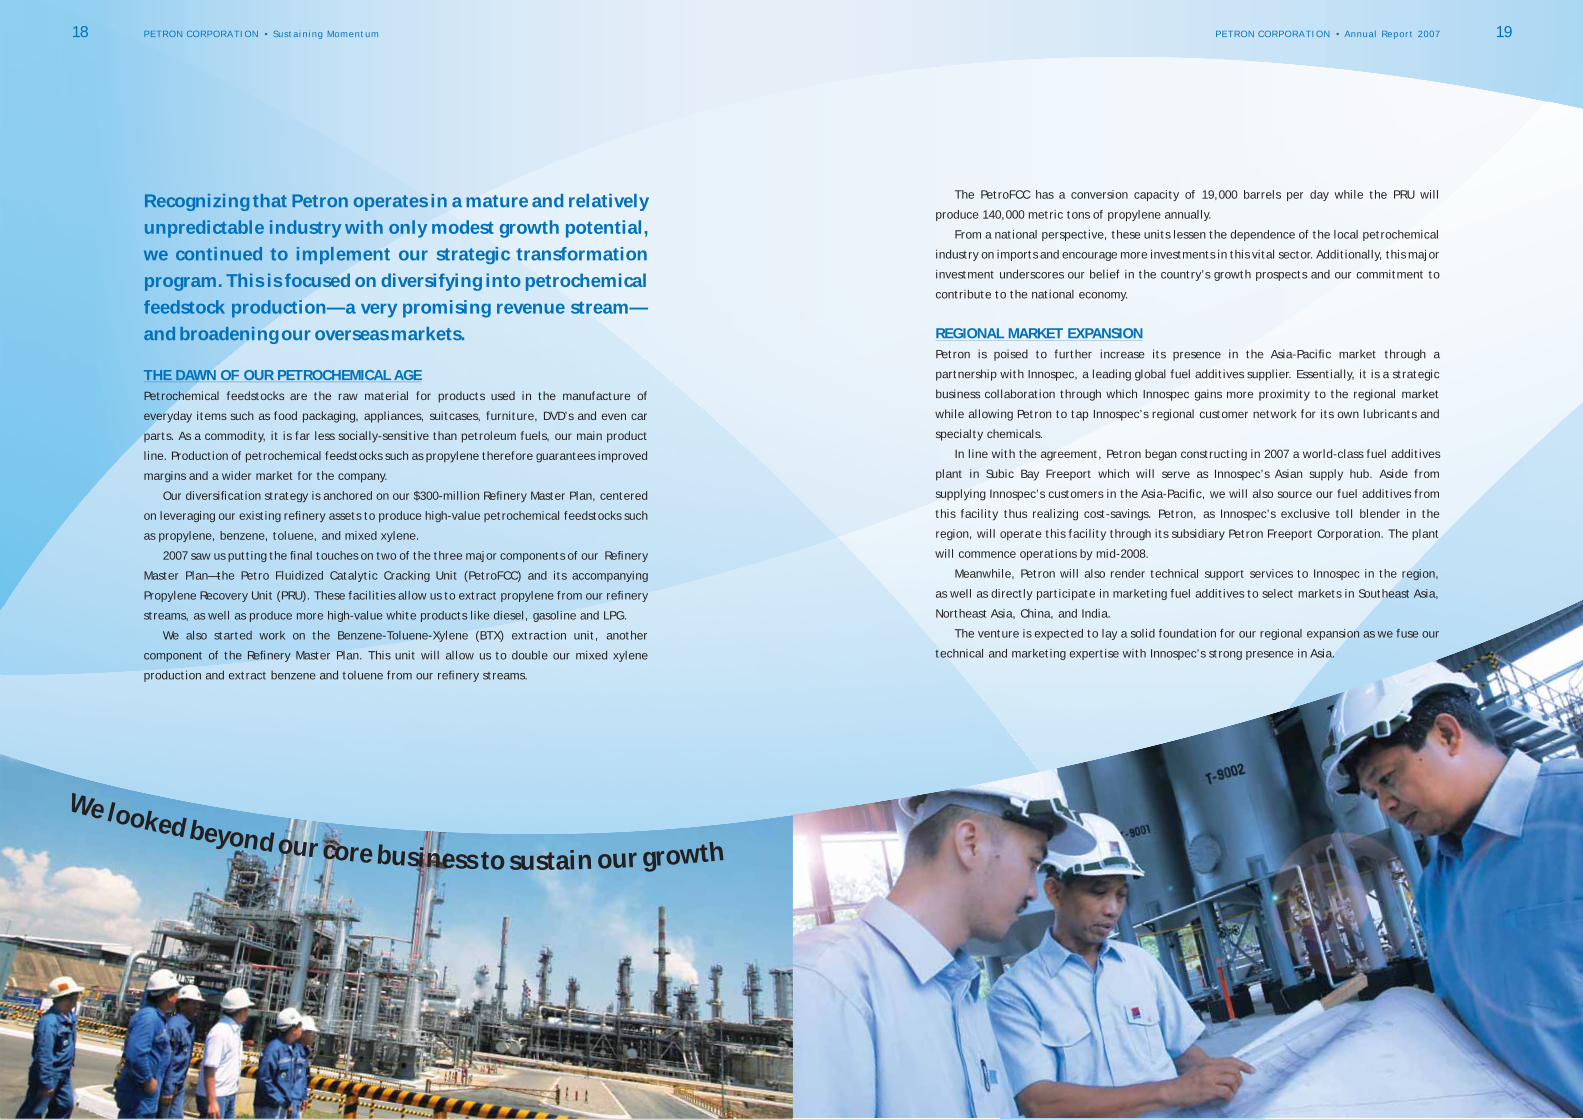
Recognizing that Petron operates in a mature and relatively
unpredictable industry with only modest growth potential,
we continued to implement our strategic transformation
program. This is focused on diversifying into petrochemical
feedstock production—a very promising revenue stream—
and broadening our overseas markets.
THE DAWN OF OUR PETROCHEMICAL AGEPetrochemical feedstocks are the raw material for products used in the manufacture of
everyday items such as food packaging, appliances, suitcases, furniture, DVD’s and even car
parts. As a commodity, it is far less socially-sensitive than petroleum fuels, our main product
line. Production of petrochemical feedstocks such as propylene therefore guarantees improved
margins and a wider market for the company.
Our diversifi cation strategy is anchored on our $300-million Refi nery Master Plan, centered
on leveraging our existing refi nery assets to produce high-value petrochemical feedstocks such
as propylene, benzene, toluene, and mixed xylene.
2007 saw us putting the fi nal touches on two of the three major components of our Refi nery
Master Plan—the Petro Fluidized Catalytic Cracking Unit (PetroFCC) and its accompanying
Propylene Recovery Unit (PRU). These facilities allow us to extract propylene from our refi nery
streams, as well as produce more high-value white products like diesel, gasoline and LPG.
We also started work on the Benzene-Toluene-Xylene (BTX) extraction unit, another
component of the Refi nery Master Plan. This unit will allow us to double our mixed xylene
production and extract benzene and toluene from our refi nery streams.
The PetroFCC has a conversion capacity of 19,000 barrels per day while the PRU will
produce 140,000 metric tons of propylene annually.
From a national perspective, these units lessen the dependence of the local petrochemical
industry on imports and encourage more investments in this vital sector. Additionally, this major
investment underscores our belief in the country’s growth prospects and our commitment to
contribute to the national economy.
REGIONAL MARKET EXPANSIONPetron is poised to further increase its presence in the Asia-Pacifi c market through a
partnership with Innospec, a leading global fuel additives supplier. Essentially, it is a strategic
business collaboration through which Innospec gains more proximity to the regional market
while allowing Petron to tap Innospec’s regional customer network for its own lubricants and
specialty chemicals.
In line with the agreement, Petron began constructing in 2007 a world-class fuel additives
plant in Subic Bay Freeport which will serve as Innospec’s Asian supply hub. Aside from
supplying Innospec’s customers in the Asia-Pacifi c, we will also source our fuel additives from
this facility thus realizing cost-savings. Petron, as Innospec’s exclusive toll blender in the
region, will operate this facility through its subsidiary Petron Freeport Corporation. The plant
will commence operations by mid-2008.
Meanwhile, Petron will also render technical support services to Innospec in the region,
as well as directly participate in marketing fuel additives to select markets in Southeast Asia,
Northeast Asia, China, and India.
The venture is expected to lay a solid foundation for our regional expansion as we fuse our
technical and marketing expertise with Innospec’s strong presence in Asia.
We looked beyond our core business to sustain our growth
18 PETRON CORPORATION • Sustaining Momentum PETRON CORPORATION • Annual Report 2007 19
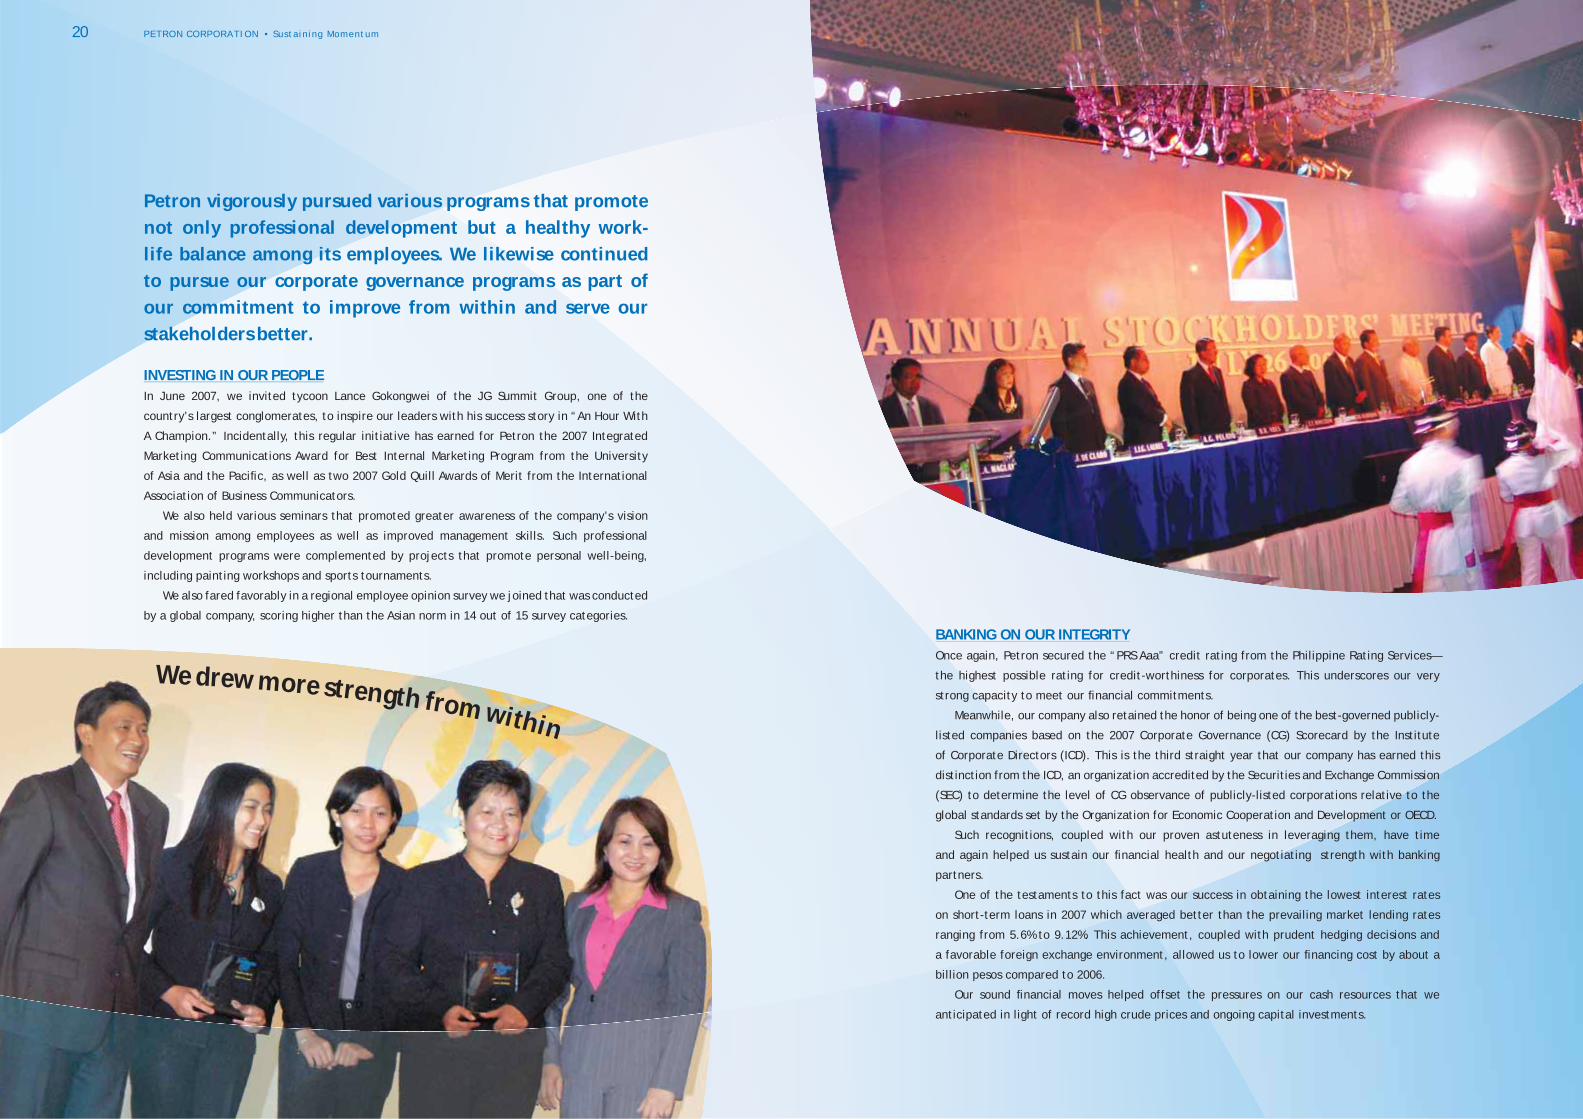
Petron vigorously pursued various programs that promote
not only professional development but a healthy work-
life balance among its employees. We likewise continued
to pursue our corporate governance programs as part of
our commitment to improve from within and serve our
stakeholders better.
INVESTING IN OUR PEOPLEIn June 2007, we invited tycoon Lance Gokongwei of the JG Summit Group, one of the
country’s largest conglomerates, to inspire our leaders with his success story in “An Hour With
A Champion.” Incidentally, this regular initiative has earned for Petron the 2007 Integrated
Marketing Communications Award for Best Internal Marketing Program from the University
of Asia and the Pacifi c, as well as two 2007 Gold Quill Awards of Merit from the International
Association of Business Communicators.
We also held various seminars that promoted greater awareness of the company’s vision
and mission among employees as well as improved management skills. Such professional
development programs were complemented by projects that promote personal well-being,
including painting workshops and sports tournaments.
We also fared favorably in a regional employee opinion survey we joined that was conducted
by a global company, scoring higher than the Asian norm in 14 out of 15 survey categories.
BANKING ON OUR INTEGRITYOnce again, Petron secured the “PRS Aaa” credit rating from the Philippine Rating Services—
the highest possible rating for credit-worthiness for corporates. This underscores our very
strong capacity to meet our fi nancial commitments.
Meanwhile, our company also retained the honor of being one of the best-governed publicly-
listed companies based on the 2007 Corporate Governance (CG) Scorecard by the Institute
of Corporate Directors (ICD). This is the third straight year that our company has earned this
distinction from the ICD, an organization accredited by the Securities and Exchange Commission
(SEC) to determine the level of CG observance of publicly-listed corporations relative to the
global standards set by the Organization for Economic Cooperation and Development or OECD.
Such recognitions, coupled with our proven astuteness in leveraging them, have time
and again helped us sustain our fi nancial health and our negotiating strength with banking
partners.
One of the testaments to this fact was our success in obtaining the lowest interest rates
on short-term loans in 2007 which averaged better than the prevailing market lending rates
ranging from 5.6% to 9.12%. This achievement, coupled with prudent hedging decisions and
a favorable foreign exchange environment, allowed us to lower our fi nancing cost by about a
billion pesos compared to 2006.
Our sound fi nancial moves helped offset the pressures on our cash resources that we
anticipated in light of record high crude prices and ongoing capital investments.
We drew more strength from within
20 PETRON CORPORATION • Sustaining Momentum

We make it a point to complement our business growth
initiatives with equally sustained efforts in promoting social
development. The expansion of our business also means
stronger support for our Corporate Social Responsibility
(CSR) programs.
FUELING HOPEOur Fuel H.O.P.E. or Helping Filipino Children and the Youth Overcome Poverty through
Education program continued to be at the forefront of Petron’s corporate social responsibility
(CSR) agenda in 2007. Our banner project, Tulong Aral ng Petron, supports over 6,000
underprivileged children in public elementary schools in Metro Manila and Mindanao. Out of
this group of scholars, nearly 380 are recognized as outstanding students and over 55 are fi rst
honors. Our fi rst batch of 1,000 Tulong Aral scholars graduates in March 2008.
We continued to enhance this program through the help of our business partners such as
the Department of Social Welfare and Development (DSWD), Department of Education (DepEd),
World Vision, the Philippine Psychology Research and Training House, and ShoeMart.
Through our strong partnerships with Habitat for Humanity and Gawad Kalinga, we
constructed 8 more Petron Schools to provide 40 new classrooms. At the end of 2007, we
already had 21 Petron Schools across the country.
We likewise sustained our support to youth education, focusing on enhancing the
entrepreneurial spirit of high school and college students. Through our Youth in Entrepreneurship
and Leadership or YIELD Program, select students from the Muntinlupa Business High School
completed a 240-hour on-the-job training in several of our service stations. Our Junior
Achievement of the Philippines and WIWAG Business Weeks programs, meanwhile, continued
to equip college students with practical business knowledge, with our very own employees
serving as mentors.
We reached out to more people to make a lasting impact in society
PETRON CORPORATION • Annual Report 2007 23

PRESERVING TUBBATAHA REEFOur people-oriented CSR programs are matched by equally notable environmental initiatives.
We launched our landmark program called “Life and Livelihood: Sustaining the Tubbataha Reef
and the Sulu Sea” in partnership with World Wide Fund Philippines (WWF-Philippines). This will
provide livelihood opportunities to the Municipality of Cagayancillo, which has jurisdiction over
Tubbataha Reef. This in turn promotes the preservation of Tubbataha Reef—the only UNESCO
marine heritage site in Southeast Asia.
ENGAGING OUR EMPLOYEESOur employee volunteers continued to be at the heart of these socio-civic projects; in 2007,
776 employees put in at least 13,425 hours in volunteer work. Their generous and sincere
support to Petron’s CSR programs helped us make a positive impact on at least 130,000
benefi ciaries nationwide.
All these initiatives enabled us to make a more meaningful contribution as an active partner
of the government in poverty alleviation and sustainable development.
Despite the challenges of a more competitive and volatile
business environment in 2007, our will to sustain our growth
momentum remained resolute. We are fueled by our desire
to provide our stakeholders with the best products and
services. We are fueled by our commitment to bring reliable
energy to millions of Filipinos. More importantly, we are
fueled by our determination to positively contribute to the
national economy. WE FUEL SUCCESS!
Photos by Lory Tan—WWF Philippines and Manny Dizon
24 PETRON CORPORATION • Sustaining Momentum
Corporate Governance
Petron is deeply committed to implement programs and policies that will promote and instill best practices in good governance in the workplace and in its business dealings with other companies—policies that go beyond compliance.
The Compliance Offi cer monitors the company’s adherence to the provisions and requirements of its Corporate Governance Manual as well as the other Manuals which clearly spell out approving authorities and limits, policies, and procedures including contracting and bidding rules. The Offi cer ensures that Petron complies with all disclosure requirements of the Securities and Exchange Commission (SEC) and the Philippine Stock Exchange (PSE). To enhance transparency, all disclosures are posted in the company’s website: www.petron.com. A separate disclosure section was created in the website’s homepage to make readily available to stakeholders, information regarding the company’s operations and corporate concerns.
Under the tight monitoring of the Compliance Offi cer, the company has maintained its zero-penalty status with the SEC and PSE for the period.
THE BOARD OF DIRECTORSPetron has a total of ten directors, two of whom are independent. The nomination and election of two independent directors is pursuant to Rule 38.1 of the Securities Regulations Code and Section II of the company’s Corporate Governance Manual. Representing the interest of the minority stockholders, independent directors must be free from any business interests or relationship with the company which could or appear to affect the exercise of independent judgment.
The nomination for independent directors is announced in major newspapers and a copy of the nomination form is made available in the company website and at the Offi ce of the Corporate Secretary. Nominations are carefully screened by the Nomination Committee and submitted to the Board of Directors, which in turn endorses the names of the candidates to the stockholders for election at the annual meeting. Only those appearing in the Final List of Candidates prepared by the Committee shall be eligible for election as independent directors. No nominations are entertained on the fl oor.
The directors sign Confl ict-of-Interest Statements, disclosing their respective business interests to ensure that these are not in competition with Petron. They are also made aware of the requirement to inform the SEC and the PSE of any acquisition and disposal of Petron shares. Upon assumption of offi ce, the directors are required to attend basic corporate governance seminars. The company also coordinates with accredited providers of good corporate governance seminars to ensure that directors are kept abreast with the latest developments and best practices in this important area.
In 2007, Petron President and Director Mr. Kamal M. Al-Yahya attended the basic course while Mr. Alberto A. Pedrosa joined the Professional Directors Program, both provided by the internationally-recognized Institute of Corporate Directors (ICD). Other directors and offi cers have already attended orientation programs on corporate governance here and abroad.
BOARD MEETINGS AND PERFORMANCE The schedule of board meetings for the entire year is fi xed at the start of the year. Apart from the quarterly board meetings and the annual stockholders’ meeting, the Board also holds special board meetings through video conferences.
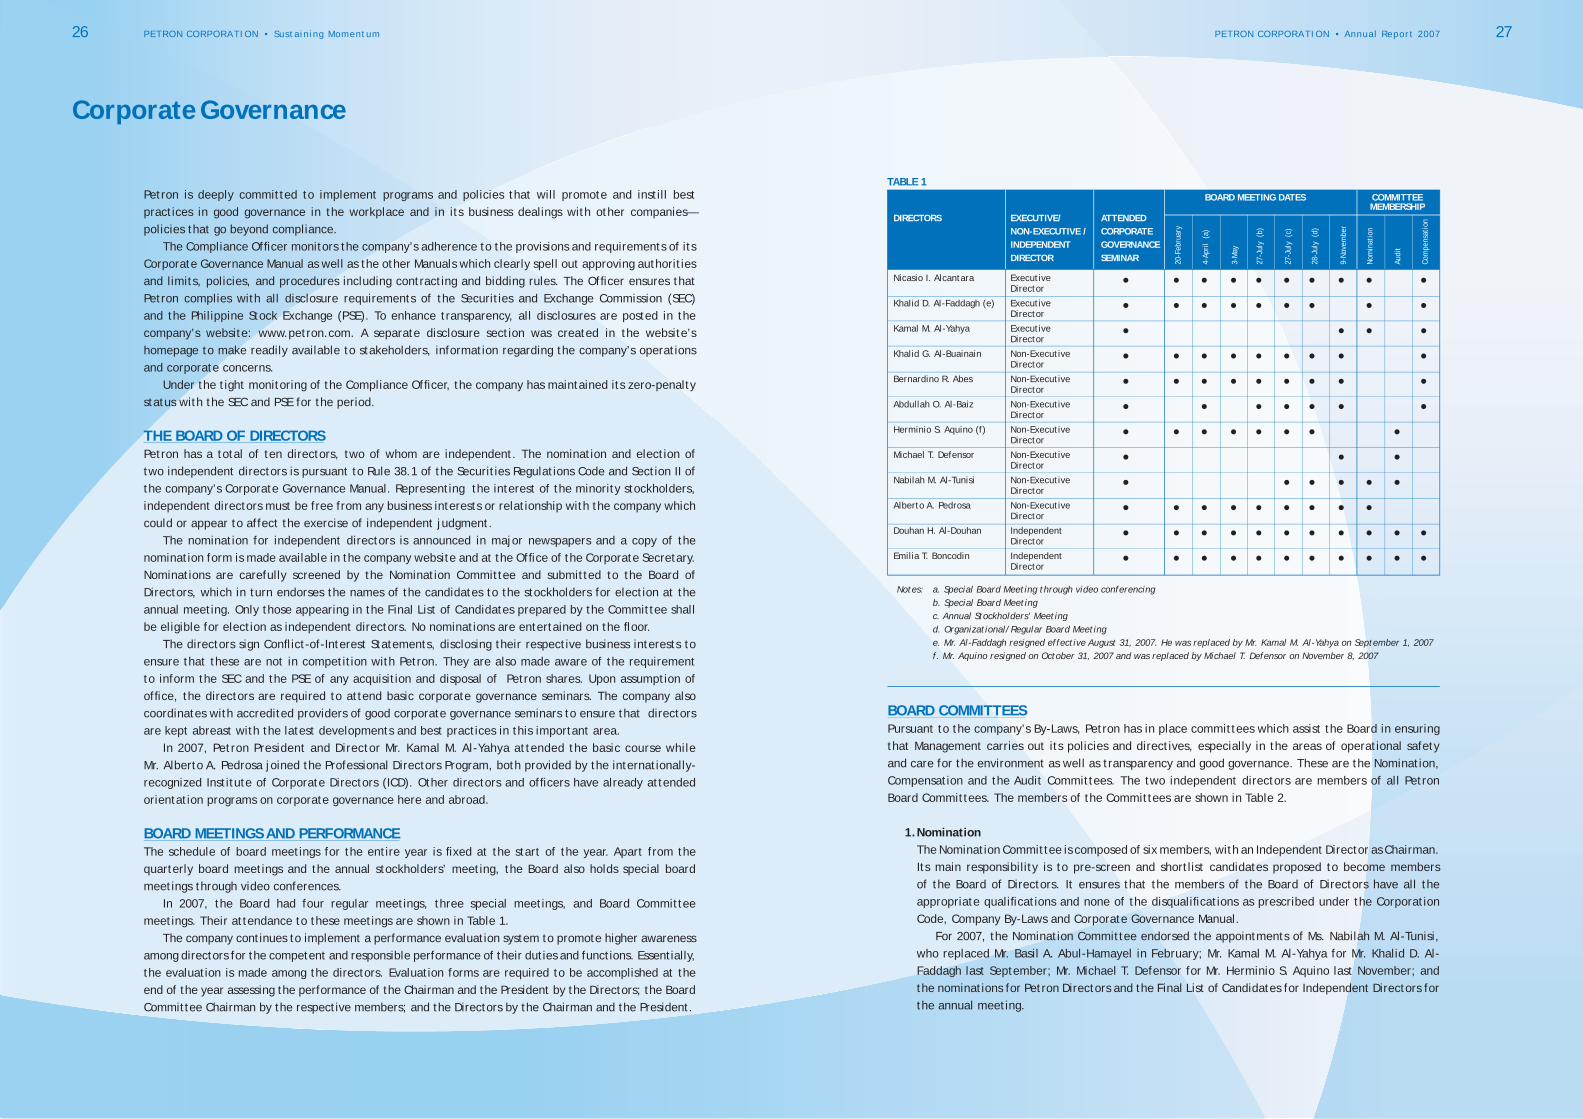
In 2007, the Board had four regular meetings, three special meetings, and Board Committee meetings. Their attendance to these meetings are shown in Table 1.
The company continues to implement a performance evaluation system to promote higher awareness among directors for the competent and responsible performance of their duties and functions. Essentially, the evaluation is made among the directors. Evaluation forms are required to be accomplished at the end of the year assessing the performance of the Chairman and the President by the Directors; the Board Committee Chairman by the respective members; and the Directors by the Chairman and the President.
BOARD COMMITTEESPursuant to the company’s By-Laws, Petron has in place committees which assist the Board in ensuring that Management carries out its policies and directives, especially in the areas of operational safety and care for the environment as well as transparency and good governance. These are the Nomination, Compensation and the Audit Committees. The two independent directors are members of all Petron Board Committees. The members of the Committees are shown in Table 2.
1. Nomination The Nomination Committee is composed of six members, with an Independent Director as Chairman.
Its main responsibility is to pre-screen and shortlist candidates proposed to become members of the Board of Directors. It ensures that the members of the Board of Directors have all the appropriate qualifi cations and none of the disqualifi cations as prescribed under the Corporation Code, Company By-Laws and Corporate Governance Manual.
For 2007, the Nomination Committee endorsed the appointments of Ms. Nabilah M. Al-Tunisi, who replaced Mr. Basil A. Abul-Hamayel in February; Mr. Kamal M. Al-Yahya for Mr. Khalid D. Al-Faddagh last September; Mr. Michael T. Defensor for Mr. Herminio S. Aquino last November; and the nominations for Petron Directors and the Final List of Candidates for Independent Directors for the annual meeting.
26 PETRON CORPORATION • Sustaining Momentum PETRON CORPORATION • Annual Report 2007 27
Notes: a. Special Board Meeting through video conferencing b. Special Board Meeting c. Annual Stockholders’ Meeting d. Organizational/Regular Board Meeting e. Mr. Al-Faddagh resigned effective August 31, 2007. He was replaced by Mr. Kamal M. Al-Yahya on September 1, 2007 f. Mr. Aquino resigned on October 31, 2007 and was replaced by Michael T. Defensor on November 8, 2007
DIRECTORS EXECUTIVE/ ATTENDED NON-EXECUTIVE / CORPORATE INDEPENDENT GOVERNANCE DIRECTOR SEMINAR
Nicasio I. Alcantara Executive • • • • • • • • • • Director
Khalid D. Al-Faddagh (e) Executive • • • • • • • • • Director
Kamal M. Al-Yahya Executive • • • • Director
Khalid G. Al-Buainain Non-Executive • • • • • • • • • Director
Bernardino R. Abes Non-Executive • • • • • • • • • Director
Abdullah O. Al-Baiz Non-Executive • • • • • • • Director
Herminio S. Aquino (f) Non-Executive • • • • • • • • Director
Michael T. Defensor Non-Executive • • • Director
Nabilah M. Al-Tunisi Non-Executive • • • • • • Director
Alberto A. Pedrosa Non-Executive • • • • • • • • • Director
Douhan H. Al-Douhan Independent • • • • • • • • • • • Director
Emilia T. Boncodin Independent • • • • • • • • • • • Director
BOARD MEETING DATES COMMITTEE MEMBERSHIP
Com
pens
atio
n
Audi
t
Nom
inat
ion
20-F
ebru
ary
4-Ap
ril
(a)
3-M
ay
27-J
uly
(b)
27-J
uly
(c)
28-J
uly
(d)
9-No
vem
ber
TABLE 1

2. Compensation The Compensation Committee is composed of seven members, with the Chairman of the Board and
the President acting as Committee Chairman and Vice-Chairman, respectively, but without voting rights. The Committee considers and approves the salary structure as well as the promotion of Division Heads/Vice Presidents. It likewise evaluates other compensation policies and corporate benefi ts plans to ensure that remuneration and other employee benefi ts are adequate and competitive.
It takes into consideration the conduct of compensation/benefi ts benchmarking activities or surveys in determining the competitiveness of compensation packages for directors, offi cers and employees. No director or offi cer can decide or allow any adjustment in his/her own remuneration.
The Committee conducted several meetings in 2007. Materials were promptly distributed to the members prior to the meetings.
3. Audit The Audit Committee has four members, with an Independent Director as Chairman. The Committee
assesses the effectiveness of the company’s internal control systems and adherence to its policies as well as laws and regulations that affect Petron’s business. It reviews the activities of the Internal Audit Manager and the External Auditor.
In July 2007, the Committee recommended to the Board and the shareholders the appointment of Punongbayan & Araullo (P&A) as Petron’s independent auditors for three years (2007-2009), subject to a yearly performance appraisal by the company. In coordination with the Internal Audit Manager, P&A reviewed the results of the tax compliance audit that was conducted in 2006 and the quarterly and annual fi nancial statements of Petron and its Subsidiaries which were endorsed to and approved by the Board. The Audit Committee, on a regular basis, monitors the company’s compliance with laws affecting its business operations, including new fi nancial reporting standards.
RAISING THE LEVEL OF GOOD CORPORATE GOVERNANCEPetron’s commitment is not only a matter of providing directors and senior offi cers with continuing updates and developments in corporate governance and best practices thru attendance in directorship programs. The provision of prompt and accurate communication to its stakeholders of material information affecting Petron’s business is considered equally important. Ultimately, the practice of greater transparency promotes good governance and investor confi dence.
The company has the Stockholders Services group that takes care of shareholder concerns and queries and prepares the logistics for annual meetings. For the 2007 stockholders’ meeting, the Public Affairs Department established a Help Desk to facilitate requests of attending stockholders, in addition to the usual telephone and mail inquiries. It also invited the Philippine Stock Exchange and the Brokers’ Association to answer stockholders’ concerns about the stock market and assist those who want to buy additional shares or dispose of their shares.
It also has an Investor Relations group which provides updated and relevant information to analysts, fund managers and other stakeholders, including quarterly performance results and fi nancial statements. It also conducts company briefi ngs with stock analysts, banks and fund managers, both local and foreign.
RISK MANAGEMENTPetron Corporation follows an enterprise-wide risk management framework for identifying, mapping and addressing the risk factors that affect or may affect its businesses.
The company’s risk management process is a bottom-up approach, with each division mandated to conduct regular assessments of its risk profi le and formulate action plans for managing identifi ed risks. As Petron’s operation is an integrated value chain, risks may emanate from every process and some could cut across divisions. The results of these activities fl ow up to the Management Committee and eventually, the Board through the company’s annual business planning process and quarterly updates on major risks and mitigation strategies.
Oversight and technical assistance is likewise provided by corporate units with special duties. The adequacy of risk management policies and the determination of the risk appetite pass through the Risk and Investment Management Committee, which is composed of the Chairman of the Board, President, and Vice Presidents of the company. The Financial Analysis Planning and Risk Management Department is mandated with the overall coordination and development of the enterprise-wide risk management process. A cross-functional Commodity Risk Management Committee oversees crude oil and petroleum product hedging transactions. The Financial Risk Management Unit is in charge of foreign exchange hedging transactions. The Transaction Management Unit provides backroom support for all hedging transactions. The Health, Safety and Environment Department oversees compliance with the domestic and international standards and manages risks related to health, safety and environment. The Internal Audit Department has been tasked with the implementation of a risk-based auditing.
RECOGNITIONPetron has received recognition from the ICD for its corporate governance practices. Since the start of its Corporate Governance Scorecard in 2005, the ICD has named Petron as one of the country’s Best-Governed Publicly-Listed Companies for three years in a row, with the number of participants increasing from 49 in 2005 to 138 publicly-listed companies in 2007. The rating is premised on fi ve categories, namely: Rights of Shareholders, Equitable Treatment of Shareholders, Role of Stakeholders in Corporate Governance, Disclosure & Transparency and Board Responsibility. For 2007, Petron scored 100% in two categories, namely: Equitable Treatment of Shareholders and Role of Stakeholders in Corporate Governance, and higher than average score in the three other categories.
28 PETRON CORPORATION • Sustaining Momentum PETRON CORPORATION • Annual Report 2007 29
* Mr. Buainain resigned on February 7, 2008 and was replaced by Mr. Abdallah I. Al-Saadan on February 29, 2008.
DIRECTORS EXECUTIVE/ NON-EXECUTIVE/ NOMINATION AUDIT COMPENSATION INDEPENDENT DIRECTOR
Nicasio I. Alcantara Executive Director • •Khalid D. Al-Faddagh Executive Director • •Kamal M. Al-Yahya Executive Director • •Khalid G. Al-Buainain* Non-Executive Director •Abdallah I. Al-Saadan Non-Executive Director •Bernardino R. Abes Non-Executive Director •Abdullah O. Al-Baiz Non-Executive Director •Herminio S. Aquino Non-Executive Director •
Michael T. Defensor Non-Executive Director •
Nabilah M. Al-Tunisi Non-Executive Director • •
Alberto A. Pedrosa Non-Executive Director •
Douhan H. Al-Douhan Independent Director • • •Emilia T. Boncodin Independent Director • • •
TABLE 2
30 PETRON CORPORATION • Sustaining Momentum PETRON CORPORATION • Annual Report 2007 31
Audit Committee Report
The Board of DirectorsPetron Corporation
The Audit Committee assists the Board of Directors in its oversight function with respect to the adequacy and effectiveness of internal control environment, compliance with corporate policies and regulations, integrity of the fi nancial statements, the independence and overall direction of the internal audit function, and the selection and performance of the external auditor.
In the performance of our responsibilities, we report that in 2007:
• We reviewed and discussed with Controllers management the quarterly and annual fi nancial statements of Petron Corporation and Subsidiaries and endorsed these for approval by the Board.
• For greater transparency and in accordance with good corporate governance practice, the Board of Directors decided to change the company’s external auditors, SGV & Co., whose services have been engaged by Petron for 13 consecutive years. Based on the evaluation of technical and fi nancial proposals submitted by the next 3 biggest accounting fi rms in the country, the Committee recommended to the Board and the shareholders the appointment of Punongbayan & Araullo as Petron’s independent auditors for 2007-2009, subject to yearly performance appraisal and contract renewal.
• The independent auditors, Punongbayan & Araullo, presented to and discussed with the Committee the scope and timing of their annual audit plan, audit methodology, and focus areas related to their audit of the 2007 fi nancial statements, including the new accounting standards that are effective in 2007 and subsequent years.
• The Company’s former external auditors, SGV & Co. briefed the members of the Audit Committee on the new accounting standards that were adopted by Petron in 2006 and their impact on the fi nancial statements.
• The Audit Committee reviewed with SGV & Co. the external auditors’ audit observations and recommendations on the Company’s internal controls and management’s response to the issues raised relating to the audit of the 2006 fi nancial statements.
• The Committee reviewed with the Internal Audit Manager and approved the annual internal audit plan and satisfi ed itself to the independence of the internal audit function.
• We reviewed on a quarterly basis the Internal Audit’s report on the adequacy and effectiveness of the internal control environment in the areas covered during the period.
• The Committee reviewed with the Internal Audit Manager the results of the tax compliance audit that was conducted by Punongbayan & Araullo in 2006 covering 2005 accounts and discussed improvement areas highlighted and corrective measures taken by management.
• The Committee reviewed and approved the engagement of services and related fees of an outsourced IT audit service provided.
All the four members of the Audit Committee, two of whom are independent directors, are satisfi ed with the scope and appropriateness of the Committee’s mandate and that the Committee substantially met its mandate in 2007.
Emilia T. Boncodin Douhan H. Al-Douhan Chairperson Independent Director Independent Director
Michael T. Defensor Nabilah M. Al-Tunisi (elected November 9, 2007)
Herminio S. Aquino (resigned October 31, 2007)
Financial Highlights
In Million Pesos, Except per Share Amount 2007 2006
Sales 210,520 211,726Net Income (loss) 6,395 6,018 Operating Expenses 5,325 4,482 Income from Operations 9,908 9,730Plant, Property & Equipment 34,128 25,153Total Assets 104,474 87,516Total Equity 37,788 32,253
(In Pesos Per Share)Earnings Per Share 0.68 0.64Cash Dividend Declared 0.10 0.10
32 PETRON CORPORATION • Sustaining Momentum PETRON CORPORATION • Annual Report 2007 33
Financial Highlights
SELECTED FINANCIAL AND OPERATING INFORMATION
The following information, as it relates to 2007, was derived from the company’s Consolidated Audited Financial Statements. The selected information should be read in conjunction with the Audited Financial Report and Related Notes as presented in pages 36–76.
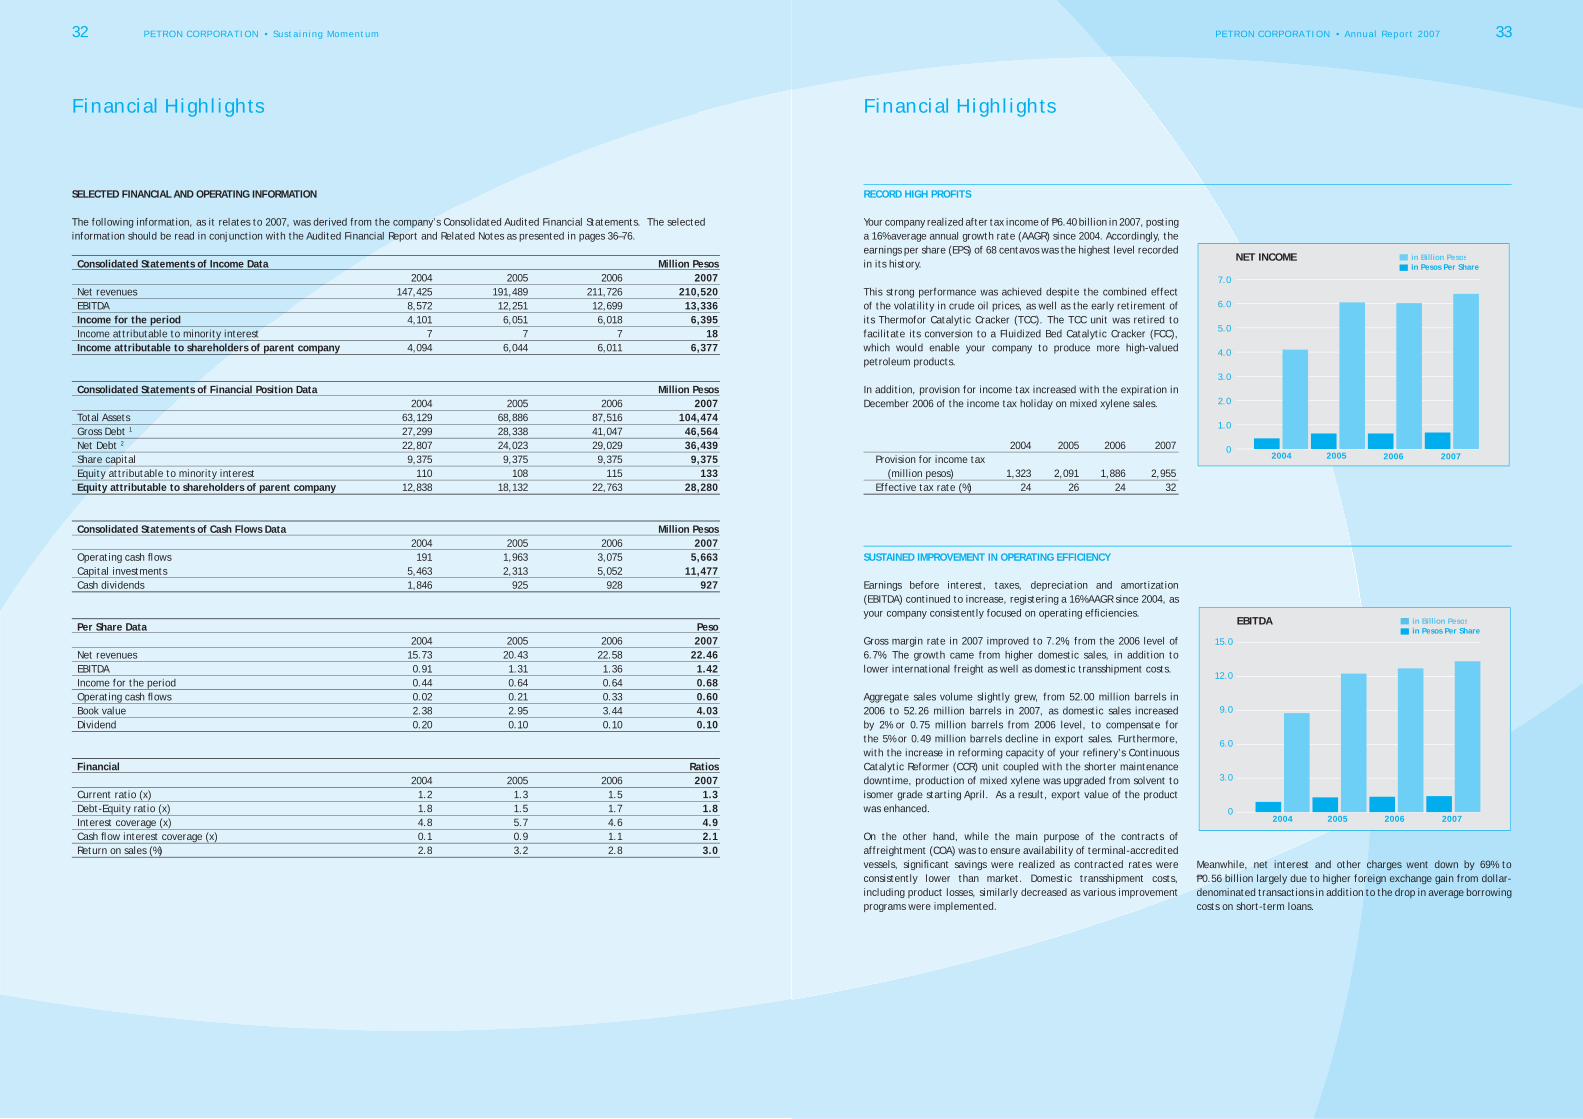
Consolidated Statements of Income Data Million Pesos 2004 2005 2006 2007Net revenues 147,425 191,489 211,726 210,520EBITDA 8,572 12,251 12,699 13,336Income for the period 4,101 6,051 6,018 6,395Income attributable to minority interest 7 7 7 18Income attributable to shareholders of parent company 4,094 6,044 6,011 6,377
Consolidated Statements of Financial Position Data Million Pesos 2004 2005 2006 2007Total Assets 63,129 68,886 87,516 104,474Gross Debt 1 27,299 28,338 41,047 46,564Net Debt 2 22,807 24,023 29,029 36,439Share capital 9,375 9,375 9,375 9,375Equity attributable to minority interest 110 108 115 133Equity attributable to shareholders of parent company 12,838 18,132 22,763 28,280
Consolidated Statements of Cash Flows Data Million Pesos 2004 2005 2006 2007Operating cash fl ows 191 1,963 3,075 5,663Capital investments 5,463 2,313 5,052 11,477Cash dividends 1,846 925 928 927
Per Share Data Peso 2004 2005 2006 2007Net revenues 15.73 20.43 22.58 22.46EBITDA 0.91 1.31 1.36 1.42Income for the period 0.44 0.64 0.64 0.68Operating cash fl ows 0.02 0.21 0.33 0.60Book value 2.38 2.95 3.44 4.03Dividend 0.20 0.10 0.10 0.10
Financial Ratios 2004 2005 2006 2007Current ratio (x) 1.2 1.3 1.5 1.3Debt-Equity ratio (x) 1.8 1.5 1.7 1.8Interest coverage (x) 4.8 5.7 4.6 4.9Cash fl ow interest coverage (x) 0.1 0.9 1.1 2.1Return on sales (%) 2.8 3.2 2.8 3.0
RECORD HIGH PROFITS
Your company realized after tax income of P6.40 billion in 2007, posting a 16% average annual growth rate (AAGR) since 2004. Accordingly, the earnings per share (EPS) of 68 centavos was the highest level recorded in its history.
This strong performance was achieved despite the combined effect of the volatility in crude oil prices, as well as the early retirement of its Thermofor Catalytic Cracker (TCC). The TCC unit was retired to facilitate its conversion to a Fluidized Bed Catalytic Cracker (FCC), which would enable your company to produce more high-valued petroleum products.
In addition, provision for income tax increased with the expiration in December 2006 of the income tax holiday on mixed xylene sales.
2004 2005 2006 2007 Provision for income tax (million pesos) 1,323 2,091 1,886 2,955 Effective tax rate (%) 24 26 24 32
SUSTAINED IMPROVEMENT IN OPERATING EFFICIENCY
Earnings before interest, taxes, depreciation and amortization (EBITDA) continued to increase, registering a 16% AAGR since 2004, as your company consistently focused on operating effi ciencies.
Gross margin rate in 2007 improved to 7.2%, from the 2006 level of 6.7%. The growth came from higher domestic sales, in addition to lower international freight as well as domestic transshipment costs.
Aggregate sales volume slightly grew, from 52.00 million barrels in 2006 to 52.26 million barrels in 2007, as domestic sales increased by 2% or 0.75 million barrels from 2006 level, to compensate for the 5% or 0.49 million barrels decline in export sales. Furthermore, with the increase in reforming capacity of your refi nery’s Continuous Catalytic Reformer (CCR) unit coupled with the shorter maintenance downtime, production of mixed xylene was upgraded from solvent to isomer grade starting April. As a result, export value of the product was enhanced.
On the other hand, while the main purpose of the contracts of affreightment (COA) was to ensure availability of terminal-accredited vessels, signifi cant savings were realized as contracted rates were consistently lower than market. Domestic transshipment costs, including product losses, similarly decreased as various improvement programs were implemented.
Financial Highlights
0
1.0
2.0
3.0
4.0
5.0
6.0
7.0
NET INCOME in Billion Pesosin Pesos Per Share
2004 2005 2006 2007
EBITDA in Billion Pesosin Pesos Per Share
0
3.0
6.0
9.0
12.0
15.0
2004 2005 2006 2007
Meanwhile, net interest and other charges went down by 69% to P0.56 billion largely due to higher foreign exchange gain from dollar-denominated transactions in addition to the drop in average borrowing costs on short-term loans.

34 PETRON CORPORATION • Sustaining Momentum PETRON CORPORATION • Annual Report 2007 35
Financial Highlights
OPERATING CASH FLOW in Billion Pesosin Pesos Per Share
0
2.0
4.0
6.0
2004 2005 2006 2007
RETAINED EARNINGS in Billion Pesosin Pesos Per Share
2004 2005 2006 20070
10.0
20.0
30.0
40.0
TOTAL ASSETS in Billion Pesosin Pesos Per Share
2004 2005 2006 20070
35.0
70.0
105.0
Statements of Management’s Responsibility for Financial Statements
The management of Petron Corporation is responsible for all information and representations contained in the consolidated fi nancial statements for the years ended December 31, 2007, 2006 and 2005. The fi nancial statements have been prepared in the conformity with the Philippine Financial Reporting Standards and refl ect amounts that are based on the best estimates and informed judgment of management with an appropriate consideration to materiality.
In this regard, management maintains a system of accounting and reporting which provides for the necessary internal controls to ensure that transactions are properly authorized and recorded, assets are safeguarded against unauthorized use or disposition and liabilities are recognized. Management likewise discloses to the company’s audit committee and to its external auditor: (i) all signifi cant defi ciencies in the design or operation of internal controls that could adversely affect its ability to record, process, and report fi nancial data; (ii) material weaknesses in the internal controls, and (iii) any fraud that involves management or other employees who exercise signifi cant roles in internal controls.
The Board of Directors reviews the fi nancial statements before such statements are approved and submitted to the stockholders of the Company.
Punongbayan & Araullo, the independent auditors appointed by the stockholders, have examined the fi nancial statements of the Company in accordance with Philippine Standards on Auditing and have expressed their opinion on the fairness of presentation upon completion of such examination, in their report to the Board of Directors and Stockholders.
Nicasio I. Alcantara Kamal M. Al-Yahya Chairman and Chief Executive Offi cer President
Antonio G. Pelayo Ma. Concepcion F. de Claro Vice President – Finance and Subsidiaries Controller
ROBUST OPERATING CASH GENERATION
With the strong EBITDA, your company’s cash fl ow from its operating activities soared to P5.67 billion. Augmented with the proceeds from a P2 billion club loan, your company was able to fund its investments during the year, amounting to P11.48 billion. Bulk of its investments were for the construction costs of its Petro Fluidized Catalytic Cracker (PetroFCC) as well as an additional refi nery facility that would extract other petrochemicals (BTX unit). Mechanical completion of the PetroFCC, which includes a new Propylene Recovery Unit (PRU) is targeted in the fi rst quarter of 2008; while the construction of the BTX unit, which will produce aromatics such as benzene and toluene and expand the company’s mixed xylene production capacity, is to be completed by the end of 2008.
Moreover, the robust earnings improved ratio of earnings to interest.
No. of times 2004 2005 2006 2007EBIT 4.0 4.6 3.6 3.7EBITDA 4.8 5.7 4.6 4.9Operating Cash Flow 0.1 0.9 1.1 2.1
HEALTHY FINANCIAL CONDITION AND LIQUIDITY
Your company’s fi nancial condition continued to be healthy. Total resources as of end 2007 were at P104.47 billion, recording a 19% growth from the end 2006 level and an AAGR of 18% since 2004.
The main drivers of the P16.96 billion increment were:
• Receivables rose by P2.24 billion to P17.87 billion on account largely of higher revenues posted for exports.
• Inventories increased by P3.98 billion to P30.27 billion despite the lower volume. This was attributed to the spike in crude cost (Dubai FOB average: 2007 – $68.27 vs. 2006 - $61.54).
• Property, Plant and Equipment grew by P8.98 billion to P34.13 billion mainly representing investments in the Philippines’ fi rst petrochemical feedstock facilities.
Meanwhile, Short-term Loans and Suppliers’ Credit went up by P10.98 billion as a consequence of the spike in crude FOB price per barrel. Despite the increase in liabilities, debt-equity ratio of 1.8 times versus the 1.7 times posted in 2006 was well within the creditor banks’ limit.
On the other hand, book value per share showed 17% improvement at P4.03 from end-2006 level of P3.44, or a 19% AAGR.
36 PETRON CORPORATION • Sustaining Momentum PETRON CORPORATION • Annual Report 2007 37
Independent Auditors’ Report
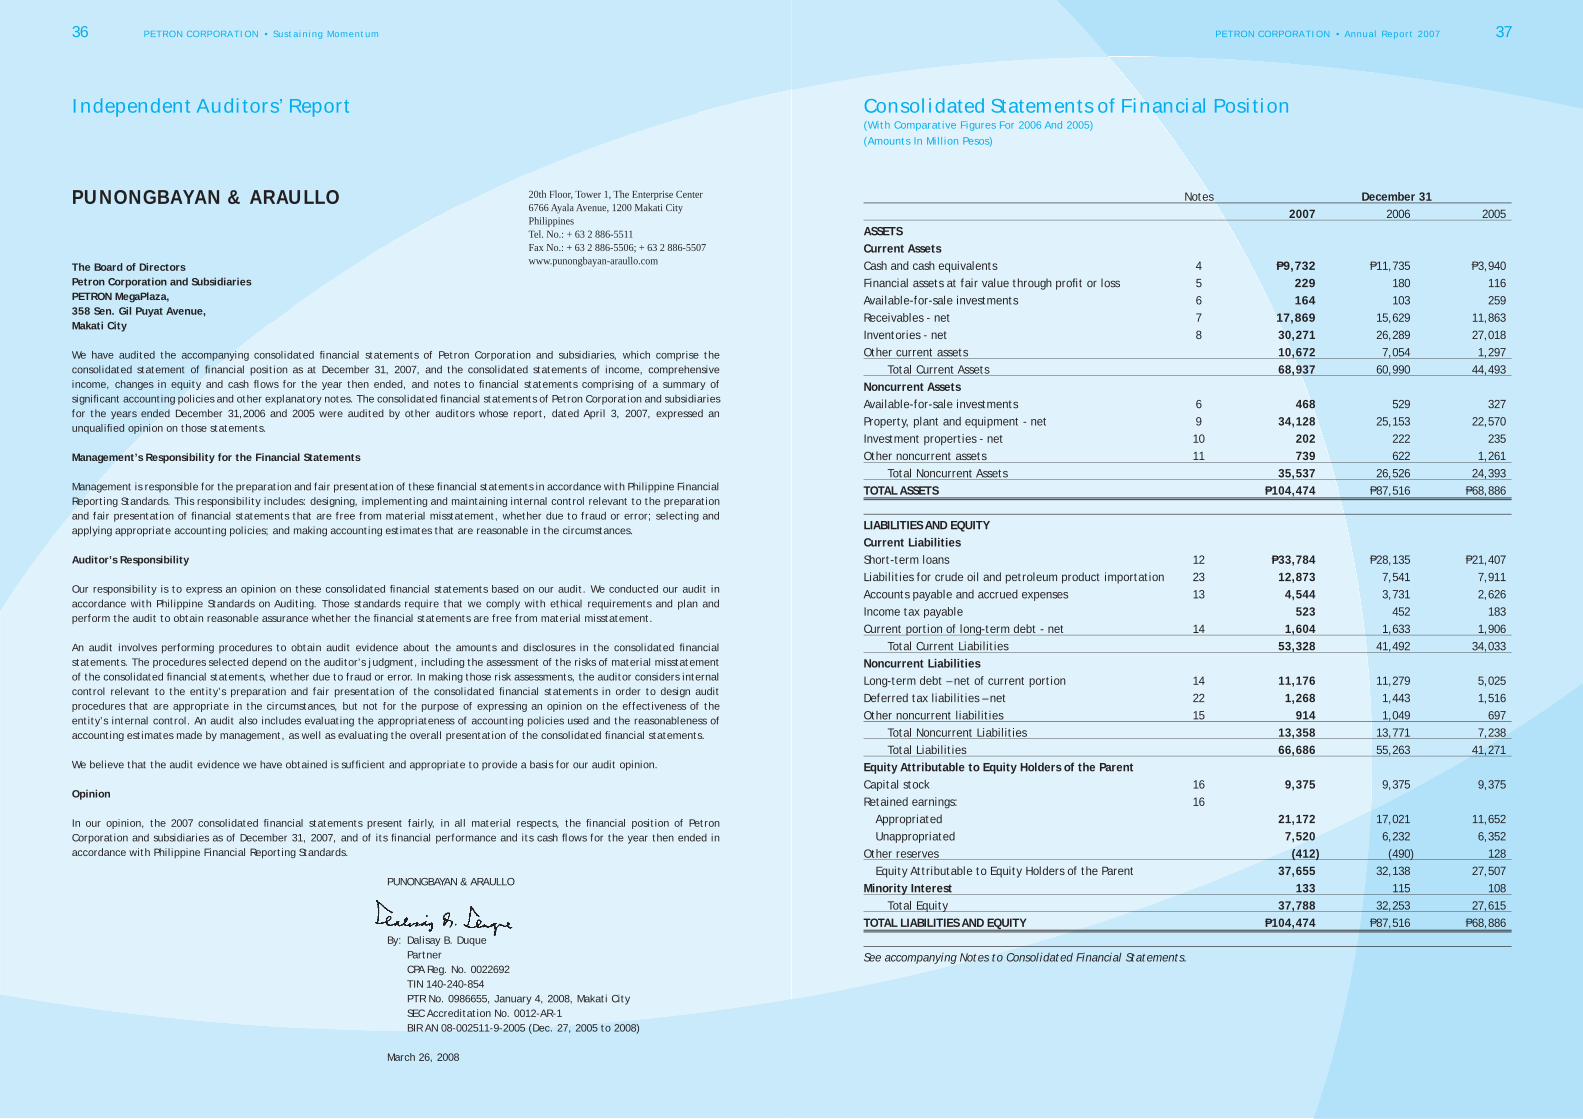
Notes December 31 2007 2006 2005ASSETS Current Assets Cash and cash equivalents 4 P9,732 P11,735 P3,940Financial assets at fair value through profi t or loss 5 229 180 116Available-for-sale investments 6 164 103 259Receivables - net 7 17,869 15,629 11,863Inventories - net 8 30,271 26,289 27,018Other current assets 10,672 7,054 1,297 Total Current Assets 68,937 60,990 44,493Noncurrent Assets Available-for-sale investments 6 468 529 327Property, plant and equipment - net 9 34,128 25,153 22,570Investment properties - net 10 202 222 235Other noncurrent assets 11 739 622 1,261 Total Noncurrent Assets 35,537 26,526 24,393TOTAL ASSETS P104,474 P87,516 P68,886 LIABILITIES AND EQUITY Current Liabilities Short-term loans 12 P33,784 P28,135 P21,407Liabilities for crude oil and petroleum product importation 23 12,873 7,541 7,911Accounts payable and accrued expenses 13 4,544 3,731 2,626Income tax payable 523 452 183Current portion of long-term debt - net 14 1,604 1,633 1,906 Total Current Liabilities 53,328 41,492 34,033Noncurrent Liabilities Long-term debt – net of current portion 14 11,176 11,279 5,025Deferred tax liabilities – net 22 1,268 1,443 1,516Other noncurrent liabilities 15 914 1,049 697 Total Noncurrent Liabilities 13,358 13,771 7,238 Total Liabilities 66,686 55,263 41,271Equity Attributable to Equity Holders of the Parent Capital stock 16 9,375 9,375 9,375Retained earnings: 16 Appropriated 21,172 17,021 11,652 Unappropriated 7,520 6,232 6,352Other reserves (412 ) (490 ) 128 Equity Attributable to Equity Holders of the Parent 37,655 32,138 27,507Minority Interest 133 115 108 Total Equity 37,788 32,253 27,615TOTAL LIABILITIES AND EQUITY P104,474 P87,516 P68,886 See accompanying Notes to Consolidated Financial Statements.
Consolidated Statements of Financial Position(With Comparative Figures For 2006 And 2005)(Amounts In Million Pesos)
The Board of DirectorsPetron Corporation and SubsidiariesPETRON MegaPlaza,358 Sen. Gil Puyat Avenue,Makati City
We have audited the accompanying consolidated fi nancial statements of Petron Corporation and subsidiaries, which comprise the consolidated statement of fi nancial position as at December 31, 2007, and the consolidated statements of income, comprehensive income, changes in equity and cash fl ows for the year then ended, and notes to fi nancial statements comprising of a summary of signifi cant accounting policies and other explanatory notes. The consolidated fi nancial statements of Petron Corporation and subsidiaries for the years ended December 31,2006 and 2005 were audited by other auditors whose report, dated April 3, 2007, expressed an unqualifi ed opinion on those statements.
Management’s Responsibility for the Financial Statements
Management is responsible for the preparation and fair presentation of these fi nancial statements in accordance with Philippine Financial Reporting Standards. This responsibility includes: designing, implementing and maintaining internal control relevant to the preparation and fair presentation of fi nancial statements that are free from material misstatement, whether due to fraud or error; selecting and applying appropriate accounting policies; and making accounting estimates that are reasonable in the circumstances.
Auditor’s Responsibility
Our responsibility is to express an opinion on these consolidated fi nancial statements based on our audit. We conducted our audit in accordance with Philippine Standards on Auditing. Those standards require that we comply with ethical requirements and plan and perform the audit to obtain reasonable assurance whether the fi nancial statements are free from material misstatement.
An audit involves performing procedures to obtain audit evidence about the amounts and disclosures in the consolidated fi nancial statements. The procedures selected depend on the auditor’s judgment, including the assessment of the risks of material misstatement of the consolidated fi nancial statements, whether due to fraud or error. In making those risk assessments, the auditor considers internal control relevant to the entity’s preparation and fair presentation of the consolidated fi nancial statements in order to design audit procedures that are appropriate in the circumstances, but not for the purpose of expressing an opinion on the effectiveness of the entity’s internal control. An audit also includes evaluating the appropriateness of accounting policies used and the reasonableness of accounting estimates made by management, as well as evaluating the overall presentation of the consolidated fi nancial statements.
We believe that the audit evidence we have obtained is suffi cient and appropriate to provide a basis for our audit opinion.
Opinion
In our opinion, the 2007 consolidated fi nancial statements present fairly, in all material respects, the fi nancial position of Petron Corporation and subsidiaries as of December 31, 2007, and of its fi nancial performance and its cash fl ows for the year then ended in accordance with Philippine Financial Reporting Standards.
PUNONGBAYAN & ARAULLO
By: Dalisay B. Duque Partner CPA Reg. No. 0022692 TIN 140-240-854 PTR No. 0986655, January 4, 2008, Makati City SEC Accreditation No. 0012-AR-1 BIR AN 08-002511-9-2005 (Dec. 27, 2005 to 2008)
March 26, 2008
PUNONGBAYAN & ARAULLO 20th Floor, Tower 1, The Enterprise Center6766 Ayala Avenue, 1200 Makati CityPhilippinesTel. No.: + 63 2 886-5511Fax No.: + 63 2 886-5506; + 63 2 886-5507www.punongbayan-araullo.com
38 PETRON CORPORATION • Sustaining Momentum PETRON CORPORATION • Annual Report 2007 39
Notes Years Ended December 31 2007 2006 2005
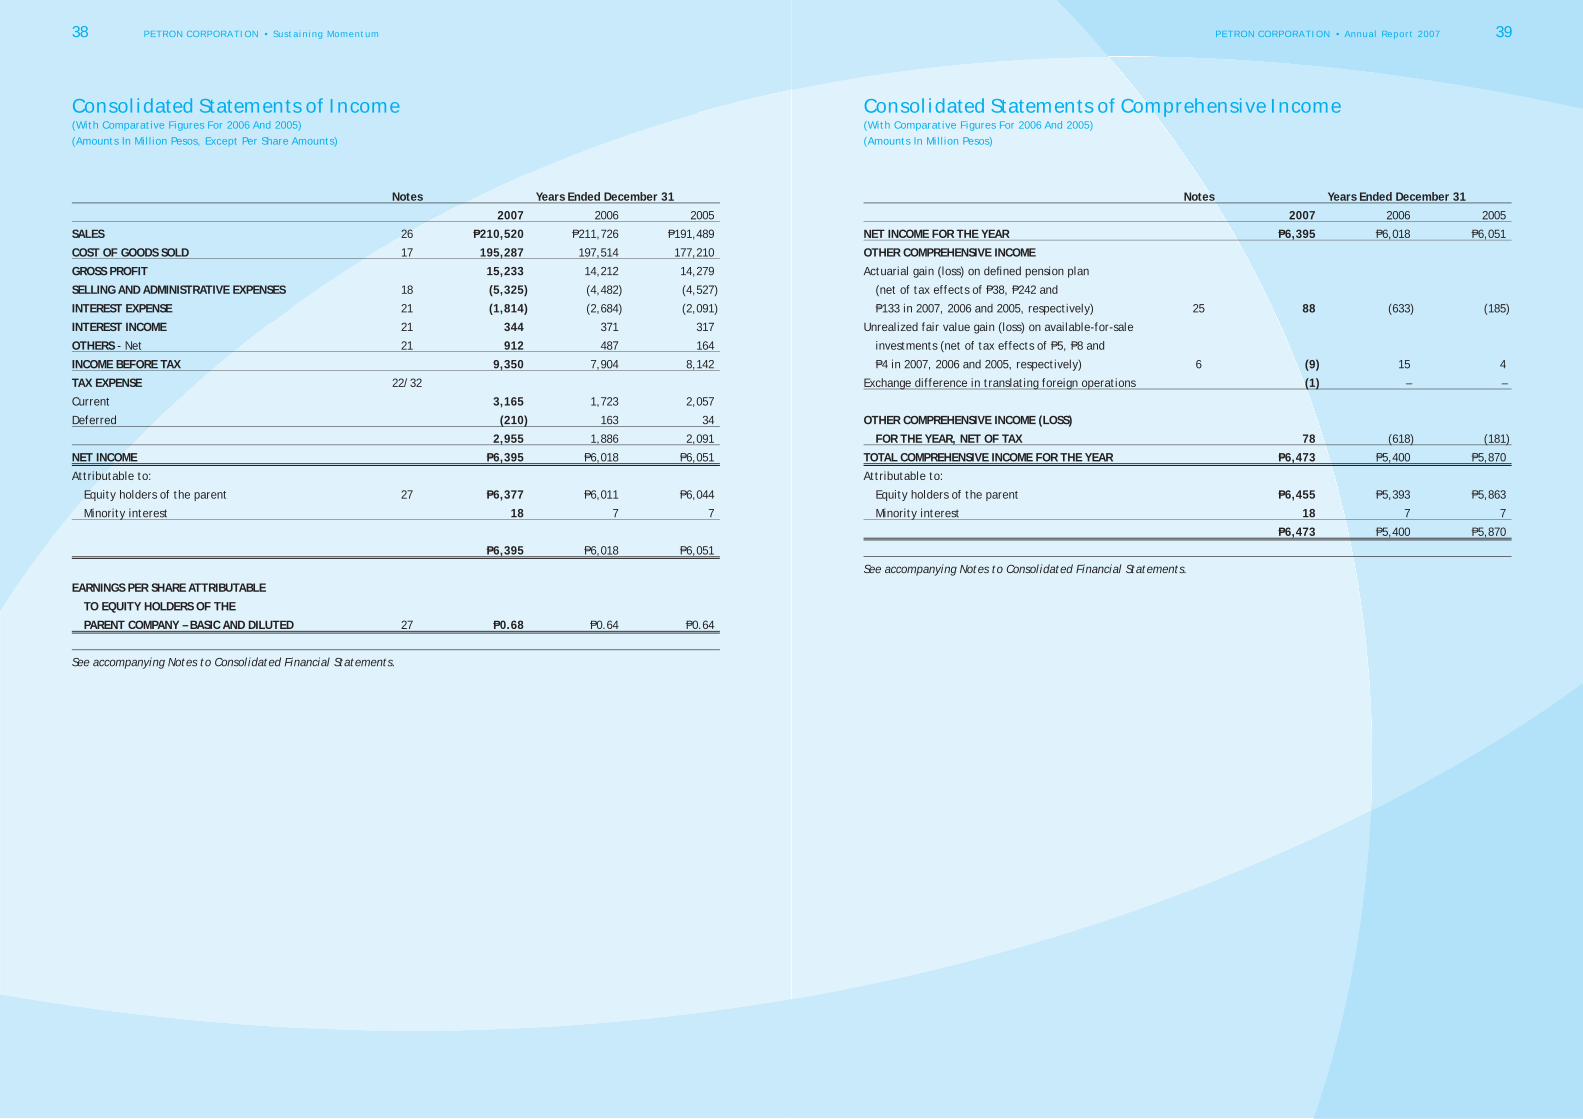
SALES 26 P210,520 P211,726 P191,489
COST OF GOODS SOLD 17 195,287 197,514 177,210
GROSS PROFIT 15,233 14,212 14,279
SELLING AND ADMINISTRATIVE EXPENSES 18 (5,325 ) (4,482 ) (4,527 )
INTEREST EXPENSE 21 (1,814 ) (2,684 ) (2,091 )
INTEREST INCOME 21 344 371 317
OTHERS - Net 21 912 487 164
INCOME BEFORE TAX 9,350 7,904 8,142
TAX EXPENSE 22/32
Current 3,165 1,723 2,057
Deferred (210 ) 163 34
2,955 1,886 2,091
NET INCOME P6,395 P6,018 P6,051
Attributable to:
Equity holders of the parent 27 P6,377 P6,011 P6,044
Minority interest 18 7 7
P6,395 P6,018 P6,051
EARNINGS PER SHARE ATTRIBUTABLE TO EQUITY HOLDERS OF THE PARENT COMPANY – BASIC AND DILUTED 27 P0.68 P0.64 P0.64
See accompanying Notes to Consolidated Financial Statements.
Consolidated Statements of Income(With Comparative Figures For 2006 And 2005)(Amounts In Million Pesos, Except Per Share Amounts)
Consolidated Statements of Comprehensive Income(With Comparative Figures For 2006 And 2005)(Amounts In Million Pesos)
Notes Years Ended December 31 2007 2006 2005
NET INCOME FOR THE YEAR P6,395 P6,018 P6,051
OTHER COMPREHENSIVE INCOME
Actuarial gain (loss) on defi ned pension plan
(net of tax effects of P38, P242 and
P133 in 2007, 2006 and 2005, respectively) 25 88 (633 ) (185 )
Unrealized fair value gain (loss) on available-for-sale
investments (net of tax effects of P5, P8 and
P4 in 2007, 2006 and 2005, respectively) 6 (9 ) 15 4
Exchange difference in translating foreign operations (1 ) – –
OTHER COMPREHENSIVE INCOME (LOSS) FOR THE YEAR, NET OF TAX 78 (618 ) (181 )
TOTAL COMPREHENSIVE INCOME FOR THE YEAR P6,473 P5,400 P5,870
Attributable to:
Equity holders of the parent P6,455 P5,393 P5,863
Minority interest 18 7 7
P6,473 P5,400 P5,870
See accompanying Notes to Consolidated Financial Statements.
40 PETRON CORPORATION • Sustaining Momentum PETRON CORPORATION • Annual Report 2007 41
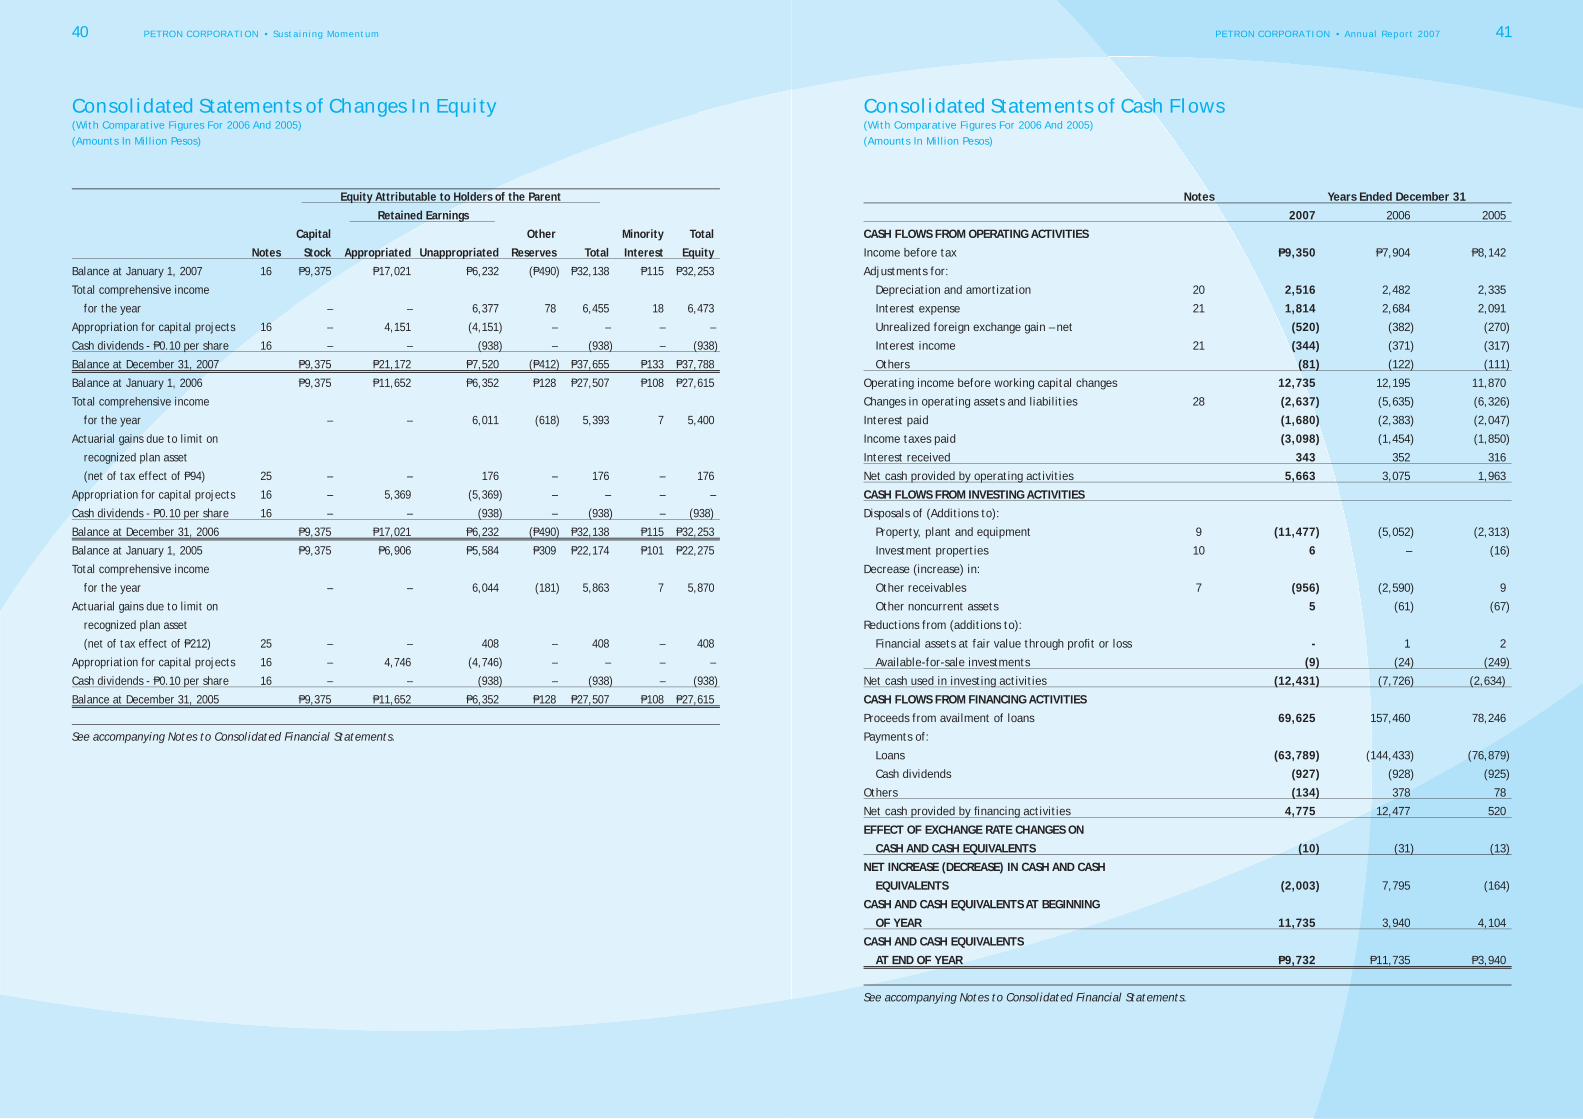
Equity Attributable to Holders of the Parent Retained Earnings Capital Other Minority Total Notes Stock Appropriated Unappropriated Reserves Total Interest EquityBalance at January 1, 2007 16 P9,375 P17,021 P6,232 (P490 ) P32,138 P115 P32,253
Total comprehensive income
for the year – – 6,377 78 6,455 18 6,473
Appropriation for capital projects 16 – 4,151 (4,151 ) – – – –
Cash dividends - P0.10 per share 16 – – (938 ) – (938 ) – (938 )
Balance at December 31, 2007 P9,375 P21,172 P7,520 (P412 ) P37,655 P133 P37,788
Balance at January 1, 2006 P9,375 P11,652 P6,352 P128 P27,507 P108 P27,615
Total comprehensive income
for the year – – 6,011 (618 ) 5,393 7 5,400
Actuarial gains due to limit on
recognized plan asset
(net of tax effect of P94) 25 – – 176 – 176 – 176
Appropriation for capital projects 16 – 5,369 (5,369 ) – – – –
Cash dividends - P0.10 per share 16 – – (938 ) – (938 ) – (938)
Balance at December 31, 2006 P9,375 P17,021 P6,232 (P490 ) P32,138 P115 P32,253
Balance at January 1, 2005 P9,375 P6,906 P5,584 P309 P22,174 P101 P22,275
Total comprehensive income
for the year – – 6,044 (181 ) 5,863 7 5,870
Actuarial gains due to limit on
recognized plan asset
(net of tax effect of P212) 25 – – 408 – 408 – 408
Appropriation for capital projects 16 – 4,746 (4,746 ) – – – –
Cash dividends - P0.10 per share 16 – – (938 ) – (938 ) – (938 )
Balance at December 31, 2005 P9,375 P11,652 P6,352 P128 P27,507 P108 P27,615
See accompanying Notes to Consolidated Financial Statements.
Consolidated Statements of Changes In Equity(With Comparative Figures For 2006 And 2005)(Amounts In Million Pesos)
Consolidated Statements of Cash Flows(With Comparative Figures For 2006 And 2005)(Amounts In Million Pesos)
Notes Years Ended December 31 2007 2006 2005
CASH FLOWS FROM OPERATING ACTIVITIES
Income before tax P9,350 P7,904 P8,142
Adjustments for:
Depreciation and amortization 20 2,516 2,482 2,335
Interest expense 21 1,814 2,684 2,091
Unrealized foreign exchange gain – net (520 ) (382 ) (270 )
Interest income 21 (344 ) (371 ) (317 )
Others (81 ) (122 ) (111 )
Operating income before working capital changes 12,735 12,195 11,870
Changes in operating assets and liabilities 28 (2,637 ) (5,635 ) (6,326 )
Interest paid (1,680 ) (2,383 ) (2,047 )
Income taxes paid (3,098 ) (1,454 ) (1,850 )
Interest received 343 352 316
Net cash provided by operating activities 5,663 3,075 1,963
CASH FLOWS FROM INVESTING ACTIVITIES
Disposals of (Additions to):
Property, plant and equipment 9 (11,477 ) (5,052 ) (2,313 )
Investment properties 10 6 – (16 )
Decrease (increase) in:
Other receivables 7 (956 ) (2,590 ) 9
Other noncurrent assets 5 (61 ) (67 )
Reductions from (additions to):
Financial assets at fair value through profi t or loss - 1 2
Available-for-sale investments (9 ) (24 ) (249 )
Net cash used in investing activities (12,431 ) (7,726 ) (2,634)
CASH FLOWS FROM FINANCING ACTIVITIES
Proceeds from availment of loans 69,625 157,460 78,246
Payments of:
Loans (63,789 ) (144,433 ) (76,879 )
Cash dividends (927 ) (928 ) (925 )
Others (134 ) 378 78
Net cash provided by fi nancing activities 4,775 12,477 520
EFFECT OF EXCHANGE RATE CHANGES ON CASH AND CASH EQUIVALENTS (10 ) (31 ) (13 )
NET INCREASE (DECREASE) IN CASH AND CASH EQUIVALENTS (2,003 ) 7,795 (164 )
CASH AND CASH EQUIVALENTS AT BEGINNING OF YEAR 11,735 3,940 4,104
CASH AND CASH EQUIVALENTS AT END OF YEAR P9,732 P11,735 P3,940
See accompanying Notes to Consolidated Financial Statements.

42 PETRON CORPORATION • Sustaining Momentum PETRON CORPORATION • Annual Report 2007 43
Notes to Consolidated Financial Statements(With Comparative Figures For 2006 And 2005)(Amounts In Million Pesos, Except Par Value, Shares And Per Share Amounts, Exchange Rates, And Commodity Volumes)
1. Corporate Information
Petron Corporation (the Parent Company or Petron) was incorporated under the laws of the Republic of the Philippines and registered with the Philippine Securities and Exchange Commission (SEC) on December 15, 1966. Petron is the largest oil refi ning and marketing company in the Philippines, supplying more than one-third of the country’s oil requirements. The Company’s vision is to be the leading provider of total customer solutions in the energy sector and its derivative businesses.
Petron operates a refi nery in Limay, Bataan, with a rated capacity of 180,000 barrels a day. Petron’s International Standards Organization (ISO) 14001 - certifi ed refi nery processes crude oil into a full range of petroleum products including liquefi ed petroleum gas (LPG), gasoline, diesel, jet fuel, kerosene, industrial fuel oil, solvents, asphalts, and mixed xylene. From the refi nery, Petron moves its products mainly by sea to Petron’s 31 depots and terminals situated all over the country. Through this nationwide network, Petron supplies fuel oil, diesel, and LPG to various industrial customers. The power sector is Petron’s largest customer. Petron also supplies jet fuel at key airports to international and domestic carriers.
Through more than 1,260 service stations, Petron retail gasoline, diesel, and kerosene to motorists and public transport operators. Petron also sells its LPG brand “Gasul” to households and other consumers through an extensive dealership network.
Petron operates a lube oil blending plant at Pandacan Oil Terminals, where it manufactures lubes and greases. These are also sold through Petron’s service stations and sales centers.
Petron is expanding its non-fuel businesses which include its convenience store brand “Treats.” Petron has partnered with major fast-food chains, coffee shops, and other consumer services to give its customers a one-stop full service experience. Petron is also putting up additional company-owned and company-operated (COCO) service stations in strategic locations.
In line with Petron’s efforts to increase its presence in the regional market, it exports various petroleum products to Asia-Pacifi c countries such as Cambodia, South Korea, China, and Australia.
Petron is a public company under Section 17.2 of the Securities Regulation Code. The Philippine National Oil Company (PNOC) and the Aramco Overseas Company B.V. (AOC) each owns a 40% share of equity. The remaining 20% is held by more than 180,000 stockholders. On March 14, 2008, AOC entered into a share purchase agreement with SEA Refi nery Holdings and subsequently issued a Transfer Notice to PNOC to signify its intent to sell its 40% equity stake in Petron. SEA Refi nery Holdings is a company owned by funds managed by Ashmore Group. The principal activities of the subsidiaries are described in Note 2 under “Basis of Consolidation.” The registered offi ce address of Petron and its Philippine-based subsidiaries is Petron MegaPlaza, 358 Sen. Gil Puyat Avenue, Makati City.
The accompanying consolidated fi nancial statements for the year ended December 31, 2007 (including comparatives for the years ended December 31, 2006 and 2005) were approved and authorized for issue by the Board of Directors (BOD) on March 26, 2008.
2. Summary of Signifi cant Accounting Policies
Basis of PreparationThe accompanying consolidated fi nancial statements of Petron and subsidiaries (collectively referred to as “the Company”) were prepared on historical cost basis, except for fi nancial assets at fair value through profi t or loss (FVPL), available-for-sale (AFS) investments, and derivative fi nancial instruments, which are measured at fair value. The consolidated fi nancial statements are presented in Philippine pesos, which is the Company’s functional and presentation currency. All amounts are rounded to the nearest millions (P000,000), except when otherwise indicated.
Reclassifi cationsCertain accounts in the 2006 and 2005 fi nancial statements were reclassifi ed to conform to the 2007 presentation. Specifi cally, the changes in equity previously presented as part of the notes to fi nancial statements were presented in a separate statement in accordance with the requirements of PAS 1 (Revised 2007), Presentation of Financial Statements.
Statement of ComplianceThe consolidated fi nancial statements of the Company were prepared in compliance with Philippine Financial Reporting Standards (PFRS).
Changes in Accounting PoliciesThe accounting policies adopted are consistent with those of the previous fi nancial years, except for the policies related to the following new and amended PFRS and Philippine Accounting Standard (PAS) effective in 2007. Adoption of these new and amended standards did not have any signifi cant effect on the Company’s consolidated fi nancial statements. These, however, required additional disclosures on the consolidated fi nancial statements.
• PFRS 7, Financial Instruments: Disclosures, became effective for fi nancial years beginning on or after January 1, 2007. The standard introduces new disclosures to improve the information about fi nancial instruments. It requires the disclosure of qualitative and quantitative information about exposure to risks arising from fi nancial instruments, including specifi ed minimum disclosures about credit risk, liquidity risk and market risk, as well as sensitivity analysis to market risk. It replaces PAS 30, Disclosures in the Financial Statements of Banks and Similar Financial Institutions, and the disclosure requirements of PAS 32, Financial Instruments: Disclosure and Presentation. This standard is applicable to all entities reporting under PFRS. PFRS 7 disclosures are required to be made for all periods presented.
The Company availed of the transitional relief granted by the Financial Reporting Standards Council and presented only the relevant disclosures required by PFRS 7 for 2007 and 2006.
• Amendment to PAS 1, Presentation of Financial Statements, became effective for fi nancial years beginning on or after January 1, 2007. The amendment introduces disclosures about the level of an entity’s capital and how it manages capital.
Additional disclosures required by amendment to PAS 1 are included in Note 29.
The following Philippine Interpretation is effective in 2007 but is not relevant to the Company:
• Philippine Interpretation IFRIC 7, Applying the Restatement Approach under PAS 29, Financial Reporting in Hyperinfl ationary Economies, became effective for fi nancial years beginning on or after March 1, 2006. This interpretation provides guidance on how to apply PAS 29 when an economy fi rst becomes hyperinfl ationary, in particular the accounting for deferred income tax.
The Company adopted the following Philippine Interpretations and amended/ revised standards.
• PFRS 8, Operating Segments, will become effective on January 1, 2009 and will replace PAS 14, Segment Reporting. The standard requires an entity to disclose information about the nature and fi nancial effects of the types of business activities in which the Company engages and the economic environment it operates following a management approach to reporting segment information.
The Company effectively adopted this standard early starting 2003 as the Company is signifi cantly in compliance with the required additional disclosures of this standard.
• PAS 1 (Revised 2007), Presentation of Financial Statements, which will become effective on January 1, 2009, requires an entity to present all items of income and expense recognized in the period in a single statement of comprehensive income or in two statements: a separate statement of income and a statement of comprehensive income. The statement of income shall disclose income and expense recognized in profi t and loss in the same way as the current version of PAS 1. The statement of comprehensive income shall disclose profi t or loss for the period, plus each component of income and expense recognized outside of profi t and loss classifi ed by nature (e.g., gains or losses on available-for-sale assets or translation differences related to foreign operations). Changes in equity arising from transactions with owners are excluded from the statement of comprehensive income (e.g., dividends and capital increase). An entity would also be required to include in its set of fi nancial statements a statement showing its fi nancial position (or balance sheet) at the beginning of the previous period when the entity retrospectively applies an accounting policy or makes a retrospective restatement.
The Company effectively early adopted the amendment to this standard as the Company has signifi cantly complied with the revisions as prescribed by this amended standard starting in its 2005 fi nancial statements while changes in the fi nancial statement nomenclature were made in 2007.
• PAS 23, Borrowing Costs will become effective on January 1, 2009. The standard has been revised to require capitalization of borrowing costs when such costs relate to a qualifying asset. A qualifying asset is an asset that necessarily takes a substantial period of time to get ready for its intended use or sale.
Adoption of this new standard has no impact on the fi nancial statements as the Company’s accounting policy is to capitalize all interest directly related to qualifying assets.
• Philippine Interpretation IFRIC 8, Scope of PFRS 2, became effective for fi nancial years beginning on or after May 1, 2006. This interpretation requires PFRS 2, Share-based Payment, to be applied to any arrangements where equity instruments are issued for consideration which appears to be less than fair value.
This interpretation was early adopted in 2006 and it did not have any impact on the fi nancial statements since the Company has no share-based transactions.
• Philippine Interpretation IFRIC 9, Re-assessment of Embedded Derivatives, became effective for fi nancial years beginning on or after June 1, 2006. This interpretation establishes that the date to assess the existence of an embedded derivative is the date an entity fi rst becomes a party to the contract, with re-assessment only if there is a change to the contract that signifi cantly modifi es the cash fl ows.
This interpretation was early adopted in 2006 and did not have any impact on the fi nancial statements of the Company as there were no changes to the terms of the Company’s contracts.
• Philippine Interpretation IFRIC 10, Interim Financial Reporting and Impairment, which became effective for fi nancial years beginning on or after November 1, 2006, provides that the frequency of fi nancial reporting does affect the amount of impairment charge to be recognized in the annual fi nancial reporting with respect to goodwill and AFS investments.
This interpretation was early adopted in 2006 and it did not have any impact on the fi nancial statements of the Company because no impairment losses were required to be recognized in an interim period that was reversed at or subsequent to the statement of fi nancial position date.
The following new and revised standards and interpretations have been approved but are not yet effective:
• Philippine Interpretation IFRIC 11, PFRS 2 - Company and Treasury Share Transactions will become effective on January 1, 2008. This interpretation requires arrangements whereby an employee is granted rights to an entity’s equity instruments to be accounted for as an equity-settled scheme by the entity even if (a) the entity chooses or is required to buy those equity instruments (e.g., treasury shares) from another party, or (b) the shareholder(s) of the entity provide the equity instruments needed.
This interpretation will have no signifi cant impact on the Company since it does not have share-based transactions either to employees or third parties.
• Philippine Interpretation IFRIC 12, Service Concession Arrangement, will become effective on January 1, 2008. This interpretation covers contractual arrangements arising from public-to-private service concessions arrangements if control of the assets remain in public hands but the private sector operator is responsible for construction activities as well as for operating and maintaining the public sector infrastructure.
This interpretation will have no impact on the fi nancial statements of the Company as this is not relevant to the Company’s operations.
• Philippine Interpretation IFRIC 13, Customer Loyalty Programs, will become effective on January 1, 2008. This interpretation requires customer loyalty award credits to be accounted for as a separate component of the sales transactions in which they are granted and therefore part of the fair value of the consideration received is allocated to the award credits and deferred over the period that the award credits are fulfi lled.
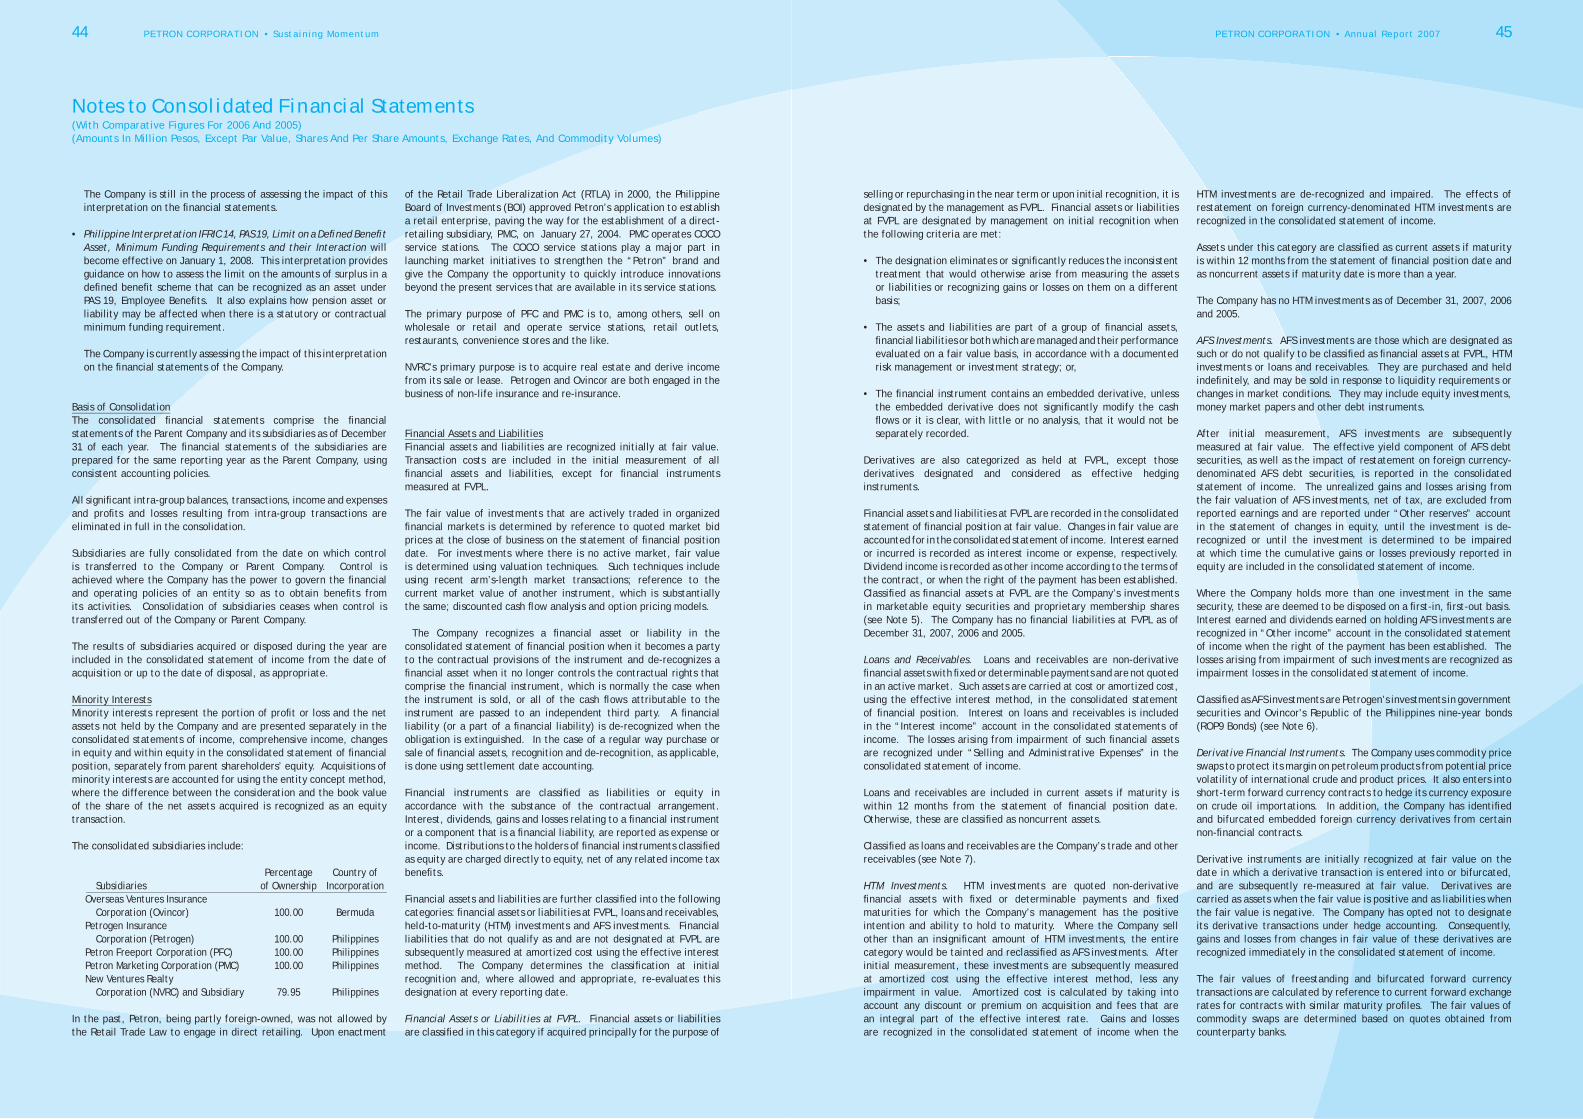
44 PETRON CORPORATION • Sustaining Momentum PETRON CORPORATION • Annual Report 2007 45
The Company is still in the process of assessing the impact of this interpretation on the fi nancial statements.
• Philippine Interpretation IFRIC 14, PAS 19, Limit on a Defi ned Benefi t Asset, Minimum Funding Requirements and their Interaction will become effective on January 1, 2008. This interpretation provides guidance on how to assess the limit on the amounts of surplus in a defi ned benefi t scheme that can be recognized as an asset under PAS 19, Employee Benefi ts. It also explains how pension asset or liability may be affected when there is a statutory or contractual minimum funding requirement.
The Company is currently assessing the impact of this interpretation on the fi nancial statements of the Company.
Basis of ConsolidationThe consolidated fi nancial statements comprise the fi nancial statements of the Parent Company and its subsidiaries as of December 31 of each year. The fi nancial statements of the subsidiaries are prepared for the same reporting year as the Parent Company, using consistent accounting policies.
All signifi cant intra-group balances, transactions, income and expenses and profi ts and losses resulting from intra-group transactions are eliminated in full in the consolidation.
Subsidiaries are fully consolidated from the date on which control is transferred to the Company or Parent Company. Control is achieved where the Company has the power to govern the fi nancial and operating policies of an entity so as to obtain benefi ts from its activities. Consolidation of subsidiaries ceases when control is transferred out of the Company or Parent Company.
The results of subsidiaries acquired or disposed during the year are included in the consolidated statement of income from the date of acquisition or up to the date of disposal, as appropriate.
Minority InterestsMinority interests represent the portion of profi t or loss and the net assets not held by the Company and are presented separately in the consolidated statements of income, comprehensive income, changes in equity and within equity in the consolidated statement of fi nancial position, separately from parent shareholders’ equity. Acquisitions of minority interests are accounted for using the entity concept method, where the difference between the consideration and the book value of the share of the net assets acquired is recognized as an equity transaction.
The consolidated subsidiaries include:
Percentage Country of Subsidiaries of Ownership Incorporation Overseas Ventures Insurance Corporation (Ovincor) 100.00 Bermuda Petrogen Insurance Corporation (Petrogen) 100.00 Philippines Petron Freeport Corporation (PFC) 100.00 Philippines Petron Marketing Corporation (PMC) 100.00 Philippines New Ventures Realty Corporation (NVRC) and Subsidiary 79.95 Philippines
In the past, Petron, being partly foreign-owned, was not allowed by the Retail Trade Law to engage in direct retailing. Upon enactment
of the Retail Trade Liberalization Act (RTLA) in 2000, the Philippine Board of Investments (BOI) approved Petron’s application to establish a retail enterprise, paving the way for the establishment of a direct-retailing subsidiary, PMC, on January 27, 2004. PMC operates COCO service stations. The COCO service stations play a major part in launching market initiatives to strengthen the “Petron” brand and give the Company the opportunity to quickly introduce innovations beyond the present services that are available in its service stations.
The primary purpose of PFC and PMC is to, among others, sell on wholesale or retail and operate service stations, retail outlets, restaurants, convenience stores and the like.
NVRC’s primary purpose is to acquire real estate and derive income from its sale or lease. Petrogen and Ovincor are both engaged in the business of non-life insurance and re-insurance.
Financial Assets and LiabilitiesFinancial assets and liabilities are recognized initially at fair value. Transaction costs are included in the initial measurement of all fi nancial assets and liabilities, except for fi nancial instruments measured at FVPL.
The fair value of investments that are actively traded in organized fi nancial markets is determined by reference to quoted market bid prices at the close of business on the statement of fi nancial position date. For investments where there is no active market, fair value is determined using valuation techniques. Such techniques include using recent arm’s-length market transactions; reference to the current market value of another instrument, which is substantially the same; discounted cash fl ow analysis and option pricing models.
The Company recognizes a fi nancial asset or liability in the consolidated statement of fi nancial position when it becomes a party to the contractual provisions of the instrument and de-recognizes a fi nancial asset when it no longer controls the contractual rights that comprise the fi nancial instrument, which is normally the case when the instrument is sold, or all of the cash fl ows attributable to the instrument are passed to an independent third party. A fi nancial liability (or a part of a fi nancial liability) is de-recognized when the obligation is extinguished. In the case of a regular way purchase or sale of fi nancial assets, recognition and de-recognition, as applicable, is done using settlement date accounting.
Financial instruments are classifi ed as liabilities or equity in accordance with the substance of the contractual arrangement. Interest, dividends, gains and losses relating to a fi nancial instrument or a component that is a fi nancial liability, are reported as expense or income. Distributions to the holders of fi nancial instruments classifi ed as equity are charged directly to equity, net of any related income tax benefi ts.
Financial assets and liabilities are further classifi ed into the following categories: fi nancial assets or liabilities at FVPL, loans and receivables, held-to-maturity (HTM) investments and AFS investments. Financial liabilities that do not qualify as and are not designated at FVPL are subsequently measured at amortized cost using the effective interest method. The Company determines the classifi cation at initial recognition and, where allowed and appropriate, re-evaluates this designation at every reporting date.
Financial Assets or Liabilities at FVPL. Financial assets or liabilities are classifi ed in this category if acquired principally for the purpose of
selling or repurchasing in the near term or upon initial recognition, it is designated by the management as FVPL. Financial assets or liabilities at FVPL are designated by management on initial recognition when the following criteria are met:
• The designation eliminates or signifi cantly reduces the inconsistent treatment that would otherwise arise from measuring the assets or liabilities or recognizing gains or losses on them on a different basis;
• The assets and liabilities are part of a group of fi nancial assets, fi nancial liabilities or both which are managed and their performance evaluated on a fair value basis, in accordance with a documented risk management or investment strategy; or,
• The fi nancial instrument contains an embedded derivative, unless the embedded derivative does not signifi cantly modify the cash fl ows or it is clear, with little or no analysis, that it would not be separately recorded.
Derivatives are also categorized as held at FVPL, except those derivatives designated and considered as effective hedging instruments.
Financial assets and liabilities at FVPL are recorded in the consolidated statement of fi nancial position at fair value. Changes in fair value are accounted for in the consolidated statement of income. Interest earned or incurred is recorded as interest income or expense, respectively. Dividend income is recorded as other income according to the terms of the contract, or when the right of the payment has been established. Classifi ed as fi nancial assets at FVPL are the Company’s investments in marketable equity securities and proprietary membership shares (see Note 5). The Company has no fi nancial liabilities at FVPL as of December 31, 2007, 2006 and 2005.
Loans and Receivables. Loans and receivables are non-derivative fi nancial assets with fi xed or determinable payments and are not quoted in an active market. Such assets are carried at cost or amortized cost, using the effective interest method, in the consolidated statement of fi nancial position. Interest on loans and receivables is included in the “Interest income” account in the consolidated statements of income. The losses arising from impairment of such fi nancial assets are recognized under “Selling and Administrative Expenses” in the consolidated statement of income.
Loans and receivables are included in current assets if maturity is within 12 months from the statement of fi nancial position date. Otherwise, these are classifi ed as noncurrent assets.
Classifi ed as loans and receivables are the Company’s trade and other receivables (see Note 7).
HTM Investments. HTM investments are quoted non-derivative fi nancial assets with fi xed or determinable payments and fi xed maturities for which the Company’s management has the positive intention and ability to hold to maturity. Where the Company sell other than an insignifi cant amount of HTM investments, the entire category would be tainted and reclassifi ed as AFS investments. After initial measurement, these investments are subsequently measured at amortized cost using the effective interest method, less any impairment in value. Amortized cost is calculated by taking into account any discount or premium on acquisition and fees that are an integral part of the effective interest rate. Gains and losses are recognized in the consolidated statement of income when the
HTM investments are de-recognized and impaired. The effects of restatement on foreign currency-denominated HTM investments are recognized in the consolidated statement of income.
Assets under this category are classifi ed as current assets if maturity is within 12 months from the statement of fi nancial position date and as noncurrent assets if maturity date is more than a year.
The Company has no HTM investments as of December 31, 2007, 2006 and 2005.
AFS Investments. AFS investments are those which are designated as such or do not qualify to be classifi ed as fi nancial assets at FVPL, HTM investments or loans and receivables. They are purchased and held indefi nitely, and may be sold in response to liquidity requirements or changes in market conditions. They may include equity investments, money market papers and other debt instruments.
After initial measurement, AFS investments are subsequently measured at fair value. The effective yield component of AFS debt securities, as well as the impact of restatement on foreign currency-denominated AFS debt securities, is reported in the consolidated statement of income. The unrealized gains and losses arising from the fair valuation of AFS investments, net of tax, are excluded from reported earnings and are reported under “Other reserves” account in the statement of changes in equity, until the investment is de-recognized or until the investment is determined to be impaired at which time the cumulative gains or losses previously reported in equity are included in the consolidated statement of income.
Where the Company holds more than one investment in the same security, these are deemed to be disposed on a fi rst-in, fi rst-out basis. Interest earned and dividends earned on holding AFS investments are recognized in “Other income” account in the consolidated statement of income when the right of the payment has been established. The losses arising from impairment of such investments are recognized as impairment losses in the consolidated statement of income.
Classifi ed as AFS investments are Petrogen’s investments in government securities and Ovincor’s Republic of the Philippines nine-year bonds (ROP9 Bonds) (see Note 6).
Derivative Financial Instruments. The Company uses commodity price swaps to protect its margin on petroleum products from potential price volatility of international crude and product prices. It also enters into short-term forward currency contracts to hedge its currency exposure on crude oil importations. In addition, the Company has identifi ed and bifurcated embedded foreign currency derivatives from certain non-fi nancial contracts.
Derivative instruments are initially recognized at fair value on the date in which a derivative transaction is entered into or bifurcated, and are subsequently re-measured at fair value. Derivatives are carried as assets when the fair value is positive and as liabilities when the fair value is negative. The Company has opted not to designate its derivative transactions under hedge accounting. Consequently, gains and losses from changes in fair value of these derivatives are recognized immediately in the consolidated statement of income.
The fair values of freestanding and bifurcated forward currency transactions are calculated by reference to current forward exchange rates for contracts with similar maturity profi les. The fair values of commodity swaps are determined based on quotes obtained from counterparty banks.
Notes to Consolidated Financial Statements(With Comparative Figures For 2006 And 2005)(Amounts In Million Pesos, Except Par Value, Shares And Per Share Amounts, Exchange Rates, And Commodity Volumes)

46 PETRON CORPORATION • Sustaining Momentum PETRON CORPORATION • Annual Report 2007 47
Cash and Cash EquivalentsCash includes cash on hand and in banks. Cash equivalents are short-term, highly liquid investments that are readily convertible to known amounts of cash with original maturities of three months or less from dates of acquisition and are subject to an insignifi cant risk of change in value.
Interest-Bearing Loans and BorrowingsAll loans and borrowings are initially recognized at the fair value of the consideration received less directly attributable transaction costs.
After initial recognition, interest-bearing loans and borrowings are subsequently measured at amortized cost using the effective interest method. Amortized cost is calculated by taking into account any related issue costs, discount or premium.
Impairment of Financial AssetsThe Company assesses at each statement of fi nancial position date whether a fi nancial asset or a group of fi nancial assets is impaired.
Loans and Receivables. If there is objective evidence that an impairment loss on loans and receivables carried at amortized cost has been incurred, the amount of the loss is measured as the difference between the asset’s carrying amount and the present value of estimated future cash fl ows (excluding future credit losses that have not been incurred) discounted at the fi nancial asset’s original effective interest rate (i.e., the effective interest rate computed at initial recognition). The carrying amount of the asset is reduced either directly or through the use of an allowance account. The amount of the loss is recognized in the consolidated statement of income.
The Company fi rst assesses whether objective evidence of impairment exists individually for fi nancial assets that are individually signifi cant, and individually or collectively for fi nancial assets that are not individually signifi cant. If it is determined that no objective evidence of impairment exists for an individually assessed fi nancial asset, whether signifi cant or not, the asset is included in a group of fi nancial assets with similar credit risk characteristics and that group of fi nancial assets is collectively assessed for impairment. Assets that are individually assessed for impairment and for which an impairment loss is or continues to be recognized are not included in a collective assessment of impairment.
If, in a subsequent period, the amount of the impairment loss decreases and the decrease can be related objectively to an event occurring after the impairment was recognized, the previously recognized impairment loss is reversed. Any subsequent reversal of an impairment loss is recognized in the consolidated statement of income, to the extent that the carrying value of the asset does not exceed its amortized cost at the reversal date.
AFS Investments. If an AFS asset is impaired, an amount comprising the difference between its cost (net of any principal payment and amortization) and its current fair value, less any impairment loss previously recognized in the consolidated statement of income, is transferred from equity to the consolidated statement of income. Reversals in respect of equity instruments classifi ed as AFS investments are not recognized in the consolidated statement of income. Reversals of impairment losses on debt instruments are reversed through the consolidated statement of income; if the increase in fair value of the instrument can be objectively related to an event occurring after the impairment loss was recognized in the consolidated statement of income.
De-recognition of Financial Assets and Liabilities
Financial Assets. A fi nancial asset (or, where applicable a part of a fi nancial asset or part of a group of similar fi nancial assets) is de-recognized when:
• The rights to receive cash fl ows from the asset have expired;
• The Company retains the right to receive cash fl ows from the asset, but has assumed an obligation to pay them in full without material delay to a third party under a “pass-through” arrangement; or,
• The Company has transferred its rights to receive cash fl ows from the asset and either (a) has transferred substantially all the risks and rewards of the assets, or (b) has neither transferred nor retained substantially all the risks and rewards of the assets, but has transferred control of the assets.
Where the Company has transferred its rights to receive cash fl ows from an asset or has entered into a pass-through arrangement, and has neither transferred nor retained substantially all the risks and rewards of the asset nor transferred control of the asset, the asset is recognized to the extent of the Company’s continuing involvement in the asset. Continuing involvement that takes the form of a guarantee over the transferred asset is measured at the lower of original carrying amount of the asset and the maximum amount of consideration that the Company could be required to repay.
Financial Liabilities. A fi nancial liability is de-recognized when the obligation under the liability is discharged, cancelled or has expired. Where an existing fi nancial liability is replaced by another from the same lender on substantially different terms, or the terms of an existing liability are substantially modifi ed, such an exchange or modifi cation is treated as a de-recognition of the original liability and the recognition of a new liability, and the difference in the respective carrying amounts is recognized in the consolidated statement of income.
Offsetting Financial InstrumentsFinancial assets and liabilities are offset and the net amount reported in the consolidated statement of fi nancial position if, and only if, there is a currently enforceable legal right to offset the recognized amounts and there is an intention to settle on a net basis, or to realize the asset and settle the liability simultaneously.
InventoriesInventories are carried at the lower of cost and net realizable value. For petroleum products, crude oil, and tires, batteries and accessories (TBA), the net realizable value is the estimated selling price in the ordinary course of business, less the estimated costs of completion and/or marketing and distribution. For materials and supplies, net realizable value is the current replacement cost.
For fi nancial reporting purposes, Petron uses the fi rst-in, fi rst-out method in costing petroleum products (except lubes and greases, waxes and solvents), crude oil, and other products. Cost is determined using the moving-average method in costing lubes and greases, waxes and solvents, TBA, materials and supplies inventories. For income tax reporting purposes, cost of all inventories is determined using the moving-average method.
For fi nancial reporting purposes, duties and taxes related to the acquisition of inventories are capitalized as part of inventory cost.
For income tax reporting purposes, such duties and taxes are treated as deductible expenses in the year these charges are incurred.
Interest in a Joint VentureThe Company’s 33.33% joint venture interest in Pandacan Depot Services Inc. (PDSI), included under “Other noncurrent assets” account in the consolidated statement of fi nancial position, incorporated on September 29, 2004 under the laws of the Republic of the Philippines, is accounted for under equity method of accounting. The interest in joint venture is carried in the consolidated statement of fi nancial position at cost plus post-acquisition changes in the Company’s share of net assets of the joint venture, less any impairment in value. The consolidated statement of income refl ects the Company’s share in the results of operations of the joint venture (see Note 21).
Results of operations as well as fi nancial position balances of PDSI were less than 1% of the consolidated values and as such were no longer separately disclosed.
Property, Plant and EquipmentProperty, plant and equipment, except land, are stated at cost less accumulated depreciation, amortization and any impairment in value. Land owned by NVRC is stated at cost less any impairment in value.
The initial cost of property, plant and equipment comprises its purchase price, including import duties and taxes, and any directly attributable costs of bringing the assets to their working condition and location for their intended use. Cost also includes any related asset retirement obligation and interest incurred during the construction period on funds borrowed to fi nance the construction of the projects. Expenditures incurred after the property, plant and equipment have been put into operation, such as repairs and maintenance, are normally charged to income in the year the costs are incurred. In situations where it can be clearly demonstrated that the expenditures have resulted in an increase in the future economic benefi ts expected to be obtained from the use of an item of property, plant and equipment beyond its originally assessed standard of performance, the expenditures are capitalized as additional costs of property, plant and equipment. When assets are retired or otherwise disposed of, the cost and the related accumulated depreciation, amortization and impairment loss, if any, are removed from the accounts and any resulting gain or loss is credited or charged to current operations.
When each major inspection is performed, its cost is recognized in the carrying amount of the property, plant and equipment as a replacement if the recognition criteria are satisfi ed.
For fi nancial reporting purposes, duties and taxes related to the acquisition of property, plant and equipment are capitalized. For income tax reporting purposes, such duties and taxes are treated as deductible expenses in the year these charges are incurred.
For fi nancial reporting purposes, depreciation and amortization are computed using the straight-line method over the estimated useful lives of the following assets:
Buildings and related facilities 20 - 25 Years Refi nery and plant equipment 10 - 16 Years Service stations and other equipment 4 - 10 Years Computers, offi ce and motor equipment 2 - 6 Years Leasehold improvements 10 years or the term of the lease, whichever is shorter
The useful lives and depreciation and amortization method are reviewed periodically to ensure that the periods and method of depreciation and amortization are consistent with the expected pattern of economic benefi ts from the items of property, plant and equipment. The residual value, if any, is also reviewed and adjusted if appropriate, at each statement of fi nancial position date.
For income tax reporting purposes, depreciation and amortization are computed using the double-declining balance method.
Construction in-progress represents plant and properties under construction and is stated at cost. This includes cost of construction, plant and equipment, interest and other direct costs. Construction in-progress is not depreciated until such time as the relevant assets are completed and available for operational use.
An asset’s carrying amount is written down immediately to its recoverable amount if the asset’s carrying amount is greater than its estimated recoverable amount.
An item of property, plant and equipment is de-recognized upon disposal or when no future economic benefi ts are expected to arise from the continued use of the asset. Any gain or loss arising from de-recognition of the asset (calculated as the difference between the net disposal proceeds and carrying amount of the item) is included in the statement of income in the year the item is de-recognized.
Investment PropertiesInvestment properties, except land, are stated at cost less accumulated depreciation and any impairment in value. Cost includes transaction costs. The carrying amount includes the cost of replacing part of an existing investment property at the time that cost is incurred if the recognition criteria are met and excludes the costs of day-to-day servicing of an investment property. Land is carried at cost less any impairment in value.
Transfers are made to investment property when, and only when, there is a change in use, evidenced by the end of owner-occupation, commencement of an operating lease to another party, completion of construction or development or commencement of development with a view to sale. These transfers are recorded using the carrying amount in use of the investment property at the date of the change.
Investment properties are de-recognized when either they have been disposed of or when the investment property is permanently withdrawn from use and no future economic benefi t is expected from its disposal. Any gains or losses on the retirement or disposal of an investment property are recognized in the consolidated statement of income in the year of retirement or disposal.
For fi nancial reporting purposes, depreciation of offi ce units is computed on a straight-line basis over the estimated useful lives of the assets of 20 years. For income tax reporting purposes, depreciation is computed using the double-declining balance method.
Intangible AssetsFranchise fees (included under “Other noncurrent assets” account in the statement of fi nancial position) are stated at cost less accumulated amortization and any impairment in value. These are being amortized on a straight-line basis over 5 to 10 years upon commencement of commercial operations.
Notes to Consolidated Financial Statements(With Comparative Figures For 2006 And 2005)(Amounts In Million Pesos, Except Par Value, Shares And Per Share Amounts, Exchange Rates, And Commodity Volumes)
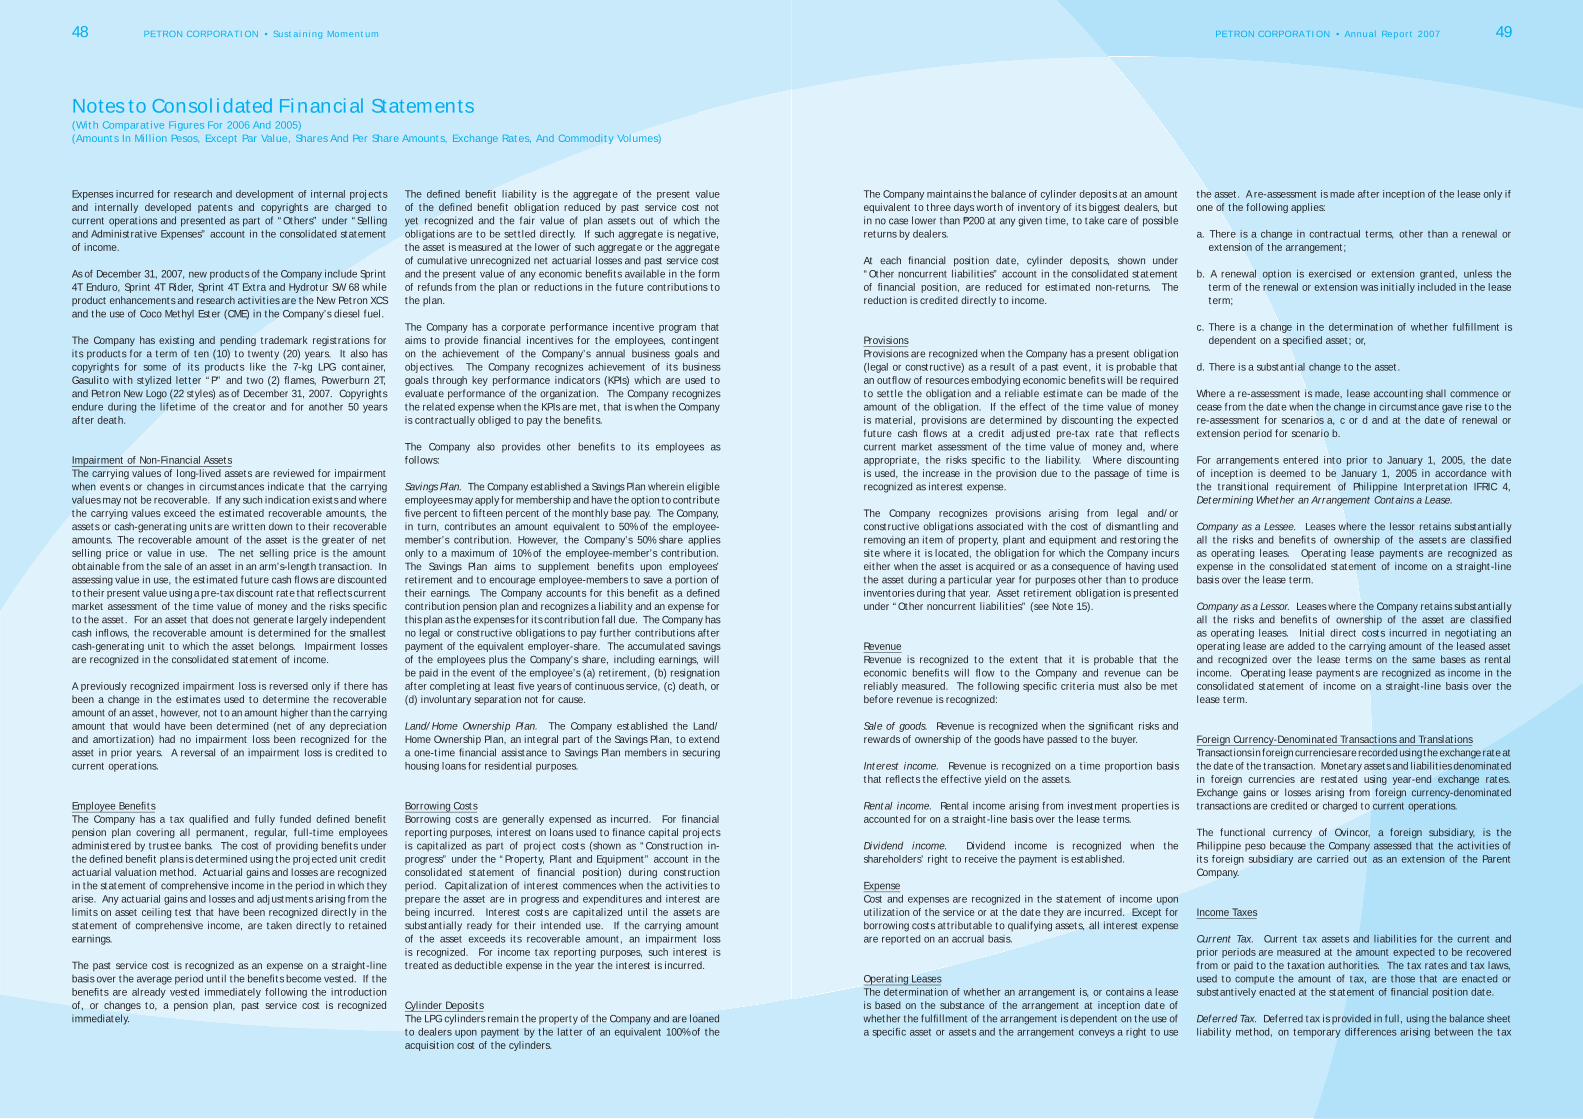
48 PETRON CORPORATION • Sustaining Momentum PETRON CORPORATION • Annual Report 2007 49
Expenses incurred for research and development of internal projects and internally developed patents and copyrights are charged to current operations and presented as part of “Others” under “Selling and Administrative Expenses” account in the consolidated statement of income.
As of December 31, 2007, new products of the Company include Sprint 4T Enduro, Sprint 4T Rider, Sprint 4T Extra and Hydrotur SW 68 while product enhancements and research activities are the New Petron XCS and the use of Coco Methyl Ester (CME) in the Company’s diesel fuel.
The Company has existing and pending trademark registrations for its products for a term of ten (10) to twenty (20) years. It also has copyrights for some of its products like the 7-kg LPG container, Gasulito with stylized letter “P” and two (2) fl ames, Powerburn 2T, and Petron New Logo (22 styles) as of December 31, 2007. Copyrights endure during the lifetime of the creator and for another 50 years after death.
Impairment of Non-Financial AssetsThe carrying values of long-lived assets are reviewed for impairment when events or changes in circumstances indicate that the carrying values may not be recoverable. If any such indication exists and where the carrying values exceed the estimated recoverable amounts, the assets or cash-generating units are written down to their recoverable amounts. The recoverable amount of the asset is the greater of net selling price or value in use. The net selling price is the amount obtainable from the sale of an asset in an arm’s-length transaction. In assessing value in use, the estimated future cash fl ows are discounted to their present value using a pre-tax discount rate that refl ects current market assessment of the time value of money and the risks specifi c to the asset. For an asset that does not generate largely independent cash infl ows, the recoverable amount is determined for the smallest cash-generating unit to which the asset belongs. Impairment losses are recognized in the consolidated statement of income.
A previously recognized impairment loss is reversed only if there has been a change in the estimates used to determine the recoverable amount of an asset, however, not to an amount higher than the carrying amount that would have been determined (net of any depreciation and amortization) had no impairment loss been recognized for the asset in prior years. A reversal of an impairment loss is credited to current operations.
Employee Benefi tsThe Company has a tax qualifi ed and fully funded defi ned benefi t pension plan covering all permanent, regular, full-time employees administered by trustee banks. The cost of providing benefi ts under the defi ned benefi t plans is determined using the projected unit credit actuarial valuation method. Actuarial gains and losses are recognized in the statement of comprehensive income in the period in which they arise. Any actuarial gains and losses and adjustments arising from the limits on asset ceiling test that have been recognized directly in the statement of comprehensive income, are taken directly to retained earnings.
The past service cost is recognized as an expense on a straight-line basis over the average period until the benefi ts become vested. If the benefi ts are already vested immediately following the introduction of, or changes to, a pension plan, past service cost is recognized immediately.
The defi ned benefi t liability is the aggregate of the present value of the defi ned benefi t obligation reduced by past service cost not yet recognized and the fair value of plan assets out of which the obligations are to be settled directly. If such aggregate is negative, the asset is measured at the lower of such aggregate or the aggregate of cumulative unrecognized net actuarial losses and past service cost and the present value of any economic benefi ts available in the form of refunds from the plan or reductions in the future contributions to the plan.
The Company has a corporate performance incentive program that aims to provide fi nancial incentives for the employees, contingent on the achievement of the Company’s annual business goals and objectives. The Company recognizes achievement of its business goals through key performance indicators (KPIs) which are used to evaluate performance of the organization. The Company recognizes the related expense when the KPIs are met, that is when the Company is contractually obliged to pay the benefi ts.
The Company also provides other benefi ts to its employees as follows:
Savings Plan. The Company established a Savings Plan wherein eligible employees may apply for membership and have the option to contribute fi ve percent to fi fteen percent of the monthly base pay. The Company, in turn, contributes an amount equivalent to 50% of the employee-member’s contribution. However, the Company’s 50% share applies only to a maximum of 10% of the employee-member’s contribution. The Savings Plan aims to supplement benefi ts upon employees’ retirement and to encourage employee-members to save a portion of their earnings. The Company accounts for this benefi t as a defi ned contribution pension plan and recognizes a liability and an expense for this plan as the expenses for its contribution fall due. The Company has no legal or constructive obligations to pay further contributions after payment of the equivalent employer-share. The accumulated savings of the employees plus the Company’s share, including earnings, will be paid in the event of the employee’s (a) retirement, (b) resignation after completing at least fi ve years of continuous service, (c) death, or (d) involuntary separation not for cause.
Land/Home Ownership Plan. The Company established the Land/Home Ownership Plan, an integral part of the Savings Plan, to extend a one-time fi nancial assistance to Savings Plan members in securing housing loans for residential purposes.
Borrowing CostsBorrowing costs are generally expensed as incurred. For fi nancial reporting purposes, interest on loans used to fi nance capital projects is capitalized as part of project costs (shown as “Construction in-progress” under the “Property, Plant and Equipment” account in the consolidated statement of fi nancial position) during construction period. Capitalization of interest commences when the activities to prepare the asset are in progress and expenditures and interest are being incurred. Interest costs are capitalized until the assets are substantially ready for their intended use. If the carrying amount of the asset exceeds its recoverable amount, an impairment loss is recognized. For income tax reporting purposes, such interest is treated as deductible expense in the year the interest is incurred.
Cylinder DepositsThe LPG cylinders remain the property of the Company and are loaned to dealers upon payment by the latter of an equivalent 100% of the acquisition cost of the cylinders.
The Company maintains the balance of cylinder deposits at an amount equivalent to three days worth of inventory of its biggest dealers, but in no case lower than P200 at any given time, to take care of possible returns by dealers.
At each fi nancial position date, cylinder deposits, shown under “Other noncurrent liabilities” account in the consolidated statement of fi nancial position, are reduced for estimated non-returns. The reduction is credited directly to income.
ProvisionsProvisions are recognized when the Company has a present obligation (legal or constructive) as a result of a past event, it is probable that an outfl ow of resources embodying economic benefi ts will be required to settle the obligation and a reliable estimate can be made of the amount of the obligation. If the effect of the time value of money is material, provisions are determined by discounting the expected future cash fl ows at a credit adjusted pre-tax rate that refl ects current market assessment of the time value of money and, where appropriate, the risks specifi c to the liability. Where discounting is used, the increase in the provision due to the passage of time is recognized as interest expense.
The Company recognizes provisions arising from legal and/or constructive obligations associated with the cost of dismantling and removing an item of property, plant and equipment and restoring the site where it is located, the obligation for which the Company incurs either when the asset is acquired or as a consequence of having used the asset during a particular year for purposes other than to produce inventories during that year. Asset retirement obligation is presented under “Other noncurrent liabilities” (see Note 15).
RevenueRevenue is recognized to the extent that it is probable that the economic benefi ts will fl ow to the Company and revenue can be reliably measured. The following specifi c criteria must also be met before revenue is recognized:
Sale of goods. Revenue is recognized when the signifi cant risks and rewards of ownership of the goods have passed to the buyer.
Interest income. Revenue is recognized on a time proportion basis that refl ects the effective yield on the assets.
Rental income. Rental income arising from investment properties is accounted for on a straight-line basis over the lease terms.
Dividend income. Dividend income is recognized when the shareholders’ right to receive the payment is established.
ExpenseCost and expenses are recognized in the statement of income upon utilization of the service or at the date they are incurred. Except for borrowing costs attributable to qualifying assets, all interest expense are reported on an accrual basis.
Operating LeasesThe determination of whether an arrangement is, or contains a lease is based on the substance of the arrangement at inception date of whether the fulfi llment of the arrangement is dependent on the use of a specifi c asset or assets and the arrangement conveys a right to use
the asset. A re-assessment is made after inception of the lease only if one of the following applies:
a. There is a change in contractual terms, other than a renewal or extension of the arrangement;
b. A renewal option is exercised or extension granted, unless the term of the renewal or extension was initially included in the lease term;
c. There is a change in the determination of whether fulfi llment is dependent on a specifi ed asset; or,
d. There is a substantial change to the asset.
Where a re-assessment is made, lease accounting shall commence or cease from the date when the change in circumstance gave rise to the re-assessment for scenarios a, c or d and at the date of renewal or extension period for scenario b.
For arrangements entered into prior to January 1, 2005, the date of inception is deemed to be January 1, 2005 in accordance with the transitional requirement of Philippine Interpretation IFRIC 4, Determining Whether an Arrangement Contains a Lease.
Company as a Lessee. Leases where the lessor retains substantially all the risks and benefi ts of ownership of the assets are classifi ed as operating leases. Operating lease payments are recognized as expense in the consolidated statement of income on a straight-line basis over the lease term.
Company as a Lessor. Leases where the Company retains substantially all the risks and benefi ts of ownership of the asset are classifi ed as operating leases. Initial direct costs incurred in negotiating an operating lease are added to the carrying amount of the leased asset and recognized over the lease terms on the same bases as rental income. Operating lease payments are recognized as income in the consolidated statement of income on a straight-line basis over the lease term.
Foreign Currency-Denominated Transactions and TranslationsTransactions in foreign currencies are recorded using the exchange rate at the date of the transaction. Monetary assets and liabilities denominated in foreign currencies are restated using year-end exchange rates. Exchange gains or losses arising from foreign currency-denominated transactions are credited or charged to current operations.
The functional currency of Ovincor, a foreign subsidiary, is the Philippine peso because the Company assessed that the activities of its foreign subsidiary are carried out as an extension of the Parent Company.
Income Taxes
Current Tax. Current tax assets and liabilities for the current and prior periods are measured at the amount expected to be recovered from or paid to the taxation authorities. The tax rates and tax laws, used to compute the amount of tax, are those that are enacted or substantively enacted at the statement of fi nancial position date.
Deferred Tax. Deferred tax is provided in full, using the balance sheet liability method, on temporary differences arising between the tax
Notes to Consolidated Financial Statements(With Comparative Figures For 2006 And 2005)(Amounts In Million Pesos, Except Par Value, Shares And Per Share Amounts, Exchange Rates, And Commodity Volumes)

50 PETRON CORPORATION • Sustaining Momentum PETRON CORPORATION • Annual Report 2007 51
bases of assets and liabilities and their carrying amounts for fi nancial reporting purposes. Deferred tax liabilities are recognized for all taxable temporary differences except where the deferred tax liability arises from the initial recognition of goodwill or of an asset or liability in a transaction that is not a business combination and, at the time of the transaction, affects neither the accounting profi t nor taxable profi t.
Deferred tax assets are recognized to the extent that it is probable that future taxable profi t will be available against which the temporary differences can be utilized.
The carrying amount of deferred tax assets is reviewed at each statement of fi nancial position date and reduced to the extent that it is no longer probable that suffi cient taxable profi t will be available to allow all or part of the deferred tax asset to be utilized. Unrecognized deferred tax assets are re-assessed at each statement of fi nancial position date and are recognized to the extent that it has become probable that future taxable profi t will allow the deferred tax asset to be recovered.
Tax expense relating to items recognized directly in equity is recognized in equity and not in the consolidated statement of income.
Deferred tax is determined using tax rates (and tax laws) that have been enacted or substantially enacted at the statement of fi nancial position date and are expected to apply when the related deferred tax asset is realized or the deferred tax liability is settled.
Deferred tax assets and liabilities are offset only if a legally enforceable right exists to offset tax assets against tax liabilities and the deferred taxes relate to the same taxable entity and the same taxation authority.
Sales Tax. Revenues, expenses and assets are recognized net of the amount of sales tax except:
• Where the sales tax incurred on a purchase of assets or services is not recoverable from the taxation authority, in which case the sales tax is recognized as part of the cost of acquisition of the asset or as part of the expense item as applicable; and,
• Receivables and payables that are stated with the amount of sales tax included.
The net amount of sales tax recoverable from, or payable to, the taxation authority is included as part of “Receivables” or “Accounts payable and accrued expenses” account in the consolidated statement of fi nancial position.
CapitalCapital stock is determined using the nominal value of shares that have been issued.
Retained earnings, the appropriated portion of which is not available for distribution, include all current and prior period results as disclosed in the consolidated statement of income.
Other reserves comprise gains and losses due to the revaluation of AFS investments, translation adjustment in foreign subsidiary (Ovincor) and actuarial gains and losses in pension plan.
Earnings Per Share Attributable to the Equity Holders of the ParentBasic earnings per share is computed by dividing net income by the weighted average number of outstanding shares after giving retroactive effect to any stock split and stock dividends declared during the year.
The Company has no dilutive potential common shares outstanding that would require disclosure of diluted earnings per share in the consolidated statement of income.
SegmentsThe Company’s operating businesses are recognized and managed separately according to the nature of the products and services provided, with each segment representing a strategic business unit that offers different products and serves different markets.
Financial information on business and geographical segments are presented in Note 33.
ContingenciesContingent liabilities are not recognized in the consolidated fi nancial statements. They are disclosed unless the possibility of an outfl ow of resources embodying economic benefi ts is remote. Contingent assets are not recognized in the consolidated fi nancial statements but are disclosed in the notes to consolidated fi nancial statements when an infl ow of economic benefi ts is probable.
Subsequent EventsAny post-year-end events that provide additional information about the Company’s fi nancial position at the statement of fi nancial position date (adjusting event) is refl ected in the consolidated fi nancial statements. Post-year-end events that are not adjusting events, if any, are disclosed when material in the notes to consolidated fi nancial statements.
3. Signifi cant Accounting Judgments, Estimates and Assumptions
The preparation of the consolidated fi nancial statements in accordance with PFRS requires the Company to make estimates and assumptions that affect the reported amounts of assets, liabilities, income and expenses and disclosure of contingent assets and contingent liabilities. Future events may occur which will cause the assumptions used in arriving at the estimates to change. The effects of any change in estimates are refl ected in the consolidated fi nancial statements as they become reasonably determinable.
Judgments and estimates are continually evaluated and are based on historical experience and other factors, including expectations of future events that are believed to be reasonable under the circumstances.
JudgmentsIn the process of applying the Company’s accounting policies, management has made the following judgments, apart from those involving estimations, which have the most signifi cant effect on the amounts recognized in the consolidated fi nancial statements:
Operating Lease Commitments - Company as Lessor/Lessee. The Company has entered into commercial property leases on its investment property portfolio. The Company has determined that it retains all the signifi cant risks and rewards of ownership of the properties leased out on operating leases while the signifi cant risks and rewards for properties leased from third parties are retained by the lessors.
Total rent income amounted to P325, P345 and P280 in 2007, 2006 and 2005, respectively (see Note 21); while rent expense amounted to P395, P381 and P306 in 2007, 2006 and 2005, respectively (see Note 18).
Fair Value of Financial Instruments. Where the fair values of fi nancial assets and liabilities recorded in the consolidated statement of fi nancial position cannot be derived from active markets, they are determined using a variety of valuation techniques that include the use of mathematical models. The input to these models is taken from observable markets where possible, but where this is not feasible, a degree of judgment is required in establishing fair values. The Company uses judgments to select from variety of valuation models and make assumptions regarding considerations of liquidity and model inputs such as correlation and volatility for longer dated fi nancial instruments.
The aggregate fair value of the fi nancial assets at FVPL and AFS investments amounted to P861, P812 and P702 as of December 31, 2007, 2006 and 2005, respectively (see Notes 5 and 6).
Distinction between Property, Plant and Equipment and Investment Property. The Company determines whether a property qualifi es as investment property. In making its judgment, the Company considers whether the property generates cash fl ows largely independent of the other assets held by an entity. Owner-occupied properties generate cash fl ows that are attributable not only to the property but also to other assets used in the production or supply process.
Some properties comprise a portion that is held to earn rental or for capital appreciation and another portion that is held for use in the production and supply of goods and services or for administrative purposes. If these portions can be sold separately (or leased out separately under fi nance lease), the Company accounts for the portions separately. If the portion cannot be sold separately, the property is accounted for as investment property only if an insignifi cant portion is held for use in the production or supply of goods or services or for administrative purposes. Judgment is applied in determining whether ancillary services are so signifi cant that a property does not qualify as investment property. The Company considers each property separately in making its judgment.
Estimations and AssumptionsThe key assumptions concerning the future and other key sources of estimation uncertainty at the statement of fi nancial position date, that have a signifi cant risk of causing material adjustments to the carrying amounts of assets and liabilities within the next fi nancial year are discussed below.
Allowance for Impairment of Trade and Other Receivables. Allowance for impairment is maintained at a level considered adequate to provide for potentially uncollectible receivables. The level of allowance is based on past collection experience and other factors that may affect collectibility. An evaluation of receivables, designed to identify potential changes to allowance, is performed regularly throughout
the year. Specifi cally, in coordination with the Marketing Division, the Finance Division ascertains customers who are unable to meet their fi nancial obligations. In these cases, Management uses sound judgment based on the best available facts and circumstances, included but not limited to, the length of relationship with the customers and their payment track record. The amount of impairment loss differ for each year based on available objective evidence for which the Company may consider that it will not be able to collect some of its accounts. Impaired accounts receivable are written off when identifi ed to be worthless after exhausting all collection efforts. An increase in allowance for impairment of trade and other receivables would increase the Company’s recorded selling and administrative expenses and decrease current assets.
Impairment losses on trade and other receivables amounted to P50 and P106 in 2007 and 2005, respectively (see Note 18). Receivables written off amounted to P3 and P4 in 2007 and 2006, respectively (see Note 7). There was no allowance required to be provided in 2006 based on management’s evaluation. Receivables, net of allowance for impairment loss, amounted to P17,869, P15,629 and P11,863 as of December 31, 2007, 2006 and 2005, respectively (see Note 7).
Allowance for Inventory Obsolescence. The allowance for inventory obsolescence consists of collective and specifi c valuation allowance. A collective valuation allowance is established as a certain percentage based on the age and movement of stocks. In case there is write-off or disposal of slow-moving items during the year, a reduction in the allowance for inventory obsolescence is made. Review of allowance is done every quarter, while a revised set-up or booking is posted at the end of the year based on evaluations or recommendations of the proponents. The amount and timing of recorded expenses for any year would therefore differ based on the judgments or estimates made.
Reduction in the allowance for inventory obsolescence amounted to P40 and P93 in 2007 and 2006, respectively, while addition to the allowance for obsolescence account in 2005 amounted to P165 (see Note 8). Inventories, net of allowance for obsolescence, amounted to P30,271, P26,289 and P27,018 as of December 31, 2007, 2006 and 2005, respectively (see Note 8).
Useful Lives. The useful life of each of the Company’s item of property, plant and equipment and investment properties is estimated based on the period over which the asset is expected to be available for use. Such estimation is based on a collective assessment of practices of similar businesses, internal technical evaluation and experience with similar assets. The estimated useful life of each asset is reviewed periodically and updated if expectations differ from previous estimates due to physical wear and tear, technical or commercial obsolescence and legal or other limits on the use of the asset. It is possible, however, that future results of operations could be materially affected by changes in the amounts and timing of recorded expenses brought about by changes in the factors mentioned above. A reduction in the estimated useful life of any item of property, plant and equipment and investment properties would increase the recorded cost of goods sold, selling and administrative expenses, and decrease noncurrent assets.
There is no change in estimated useful lives of property, plant and equipment and investment properties during the year. Property, plant and equipment and investment properties, net of accumulated depreciation and amortization as of December 31, 2007, 2006 and 2005, amounted to P34,330, P25,375 and P22,805, respectively (see Notes 9 and 10).
Notes to Consolidated Financial Statements(With Comparative Figures For 2006 And 2005)(Amounts In Million Pesos, Except Par Value, Shares And Per Share Amounts, Exchange Rates, And Commodity Volumes)
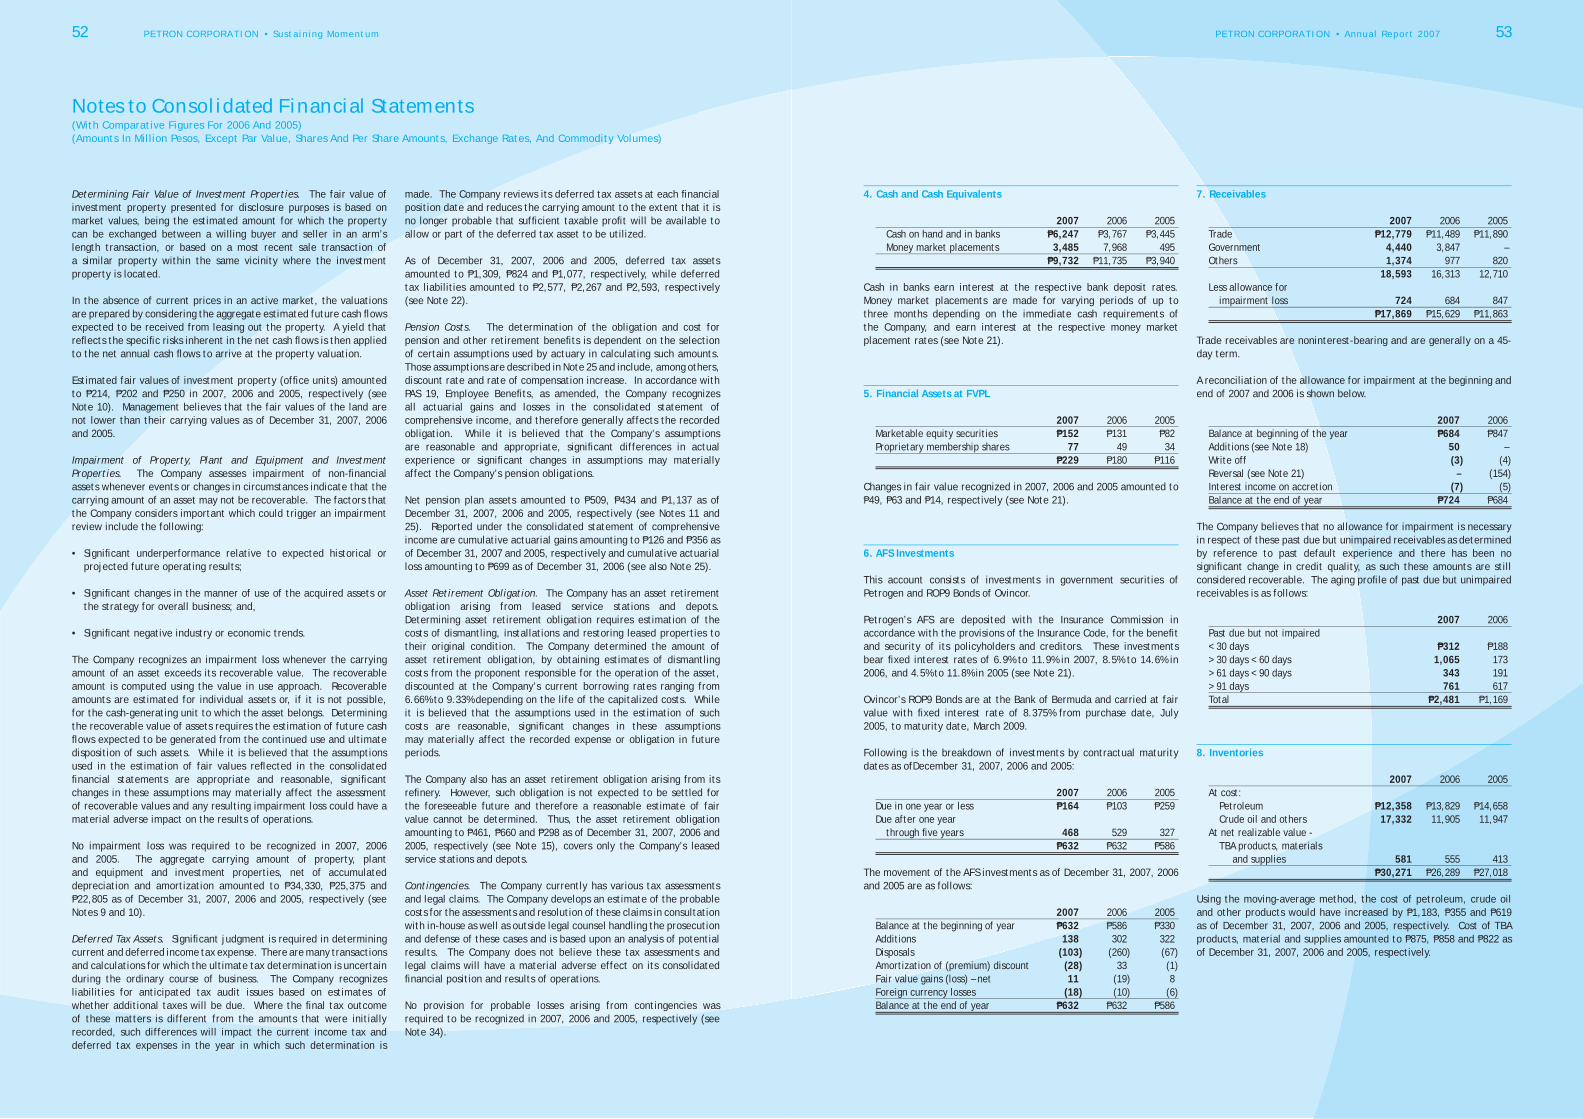
52 PETRON CORPORATION • Sustaining Momentum PETRON CORPORATION • Annual Report 2007 53
Determining Fair Value of Investment Properties. The fair value of investment property presented for disclosure purposes is based on market values, being the estimated amount for which the property can be exchanged between a willing buyer and seller in an arm’s length transaction, or based on a most recent sale transaction of a similar property within the same vicinity where the investment property is located.
In the absence of current prices in an active market, the valuations are prepared by considering the aggregate estimated future cash fl ows expected to be received from leasing out the property. A yield that refl ects the specifi c risks inherent in the net cash fl ows is then applied to the net annual cash fl ows to arrive at the property valuation.
Estimated fair values of investment property (offi ce units) amounted to P214, P202 and P250 in 2007, 2006 and 2005, respectively (see Note 10). Management believes that the fair values of the land are not lower than their carrying values as of December 31, 2007, 2006 and 2005.
Impairment of Property, Plant and Equipment and Investment Properties. The Company assesses impairment of non-fi nancial assets whenever events or changes in circumstances indicate that the carrying amount of an asset may not be recoverable. The factors that the Company considers important which could trigger an impairment review include the following:
• Signifi cant underperformance relative to expected historical or projected future operating results;
• Signifi cant changes in the manner of use of the acquired assets or the strategy for overall business; and,
• Signifi cant negative industry or economic trends.
The Company recognizes an impairment loss whenever the carrying amount of an asset exceeds its recoverable value. The recoverable amount is computed using the value in use approach. Recoverable amounts are estimated for individual assets or, if it is not possible, for the cash-generating unit to which the asset belongs. Determining the recoverable value of assets requires the estimation of future cash fl ows expected to be generated from the continued use and ultimate disposition of such assets. While it is believed that the assumptions used in the estimation of fair values refl ected in the consolidated fi nancial statements are appropriate and reasonable, signifi cant changes in these assumptions may materially affect the assessment of recoverable values and any resulting impairment loss could have a material adverse impact on the results of operations.
No impairment loss was required to be recognized in 2007, 2006 and 2005. The aggregate carrying amount of property, plant and equipment and investment properties, net of accumulated depreciation and amortization amounted to P34,330, P25,375 and P22,805 as of December 31, 2007, 2006 and 2005, respectively (see Notes 9 and 10).
Deferred Tax Assets. Signifi cant judgment is required in determining current and deferred income tax expense. There are many transactions and calculations for which the ultimate tax determination is uncertain during the ordinary course of business. The Company recognizes liabilities for anticipated tax audit issues based on estimates of whether additional taxes will be due. Where the fi nal tax outcome of these matters is different from the amounts that were initially recorded, such differences will impact the current income tax and deferred tax expenses in the year in which such determination is
made. The Company reviews its deferred tax assets at each fi nancial position date and reduces the carrying amount to the extent that it is no longer probable that suffi cient taxable profi t will be available to allow or part of the deferred tax asset to be utilized.
As of December 31, 2007, 2006 and 2005, deferred tax assets amounted to P1,309, P824 and P1,077, respectively, while deferred tax liabilities amounted to P2,577, P2,267 and P2,593, respectively (see Note 22).
Pension Costs. The determination of the obligation and cost for pension and other retirement benefi ts is dependent on the selection of certain assumptions used by actuary in calculating such amounts. Those assumptions are described in Note 25 and include, among others, discount rate and rate of compensation increase. In accordance with PAS 19, Employee Benefi ts, as amended, the Company recognizes all actuarial gains and losses in the consolidated statement of comprehensive income, and therefore generally affects the recorded obligation. While it is believed that the Company’s assumptions are reasonable and appropriate, signifi cant differences in actual experience or signifi cant changes in assumptions may materially affect the Company’s pension obligations.
Net pension plan assets amounted to P509, P434 and P1,137 as of December 31, 2007, 2006 and 2005, respectively (see Notes 11 and 25). Reported under the consolidated statement of comprehensive income are cumulative actuarial gains amounting to P126 and P356 as of December 31, 2007 and 2005, respectively and cumulative actuarial loss amounting to P699 as of December 31, 2006 (see also Note 25).
Asset Retirement Obligation. The Company has an asset retirement obligation arising from leased service stations and depots. Determining asset retirement obligation requires estimation of the costs of dismantling, installations and restoring leased properties to their original condition. The Company determined the amount of asset retirement obligation, by obtaining estimates of dismantling costs from the proponent responsible for the operation of the asset, discounted at the Company’s current borrowing rates ranging from 6.66% to 9.33% depending on the life of the capitalized costs. While it is believed that the assumptions used in the estimation of such costs are reasonable, signifi cant changes in these assumptions may materially affect the recorded expense or obligation in future periods.
The Company also has an asset retirement obligation arising from its refi nery. However, such obligation is not expected to be settled for the foreseeable future and therefore a reasonable estimate of fair value cannot be determined. Thus, the asset retirement obligation amounting to P461, P660 and P298 as of December 31, 2007, 2006 and 2005, respectively (see Note 15), covers only the Company’s leased service stations and depots.
Contingencies. The Company currently has various tax assessments and legal claims. The Company develops an estimate of the probable costs for the assessments and resolution of these claims in consultation with in-house as well as outside legal counsel handling the prosecution and defense of these cases and is based upon an analysis of potential results. The Company does not believe these tax assessments and legal claims will have a material adverse effect on its consolidated fi nancial position and results of operations.
No provision for probable losses arising from contingencies was required to be recognized in 2007, 2006 and 2005, respectively (see Note 34).
4. Cash and Cash Equivalents
2007 2006 2005 Cash on hand and in banks P6,247 P3,767 P3,445 Money market placements 3,485 7,968 495 P9,732 P11,735 P3,940
Cash in banks earn interest at the respective bank deposit rates. Money market placements are made for varying periods of up to three months depending on the immediate cash requirements of the Company, and earn interest at the respective money market placement rates (see Note 21).
5. Financial Assets at FVPL
2007 2006 2005 Marketable equity securities P152 P131 P82 Proprietary membership shares 77 49 34 P229 P180 P116
Changes in fair value recognized in 2007, 2006 and 2005 amounted to P49, P63 and P14, respectively (see Note 21).
6. AFS Investments
This account consists of investments in government securities of Petrogen and ROP9 Bonds of Ovincor.
Petrogen’s AFS are deposited with the Insurance Commission in accordance with the provisions of the Insurance Code, for the benefi t and security of its policyholders and creditors. These investments bear fi xed interest rates of 6.9% to 11.9% in 2007, 8.5% to 14.6% in 2006, and 4.5% to 11.8% in 2005 (see Note 21).
Ovincor’s ROP9 Bonds are at the Bank of Bermuda and carried at fair value with fi xed interest rate of 8.375% from purchase date, July 2005, to maturity date, March 2009.
Following is the breakdown of investments by contractual maturity dates as ofDecember 31, 2007, 2006 and 2005:
2007 2006 2005 Due in one year or less P164 P103 P259 Due after one year through fi ve years 468 529 327 P632 P632 P586
The movement of the AFS investments as of December 31, 2007, 2006 and 2005 are as follows:
2007 2006 2005 Balance at the beginning of year P632 P586 P330 Additions 138 302 322 Disposals (103 ) (260 ) (67 ) Amortization of (premium) discount (28 ) 33 (1 ) Fair value gains (loss) – net 11 (19 ) 8 Foreign currency losses (18 ) (10 ) (6 ) Balance at the end of year P632 P632 P586
7. Receivables
2007 2006 2005 Trade P12,779 P11,489 P11,890 Government 4,440 3,847 – Others 1,374 977 820 18,593 16,313 12,710 Less allowance for impairment loss 724 684 847 P17,869 P15,629 P11,863
Trade receivables are noninterest-bearing and are generally on a 45-day term.
A reconciliation of the allowance for impairment at the beginning and end of 2007 and 2006 is shown below.
2007 2006 Balance at beginning of the year P684 P847 Additions (see Note 18) 50 – Write off (3 ) (4 ) Reversal (see Note 21) – (154 ) Interest income on accretion (7 ) (5 ) Balance at the end of year P724 P684
The Company believes that no allowance for impairment is necessary in respect of these past due but unimpaired receivables as determined by reference to past default experience and there has been no signifi cant change in credit quality, as such these amounts are still considered recoverable. The aging profi le of past due but unimpaired receivables is as follows:
2007 2006 Past due but not impaired < 30 days P312 P188 > 30 days < 60 days 1,065 173 > 61 days < 90 days 343 191 > 91 days 761 617 Total P2,481 P1,169
8. Inventories
2007 2006 2005 At cost: Petroleum P12,358 P13,829 P14,658 Crude oil and others 17,332 11,905 11,947 At net realizable value - TBA products, materials and supplies 581 555 413 P30,271 P26,289 P27,018
Using the moving-average method, the cost of petroleum, crude oil and other products would have increased by P1,183, P355 and P619 as of December 31, 2007, 2006 and 2005, respectively. Cost of TBA products, material and supplies amounted to P875, P858 and P822 as of December 31, 2007, 2006 and 2005, respectively.
Notes to Consolidated Financial Statements(With Comparative Figures For 2006 And 2005)(Amounts In Million Pesos, Except Par Value, Shares And Per Share Amounts, Exchange Rates, And Commodity Volumes)
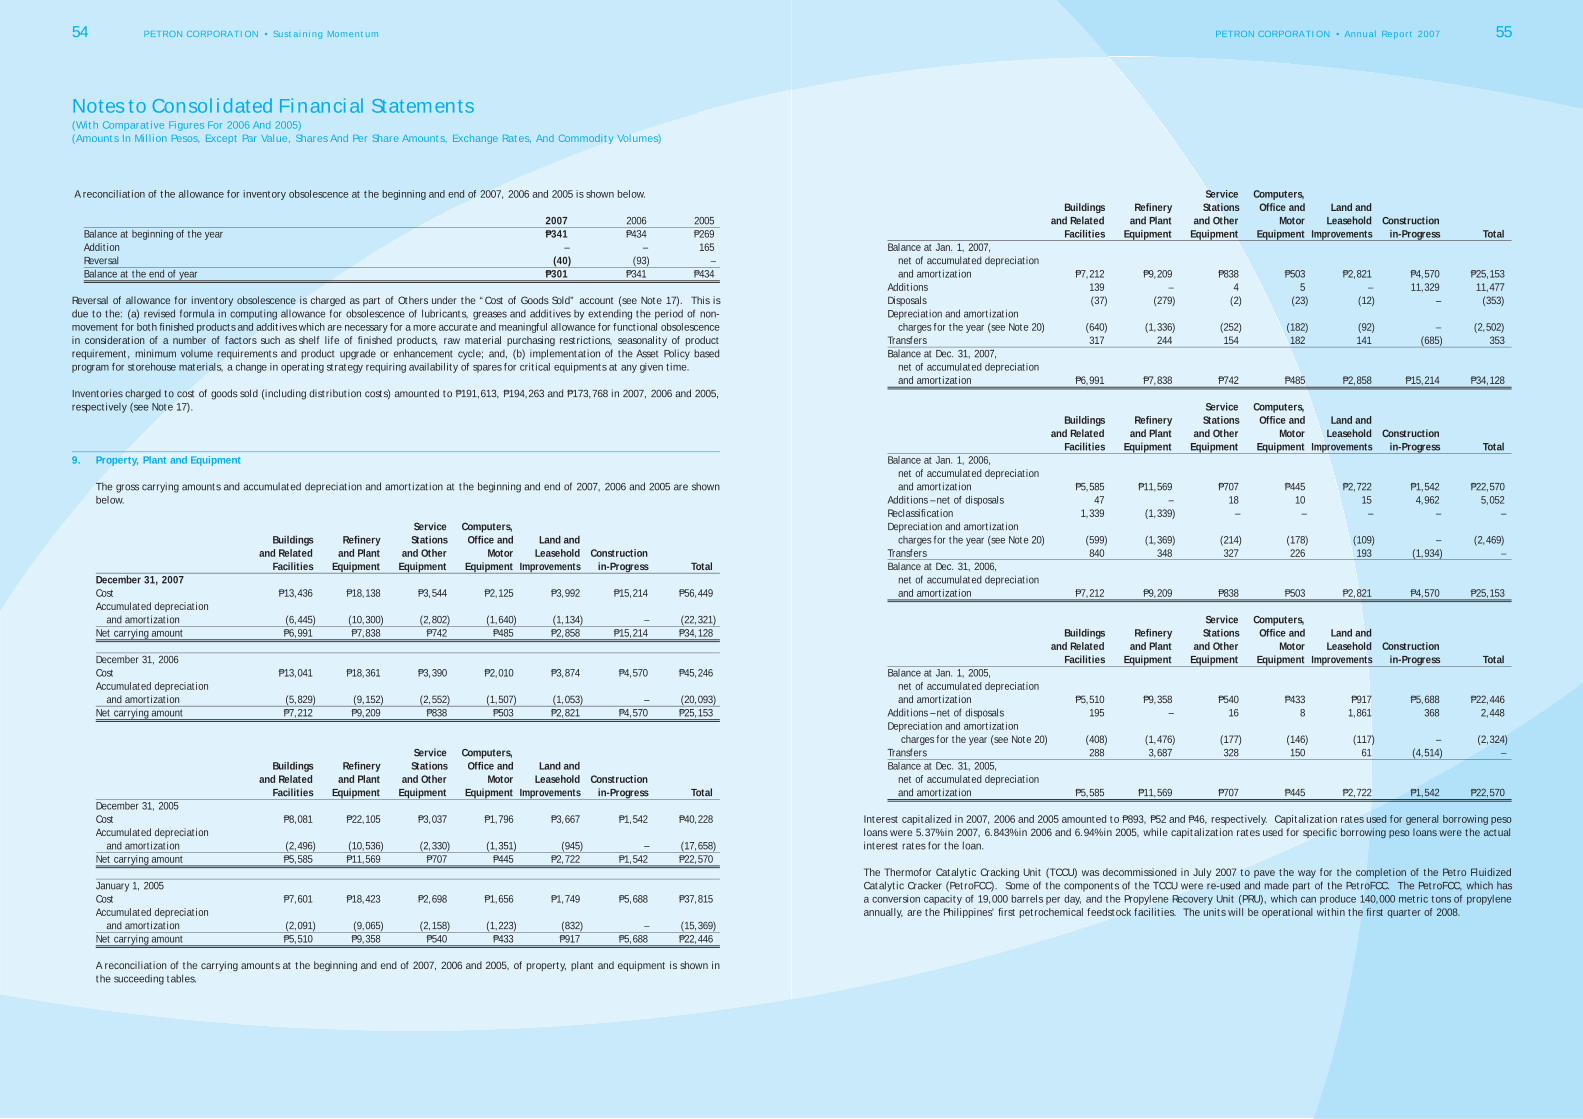
54 PETRON CORPORATION • Sustaining Momentum PETRON CORPORATION • Annual Report 2007 55
A reconciliation of the allowance for inventory obsolescence at the beginning and end of 2007, 2006 and 2005 is shown below.
2007 2006 2005 Balance at beginning of the year P341 P434 P269 Addition – – 165 Reversal (40 ) (93 ) – Balance at the end of year P301 P341 P434
Reversal of allowance for inventory obsolescence is charged as part of Others under the “Cost of Goods Sold” account (see Note 17). This is due to the: (a) revised formula in computing allowance for obsolescence of lubricants, greases and additives by extending the period of non-movement for both fi nished products and additives which are necessary for a more accurate and meaningful allowance for functional obsolescence in consideration of a number of factors such as shelf life of fi nished products, raw material purchasing restrictions, seasonality of product requirement, minimum volume requirements and product upgrade or enhancement cycle; and, (b) implementation of the Asset Policy based program for storehouse materials, a change in operating strategy requiring availability of spares for critical equipments at any given time.
Inventories charged to cost of goods sold (including distribution costs) amounted to P191,613, P194,263 and P173,768 in 2007, 2006 and 2005, respectively (see Note 17).
9. Property, Plant and Equipment
The gross carrying amounts and accumulated depreciation and amortization at the beginning and end of 2007, 2006 and 2005 are shown below.
Service Computers, Buildings Refi nery Stations Offi ce and Land and and Related and Plant and Other Motor Leasehold Construction Facilities Equipment Equipment Equipment Improvements in-Progress TotalDecember 31, 2007 Cost P13,436 P18,138 P3,544 P2,125 P3,992 P15,214 P56,449Accumulated depreciation and amortization (6,445 ) (10,300 ) (2,802 ) (1,640 ) (1,134 ) – (22,321 )Net carrying amount P6,991 P7,838 P742 P485 P2,858 P15,214 P34,128 December 31, 2006 Cost P13,041 P18,361 P3,390 P2,010 P3,874 P4,570 P45,246Accumulated depreciation and amortization (5,829 ) (9,152 ) (2,552 ) (1,507 ) (1,053 ) – (20,093 )Net carrying amount P7,212 P9,209 P838 P503 P2,821 P4,570 P25,153
Service Computers, Buildings Refi nery Stations Offi ce and Land and and Related and Plant and Other Motor Leasehold Construction Facilities Equipment Equipment Equipment Improvements in-Progress TotalDecember 31, 2005 Cost P8,081 P22,105 P3,037 P1,796 P3,667 P1,542 P40,228Accumulated depreciation and amortization (2,496 ) (10,536 ) (2,330 ) (1,351 ) (945 ) – (17,658 )Net carrying amount P5,585 P11,569 P707 P445 P2,722 P1,542 P22,570 January 1, 2005 Cost P7,601 P18,423 P2,698 P1,656 P1,749 P5,688 P37,815Accumulated depreciation and amortization (2,091 ) (9,065 ) (2,158 ) (1,223 ) (832 ) – (15,369 )Net carrying amount P5,510 P9,358 P540 P433 P917 P5,688 P22,446
A reconciliation of the carrying amounts at the beginning and end of 2007, 2006 and 2005, of property, plant and equipment is shown in the succeeding tables.
Service Computers, Buildings Refi nery Stations Offi ce and Land and and Related and Plant and Other Motor Leasehold Construction Facilities Equipment Equipment Equipment Improvements in-Progress TotalBalance at Jan. 1, 2007, net of accumulated depreciation and amortization P7,212 P9,209 P838 P503 P2,821 P4,570 P25,153Additions 139 – 4 5 – 11,329 11,477Disposals (37 ) (279 ) (2 ) (23 ) (12 ) – (353)Depreciation and amortization charges for the year (see Note 20) (640 ) (1,336 ) (252 ) (182 ) (92 ) – (2,502)Transfers 317 244 154 182 141 (685 ) 353Balance at Dec. 31, 2007, net of accumulated depreciation and amortization P6,991 P7,838 P742 P485 P2,858 P15,214 P34,128
Service Computers, Buildings Refi nery Stations Offi ce and Land and and Related and Plant and Other Motor Leasehold Construction Facilities Equipment Equipment Equipment Improvements in-Progress TotalBalance at Jan. 1, 2006, net of accumulated depreciation and amortization P5,585 P11,569 P707 P445 P2,722 P1,542 P22,570Additions – net of disposals 47 – 18 10 15 4,962 5,052Reclassifi cation 1,339 (1,339 ) – – – – –Depreciation and amortization charges for the year (see Note 20) (599 ) (1,369 ) (214 ) (178 ) (109 ) – (2,469)Transfers 840 348 327 226 193 (1,934 ) –Balance at Dec. 31, 2006, net of accumulated depreciation and amortization P7,212 P9,209 P838 P503 P2,821 P4,570 P25,153 Service Computers, Buildings Refi nery Stations Offi ce and Land and and Related and Plant and Other Motor Leasehold Construction Facilities Equipment Equipment Equipment Improvements in-Progress TotalBalance at Jan. 1, 2005, net of accumulated depreciation and amortization P5,510 P9,358 P540 P433 P917 P5,688 P22,446Additions – net of disposals 195 – 16 8 1,861 368 2,448Depreciation and amortization charges for the year (see Note 20) (408 ) (1,476 ) (177 ) (146 ) (117 ) – (2,324 )Transfers 288 3,687 328 150 61 (4,514 ) –Balance at Dec. 31, 2005, net of accumulated depreciation and amortization P5,585 P11,569 P707 P445 P2,722 P1,542 P22,570
Interest capitalized in 2007, 2006 and 2005 amounted to P893, P52 and P46, respectively. Capitalization rates used for general borrowing peso loans were 5.37% in 2007, 6.843% in 2006 and 6.94% in 2005, while capitalization rates used for specifi c borrowing peso loans were the actual interest rates for the loan.
The Thermofor Catalytic Cracking Unit (TCCU) was decommissioned in July 2007 to pave the way for the completion of the Petro Fluidized Catalytic Cracker (PetroFCC). Some of the components of the TCCU were re-used and made part of the PetroFCC. The PetroFCC, which has a conversion capacity of 19,000 barrels per day, and the Propylene Recovery Unit (PRU), which can produce 140,000 metric tons of propylene annually, are the Philippines’ fi rst petrochemical feedstock facilities. The units will be operational within the fi rst quarter of 2008.
Notes to Consolidated Financial Statements(With Comparative Figures For 2006 And 2005)(Amounts In Million Pesos, Except Par Value, Shares And Per Share Amounts, Exchange Rates, And Commodity Volumes)

56 PETRON CORPORATION • Sustaining Momentum PETRON CORPORATION • Annual Report 2007 57
10. Investment Properties
The gross carrying amounts and accumulated depreciation and amortization at the beginning and end of 2007, 2006 and 2005 are as follows:
Land Offi ce Units Total At December 31, 2007 Cost P42 P263 P305 Accumulated depreciation – (103 ) (103 ) Net carrying amount P42 P160 P202 At December 31, 2006 Cost P48 P263 P311 Accumulated depreciation – (89 ) (89 ) Net carrying amount P48 P174 P222 At December 31, 2005 Cost P48 P263 P311 Accumulated depreciation – (76 ) (76 ) Net carrying amount P48 P187 P235 Land Offi ce Units Total At January 1, 2005 Cost P32 P263 P295 Accumulated depreciation – (65 ) (65 ) Net carrying amount P32 P198 P230
A reconciliation of the carrying amounts at the beginning and end of 2007, 2006 and 2005 of investment property is shown below.
Land Offi ce Units Total Net carrying amount, at January 1, 2007 P48 P174 P222 Additions 42 – 42 Disposals (48 ) – (48 ) Depreciation for the year (see Note 20) – (14 ) (14 ) Net carrying amount, at December 31, 2007 P42 P160 P202
Net carrying amount, at January 1, 2006 P48 P187 P235 Additions – – – Depreciation for the year (see Note 20) – (13 ) (13 ) Net carrying amount, at December 31, 2006 P48 P174 P222 Net carrying amount, at January 1, 2005 P32 P198 P230 Additions 16 – 16 Depreciation for the year (see Note 20) – (11 ) (11 ) Net carrying amount, at December 31, 2005 P48 P187 P235
The Company’s investment properties consist of offi ce units located in Petron MegaPlaza and parcels of land in various locations intended for service stations. Estimated fair values for such properties, based
Landbank of the Philippines (Landbank) –
P2 billion
Nordeutsche Landesbank
Girozentrale (NORD) – US$100 million
Metrobank and Citibank Club
Loan (MBTC and CTB) –
P2 billion
BPI Capital Corporation
and ING Bank N.V. – P6.3 billionOriginal Amount
Payment Terms
CTB –P2 billion
Interest (2007)
Security
Major Covenants
12 equal quarterly installments starting March 2009 up to November 2011
One time payment in August 2011
Six semi-annual installments starting on the 30th month from June 2004 up to June 2009
13 quarterly installments starting April 2009 up to January 2012
13 quarterly installments starting April 2004 up to April 2007
4.60%- 5.84% 8.88% 5.26% to 6.52% 6.73% 5.18%
None None None None None
None Maintenance of certain fi nancial ratios
Maintenance of certain fi nancial ratios
Maintenance of certain fi nancial ratios
Maintenance of certain fi nancial ratios
on recent sale of units within the building and/or sale of units in comparative Grade A buildings, amounted to P214, P202 and P250 in 2007, 2006 and 2005, respectively.
Rental income earned from the investment properties amounted to P15, P16, and P20 in 2007, 2006 and 2005, respectively, which are recognized as part of “Other Income and Charges” account (see Note 21).
There are no other direct selling and administration expenses (i.e., repairs and maintenance) arising from investment properties that generated rent income in 2007, 2006 and 2005.
11. Other Noncurrent Assets
2007 2006 2005 Net pension plan assets (see Note 25) P509 P434 P1,137 Others-net 230 188 124 P739 P622 P1,261
Others include franchise fees amounting to P9, P6 and P4 in 2007, 2006 and 2005, respectively, net of amortization of franchise fees amounting to P0.88, P0.83 and P0.40 in 2007, 2006 and 2005, respectively. Amortization of franchise fee is included as part of “Others” under “Selling and Administrative” account in the consolidated statement of income (see Note 18).
12. Short-term Loans
This account pertains to unsecured peso loans obtained from local banks with interest ranging from 4% to 7% (see Note 21), intended to fund the importation of crude oil and petroleum products, capital expenditures and working capital requirements.
13. Accounts Payable and Accrued Expenses
2007 2006 2005 Accounts payable P2,653 P1,298 P472 Accrued expenses 957 1,390 1,406 Specifi c taxes and other taxes payable 443 425 336 Others (see Note 31) 491 618 412 P4,544 P3,731 P2,626
Accounts payable are liabilities to haulers, contractors and suppliers that are noninterest-bearing and are normally settled on a 30-day term.
Accrued expenses are accrual of unpaid interest and selling and administrative expenses and are normally settled within 12 months from the reporting date.
14. Long-term Debt
2007 2006 2005 Unsecured peso loans (net of debt issue cost amounting to P69 in 2007 and P70 in 2006) P10,231 P8,538 P1,673 Syndicated dollar bank loans (net of debt issue costs amounting to P31, P58 and P80 in 2007, 2006 and 2005, respectively) 2,549 4,374 5,258 12,780 12,912 6,931 Less current portion (net of debt issue costs amounting to P48, P41 and P21 in 2007, 2006 and 2005, respectively) 1,604 1,633 1,906 P11,176 P11,279 P5,025
Movements of debt issue costs are as follows:
2007 2006 2005 Beginning balance P128 P80 P100 Additions 17 74 –
Accretion for the year (see Note 21) (45 ) (26 ) (20 ) Ending balance P100 P128 P80
The salient terms of the foregoing debts are summarized as follows:
As of December 31, 2007, the Company is in compliance with its loan covenants. Debt maturities (gross of P100 debt issue costs) for the next fi ve years are as follows:
Year Amount2008 P1,6512009 2,2112010 1,2822011 7,5822012 154 P12,880
Notes to Consolidated Financial Statements(With Comparative Figures For 2006 And 2005)(Amounts In Million Pesos, Except Par Value, Shares And Per Share Amounts, Exchange Rates, And Commodity Volumes)
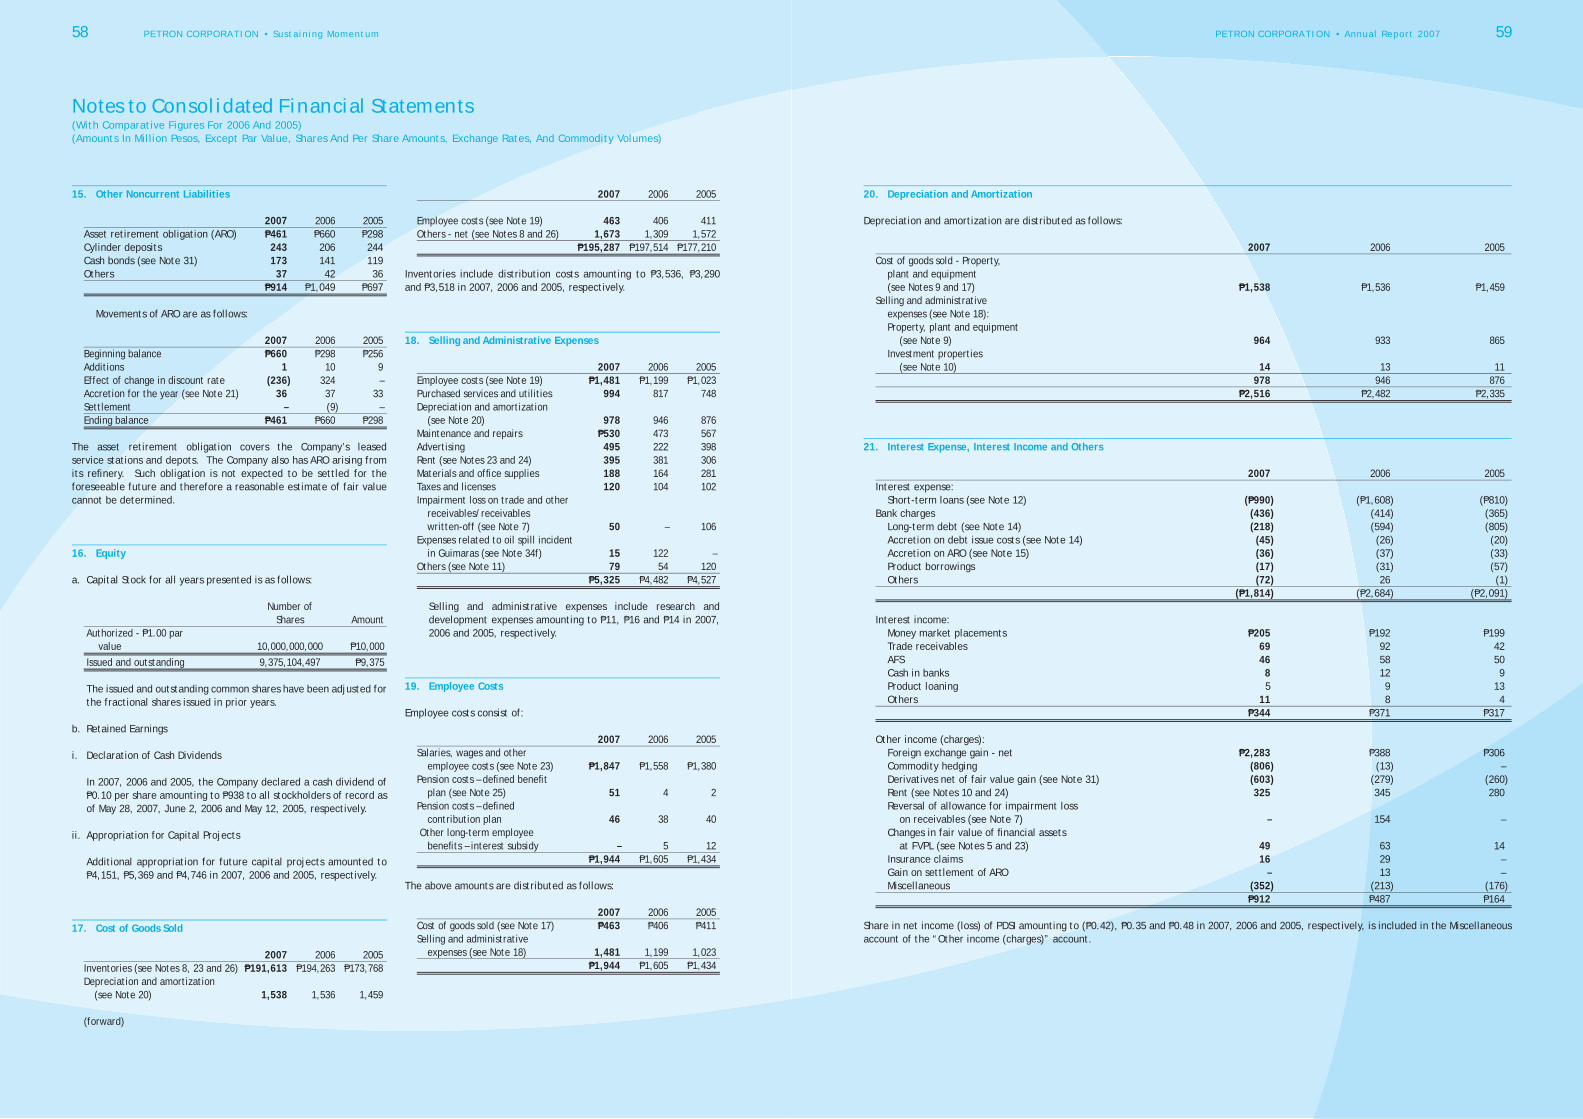
58 PETRON CORPORATION • Sustaining Momentum PETRON CORPORATION • Annual Report 2007 59
15. Other Noncurrent Liabilities
2007 2006 2005 Asset retirement obligation (ARO) P461 P660 P298 Cylinder deposits 243 206 244 Cash bonds (see Note 31) 173 141 119 Others 37 42 36 P914 P1,049 P697 Movements of ARO are as follows:
2007 2006 2005 Beginning balance P660 P298 P256 Additions 1 10 9 Effect of change in discount rate (236 ) 324 – Accretion for the year (see Note 21) 36 37 33 Settlement – (9 ) – Ending balance P461 P660 P298
The asset retirement obligation covers the Company’s leased service stations and depots. The Company also has ARO arising from its refi nery. Such obligation is not expected to be settled for the foreseeable future and therefore a reasonable estimate of fair value cannot be determined.
16. Equity
a. Capital Stock for all years presented is as follows:
Number of Shares Amount Authorized - P1.00 par value 10,000,000,000 P10,000 Issued and outstanding 9,375,104,497 P9,375
The issued and outstanding common shares have been adjusted for the fractional shares issued in prior years.
b. Retained Earnings
i. Declaration of Cash Dividends
In 2007, 2006 and 2005, the Company declared a cash dividend of P0.10 per share amounting to P938 to all stockholders of record as of May 28, 2007, June 2, 2006 and May 12, 2005, respectively.
ii. Appropriation for Capital Projects
Additional appropriation for future capital projects amounted to P4,151, P5,369 and P4,746 in 2007, 2006 and 2005, respectively.
17. Cost of Goods Sold
2007 2006 2005 Inventories (see Notes 8, 23 and 26) P191,613 P194,263 P173,768 Depreciation and amortization (see Note 20) 1,538 1,536 1,459 (forward)
2007 2006 2005
Employee costs (see Note 19) 463 406 411 Others - net (see Notes 8 and 26) 1,673 1,309 1,572 P195,287 P197,514 P177,210
Inventories include distribution costs amounting to P3,536, P3,290 and P3,518 in 2007, 2006 and 2005, respectively.
18. Selling and Administrative Expenses
2007 2006 2005 Employee costs (see Note 19) P1,481 P1,199 P1,023 Purchased services and utilities 994 817 748 Depreciation and amortization (see Note 20) 978 946 876 Maintenance and repairs P530 473 567 Advertising 495 222 398 Rent (see Notes 23 and 24) 395 381 306 Materials and offi ce supplies 188 164 281 Taxes and licenses 120 104 102 Impairment loss on trade and other receivables/receivables written-off (see Note 7) 50 – 106 Expenses related to oil spill incident in Guimaras (see Note 34f) 15 122 – Others (see Note 11) 79 54 120 P5,325 P4,482 P4,527
Selling and administrative expenses include research and development expenses amounting to P11, P16 and P14 in 2007, 2006 and 2005, respectively.
19. Employee Costs
Employee costs consist of:
2007 2006 2005 Salaries, wages and other employee costs (see Note 23) P1,847 P1,558 P1,380 Pension costs – defi ned benefi t plan (see Note 25) 51 4 2 Pension costs – defi ned contribution plan 46 38 40 Other long-term employee benefi ts – interest subsidy – 5 12 P1,944 P1,605 P1,434
The above amounts are distributed as follows:
2007 2006 2005 Cost of goods sold (see Note 17) P463 P406 P411 Selling and administrative expenses (see Note 18) 1,481 1,199 1,023 P1,944 P1,605 P1,434
20. Depreciation and Amortization
Depreciation and amortization are distributed as follows:
2007 2006 2005 Cost of goods sold - Property, plant and equipment (see Notes 9 and 17) P1,538 P1,536 P1,459 Selling and administrative expenses (see Note 18): Property, plant and equipment (see Note 9) 964 933 865 Investment properties (see Note 10) 14 13 11 978 946 876 P2,516 P2,482 P2,335
21. Interest Expense, Interest Income and Others
2007 2006 2005 Interest expense: Short-term loans (see Note 12) (P990 ) (P1,608 ) (P810 ) Bank charges (436 ) (414 ) (365 ) Long-term debt (see Note 14) (218 ) (594 ) (805 ) Accretion on debt issue costs (see Note 14) (45 ) (26 ) (20 ) Accretion on ARO (see Note 15) (36 ) (37 ) (33 ) Product borrowings (17 ) (31 ) (57 ) Others (72 ) 26 (1 ) (P1,814 ) (P2,684 ) (P2,091 )
Interest income: Money market placements P205 P192 P199 Trade receivables 69 92 42 AFS 46 58 50 Cash in banks 8 12 9 Product loaning 5 9 13 Others 11 8 4 P344 P371 P317
Other income (charges): Foreign exchange gain - net P2,283 P388 P306 Commodity hedging (806 ) (13 ) – Derivatives net of fair value gain (see Note 31) (603 ) (279 ) (260 ) Rent (see Notes 10 and 24) 325 345 280 Reversal of allowance for impairment loss on receivables (see Note 7) – 154 – Changes in fair value of fi nancial assets at FVPL (see Notes 5 and 23) 49 63 14 Insurance claims 16 29 – Gain on settlement of ARO – 13 – Miscellaneous (352 ) (213 ) (176 ) P912 P487 P164
Share in net income (loss) of PDSI amounting to (P0.42), P0.35 and P0.48 in 2007, 2006 and 2005, respectively, is included in the Miscellaneous account of the “Other income (charges)” account.
Notes to Consolidated Financial Statements(With Comparative Figures For 2006 And 2005)(Amounts In Million Pesos, Except Par Value, Shares And Per Share Amounts, Exchange Rates, And Commodity Volumes)
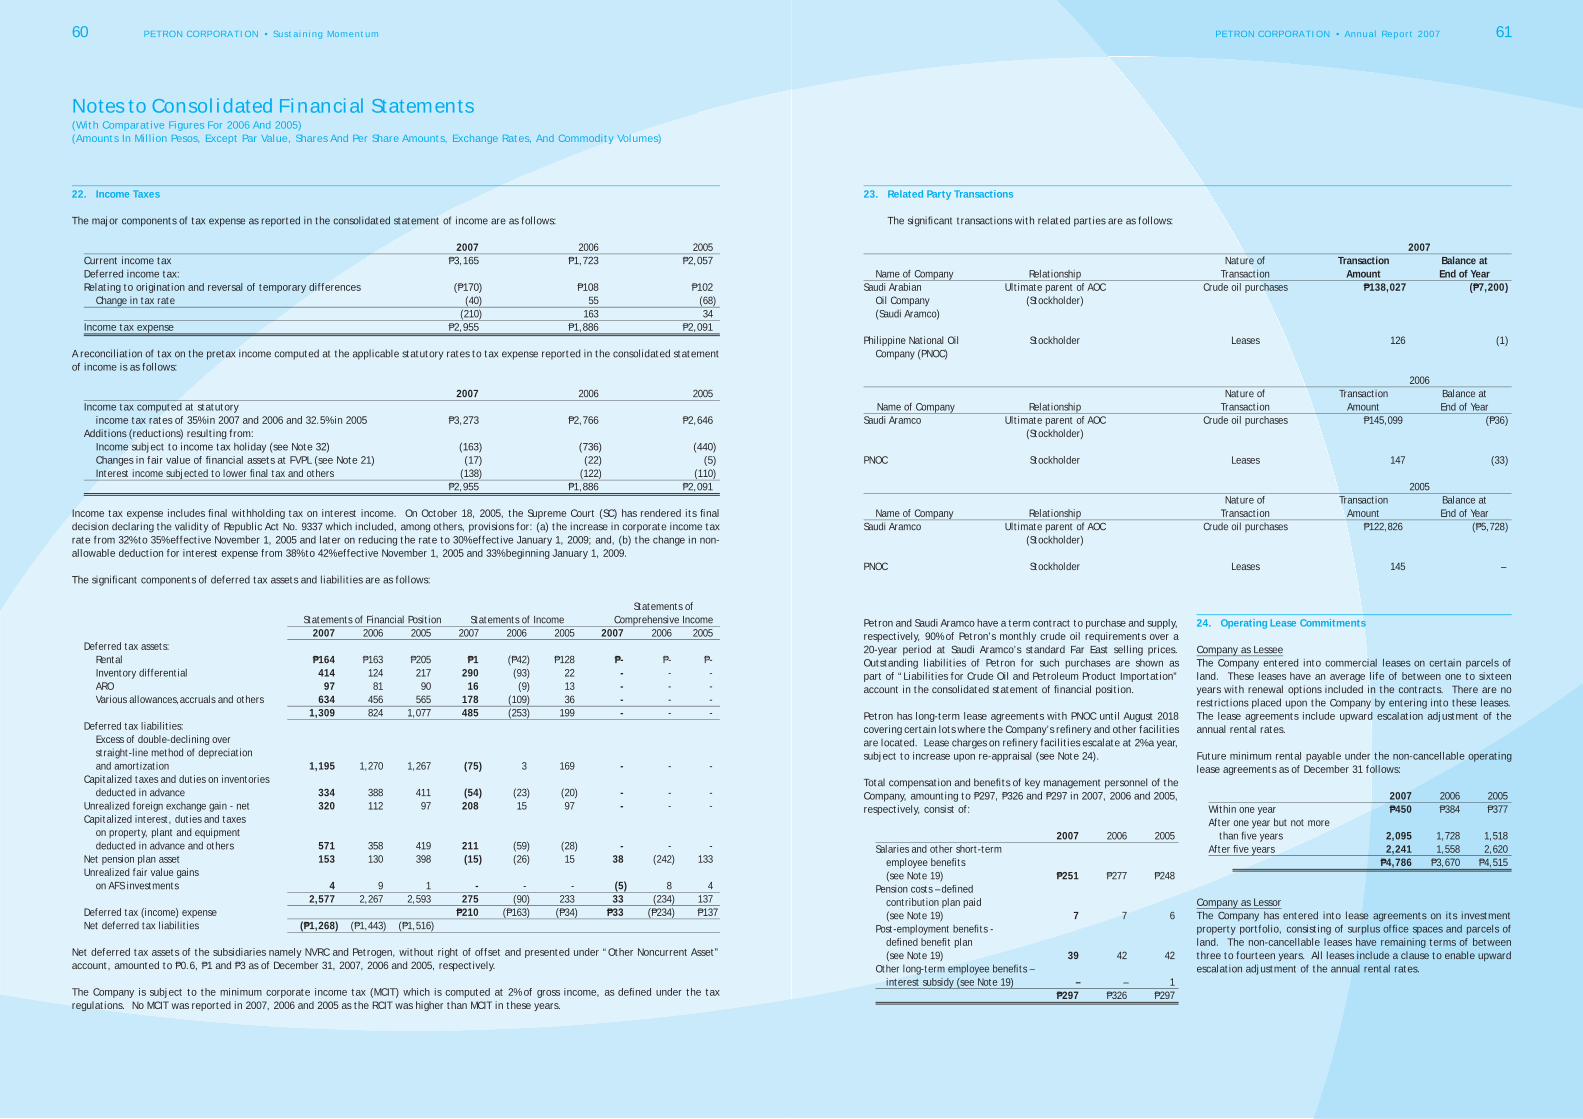
60 PETRON CORPORATION • Sustaining Momentum PETRON CORPORATION • Annual Report 2007 61
22. Income Taxes
The major components of tax expense as reported in the consolidated statement of income are as follows:
2007 2006 2005 Current income tax P3,165 P1,723 P2,057 Deferred income tax: Relating to origination and reversal of temporary differences (P170 ) P108 P102 Change in tax rate (40 ) 55 (68 ) (210 ) 163 34 Income tax expense P2,955 P1,886 P2,091
A reconciliation of tax on the pretax income computed at the applicable statutory rates to tax expense reported in the consolidated statement of income is as follows:
2007 2006 2005 Income tax computed at statutory income tax rates of 35% in 2007 and 2006 and 32.5% in 2005 P3,273 P2,766 P2,646 Additions (reductions) resulting from: Income subject to income tax holiday (see Note 32) (163 ) (736 ) (440 ) Changes in fair value of fi nancial assets at FVPL (see Note 21) (17 ) (22 ) (5 ) Interest income subjected to lower fi nal tax and others (138 ) (122 ) (110 ) P2,955 P1,886 P2,091
Income tax expense includes fi nal withholding tax on interest income. On October 18, 2005, the Supreme Court (SC) has rendered its fi nal decision declaring the validity of Republic Act No. 9337 which included, among others, provisions for: (a) the increase in corporate income tax rate from 32% to 35% effective November 1, 2005 and later on reducing the rate to 30% effective January 1, 2009; and, (b) the change in non-allowable deduction for interest expense from 38% to 42% effective November 1, 2005 and 33% beginning January 1, 2009.
The signifi cant components of deferred tax assets and liabilities are as follows:
Statements of Statements of Financial Position Statements of Income Comprehensive Income 2007 2006 2005 2007 2006 2005 2007 2006 2005
Deferred tax assets: Rental P164 P163 P205 P1 (P42 ) P128 P- P- P- Inventory differential 414 124 217 290 (93 ) 22 - - - ARO 97 81 90 16 (9 ) 13 - - - Various allowances,accruals and others 634 456 565 178 (109 ) 36 - - - 1,309 824 1,077 485 (253 ) 199 - - - Deferred tax liabilities: Excess of double-declining over straight-line method of depreciation and amortization 1,195 1,270 1,267 (75 ) 3 169 - - - Capitalized taxes and duties on inventories deducted in advance 334 388 411 (54 ) (23 ) (20 ) - - - Unrealized foreign exchange gain - net 320 112 97 208 15 97 - - - Capitalized interest, duties and taxes on property, plant and equipment deducted in advance and others 571 358 419 211 (59 ) (28 ) - - - Net pension plan asset 153 130 398 (15 ) (26 ) 15 38 (242 ) 133 Unrealized fair value gains on AFS investments 4 9 1 - - - (5 ) 8 4 2,577 2,267 2,593 275 (90 ) 233 33 (234 ) 137 Deferred tax (income) expense P210 (P163 ) (P34 ) P33 (P234 ) P13 7 Net deferred tax liabilities (P1,268 ) (P1,443 ) (P1,516 )
Net deferred tax assets of the subsidiaries namely NVRC and Petrogen, without right of offset and presented under “Other Noncurrent Asset” account, amounted to P0.6, P1 and P3 as of December 31, 2007, 2006 and 2005, respectively.
The Company is subject to the minimum corporate income tax (MCIT) which is computed at 2% of gross income, as defi ned under the tax regulations. No MCIT was reported in 2007, 2006 and 2005 as the RCIT was higher than MCIT in these years.
23. Related Party Transactions
The signifi cant transactions with related parties are as follows:
2007 Nature of Transaction Balance at Name of Company Relationship Transaction Amount End of YearSaudi Arabian Ultimate parent of AOC Crude oil purchases P138,027 (P7,200 ) Oil Company (Stockholder) (Saudi Aramco)
Philippine National Oil Stockholder Leases 126 (1 ) Company (PNOC)
2006
Nature of Transaction Balance at Name of Company Relationship Transaction Amount End of YearSaudi Aramco Ultimate parent of AOC Crude oil purchases P145,099 (P36 ) (Stockholder)
PNOC Stockholder Leases 147 (33 )
2005 Nature of Transaction Balance at Name of Company Relationship Transaction Amount End of YearSaudi Aramco Ultimate parent of AOC Crude oil purchases P122,826 (P5,728 ) (Stockholder)
PNOC Stockholder Leases 145 –
Petron and Saudi Aramco have a term contract to purchase and supply, respectively, 90% of Petron’s monthly crude oil requirements over a 20-year period at Saudi Aramco’s standard Far East selling prices. Outstanding liabilities of Petron for such purchases are shown as part of “Liabilities for Crude Oil and Petroleum Product Importation” account in the consolidated statement of fi nancial position.
Petron has long-term lease agreements with PNOC until August 2018 covering certain lots where the Company’s refi nery and other facilities are located. Lease charges on refi nery facilities escalate at 2% a year, subject to increase upon re-appraisal (see Note 24).
Total compensation and benefi ts of key management personnel of the Company, amounting to P297, P326 and P297 in 2007, 2006 and 2005, respectively, consist of:
2007 2006 2005 Salaries and other short-term employee benefi ts (see Note 19) P251 P277 P248 Pension costs – defi ned contribution plan paid (see Note 19) 7 7 6 Post-employment benefi ts - defi ned benefi t plan (see Note 19) 39 42 42 Other long-term employee benefi ts – interest subsidy (see Note 19) – – 1 P297 P326 P297
24. Operating Lease Commitments
Company as LesseeThe Company entered into commercial leases on certain parcels of land. These leases have an average life of between one to sixteen years with renewal options included in the contracts. There are no restrictions placed upon the Company by entering into these leases. The lease agreements include upward escalation adjustment of the annual rental rates.
Future minimum rental payable under the non-cancellable operating lease agreements as of December 31 follows:
2007 2006 2005 Within one year P450 P384 P377 After one year but not more than fi ve years 2,095 1,728 1,518 After fi ve years 2,241 1,558 2,620 P4,786 P3,670 P4,515
Company as LessorThe Company has entered into lease agreements on its investment property portfolio, consisting of surplus offi ce spaces and parcels of land. The non-cancellable leases have remaining terms of between three to fourteen years. All leases include a clause to enable upward escalation adjustment of the annual rental rates.
Notes to Consolidated Financial Statements(With Comparative Figures For 2006 And 2005)(Amounts In Million Pesos, Except Par Value, Shares And Per Share Amounts, Exchange Rates, And Commodity Volumes)
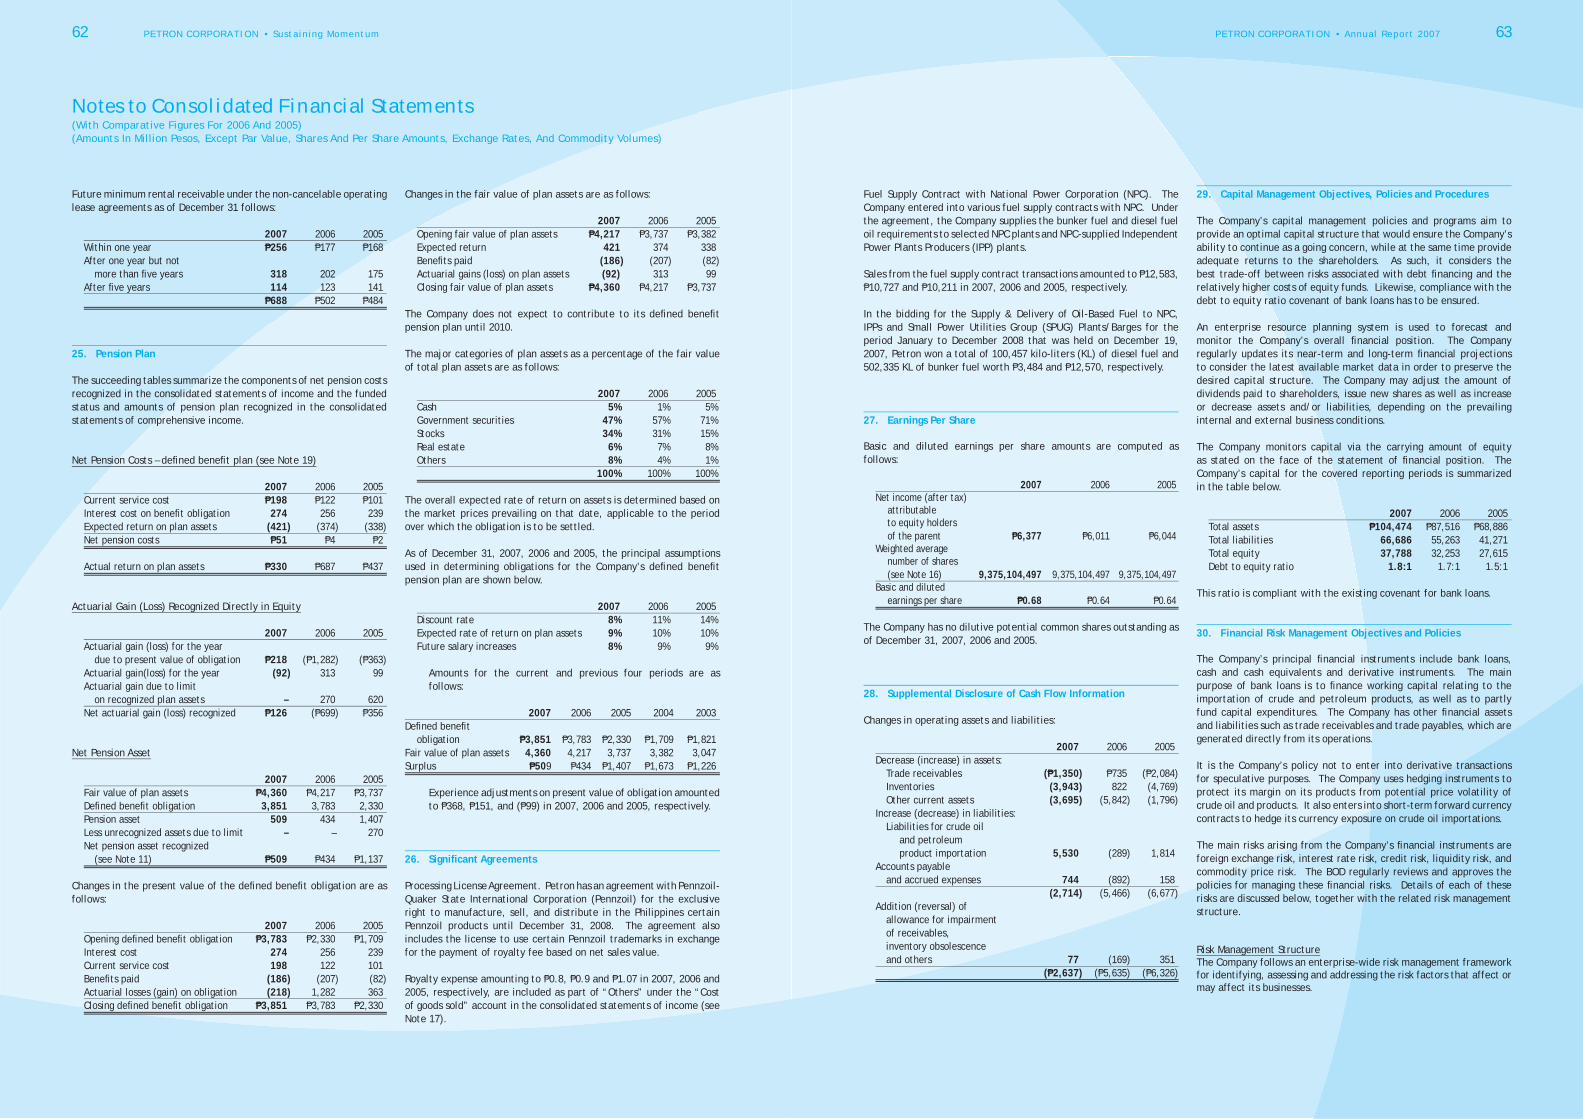
62 PETRON CORPORATION • Sustaining Momentum PETRON CORPORATION • Annual Report 2007 63
Future minimum rental receivable under the non-cancelable operating lease agreements as of December 31 follows:
2007 2006 2005 Within one year P256 P177 P168 After one year but not more than fi ve years 318 202 175 After fi ve years 114 123 141 P688 P502 P484
25. Pension Plan
The succeeding tables summarize the components of net pension costs recognized in the consolidated statements of income and the funded status and amounts of pension plan recognized in the consolidated statements of comprehensive income.
Net Pension Costs – defi ned benefi t plan (see Note 19)
2007 2006 2005 Current service cost P198 P122 P101 Interest cost on benefi t obligation 274 256 239 Expected return on plan assets (421 ) (374 ) (338 ) Net pension costs P51 P4 P2 Actual return on plan assets P330 P687 P437
Actuarial Gain (Loss) Recognized Directly in Equity
2007 2006 2005 Actuarial gain (loss) for the year due to present value of obligation P218 (P1,282 ) (P363 ) Actuarial gain(loss) for the year (92 ) 313 99 Actuarial gain due to limit on recognized plan assets – 270 620 Net actuarial gain (loss) recognized P126 (P699 ) P356
Net Pension Asset
2007 2006 2005 Fair value of plan assets P4,360 P4,217 P3,737 Defi ned benefi t obligation 3,851 3,783 2,330 Pension asset 509 434 1,407 Less unrecognized assets due to limit – – 270 Net pension asset recognized (see Note 11) P509 P434 P1,137
Changes in the present value of the defi ned benefi t obligation are as follows:
2007 2006 2005 Opening defi ned benefi t obligation P3,783 P2,330 P1,709 Interest cost 274 256 239 Current service cost 198 122 101 Benefi ts paid (186 ) (207 ) (82 ) Actuarial losses (gain) on obligation (218 ) 1,282 363 Closing defi ned benefi t obligation P3,851 P3,783 P2,330
Changes in the fair value of plan assets are as follows:
2007 2006 2005 Opening fair value of plan assets P4,217 P3,737 P3,382 Expected return 421 374 338 Benefi ts paid (186 ) (207 ) (82 ) Actuarial gains (loss) on plan assets (92) 313 99 Closing fair value of plan assets P4,360 P4,217 P3,737
The Company does not expect to contribute to its defi ned benefi t pension plan until 2010.
The major categories of plan assets as a percentage of the fair value of total plan assets are as follows:
2007 2006 2005 Cash 5% 1% 5% Government securities 47% 57% 71% Stocks 34% 31% 15% Real estate 6% 7% 8% Others 8% 4% 1% 100% 100% 100%
The overall expected rate of return on assets is determined based on the market prices prevailing on that date, applicable to the period over which the obligation is to be settled.
As of December 31, 2007, 2006 and 2005, the principal assumptions used in determining obligations for the Company’s defi ned benefi t pension plan are shown below.
2007 2006 2005 Discount rate 8% 11% 14% Expected rate of return on plan assets 9% 10% 10% Future salary increases 8% 9% 9%
Amounts for the current and previous four periods are as follows:
2007 2006 2005 2004 2003Defi ned benefi t obligation P3,851 P3,783 P2,330 P1,709 P1,821Fair value of plan assets 4,360 4,217 3,737 3,382 3,047Surplus P509 P434 P1,407 P1,673 P1,226
Experience adjustments on present value of obligation amounted to P368, P151, and (P99) in 2007, 2006 and 2005, respectively.
26. Signifi cant Agreements
Processing License Agreement. Petron has an agreement with Pennzoil-Quaker State International Corporation (Pennzoil) for the exclusive right to manufacture, sell, and distribute in the Philippines certain Pennzoil products until December 31, 2008. The agreement also includes the license to use certain Pennzoil trademarks in exchange for the payment of royalty fee based on net sales value. Royalty expense amounting to P0.8, P0.9 and P1.07 in 2007, 2006 and 2005, respectively, are included as part of “Others” under the “Cost of goods sold” account in the consolidated statements of income (see Note 17).
Fuel Supply Contract with National Power Corporation (NPC). The Company entered into various fuel supply contracts with NPC. Under the agreement, the Company supplies the bunker fuel and diesel fuel oil requirements to selected NPC plants and NPC-supplied Independent Power Plants Producers (IPP) plants.
Sales from the fuel supply contract transactions amounted to P12,583, P10,727 and P10,211 in 2007, 2006 and 2005, respectively.
In the bidding for the Supply & Delivery of Oil-Based Fuel to NPC, IPPs and Small Power Utilities Group (SPUG) Plants/Barges for the period January to December 2008 that was held on December 19, 2007, Petron won a total of 100,457 kilo-liters (KL) of diesel fuel and 502,335 KL of bunker fuel worth P3,484 and P12,570, respectively.
27. Earnings Per Share
Basic and diluted earnings per share amounts are computed as follows:
2007 2006 2005 Net income (after tax) attributable to equity holders of the parent P6,377 P6,011 P6,044 Weighted average number of shares (see Note 16) 9,375,104,497 9,375,104,497 9,375,104,497 Basic and diluted earnings per share P0.68 P0.64 P0.64
The Company has no dilutive potential common shares outstanding as of December 31, 2007, 2006 and 2005.
28. Supplemental Disclosure of Cash Flow Information
Changes in operating assets and liabilities:
2007 2006 2005 Decrease (increase) in assets: Trade receivables (P1,350 ) P735 (P2,084 ) Inventories (3,943 ) 822 (4,769 ) Other current assets (3,695 ) (5,842 ) (1,796 ) Increase (decrease) in liabilities: Liabilities for crude oil and petroleum product importation 5,530 (289 ) 1,814 Accounts payable and accrued expenses 744 (892 ) 158 (2,714 ) (5,466 ) (6,677 ) Addition (reversal) of allowance for impairment of receivables, inventory obsolescence and others 77 (169 ) 351 (P2,637 ) (P5,635 ) (P6,326 )
29. Capital Management Objectives, Policies and Procedures
The Company’s capital management policies and programs aim to provide an optimal capital structure that would ensure the Company’s ability to continue as a going concern, while at the same time provide adequate returns to the shareholders. As such, it considers the best trade-off between risks associated with debt fi nancing and the relatively higher costs of equity funds. Likewise, compliance with the debt to equity ratio covenant of bank loans has to be ensured. An enterprise resource planning system is used to forecast and monitor the Company’s overall fi nancial position. The Company regularly updates its near-term and long-term fi nancial projections to consider the latest available market data in order to preserve the desired capital structure. The Company may adjust the amount of dividends paid to shareholders, issue new shares as well as increase or decrease assets and/or liabilities, depending on the prevailing internal and external business conditions.
The Company monitors capital via the carrying amount of equity as stated on the face of the statement of fi nancial position. The Company’s capital for the covered reporting periods is summarized in the table below.
2007 2006 2005 Total assets P104,474 P87,516 P68,886 Total liabilities 66,686 55,263 41,271 Total equity 37,788 32,253 27,615 Debt to equity ratio 1.8:1 1.7:1 1.5:1
This ratio is compliant with the existing covenant for bank loans.
30. Financial Risk Management Objectives and Policies
The Company’s principal fi nancial instruments include bank loans, cash and cash equivalents and derivative instruments. The main purpose of bank loans is to fi nance working capital relating to the importation of crude and petroleum products, as well as to partly fund capital expenditures. The Company has other fi nancial assets and liabilities such as trade receivables and trade payables, which are generated directly from its operations.
It is the Company’s policy not to enter into derivative transactions for speculative purposes. The Company uses hedging instruments to protect its margin on its products from potential price volatility of crude oil and products. It also enters into short-term forward currency contracts to hedge its currency exposure on crude oil importations.
The main risks arising from the Company’s fi nancial instruments are foreign exchange risk, interest rate risk, credit risk, liquidity risk, and commodity price risk. The BOD regularly reviews and approves the policies for managing these fi nancial risks. Details of each of these risks are discussed below, together with the related risk management structure.
Risk Management StructureThe Company follows an enterprise-wide risk management framework for identifying, assessing and addressing the risk factors that affect or may affect its businesses.
Notes to Consolidated Financial Statements(With Comparative Figures For 2006 And 2005)(Amounts In Million Pesos, Except Par Value, Shares And Per Share Amounts, Exchange Rates, And Commodity Volumes)
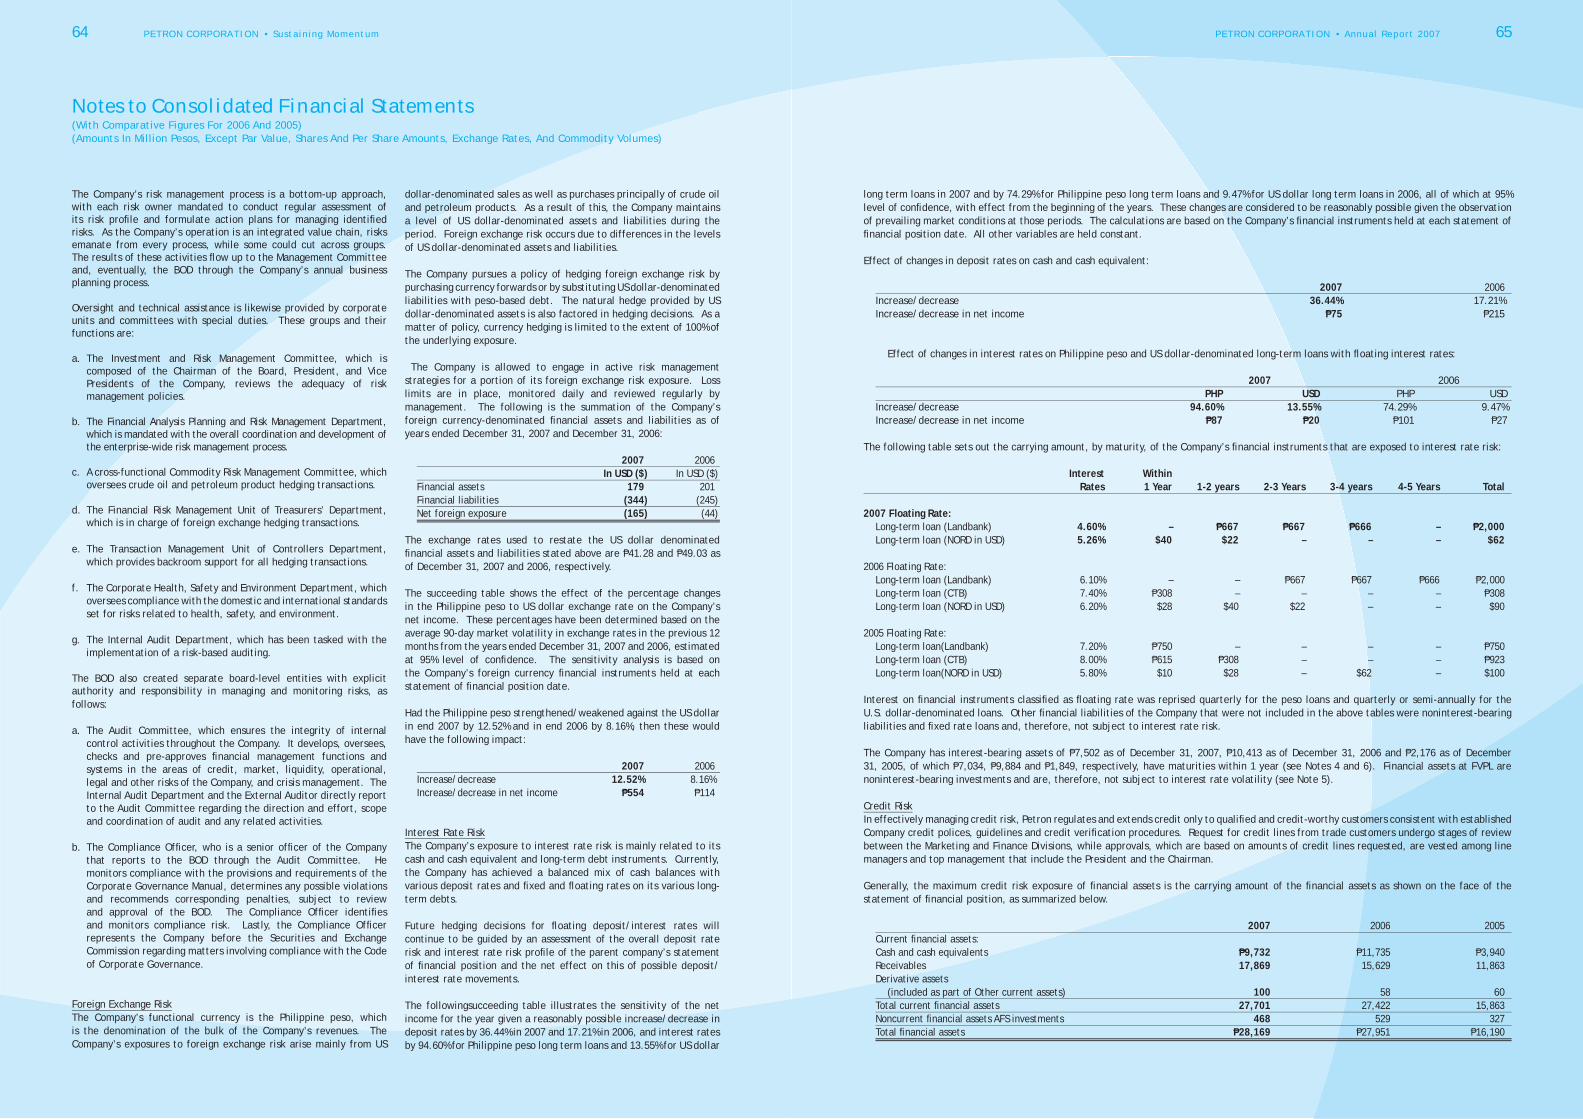
64 PETRON CORPORATION • Sustaining Momentum PETRON CORPORATION • Annual Report 2007 65
The Company’s risk management process is a bottom-up approach, with each risk owner mandated to conduct regular assessment of its risk profi le and formulate action plans for managing identifi ed risks. As the Company’s operation is an integrated value chain, risks emanate from every process, while some could cut across groups. The results of these activities fl ow up to the Management Committee and, eventually, the BOD through the Company’s annual business planning process.
Oversight and technical assistance is likewise provided by corporate units and committees with special duties. These groups and their functions are:
a. The Investment and Risk Management Committee, which is composed of the Chairman of the Board, President, and Vice Presidents of the Company, reviews the adequacy of risk management policies.
b. The Financial Analysis Planning and Risk Management Department, which is mandated with the overall coordination and development of the enterprise-wide risk management process.
c. A cross-functional Commodity Risk Management Committee, which oversees crude oil and petroleum product hedging transactions.
d. The Financial Risk Management Unit of Treasurers’ Department, which is in charge of foreign exchange hedging transactions.
e. The Transaction Management Unit of Controllers Department, which provides backroom support for all hedging transactions.
f. The Corporate Health, Safety and Environment Department, which oversees compliance with the domestic and international standards set for risks related to health, safety, and environment.
g. The Internal Audit Department, which has been tasked with the
implementation of a risk-based auditing.
The BOD also created separate board-level entities with explicit authority and responsibility in managing and monitoring risks, as follows:
a. The Audit Committee, which ensures the integrity of internal control activities throughout the Company. It develops, oversees, checks and pre-approves fi nancial management functions and systems in the areas of credit, market, liquidity, operational, legal and other risks of the Company, and crisis management. The Internal Audit Department and the External Auditor directly report to the Audit Committee regarding the direction and effort, scope and coordination of audit and any related activities.
b. The Compliance Offi cer, who is a senior offi cer of the Company that reports to the BOD through the Audit Committee. He monitors compliance with the provisions and requirements of the Corporate Governance Manual, determines any possible violations and recommends corresponding penalties, subject to review and approval of the BOD. The Compliance Offi cer identifi es and monitors compliance risk. Lastly, the Compliance Offi cer represents the Company before the Securities and Exchange Commission regarding matters involving compliance with the Code of Corporate Governance.
Foreign Exchange RiskThe Company’s functional currency is the Philippine peso, which is the denomination of the bulk of the Company’s revenues. The Company’s exposures to foreign exchange risk arise mainly from US
dollar-denominated sales as well as purchases principally of crude oil and petroleum products. As a result of this, the Company maintains a level of US dollar-denominated assets and liabilities during the period. Foreign exchange risk occurs due to differences in the levels of US dollar-denominated assets and liabilities.
The Company pursues a policy of hedging foreign exchange risk by purchasing currency forwards or by substituting US dollar-denominated liabilities with peso-based debt. The natural hedge provided by US dollar-denominated assets is also factored in hedging decisions. As a matter of policy, currency hedging is limited to the extent of 100% of the underlying exposure. The Company is allowed to engage in active risk management strategies for a portion of its foreign exchange risk exposure. Loss limits are in place, monitored daily and reviewed regularly by management. The following is the summation of the Company’s foreign currency-denominated fi nancial assets and liabilities as of years ended December 31, 2007 and December 31, 2006:
2007 2006 In USD ($ ) In USD ($ ) Financial assets 179 201 Financial liabilities (344 ) (245 ) Net foreign exposure (165 ) (44 )
The exchange rates used to restate the US dollar denominated fi nancial assets and liabilities stated above are P41.28 and P49.03 as of December 31, 2007 and 2006, respectively.
The succeeding table shows the effect of the percentage changes in the Philippine peso to US dollar exchange rate on the Company’s net income. These percentages have been determined based on the average 90-day market volatility in exchange rates in the previous 12 months from the years ended December 31, 2007 and 2006, estimated at 95% level of confi dence. The sensitivity analysis is based on the Company’s foreign currency fi nancial instruments held at each statement of fi nancial position date.
Had the Philippine peso strengthened/weakened against the US dollar in end 2007 by 12.52% and in end 2006 by 8.16%, then these would have the following impact:
2007 2006 Increase/decrease 12.52% 8.16% Increase/decrease in net income P554 P114
Interest Rate RiskThe Company’s exposure to interest rate risk is mainly related to its cash and cash equivalent and long-term debt instruments. Currently, the Company has achieved a balanced mix of cash balances with various deposit rates and fi xed and fl oating rates on its various long-term debts.
Future hedging decisions for fl oating deposit/interest rates will continue to be guided by an assessment of the overall deposit rate risk and interest rate risk profi le of the parent company’s statement of fi nancial position and the net effect on this of possible deposit/interest rate movements.
The followingsucceeding table illustrates the sensitivity of the net income for the year given a reasonably possible increase/decrease in deposit rates by 36.44% in 2007 and 17.21% in 2006, and interest rates by 94.60% for Philippine peso long term loans and 13.55% for US dollar
long term loans in 2007 and by 74.29% for Philippine peso long term loans and 9.47% for US dollar long term loans in 2006, all of which at 95% level of confi dence, with effect from the beginning of the years. These changes are considered to be reasonably possible given the observation of prevailing market conditions at those periods. The calculations are based on the Company’s fi nancial instruments held at each statement of fi nancial position date. All other variables are held constant.
Effect of changes in deposit rates on cash and cash equivalent:
2007 2006 Increase/decrease 36.44% 17.21% Increase/decrease in net income P75 P215
Effect of changes in interest rates on Philippine peso and US dollar-denominated long-term loans with fl oating interest rates:
2007 2006 PHP USD PHP USD Increase/decrease 94.60% 13.55% 74.29% 9.47% Increase/decrease in net income P87 P20 P101 P27
The following table sets out the carrying amount, by maturity, of the Company’s fi nancial instruments that are exposed to interest rate risk:
Interest Within Rates 1 Year 1-2 years 2-3 Years 3-4 years 4-5 Years Total
2007 Floating Rate: Long-term loan (Landbank) 4.60% – P667 P667 P666 – P2,000 Long-term loan (NORD in USD) 5.26% $40 $22 – – – $62 2006 Floating Rate: Long-term loan (Landbank) 6.10% – – P667 P667 P666 P2,000 Long-term loan (CTB) 7.40% P308 – – – – P308 Long-term loan (NORD in USD) 6.20% $28 $40 $22 – – $90 2005 Floating Rate: Long-term loan(Landbank) 7.20% P750 – – – – P750 Long-term loan (CTB) 8.00% P615 P308 – – – P923 Long-term loan(NORD in USD) 5.80% $10 $28 – $62 – $100
Interest on fi nancial instruments classifi ed as fl oating rate was reprised quarterly for the peso loans and quarterly or semi-annually for the U.S. dollar-denominated loans. Other fi nancial liabilities of the Company that were not included in the above tables were noninterest-bearing liabilities and fi xed rate loans and, therefore, not subject to interest rate risk.
The Company has interest-bearing assets of P7,502 as of December 31, 2007, P10,413 as of December 31, 2006 and P2,176 as of December 31, 2005, of which P7,034, P9,884 and P1,849, respectively, have maturities within 1 year (see Notes 4 and 6). Financial assets at FVPL are noninterest-bearing investments and are, therefore, not subject to interest rate volatility (see Note 5).
Credit RiskIn effectively managing credit risk, Petron regulates and extends credit only to qualifi ed and credit-worthy customers consistent with established Company credit polices, guidelines and credit verifi cation procedures. Request for credit lines from trade customers undergo stages of review between the Marketing and Finance Divisions, while approvals, which are based on amounts of credit lines requested, are vested among line managers and top management that include the President and the Chairman.
Generally, the maximum credit risk exposure of fi nancial assets is the carrying amount of the fi nancial assets as shown on the face of the statement of fi nancial position, as summarized below.
2007 2006 2005 Current fi nancial assets: Cash and cash equivalents P9,732 P11,735 P3,940 Receivables 17,869 15,629 11,863 Derivative assets (included as part of Other current assets) 100 58 60 Total current fi nancial assets 27,701 27,422 15,863 Noncurrent fi nancial assets AFS investments 468 529 327 Total fi nancial assets P28,169 P27,951 P16,190
Notes to Consolidated Financial Statements(With Comparative Figures For 2006 And 2005)(Amounts In Million Pesos, Except Par Value, Shares And Per Share Amounts, Exchange Rates, And Commodity Volumes)
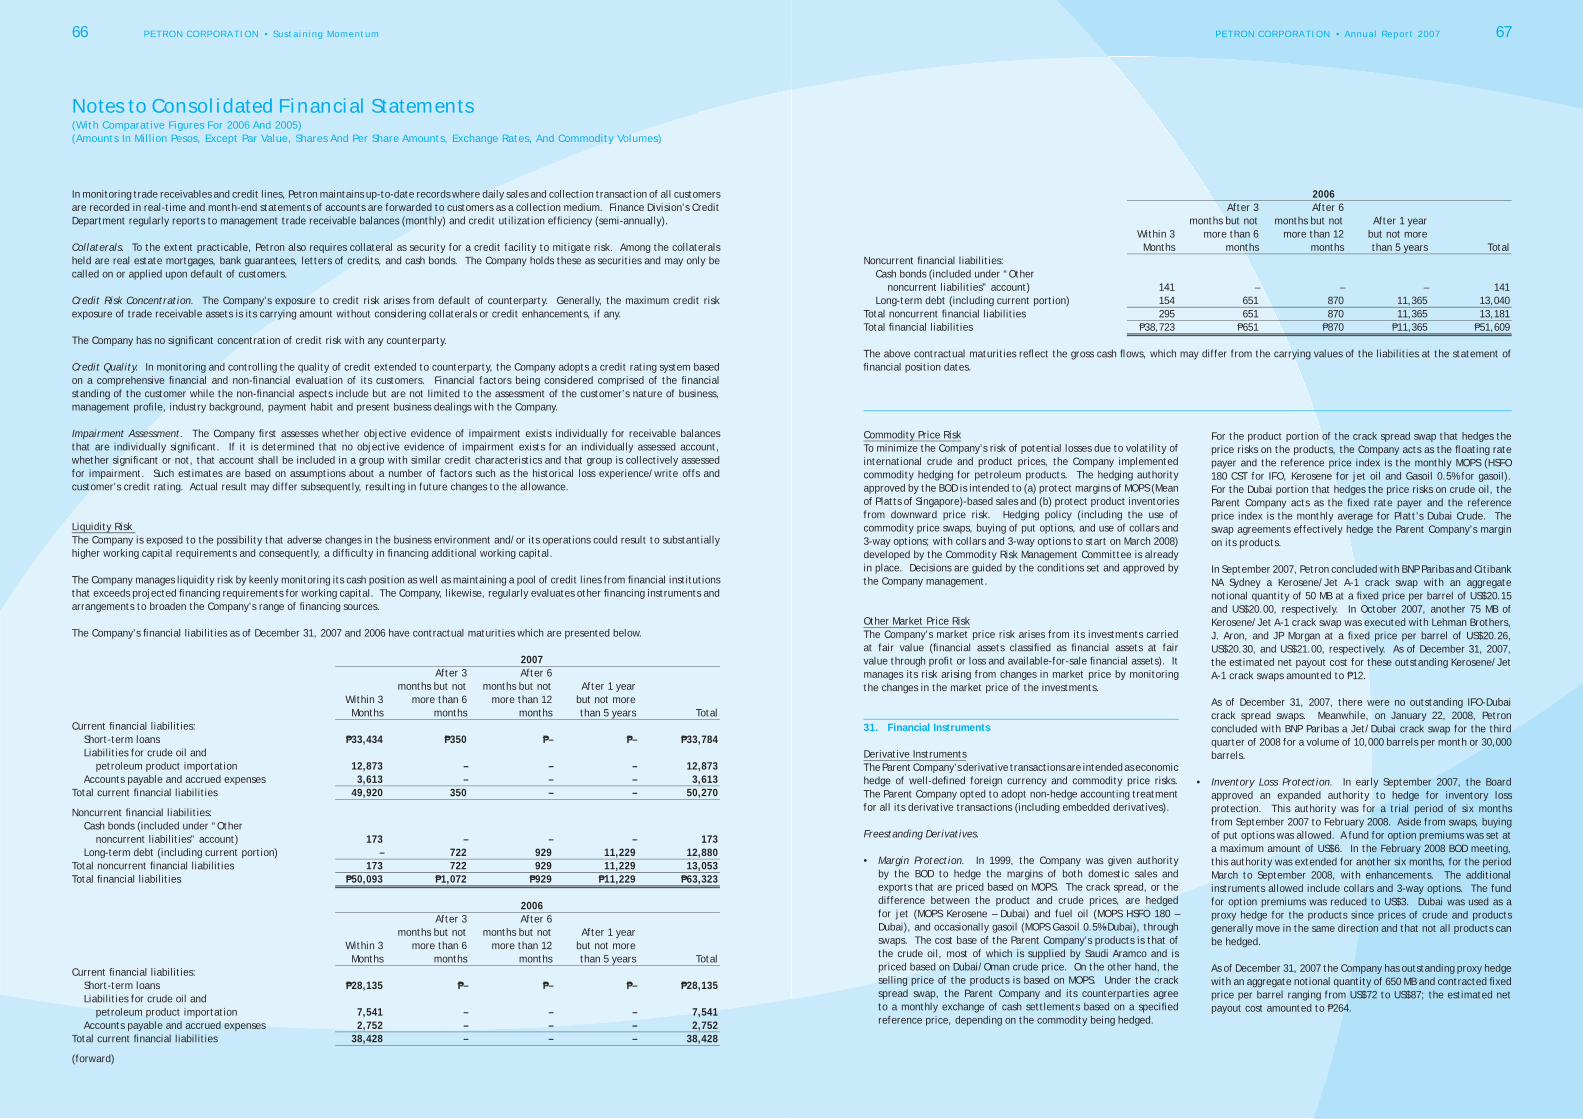
66 PETRON CORPORATION • Sustaining Momentum PETRON CORPORATION • Annual Report 2007 67
In monitoring trade receivables and credit lines, Petron maintains up-to-date records where daily sales and collection transaction of all customers are recorded in real-time and month-end statements of accounts are forwarded to customers as a collection medium. Finance Division’s Credit Department regularly reports to management trade receivable balances (monthly) and credit utilization effi ciency (semi-annually).
Collaterals. To the extent practicable, Petron also requires collateral as security for a credit facility to mitigate risk. Among the collaterals held are real estate mortgages, bank guarantees, letters of credits, and cash bonds. The Company holds these as securities and may only be called on or applied upon default of customers.
Credit Risk Concentration. The Company’s exposure to credit risk arises from default of counterparty. Generally, the maximum credit risk exposure of trade receivable assets is its carrying amount without considering collaterals or credit enhancements, if any.
The Company has no signifi cant concentration of credit risk with any counterparty.
Credit Quality. In monitoring and controlling the quality of credit extended to counterparty, the Company adopts a credit rating system based on a comprehensive fi nancial and non-fi nancial evaluation of its customers. Financial factors being considered comprised of the fi nancial standing of the customer while the non-fi nancial aspects include but are not limited to the assessment of the customer’s nature of business, management profi le, industry background, payment habit and present business dealings with the Company.
Impairment Assessment. The Company fi rst assesses whether objective evidence of impairment exists individually for receivable balances that are individually signifi cant. If it is determined that no objective evidence of impairment exists for an individually assessed account, whether signifi cant or not, that account shall be included in a group with similar credit characteristics and that group is collectively assessed for impairment. Such estimates are based on assumptions about a number of factors such as the historical loss experience/write offs and customer’s credit rating. Actual result may differ subsequently, resulting in future changes to the allowance.
Liquidity Risk The Company is exposed to the possibility that adverse changes in the business environment and/or its operations could result to substantially higher working capital requirements and consequently, a diffi culty in fi nancing additional working capital. The Company manages liquidity risk by keenly monitoring its cash position as well as maintaining a pool of credit lines from fi nancial institutions that exceeds projected fi nancing requirements for working capital. The Company, likewise, regularly evaluates other fi nancing instruments and arrangements to broaden the Company’s range of fi nancing sources.
The Company’s fi nancial liabilities as of December 31, 2007 and 2006 have contractual maturities which are presented below.
2007 After 3 After 6 months but not months but not After 1 year Within 3 more than 6 more than 12 but not more Months months months than 5 years TotalCurrent fi nancial liabilities: Short-term loans P33,434 P350 P– P– P33,784 Liabilities for crude oil and petroleum product importation 12,873 – – – 12,873 Accounts payable and accrued expenses 3,613 – – – 3,613Total current fi nancial liabilities 49,920 350 – – 50,270
Noncurrent fi nancial liabilities: Cash bonds (included under “Other noncurrent liabilities” account) 173 – – – 173 Long-term debt (including current portion) – 722 929 11,229 12,880Total noncurrent fi nancial liabilities 173 722 929 11,229 13,053Total fi nancial liabilities P50,093 P1,072 P929 P11,229 P63,323
2006 After 3 After 6 months but not months but not After 1 year Within 3 more than 6 more than 12 but not more Months months months than 5 years Total
Current fi nancial liabilities: Short-term loans P28,135 P– P– P– P28,135 Liabilities for crude oil and petroleum product importation 7,541 – – – 7,541 Accounts payable and accrued expenses 2,752 – – – 2,752Total current fi nancial liabilities 38,428 – – – 38,428
(forward)
2006 After 3 After 6 months but not months but not After 1 year Within 3 more than 6 more than 12 but not more Months months months than 5 years Total
Noncurrent fi nancial liabilities: Cash bonds (included under “Other noncurrent liabilities” account) 141 – – – 141 Long-term debt (including current portion) 154 651 870 11,365 13,040Total noncurrent fi nancial liabilities 295 651 870 11,365 13,181Total fi nancial liabilities P38,723 P651 P870 P11,365 P51,609
The above contractual maturities refl ect the gross cash fl ows, which may differ from the carrying values of the liabilities at the statement of fi nancial position dates.
Commodity Price RiskTo minimize the Company’s risk of potential losses due to volatility of international crude and product prices, the Company implemented commodity hedging for petroleum products. The hedging authority approved by the BOD is intended to (a) protect margins of MOPS (Mean of Platts of Singapore)-based sales and (b) protect product inventories from downward price risk. Hedging policy (including the use of commodity price swaps, buying of put options, and use of collars and 3-way options; with collars and 3-way options to start on March 2008) developed by the Commodity Risk Management Committee is already in place. Decisions are guided by the conditions set and approved by the Company management.
Other Market Price RiskThe Company’s market price risk arises from its investments carried at fair value (fi nancial assets classifi ed as fi nancial assets at fair value through profi t or loss and available-for-sale fi nancial assets). It manages its risk arising from changes in market price by monitoring the changes in the market price of the investments.
31. Financial Instruments
Derivative InstrumentsThe Parent Company’s derivative transactions are intended as economic hedge of well-defi ned foreign currency and commodity price risks. The Parent Company opted to adopt non-hedge accounting treatment for all its derivative transactions (including embedded derivatives).
Freestanding Derivatives.
• Margin Protection. In 1999, the Company was given authority by the BOD to hedge the margins of both domestic sales and exports that are priced based on MOPS. The crack spread, or the difference between the product and crude prices, are hedged for jet (MOPS Kerosene – Dubai) and fuel oil (MOPS HSFO 180 – Dubai), and occasionally gasoil (MOPS Gasoil 0.5%-Dubai), through swaps. The cost base of the Parent Company’s products is that of the crude oil, most of which is supplied by Saudi Aramco and is priced based on Dubai/Oman crude price. On the other hand, the selling price of the products is based on MOPS. Under the crack spread swap, the Parent Company and its counterparties agree to a monthly exchange of cash settlements based on a specifi ed reference price, depending on the commodity being hedged.
For the product portion of the crack spread swap that hedges the price risks on the products, the Company acts as the fl oating rate payer and the reference price index is the monthly MOPS (HSFO 180 CST for IFO, Kerosene for jet oil and Gasoil 0.5% for gasoil). For the Dubai portion that hedges the price risks on crude oil, the Parent Company acts as the fi xed rate payer and the reference price index is the monthly average for Platt’s Dubai Crude. The swap agreements effectively hedge the Parent Company’s margin on its products.
In September 2007, Petron concluded with BNP Paribas and Citibank NA Sydney a Kerosene/Jet A-1 crack swap with an aggregate notional quantity of 50 MB at a fi xed price per barrel of US$20.15 and US$20.00, respectively. In October 2007, another 75 MB of Kerosene/Jet A-1 crack swap was executed with Lehman Brothers, J. Aron, and JP Morgan at a fi xed price per barrel of US$20.26, US$20.30, and US$21.00, respectively. As of December 31, 2007, the estimated net payout cost for these outstanding Kerosene/Jet A-1 crack swaps amounted to P12.
As of December 31, 2007, there were no outstanding IFO-Dubai crack spread swaps. Meanwhile, on January 22, 2008, Petron concluded with BNP Paribas a Jet/Dubai crack swap for the third quarter of 2008 for a volume of 10,000 barrels per month or 30,000 barrels.
• Inventory Loss Protection. In early September 2007, the Board approved an expanded authority to hedge for inventory loss protection. This authority was for a trial period of six months from September 2007 to February 2008. Aside from swaps, buying of put options was allowed. A fund for option premiums was set at a maximum amount of US$6. In the February 2008 BOD meeting, this authority was extended for another six months, for the period March to September 2008, with enhancements. The additional instruments allowed include collars and 3-way options. The fund for option premiums was reduced to US$3. Dubai was used as a proxy hedge for the products since prices of crude and products generally move in the same direction and that not all products can be hedged.
As of December 31, 2007 the Company has outstanding proxy hedge with an aggregate notional quantity of 650 MB and contracted fi xed price per barrel ranging from US$72 to US$87; the estimated net payout cost amounted to P264.
Notes to Consolidated Financial Statements(With Comparative Figures For 2006 And 2005)(Amounts In Million Pesos, Except Par Value, Shares And Per Share Amounts, Exchange Rates, And Commodity Volumes)

68 PETRON CORPORATION • Sustaining Momentum PETRON CORPORATION • Annual Report 2007 69
• Foreign Exchange Loss Protection. The Parent Company also enters into deliverable and non-deliverable short-term currency forward contracts to hedge its foreign currency exposure on crude oil importations.
There were no outstanding currency forward contracts as of December 31, 2007. On the other hand, as of December 31, 2006 and 2005, the Company had outstanding currency forward contracts with an aggregate notional amount of US$109 and US$45, respectively and weighted average contracted forward rate of P49.704 to US$1.00 and P53.206 to US$1.00, respectively. The net fair value loss on these currency forward contracts as of December 31, 2006 and 2005 amounted to P64 and P5, respectively.
Embedded Derivatives.
Embedded foreign currency derivatives exist in certain U.S. dollar-denominated sales and purchase contracts for various fuel products of the Parent Company. Under the sales contracts, the Parent Company agrees to fi x the peso equivalent of the invoice amount based on the average Philippine Dealing System (PDS) rate on the month of delivery. In the purchase contracts, the peso equivalent is determined using the average PDS rate on the month preceding the month of delivery. The net fair value gain on these transactions as of December 31, 2007, 2006 and 2005 amounted to P98, P58 and P60, respectively.
Fair Value Changes on DerivativesThe net movements in fair value changes of all derivative transactions in 2007 and 2006 are as follows:
Mark-to-market Gain (Loss ) Fair values at January 1, 2007 (P6 ) Net changes in fair value during the year (see Note 21) (603 ) Fair value of settled instruments 707 Balance at December 31, 2007 P98
Fair values at January 1, 2006 P55 Net changes in fair value during the year (see Note 21) (279 ) Fair value of settled instruments 218 Balance at December 31, 2006 (P6 )
Included in the consolidated statement of fi nancial position as follows:
2007 2006 2005 Derivative assets (included under Other current assets) P100 P58 P60 Derivative liabilities (see Note 13) (2 ) (64 ) (5 ) Net P98 (P6 ) P55
The following table sets forth the carrying values and estimated fair values of the Company’s fi nancial assets and liabilities:
2007 2006 2005 Carrying Value Fair Value Carrying Value Fair Value Carrying Value Fair Value
Current fi nancial assets: Cash and cash equivalents P9,732 P9,732 P11,735 P11,735 P3,940 P3,940 Financial assets at FVPL 229 229 180 180 116 116 AFS investments 164 164 103 103 259 259 Receivables 17,869 17,869 15,629 15,629 11,863 11,863 Derivative assets 100 100 58 58 60 60Total current fi nancial assets 28,094 28,094 27,705 27,705 16,238 16,238Noncurrent fi nancial assets AFS investments 468 468 529 529 327 327Total fi nancial assets P28,562 P28,562 P28,234 P28,234 P16,565 P16,565Current fi nancial liabilities: Short-term loans P33,784 P33,784 P28,135 P28,135 P21,407 P21,407 Liabilities for crude oil andpetroleum product importation 12,873 12,873 7,541 7,541 7,911 7,911 Accounts payable and accrued expenses 3,612 3,612 2,752 2,752 1,883 1,883Total current fi nancial liabilities 50,269 50,269 38,428 38,428 31,201 31,201Noncurrent fi nancial liabilities: Cash bonds (see Note 15) 173 163 141 135 119 98 Long-term debt (including current portion) 12,780 11,163 12,912 12,973 6,931 7,032Total noncurrent fi nancial liabilities 12,953 11,326 13,053 13,108 7,050 7,130Total fi nancial liabilities P63,222 P61,595 P51,481 P51,536 P38,251 P38,331
The following methods and assumptions were used to estimate the fair value of each class of fi nancial instruments for fi nancial assets and which it is practicable to estimate such value:
Financial Assets at FVPL and AFS Investments. Market values have been used to determine the fair values of traded government securities and equity shares. Market value is determined by reference to the Insurance Commission (IC) and stock exchange quoted market bid prices at the close of business on the statement of fi nancial position date.
Derivative Assets and Liabilities. The fair values of freestanding and bifurcated forward currency transactions are calculated by reference to current forward exchange rates for contracts with similar maturity profi les.
Cash Bonds. Fair value is estimated as the present value of all future cash fl ows discounted using the applicable rates for similar types of instruments. Discount rates used in 2007, 2006 and 2005 are 5.76%, 5.69% and 9.97%, respectively. Long-term Debt - Floating Rate. For variable rate loans that reprice every three months, the carrying value approximates the fair value because of recent and regular repricing based on current market rates. For variable rate loans that reprice every six months, the fair value is determined by discounting, the principal amount plus the next interest payment, using the prevailing market rate for the period up to the next repricing date. Average discount rates used in 2007, 2006 and 2005 are 6.305%, 5.142% and 4.411%, respectively.
Other Financial Assets and Liabilities. Due to the short-term nature of the transactions, the fair values of cash and cash equivalents, receivables, short-term loans, liabilities for crude oil and petroleum product importation and accounts payable and accrued expenses approximate the carrying amounts as of the statement of fi nancial position date.
32. Registration with the BOI
Mixed Xylene PlantPetron is registered with the BOI under the New Omnibus Investments Code of 1987 (Executive Order 226) as a pioneer, new producer status of Mixed Xylene. Under the terms of its registration, Petron is subject to certain requirements principally that of producing required metric tons of Mixed Xylene every year.
As a registered enterprise, Petron is entitled to the following benefi ts on its Mixed Xylene operations:
a. Income Tax Holiday (ITH) for six years from actual start of Mixed Xylene commercial operations (December 1999) until 2005. On May 10, 2005, the BOI approved Petron’s application under Certifi cate of Registration No. DP98-148, for the one year extension of its ITH incentive. The approved bonus year is for the period December 5, 2005 to December 4, 2006;
b. Tax credits for taxes on duties on raw materials and supplies used for its export products and forming parts thereof; and,
c. Simplifi ed custom procedures and others.
Isomerization and Gas Oil Hydrotreater UnitsIn On January 7, 2004, the BOI approved Petron’s application under RA No. 8479, otherwise known as the Downstream Oil Industry Deregulation Act (RA No. 8479), for new investments at its Bataan Refi nery for an Isomerization Unit and a Gas Oil Hydrotreater (Project). The BOI is extending the following major incentives:
a. ITH for fi ve years without extension or bonus year from January 2005 for the Project and March 2005 for LVN Isomerization or actual start of commercial operations, whichever is earlier;
b. Duty of three percent and VAT on imported capital equipment and accompanying spare parts;
c. Tax credit on domestic capital equipment on locally fabricated capital equipment which is equivalent to the difference between the tariff rate and the three percent duty imposed on the imported counterpart;
d. Exemption from taxes and duties on imported spare parts for consigned equipment with bonded manufacturing warehouse;
e. Exemption from real property tax on production equipment or machinery; and,
f. Exemption from contractor’s tax.
Mixed Xylene, Benzene, Toluene (BTX) and Propylene Recovery UnitsOn October 20, 2005, Petron registered with the BOI under the Omnibus Investments Code of 1987 (Executive Order 226) as (1) a non-pioneer, new export producer status of Mixed Xylene; (2) a pioneer, new export producer status of Benzene and Toluene; and (3) a pioneer, new domestic producer status of Propylene. Under the terms of its registration, Petron is subject to certain requirements principally that of exporting at least seventy percent (70%) of the production of the mentioned petrochemical products every year except for the produced propylene.
As a registered enterprise, Petron is entitled to the following benefi ts on its production of petroleum products used as petrochemical feedstock :
a. ITH (1) for four years from May 2008 or actual start of commercial operations, whichever is earlier, but in no case earlier than the date of registration for Mixed Xylene subject to base fi gure of 120,460 metric tons per year representing Petron’s highest attained production volume for the last three (3) years; (2) for six years from May 2008 or actual start of commercial operations, whichever is earlier, but in no case earlier than the date of registration for Benzene and Toluene; and (3) for six years from December 2007 or actual start of commercial operations, whichever is earlier, but in no case earlier than the date of registration for Propylene;
Notes to Consolidated Financial Statements(With Comparative Figures For 2006 And 2005)(Amounts In Million Pesos, Except Par Value, Shares And Per Share Amounts, Exchange Rates, And Commodity Volumes)

70 PETRON CORPORATION • Sustaining Momentum PETRON CORPORATION • Annual Report 2007 71
b. Tax credit equivalent to the national internal revenue taxes and duties paid on raw materials and supplies and semi-manufactured products used in producing its export product and forming parts thereof for ten years from start of commercial operations;
c. Simplifi cation of custom procedures;
d. Access to Customs Bonded Manufacturing Warehouse (CBMW) subject to Custom rules and regulations provided fi rm exports at least 70% of production output;
e. Exemption from wharfage dues, any export tax, duty, imposts and fees for a ten (10) year period from date of registration;
f. Importation of consigned equipment for a period of ten (10) years from the date of registration subject to the posting of re-export bond;
g. Exemption from taxes and duties on imported spare parts and consumable supplies for export producers with CBMW exporting at least 70% of production; and,
h. The fi rm may qualify to import capital equipment, spare parts, and accessories at zero duty from date of registration up to June 5, 2006 pursuant to Executive Order No. 313 and its Implementing Rules and Regulations.
Fluidized Bed Catalytic Cracker (PetroFCC) UnitOn December 20, 2005, the BOI approved Petron’s application under RA No. 8479 for new investment at its Bataan Refi nery for the PetroFCC (see Note 10). Subject to Petron’s compliance with the terms and conditions of registration, the BOI is extending the following major incentives:
a. ITH for fi ve years without extension or bonus year from December 2007 or actual start of commercial operations, whichever is earlier, but in no case earlier than the date of registration subject to a rate of exemption computed based on the % share of product that are subject to retooling;
b. Minimum duty of three percent and VAT on imported capital equipment and accompanying spare parts;
c. Tax credit on domestic capital equipment shall be granted on locally fabricated capital equipment. This shall be equivalent to the difference between the tariff rate and the three percent (3%) duty imposed on the imported counterpart;
d. Importation of consigned equipment for a period of fi ve (5) years from date of registration subject to posting of the appropriate re-export bond; provided that such consigned equipment shall be for the exclusive use of the registered activity;
e. Exemption from taxes and duties on imported spare parts for consigned equipment with bonded manufacturing warehouse;
f. Exemption from real property tax on production equipment or machinery; and,
g. Exemption from contractor’s tax.
Grease Manufacturing PlantIn December 2005, the BOI approved Petron’s application under RA No. 8479 as an Existing Industry Participant with New Investment in Modernization of the fi rm’s Grease Manufacturing Plant in Pandacan, Manila. The BOI is extending the following major incentives:
a. ITH for a period of fi ve years without extension or bonus year from March 2006 or actual start of commercial operations, whichever is earlier, but in no case earlier than the date of registration subject to base fi gure of 845 metric tons of grease product representing Petron’s highest attained sales volume prior to rehabilitation;
b. Minimum duty of three percent and VAT on imported capital equipment, machinery and accompanying spare parts;
c. Tax credit on domestic capital equipment on locally fabricated capital equipment which is equivalent to the difference between the tariff rate and the three percent duty imposed on the imported counterpart;
d. Importation of consigned equipment for a period of fi ve (5) years from date of registration subject to posting of the appropriate re-export bond; provided that such consigned equipment shall be for the exclusive use of the registered activity;
e. Exemption from taxes and duties on imported spare parts for consigned equipment with bonded manufacturing warehouse;
f. Exemption from real property tax on production equipment or machinery; and,
g. Exemption from contractor’s tax.
Petron has availed of ITH credits amounting to P163 in 2007, P736 in 2006, and P440 in 2005.
33. Segment Information
The Company’s operating businesses are organized and managed according to the nature of the products marketed, with each segment representing a strategic business unit that offers different products and serves different markets.
The Company’s major sources of revenues are as follows:
a. Sales from petroleum and other related products which include gasoline, diesel and kerosene offered to motorists and public transport operators through its service station network around the country;
b. Insurance premiums from the business and operation of all kinds of insurance and reinsurance, on sea as well as on land, of properties, goods and merchandise, of transportation or conveyance, against fi re, earthquake, marine perils, accidents and all other forms and lines of insurance authorized by law, except life insurance;
c. Lease of acquired real estate properties for petroleum, refi ning, storage and distribution facilities, gasoline service stations and other related structures;
d. Sales on wholesale or retail and operation of service stations, retail outlets, restaurants, convenience stores and the like; and,
e. Export sales of various petroleum products to other Asian countries such as Cambodia, South Korea, China, and Australia.
The following tables present revenue and income information and certain asset and liability information regarding the business segments for the years ended December 31, 2007, 2006 and 2005. Segment assets and liabilities exclude deferred tax assets and liabilities.
Petroleum Insurance Leasing Marketing Elimination Total
Year Ended December 31, 2007 Revenue: External sales P207,621 P– P– P2,899 P– P210,520 Inter-segment sales 2,201200 158 182 – (2,5410 ) – Segment results 9,227 134 161 86 300 9,908 Net income 6,113 177 94 82 (70 ) 6,396Assets and liabilities: Segment assets 102,241 1,512 2,619 1,073 (2,970 ) 104,475 Segment liabilities 64,962 262 1,942 534 (2,282 ) 65,418Other segment information: Property, plant and equipment 30,912 1 1 597 2,617 34,128 Depreciation and amortization 2,467 – – 49 – 2,516
Year Ended December 31, 2006 Revenue: External sales 209,395 – – 2,331 – 211,726 Inter-segment sales 1,777 110 170 – (2,057 ) – Segment results 9,101 85 151 78 315 9,730 Net income 5,944 143 37 75 (181 ) 6,018Assets and liabilities: Segment assets 85,421 1,541 2,507 850 (2,804 ) 87,515 Segment liabilities 53,268 353 1,924 394 (2,119 ) 53,820Other segment information: Property, plant and equipment 22,193 1 1 467 2,491 25,153 Depreciation and amortization 2,436 – – 41 5 2,482
Year Ended December 31, 2005 Revenue: External sales 190,346 – – 1,143 – 191,489 Inter-segment sales 882 146 159 – (1,187 ) – Segment results 9,186 120 145 21 280 9,752 Net income 5,765 166 34 29 57 6,051Assets and liabilities: Segment assets 67,185 1,366 2,347 587 (2,602 ) 68,883 Segment liabilities 39,519 150 1,800 205 (1,919 ) 39,755Other segment information: Property, plant and equipment 19,797 1 1 429 2,342 22,570 Depreciation and amortization 2,315 – – 20 – 2,335
Intersegment sales transactions amounted to P2,541540, P2,057 and P1,187 as of December 31, 2007, 2006 and 2005, respectively, which is less than 2% of the total revenues for the years ended 2007, 2006 and 2005, respectively.
Notes to Consolidated Financial Statements(With Comparative Figures For 2006 And 2005)(Amounts In Million Pesos, Except Par Value, Shares And Per Share Amounts, Exchange Rates, And Commodity Volumes)
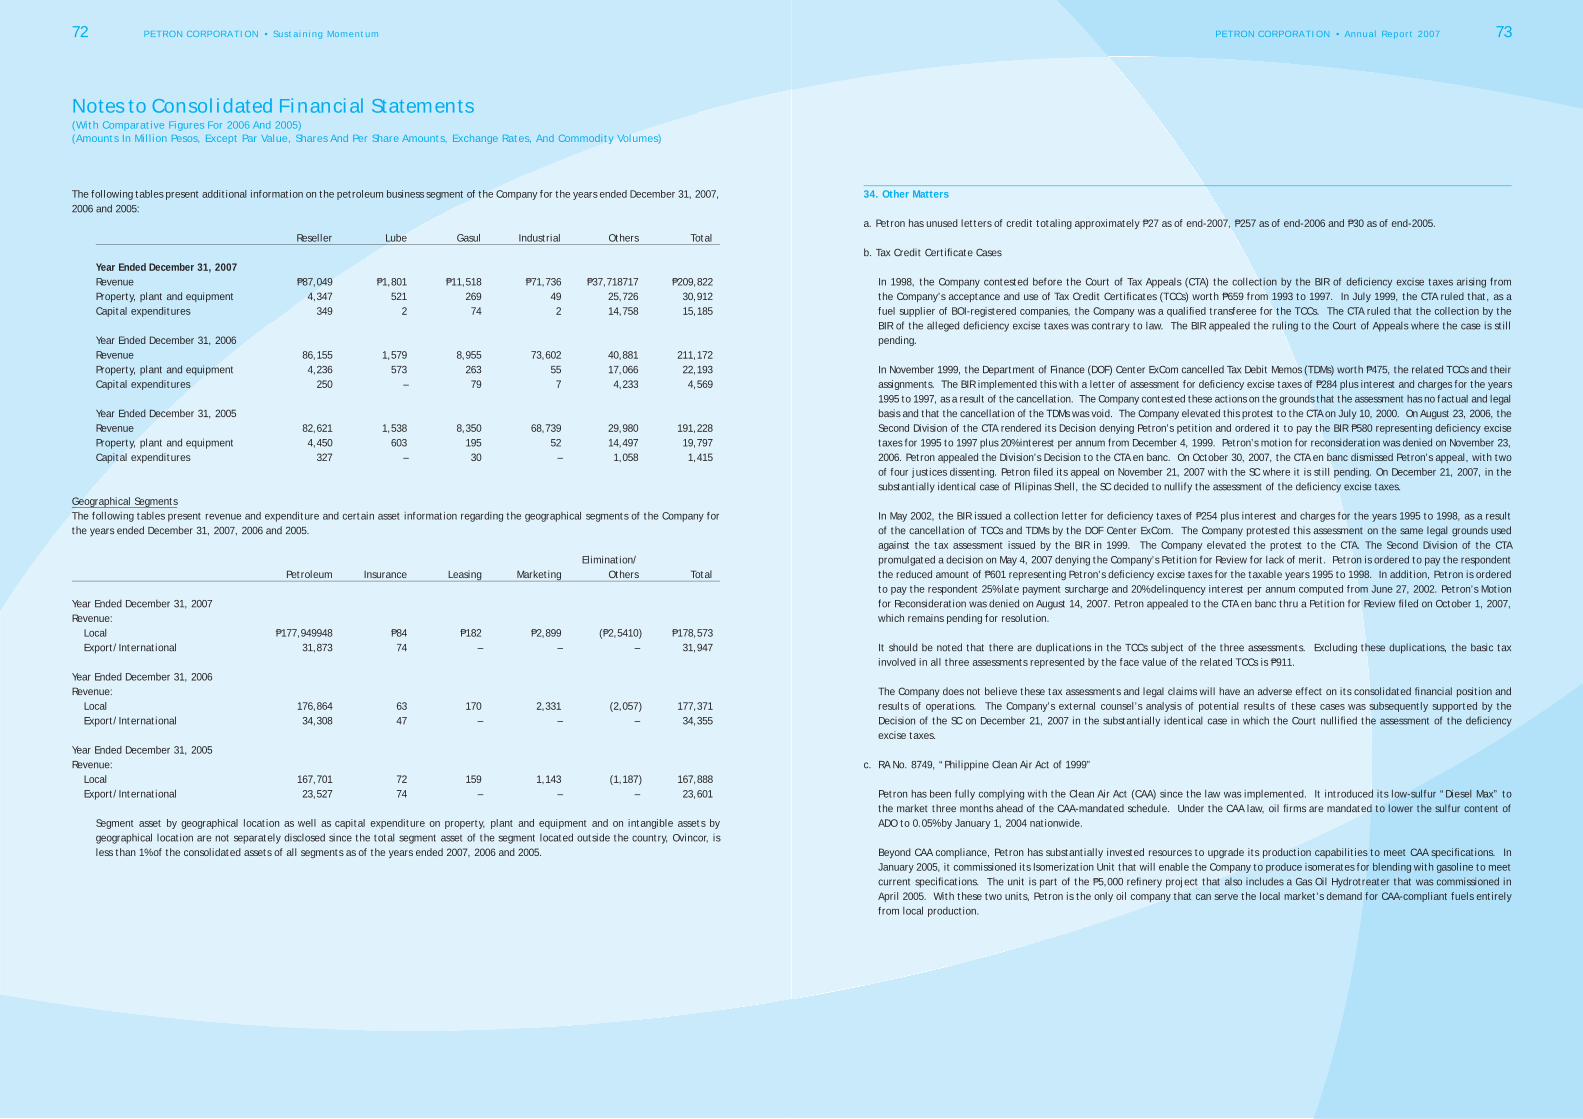
72 PETRON CORPORATION • Sustaining Momentum PETRON CORPORATION • Annual Report 2007 73
The following tables present additional information on the petroleum business segment of the Company for the years ended December 31, 2007, 2006 and 2005:
Reseller Lube Gasul Industrial Others Total
Year Ended December 31, 2007 Revenue P87,049 P1,801 P11,518 P71,736 P37,718717 P209,822Property, plant and equipment 4,347 521 269 49 25,726 30,912Capital expenditures 349 2 74 2 14,758 15,185
Year Ended December 31, 2006 Revenue 86,155 1,579 8,955 73,602 40,881 211,172Property, plant and equipment 4,236 573 263 55 17,066 22,193Capital expenditures 250 – 79 7 4,233 4,569
Year Ended December 31, 2005 Revenue 82,621 1,538 8,350 68,739 29,980 191,228Property, plant and equipment 4,450 603 195 52 14,497 19,797Capital expenditures 327 – 30 – 1,058 1,415
Geographical SegmentsThe following tables present revenue and expenditure and certain asset information regarding the geographical segments of the Company for the years ended December 31, 2007, 2006 and 2005.
Elimination/ Petroleum Insurance Leasing Marketing Others Total
Year Ended December 31, 2007 Revenue: Local P177,949948 P84 P182 P2,899 (P2,5410 ) P178,573 Export/International 31,873 74 – – – 31,947
Year Ended December 31, 2006 Revenue: Local 176,864 63 170 2,331 (2,057 ) 177,371 Export/International 34,308 47 – – – 34,355
Year Ended December 31, 2005 Revenue: Local 167,701 72 159 1,143 (1,187 ) 167,888 Export/International 23,527 74 – – – 23,601
Segment asset by geographical location as well as capital expenditure on property, plant and equipment and on intangible assets by geographical location are not separately disclosed since the total segment asset of the segment located outside the country, Ovincor, is less than 1% of the consolidated assets of all segments as of the years ended 2007, 2006 and 2005.
34. Other Matters
a. Petron has unused letters of credit totaling approximately P27 as of end-2007, P257 as of end-2006 and P30 as of end-2005.
b. Tax Credit Certifi cate Cases
In 1998, the Company contested before the Court of Tax Appeals (CTA) the collection by the BIR of defi ciency excise taxes arising from the Company’s acceptance and use of Tax Credit Certifi cates (TCCs) worth P659 from 1993 to 1997. In July 1999, the CTA ruled that, as a fuel supplier of BOI-registered companies, the Company was a qualifi ed transferee for the TCCs. The CTA ruled that the collection by the BIR of the alleged defi ciency excise taxes was contrary to law. The BIR appealed the ruling to the Court of Appeals where the case is still pending.
In November 1999, the Department of Finance (DOF) Center ExCom cancelled Tax Debit Memos (TDMs) worth P475, the related TCCs and their assignments. The BIR implemented this with a letter of assessment for defi ciency excise taxes of P284 plus interest and charges for the years 1995 to 1997, as a result of the cancellation. The Company contested these actions on the grounds that the assessment has no factual and legal basis and that the cancellation of the TDMs was void. The Company elevated this protest to the CTA on July 10, 2000. On August 23, 2006, the Second Division of the CTA rendered its Decision denying Petron’s petition and ordered it to pay the BIR P580 representing defi ciency excise taxes for 1995 to 1997 plus 20% interest per annum from December 4, 1999. Petron’s motion for reconsideration was denied on November 23, 2006. Petron appealed the Division’s Decision to the CTA en banc. On October 30, 2007, the CTA en banc dismissed Petron’s appeal, with two of four justices dissenting. Petron fi led its appeal on November 21, 2007 with the SC where it is still pending. On December 21, 2007, in the substantially identical case of Pilipinas Shell, the SC decided to nullify the assessment of the defi ciency excise taxes.
In May 2002, the BIR issued a collection letter for defi ciency taxes of P254 plus interest and charges for the years 1995 to 1998, as a result of the cancellation of TCCs and TDMs by the DOF Center ExCom. The Company protested this assessment on the same legal grounds used against the tax assessment issued by the BIR in 1999. The Company elevated the protest to the CTA. The Second Division of the CTA promulgated a decision on May 4, 2007 denying the Company’s Petition for Review for lack of merit. Petron is ordered to pay the respondent the reduced amount of P601 representing Petron’s defi ciency excise taxes for the taxable years 1995 to 1998. In addition, Petron is ordered to pay the respondent 25% late payment surcharge and 20% delinquency interest per annum computed from June 27, 2002. Petron’s Motion for Reconsideration was denied on August 14, 2007. Petron appealed to the CTA en banc thru a Petition for Review fi led on October 1, 2007, which remains pending for resolution.
It should be noted that there are duplications in the TCCs subject of the three assessments. Excluding these duplications, the basic tax
involved in all three assessments represented by the face value of the related TCCs is P911.
The Company does not believe these tax assessments and legal claims will have an adverse effect on its consolidated fi nancial position and results of operations. The Company’s external counsel’s analysis of potential results of these cases was subsequently supported by the Decision of the SC on December 21, 2007 in the substantially identical case in which the Court nullifi ed the assessment of the defi ciency excise taxes.
c. RA No. 8749, “Philippine Clean Air Act of 1999”
Petron has been fully complying with the Clean Air Act (CAA) since the law was implemented. It introduced its low-sulfur “Diesel Max” to the market three months ahead of the CAA-mandated schedule. Under the CAA law, oil fi rms are mandated to lower the sulfur content of ADO to 0.05% by January 1, 2004 nationwide.
Beyond CAA compliance, Petron has substantially invested resources to upgrade its production capabilities to meet CAA specifi cations. In January 2005, it commissioned its Isomerization Unit that will enable the Company to produce isomerates for blending with gasoline to meet current specifi cations. The unit is part of the P5,000 refi nery project that also includes a Gas Oil Hydrotreater that was commissioned in April 2005. With these two units, Petron is the only oil company that can serve the local market’s demand for CAA-compliant fuels entirely from local production.
Notes to Consolidated Financial Statements(With Comparative Figures For 2006 And 2005)(Amounts In Million Pesos, Except Par Value, Shares And Per Share Amounts, Exchange Rates, And Commodity Volumes)
74 PETRON CORPORATION • Sustaining Momentum PETRON CORPORATION • Annual Report 2007 75
d. Pandacan Terminal Operations
The City Council of Manila, citing concerns of safety, security, and health, passed City Ordinance No. 8027 reclassifying the areas occupied by the oil terminals of Petron, Shell, and Chevron from Industrial to Commercial, making the operation of the terminals therein unlawful. Simultaneous with efforts to address the concerns of the City Council with the implementation of a scale down program to reduce tankage capacities and joint operation of facilities with Shell and Chevron, Petron fi led this petition to annul city Ordinance No. 8027 and enjoin the City Council of Manila, as well as Mayor Joselito Atienza from implementing the same.
A status quo order is in effect and the case is under mediation proceedings. Recently, the City of Manila approved the Comprehensive Land Use Plan and Zoning Ordinance (CLUPZO) (Ordinance No. 8119) that allows Petron a seven-year grace period. The passage of Ordinance No. 8119 effectively repealed Manila Ordinance No. 8027 and is in fact now being implemented by the City of Manila. On March 7, 2007, the SC rendered a Decision in the case of SJS Society vs. Atienza, directing the Mayor of Manila to immediately enforce Ordinance No. 8027.
On March 12, 2007, Petron, together with Shell and Chevron, fi led an Urgent Motion for Leave to Intervene and Urgent Motion to Admit Motion for Reconsideration of the decision dated March 7, 2007, citing that the SC failed to consider supervising events, notably (i) the passage of Ordinance No. 8119 which supersedes Ordinance No. 8027, as well as (ii) the writs of injunction from the RTC presenting the implementation of Ordinance No. 8027, the SC’s decision and the enforcement of Ordinance No. 8027 improper. Further, Petron, Shell, and Chevron noted the ill-effects of the sudden closure of the Pandacan Terminals on the entire country.
On March 22, 2007, the Department of Energy likewise fi led a motion for the government to intervene and supported the oil companies’ position. On March 23, 2007, Petron received an order from the SC ordering the parties to fi le their comments and setting the same for oral arguments. This order in effect, stayed any action by the City of Manila. The oral argument was held on April 11, 2007. Petron, together with Shell and Chevron, fi led its Memorandum dated May 4, 2007.
As a result of the passage of Ordinance No. 8119, on April 23, 2007, upon motion of Petron, Mayor of Manila and the City Council, on the ground that the issues raised in said case became academic; the RTC dismissed the case fi led by Petron questioning Ordinance No. 8027.
On February 13, 2008, the SC allowed the oil companies’ intervention but denied their motion for reconsideration, declaring Manila City Ordinance No. 8027 valid and applicable to the Oil Terminals. The Court dissolved all existing injunctions against the implementation of the ordinance and directed the oil companies to submit their relocation plans to the Regional Trial Court within 90 days to determine, among others, the reasonableness of the time frame for relocation. On February 28, 2008, the Company, jointly with Chevron and Shell, fi led its motion for reconsideration of the Resolution.
Notwithstanding that the SC resolution is not yet fi nal; the Company is already in the processes of fi nalizing the study of its various alternatives. Further, the Company believes that an adverse ruling will not have any material impact to the Company’s profi tability.
e. Navotas Business Tax Case
In the case of Petron vs. Mayor Tobias Tiangco concerning the imposition of business tax for the sale of diesel at the Navotas Bulk Plant, the TRO issued by the SC is still in effect and will prevent the closure of the Bulk Plant until the case is decided by the SC.
f. Oil Spill Incident in Guimaras
M/T Solar I sank in rough seas in the afternoon of August 11, 2006 en route to Zamboanga, loaded with about two million liters of industrial fuel oil. It now lies about 640 meters beneath the sea, at approximately 13 nautical miles southwest of Guimaras.
Petron immediately dispatched its oil spill gear, equipment and oil spill teams upon receiving information of the incident. An aerial and surface assessment was conducted to determine the extent of the oil spill.
Inspection by the Survey Ship Shinsei Maru (Shinsei Maru), using a remote-operated vehicle (ROV), found the vessel upright and in stable condition with minimal traces of leakage. All cargo compartment valves were tightened by the ROV to ensure against further leakage. The Shinsei Maru was contracted by the Protection and Indemnity (P & I) Club and the International Oil Pollution Compensation (IOPC) from Fukada Salvage & Marine Works Co. Ltd.
On separate investigations conducted by the Special Task Force on Guimaras by the Department of Justice (DOJ) and the Special Board of Marine Inquiry (SBMI), both found the owners of M/T Solar I, Sunshine Marine Development Corporation (SMDC), liable. The DOJ found no criminal liability on the part of Petron. However, the SBMI found Petron to have overloaded the vessel. Petron has appealed the fi ndings of the SBMI to the Department of Transportation and Communication and is awaiting its resolution.
The Company implemented a “Cash for Work” program involving residents of the affected areas in the clean-up operations, providing them with a daily allowance. The Company also mobilized its employees to assist in the operations. By the middle of November 2006, Petron had cleaned up all affected shorelines and was affi rmed by the inspections made by Task Force Solar I Oil Spill (SOS), a multi-agency group composed of offi cials from the Local Government Units, Department of Health, Department of Environment and Natural Resources, Department of Social Welfare and Development (DSWD), and the Philippine Coast Guard.
The Company collected a total of 6,000 metric tons of debris which were brought to the Holcim Cement facility in Lugait, Misamis Occidental Oriental for processing/treatment of waste. On November 20, 2006, one of the last barge shipments of oil debris unfortunately sank en route to the same plant.
The Company is working closely with the provincial government, DSWD, Department of Agriculture, Technical Education and Skills Development Authority and the Philippine Business for Social Progress in developing livelihood programs for the local community. Last November 27, 2006, Petron held a scientifi c conference in cooperation with the University of the Philippines - Visayas, the National Disaster Coordinating Council, the World Wildlife Fund and the Guimaras Provincial Government with the objective of developing an integrated assessment and protocol for the rehabilitation of the province. On top of providing alternative livelihood for affected Guimarasnons, the Company has established programs and facilities aimed at helping improve basic education in the province. Among the interventions along this line were the construction of the Petron School in Nueva Valencia and the establishment of Petron Library Hub in Jordan, both of which were inaugurated on June 15, 2007. To complement these educational facilities, the Company has put in place internet connectivity in all the public high schools and Department of Education facilities in Guimaras.
The Company also established a mari-culture park at the Southeast Asian Fisheries Development Center (SEAFDEC) area in the town of Nueva Valencia in August 2007. Several representatives from nearby barangays received hands-on training including the construction of fi sh cages, stocking of fi ngerlings, feeding, maintenance work on the fi sh cages, harvesting and packaging for shipment to ensure that the program is sustainable.
With regard to the retrieval of the remaining oil still trapped in M/T Solar I, the P & I Club contracted a sub-sea systems technology provider (Sonsub) to recover the oil from the sunken vessel. The recovery vessel, Allied Shield, arrived at Bacolod Real Estate Development Corporation Pier in Bacolod City last March 10, 2007. After unloading the ISO-certifi ed tanks and hoses, the vessel proceeded to the site ion March 11, 2007. Oil recovery operation was technically completed on April 1, 2007. A total of 9,000 liters of oil was recovered.
Petron has fi led a total of P217 against the IOPC as of December 31, 2007. A total of P118 have been paid to the Company. The recent installment was collected last April 30, 2007. As of December 31, 2007, total outstanding claims from IOPC amounted to P99.
Total expenses incurred were P15 in 2007 and P122 in 2006, net of P105 reimbursements (see Note 18).
Notes to Consolidated Financial Statements(With Comparative Figures For 2006 And 2005)(Amounts In Million Pesos, Except Par Value, Shares And Per Share Amounts, Exchange Rates, And Commodity Volumes)
76 PETRON CORPORATION • Sustaining Momentum PETRON CORPORATION • Annual Report 2007 77
List of Banks and Financial Institutions
ABN AMRO Bank
Allied Banking Corporation
Arab Petroleum Investments
Australia and New Zealand Banking Group, Ltd.
Ayala Life Assurance
Banco de Oro
Bank of Butterfi eld
Bank of China
Bank of the Philippine Islands
BNP Paribas
BPI Capital Corporation
Calyon Corporate and Investment Bank
Cathay United Bank
China Banking Corporation
Chinatrust Commercial Bank Corporation
Citibank, N. A.
Citicorp International Limited
Deutsche Bank
DZ Bank AG Deutsche Zentral-Genossenschaftsbank
Development Bank of the Philippines
First Metro Investment Corporation
ING Bank, N. V., Manila Branch
Insular Life Assurance Co.
JP Morgan Chase Bank, N.A.
Land Bank of the Philippines
Maybank Philippines, Inc.
Mega International Commercial Bank Co., Ltd.
Metropolitan Bank and Trust Company
Mizuho Corporate Bank, Ltd.
Norddeutsche Landesbank Girozentrale, Singapore
PCI Capital Corporation
Philippine National Bank
Pioneer Life, Inc.
Rizal Commercial Banking Corporation
Robinson’s Savings Bank
Samba Financial Group
SB Capital Investment Corporation
Schroeders (Bermuda), Ltd.
Security Bank Corporation
Societe Generale
Standard Chartered Bank
The Bank of Bermuda, Ltd.
The Bank of Tokyo-Mitsubishi UFJ, Ltd.
The Hongkong and Shanghai Banking Corporation, Ltd.
The Saudi Investment Bank
Union Bank of the Philippines
United Coconut Planters Bank
g. Bataan Real Property Tax Cases
On August 21, 2007, Bataan Provincial Treasurer issued a Final Notice of Delinquent Real Property Tax requiring Petron to settle the amount of P2,168 allegedly in delinquent real property taxes as of September 30, 2007.
Petron had previously contested the assessments subject of the Notice of Delinquent Real Property Taxes, appealed the same to the Local Board of Assessment Appeals (LBAA), and posted the necessary surety bonds to stop collection of the assessed amount. Petron contested the fi rst assessment covering the Isomerization and Gas Oil Hydrotreater (GOHT3) Facilities of Petron which enjoy, among others, a fi ve-year real property tax exemption under the Oil Deregulation Law (RA 8479) per Board of Investments Certifi cates of Registration. The second assessment is based on alleged non-declaration by Petron of machineries and equipment in its Bataan refi nery for real property tax purposes and/or paid the proper taxes thereon since 1994. Petron questioned this second assessment on the ground among others that: there was no non-declaration; back taxes can be assessed only for a maximum of 10 years, even assuming fraud; erroneous valuations were used; some adjustments like asset retirement and non-use were not considered; some assets were taken up twice in the assessments; and some assets enjoyed real property tax exemptions.
Notwithstanding the appeal to the LBAA and the posting of the surety bond, the Provincial Treasurer of Bataan proceeded with the publication of the Public Auction of the assets of Petron, which was set for October 17, 2007.
Petron exerted all efforts to explain to the Treasurer that the scheduled auction sale was illegal considering Petron’s appeal to the LBAA and the posting of the surety bond. Considering the Treasurer’s refusal to cancel the auction sale, Petron fi led a complaint for injunction on October 8, 2007 before the Regional Trial Court to stop the auction sale. A writ of injunction stopping the holding of the public auction until the case is fi nally decided was issued by the RTC on November 5, 2007.
A motion to dismiss fi led by the Provincial Treasurer on the ground of forum-shopping was denied by the RTC. However, a similar motion based on the same ground of forum shopping was fi led before the LBAA by the respondents and the motion was granted by the LBAA on December 10, 2007.
On January 4, 2008, the respondents appealed the RTC’s grant of a writ of injunction to the SC.
Last January 17, 2008, Petron appealed from the LBAA’s dismissal of its appeal by fi ling a Notice of Appeal with the CBAA.
Notes to Consolidated Financial Statements(With Comparative Figures For 2006 And 2005)(Amounts In Million Pesos, Except Par Value, Shares And Per Share Amounts, Exchange Rates, And Commodity Volumes)
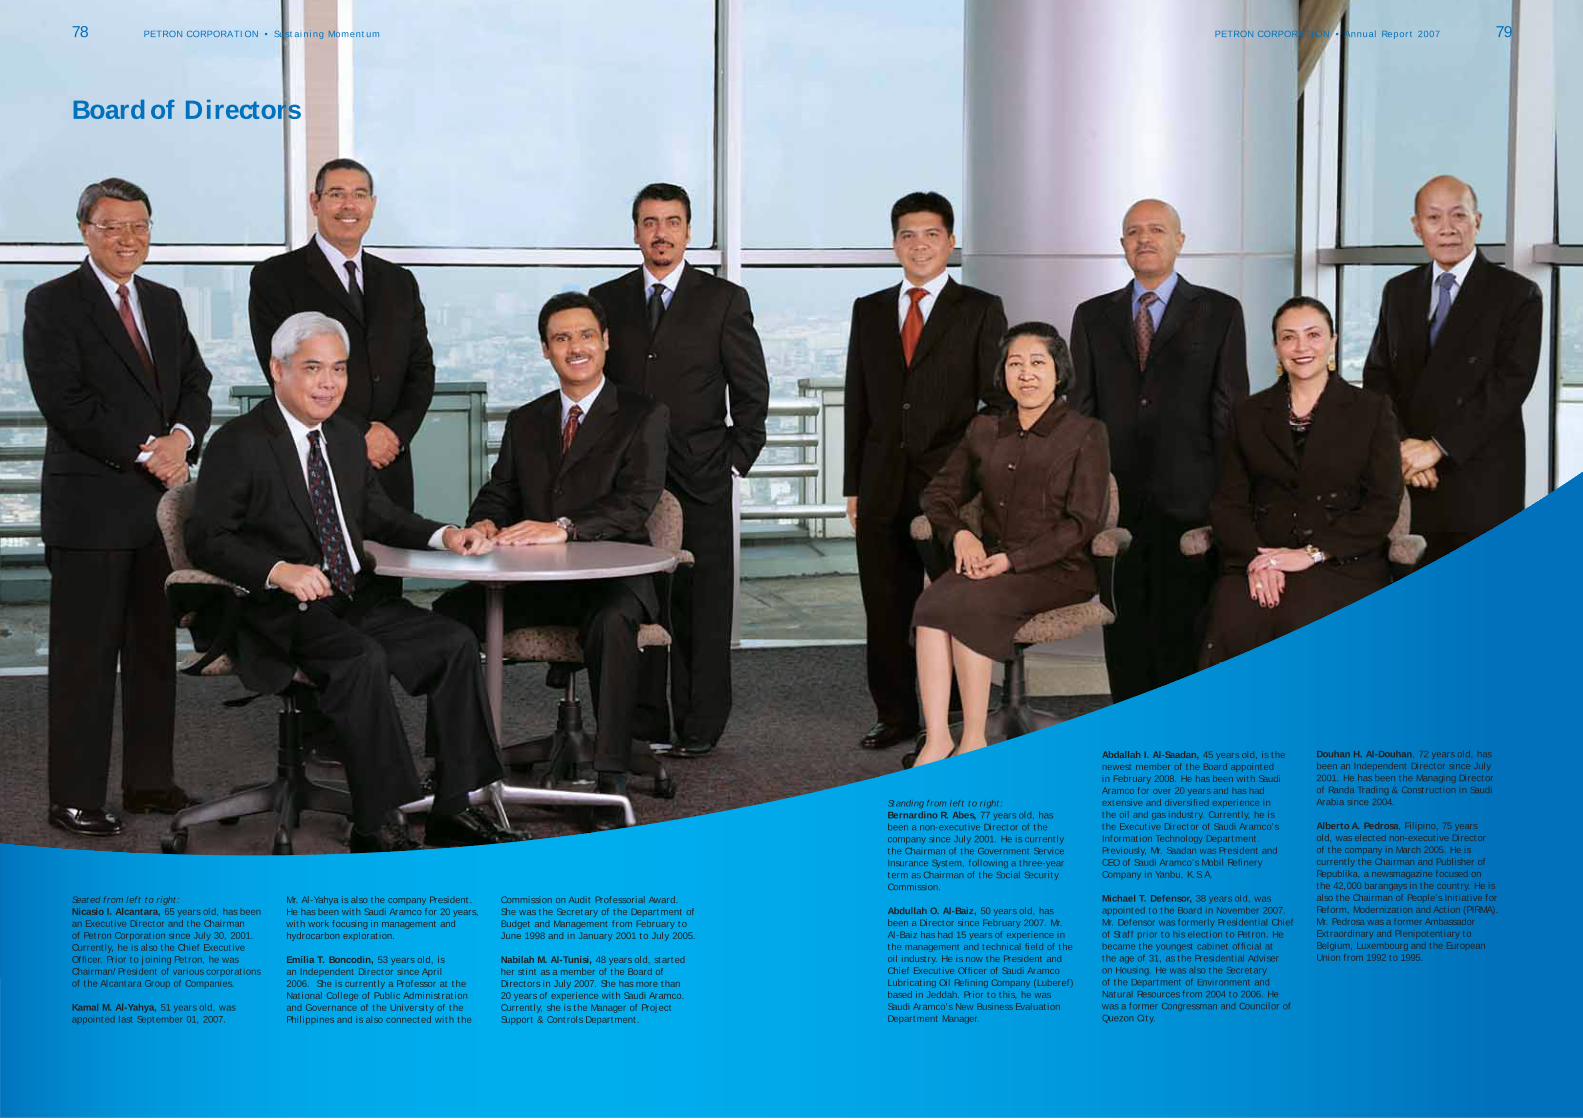
Seated from left to right: Nicasio I. Alcantara, 65 years old, has been an Executive Director and the Chairman of Petron Corporation since July 30, 2001. Currently, he is also the Chief Executive Offi cer. Prior to joining Petron, he was Chairman/President of various corporations of the Alcantara Group of Companies.
Kamal M. Al-Yahya, 51 years old, was appointed last September 01, 2007.
Mr. Al-Yahya is also the company President. He has been with Saudi Aramco for 20 years, with work focusing in management and hydrocarbon exploration.
Emilia T. Boncodin, 53 years old, is an Independent Director since April 2006. She is currently a Professor at the National College of Public Administration and Governance of the University of the Philippines and is also connected with the
Standing from left to right: Bernardino R. Abes, 77 years old, has been a non-executive Director of the company since July 2001. He is currently the Chairman of the Government Service Insurance System, following a three-year term as Chairman of the Social Security Commission.
Abdullah O. Al-Baiz, 50 years old, has been a Director since February 2007. Mr. Al-Baiz has had 15 years of experience in the management and technical fi eld of the oil industry. He is now the President and Chief Executive Offi cer of Saudi Aramco Lubricating Oil Refi ning Company (Luberef) based in Jeddah. Prior to this, he was Saudi Aramco’s New Business Evaluation Department Manager.
Abdallah I. Al-Saadan, 45 years old, is the newest member of the Board appointed in February 2008. He has been with Saudi Aramco for over 20 years and has had extensive and diversifi ed experience in the oil and gas industry. Currently, he is the Executive Director of Saudi Aramco’s Information Technology Department. Previously, Mr. Saadan was President and CEO of Saudi Aramco’s Mobil Refi nery Company in Yanbu, K.S.A.
Michael T. Defensor, 38 years old, was appointed to the Board in November 2007. Mr. Defensor was formerly Presidential Chief of Staff prior to his election to Petron. He became the youngest cabinet offi cial at the age of 31, as the Presidential Adviser on Housing. He was also the Secretary of the Department of Environment and Natural Resources from 2004 to 2006. He was a former Congressman and Councilor of Quezon City.
Board of Directors
Commission on Audit Professorial Award. She was the Secretary of the Department of Budget and Management from February to June 1998 and in January 2001 to July 2005.
Nabilah M. Al-Tunisi, 48 years old, startedher stint as a member of the Board of Directors in July 2007. She has more than 20 years of experience with Saudi Aramco. Currently, she is the Manager of Project Support & Controls Department.
Douhan H. Al-Douhan, 72 years old, has been an Independent Director since July 2001. He has been the Managing Director of Randa Trading & Construction in Saudi Arabia since 2004.
Alberto A. Pedrosa, Filipino, 75 years old, was elected non-executive Director of the company in March 2005. He is currently the Chairman and Publisher of Republika, a newsmagazine focused on the 42,000 barangays in the country. He is also the Chairman of People’s Initiative for Reform, Modernization and Action (PIRMA). Mr. Pedrosa was a former Ambassador Extraordinary and Plenipotentiary to Belgium, Luxembourg and the European Union from 1992 to 1995.
78 PETRON CORPORATION • Sustaining Momentum PETRON CORPORATION • Annual Report 2007 79
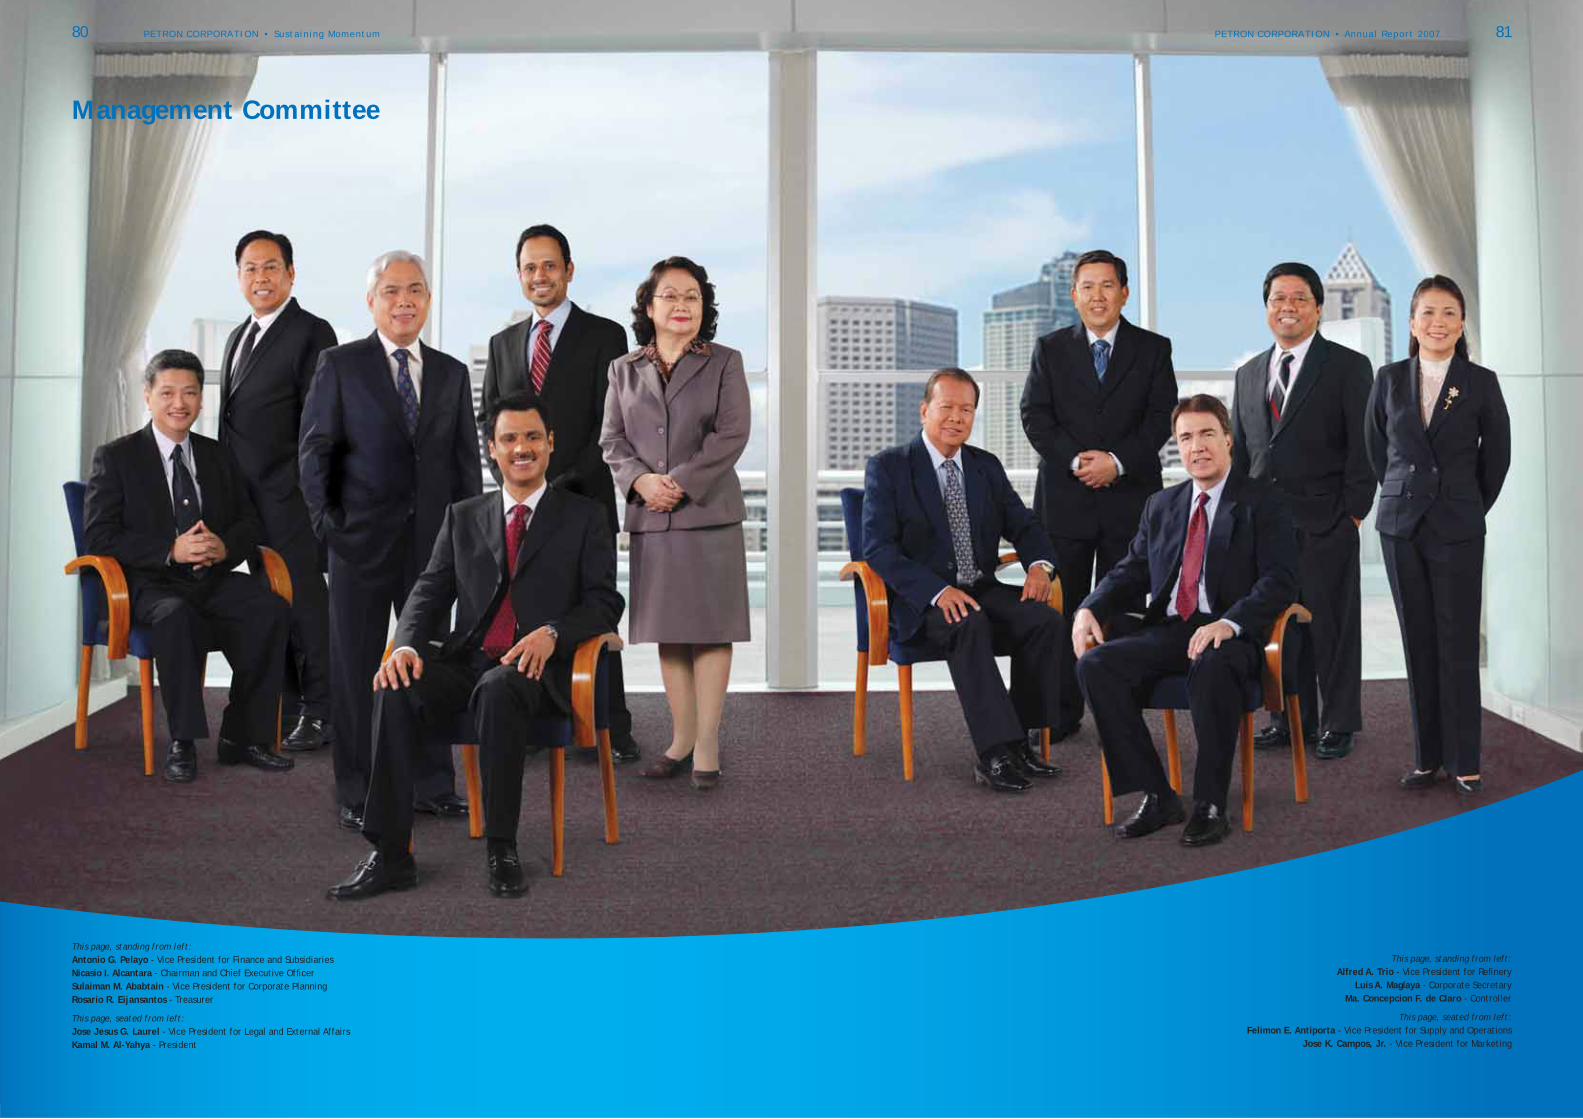
This page, standing from left:Alfred A. Trio - Vice President for Refi nery
Luis A. Maglaya - Corporate SecretaryMa. Concepcion F. de Claro - Controller
This page, seated from left:Felimon E. Antiporta - Vice President for Supply and Operations
Jose K. Campos, Jr. - Vice President for Marketing
This page, standing from left:Antonio G. Pelayo - Vice President for Finance and SubsidiariesNicasio I. Alcantara - Chairman and Chief Executive Offi cerSulaiman M. Ababtain - Vice President for Corporate PlanningRosario R. Eijansantos - Treasurer
This page, seated from left:Jose Jesus G. Laurel - Vice President for Legal and External AffairsKamal M. Al-Yahya - President
Management Committee
80 PETRON CORPORATION • Sustaining Momentum PETRON CORPORATION • Annual Report 2007 81
Fuels
AUTOMOTIVE FUELSPetron BlazePetron XCS Petron Xtra UnleadedRegular UnleadedDiesel MaxPetron Xtend Autogas
INDUSTRIAL FUELSPetron Fuel OilIF-1LSFO-1Intermediate FuelsSpecial Fuel OilIndustrial Diesel Fuel
AVIATION FUELSAviation GasolineJet A- I
HOUSEHOLD FUELSGasulGaas
Automotive Lubricating Oils
DIESEL ENGINE OILSRev-X All TerrainRev-X TrekkerRev-X HaulerRev-X HDPetron HDXPetron XD3Petron XD 2040Petron 2040Petron Railroad Extra
GASOLINE ENGINE OILSUltron RaceUltron RallyeUltron TouringUltron ExtraPetron MO
MOTORCYCLE OILSPetron Sprint 4T EnduroPetron Sprint 4T RiderPetron Sprint 4T Extra2T Premium2T Enviro2T Autolube2T Powerburn
AUTOMOTIVE GEAR OILSPetron GXPetron GEPPetron GST
AUTOMOTIVE TRANSMISSION FLUIDSPetron ATF PremiumPetron TF 38Petron TDH 50
Industrial Lubricating Oils
TURBINE, HYDRAULIC AND CIRCULATING OILS Hydrotur AWXHydrotur AWHydrotur AW (GT) Hydrotur EP 46Hydrotur N 100Hydrotur RHydrotur SW 68Hydrotur SX 32Hydrotur SX 68Hydrotur SX 220Hydrotur THydrotur TEP
INDUSTRIAL GEAR OILSHypex EP (Oil-Based)Hypex EP (Asphalt-Based)Milrol 5KGearfl uidGearkote
CUTTING OILS TurnolPetrokut 10Petrokut 27
REFRIGERATION OILS Zerfl o 68Suniso
OTHER INDUSTRIAL LUBRICATING OILSPetrocyl SPetrocyl AirlubeSpinol 15Spinol 10EPetrosine 68Voltran 60
MarineLubricating Oils
MARINE CYLINDER OILSPetromar DCL 7050Petromar DCL 4000 Series
MARINE TRUNK PISTON ENGINE OILSPetromar XC 5540Petromar XC 5040Petromar XC 4040Petromar XC 3000 SeriesPetromar XC 2000 SeriesPetromar XC 1500 SeriesPetromar XC 1000 Series
OTHER MARINE LUBRICANTSPetromar 65Petromar HD Marine Series
Greases
REGULAR PERFORMANCE GREASESPetrogrease MPPetrogrease XX
PREMIUM PERFORMANCE GREASESMolygrease EP2Molygrease PremiumPetrogrease EPPetrogrease Premium
HIGH TEMPERATURE GREASESMolygrease EP 1P and EP 2PPetrogrease EP 290 and EP 375Petrogrease HT
COMPLEX GREASESPetrogrease Aluminum ComplexPetrogrease Lithium ComplexPetrogrease Lithium Complex with Moly
FOOD GRADE GREASESPetrogrease Food Grade
Asphalts
PENETRATION ASPHALTPetropen
CUTBACK ASPHALTPetropen CB
EMULSIFIED ASPHALTPetromul CSS -1
BLOWN ASPHALTSAsphaltsealAsphalt Joint Sealer
Special Products
PROCESS OILSProcess OilsProduct 50 RPrintsol 600Rubbex 130StemolJute Batching OilAldro Oil
HEAT TRANSFER OILPetrotherm 32
CLEANING AGENTGreasolveCarbon Flush
FLUSHING OILSTM
SEALING LUBRICANTDust Stop Oil
PROTECTIVE COATINGSPetrokote 500Petrokote 392MarinekoteMarinekote SSAutokoteCablelubeCablekote
OTHERSPetron Farm Trac OilPetron Marine HD OilBull’s Eye
Aftermarket Specialties
PETROMATE SPECIALTIESPetroMate Oil SaverPetroMate Oil ImproverPetroMate Gas SaverPetroMate Diesel Power BoosterPetroMate Engine FlushPetroMate Super CoolantPetroMate Clean N’ ShinePetroMate Penetrating OilPetroMate GreaseawayPetroMate Brake and Clutch Fluid
Aviation Lubricants
Braycote 622Nyco Grease GN 22Hydraunycoil FH 51Royco 481Aviation Oil EE Invarol FJ 13Exxon Turbo Oil 2389Exxon Turbo Oil 2380Univis J-13Turbonycoil 35 MTurbonycoil 600
Luzon
APARRI J.P. de Carreon Street Punta Aparri, Cagayan(078) 888-2456, 888-2071
BATANGASBarrio Mainaga, MabiniBatangas(043) 487-0418, 487-0377(043) 487-0419 (Fax)
CALAPAN Roxas Street, Barangay Ilaya Calapan City, Oriental Mindoro (043) 288-1779
LIMAYPetron Bataan Refi neryLimay, Bataan (02) 884-9100(047) 244-3300
NAVOTASPFDA CompoundNavotas, Metro Manila (02) 281-4826, 281-1297
PALAWANParola, Barangay Maunlad Puerto Princesa City, Palawan (048) 433-2682, 433-3329
PANDACAN Jesus Street, PandacanManila (02) 563-8521 to 40 - Order & Billing (02) 563-8491 to 95 - Dispatching (02) 563-3047 (02) 563-8521 loc. 223
PASACAO Barangay Camangi Pasacao, Camarines Sur (054) 513-9258, 513-9175(054) 513-9175 (Fax)
POROPoro PointSan Fernando, La Union(072) 242-6032 to 34
ROSARIO General TriasRosario, Cavite (046) 438-2860, 438-1996
SAN JOSE1020 A. Mabini Street San Jose, Occidental Mindoro (043) 491-1938
Visayas
AMLANTandayag, AmlanNegros Oriental (035) 527-0790, 417-0793 417-0795
BACOLOD Barrio San Patricio, Bacolod City Negros Occidental(034) 433-9690, 433-9687 to 89
ILOILO Lapuz, Iloilo City (033) 337-6895, 338-1893
ISABEL Lide, Isabel, Leyte (053)556-0177, 337-2289
MACTAN MEPZ, Lapu-lapu City (032) 340-4620, 340-4629
MANDAUE Looc, Mandaue City, Cebu(032) 346-5135, 344-7341 to 51
ORMOC Barrio Linao, Ormoc City, Leyte(053) 255-9070, 561-1239
ROXAS Arnaldo Boulevard, CulasiRoxas City (036) 621-1992, 621-0722
TACLOBANAnibong, Tacloban City (053)325-6433, 325-6432523-1686
TAGBILARAN Graham Avenue, TagbilaranBohol(038) 411-3397
Mindanao
BAWING Purok Cabu, BawingGeneral Santos City (083) 301-1988
BULA P. Acharon BoulevardBula, General Santos City (083) 553-4923
DAVAO Km. 9, Barrio PampangaDavao City(082) 234-2185, 233-0399
ILIGAN Barrio Tuminobo, Iligan CityLanao del Norte (063) 492-0653, 351-6704221-5264
JIMENEZ Jimenez, Misamis Occidental (088) 272-3230, 272-3243
NASIPIT Talisay, NasipitAgusan del Norte(085) 283-3126, 343-2218/19
TAGOLOAN Tagoloan, Misamis Oriental(08822) 740-072, 740-263
ZAMBOANGA Barangay Campo IslamLower Calarian, Zamboanga City(062) 991-1245, 991-1571991-4352
Airport Installations
DAVAO Davao Airport (082) 234-2185/86, 233-0399
ILOILO Barangay Airport, MandurriaoIloilo City (033) 321-3183
LAOAG Laoag Airport c/o NAIA 833-7084
NAIA JOCASP, CPD, NAIA, Pasay City (02) 833-7084, 831-5842
LPG Operations
GASUL-PASIG Barrio Ugong, Pasig, Metro Manila (TL) 671-9817 to 26
LEGASPI Lakandula Drive, Barangay Bonot Legaspi City (052) 480-8113
GASUL-SAN FERNANDOSan Fernando, Pampanga(045) 961-3564
CALAMBA WAREHOUSE Calamba, Laguna (049) 545-6481
Terminals and Depots Product List
82 PETRON CORPORATION • Sustaining Momentum PETRON CORPORATION • Annual Report 2007 83

Information and Assistance
Petron CorporationPetron MegaPlaza358 Sen. Gil Puyat AvenueMakati City 1200 PhilippinesTel. No. (632) 886 3888Fax No. (632) 886 3064Website: www.petron.comE mail: [email protected]
Shareholder Services and AssistanceFor questions or comments regarding dividend payments,change of address, account status, lost or damaged stockcertifi cates, please get in touch with:
Stockholder Services SectionPublic Affairs Department39/F Petron MegaPlaza358 Sen. Gil Puyat AvenueMakati City 1200 PhilippinesTel. No. (632) 886 3888Fax No. (632) 886 3064
Or with our stock transfer agent:
Stock Transfer Services, Inc.8/F Phinma Plaza39 Plaza Drive, Rockwell CenterMakati City 1200 PhilippinesTel. No. (632) 898 7555Fax No. (632) 898 7597
Institutional Investor InquiriesPetron Corporation welcomes inquiries from analysts,the fi nancial community and institutional investors.Please write or call:
Public Affairs Deparment39/F Petron MegaPlaza358 Sen. Gil Puyat AvenueMakati City 1200 PhilippinesTel. No. (632) 886 3888Fax No. (632) 886 3064E mail: [email protected]
Annual reports, quarterly reports and other information on Petron can be downloaded from our website: www.petron.com
84 PETRON CORPORATION • Sustaining Momentum