sutlej textiles and sutta industries limited
TRANSCRIPT

sutta textiles and industries limited
02nd August, 2018
BSE Limited Phiroze Jeejeebhoy Towers
Dalai Street, Fort Mumbai 400 001 Scrip Code: 532782
Dear Sirs,
SUTLEJ TEXTILES AND INDUSTRIES LIMITED Lotus Corporate Park, 'E' Wing, 5th/6th Floor, 185/A, Graham Firth Compound, Near Jay Coach, Goregaon (East), Mumbai - 400 063. Phone : (022) 4219 8800/6122 8989 Fax : (022) 4219 8830 E-mail : info©rtmyarn.com Website : www.sutlejtextiles.com CIN No. : L17124RJ2005PLCO20927
National Stock Exchange of India Ltd. Exchange Plaza, 5th Floor, Plot No.C/1,
G-Block, Bandra - Kuria Complex, Bandra (E), Mumbai 400 051 Scrip Code : SUTLEJTEX
Re:- Results Presentation
Please find enclosed herewith a copy of the presentation with respect to the Un-audited
Financial Results of the Company for the quarter ended 30th June, 2018.
Thanking you
Yours faithfully For Sutlej Textiles and Industries Limited
Manoj Contractor Company Secretary and Compliance Officer
Encl: a/a
(Govt. Recognised Three Star Export House) Regd. Office : Pachpahar Road, Bhawanimandi - 326 502 (Rajasthan) • Mills : Bhawanimandi (Raj.), Kathua (J&K), Baddi (H.P.), Bhilad (Guj.)

Investor Presentation | August 2018

Agenda
• Q1 FY19 Performance
• Sutlej at Glance
• Financial Highlights
2
3
Q1FY19 Performance
Charged to Grow Higher
Key progress during Q1 FY19 and outlook
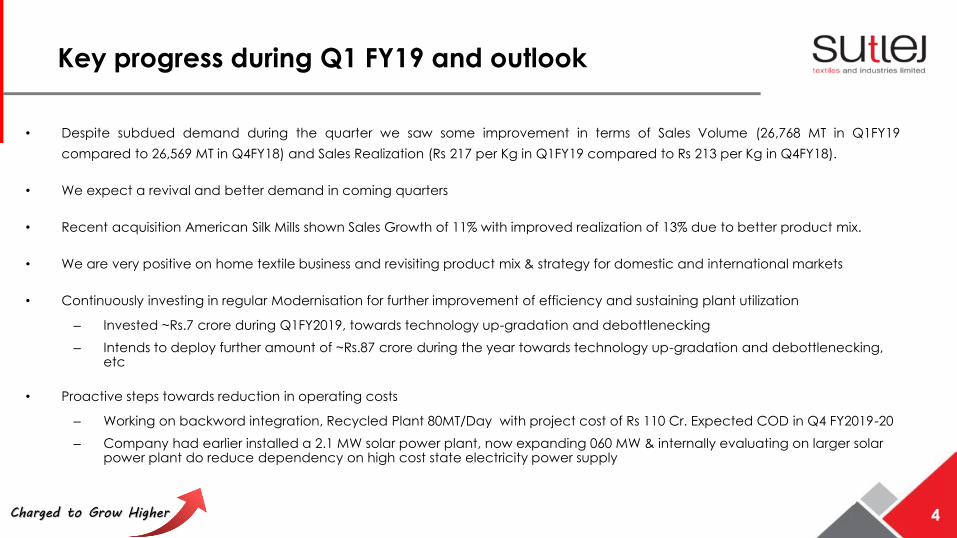
• Despite subdued demand during the quarter we saw some improvement in terms of Sales Volume (26,768 MT in Q1FY19
compared to 26,569 MT in Q4FY18) and Sales Realization (Rs 217 per Kg in Q1FY19 compared to Rs 213 per Kg in Q4FY18).
• We expect a revival and better demand in coming quarters
• Recent acquisition American Silk Mills shown Sales Growth of 11% with improved realization of 13% due to better product mix.
• We are very positive on home textile business and revisiting product mix & strategy for domestic and international markets
• Continuously investing in regular Modernisation for further improvement of efficiency and sustaining plant utilization
– Invested ~Rs.7 crore during Q1FY2019, towards technology up-gradation and debottlenecking
– Intends to deploy further amount of ~Rs.87 crore during the year towards technology up-gradation and debottlenecking, etc
• Proactive steps towards reduction in operating costs
– Working on backword integration, Recycled Plant 80MT/Day with project cost of Rs 110 Cr. Expected COD in Q4 FY2019-20
– Company had earlier installed a 2.1 MW solar power plant, now expanding 060 MW & internally evaluating on larger solar power plant do reduce dependency on high cost state electricity power supply
4
Charged to Grow Higher
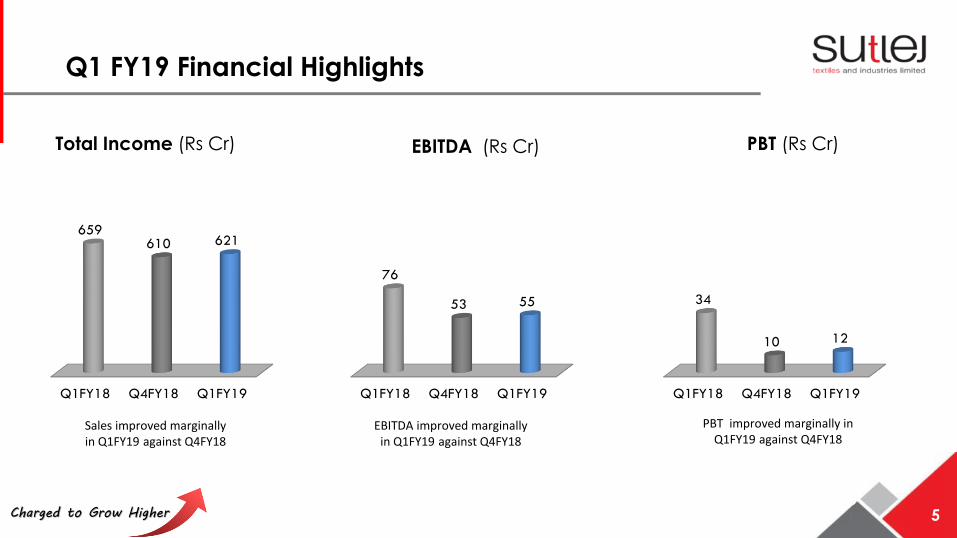
Q1 FY19 Financial Highlights
Q1FY18 Q4FY18 Q1FY19
659610 621
Total Income (Rs Cr) EBITDA (Rs Cr) PBT (Rs Cr)
Q1FY18 Q4FY18 Q1FY19
76
53 55
Q1FY18 Q4FY18 Q1FY19
34
10 12
5
Sales improved marginally in Q1FY19 against Q4FY18
EBITDA improved marginally in Q1FY19 against Q4FY18
PBT improved marginally in Q1FY19 against Q4FY18

Charged to Grow Higher
Key Performance Highlights – Q1 FY19
Q1FY18 Q4FY18 Q1FY19
27,56026,569 26,768
Yarn Sales (in MT)Sales volume are improving from
previous quarter
Average Yarn Realization (Rs/kg) in Q1FY19Improvements in Realization from
previous quarter shows are ability to price better
Export Revenue continues 30%+Shows our Market
Diversification
The Yarn segment continues to give 95%+ of Revenue Share
Q1FY18 Q4FY18 Q1FY19
497393 419
155211 197
Domestic ExportQ1FY18 Q4FY18 Q1FY19
227
213 217
6

Charged to Grow Higher
Profitability Highlights
7
Rs. in Cr Q1FY19 Q4FY18 Q1FY18
Total Income 621 610 659
Raw Material Cost 354 354 380
Employee Cost 79 73 72
Other Expenses 133 131 130
EBITDA 55* 53 76
EBITDA Margin (%) 8.9% 8.6% 11.6%
Depreciation 27 27 26
Finance Cost 16 15 16
Profit Before Tax 12 10 34
Exceptional Items 0 0 0
Tax 3 1 11
Net Profit After Tax 9 10 24
Net Profit Margin (%) 1.4% 1.6% 3.6%
Earning Per Share (Rs.) 0.5 0.6 1.4
* include MTM/Reinstatement loss of Rs.7.84 Crore on outstanding foreign exchange exposure as on 30th June 2018

Charged to Grow Higher
Executive Chairman’s comments on Q1FY19 performance
Executive Chairman - Mr. C. S. Nopany
Commenting on the results, Mr. C.S. Nopany, Executive Chairman, Sutlej
Textiles and Industries Limited said:
“The challenging business environment in the spinning sector continued in Q1 FY19
due to subdued demand and sluggish exports. While input costs continued to rise,
product prices remained subdued. The decision by the GST Council to allow refund
of accumulated input tax credit due to the inverted duty structure to fabric
manufacturers is certainly a positive step which should alleviate the negative
sentiment. Secondly, the recent depreciation of the Rupee will also improve export
competitiveness and overall demand. I am hopeful that with these initiatives the
worst is behind us and our diversified portfolio of value added products should
enable us to deliver a better performance in the coming quarters.”
8

9
Sutlej’s Key Growth Areas “Growth is a outcome of right actions and patience”

Charged to Grow Higher
Stabilization of recently expanded capacities
10
•Post stabilization of newly added 35,280 spindles of melange yarn capacity, realization is expected to increase going forward
Optimum utilization of newly added yarn capacity
•Home textile capacities were under utilized due to adverse market conditions ; envisage to increase the utilizations way forward
•Continuous shift of capacities from job work to in-house home textile manufacturing will bring growth in this segment
Increasing utilization of Home Textile capacity
•Continuous focus on growth opportunities in USA market through American Silk Mills
•Focus on new designs and acquiring large customers
•Build synergy between Home Textile unit at India and American Silk Mills unit at USA
Stabilization of recently acquired Home Textile unit in USA

Charged to Grow Higher
Proactive measures to achieve better cost efficiencies
11
•New Green Fibre project to manufacture polyester staple fibre will lead to savings in cost and better GST utilization
Proposed new expansion to improve operational margins
•Installed Roof top solar plant of 2.1 MW at new unit in Bhawanimandi resulting ~40% less per unit cost compared to State Tariff
•Evaluating new Solar capabilities to reduce power cost further in RTM
Installation of Solar Plant

12
Sutlej at Glance“Our Focus towards value addition, helps us to be in a niche segments”

Charged to Grow Higher
Sutlej Textiles - Overview
13
Largest
India’s largest spun dyed Yarn Manufacturer
One of the leading manufacturer of Melange Yarn
Niche Presence
Manufacturing mainly all value added yarns
Presence in curtains and upholstery in Home Textile segment
Substantial Capacities
4,18,680 spindles capacity of Yarn
9.6 Million Meters Per Annum capacity of Home Textiles
Patronage of Renowned K.K.Birla group
Part of a reputed group with excellent corporate governance
Exports to + 65 countries
Exports across Europe, North America, South-East Asia, USA, etc
Reputed Cliental
Marquee Clients like Page Industries, Siyaram’s, Donear, Arrow, etc

Charged to Grow Higher
Key Milestones
14
2006-07 2008-09
2009-10
2014
2015-17 2017-18
Entered into Home Textiles
Expansion of Kathua and Bhawanimandi units by 35,400 spindles and 2,112 spindles to manufacture PV Dyed Yarn completed
Bhawanimandi Expansion
Completed Expansion of 7,488 spindles for PV Dyed Yarn
12,672 Spindles added for manufacturing Cotton Yarn
Commenced commercial production of 31,104 Spindles at Chenab Textile Mills, J&K to manufacture Cotton Mélange and Cotton Blended Dyed Yarn
Installed 12 MW Thermal Power Plant at Bhanwanimandi unit
31,104 spindles added at Chenab Textile Mills - J&K for value added cotton mélange and cotton blended dyed yarn
Acquisition of Birla Textile Mills
35,280 spindles – commencedcommercial production forCotton blended dyed andMélange Yarn at Rajasthan
9.6 MMPA - commencedproduction of Home Textilefacilities at Gujarat
Acquired Design, Sales,and Distribution (DS&D)business along withbrand of American Silk
Mills LLC (ASM)
Invested USD 4.5 Millionin Wholly OwnedSubsidiary in USA

Charged to Grow Higher
Business Verticals
15
India’s Largest Spun-dyed & Cotton Melange Yarn manufacturer
4,18,680 spindles capacity
Cotton Melange Yarn Capacity 1,44,290 spindles
Marquee clients - B2B business
Optimum Capacity utilisation of ~95%
Average counts of yarn 27.05
Focus on Curtains & Upholstery
Capacity - 9.6 million metres
Leading producer & exporter of Home Decor
Exports account of 24%
Latest technology in design & manufacturing
State of Art Weaving and processing facility with total 126 loom including 36 looms with double width
Value Added Yarn Segment“our core strength”
Home Textile Segment“our new growth opportunity”
95% Revenue contribution 5% Revenue contribution

Charged to Grow Higher
Best in class facilities
Location: Baddi, Himachal Pradesh
Capacity:
• 83,376 Spindles (Man-made Fibre)
Location: Bhawanimandi, Rajasthan
Capacity:
• 35,280 Spindles (Cotton Mélange )
• 91,584 Spindles (Man –made Fibre)
• Roof top solar plant of 2.1 MW
Yarn Business
Home textile Business
16
Location: Kathua, J&K
Capacity:
• 109,010 Spindles (Cotton Mélange)
• 97,900 Spindles (Man-made Fibre)
Installed Roof top solar plant of 2.1 MW at new unit in Bhawanimandi,
Rajasthan resulting ~40% less per unit cost compared to State Tariff
Location: Daheli, Gujarat
Capacity:
• 9.6 million metres p.a. (126 looms.
Dobby 42 single width, rest all
Jacquard)
• Processing facilities mainly 4 stenter, 28
jet, 24 jigger, 19 mechanical and
various others

Charged to Grow Higher
Marquee Clients over the Globe
17
Charged to Grow Higher
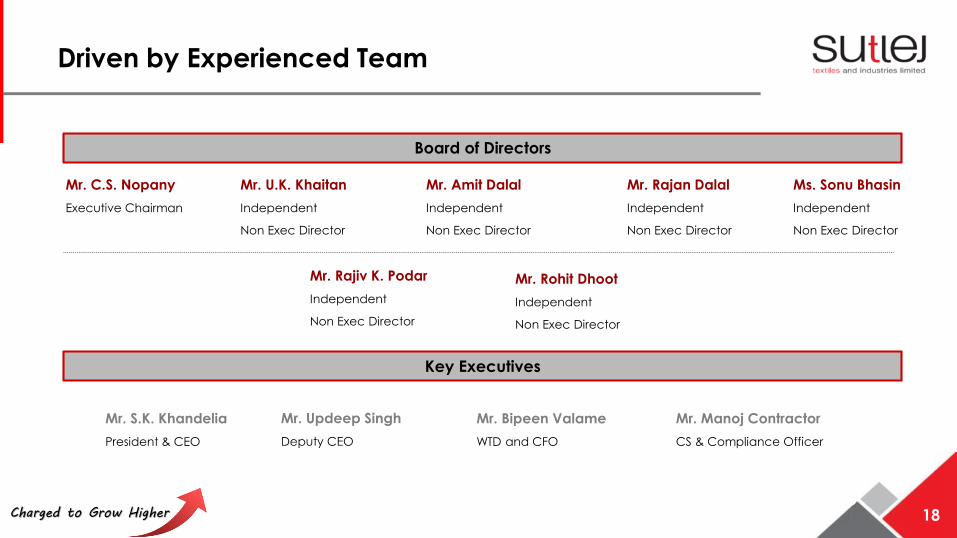
Driven by Experienced Team
Board of Directors
Mr. C.S. Nopany
Executive Chairman
Mr. Amit Dalal
Independent
Non Exec Director
Mr. Rajan Dalal
Independent
Non Exec Director
Mr. U.K. Khaitan
Independent
Non Exec Director
Ms. Sonu Bhasin
Independent
Non Exec Director
Mr. S.K. Khandelia
President & CEO
Mr. Bipeen Valame
WTD and CFO
Mr. Manoj Contractor
CS & Compliance Officer
Mr. Rohit Dhoot
Independent
Non Exec Director
Mr. Rajiv K. Podar
Independent
Non Exec Director
Key Executives
18
Mr. Updeep Singh
Deputy CEO

Charged to Grow Higher
Progressively widened global
footprint with presence in 65
countries
Entered geographies with growing
preference for value-added yarns & Home
Textile segment
Exports contribute ~30% to total
revenue
Competitive export realisations
Increasing global foot prints
19
2534
40
FY16 FY17 FY18
Home Textile
Exports (Rs. Cr)
587 622 759
FY16 FY17 FY18
Yarn
Exports (Rs. Cr)

Charged to Grow Higher
Comfortable Balance Sheet
Generate larger
cash profits
Moderate gearing and increased reinvestment
Switched
from high-cost
working
capital loans to
commercial
paper & packing
credit (foreign
currency)
Moderated capital cost of 5.97% in FY18
FY12 FY14 FY17 FY18
Total Debt to Equity (x) 2.58 1.36 1.27 1.15
Average borrowing Cost (%) 8.18 8.55 5.88 5.97
Interest cover (x) 2.56 5.26 6.99 4.75
20

Charged to Grow Higher
Huge opportunities Ahead
21
2015 2016 2017 2019F
108137 150
250
Textile and apparel industry in India (US$
billion)
• Rising per capita income, favourable
demographics and a shift in preference to
branded products to boost demand
• Huge consumption demand expected in India
FY15 FY16 FY18 2021E
36.8 36.7 37.9
82.0
Textiles and apparel exports from India
(US$ billion)
1.2x
• Favourable trade policies and superior
quality to drive textile exports
• Increase in exports opportunities will lead
to increase in Home Textile & Yarn business
2014 2021E
4.7
8.2
Indian home textile industry
(US$ billion)
• India accounts for 7% of global home
textiles trade
• India is a leader in the US and the UK,
contributing 2/3rd to their exports
Source: IBEF

22
Financial Highlights“Discipline financial leads to consistent growth of the company”

Charged to Grow Higher
306
272
302
317
281
FY14
FY15
FY16
FY17
FY18
Enhancing value across the years
*The Company acquired American Silk Mills, LLC on 6 th November 2017 and
hence FY 2017-18 is first year of consolidation
1,923
1,918
2,108
2,285
2,510
FY14
FY15
FY16
FY17
FY18
131
115
143
158
113
FY14
FY15
FY16
FY17
FY18
Revenue EBITDA PAT
15.9%
14.2%
14.3%
13.9%
11.2%
23
6.8%
6.0%
6.8%
6.9%
4.5%* * *

Charged to Grow Higher
Maintained low leverage despite continuous expansion
1.4
1.1
1.2
1.3
1.15
FY14
FY15
FY16
FY17
FY18
6.8%
7.5%7.3%
6.2%6.2%
FY14 FY15 FY16 FY17 FY18
Comfortable Total Debt / Equity Ratio Robust Interest CoverageAverage Interest Rate of Term Loans
(After TUF)
4
3.8
4.9
5.2
4.8
FY14
FY15
FY16
FY17
FY18
24
Charged to Grow Higher
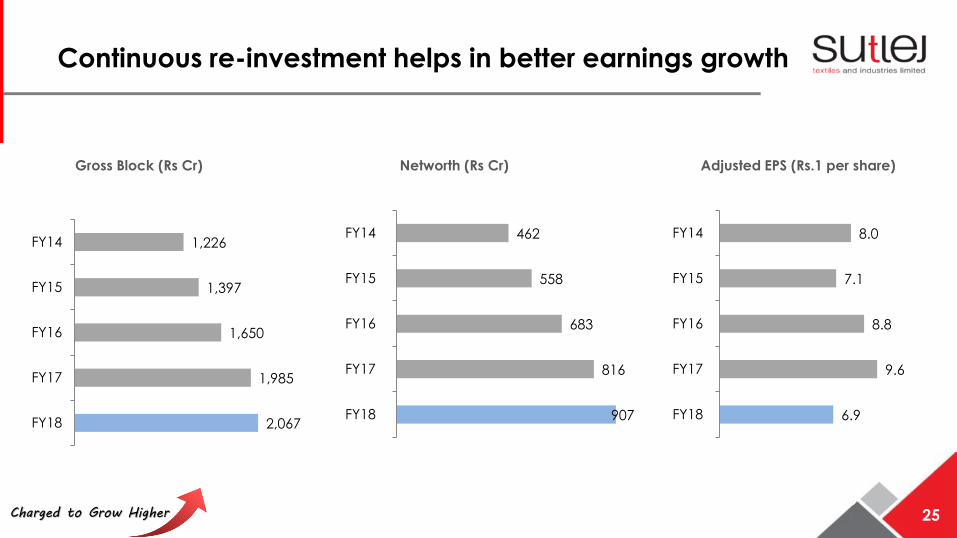
Continuous re-investment helps in better earnings growth
8.0
7.1
8.8
9.6
6.9
FY14
FY15
FY16
FY17
FY18
Adjusted EPS (Rs.1 per share)
1,226
1,397
1,650
1,985
2,067
FY14
FY15
FY16
FY17
FY18
462
558
683
816
907
FY14
FY15
FY16
FY17
FY18
Gross Block (Rs Cr) Networth (Rs Cr)
25
Charged to Grow Higher
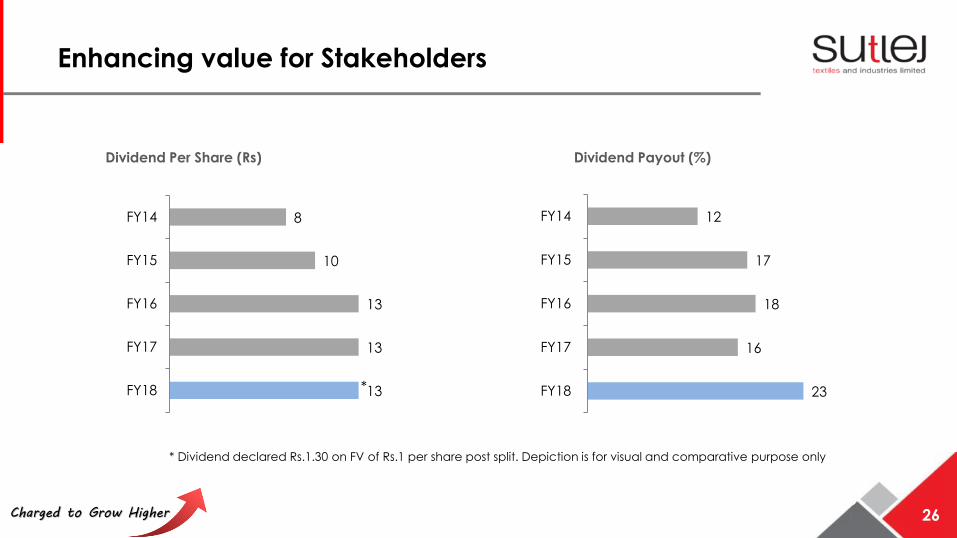
Enhancing value for Stakeholders
12
17
18
16
23
FY14
FY15
FY16
FY17
FY18
8
10
13
13
13
FY14
FY15
FY16
FY17
FY18
Dividend Payout (%)Dividend Per Share (Rs)
26
*
* Dividend declared Rs.1.30 on FV of Rs.1 per share post split. Depiction is for visual and comparative purpose only

Let’s Connect
For more information visit: www.sutlejtextiles.com
Mr. Bipeen [email protected]
Lotus Corporate Park, Goregaon (East), Mumbai 400063
Mr. Vikash Verma / Mr. Abhishek Bhatt
[email protected] [email protected]
Kanakia Wall Street, Andheri (East), Mumbai 400 093