swan canning estuarine data report - parks and wildlife ... · table 29 canning salinity (ppt) (in...
TRANSCRIPT
Swan Canning Estuarine Data Report
4th Quarter: June 2015 – May 2016
Looking after all our water needs
Technical Report Prepared by the Department of Water, Water Science Branch for the Department of Parks and Wildlife, Rivers and Estuaries Division
August 2016
Department of Water
168 St Georges Terrace
Perth Western Australia 6000
Telephone +61 8 6364 7600
Facsimile +61 8 6364 7601
www.water.wa.gov.au
© Government of Western Australia 2016
August 2016
This work is copyright. You may download, display, print and reproduce
this material in unaltered form only (retaining this notice) for your personal, non-
commercial use or use within your organisation. Apart from any use as permitted
under the Copyright Act 1968, all other rights are reserved. Requests and inquiries
concerning reproduction and rights should be addressed to the Department of Water.
Report details
This report was prepared by the Water Science Branch of the Department of Water for the Rivers and Estuaries Division of the Department of Parks and Wildlife, Government of Western Australia.
The report should be referenced as:
Department of Water 2016. Swan Canning Estuarine Data Report, June 2015 to May 2016. Report prepared by the Department of Water for the Department of Parks and Wildlife.
Acknowledgements
This project was funded by the Government of Western Australia through the Department of Parks and Wildlife and the Department of Water.
For more information about this report, contact
Frances Miller (Environmental Officer),
Water Science Branch.
Swan Canning Estuarine Data Report June 2015 – May 2016
3 Department of Water
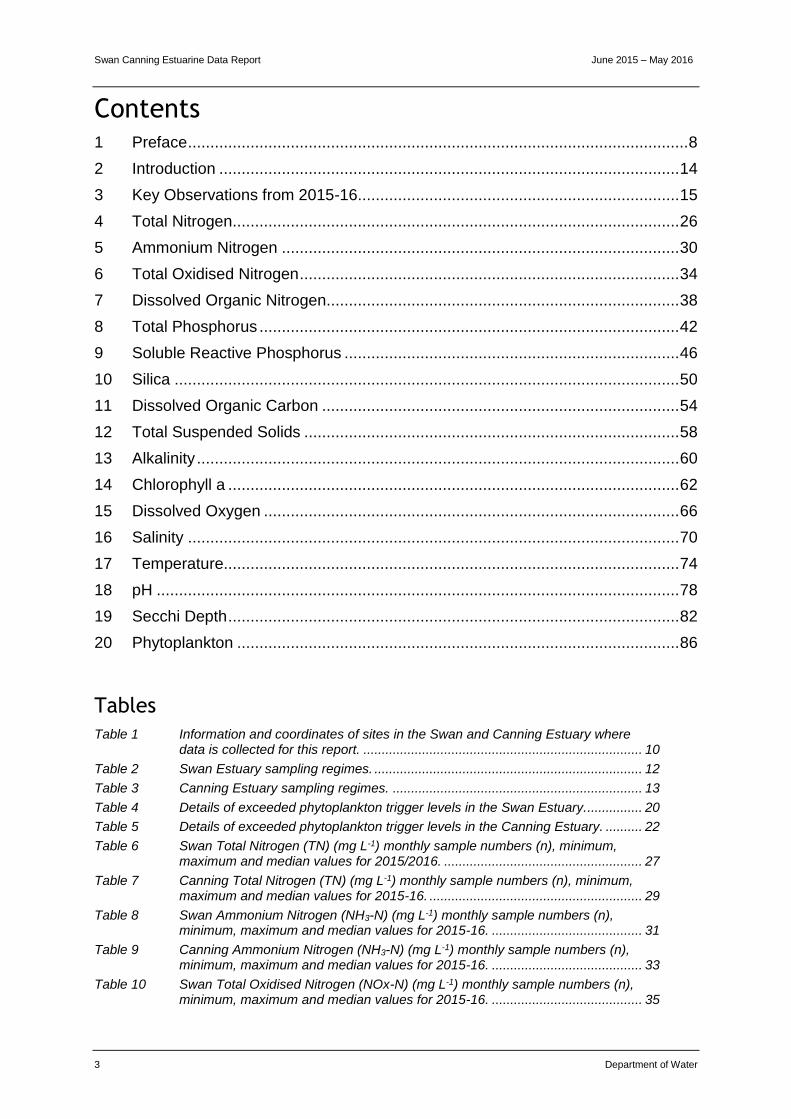
Contents 1 Preface ................................................................................................................ 8
2 Introduction ....................................................................................................... 14
3 Key Observations from 2015-16 ........................................................................ 15
4 Total Nitrogen .................................................................................................... 26
5 Ammonium Nitrogen ......................................................................................... 30
6 Total Oxidised Nitrogen ..................................................................................... 34
7 Dissolved Organic Nitrogen............................................................................... 38
8 Total Phosphorus .............................................................................................. 42
9 Soluble Reactive Phosphorus ........................................................................... 46
10 Silica ................................................................................................................. 50
11 Dissolved Organic Carbon ................................................................................ 54
12 Total Suspended Solids .................................................................................... 58
13 Alkalinity ............................................................................................................ 60
14 Chlorophyll a ..................................................................................................... 62
15 Dissolved Oxygen ............................................................................................. 66
16 Salinity .............................................................................................................. 70
17 Temperature...................................................................................................... 74
18 pH ..................................................................................................................... 78
19 Secchi Depth ..................................................................................................... 82
20 Phytoplankton ................................................................................................... 86
Tables
Table 1 Information and coordinates of sites in the Swan and Canning Estuary where data is collected for this report. ............................................................................ 10
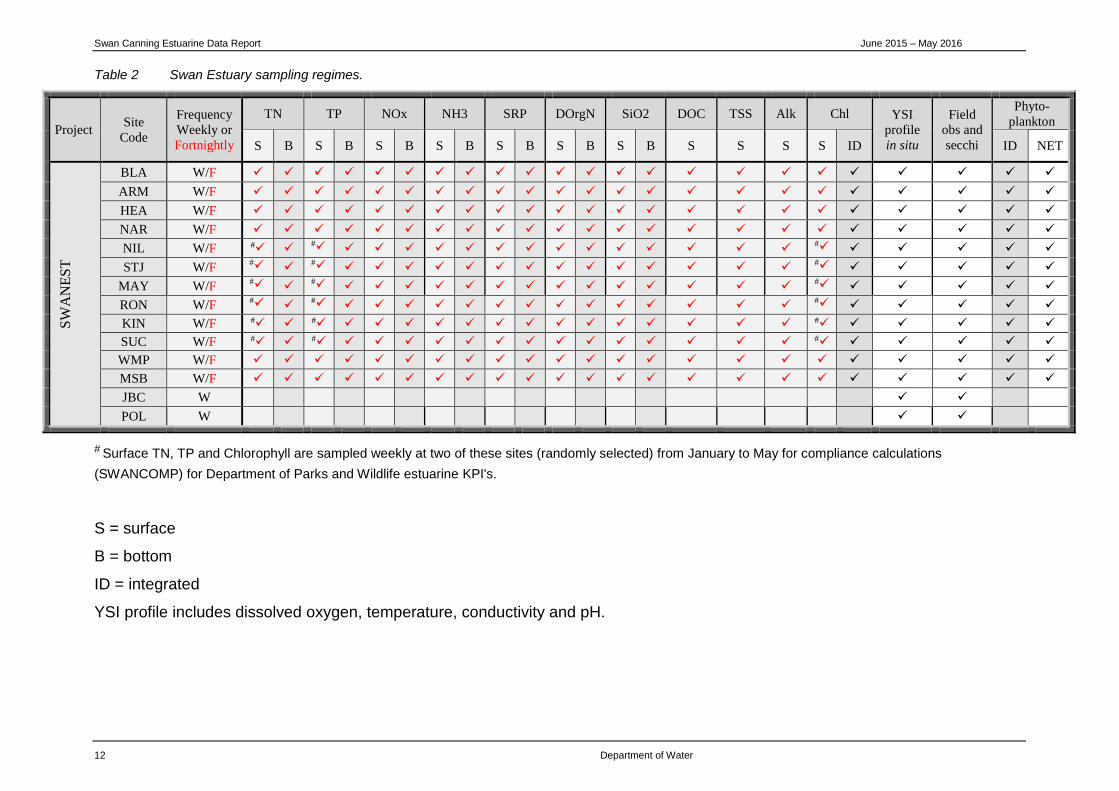
Table 2 Swan Estuary sampling regimes. ......................................................................... 12
Table 3 Canning Estuary sampling regimes. .................................................................... 13
Table 4 Details of exceeded phytoplankton trigger levels in the Swan Estuary................ 20
Table 5 Details of exceeded phytoplankton trigger levels in the Canning Estuary. .......... 22
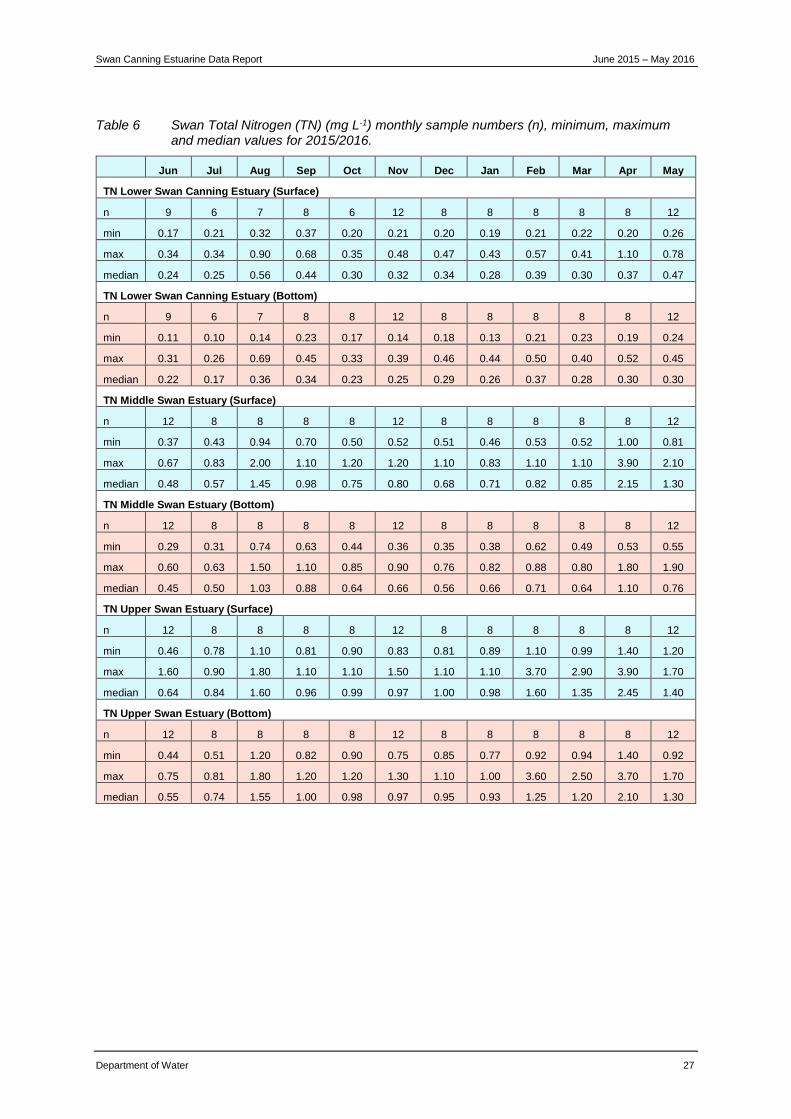
Table 6 Swan Total Nitrogen (TN) (mg L-1) monthly sample numbers (n), minimum, maximum and median values for 2015/2016. ...................................................... 27
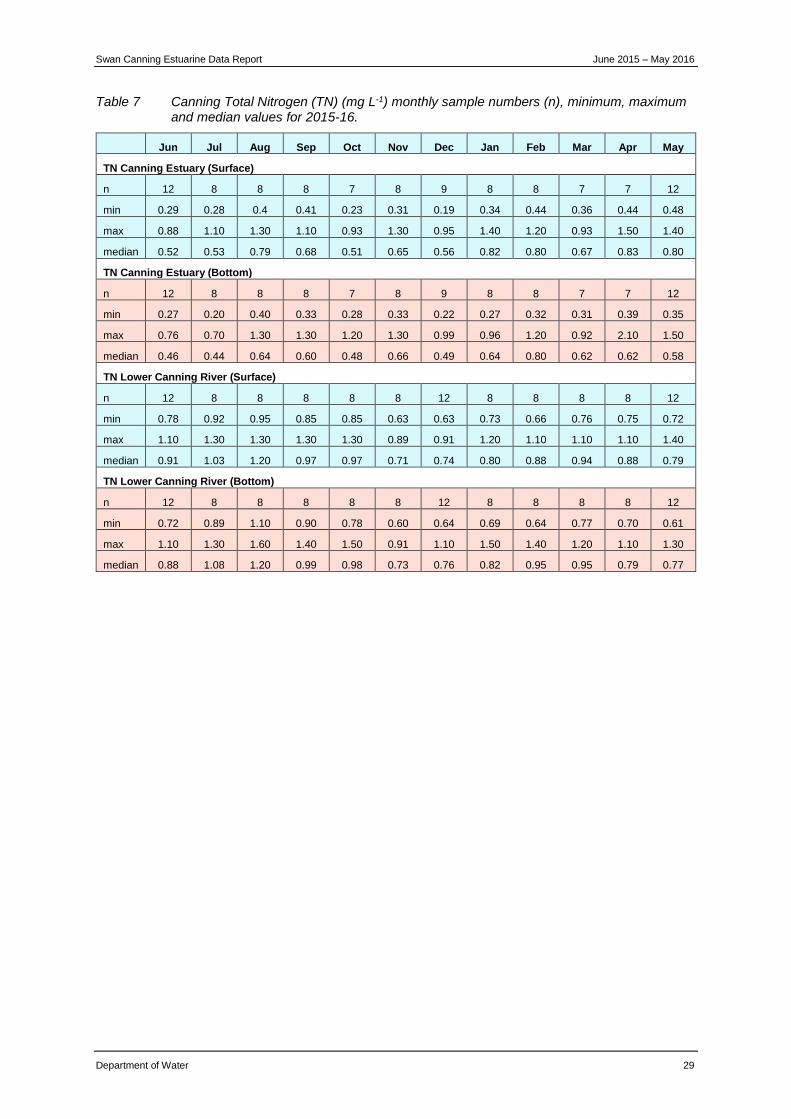
Table 7 Canning Total Nitrogen (TN) (mg L-1) monthly sample numbers (n), minimum, maximum and median values for 2015-16. .......................................................... 29
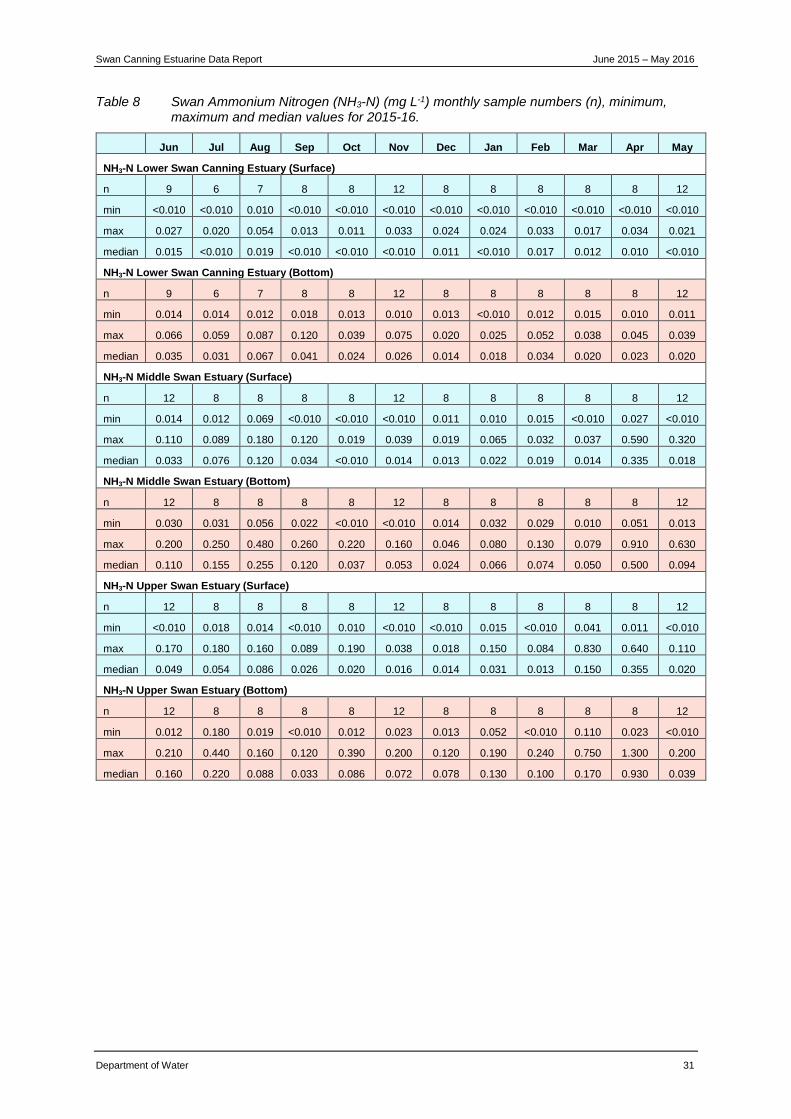
Table 8 Swan Ammonium Nitrogen (NH3-N) (mg L-1) monthly sample numbers (n), minimum, maximum and median values for 2015-16. ......................................... 31
Table 9 Canning Ammonium Nitrogen (NH3-N) (mg L-1) monthly sample numbers (n), minimum, maximum and median values for 2015-16. ......................................... 33
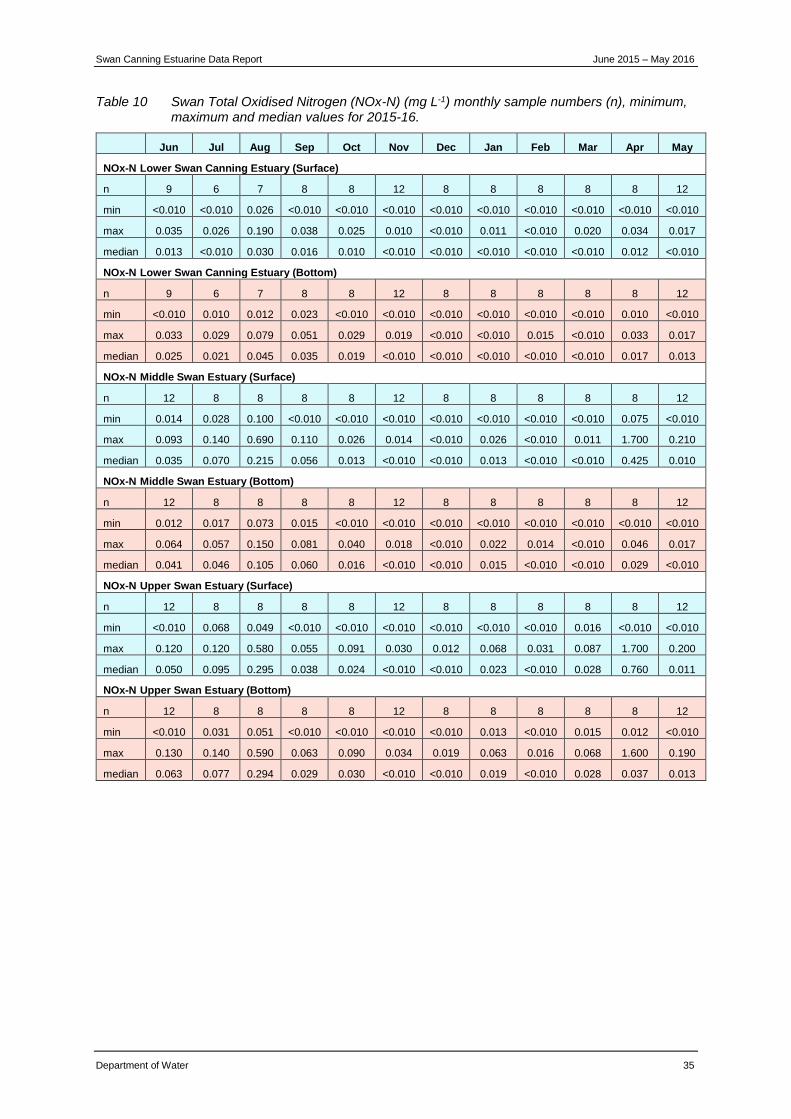
Table 10 Swan Total Oxidised Nitrogen (NOx-N) (mg L-1) monthly sample numbers (n), minimum, maximum and median values for 2015-16. ......................................... 35
Swan Canning Estuarine Data Report June 2015 – May 2016
4 Department of Water
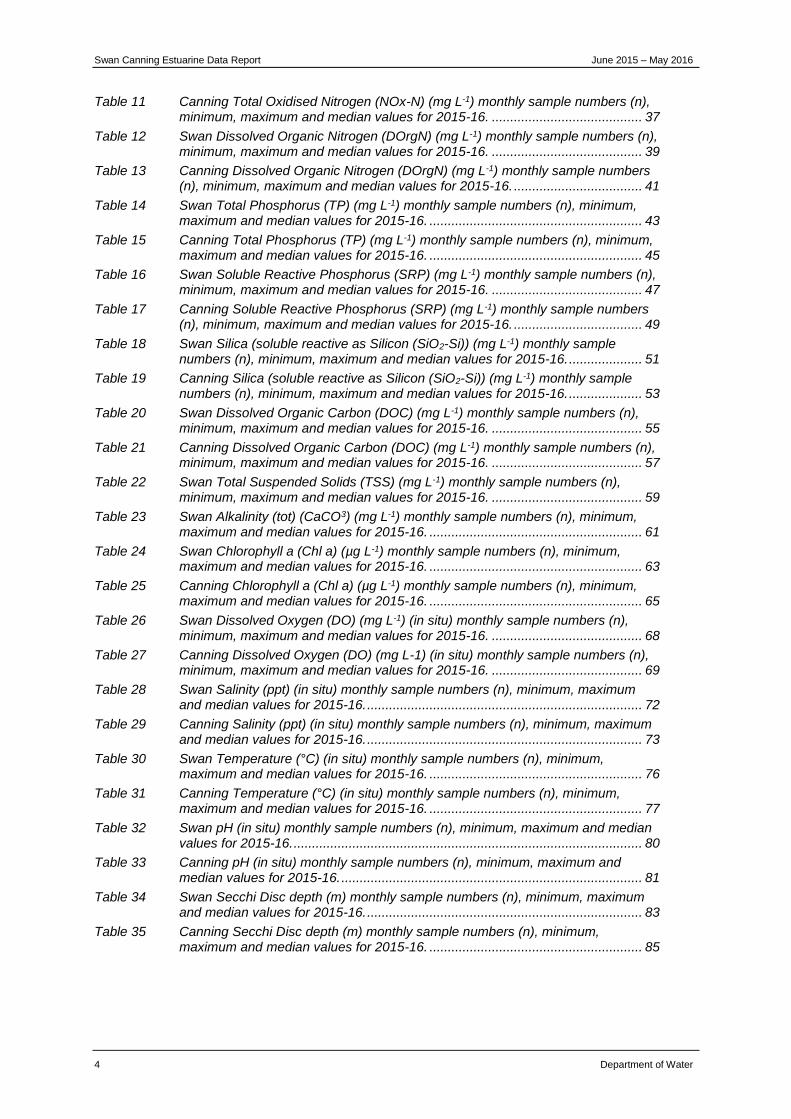
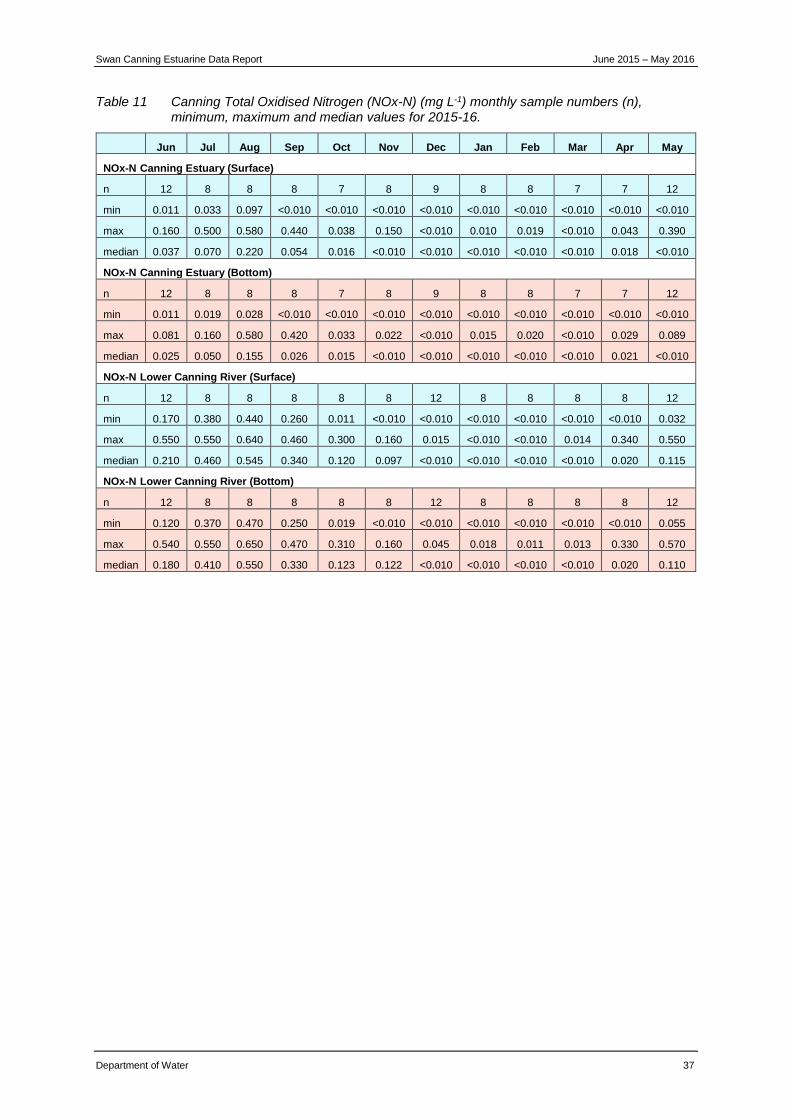
Table 11 Canning Total Oxidised Nitrogen (NOx-N) (mg L-1) monthly sample numbers (n), minimum, maximum and median values for 2015-16. ......................................... 37
Table 12 Swan Dissolved Organic Nitrogen (DOrgN) (mg L-1) monthly sample numbers (n), minimum, maximum and median values for 2015-16. ......................................... 39
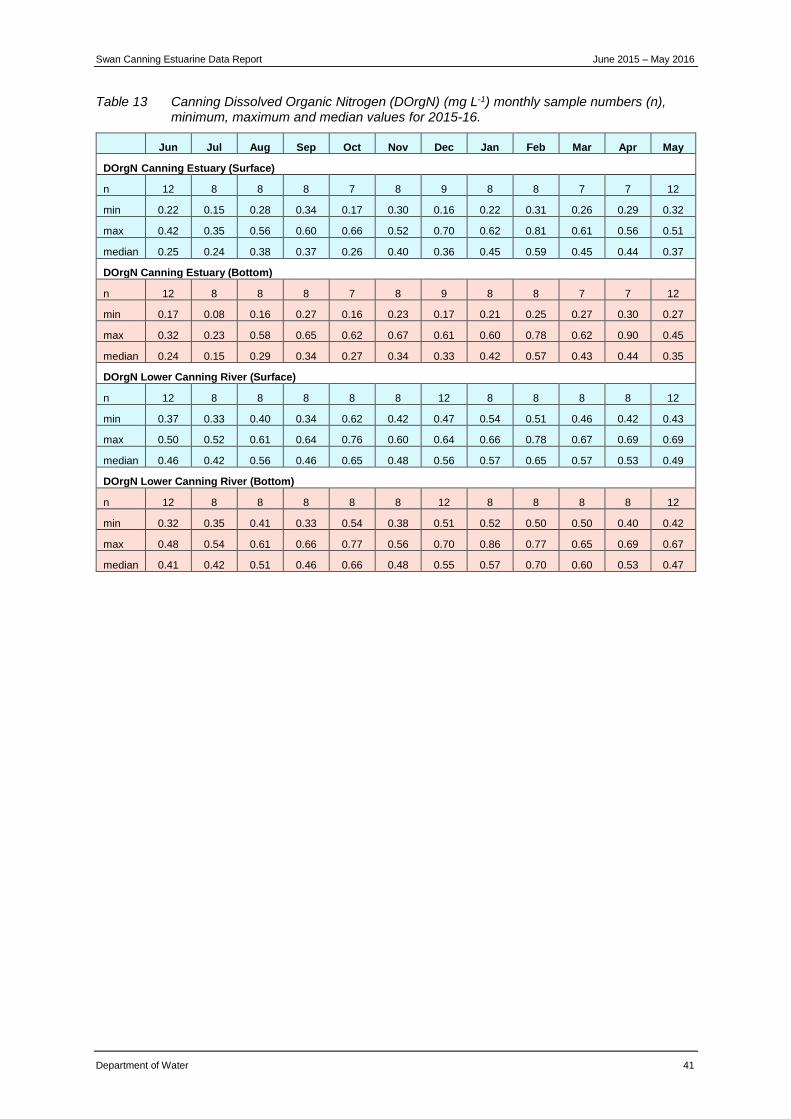
Table 13 Canning Dissolved Organic Nitrogen (DOrgN) (mg L-1) monthly sample numbers (n), minimum, maximum and median values for 2015-16. ................................... 41
Table 14 Swan Total Phosphorus (TP) (mg L-1) monthly sample numbers (n), minimum, maximum and median values for 2015-16. .......................................................... 43
Table 15 Canning Total Phosphorus (TP) (mg L-1) monthly sample numbers (n), minimum, maximum and median values for 2015-16. .......................................................... 45
Table 16 Swan Soluble Reactive Phosphorus (SRP) (mg L-1) monthly sample numbers (n), minimum, maximum and median values for 2015-16. ......................................... 47
Table 17 Canning Soluble Reactive Phosphorus (SRP) (mg L-1) monthly sample numbers (n), minimum, maximum and median values for 2015-16. ................................... 49
Table 18 Swan Silica (soluble reactive as Silicon (SiO2-Si)) (mg L-1) monthly sample numbers (n), minimum, maximum and median values for 2015-16. .................... 51
Table 19 Canning Silica (soluble reactive as Silicon (SiO2-Si)) (mg L-1) monthly sample numbers (n), minimum, maximum and median values for 2015-16. .................... 53
Table 20 Swan Dissolved Organic Carbon (DOC) (mg L-1) monthly sample numbers (n), minimum, maximum and median values for 2015-16. ......................................... 55
Table 21 Canning Dissolved Organic Carbon (DOC) (mg L-1) monthly sample numbers (n), minimum, maximum and median values for 2015-16. ......................................... 57
Table 22 Swan Total Suspended Solids (TSS) (mg L-1) monthly sample numbers (n), minimum, maximum and median values for 2015-16. ......................................... 59
Table 23 Swan Alkalinity (tot) (CaCO3) (mg L-1) monthly sample numbers (n), minimum, maximum and median values for 2015-16. .......................................................... 61
Table 24 Swan Chlorophyll a (Chl a) (µg L-1) monthly sample numbers (n), minimum, maximum and median values for 2015-16. .......................................................... 63
Table 25 Canning Chlorophyll a (Chl a) (µg L-1) monthly sample numbers (n), minimum, maximum and median values for 2015-16. .......................................................... 65
Table 26 Swan Dissolved Oxygen (DO) (mg L-1) (in situ) monthly sample numbers (n), minimum, maximum and median values for 2015-16. ......................................... 68
Table 27 Canning Dissolved Oxygen (DO) (mg L-1) (in situ) monthly sample numbers (n), minimum, maximum and median values for 2015-16. ......................................... 69
Table 28 Swan Salinity (ppt) (in situ) monthly sample numbers (n), minimum, maximum and median values for 2015-16. ........................................................................... 72
Table 29 Canning Salinity (ppt) (in situ) monthly sample numbers (n), minimum, maximum and median values for 2015-16. ........................................................................... 73
Table 30 Swan Temperature (°C) (in situ) monthly sample numbers (n), minimum, maximum and median values for 2015-16. .......................................................... 76
Table 31 Canning Temperature (°C) (in situ) monthly sample numbers (n), minimum, maximum and median values for 2015-16. .......................................................... 77
Table 32 Swan pH (in situ) monthly sample numbers (n), minimum, maximum and median values for 2015-16. ............................................................................................... 80
Table 33 Canning pH (in situ) monthly sample numbers (n), minimum, maximum and median values for 2015-16. .................................................................................. 81
Table 34 Swan Secchi Disc depth (m) monthly sample numbers (n), minimum, maximum and median values for 2015-16. ........................................................................... 83
Table 35 Canning Secchi Disc depth (m) monthly sample numbers (n), minimum, maximum and median values for 2015-16. .......................................................... 85
Swan Canning Estuarine Data Report June 2015 – May 2016
5 Department of Water
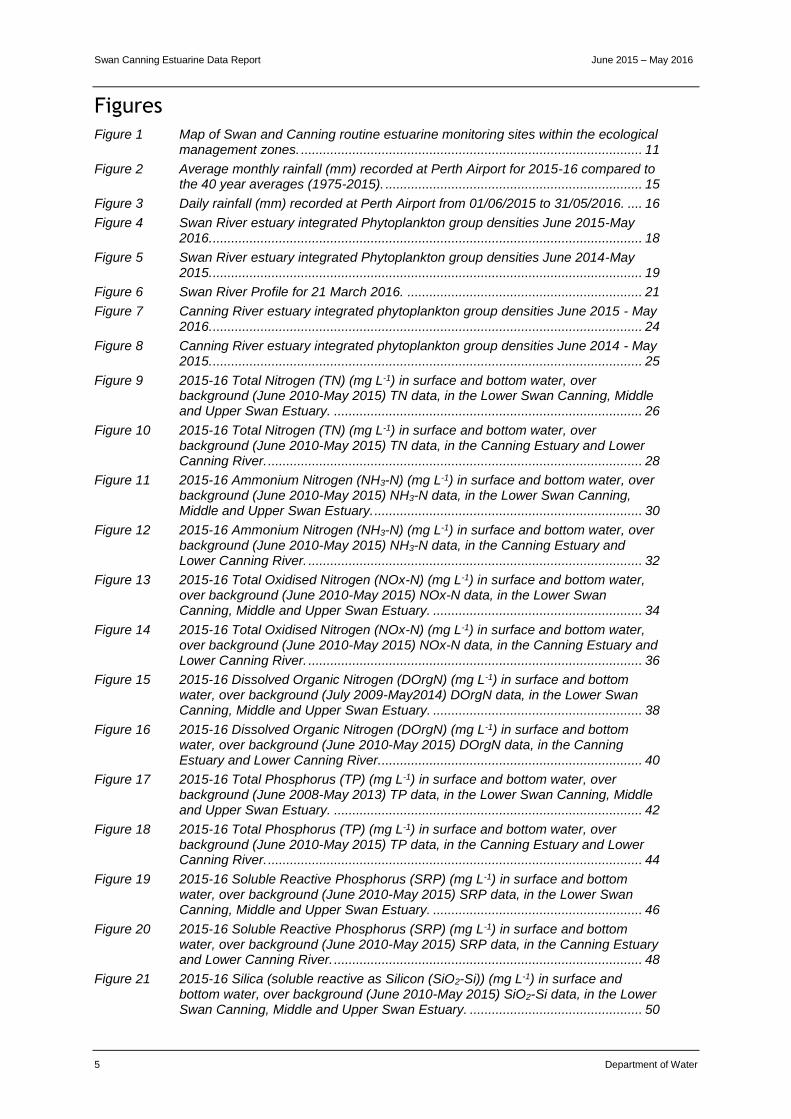
Figures
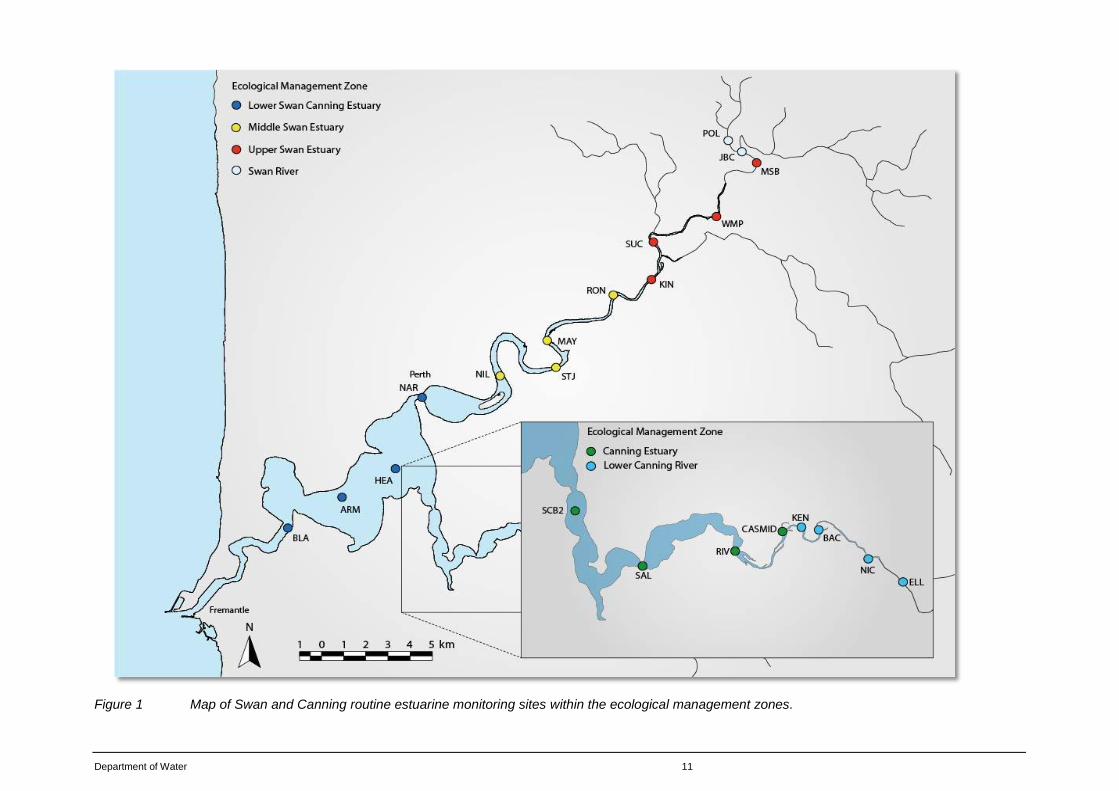
Figure 1 Map of Swan and Canning routine estuarine monitoring sites within the ecological management zones. ............................................................................................. 11
Figure 2 Average monthly rainfall (mm) recorded at Perth Airport for 2015-16 compared to the 40 year averages (1975-2015). ...................................................................... 15
Figure 3 Daily rainfall (mm) recorded at Perth Airport from 01/06/2015 to 31/05/2016. .... 16
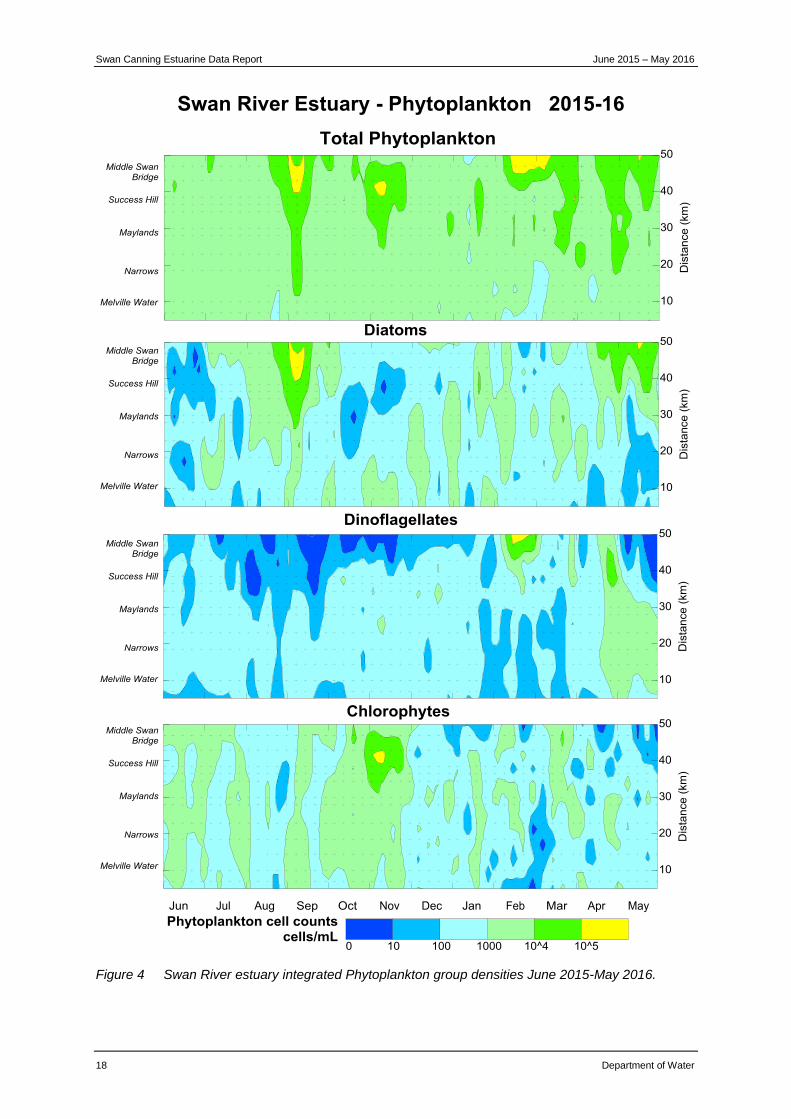
Figure 4 Swan River estuary integrated Phytoplankton group densities June 2015-May 2016. ..................................................................................................................... 18
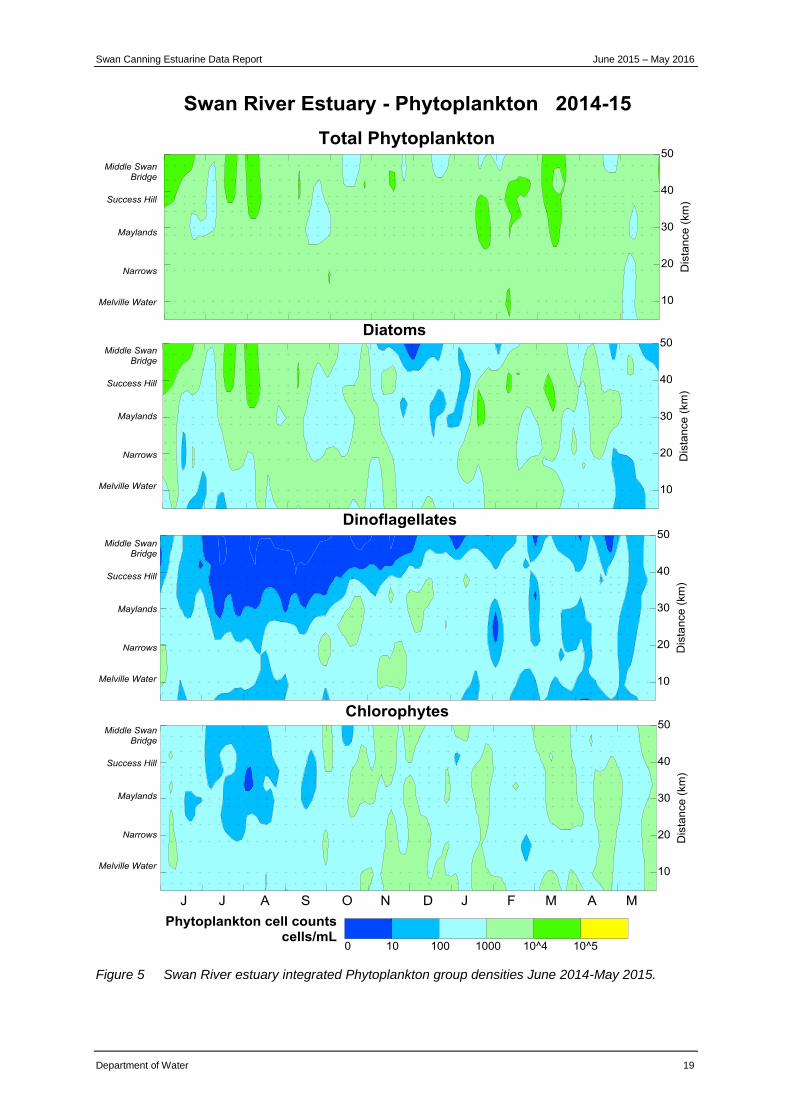
Figure 5 Swan River estuary integrated Phytoplankton group densities June 2014-May 2015. ..................................................................................................................... 19
Figure 6 Swan River Profile for 21 March 2016. ................................................................ 21
Figure 7 Canning River estuary integrated phytoplankton group densities June 2015 - May 2016. ..................................................................................................................... 24
Figure 8 Canning River estuary integrated phytoplankton group densities June 2014 - May 2015. ..................................................................................................................... 25
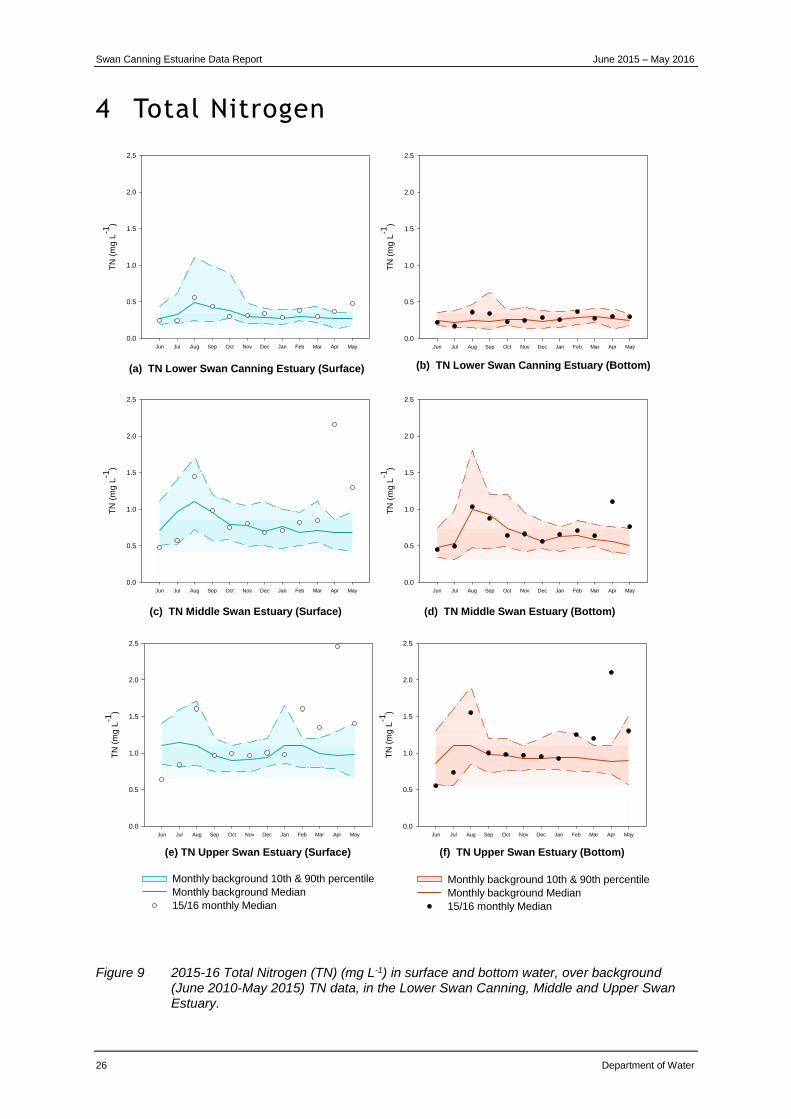
Figure 9 2015-16 Total Nitrogen (TN) (mg L-1) in surface and bottom water, over background (June 2010-May 2015) TN data, in the Lower Swan Canning, Middle and Upper Swan Estuary. .................................................................................... 26
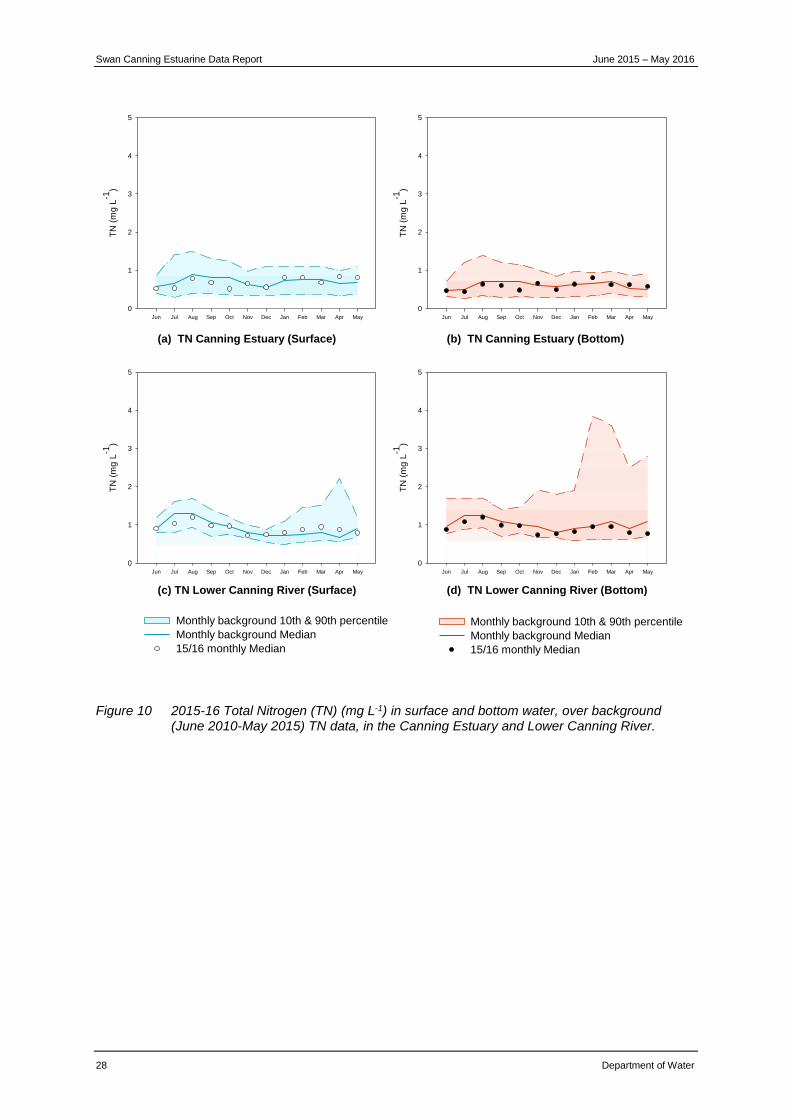
Figure 10 2015-16 Total Nitrogen (TN) (mg L-1) in surface and bottom water, over background (June 2010-May 2015) TN data, in the Canning Estuary and Lower Canning River. ...................................................................................................... 28
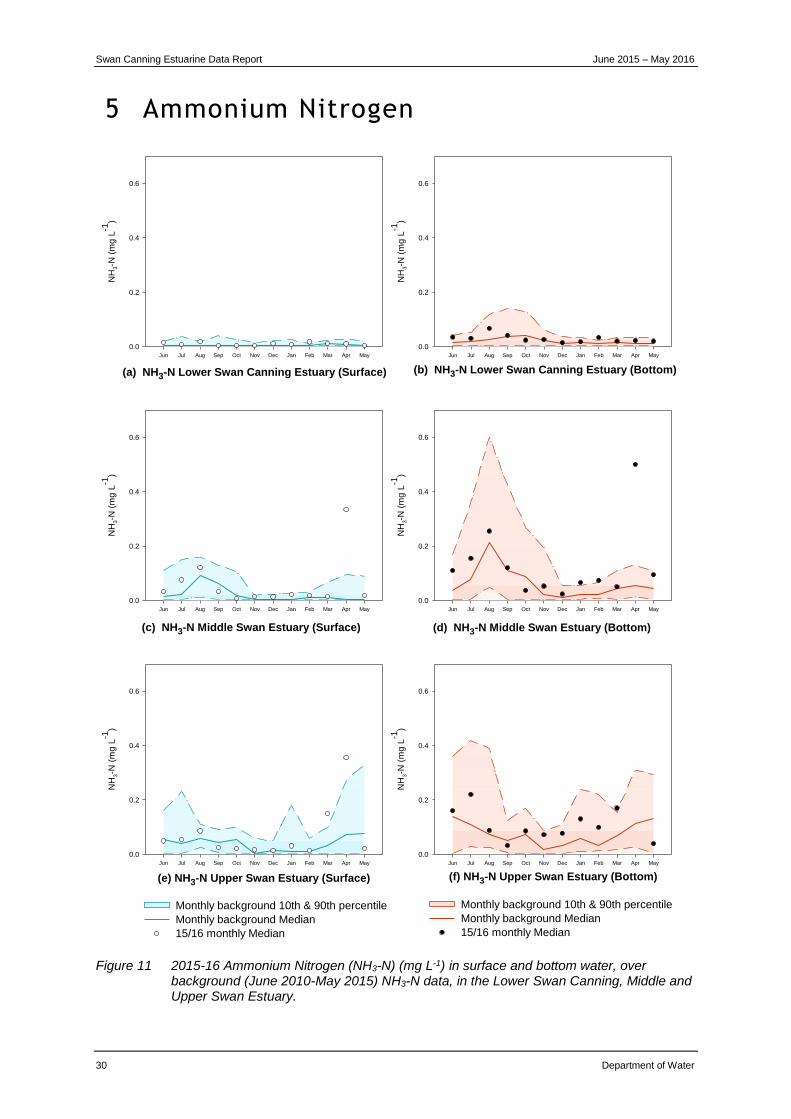
Figure 11 2015-16 Ammonium Nitrogen (NH3-N) (mg L-1) in surface and bottom water, over background (June 2010-May 2015) NH3-N data, in the Lower Swan Canning, Middle and Upper Swan Estuary. ......................................................................... 30
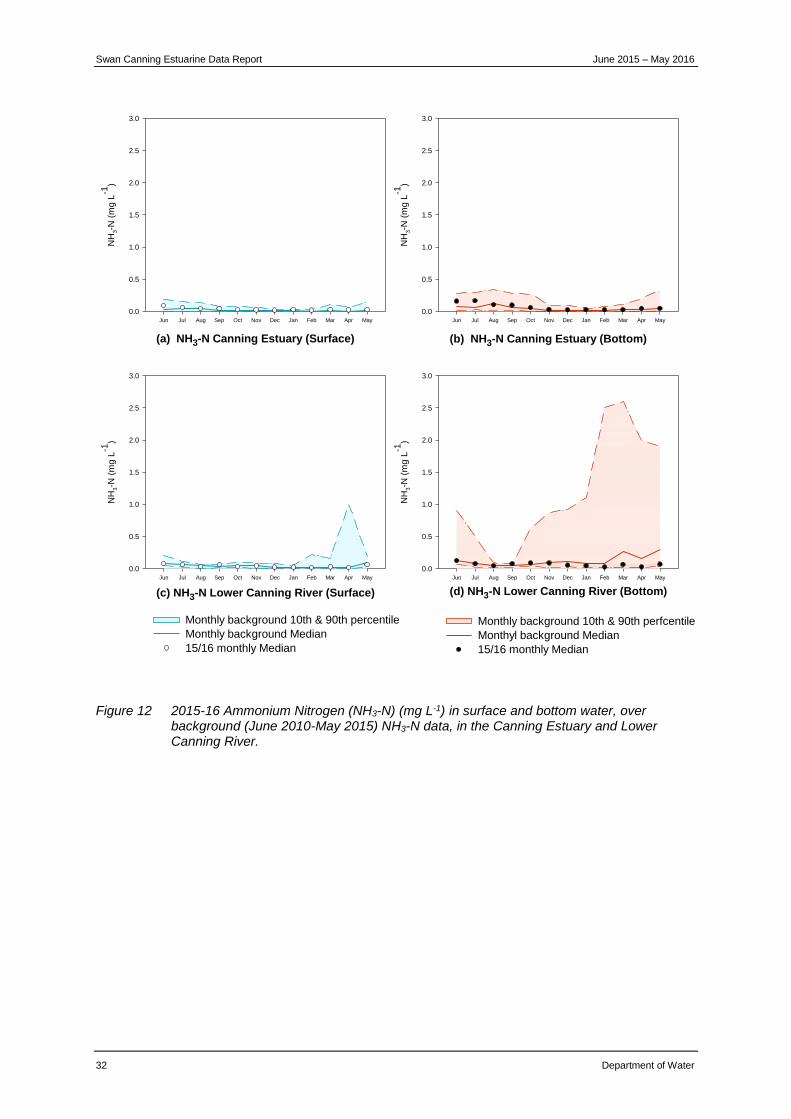
Figure 12 2015-16 Ammonium Nitrogen (NH3-N) (mg L-1) in surface and bottom water, over background (June 2010-May 2015) NH3-N data, in the Canning Estuary and Lower Canning River. ........................................................................................... 32
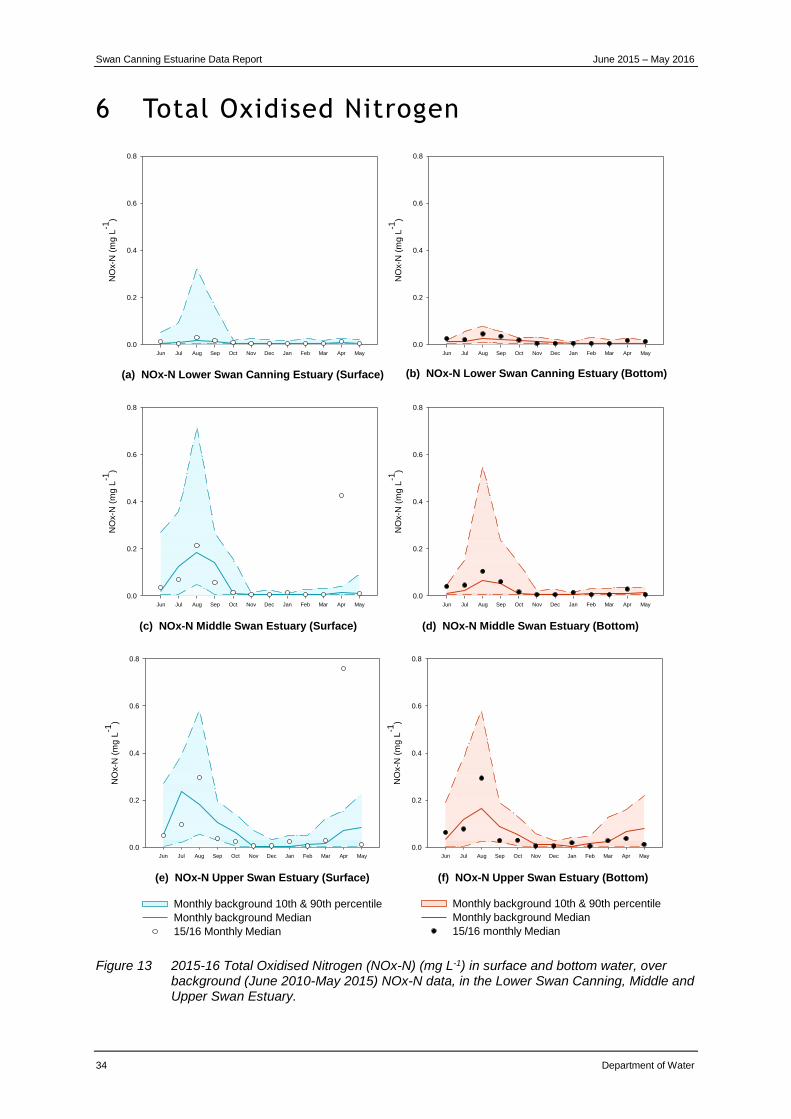
Figure 13 2015-16 Total Oxidised Nitrogen (NOx-N) (mg L-1) in surface and bottom water, over background (June 2010-May 2015) NOx-N data, in the Lower Swan Canning, Middle and Upper Swan Estuary. ......................................................... 34
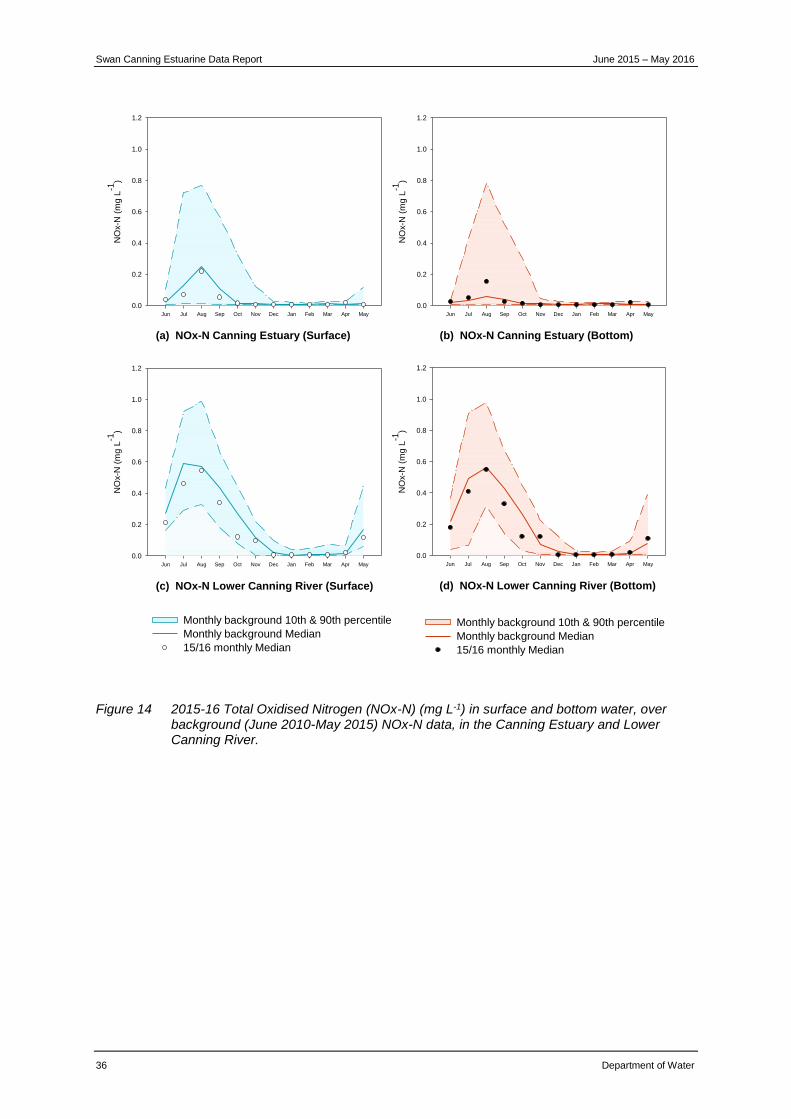
Figure 14 2015-16 Total Oxidised Nitrogen (NOx-N) (mg L-1) in surface and bottom water, over background (June 2010-May 2015) NOx-N data, in the Canning Estuary and Lower Canning River. ........................................................................................... 36
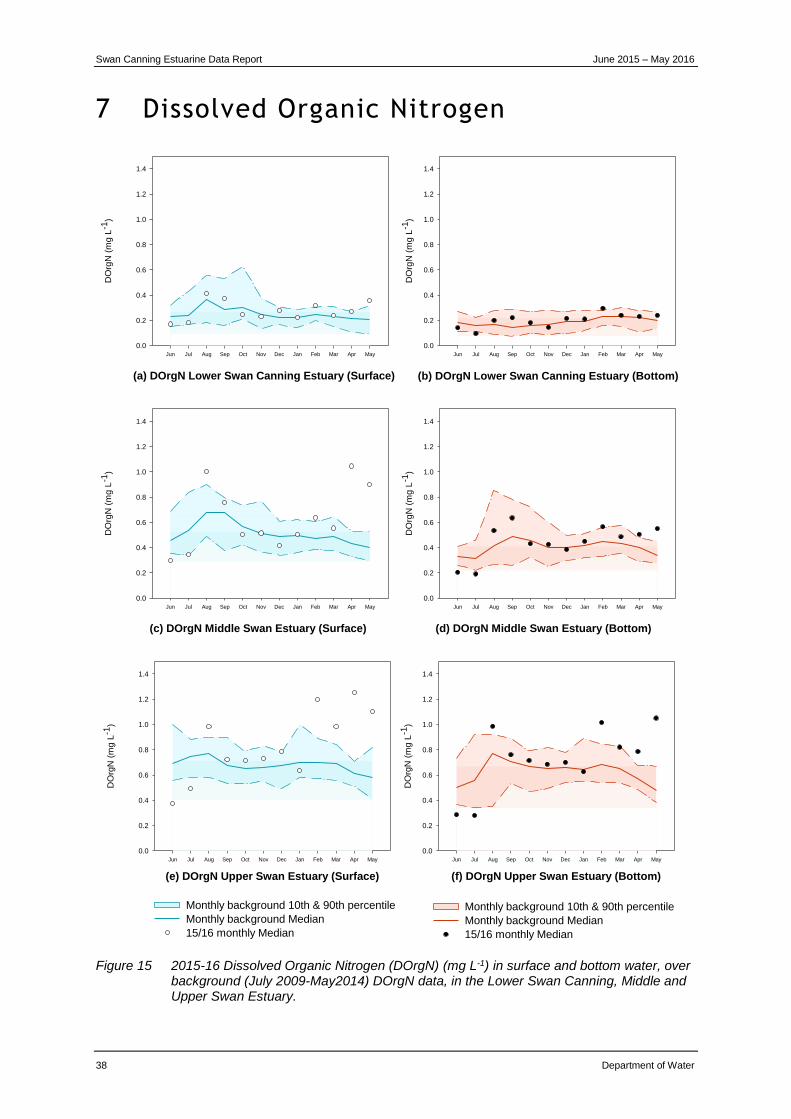
Figure 15 2015-16 Dissolved Organic Nitrogen (DOrgN) (mg L-1) in surface and bottom water, over background (July 2009-May2014) DOrgN data, in the Lower Swan Canning, Middle and Upper Swan Estuary. ......................................................... 38
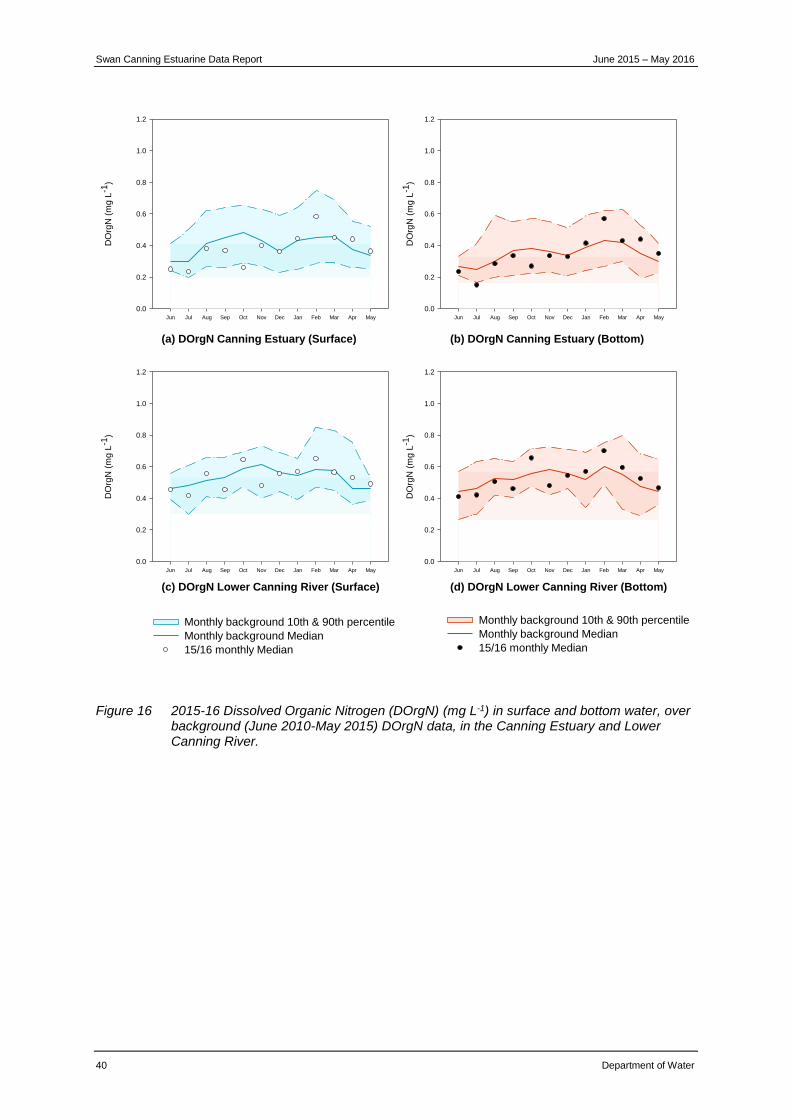
Figure 16 2015-16 Dissolved Organic Nitrogen (DOrgN) (mg L-1) in surface and bottom water, over background (June 2010-May 2015) DOrgN data, in the Canning Estuary and Lower Canning River........................................................................ 40
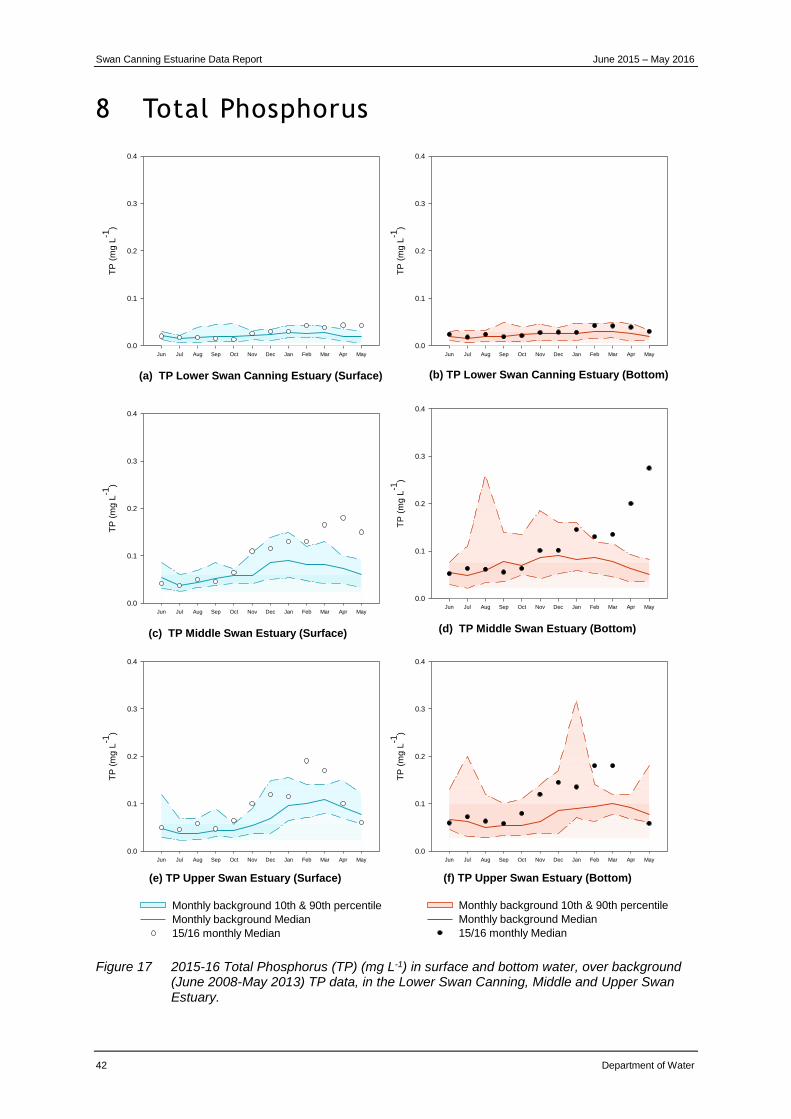
Figure 17 2015-16 Total Phosphorus (TP) (mg L-1) in surface and bottom water, over background (June 2008-May 2013) TP data, in the Lower Swan Canning, Middle and Upper Swan Estuary. .................................................................................... 42
Figure 18 2015-16 Total Phosphorus (TP) (mg L-1) in surface and bottom water, over background (June 2010-May 2015) TP data, in the Canning Estuary and Lower Canning River. ...................................................................................................... 44
Figure 19 2015-16 Soluble Reactive Phosphorus (SRP) (mg L-1) in surface and bottom water, over background (June 2010-May 2015) SRP data, in the Lower Swan Canning, Middle and Upper Swan Estuary. ......................................................... 46
Figure 20 2015-16 Soluble Reactive Phosphorus (SRP) (mg L-1) in surface and bottom water, over background (June 2010-May 2015) SRP data, in the Canning Estuary and Lower Canning River. .................................................................................... 48
Figure 21 2015-16 Silica (soluble reactive as Silicon (SiO2-Si)) (mg L-1) in surface and bottom water, over background (June 2010-May 2015) SiO2-Si data, in the Lower Swan Canning, Middle and Upper Swan Estuary. ............................................... 50
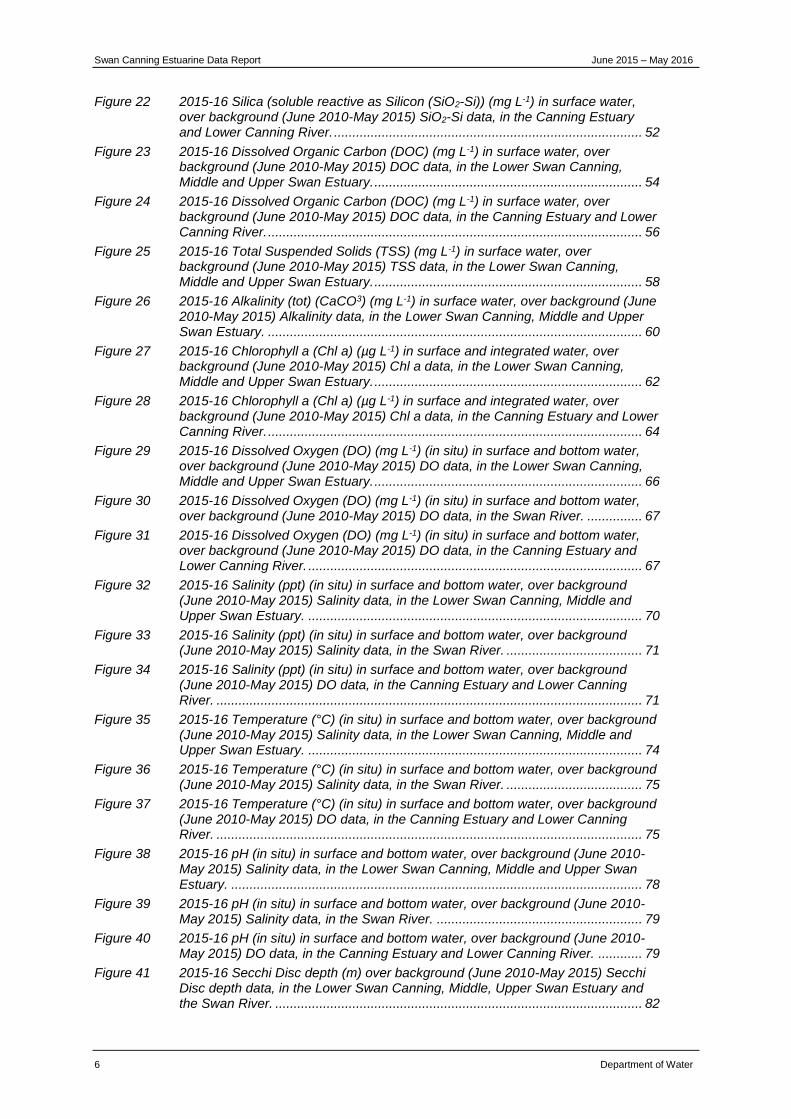
Swan Canning Estuarine Data Report June 2015 – May 2016
6 Department of Water
Figure 22 2015-16 Silica (soluble reactive as Silicon (SiO2-Si)) (mg L-1) in surface water, over background (June 2010-May 2015) SiO2-Si data, in the Canning Estuary and Lower Canning River. .................................................................................... 52
Figure 23 2015-16 Dissolved Organic Carbon (DOC) (mg L-1) in surface water, over background (June 2010-May 2015) DOC data, in the Lower Swan Canning, Middle and Upper Swan Estuary. ......................................................................... 54
Figure 24 2015-16 Dissolved Organic Carbon (DOC) (mg L-1) in surface water, over background (June 2010-May 2015) DOC data, in the Canning Estuary and Lower Canning River. ...................................................................................................... 56
Figure 25 2015-16 Total Suspended Solids (TSS) (mg L-1) in surface water, over background (June 2010-May 2015) TSS data, in the Lower Swan Canning, Middle and Upper Swan Estuary. ......................................................................... 58
Figure 26 2015-16 Alkalinity (tot) (CaCO3) (mg L-1) in surface water, over background (June 2010-May 2015) Alkalinity data, in the Lower Swan Canning, Middle and Upper Swan Estuary. ...................................................................................................... 60
Figure 27 2015-16 Chlorophyll a (Chl a) (µg L-1) in surface and integrated water, over background (June 2010-May 2015) Chl a data, in the Lower Swan Canning, Middle and Upper Swan Estuary. ......................................................................... 62
Figure 28 2015-16 Chlorophyll a (Chl a) (µg L-1) in surface and integrated water, over background (June 2010-May 2015) Chl a data, in the Canning Estuary and Lower Canning River. ...................................................................................................... 64
Figure 29 2015-16 Dissolved Oxygen (DO) (mg L-1) (in situ) in surface and bottom water, over background (June 2010-May 2015) DO data, in the Lower Swan Canning, Middle and Upper Swan Estuary. ......................................................................... 66
Figure 30 2015-16 Dissolved Oxygen (DO) (mg L-1) (in situ) in surface and bottom water, over background (June 2010-May 2015) DO data, in the Swan River. ............... 67
Figure 31 2015-16 Dissolved Oxygen (DO) (mg L-1) (in situ) in surface and bottom water, over background (June 2010-May 2015) DO data, in the Canning Estuary and Lower Canning River. ........................................................................................... 67
Figure 32 2015-16 Salinity (ppt) (in situ) in surface and bottom water, over background (June 2010-May 2015) Salinity data, in the Lower Swan Canning, Middle and Upper Swan Estuary. ........................................................................................... 70
Figure 33 2015-16 Salinity (ppt) (in situ) in surface and bottom water, over background (June 2010-May 2015) Salinity data, in the Swan River. ..................................... 71
Figure 34 2015-16 Salinity (ppt) (in situ) in surface and bottom water, over background (June 2010-May 2015) DO data, in the Canning Estuary and Lower Canning River. .................................................................................................................... 71
Figure 35 2015-16 Temperature (°C) (in situ) in surface and bottom water, over background (June 2010-May 2015) Salinity data, in the Lower Swan Canning, Middle and Upper Swan Estuary. ........................................................................................... 74
Figure 36 2015-16 Temperature (°C) (in situ) in surface and bottom water, over background (June 2010-May 2015) Salinity data, in the Swan River. ..................................... 75
Figure 37 2015-16 Temperature (°C) (in situ) in surface and bottom water, over background (June 2010-May 2015) DO data, in the Canning Estuary and Lower Canning River. .................................................................................................................... 75
Figure 38 2015-16 pH (in situ) in surface and bottom water, over background (June 2010-May 2015) Salinity data, in the Lower Swan Canning, Middle and Upper Swan Estuary. ................................................................................................................ 78
Figure 39 2015-16 pH (in situ) in surface and bottom water, over background (June 2010-May 2015) Salinity data, in the Swan River. ........................................................ 79
Figure 40 2015-16 pH (in situ) in surface and bottom water, over background (June 2010-May 2015) DO data, in the Canning Estuary and Lower Canning River. ............ 79
Figure 41 2015-16 Secchi Disc depth (m) over background (June 2010-May 2015) Secchi Disc depth data, in the Lower Swan Canning, Middle, Upper Swan Estuary and the Swan River. .................................................................................................... 82
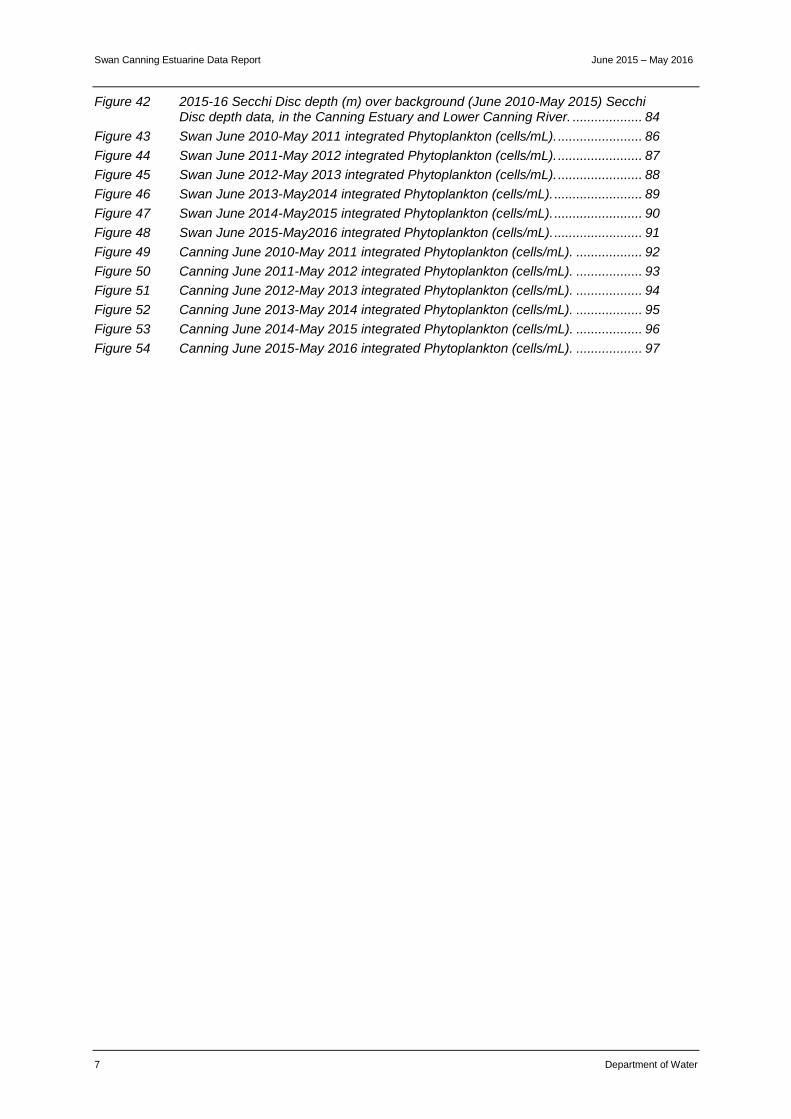
Swan Canning Estuarine Data Report June 2015 – May 2016
7 Department of Water
Figure 42 2015-16 Secchi Disc depth (m) over background (June 2010-May 2015) Secchi Disc depth data, in the Canning Estuary and Lower Canning River. ................... 84
Figure 43 Swan June 2010-May 2011 integrated Phytoplankton (cells/mL). ....................... 86
Figure 44 Swan June 2011-May 2012 integrated Phytoplankton (cells/mL). ....................... 87
Figure 45 Swan June 2012-May 2013 integrated Phytoplankton (cells/mL). ....................... 88
Figure 46 Swan June 2013-May2014 integrated Phytoplankton (cells/mL). ........................ 89
Figure 47 Swan June 2014-May2015 integrated Phytoplankton (cells/mL). ........................ 90
Figure 48 Swan June 2015-May2016 integrated Phytoplankton (cells/mL). ........................ 91
Figure 49 Canning June 2010-May 2011 integrated Phytoplankton (cells/mL). .................. 92
Figure 50 Canning June 2011-May 2012 integrated Phytoplankton (cells/mL). .................. 93
Figure 51 Canning June 2012-May 2013 integrated Phytoplankton (cells/mL). .................. 94
Figure 52 Canning June 2013-May 2014 integrated Phytoplankton (cells/mL). .................. 95
Figure 53 Canning June 2014-May 2015 integrated Phytoplankton (cells/mL). .................. 96
Figure 54 Canning June 2015-May 2016 integrated Phytoplankton (cells/mL). .................. 97
Swan Canning Estuarine Data Report June 2015 – May 2016
8 Department of Water
1 Preface The Swan Canning Environmental Monitoring and Reporting project is a long term monitoring project consisting of regular sampling of the Swan and Canning Rivers and the Swan Canning catchment, enabling regular water quality reporting and annual reporting on estuarine and catchment compliance. The project was designed and implemented in 1994 by the Swan River Trust and Department of Water (then Water and Rivers Commission) as part of the Swan Canning Clean-up Program Action Plan. The project is currently delivered through the Department of Parks and Wildlife in partnership with the Water Science Branch of the Department of Water.
The estuarine water sampling conducted for this monitoring project falls under several Department of Water WIN data management projects. These are:
SG-E-SWANEST – Swan River Estuary Sampling. This project consists of weekly sampling at twenty-one fixed sites (12 grab sample sites) from Blackwall Reach upstream to Power Line crossing in West Swan. This sampling is generally conducted every Monday, split into the lower Swan run, using the Department of Parks and Wildlife boat Kwilana, and the upper Swan run using the Department of Parks and Wildlife boat Kepa. For the lower Swan run sites, sampling began in October 1994 but was somewhat intermittent until 1999. For the upper Swan sites, sampling began November 2006.
SG-E-CANEST – Canning River Estuary Sampling. This project consists of weekly sampling at eight fixed sites from South Canning Bridge upstream to Ellison Drive in Langford. This sampling is generally conducted every Tuesday and is split into two runs, conducted simultaneously using Department of Parks and Wildlife boats the Trekker and the Kepa. Sampling began January 1995 but was somewhat intermittent until 1999.
SG-E-UPPERSWAN – Upper Swan River Estuary Sampling. This project was closed and the sites were added to the SG-E-SWANEST project from July 2010.
SG-E-SWANCOMP – Swan River Compliance Sampling. This project consists of weekly sampling at an additional site from the first week of January to last week of May. The weekly compliance site is located at a randomly selected sampling point (site code prefix of SWL) on a grid of Melville waters. Two randomly selected sites on the lower Swan run and RIV on the Canning run are also sampled for the Swan compliance program (Table 2 and Table 3). The compliance sampling is incorporated into the regular weekly SWANEST and CANEST sampling runs. Sampling began in 1999. A report of the compliance data is produced annually at the end of June.
Swan Canning Estuarine Data Report June 2015 – May 2016
9 Department of Water
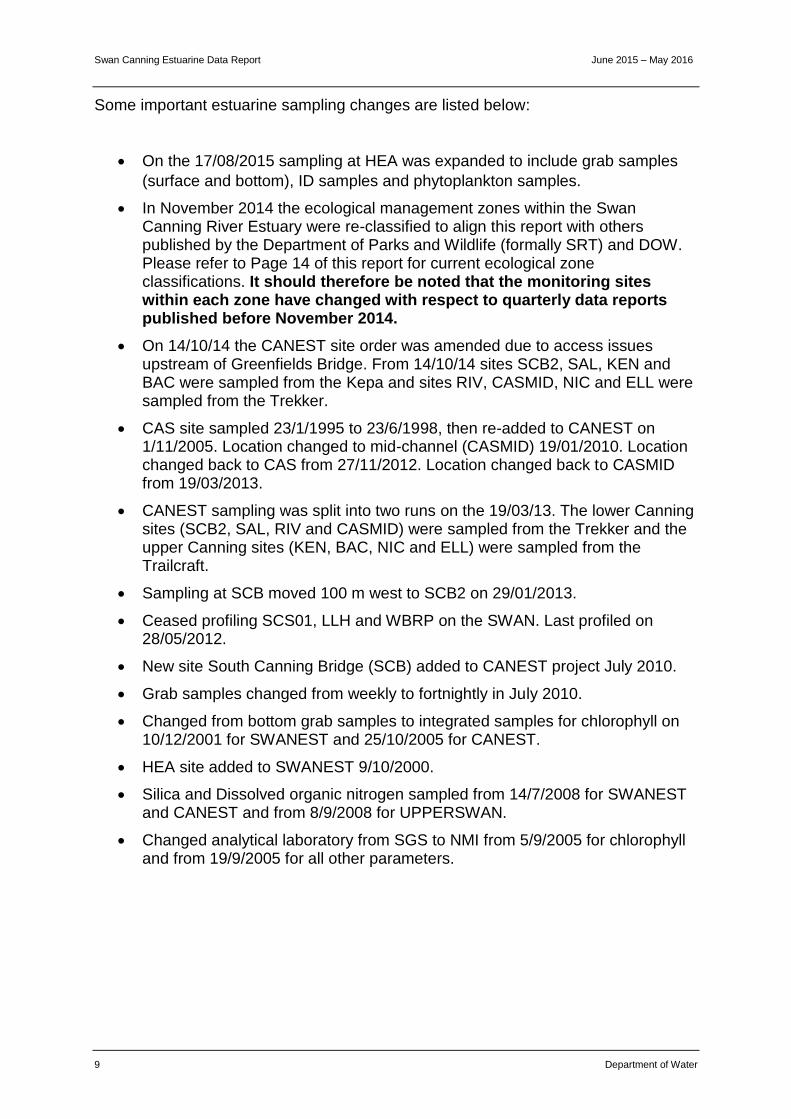
Some important estuarine sampling changes are listed below:
On the 17/08/2015 sampling at HEA was expanded to include grab samples
(surface and bottom), ID samples and phytoplankton samples.
In November 2014 the ecological management zones within the Swan Canning River Estuary were re-classified to align this report with others published by the Department of Parks and Wildlife (formally SRT) and DOW. Please refer to Page 14 of this report for current ecological zone classifications. It should therefore be noted that the monitoring sites within each zone have changed with respect to quarterly data reports published before November 2014.
On 14/10/14 the CANEST site order was amended due to access issues upstream of Greenfields Bridge. From 14/10/14 sites SCB2, SAL, KEN and BAC were sampled from the Kepa and sites RIV, CASMID, NIC and ELL were sampled from the Trekker.
CAS site sampled 23/1/1995 to 23/6/1998, then re-added to CANEST on 1/11/2005. Location changed to mid-channel (CASMID) 19/01/2010. Location changed back to CAS from 27/11/2012. Location changed back to CASMID from 19/03/2013.
CANEST sampling was split into two runs on the 19/03/13. The lower Canning sites (SCB2, SAL, RIV and CASMID) were sampled from the Trekker and the upper Canning sites (KEN, BAC, NIC and ELL) were sampled from the Trailcraft.
Sampling at SCB moved 100 m west to SCB2 on 29/01/2013.
Ceased profiling SCS01, LLH and WBRP on the SWAN. Last profiled on 28/05/2012.
New site South Canning Bridge (SCB) added to CANEST project July 2010.
Grab samples changed from weekly to fortnightly in July 2010.
Changed from bottom grab samples to integrated samples for chlorophyll on 10/12/2001 for SWANEST and 25/10/2005 for CANEST.
HEA site added to SWANEST 9/10/2000.
Silica and Dissolved organic nitrogen sampled from 14/7/2008 for SWANEST and CANEST and from 8/9/2008 for UPPERSWAN.
Changed analytical laboratory from SGS to NMI from 5/9/2005 for chlorophyll and from 19/9/2005 for all other parameters.
Swan Canning Estuarine Data Report June 2015 – May 2016
10 Department of Water
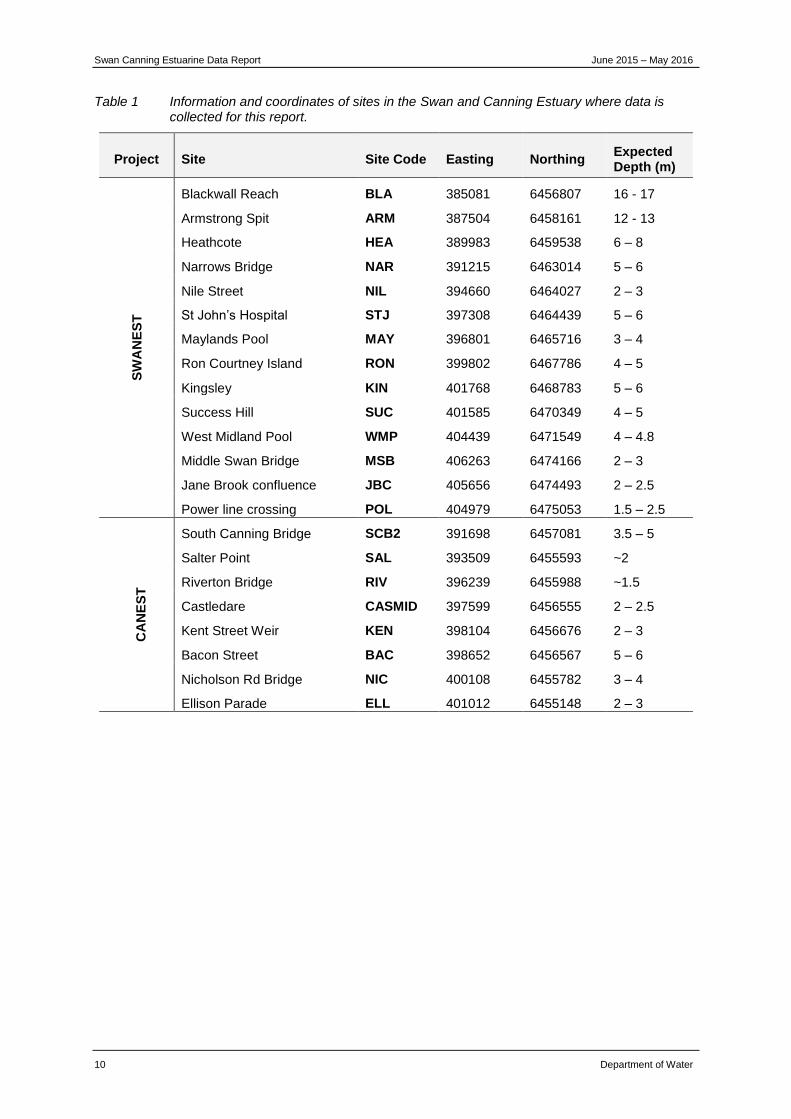
Table 1 Information and coordinates of sites in the Swan and Canning Estuary where data is collected for this report.
Project Site Site Code Easting Northing Expected Depth (m)
SW
AN
ES
T
Blackwall Reach BLA 385081 6456807 16 - 17
Armstrong Spit ARM 387504 6458161 12 - 13
Heathcote HEA 389983 6459538 6 – 8
Narrows Bridge NAR 391215 6463014 5 – 6
Nile Street NIL 394660 6464027 2 – 3
St John’s Hospital STJ 397308 6464439 5 – 6
Maylands Pool MAY 396801 6465716 3 – 4
Ron Courtney Island RON 399802 6467786 4 – 5
Kingsley KIN 401768 6468783 5 – 6
Success Hill SUC 401585 6470349 4 – 5
West Midland Pool WMP 404439 6471549 4 – 4.8
Middle Swan Bridge MSB 406263 6474166 2 – 3
Jane Brook confluence JBC 405656 6474493 2 – 2.5
Power line crossing POL 404979 6475053 1.5 – 2.5
CA
NE
ST
South Canning Bridge SCB2 391698 6457081 3.5 – 5
Salter Point SAL 393509 6455593 ~2
Riverton Bridge RIV 396239 6455988 ~1.5
Castledare CASMID 397599 6456555 2 – 2.5
Kent Street Weir KEN 398104 6456676 2 – 3
Bacon Street BAC 398652 6456567 5 – 6
Nicholson Rd Bridge NIC 400108 6455782 3 – 4
Ellison Parade ELL 401012 6455148 2 – 3
Department of Water 11
Figure 1 Map of Swan and Canning routine estuarine monitoring sites within the ecological management zones.
Swan Canning Estuarine Data Report June 2015 – May 2016
12 Department of Water
Table 2 Swan Estuary sampling regimes.
Project Site
Code
Frequency
Weekly or
Fortnightly
TN TP NOx NH3 SRP DOrgN SiO2 DOC TSS Alk Chl YSI
profile
in situ
Field
obs and
secchi
Phyto-
plankton
S B S B S B S B S B S B S B S S S S ID ID NET
SW
AN
ES
T
BLA W/F
ARM W/F
HEA W/F
NAR W/F
NIL W/F #
#
#
STJ W/F #
#
#
MAY W/F #
#
#
RON W/F #
#
#
KIN W/F # #
#
SUC W/F # #
#
WMP W/F
MSB W/F
JBC W
POL W
# Surface TN, TP and Chlorophyll are sampled weekly at two of these sites (randomly selected) from January to May for compliance calculations
(SWANCOMP) for Department of Parks and Wildlife estuarine KPI's.
S = surface
B = bottom
ID = integrated
YSI profile includes dissolved oxygen, temperature, conductivity and pH.
Swan Canning Estuarine Data Report June 2015 – May 2016
Department of Water 13
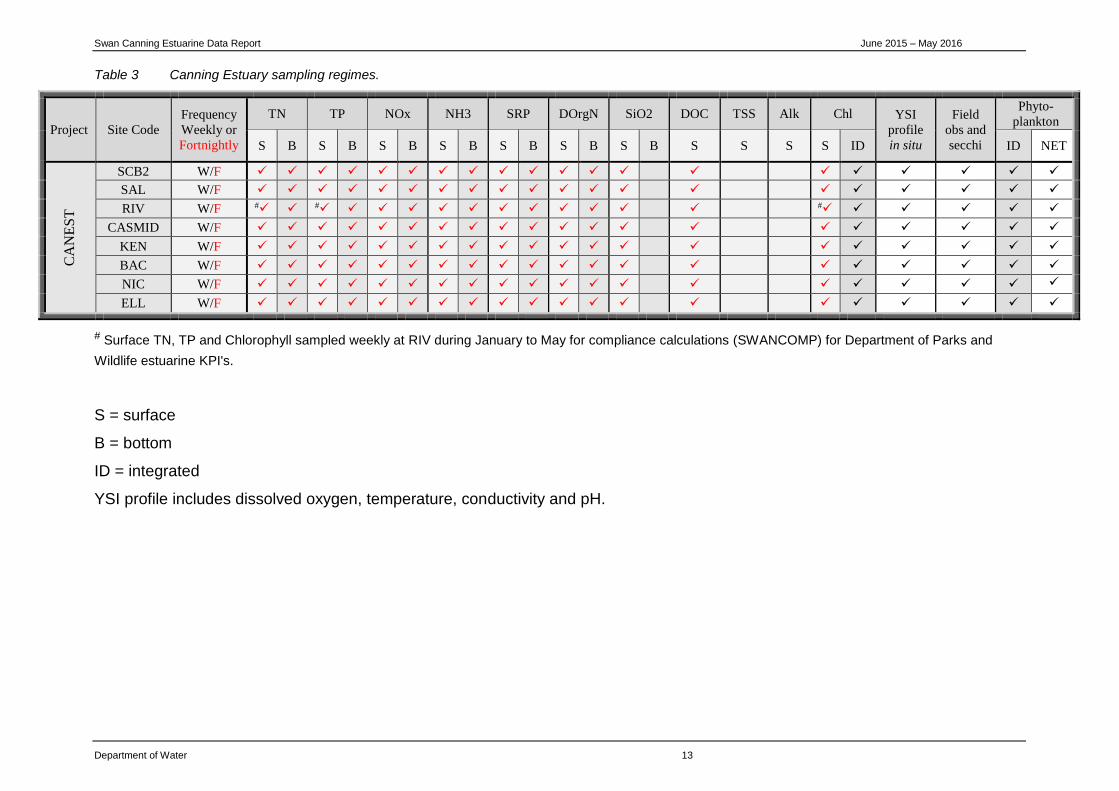
Table 3 Canning Estuary sampling regimes.
Project Site Code
Frequency
Weekly or
Fortnightly
TN TP NOx NH3 SRP DOrgN SiO2 DOC TSS Alk Chl YSI
profile
in situ
Field
obs and
secchi
Phyto-
plankton
S B S B S B S B S B S B S B S S S S ID ID NET
CA
NE
ST
SCB2 W/F
SAL W/F
RIV W/F # #
#
CASMID W/F
KEN W/F
BAC W/F
NIC W/F
ELL W/F
# Surface TN, TP and Chlorophyll sampled weekly at RIV during January to May for compliance calculations (SWANCOMP) for Department of Parks and
Wildlife estuarine KPI's.
S = surface
B = bottom
ID = integrated
YSI profile includes dissolved oxygen, temperature, conductivity and pH.

Swan Canning Estuarine Data Report June 2015 – May 2016
14 Department of Water
2 Introduction This Swan Canning estuarine quarterly data report presents background and current quarter data collected from a total of twenty two sites from the Swan and Canning Estuarine Environmental Monitoring program. Data is presented in graphical and tabular form for thirteen key analytes; total nitrogen, ammonium nitrogen, total oxidised nitrogen, dissolved organic nitrogen, total phosphorus, soluble reactive phosphorus, silica, dissolved organic carbon, total suspended solids, alkalinity, chlorophyll a, secchi depth, and phytoplankton, and four in situ profile data parameters; dissolved oxygen, salinity, temperature and pH. Data (except phytoplankton data) from the twenty two sites is grouped into six regions as follows;
Lower Swan Canning Estuary: BLA, ARM, HEA and NAR
Middle Swan Estuary: NIL, STJ, MAY and RON
Upper Swan Estuary: KIN, SUC, WMP and MSB
Swan River: JBC and POL
Canning Estuary: SCB2, SAL, RIV and CASMID
Lower Canning River: KEN, BAC, NIC and ELL
Graphical presentation of each analyte (except phytoplankton) and in situ parameter includes background monthly median, 10th and 90th percentile data overlain by the monthly medians of the current year. Estuarine data is presented over a June to May year so that the usual summer/autumn period of interest is kept together in one report and is still current for the final 4th quarter report. Quarterly reports correspond to 1st quarter (Jun-Aug), 2nd quarter (Sep-Nov), 3rd quarter (Dec-Feb) and 4th quarter (Mar-May) with the data from each quarterly report adding to the “current year” data already presented. This data report is the fourth quarterly data report for 2015-16 and presents data from June 2015 to May 2016 over background data generally from June 2010 to May 2015. Dates of background data vary for some analytes due to sampling changes (see Preface). All data recorded below the laboratory limit of reporting was halved in order to be presented graphically. The current year data (2015-16) is also presented in tables showing the number of samples collected for each analyte (n), the monthly minimum and maximum values and the monthly median for the current quarter. Phytoplankton data is presented as yearly contour plots for total phytoplankton, diatoms, dinoflagellates and chlorophytes for the Swan and Canning for 2010-11 to 2015-16. Weekly phytoplankton data from integrated water column samples is presented with no temporal or spatial grouping of the data. On 17 August 2015 phytoplankton sampling commenced at HEA in the lower Swan Canning Estuary. Data presented and discussed in the section titled, Key Observations from 2015-16, compares current year data (2015-16) to data from the previous year (2014-15).
Swan Canning Estuarine Data Report June 2015 – May 2016
Department of Water 15
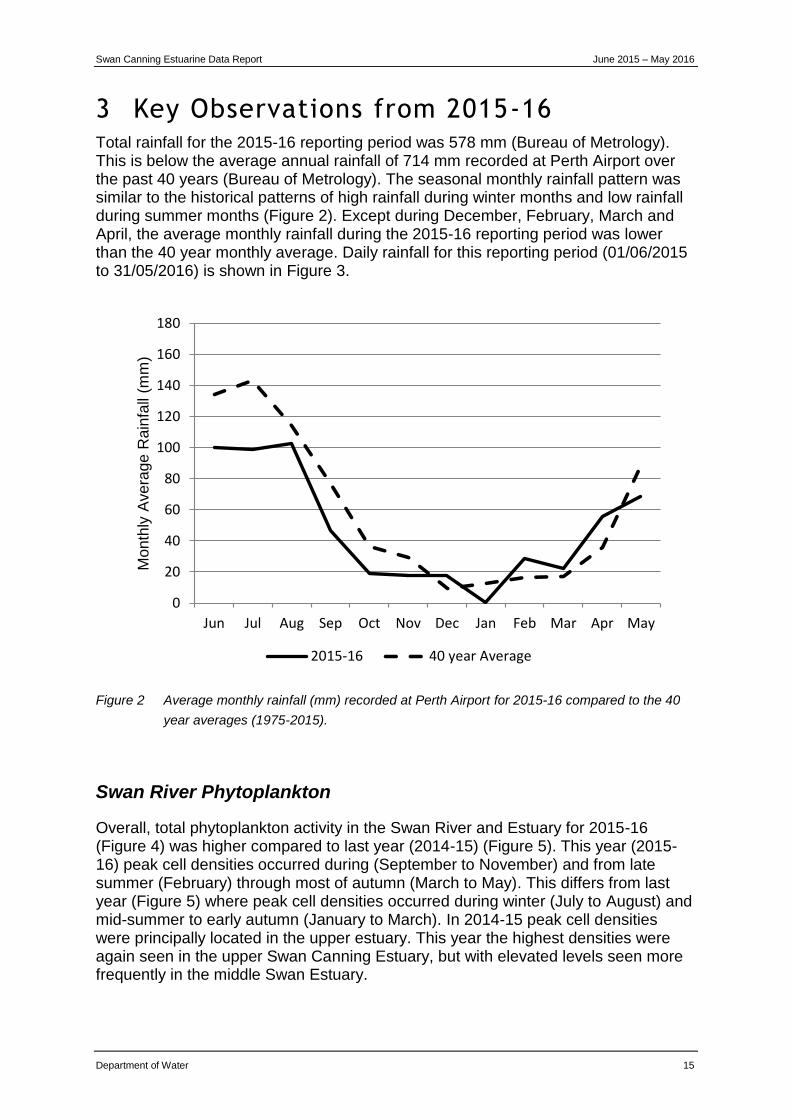
3 Key Observations from 2015-16 Total rainfall for the 2015-16 reporting period was 578 mm (Bureau of Metrology). This is below the average annual rainfall of 714 mm recorded at Perth Airport over the past 40 years (Bureau of Metrology). The seasonal monthly rainfall pattern was similar to the historical patterns of high rainfall during winter months and low rainfall during summer months (Figure 2). Except during December, February, March and April, the average monthly rainfall during the 2015-16 reporting period was lower than the 40 year monthly average. Daily rainfall for this reporting period (01/06/2015 to 31/05/2016) is shown in Figure 3.
Figure 2 Average monthly rainfall (mm) recorded at Perth Airport for 2015-16 compared to the 40
year averages (1975-2015).
Swan River Phytoplankton
Overall, total phytoplankton activity in the Swan River and Estuary for 2015-16 (Figure 4) was higher compared to last year (2014-15) (Figure 5). This year (2015-16) peak cell densities occurred during (September to November) and from late summer (February) through most of autumn (March to May). This differs from last year (Figure 5) where peak cell densities occurred during winter (July to August) and mid-summer to early autumn (January to March). In 2014-15 peak cell densities were principally located in the upper estuary. This year the highest densities were again seen in the upper Swan Canning Estuary, but with elevated levels seen more frequently in the middle Swan Estuary.
0
20
40
60
80
100
120
140
160
180
Jun Jul Aug Sep Oct Nov Dec Jan Feb Mar Apr May
Month
ly A
vera
ge R
ain
fall
(mm
)
2015-16 40 year Average
Swan Canning Estuarine Data Report June 2015 – May 2016
16 Department of Water
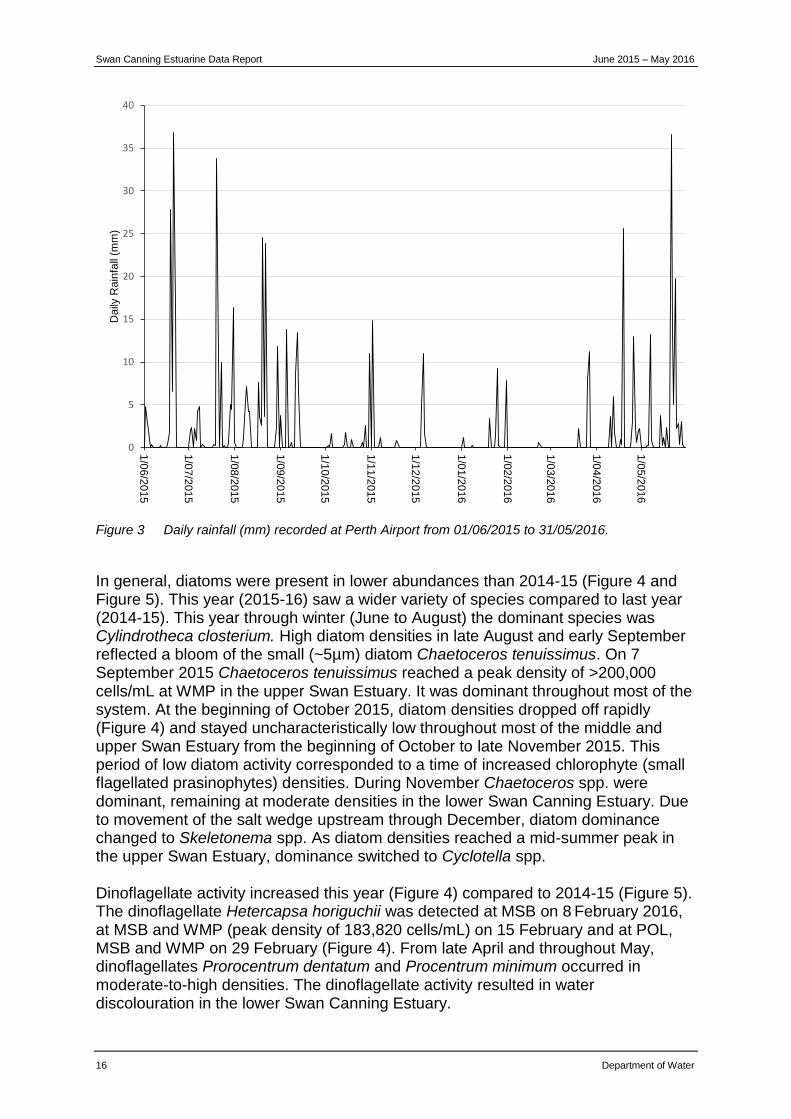
Figure 3 Daily rainfall (mm) recorded at Perth Airport from 01/06/2015 to 31/05/2016.
In general, diatoms were present in lower abundances than 2014-15 (Figure 4 and Figure 5). This year (2015-16) saw a wider variety of species compared to last year (2014-15). This year through winter (June to August) the dominant species was Cylindrotheca closterium. High diatom densities in late August and early September reflected a bloom of the small (~5µm) diatom Chaetoceros tenuissimus. On 7 September 2015 Chaetoceros tenuissimus reached a peak density of >200,000 cells/mL at WMP in the upper Swan Estuary. It was dominant throughout most of the system. At the beginning of October 2015, diatom densities dropped off rapidly (Figure 4) and stayed uncharacteristically low throughout most of the middle and upper Swan Estuary from the beginning of October to late November 2015. This period of low diatom activity corresponded to a time of increased chlorophyte (small flagellated prasinophytes) densities. During November Chaetoceros spp. were dominant, remaining at moderate densities in the lower Swan Canning Estuary. Due to movement of the salt wedge upstream through December, diatom dominance changed to Skeletonema spp. As diatom densities reached a mid-summer peak in the upper Swan Estuary, dominance switched to Cyclotella spp. Dinoflagellate activity increased this year (Figure 4) compared to 2014-15 (Figure 5). The dinoflagellate Hetercapsa horiguchii was detected at MSB on 8 February 2016, at MSB and WMP (peak density of 183,820 cells/mL) on 15 February and at POL, MSB and WMP on 29 February (Figure 4). From late April and throughout May, dinoflagellates Prorocentrum dentatum and Procentrum minimum occurred in moderate-to-high densities. The dinoflagellate activity resulted in water discolouration in the lower Swan Canning Estuary.
0
5
10
15
20
25
30
35
40
1/0
6/2
015
1/0
7/2
015
1/0
8/2
015
1/0
9/2
015
1/1
0/2
015
1/1
1/2
015
1/1
2/2
015
1/0
1/2
016
1/0
2/2
016
1/0
3/2
016
1/0
4/2
016
1/0
5/2
016
Da
ily R
ain
fall
(mm
)
Swan Canning Estuarine Data Report June 2015 – May 2016
Department of Water 17
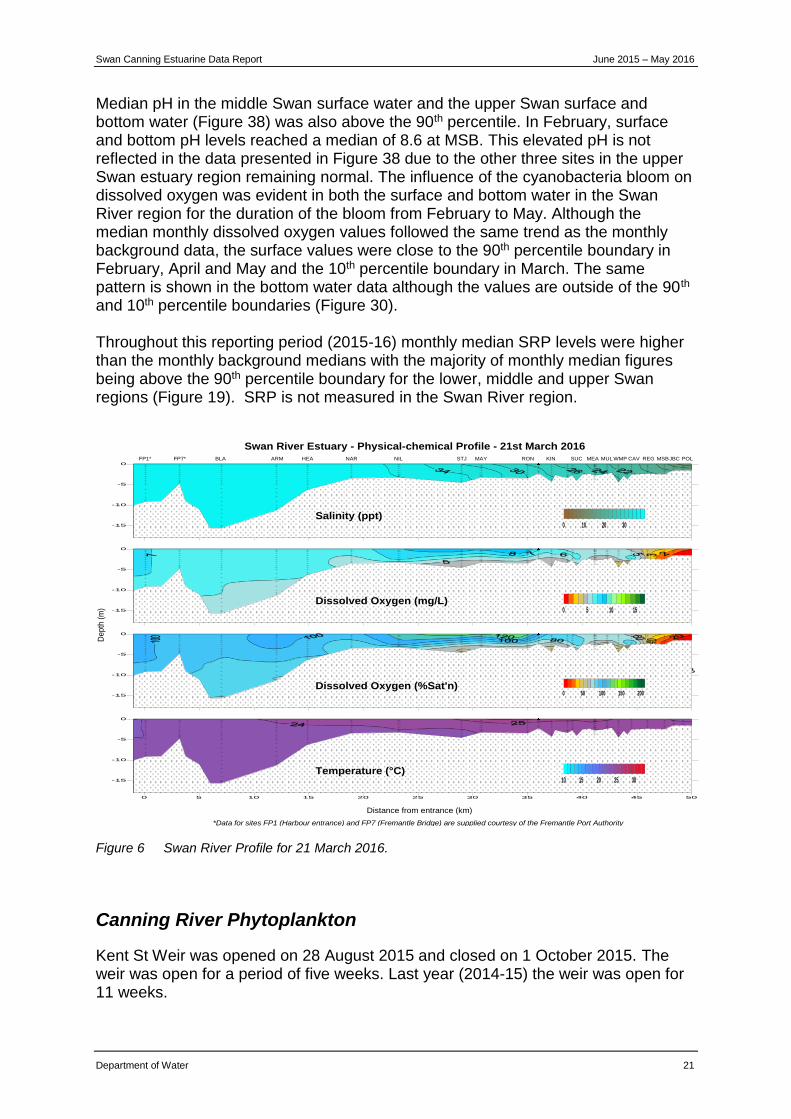
In late February, increased summer water temperatures contributed to the development of a cyanobacteria bloom in the upper Swan Estuary, replacing the Hetercapsa horiguchii bloom. The cyanobacteria bloom was of mixed genera, including Oscillatoria spp., Pseudanabaena spp. and Anabaenopsis arnoldii. No known toxigenic species were recorded however the high bio-volumes exceeded the NHMRC red alert level 2 guideline (>10 mm3/L total cyanobacterial biovolume) and therefore the Parks and Wildlife notification response trigger level. Table 4 shows details of exceeded phytoplankton trigger levels in the Swan River Estuary during the 2015-16 period. Between Sunday 20 March and Tuesday 22 March 2016 a fish death event (estimated at 200 Black Bream) was recorded along a 5 km stretch of the upper Swan Estuary from Maali Bridge to All Saints Church. The hypoxic and near anoxic dissolved oxygen levels associated with the bloom were recorded during the routine upper Swan sampling run that occurred on the 21 March 2016, can be seen in the contour plots for salinity, oxygen and water temperature shown in Figure 6. The cyanobacteria event lasted for 11 weeks (Table 4). The Department of Parks and Wildlife determined that the fish deaths were most likely caused by asphyxiation due to the cyanobacteria bloom creating hypoxic and anoxic conditions. In late March a rainfall event (Figure 3) pushed the bloom downstream, after which it dissipated. The modified physical conditions resulting from the rainfall led to another bloom of the dinoflagellate Heterocapsa horiguchii in the upper Swan Estuary in the Guildford/Midland area. Of the observed Harmful Algal Bloom events that triggered a Notification response (Table 4), the August-October 2015 Dinophysis acuminta event and the Alexandrium spp. event in spring 2015 are notable. Potentially neurotoxic Alexandrium spp. has only rarely been detected in the system before and the series of observations across a period of nine weeks was highly unusual. Dinophysis acuminata, a producer of diarrhetic shellfish toxins, is commonly present at low densities and tends to bloom in September-October; somewhat later than the 2015 observations. Chlorophyte activity throughout the year was once again predominantly Prasinophyte spp. This year, Chlorophytes were present throughout the whole year with densities peaking during spring (November). Chlorophyte activity occurred throughout the River and Estuary.
Swan Canning Estuarine Data Report June 2015 – May 2016
18 Department of Water
Figure 4 Swan River estuary integrated Phytoplankton group densities June 2015-May 2016.
Swan Canning Estuarine Data Report June 2015 – May 2016
Department of Water 19
Figure 5 Swan River estuary integrated Phytoplankton group densities June 2014-May 2015.

Swan Canning Estuarine Data Report June 2015 – May 2016
20 Department of Water
Table 4 Details of exceeded phytoplankton trigger levels in the Swan Estuary.
Site(s) Harmful (H)/Nuisance (N) Species (max cell count2)
Status/Species Trigger Level (cells/mL)*
Duration of Event (Dates Sampled)
ARM-NIL
Dinophysis acuminata (H) 22 cells/mL
Notification1 (10) 6 weeks
31/08/2015 – 5/10/2015
SUC-MSB
Chaetoceros tenuissimus (N)
212,504 cells/mL
Investigation (100,000) 2 weeks
31/08/2015 – 7/09/2015
ARM-STJ
Alexandrium spp. (H)
1 cell/mL Notification (detect)
9 weeks
29/09/2015 – 23/11/2015
SUC-WMP
Prasinophytes (N)
701,344 cells/mL Investigation (100,000)
3 weeks
2/11/2015 – 16/11/2015
MSB-POL
Heterocapsa spp. (N) 194,728 cells/mL
Notification (discolouration)
4 weeks
8/02/2016 – 29/02/2016
KIN-POL
Cyanobacteria (H) 28.87 mm3/L
Notification (≥10 mm3/L) 11 weeks
7/02/2016 – 18/04/2016
SUC-WMP
Heterocapsa spp. (N) 57,368 cells/mL
Notification (discolouration)
1 week
26/04/2016
NIL Dinophysis acuminata (H) 5 cells/mL
Investigation1 (5) 1 week
2/05/2016
SUC-MSB
Mixed diatoms 5-10 µm (N) 146,046 cells/mL
Notification (discolouration)
4 weeks
2/05/2016 – 23/05/2016
NIL-MAY
Prorocentrum minimum
(H) 12,271 cells/mL
Investigation (5,000) 5 weeks
9/05/2016 – 7/06/2016
* Species trigger values are set by the Department of Parks and Wildlife in consultation with the Departments of Water and Health and are reviewed annually. The trigger values are intended to inform management actions for the Swan Canning river system. Phytoplankton cell densities are determined from depth-integrated samples.
1 Investigation and notification trigger values for Dinophysis acuminata were reduced from 10 and 20 to 5 and 10 cells/mL respectively in September 2014.
2 Maximum cell counts are the maximum density observed during the bloom.
Swan River Total Nitrogen (TN) and Total Phosphorus (TP)
The effects of the cyanobacteria bloom that occurred in the middle and upper Swan Estuary regions from February to May can be seen in the water chemistry. Median monthly nitrogen and phosphorous levels were above the monthly background 90th percentile boundary as shown in the TN (Figure 9), NH3-N (Figure 11), NOx-N (Figure 13), DON (Figure 15), TP (Figure 17) and SRP (Figure 19) data. Monthly median pH levels were also influenced by the cyanobacteria bloom with monthly median levels above the 90th percentile (Figure 39) in February to May in the Swan River region with median surface and bottom results of >8.5 in February (Table 32).
Swan Canning Estuarine Data Report June 2015 – May 2016
Department of Water 21
Median pH in the middle Swan surface water and the upper Swan surface and bottom water (Figure 38) was also above the 90th percentile. In February, surface and bottom pH levels reached a median of 8.6 at MSB. This elevated pH is not reflected in the data presented in Figure 38 due to the other three sites in the upper Swan estuary region remaining normal. The influence of the cyanobacteria bloom on dissolved oxygen was evident in both the surface and bottom water in the Swan River region for the duration of the bloom from February to May. Although the median monthly dissolved oxygen values followed the same trend as the monthly background data, the surface values were close to the 90th percentile boundary in February, April and May and the 10th percentile boundary in March. The same pattern is shown in the bottom water data although the values are outside of the 90th and 10th percentile boundaries (Figure 30). Throughout this reporting period (2015-16) monthly median SRP levels were higher than the monthly background medians with the majority of monthly median figures being above the 90th percentile boundary for the lower, middle and upper Swan regions (Figure 19). SRP is not measured in the Swan River region.
Figure 6 Swan River Profile for 21 March 2016.
Canning River Phytoplankton
Kent St Weir was opened on 28 August 2015 and closed on 1 October 2015. The weir was open for a period of five weeks. Last year (2014-15) the weir was open for 11 weeks.
-15
-10
-5
0
0 10 20 30Salinity (ppt)
-15
-10
-5
0
0 5 10 15Dissolved Oxygen (mg/L)
-15
-10
-5
0
0 50 100 150 200Dissolved Oxygen (%Sat'n)
0 5 10 15 20 25 30 35 40 45 50
-15
-10
-5
0
10 15 20 25 30Temperature (°C)
Swan River Estuary - Physical-chemical Profile - 21st March 2016
Distance from entrance (km)
De
pth
(m
)
*Data for sites FP1 (Harbour entrance) and FP7 (Fremantle Bridge) are supplied courtesy of the Fremantle Port Authority
FP1* FP7* BLA ARM HEA NAR NIL STJ MAY RON KIN SUC MEA MUL WMP CAV REG MSBJBC POL
Swan Canning Estuarine Data Report June 2015 – May 2016
22 Department of Water
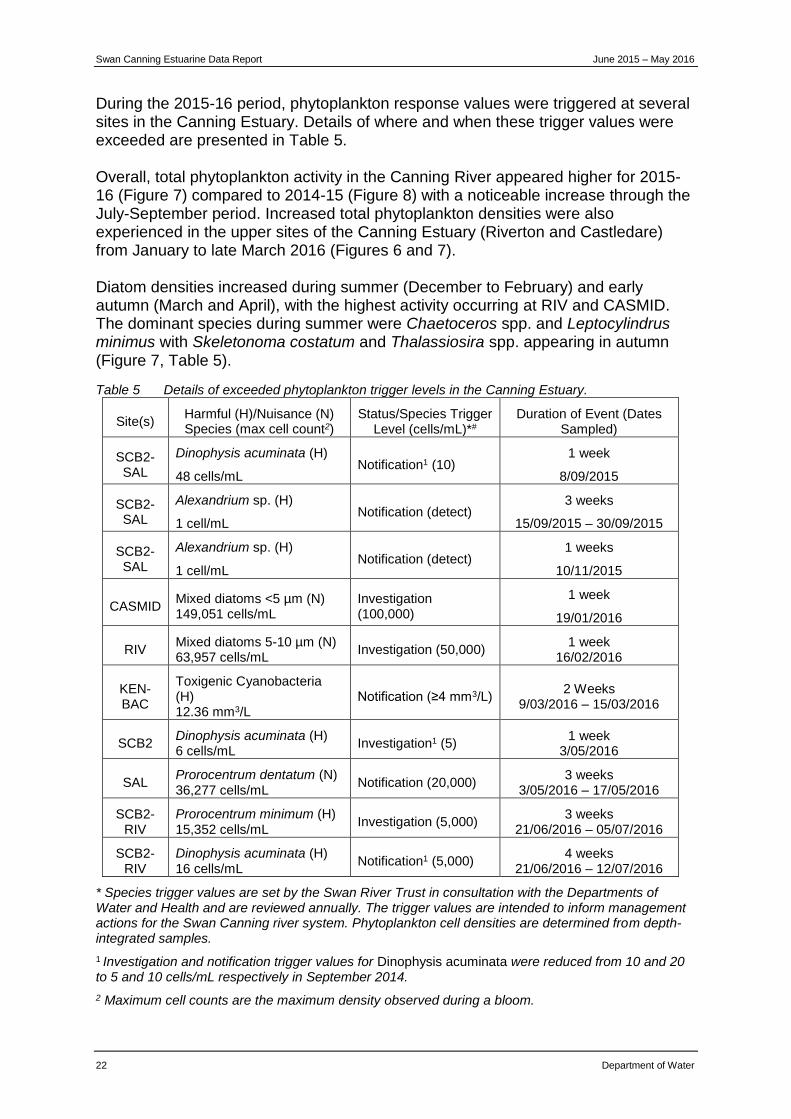
During the 2015-16 period, phytoplankton response values were triggered at several sites in the Canning Estuary. Details of where and when these trigger values were exceeded are presented in Table 5. Overall, total phytoplankton activity in the Canning River appeared higher for 2015-16 (Figure 7) compared to 2014-15 (Figure 8) with a noticeable increase through the July-September period. Increased total phytoplankton densities were also experienced in the upper sites of the Canning Estuary (Riverton and Castledare) from January to late March 2016 (Figures 6 and 7). Diatom densities increased during summer (December to February) and early autumn (March and April), with the highest activity occurring at RIV and CASMID. The dominant species during summer were Chaetoceros spp. and Leptocylindrus minimus with Skeletonoma costatum and Thalassiosira spp. appearing in autumn (Figure 7, Table 5).
Table 5 Details of exceeded phytoplankton trigger levels in the Canning Estuary.
Site(s) Harmful (H)/Nuisance (N) Species (max cell count2)
Status/Species Trigger Level (cells/mL)*#
Duration of Event (Dates Sampled)
SCB2-SAL
Dinophysis acuminata (H)
48 cells/mL Notification1 (10)
1 week
8/09/2015
SCB2-SAL
Alexandrium sp. (H)
1 cell/mL Notification (detect)
3 weeks
15/09/2015 – 30/09/2015
SCB2-SAL
Alexandrium sp. (H)
1 cell/mL Notification (detect)
1 weeks
10/11/2015
CASMID Mixed diatoms <5 µm (N) 149,051 cells/mL
Investigation (100,000)
1 week
19/01/2016
RIV Mixed diatoms 5-10 µm (N) 63,957 cells/mL
Investigation (50,000) 1 week
16/02/2016
KEN-BAC
Toxigenic Cyanobacteria (H) 12.36 mm3/L
Notification (≥4 mm3/L) 2 Weeks
9/03/2016 – 15/03/2016
SCB2 Dinophysis acuminata (H) 6 cells/mL
Investigation1 (5) 1 week
3/05/2016
SAL Prorocentrum dentatum (N) 36,277 cells/mL
Notification (20,000) 3 weeks
3/05/2016 – 17/05/2016
SCB2-RIV
Prorocentrum minimum (H) 15,352 cells/mL
Investigation (5,000) 3 weeks
21/06/2016 – 05/07/2016
SCB2-RIV
Dinophysis acuminata (H) 16 cells/mL
Notification1 (5,000) 4 weeks
21/06/2016 – 12/07/2016
* Species trigger values are set by the Swan River Trust in consultation with the Departments of Water and Health and are reviewed annually. The trigger values are intended to inform management actions for the Swan Canning river system. Phytoplankton cell densities are determined from depth-integrated samples.
1 Investigation and notification trigger values for Dinophysis acuminata were reduced from 10 and 20 to 5 and 10 cells/mL respectively in September 2014.
2 Maximum cell counts are the maximum density observed during a bloom.
Swan Canning Estuarine Data Report June 2015 – May 2016
Department of Water 23
Dinoflagellate activity increased from mid-spring to mid-summer (October to January) and again in autumn (April and May) (Figure 7). The dominant dinoflagellate was Prorocentrum minimum. Highest activity was recorded at RIV and CASMID. At the end of December Oxyrrhis spp. activity increased at RIV and in January Gymnodinium spp. activity increased at CASMID. The dominant species recorded in autumn was Prorocentrum minimum. On 10/11/2015, Alexandrium spp. was recorded at detection levels in the Canning Estuary at SCB2 and SAL. Alexandrium spp. is a known neurotoxin producing species (Table 5). Chlorophyte activity was observed throughout the year, with peak activity occurring from September to March (Figure 7). The dominant species above and below Kent Street Weir, were Prasinophyte spp. with some Tetraselemis spp. activity below the weir in August and September. A short-lived bloom of toxigenic cyanobacteria occurred in the Canning River in March at the beginning of autumn (Table 5). The bloom resulted in a media release from the Department of Health and the erection of warning signs at impacted areas. No fish death events were reported relating to the Canning River for the period of June 2015 to May 2016.
Canning River Total Nitrogen (TN) and Total Phosphorus (TP)
Monthly median total nitrogen concentrations for 2015-16 followed similar trends to the median monthly background data (Figure 10). All monthly median total nitrogen concentrations fell within the 10th and 90th percentile boundaries. Monthly median total nitrogen concentrations peaked in January and February in the Canning Estuary surface and bottom water respectively, and in August in the lower Canning River surface and bottom water. Monthly median total phosphorus concentrations for 2015-16 followed similar trends to the median monthly background data (Figure 18). All monthly median total phosphorus concentrations fell within the 10th and 90th percentile boundaries (Figure 18) except for May in the lower Caning River region where the monthly median was below the 10th percentile boundary.

Swan Canning Estuarine Data Report June 2015 – May 2016
24 Department of Water
Figure 7 Canning River estuary integrated phytoplankton group densities June 2015 - May 2016.

Swan Canning Estuarine Data Report June 2015 – May 2016
Department of Water 25
Figure 8 Canning River estuary integrated phytoplankton group densities June 2014 - May 2015.
Swan Canning Estuarine Data Report June 2015 – May 2016
26 Department of Water
4 Total Nitrogen
Figure 9 2015-16 Total Nitrogen (TN) (mg L-1) in surface and bottom water, over background (June 2010-May 2015) TN data, in the Lower Swan Canning, Middle and Upper Swan Estuary.
(e) TN Upper Swan Estuary (Surface)
Jun Jul Aug Sep Oct Nov Dec Jan Feb Mar Apr May
TN
(m
g L
-1)
0.0
0.5
1.0
1.5
2.0
2.5
(b) TN Lower Swan Canning Estuary (Bottom)
Jun Jul Aug Sep Oct Nov Dec Jan Feb Mar Apr May
TN
(m
g L
-1)
0.0
0.5
1.0
1.5
2.0
2.5
Monthly background 10th & 90th percentile
Monthly background Median
15/16 monthly Median
(c) TN Middle Swan Estuary (Surface)
Jun Jul Aug Sep Oct Nov Dec Jan Feb Mar Apr May
TN
(m
g L
-1)
0.0
0.5
1.0
1.5
2.0
2.5
(d) TN Middle Swan Estuary (Bottom)
Jun Jul Aug Sep Oct Nov Dec Jan Feb Mar Apr May
TN
(m
g L
-1)
0.0
0.5
1.0
1.5
2.0
2.5
(a) TN Lower Swan Canning Estuary (Surface)
Jun Jul Aug Sep Oct Nov Dec Jan Feb Mar Apr May
TN
(m
g L
-1)
0.0
0.5
1.0
1.5
2.0
2.5
Monthly background 10th & 90th percentile
Monthly background Median
15/16 monthly Median
(f) TN Upper Swan Estuary (Bottom)
Jun Jul Aug Sep Oct Nov Dec Jan Feb Mar Apr May
TN
(m
g L
-1)
0.0
0.5
1.0
1.5
2.0
2.5
Swan Canning Estuarine Data Report June 2015 – May 2016
Department of Water 27
Table 6 Swan Total Nitrogen (TN) (mg L-1) monthly sample numbers (n), minimum, maximum and median values for 2015/2016.
Jun Jul Aug Sep Oct Nov Dec Jan Feb Mar Apr May
TN Lower Swan Canning Estuary (Surface)
n 9 6 7 8 6 12 8 8 8 8 8 12
min 0.17 0.21 0.32 0.37 0.20 0.21 0.20 0.19 0.21 0.22 0.20 0.26
max 0.34 0.34 0.90 0.68 0.35 0.48 0.47 0.43 0.57 0.41 1.10 0.78
median 0.24 0.25 0.56 0.44 0.30 0.32 0.34 0.28 0.39 0.30 0.37 0.47
TN Lower Swan Canning Estuary (Bottom)
n 9 6 7 8 8 12 8 8 8 8 8 12
min 0.11 0.10 0.14 0.23 0.17 0.14 0.18 0.13 0.21 0.23 0.19 0.24
max 0.31 0.26 0.69 0.45 0.33 0.39 0.46 0.44 0.50 0.40 0.52 0.45
median 0.22 0.17 0.36 0.34 0.23 0.25 0.29 0.26 0.37 0.28 0.30 0.30
TN Middle Swan Estuary (Surface)
n 12 8 8 8 8 12 8 8 8 8 8 12
min 0.37 0.43 0.94 0.70 0.50 0.52 0.51 0.46 0.53 0.52 1.00 0.81
max 0.67 0.83 2.00 1.10 1.20 1.20 1.10 0.83 1.10 1.10 3.90 2.10
median 0.48 0.57 1.45 0.98 0.75 0.80 0.68 0.71 0.82 0.85 2.15 1.30
TN Middle Swan Estuary (Bottom)
n 12 8 8 8 8 12 8 8 8 8 8 12
min 0.29 0.31 0.74 0.63 0.44 0.36 0.35 0.38 0.62 0.49 0.53 0.55
max 0.60 0.63 1.50 1.10 0.85 0.90 0.76 0.82 0.88 0.80 1.80 1.90
median 0.45 0.50 1.03 0.88 0.64 0.66 0.56 0.66 0.71 0.64 1.10 0.76
TN Upper Swan Estuary (Surface)
n 12 8 8 8 8 12 8 8 8 8 8 12
min 0.46 0.78 1.10 0.81 0.90 0.83 0.81 0.89 1.10 0.99 1.40 1.20
max 1.60 0.90 1.80 1.10 1.10 1.50 1.10 1.10 3.70 2.90 3.90 1.70
median 0.64 0.84 1.60 0.96 0.99 0.97 1.00 0.98 1.60 1.35 2.45 1.40
TN Upper Swan Estuary (Bottom)
n 12 8 8 8 8 12 8 8 8 8 8 12
min 0.44 0.51 1.20 0.82 0.90 0.75 0.85 0.77 0.92 0.94 1.40 0.92
max 0.75 0.81 1.80 1.20 1.20 1.30 1.10 1.00 3.60 2.50 3.70 1.70
median 0.55 0.74 1.55 1.00 0.98 0.97 0.95 0.93 1.25 1.20 2.10 1.30
Swan Canning Estuarine Data Report June 2015 – May 2016
28 Department of Water
Figure 10 2015-16 Total Nitrogen (TN) (mg L-1) in surface and bottom water, over background (June 2010-May 2015) TN data, in the Canning Estuary and Lower Canning River.
(a) TN Canning Estuary (Surface)
Jun Jul Aug Sep Oct Nov Dec Jan Feb Mar Apr May
TN
(m
g L
-1)
0
1
2
3
4
5
Monthly background 10th & 90th percentile
Monthly background Median
15/16 monthly Median
(b) TN Canning Estuary (Bottom)
Jun Jul Aug Sep Oct Nov Dec Jan Feb Mar Apr May
TN
(m
g L
-1)
0
1
2
3
4
5
Monthly background 10th & 90th percentile
Monthly background Median
15/16 monthly Median
(c) TN Lower Canning River (Surface)
Jun Jul Aug Sep Oct Nov Dec Jan Feb Mar Apr May
TN
(m
g L
-1)
0
1
2
3
4
5
(d) TN Lower Canning River (Bottom)
Jun Jul Aug Sep Oct Nov Dec Jan Feb Mar Apr May
TN
(m
g L
-1)
0
1
2
3
4
5
Swan Canning Estuarine Data Report June 2015 – May 2016
Department of Water 29
Table 7 Canning Total Nitrogen (TN) (mg L-1) monthly sample numbers (n), minimum, maximum and median values for 2015-16.
Jun Jul Aug Sep Oct Nov Dec Jan Feb Mar Apr May
TN Canning Estuary (Surface)
n 12 8 8 8 7 8 9 8 8 7 7 12
min 0.29 0.28 0.4 0.41 0.23 0.31 0.19 0.34 0.44 0.36 0.44 0.48
max 0.88 1.10 1.30 1.10 0.93 1.30 0.95 1.40 1.20 0.93 1.50 1.40
median 0.52 0.53 0.79 0.68 0.51 0.65 0.56 0.82 0.80 0.67 0.83 0.80
TN Canning Estuary (Bottom)
n 12 8 8 8 7 8 9 8 8 7 7 12
min 0.27 0.20 0.40 0.33 0.28 0.33 0.22 0.27 0.32 0.31 0.39 0.35
max 0.76 0.70 1.30 1.30 1.20 1.30 0.99 0.96 1.20 0.92 2.10 1.50
median 0.46 0.44 0.64 0.60 0.48 0.66 0.49 0.64 0.80 0.62 0.62 0.58
TN Lower Canning River (Surface)
n 12 8 8 8 8 8 12 8 8 8 8 12
min 0.78 0.92 0.95 0.85 0.85 0.63 0.63 0.73 0.66 0.76 0.75 0.72
max 1.10 1.30 1.30 1.30 1.30 0.89 0.91 1.20 1.10 1.10 1.10 1.40
median 0.91 1.03 1.20 0.97 0.97 0.71 0.74 0.80 0.88 0.94 0.88 0.79
TN Lower Canning River (Bottom)
n 12 8 8 8 8 8 12 8 8 8 8 12
min 0.72 0.89 1.10 0.90 0.78 0.60 0.64 0.69 0.64 0.77 0.70 0.61
max 1.10 1.30 1.60 1.40 1.50 0.91 1.10 1.50 1.40 1.20 1.10 1.30
median 0.88 1.08 1.20 0.99 0.98 0.73 0.76 0.82 0.95 0.95 0.79 0.77
Swan Canning Estuarine Data Report June 2015 – May 2016
30 Department of Water
5 Ammonium Nitrogen
Figure 11 2015-16 Ammonium Nitrogen (NH3-N) (mg L-1) in surface and bottom water, over background (June 2010-May 2015) NH3-N data, in the Lower Swan Canning, Middle and Upper Swan Estuary.
(e) NH3-N Upper Swan Estuary (Surface)
Jun Jul Aug Sep Oct Nov Dec Jan Feb Mar Apr May
NH
3-N
(m
g L
-1)
0.0
0.2
0.4
0.6
(f) NH3-N Upper Swan Estuary (Bottom)
Jun Jul Aug Sep Oct Nov Dec Jan Feb Mar Apr May
NH
3-N
(m
g L
-1)
0.0
0.2
0.4
0.6
(b) NH3-N Lower Swan Canning Estuary (Bottom)
Jun Jul Aug Sep Oct Nov Dec Jan Feb Mar Apr May
NH
3-N
(m
g L
-1)
0.0
0.2
0.4
0.6
Monthly background 10th & 90th percentile
Monthly background Median
15/16 monthly Median
(c) NH3-N Middle Swan Estuary (Surface)
Jun Jul Aug Sep Oct Nov Dec Jan Feb Mar Apr May
NH
3-N
(m
g L
-1)
0.0
0.2
0.4
0.6
(d) NH3-N Middle Swan Estuary (Bottom)
Jun Jul Aug Sep Oct Nov Dec Jan Feb Mar Apr May
NH
3-N
(m
g L
-1)
0.0
0.2
0.4
0.6
(a) NH3-N Lower Swan Canning Estuary (Surface)
Jun Jul Aug Sep Oct Nov Dec Jan Feb Mar Apr May
NH
3-N
(m
g L
-1)
0.0
0.2
0.4
0.6
Monthly background 10th & 90th percentile
Monthly background Median
15/16 monthly Median
Swan Canning Estuarine Data Report June 2015 – May 2016
Department of Water 31
Table 8 Swan Ammonium Nitrogen (NH3-N) (mg L-1) monthly sample numbers (n), minimum, maximum and median values for 2015-16.
Jun Jul Aug Sep Oct Nov Dec Jan Feb Mar Apr May
NH3-N Lower Swan Canning Estuary (Surface)
n 9 6 7 8 8 12 8 8 8 8 8 12
min <0.010 <0.010 0.010 <0.010 <0.010 <0.010 <0.010 <0.010 <0.010 <0.010 <0.010 <0.010
max 0.027 0.020 0.054 0.013 0.011 0.033 0.024 0.024 0.033 0.017 0.034 0.021
median 0.015 <0.010 0.019 <0.010 <0.010 <0.010 0.011 <0.010 0.017 0.012 0.010 <0.010
NH3-N Lower Swan Canning Estuary (Bottom)
n 9 6 7 8 8 12 8 8 8 8 8 12
min 0.014 0.014 0.012 0.018 0.013 0.010 0.013 <0.010 0.012 0.015 0.010 0.011
max 0.066 0.059 0.087 0.120 0.039 0.075 0.020 0.025 0.052 0.038 0.045 0.039
median 0.035 0.031 0.067 0.041 0.024 0.026 0.014 0.018 0.034 0.020 0.023 0.020
NH3-N Middle Swan Estuary (Surface)
n 12 8 8 8 8 12 8 8 8 8 8 12
min 0.014 0.012 0.069 <0.010 <0.010 <0.010 0.011 0.010 0.015 <0.010 0.027 <0.010
max 0.110 0.089 0.180 0.120 0.019 0.039 0.019 0.065 0.032 0.037 0.590 0.320
median 0.033 0.076 0.120 0.034 <0.010 0.014 0.013 0.022 0.019 0.014 0.335 0.018
NH3-N Middle Swan Estuary (Bottom)
n 12 8 8 8 8 12 8 8 8 8 8 12
min 0.030 0.031 0.056 0.022 <0.010 <0.010 0.014 0.032 0.029 0.010 0.051 0.013
max 0.200 0.250 0.480 0.260 0.220 0.160 0.046 0.080 0.130 0.079 0.910 0.630
median 0.110 0.155 0.255 0.120 0.037 0.053 0.024 0.066 0.074 0.050 0.500 0.094
NH3-N Upper Swan Estuary (Surface)
n 12 8 8 8 8 12 8 8 8 8 8 12
min <0.010 0.018 0.014 <0.010 0.010 <0.010 <0.010 0.015 <0.010 0.041 0.011 <0.010
max 0.170 0.180 0.160 0.089 0.190 0.038 0.018 0.150 0.084 0.830 0.640 0.110
median 0.049 0.054 0.086 0.026 0.020 0.016 0.014 0.031 0.013 0.150 0.355 0.020
NH3-N Upper Swan Estuary (Bottom)
n 12 8 8 8 8 12 8 8 8 8 8 12
min 0.012 0.180 0.019 <0.010 0.012 0.023 0.013 0.052 <0.010 0.110 0.023 <0.010
max 0.210 0.440 0.160 0.120 0.390 0.200 0.120 0.190 0.240 0.750 1.300 0.200
median 0.160 0.220 0.088 0.033 0.086 0.072 0.078 0.130 0.100 0.170 0.930 0.039
Swan Canning Estuarine Data Report June 2015 – May 2016
32 Department of Water
Figure 12 2015-16 Ammonium Nitrogen (NH3-N) (mg L-1) in surface and bottom water, over background (June 2010-May 2015) NH3-N data, in the Canning Estuary and Lower Canning River.
(a) NH3-N Canning Estuary (Surface)
Jun Jul Aug Sep Oct Nov Dec Jan Feb Mar Apr May
NH
3-N
(m
g L
-1)
0.0
0.5
1.0
1.5
2.0
2.5
3.0
Monthly background 10th & 90th percentile
Monthly background Median
15/16 monthly Median
(b) NH3-N Canning Estuary (Bottom)
Jun Jul Aug Sep Oct Nov Dec Jan Feb Mar Apr May
NH
3-N
(m
g L
-1)
0.0
0.5
1.0
1.5
2.0
2.5
3.0
Monthly background 10th & 90th perfcentile
Monthyl background Median
15/16 monthly Median
(c) NH3-N Lower Canning River (Surface)
Jun Jul Aug Sep Oct Nov Dec Jan Feb Mar Apr May
NH
3-N
(m
g L
-1)
0.0
0.5
1.0
1.5
2.0
2.5
3.0
(d) NH3-N Lower Canning River (Bottom)
Jun Jul Aug Sep Oct Nov Dec Jan Feb Mar Apr May
NH
3-N
(m
g L
-1)
0.0
0.5
1.0
1.5
2.0
2.5
3.0

Swan Canning Estuarine Data Report June 2015 – May 2016
Department of Water 33
Table 9 Canning Ammonium Nitrogen (NH3-N) (mg L-1) monthly sample numbers (n), minimum, maximum and median values for 2015-16.
Jun Jul Aug Sep Oct Nov Dec Jan Feb Mar Apr May
NH3-N Canning Estuary (Surface)
n 12 8 8 8 7 8 9 8 8 7 7 12
min 0.035 0.013 0.032 <0.010 <0.010 <0.010 0.013 <0.010 0.016 0.015 0.010 <0.010
max 0.310 0.190 0.190 0.100 0.075 0.140 0.047 0.039 0.036 0.029 0.120 0.230
median 0.089 0.065 0.047 0.045 0.026 0.022 0.020 0.026 0.021 0.023 0.022 0.025
NH3-N Canning Estuary (Bottom)
n 12 8 8 8 7 8 9 8 8 7 7 12
min 0.034 0.035 0.042 0.027 <0.010 <0.010 0.015 0.012 0.020 0.015 <0.010 <0.010
max 0.330 0.250 0.350 0.240 0.130 0.520 0.050 0.110 0.050 0.062 1.200 0.900
median 0.160 0.165 0.103 0.099 0.059 0.031 0.023 0.029 0.025 0.026 0.045 0.048
NH3-N Lower Canning River (Surface)
n 12 8 8 8 8 8 12 8 8 8 8 12
min 0.038 0.053 <0.005 0.029 0.018 0.017 0.014 <0.010 0.015 0.019 0.010 0.013
max 0.130 0.085 0.051 0.073 0.094 0.110 0.085 0.047 0.022 0.110 0.066 0.095
median 0.078 0.067 0.031 0.063 0.032 0.043 0.023 0.024 0.020 0.025 0.020 0.063
NH3-N Lower Canning River (Bottom)
n 12 8 8 8 8 8 12 8 8 8 8 12
min 0.051 0.066 0.019 0.052 0.027 0.018 0.013 0.024 0.020 0.024 0.016 0.014
max 0.220 0.095 0.064 0.084 0.680 0.150 0.220 0.220 0.310 0.150 0.076 0.160
median 0.125 0.075 0.044 0.075 0.087 0.088 0.054 0.046 0.025 0.065 0.027 0.069
Swan Canning Estuarine Data Report June 2015 – May 2016
34 Department of Water
6 Total Oxidised Nitrogen
Figure 13 2015-16 Total Oxidised Nitrogen (NOx-N) (mg L-1) in surface and bottom water, over background (June 2010-May 2015) NOx-N data, in the Lower Swan Canning, Middle and Upper Swan Estuary.
(e) NOx-N Upper Swan Estuary (Surface)
Jun Jul Aug Sep Oct Nov Dec Jan Feb Mar Apr May
NO
x-N
(m
g L
-1)
0.0
0.2
0.4
0.6
0.8
(b) NOx-N Lower Swan Canning Estuary (Bottom)
Jun Jul Aug Sep Oct Nov Dec Jan Feb Mar Apr May
NO
x-N
(m
g L
-1)
0.0
0.2
0.4
0.6
0.8
Monthly background 10th & 90th percentile
Monthly background Median
15/16 monthly Median
(c) NOx-N Middle Swan Estuary (Surface)
Jun Jul Aug Sep Oct Nov Dec Jan Feb Mar Apr May
NO
x-N
(m
g L
-1)
0.0
0.2
0.4
0.6
0.8
(d) NOx-N Middle Swan Estuary (Bottom)
Jun Jul Aug Sep Oct Nov Dec Jan Feb Mar Apr May
NO
x-N
(m
g L
-1)
0.0
0.2
0.4
0.6
0.8
(a) NOx-N Lower Swan Canning Estuary (Surface)
Jun Jul Aug Sep Oct Nov Dec Jan Feb Mar Apr May
NO
x-N
(m
g L
-1)
0.0
0.2
0.4
0.6
0.8
Monthly background 10th & 90th percentile
Monthly background Median
15/16 Monthly Median
(f) NOx-N Upper Swan Estuary (Bottom)
Jun Jul Aug Sep Oct Nov Dec Jan Feb Mar Apr May
NO
x-N
(m
g L
-1)
0.0
0.2
0.4
0.6
0.8
Swan Canning Estuarine Data Report June 2015 – May 2016
Department of Water 35
Table 10 Swan Total Oxidised Nitrogen (NOx-N) (mg L-1) monthly sample numbers (n), minimum, maximum and median values for 2015-16.
Jun Jul Aug Sep Oct Nov Dec Jan Feb Mar Apr May
NOx-N Lower Swan Canning Estuary (Surface)
n 9 6 7 8 8 12 8 8 8 8 8 12
min <0.010 <0.010 0.026 <0.010 <0.010 <0.010 <0.010 <0.010 <0.010 <0.010 <0.010 <0.010
max 0.035 0.026 0.190 0.038 0.025 0.010 <0.010 0.011 <0.010 0.020 0.034 0.017
median 0.013 <0.010 0.030 0.016 0.010 <0.010 <0.010 <0.010 <0.010 <0.010 0.012 <0.010
NOx-N Lower Swan Canning Estuary (Bottom)
n 9 6 7 8 8 12 8 8 8 8 8 12
min <0.010 0.010 0.012 0.023 <0.010 <0.010 <0.010 <0.010 <0.010 <0.010 0.010 <0.010
max 0.033 0.029 0.079 0.051 0.029 0.019 <0.010 <0.010 0.015 <0.010 0.033 0.017
median 0.025 0.021 0.045 0.035 0.019 <0.010 <0.010 <0.010 <0.010 <0.010 0.017 0.013
NOx-N Middle Swan Estuary (Surface)
n 12 8 8 8 8 12 8 8 8 8 8 12
min 0.014 0.028 0.100 <0.010 <0.010 <0.010 <0.010 <0.010 <0.010 <0.010 0.075 <0.010
max 0.093 0.140 0.690 0.110 0.026 0.014 <0.010 0.026 <0.010 0.011 1.700 0.210
median 0.035 0.070 0.215 0.056 0.013 <0.010 <0.010 0.013 <0.010 <0.010 0.425 0.010
NOx-N Middle Swan Estuary (Bottom)
n 12 8 8 8 8 12 8 8 8 8 8 12
min 0.012 0.017 0.073 0.015 <0.010 <0.010 <0.010 <0.010 <0.010 <0.010 <0.010 <0.010
max 0.064 0.057 0.150 0.081 0.040 0.018 <0.010 0.022 0.014 <0.010 0.046 0.017
median 0.041 0.046 0.105 0.060 0.016 <0.010 <0.010 0.015 <0.010 <0.010 0.029 <0.010
NOx-N Upper Swan Estuary (Surface)
n 12 8 8 8 8 12 8 8 8 8 8 12
min <0.010 0.068 0.049 <0.010 <0.010 <0.010 <0.010 <0.010 <0.010 0.016 <0.010 <0.010
max 0.120 0.120 0.580 0.055 0.091 0.030 0.012 0.068 0.031 0.087 1.700 0.200
median 0.050 0.095 0.295 0.038 0.024 <0.010 <0.010 0.023 <0.010 0.028 0.760 0.011
NOx-N Upper Swan Estuary (Bottom)
n 12 8 8 8 8 12 8 8 8 8 8 12
min <0.010 0.031 0.051 <0.010 <0.010 <0.010 <0.010 0.013 <0.010 0.015 0.012 <0.010
max 0.130 0.140 0.590 0.063 0.090 0.034 0.019 0.063 0.016 0.068 1.600 0.190
median 0.063 0.077 0.294 0.029 0.030 <0.010 <0.010 0.019 <0.010 0.028 0.037 0.013
Swan Canning Estuarine Data Report June 2015 – May 2016
36 Department of Water
Figure 14 2015-16 Total Oxidised Nitrogen (NOx-N) (mg L-1) in surface and bottom water, over background (June 2010-May 2015) NOx-N data, in the Canning Estuary and Lower Canning River.
(a) NOx-N Canning Estuary (Surface)
Jun Jul Aug Sep Oct Nov Dec Jan Feb Mar Apr May
NO
x-N
(m
g L
-1)
0.0
0.2
0.4
0.6
0.8
1.0
1.2
Monthly background 10th & 90th percentile
Monthly background Median
15/16 monthly Median
(b) NOx-N Canning Estuary (Bottom)
Jun Jul Aug Sep Oct Nov Dec Jan Feb Mar Apr May
NO
x-N
(m
g L
-1)
0.0
0.2
0.4
0.6
0.8
1.0
1.2
Monthly background 10th & 90th percentile
Monthly background Median
15/16 monthly Median
(c) NOx-N Lower Canning River (Surface)
Jun Jul Aug Sep Oct Nov Dec Jan Feb Mar Apr May
NO
x-N
(m
g L
-1)
0.0
0.2
0.4
0.6
0.8
1.0
1.2
(d) NOx-N Lower Canning River (Bottom)
Jun Jul Aug Sep Oct Nov Dec Jan Feb Mar Apr May
NO
x-N
(m
g L
-1)
0.0
0.2
0.4
0.6
0.8
1.0
1.2
Swan Canning Estuarine Data Report June 2015 – May 2016
Department of Water 37
Table 11 Canning Total Oxidised Nitrogen (NOx-N) (mg L-1) monthly sample numbers (n), minimum, maximum and median values for 2015-16.
Jun Jul Aug Sep Oct Nov Dec Jan Feb Mar Apr May
NOx-N Canning Estuary (Surface)
n 12 8 8 8 7 8 9 8 8 7 7 12
min 0.011 0.033 0.097 <0.010 <0.010 <0.010 <0.010 <0.010 <0.010 <0.010 <0.010 <0.010
max 0.160 0.500 0.580 0.440 0.038 0.150 <0.010 0.010 0.019 <0.010 0.043 0.390
median 0.037 0.070 0.220 0.054 0.016 <0.010 <0.010 <0.010 <0.010 <0.010 0.018 <0.010
NOx-N Canning Estuary (Bottom)
n 12 8 8 8 7 8 9 8 8 7 7 12
min 0.011 0.019 0.028 <0.010 <0.010 <0.010 <0.010 <0.010 <0.010 <0.010 <0.010 <0.010
max 0.081 0.160 0.580 0.420 0.033 0.022 <0.010 0.015 0.020 <0.010 0.029 0.089
median 0.025 0.050 0.155 0.026 0.015 <0.010 <0.010 <0.010 <0.010 <0.010 0.021 <0.010
NOx-N Lower Canning River (Surface)
n 12 8 8 8 8 8 12 8 8 8 8 12
min 0.170 0.380 0.440 0.260 0.011 <0.010 <0.010 <0.010 <0.010 <0.010 <0.010 0.032
max 0.550 0.550 0.640 0.460 0.300 0.160 0.015 <0.010 <0.010 0.014 0.340 0.550
median 0.210 0.460 0.545 0.340 0.120 0.097 <0.010 <0.010 <0.010 <0.010 0.020 0.115
NOx-N Lower Canning River (Bottom)
n 12 8 8 8 8 8 12 8 8 8 8 12
min 0.120 0.370 0.470 0.250 0.019 <0.010 <0.010 <0.010 <0.010 <0.010 <0.010 0.055
max 0.540 0.550 0.650 0.470 0.310 0.160 0.045 0.018 0.011 0.013 0.330 0.570
median 0.180 0.410 0.550 0.330 0.123 0.122 <0.010 <0.010 <0.010 <0.010 0.020 0.110
Swan Canning Estuarine Data Report June 2015 – May 2016
38 Department of Water
7 Dissolved Organic Nitrogen
Figure 15 2015-16 Dissolved Organic Nitrogen (DOrgN) (mg L-1) in surface and bottom water, over background (July 2009-May2014) DOrgN data, in the Lower Swan Canning, Middle and Upper Swan Estuary.
(e) DOrgN Upper Swan Estuary (Surface)
Jun Jul Aug Sep Oct Nov Dec Jan Feb Mar Apr May
DO
rgN
(m
g L
-1)
0.0
0.2
0.4
0.6
0.8
1.0
1.2
1.4
(f) DOrgN Upper Swan Estuary (Bottom)
Jun Jul Aug Sep Oct Nov Dec Jan Feb Mar Apr May
DO
rgN
(m
g L
-1)
0.0
0.2
0.4
0.6
0.8
1.0
1.2
1.4
(b) DOrgN Lower Swan Canning Estuary (Bottom)
Jun Jul Aug Sep Oct Nov Dec Jan Feb Mar Apr May
DO
rgN
(m
g L
-1)
0.0
0.2
0.4
0.6
0.8
1.0
1.2
1.4
Monthly background 10th & 90th percentile
Monthly background Median
15/16 monthly Median
(c) DOrgN Middle Swan Estuary (Surface)
Jun Jul Aug Sep Oct Nov Dec Jan Feb Mar Apr May
DO
rgN
(m
g L
-1)
0.0
0.2
0.4
0.6
0.8
1.0
1.2
1.4
(d) DOrgN Middle Swan Estuary (Bottom)
Jun Jul Aug Sep Oct Nov Dec Jan Feb Mar Apr May
DO
rgN
(m
g L
-1)
0.0
0.2
0.4
0.6
0.8
1.0
1.2
1.4
(a) DOrgN Lower Swan Canning Estuary (Surface)
Jun Jul Aug Sep Oct Nov Dec Jan Feb Mar Apr May
DO
rgN
(m
g L
-1)
0.0
0.2
0.4
0.6
0.8
1.0
1.2
1.4
Monthly background 10th & 90th percentile
Monthly background Median
15/16 monthly Median

Swan Canning Estuarine Data Report June 2015 – May 2016
Department of Water 39
Table 12 Swan Dissolved Organic Nitrogen (DOrgN) (mg L-1) monthly sample numbers (n), minimum, maximum and median values for 2015-16.
Jun Jul Aug Sep Oct Nov Dec Jan Feb Mar Apr May
DOrgN Lower Swan Canning Estuary (Surface)
n 9 6 7 8 8 12 8 8 8 8 8 12
min 0.12 0.16 0.25 0.30 0.16 0.17 0.11 0.12 0.19 0.17 0.13 0.22
max 0.29 0.21 0.58 0.56 0.34 0.29 0.38 0.31 0.42 0.30 0.47 0.68
median 0.17 0.18 0.41 0.37 0.25 0.23 0.28 0.22 0.32 0.24 0.27 0.36
DOrgN Lower Swan Canning Estuary (Bottom)
n 9 6 7 8 8 12 8 8 8 8 8 12
min 0.04 0.06 0.10 0.15 0.10 0.11 0.10 0.10 0.15 0.21 0.15 0.16
max 0.23 0.15 0.37 0.39 0.30 0.28 0.32 0.31 0.44 0.29 0.29 0.40
median 0.14 0.10 0.20 0.22 0.18 0.15 0.22 0.21 0.30 0.24 0.23 0.24
DOrgN Middle Swan Estuary (Surface)
n 12 8 8 8 8 12 8 8 8 8 8 12
min 0.19 0.24 0.47 0.56 0.37 0.40 0.31 0.33 0.40 0.40 0.56 0.57
max 0.41 0.46 1.10 0.80 0.66 0.63 0.69 0.61 0.90 0.71 1.50 1.40
median 0.30 0.35 1.00 0.76 0.51 0.52 0.42 0.51 0.64 0.56 1.05 0.90
DOrgN Middle Swan Estuary (Bottom)
n 12 8 8 8 8 12 8 8 8 8 8 12
min 0.15 0.16 0.33 0.43 0.32 0.29 0.22 0.30 0.40 0.41 0.36 0.37
max 0.37 0.24 1.10 0.96 0.56 0.56 0.61 0.60 0.79 0.65 0.81 1.00
median 0.21 0.19 0.54 0.64 0.43 0.43 0.39 0.45 0.57 0.49 0.51 0.55
DOrgN Upper Swan Estuary (Surface)
n 12 8 8 8 8 12 8 8 8 8 8 12
min 0.28 0.38 0.94 0.64 0.65 0.63 0.67 0.57 0.89 0.73 1.00 0.83
max 0.57 0.61 1.10 0.85 0.79 0.87 0.84 0.72 2.00 1.60 1.40 1.30
median 0.38 0.49 0.99 0.73 0.72 0.73 0.79 0.64 1.20 0.99 1.25 1.10
DOrgN Upper Swan Estuary (Bottom)
n 12 8 8 8 8 12 8 8 8 8 8 12
min 0.21 0.20 0.94 0.63 0.53 0.59 0.59 0.53 0.63 0.70 0.56 0.67
max 0.40 0.45 1.10 0.89 0.75 0.78 0.76 0.73 1.70 1.60 1.30 1.30
median 0.29 0.28 0.99 0.76 0.72 0.69 0.70 0.63 1.02 0.82 0.79 1.05
Swan Canning Estuarine Data Report June 2015 – May 2016
40 Department of Water
Figure 16 2015-16 Dissolved Organic Nitrogen (DOrgN) (mg L-1) in surface and bottom water, over background (June 2010-May 2015) DOrgN data, in the Canning Estuary and Lower Canning River.
(c) DOrgN Lower Canning River (Surface)
Jun Jul Aug Sep Oct Nov Dec Jan Feb Mar Apr May
DO
rgN
(m
g L
-1)
0.0
0.2
0.4
0.6
0.8
1.0
1.2
(d) DOrgN Lower Canning River (Bottom)
Jun Jul Aug Sep Oct Nov Dec Jan Feb Mar Apr May
DO
rgN
(m
g L
-1)
0.0
0.2
0.4
0.6
0.8
1.0
1.2
(a) DOrgN Canning Estuary (Surface)
Jun Jul Aug Sep Oct Nov Dec Jan Feb Mar Apr May
DO
rgN
(m
g L
-1)
0.0
0.2
0.4
0.6
0.8
1.0
1.2
Monthly background 10th & 90th percentile
Monthly background Median
15/16 monthly Median
(b) DOrgN Canning Estuary (Bottom)
Jun Jul Aug Sep Oct Nov Dec Jan Feb Mar Apr May
DO
rgN
(m
g L
-1)
0.0
0.2
0.4
0.6
0.8
1.0
1.2
Monthly background 10th & 90th percentile
Monthly background Median
15/16 monthly Median
Swan Canning Estuarine Data Report June 2015 – May 2016
Department of Water 41
Table 13 Canning Dissolved Organic Nitrogen (DOrgN) (mg L-1) monthly sample numbers (n), minimum, maximum and median values for 2015-16.
Jun Jul Aug Sep Oct Nov Dec Jan Feb Mar Apr May
DOrgN Canning Estuary (Surface)
n 12 8 8 8 7 8 9 8 8 7 7 12
min 0.22 0.15 0.28 0.34 0.17 0.30 0.16 0.22 0.31 0.26 0.29 0.32
max 0.42 0.35 0.56 0.60 0.66 0.52 0.70 0.62 0.81 0.61 0.56 0.51
median 0.25 0.24 0.38 0.37 0.26 0.40 0.36 0.45 0.59 0.45 0.44 0.37
DOrgN Canning Estuary (Bottom)
n 12 8 8 8 7 8 9 8 8 7 7 12
min 0.17 0.08 0.16 0.27 0.16 0.23 0.17 0.21 0.25 0.27 0.30 0.27
max 0.32 0.23 0.58 0.65 0.62 0.67 0.61 0.60 0.78 0.62 0.90 0.45
median 0.24 0.15 0.29 0.34 0.27 0.34 0.33 0.42 0.57 0.43 0.44 0.35
DOrgN Lower Canning River (Surface)
n 12 8 8 8 8 8 12 8 8 8 8 12
min 0.37 0.33 0.40 0.34 0.62 0.42 0.47 0.54 0.51 0.46 0.42 0.43
max 0.50 0.52 0.61 0.64 0.76 0.60 0.64 0.66 0.78 0.67 0.69 0.69
median 0.46 0.42 0.56 0.46 0.65 0.48 0.56 0.57 0.65 0.57 0.53 0.49
DOrgN Lower Canning River (Bottom)
n 12 8 8 8 8 8 12 8 8 8 8 12
min 0.32 0.35 0.41 0.33 0.54 0.38 0.51 0.52 0.50 0.50 0.40 0.42
max 0.48 0.54 0.61 0.66 0.77 0.56 0.70 0.86 0.77 0.65 0.69 0.67
median 0.41 0.42 0.51 0.46 0.66 0.48 0.55 0.57 0.70 0.60 0.53 0.47
Swan Canning Estuarine Data Report June 2015 – May 2016
42 Department of Water
8 Total Phosphorus
Figure 17 2015-16 Total Phosphorus (TP) (mg L-1) in surface and bottom water, over background (June 2008-May 2013) TP data, in the Lower Swan Canning, Middle and Upper Swan Estuary.
(e) TP Upper Swan Estuary (Surface)
Jun Jul Aug Sep Oct Nov Dec Jan Feb Mar Apr May
TP
(m
g L
-1)
0.0
0.1
0.2
0.3
0.4
(b) TP Lower Swan Canning Estuary (Bottom)
Jun Jul Aug Sep Oct Nov Dec Jan Feb Mar Apr May
TP
(m
g L
-1)
0.0
0.1
0.2
0.3
0.4
Monthly background 10th & 90th percentile
Monthly background Median
15/16 monthly Median
(c) TP Middle Swan Estuary (Surface)
Jun Jul Aug Sep Oct Nov Dec Jan Feb Mar Apr May
TP
(m
g L
-1)
0.0
0.1
0.2
0.3
0.4
(d) TP Middle Swan Estuary (Bottom)
Jun Jul Aug Sep Oct Nov Dec Jan Feb Mar Apr May
TP
(m
g L
-1)
0.0
0.1
0.2
0.3
0.4
(a) TP Lower Swan Canning Estuary (Surface)
Jun Jul Aug Sep Oct Nov Dec Jan Feb Mar Apr May
TP
(m
g L
-1)
0.0
0.1
0.2
0.3
0.4
Monthly background 10th & 90th percentile
Monthly background Median
15/16 monthly Median
(f) TP Upper Swan Estuary (Bottom)
Jun Jul Aug Sep Oct Nov Dec Jan Feb Mar Apr May
TP
(m
g L
-1)
0.0
0.1
0.2
0.3
0.4

Swan Canning Estuarine Data Report June 2015 – May 2016
Department of Water 43
Table 14 Swan Total Phosphorus (TP) (mg L-1) monthly sample numbers (n), minimum, maximum and median values for 2015-16.
Jun Jul Aug Sep Oct Nov Dec Jan Feb Mar Apr May
TP Lower Swan Canning Estuary (Surface)
n 9 6 7 8 6 12 8 8 8 8 8 12
min <0.005 0.009 0.008 0.010 <0.005 0.013 0.019 0.013 0.024 0.017 0.027 0.022
max 0.035 0.022 0.030 0.026 0.020 0.040 0.039 0.054 0.058 0.054 0.110 0.095
median 0.020 0.017 0.017 0.016 0.014 0.026 0.030 0.030 0.042 0.039 0.044 0.042
TP Lower Swan Canning Estuary (Bottom)
n 9 6 7 8 8 12 8 8 8 8 8 12
min 0.011 0.010 0.009 0.009 0.010 0.010 0.015 0.012 0.026 0.020 0.028 0.015
max 0.036 0.034 0.052 0.031 0.027 0.047 0.047 0.051 0.057 0.056 0.051 0.049
median 0.024 0.018 0.024 0.019 0.021 0.028 0.029 0.028 0.042 0.042 0.039 0.030
TP Middle Swan Estuary (Surface)
n 12 8 8 8 8 12 8 8 8 8 8 12
min 0.020 0.027 0.034 0.032 0.031 0.062 0.058 0.073 0.080 0.074 0.110 0.045
max 0.073 0.059 0.061 0.061 0.120 0.170 0.160 0.140 0.170 0.200 0.220 0.340
median 0.042 0.038 0.050 0.046 0.064 0.110 0.115 0.130 0.130 0.165 0.180 0.150
TP Middle Swan Estuary (Bottom)
n 12 8 8 8 8 12 8 8 8 8 8 12
min 0.029 0.025 0.026 0.033 0.028 0.031 0.048 0.063 0.074 0.071 0.041 0.079
max 0.091 0.110 0.097 0.091 0.180 0.180 0.140 0.190 0.160 0.170 0.600 0.570
median 0.052 0.063 0.062 0.056 0.063 0.101 0.102 0.145 0.130 0.135 0.200 0.275
TP Upper Swan Estuary (Surface)
n 12 8 8 8 8 12 8 8 8 8 8 12
min 0.033 0.036 0.048 0.043 0.031 0.044 0.069 0.070 0.120 0.160 0.060 0.037
max 0.190 0.075 0.073 0.055 0.110 0.200 0.180 0.140 0.540 0.490 0.140 0.140
median 0.050 0.046 0.058 0.047 0.065 0.100 0.120 0.115 0.190 0.170 0.100 0.060
TP Upper Swan Estuary (Bottom)
n 12 8 8 8 8 12 8 8 8 8 8 12
min 0.027 0.051 0.047 0.044 0.037 0.048 0.076 0.069 0.160 0.170 0.080 0.038
max 0.092 0.082 0.088 0.140 0.150 0.220 0.180 0.170 0.550 0.400 0.720 0.350
median 0.059 0.072 0.063 0.058 0.080 0.120 0.145 0.135 0.180 0.180 0.460 0.059
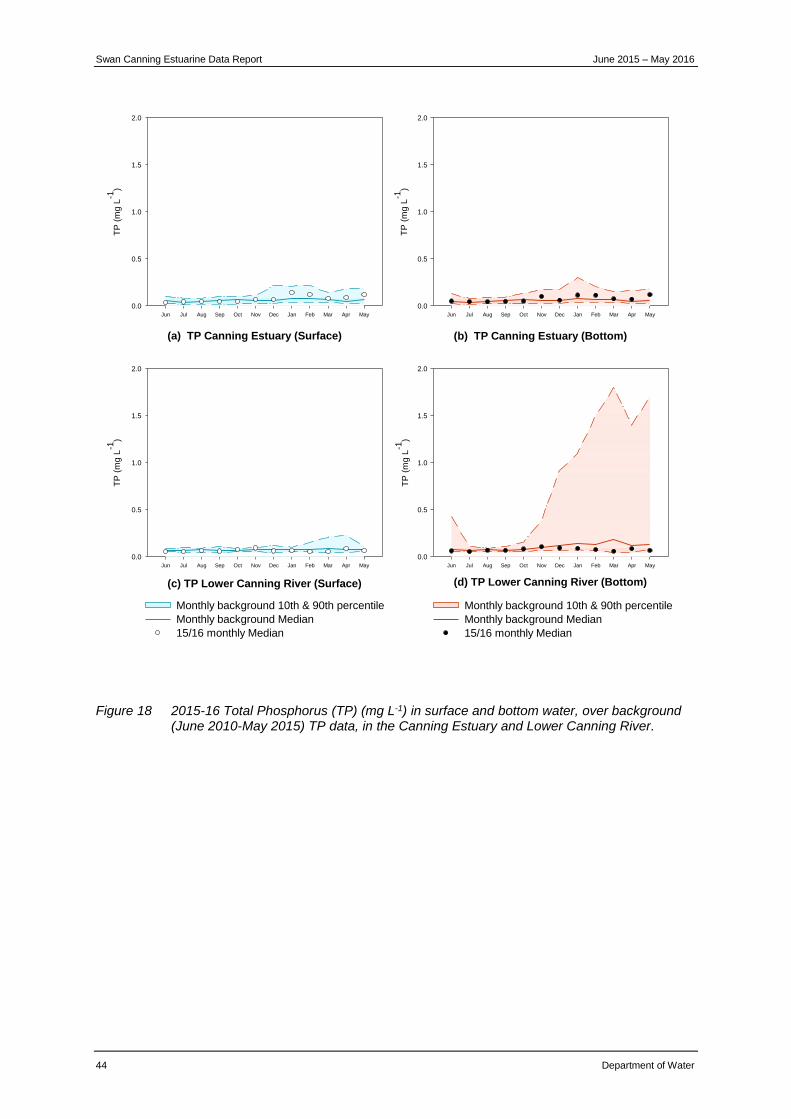
Swan Canning Estuarine Data Report June 2015 – May 2016
44 Department of Water
Figure 18 2015-16 Total Phosphorus (TP) (mg L-1) in surface and bottom water, over background (June 2010-May 2015) TP data, in the Canning Estuary and Lower Canning River.
(c) TP Lower Canning River (Surface)
Jun Jul Aug Sep Oct Nov Dec Jan Feb Mar Apr May
TP
(m
g L
-1)
0.0
0.5
1.0
1.5
2.0
(d) TP Lower Canning River (Bottom)
Jun Jul Aug Sep Oct Nov Dec Jan Feb Mar Apr May
TP
(m
g L
-1)
0.0
0.5
1.0
1.5
2.0
(a) TP Canning Estuary (Surface)
Jun Jul Aug Sep Oct Nov Dec Jan Feb Mar Apr May
TP
(m
g L
-1)
0.0
0.5
1.0
1.5
2.0
Monthly background 10th & 90th percentile
Monthly background Median
15/16 monthly Median
(b) TP Canning Estuary (Bottom)
Jun Jul Aug Sep Oct Nov Dec Jan Feb Mar Apr May
TP
(m
g L
-1)
0.0
0.5
1.0
1.5
2.0
Monthly background 10th & 90th percentile
Monthly background Median
15/16 monthly Median
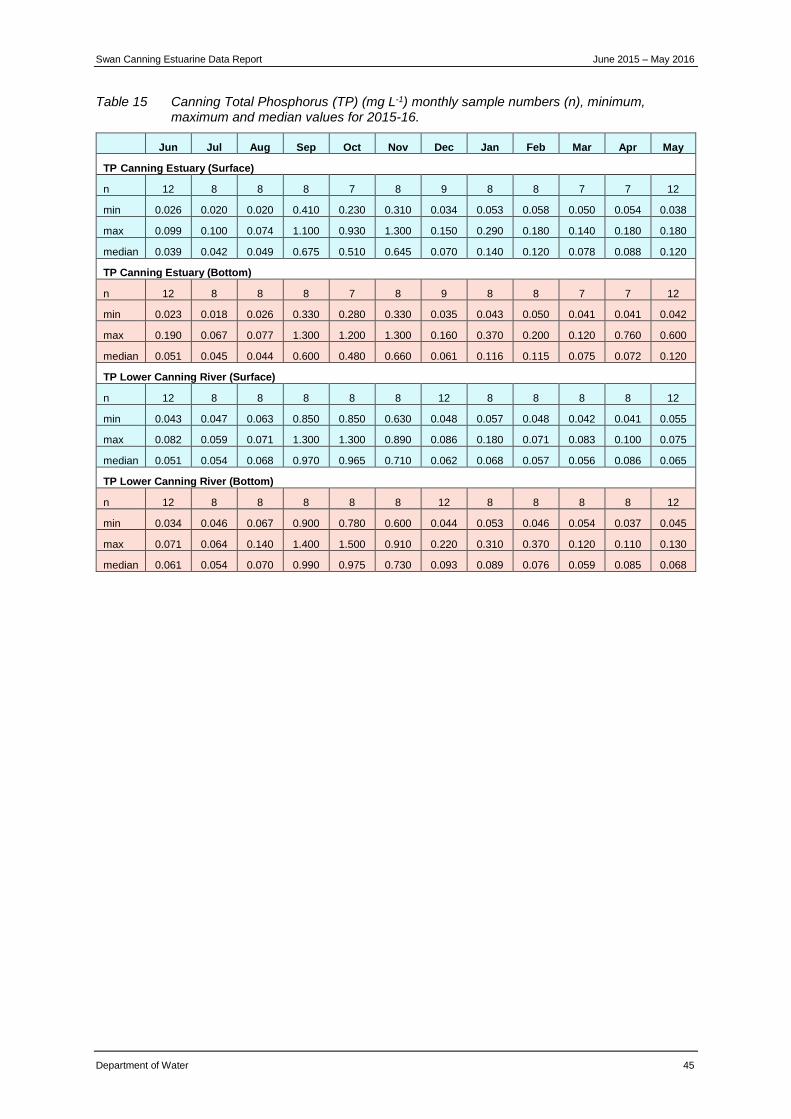
Swan Canning Estuarine Data Report June 2015 – May 2016
Department of Water 45
Table 15 Canning Total Phosphorus (TP) (mg L-1) monthly sample numbers (n), minimum, maximum and median values for 2015-16.
Jun Jul Aug Sep Oct Nov Dec Jan Feb Mar Apr May
TP Canning Estuary (Surface)
n 12 8 8 8 7 8 9 8 8 7 7 12
min 0.026 0.020 0.020 0.410 0.230 0.310 0.034 0.053 0.058 0.050 0.054 0.038
max 0.099 0.100 0.074 1.100 0.930 1.300 0.150 0.290 0.180 0.140 0.180 0.180
median 0.039 0.042 0.049 0.675 0.510 0.645 0.070 0.140 0.120 0.078 0.088 0.120
TP Canning Estuary (Bottom)
n 12 8 8 8 7 8 9 8 8 7 7 12
min 0.023 0.018 0.026 0.330 0.280 0.330 0.035 0.043 0.050 0.041 0.041 0.042
max 0.190 0.067 0.077 1.300 1.200 1.300 0.160 0.370 0.200 0.120 0.760 0.600
median 0.051 0.045 0.044 0.600 0.480 0.660 0.061 0.116 0.115 0.075 0.072 0.120
TP Lower Canning River (Surface)
n 12 8 8 8 8 8 12 8 8 8 8 12
min 0.043 0.047 0.063 0.850 0.850 0.630 0.048 0.057 0.048 0.042 0.041 0.055
max 0.082 0.059 0.071 1.300 1.300 0.890 0.086 0.180 0.071 0.083 0.100 0.075
median 0.051 0.054 0.068 0.970 0.965 0.710 0.062 0.068 0.057 0.056 0.086 0.065
TP Lower Canning River (Bottom)
n 12 8 8 8 8 8 12 8 8 8 8 12
min 0.034 0.046 0.067 0.900 0.780 0.600 0.044 0.053 0.046 0.054 0.037 0.045
max 0.071 0.064 0.140 1.400 1.500 0.910 0.220 0.310 0.370 0.120 0.110 0.130
median 0.061 0.054 0.070 0.990 0.975 0.730 0.093 0.089 0.076 0.059 0.085 0.068
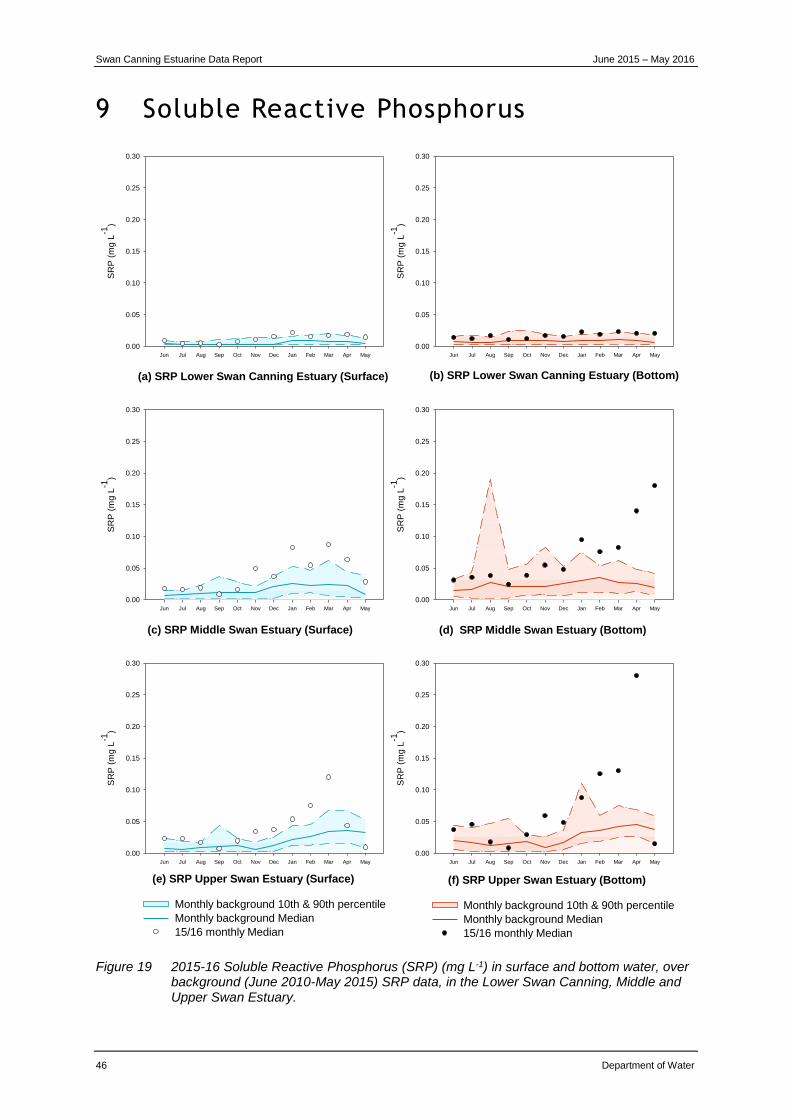
Swan Canning Estuarine Data Report June 2015 – May 2016
46 Department of Water
9 Soluble Reactive Phosphorus
Figure 19 2015-16 Soluble Reactive Phosphorus (SRP) (mg L-1) in surface and bottom water, over background (June 2010-May 2015) SRP data, in the Lower Swan Canning, Middle and Upper Swan Estuary.
(e) SRP Upper Swan Estuary (Surface)
Jun Jul Aug Sep Oct Nov Dec Jan Feb Mar Apr May
SR
P (
mg
L-1
)
0.00
0.05
0.10
0.15
0.20
0.25
0.30
(f) SRP Upper Swan Estuary (Bottom)
Jun Jul Aug Sep Oct Nov Dec Jan Feb Mar Apr May
SR
P (
mg
L-1
)
0.00
0.05
0.10
0.15
0.20
0.25
0.30
(b) SRP Lower Swan Canning Estuary (Bottom)
Jun Jul Aug Sep Oct Nov Dec Jan Feb Mar Apr May
SR
P (
mg
L-1
)
0.00
0.05
0.10
0.15
0.20
0.25
0.30
Monthly background 10th & 90th percentile
Monthly background Median
15/16 monthly Median
(c) SRP Middle Swan Estuary (Surface)
Jun Jul Aug Sep Oct Nov Dec Jan Feb Mar Apr May
SR
P (
mg
L-1
)
0.00
0.05
0.10
0.15
0.20
0.25
0.30
(d) SRP Middle Swan Estuary (Bottom)
Jun Jul Aug Sep Oct Nov Dec Jan Feb Mar Apr May
SR
P (
mg
L-1
)
0.00
0.05
0.10
0.15
0.20
0.25
0.30
(a) SRP Lower Swan Canning Estuary (Surface)
Jun Jul Aug Sep Oct Nov Dec Jan Feb Mar Apr May
SR
P (
mg
L-1
)
0.00
0.05
0.10
0.15
0.20
0.25
0.30
Monthly background 10th & 90th percentile
Monthly background Median
15/16 monthly Median
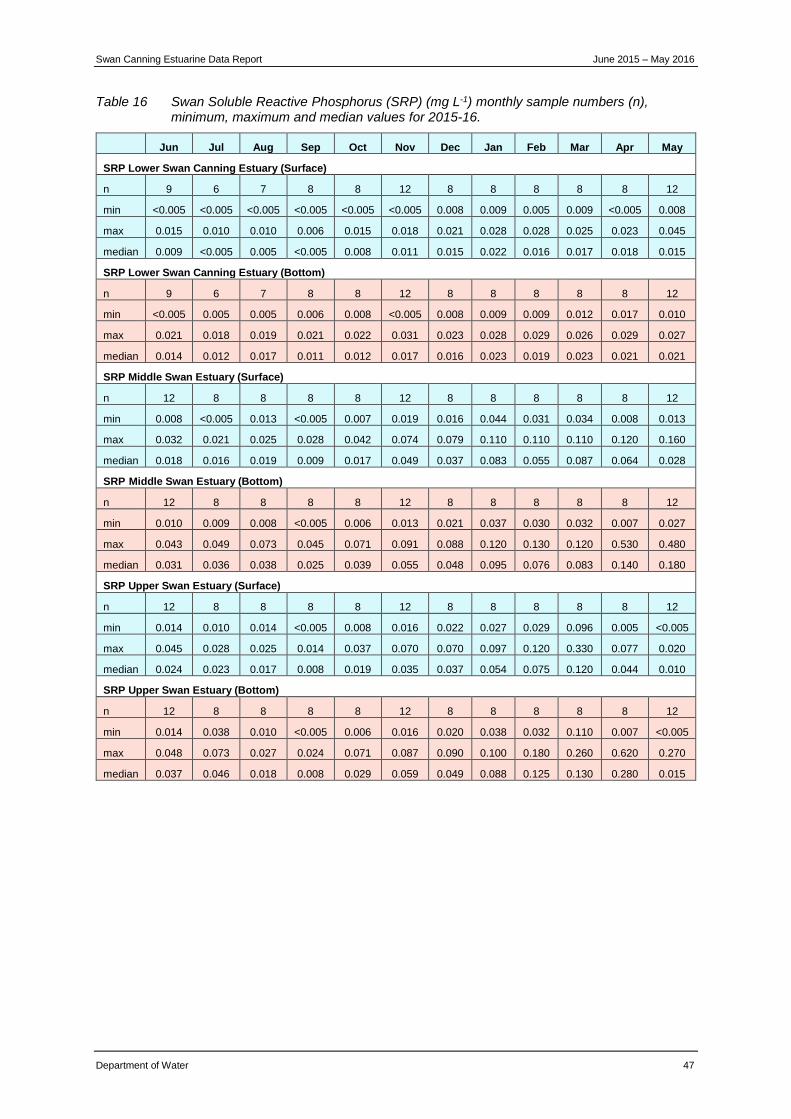
Swan Canning Estuarine Data Report June 2015 – May 2016
Department of Water 47
Table 16 Swan Soluble Reactive Phosphorus (SRP) (mg L-1) monthly sample numbers (n), minimum, maximum and median values for 2015-16.
Jun Jul Aug Sep Oct Nov Dec Jan Feb Mar Apr May
SRP Lower Swan Canning Estuary (Surface)
n 9 6 7 8 8 12 8 8 8 8 8 12
min <0.005 <0.005 <0.005 <0.005 <0.005 <0.005 0.008 0.009 0.005 0.009 <0.005 0.008
max 0.015 0.010 0.010 0.006 0.015 0.018 0.021 0.028 0.028 0.025 0.023 0.045
median 0.009 <0.005 0.005 <0.005 0.008 0.011 0.015 0.022 0.016 0.017 0.018 0.015
SRP Lower Swan Canning Estuary (Bottom)
n 9 6 7 8 8 12 8 8 8 8 8 12
min <0.005 0.005 0.005 0.006 0.008 <0.005 0.008 0.009 0.009 0.012 0.017 0.010
max 0.021 0.018 0.019 0.021 0.022 0.031 0.023 0.028 0.029 0.026 0.029 0.027
median 0.014 0.012 0.017 0.011 0.012 0.017 0.016 0.023 0.019 0.023 0.021 0.021
SRP Middle Swan Estuary (Surface)
n 12 8 8 8 8 12 8 8 8 8 8 12
min 0.008 <0.005 0.013 <0.005 0.007 0.019 0.016 0.044 0.031 0.034 0.008 0.013
max 0.032 0.021 0.025 0.028 0.042 0.074 0.079 0.110 0.110 0.110 0.120 0.160
median 0.018 0.016 0.019 0.009 0.017 0.049 0.037 0.083 0.055 0.087 0.064 0.028
SRP Middle Swan Estuary (Bottom)
n 12 8 8 8 8 12 8 8 8 8 8 12
min 0.010 0.009 0.008 <0.005 0.006 0.013 0.021 0.037 0.030 0.032 0.007 0.027
max 0.043 0.049 0.073 0.045 0.071 0.091 0.088 0.120 0.130 0.120 0.530 0.480
median 0.031 0.036 0.038 0.025 0.039 0.055 0.048 0.095 0.076 0.083 0.140 0.180
SRP Upper Swan Estuary (Surface)
n 12 8 8 8 8 12 8 8 8 8 8 12
min 0.014 0.010 0.014 <0.005 0.008 0.016 0.022 0.027 0.029 0.096 0.005 <0.005
max 0.045 0.028 0.025 0.014 0.037 0.070 0.070 0.097 0.120 0.330 0.077 0.020
median 0.024 0.023 0.017 0.008 0.019 0.035 0.037 0.054 0.075 0.120 0.044 0.010
SRP Upper Swan Estuary (Bottom)
n 12 8 8 8 8 12 8 8 8 8 8 12
min 0.014 0.038 0.010 <0.005 0.006 0.016 0.020 0.038 0.032 0.110 0.007 <0.005
max 0.048 0.073 0.027 0.024 0.071 0.087 0.090 0.100 0.180 0.260 0.620 0.270
median 0.037 0.046 0.018 0.008 0.029 0.059 0.049 0.088 0.125 0.130 0.280 0.015
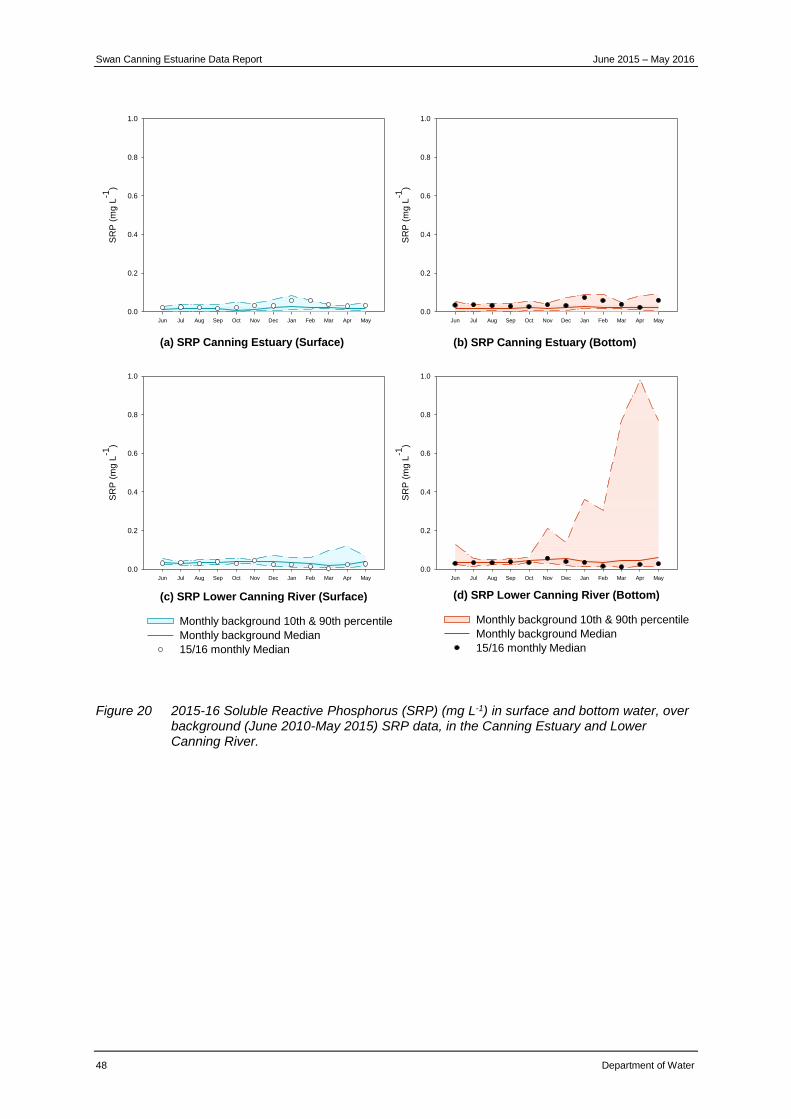
Swan Canning Estuarine Data Report June 2015 – May 2016
48 Department of Water
Figure 20 2015-16 Soluble Reactive Phosphorus (SRP) (mg L-1) in surface and bottom water, over background (June 2010-May 2015) SRP data, in the Canning Estuary and Lower Canning River.
(a) SRP Canning Estuary (Surface)
Jun Jul Aug Sep Oct Nov Dec Jan Feb Mar Apr May
SR
P (
mg
L-1
)
0.0
0.2
0.4
0.6
0.8
1.0
Monthly background 10th & 90th percentile
Monthly background Median
15/16 monthly Median
(b) SRP Canning Estuary (Bottom)
Jun Jul Aug Sep Oct Nov Dec Jan Feb Mar Apr May
SR
P (
mg
L-1
)
0.0
0.2
0.4
0.6
0.8
1.0
Monthly background 10th & 90th percentile
Monthly background Median
15/16 monthly Median
(c) SRP Lower Canning River (Surface)
Jun Jul Aug Sep Oct Nov Dec Jan Feb Mar Apr May
SR
P (
mg
L-1
)
0.0
0.2
0.4
0.6
0.8
1.0
(d) SRP Lower Canning River (Bottom)
Jun Jul Aug Sep Oct Nov Dec Jan Feb Mar Apr May
SR
P (
mg
L-1
)
0.0
0.2
0.4
0.6
0.8
1.0
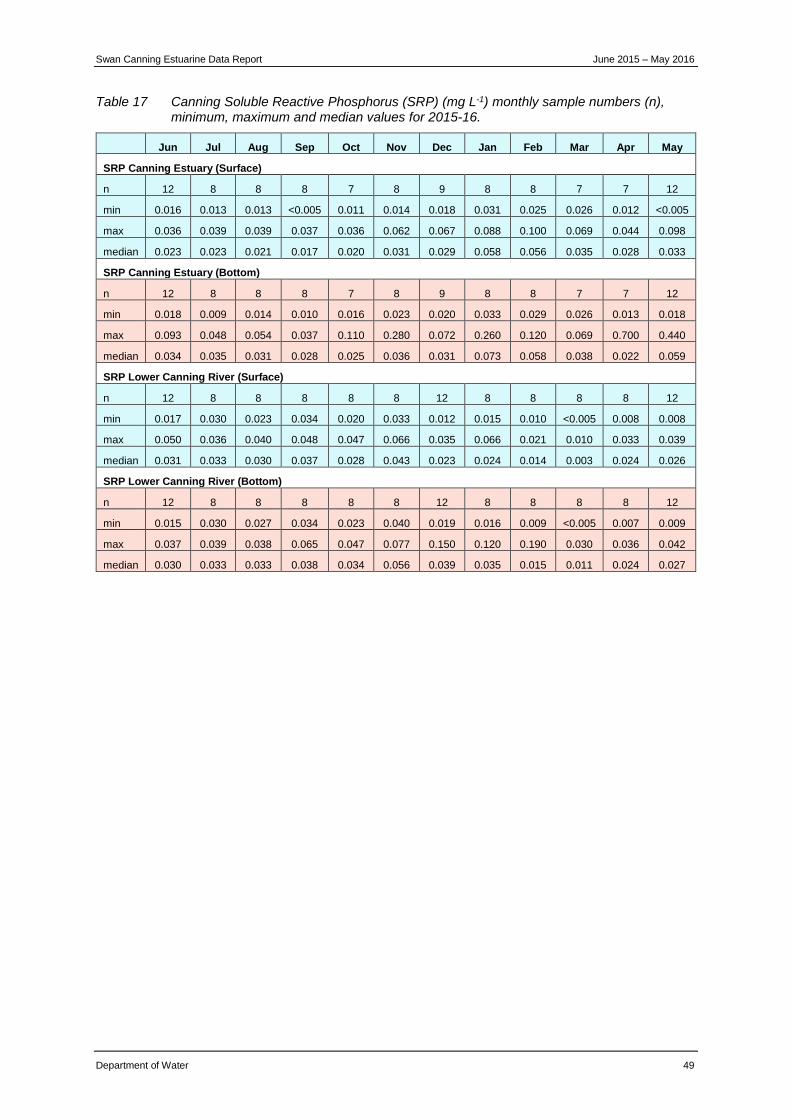
Swan Canning Estuarine Data Report June 2015 – May 2016
Department of Water 49
Table 17 Canning Soluble Reactive Phosphorus (SRP) (mg L-1) monthly sample numbers (n), minimum, maximum and median values for 2015-16.
Jun Jul Aug Sep Oct Nov Dec Jan Feb Mar Apr May
SRP Canning Estuary (Surface)
n 12 8 8 8 7 8 9 8 8 7 7 12
min 0.016 0.013 0.013 <0.005 0.011 0.014 0.018 0.031 0.025 0.026 0.012 <0.005
max 0.036 0.039 0.039 0.037 0.036 0.062 0.067 0.088 0.100 0.069 0.044 0.098
median 0.023 0.023 0.021 0.017 0.020 0.031 0.029 0.058 0.056 0.035 0.028 0.033
SRP Canning Estuary (Bottom)
n 12 8 8 8 7 8 9 8 8 7 7 12
min 0.018 0.009 0.014 0.010 0.016 0.023 0.020 0.033 0.029 0.026 0.013 0.018
max 0.093 0.048 0.054 0.037 0.110 0.280 0.072 0.260 0.120 0.069 0.700 0.440
median 0.034 0.035 0.031 0.028 0.025 0.036 0.031 0.073 0.058 0.038 0.022 0.059
SRP Lower Canning River (Surface)
n 12 8 8 8 8 8 12 8 8 8 8 12
min 0.017 0.030 0.023 0.034 0.020 0.033 0.012 0.015 0.010 <0.005 0.008 0.008
max 0.050 0.036 0.040 0.048 0.047 0.066 0.035 0.066 0.021 0.010 0.033 0.039
median 0.031 0.033 0.030 0.037 0.028 0.043 0.023 0.024 0.014 0.003 0.024 0.026
SRP Lower Canning River (Bottom)
n 12 8 8 8 8 8 12 8 8 8 8 12
min 0.015 0.030 0.027 0.034 0.023 0.040 0.019 0.016 0.009 <0.005 0.007 0.009
max 0.037 0.039 0.038 0.065 0.047 0.077 0.150 0.120 0.190 0.030 0.036 0.042
median 0.030 0.033 0.033 0.038 0.034 0.056 0.039 0.035 0.015 0.011 0.024 0.027
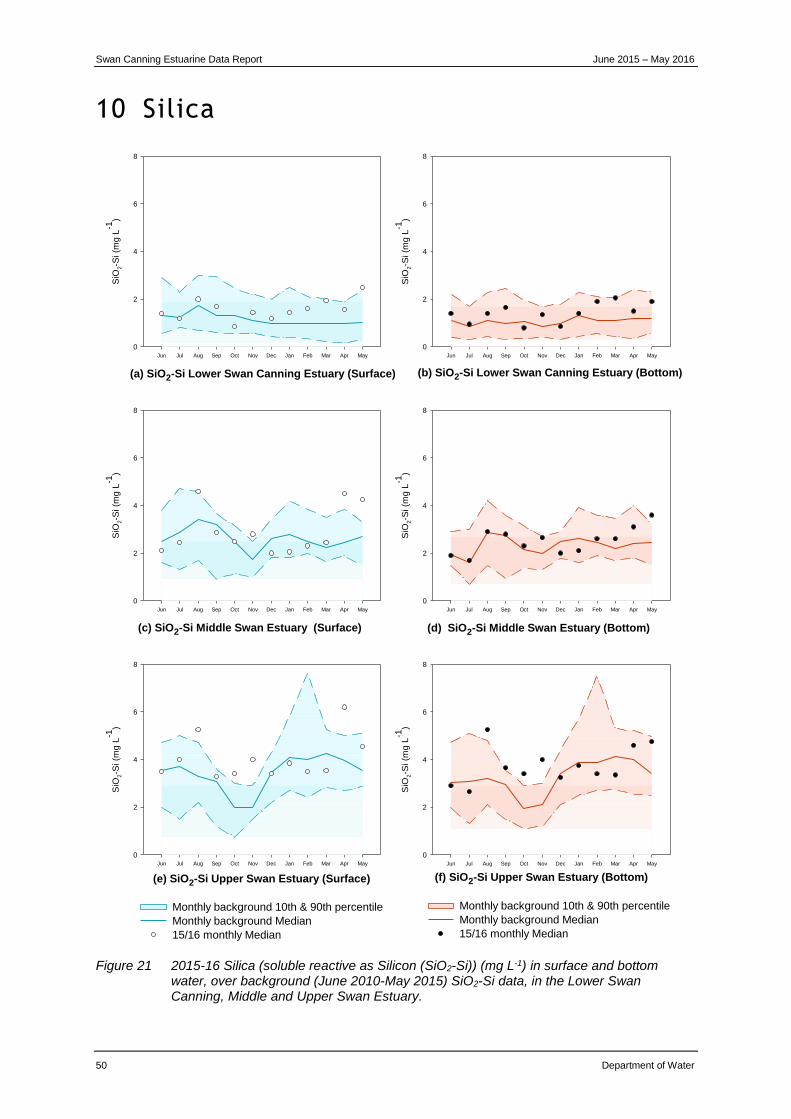
Swan Canning Estuarine Data Report June 2015 – May 2016
50 Department of Water
10 Silica
Figure 21 2015-16 Silica (soluble reactive as Silicon (SiO2-Si)) (mg L-1) in surface and bottom water, over background (June 2010-May 2015) SiO2-Si data, in the Lower Swan Canning, Middle and Upper Swan Estuary.
(f) SiO2-Si Upper Swan Estuary (Bottom)
Jun Jul Aug Sep Oct Nov Dec Jan Feb Mar Apr May
SiO
2-S
i (m
g L
-1)
0
2
4
6
8
(b) SiO2-Si Lower Swan Canning Estuary (Bottom)
Jun Jul Aug Sep Oct Nov Dec Jan Feb Mar Apr May
SiO
2-S
i (m
g L
-1)
0
2
4
6
8
Monthly background 10th & 90th percentile
Monthly background Median
15/16 monthly Median
(c) SiO2-Si Middle Swan Estuary (Surface)
Jun Jul Aug Sep Oct Nov Dec Jan Feb Mar Apr May
SiO
2-S
i (m
g L
-1)
0
2
4
6
8
(d) SiO2-Si Middle Swan Estuary (Bottom)
Jun Jul Aug Sep Oct Nov Dec Jan Feb Mar Apr May
SiO
2-S
i (m
g L
-1)
0
2
4
6
8
(a) SiO2-Si Lower Swan Canning Estuary (Surface)
Jun Jul Aug Sep Oct Nov Dec Jan Feb Mar Apr May
SiO
2-S
i (m
g L
-1)
0
2
4
6
8
Monthly background 10th & 90th percentile
Monthly background Median
15/16 monthly Median
(e) SiO2-Si Upper Swan Estuary (Surface)
Jun Jul Aug Sep Oct Nov Dec Jan Feb Mar Apr May
SiO
2-S
i (m
g L
-1)
0
2
4
6
8
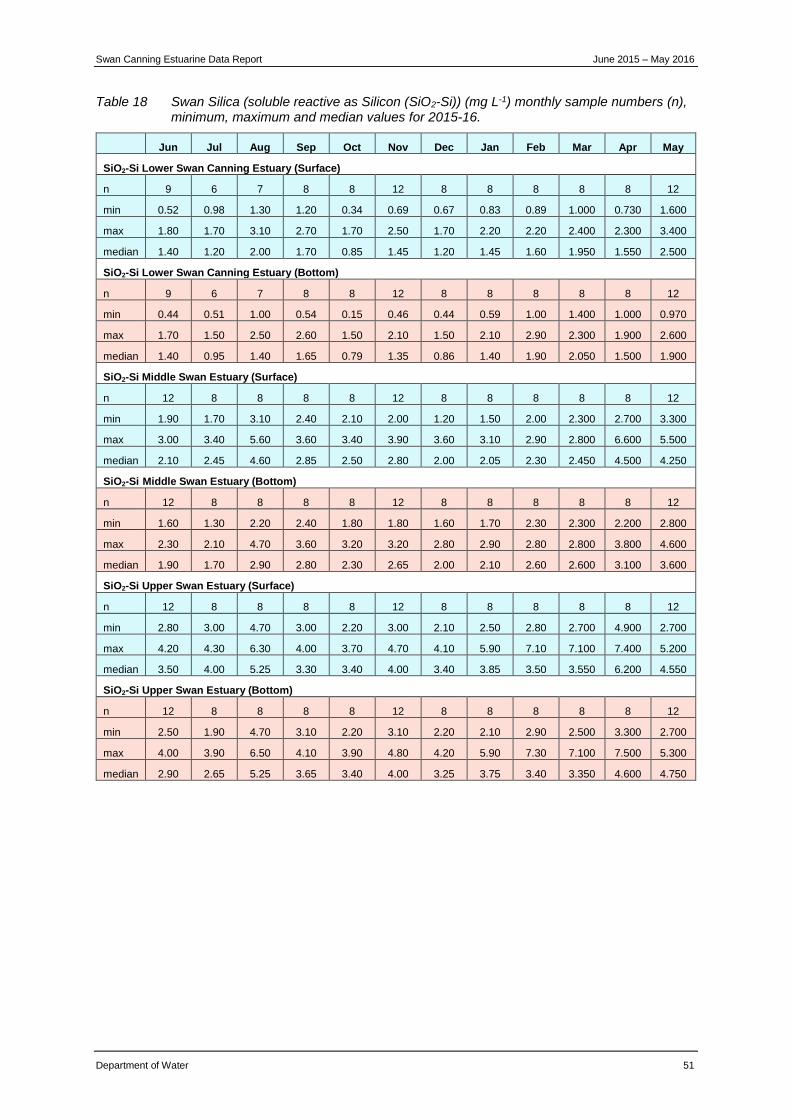
Swan Canning Estuarine Data Report June 2015 – May 2016
Department of Water 51
Table 18 Swan Silica (soluble reactive as Silicon (SiO2-Si)) (mg L-1) monthly sample numbers (n), minimum, maximum and median values for 2015-16.
Jun Jul Aug Sep Oct Nov Dec Jan Feb Mar Apr May
SiO2-Si Lower Swan Canning Estuary (Surface)
n 9 6 7 8 8 12 8 8 8 8 8 12
min 0.52 0.98 1.30 1.20 0.34 0.69 0.67 0.83 0.89 1.000 0.730 1.600
max 1.80 1.70 3.10 2.70 1.70 2.50 1.70 2.20 2.20 2.400 2.300 3.400
median 1.40 1.20 2.00 1.70 0.85 1.45 1.20 1.45 1.60 1.950 1.550 2.500
SiO2-Si Lower Swan Canning Estuary (Bottom)
n 9 6 7 8 8 12 8 8 8 8 8 12
min 0.44 0.51 1.00 0.54 0.15 0.46 0.44 0.59 1.00 1.400 1.000 0.970
max 1.70 1.50 2.50 2.60 1.50 2.10 1.50 2.10 2.90 2.300 1.900 2.600
median 1.40 0.95 1.40 1.65 0.79 1.35 0.86 1.40 1.90 2.050 1.500 1.900
SiO2-Si Middle Swan Estuary (Surface)
n 12 8 8 8 8 12 8 8 8 8 8 12
min 1.90 1.70 3.10 2.40 2.10 2.00 1.20 1.50 2.00 2.300 2.700 3.300
max 3.00 3.40 5.60 3.60 3.40 3.90 3.60 3.10 2.90 2.800 6.600 5.500
median 2.10 2.45 4.60 2.85 2.50 2.80 2.00 2.05 2.30 2.450 4.500 4.250
SiO2-Si Middle Swan Estuary (Bottom)
n 12 8 8 8 8 12 8 8 8 8 8 12
min 1.60 1.30 2.20 2.40 1.80 1.80 1.60 1.70 2.30 2.300 2.200 2.800
max 2.30 2.10 4.70 3.60 3.20 3.20 2.80 2.90 2.80 2.800 3.800 4.600
median 1.90 1.70 2.90 2.80 2.30 2.65 2.00 2.10 2.60 2.600 3.100 3.600
SiO2-Si Upper Swan Estuary (Surface)
n 12 8 8 8 8 12 8 8 8 8 8 12
min 2.80 3.00 4.70 3.00 2.20 3.00 2.10 2.50 2.80 2.700 4.900 2.700
max 4.20 4.30 6.30 4.00 3.70 4.70 4.10 5.90 7.10 7.100 7.400 5.200
median 3.50 4.00 5.25 3.30 3.40 4.00 3.40 3.85 3.50 3.550 6.200 4.550
SiO2-Si Upper Swan Estuary (Bottom)
n 12 8 8 8 8 12 8 8 8 8 8 12
min 2.50 1.90 4.70 3.10 2.20 3.10 2.20 2.10 2.90 2.500 3.300 2.700
max 4.00 3.90 6.50 4.10 3.90 4.80 4.20 5.90 7.30 7.100 7.500 5.300
median 2.90 2.65 5.25 3.65 3.40 4.00 3.25 3.75 3.40 3.350 4.600 4.750
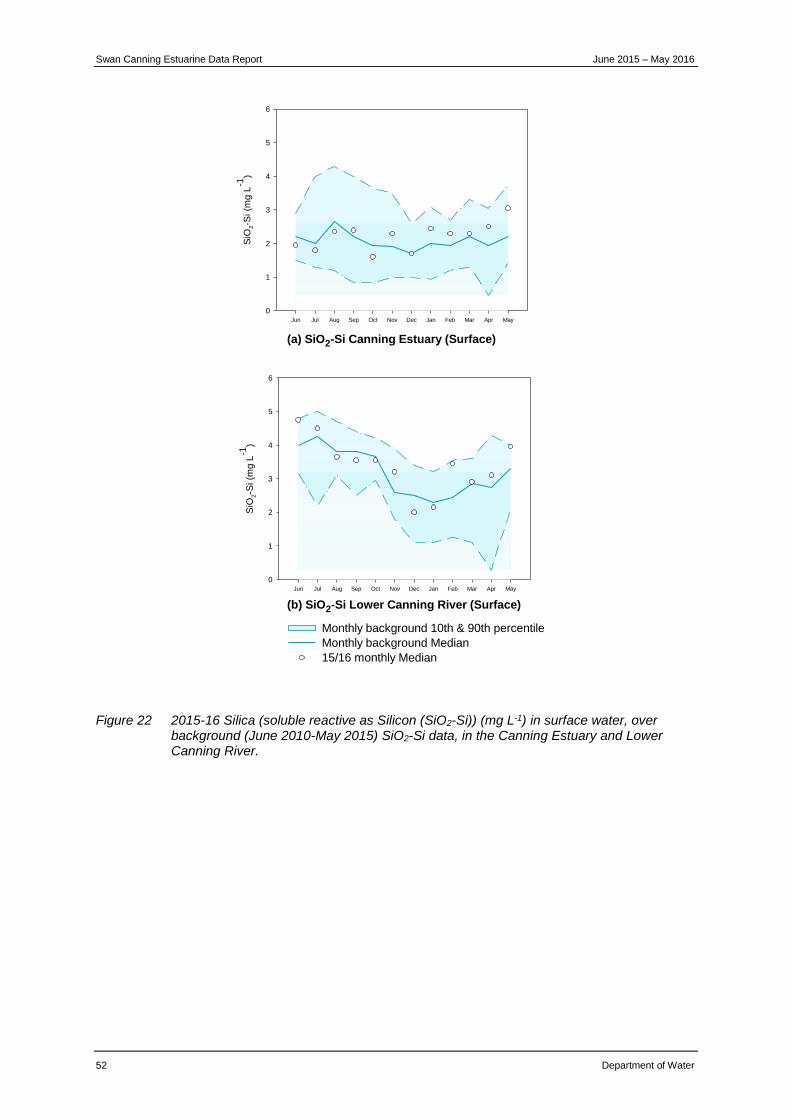
Swan Canning Estuarine Data Report June 2015 – May 2016
52 Department of Water
Figure 22 2015-16 Silica (soluble reactive as Silicon (SiO2-Si)) (mg L-1) in surface water, over background (June 2010-May 2015) SiO2-Si data, in the Canning Estuary and Lower Canning River.
(b) SiO2-Si Lower Canning River (Surface)
Jun Jul Aug Sep Oct Nov Dec Jan Feb Mar Apr May
SiO
2-S
i (m
g L
-1)
0
1
2
3
4
5
6
(a) SiO2-Si Canning Estuary (Surface)
Jun Jul Aug Sep Oct Nov Dec Jan Feb Mar Apr May
SiO
2-S
i (m
g L
-1)
0
1
2
3
4
5
6
Monthly background 10th & 90th percentile
Monthly background Median
15/16 monthly Median
Swan Canning Estuarine Data Report June 2015 – May 2016
Department of Water 53
Table 19 Canning Silica (soluble reactive as Silicon (SiO2-Si)) (mg L-1) monthly sample numbers (n), minimum, maximum and median values for 2015-16.
Jun Jul Aug Sep Oct Nov Dec Jan Feb Mar Apr May
SiO2-Si Canning Estuary (Surface)
n 12 8 8 8 7 8 9 8 8 7 7 12
min 1.30 1.30 1.60 1.50 1.00 1.20 1.00 1.60 0.96 1.70 1.90 2.40
max 3.60 4.10 4.00 3.50 3.50 3.20 2.40 3.10 3.00 3.00 3.10 3.60
median 1.95 1.80 2.35 2.40 1.60 2.30 1.70 2.45 2.30 2.30 2.50 3.05
SiO2-Si Lower Canning River (Surface)
n 12 8 8 8 8 8 12 8 8 8 8 12
min 4.20 4.00 3.00 3.40 3.40 3.00 0.27 0.29 2.70 2.50 2.20 3.20
max 5.20 4.80 4.20 3.80 3.90 3.60 2.60 4.50 4.10 3.40 4.10 4.90
median 4.75 4.50 3.65 3.55 3.55 3.20 2.00 2.15 3.45 2.90 3.10 3.95
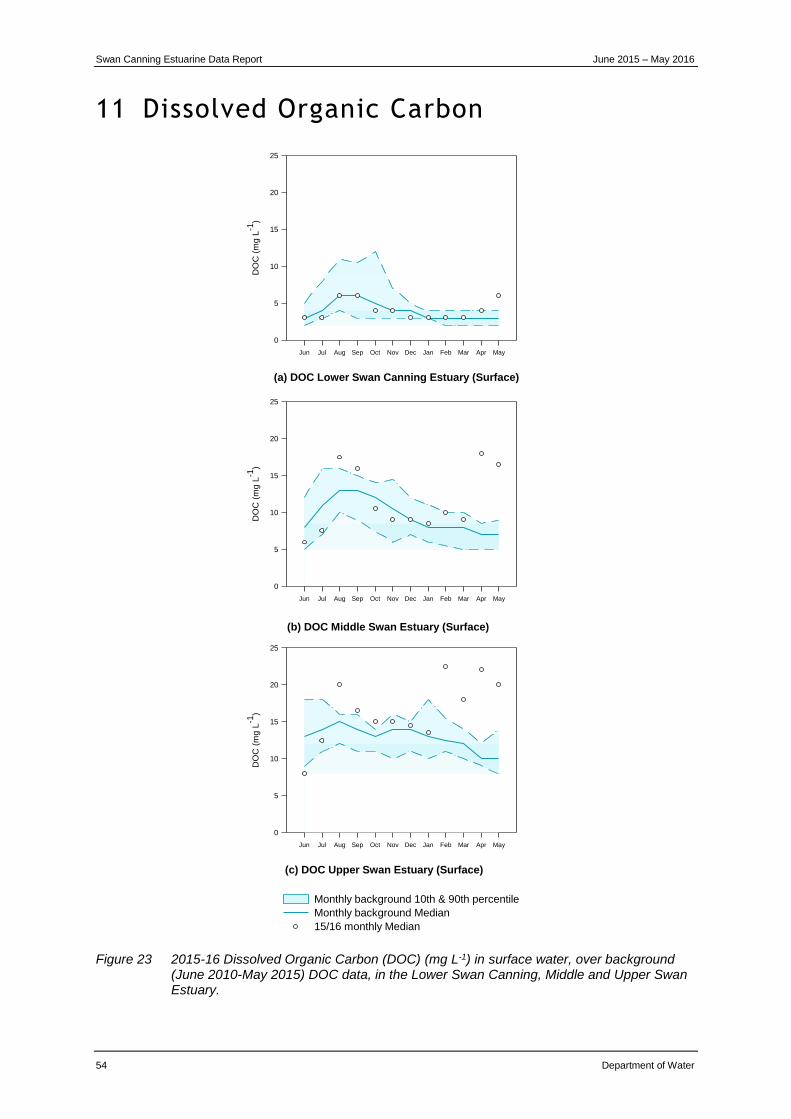
Swan Canning Estuarine Data Report June 2015 – May 2016
54 Department of Water
11 Dissolved Organic Carbon
Figure 23 2015-16 Dissolved Organic Carbon (DOC) (mg L-1) in surface water, over background (June 2010-May 2015) DOC data, in the Lower Swan Canning, Middle and Upper Swan Estuary.
(b) DOC Middle Swan Estuary (Surface)
Jun Jul Aug Sep Oct Nov Dec Jan Feb Mar Apr May
DO
C (
mg L
-1)
0
5
10
15
20
25
(c) DOC Upper Swan Estuary (Surface)
Jun Jul Aug Sep Oct Nov Dec Jan Feb Mar Apr May
DO
C (
mg L
-1)
0
5
10
15
20
25
(a) DOC Lower Swan Canning Estuary (Surface)
Jun Jul Aug Sep Oct Nov Dec Jan Feb Mar Apr May
DO
C (
mg L
-1)
0
5
10
15
20
25
Monthly background 10th & 90th percentile
Monthly background Median
15/16 monthly Median
Swan Canning Estuarine Data Report June 2015 – May 2016
Department of Water 55
Table 20 Swan Dissolved Organic Carbon (DOC) (mg L-1) monthly sample numbers (n), minimum, maximum and median values for 2015-16.
Jun Jul Aug Sep Oct Nov Dec Jan Feb Mar Apr May
DOC Lower Swan Canning Estuary (Surface)
n 9 6 7 8 8 12 8 8 8 8 8 12
min 3 3 4 5 3 3 3 2 3 2 3 4
max 4 4 12 11 5 5 4 4 4 4 8 11
median 3 3 6 6 4 4 3 3 3 3 4 6
DOC Middle Swan Estuary (Surface)
n 12 8 8 8 8 12 8 8 8 8 8 12
min 4 5 8 13 7 7 6 6 6 6 11 11
max 8 11 21 17 14 13 11 11 13 12 25 24
median 6 8 18 16 11 9 9 9 10 9 18 17
DOC Upper Swan Estuary (Surface)
n 12 8 8 8 8 12 8 8 8 8 8 12
min 7 8 18 16 14 13 12 11 15 13 18 17
max 12 16 21 19 16 16 16 16 32 29 25 22
median 8 13 20 17 15 15 15 14 23 18 22 20
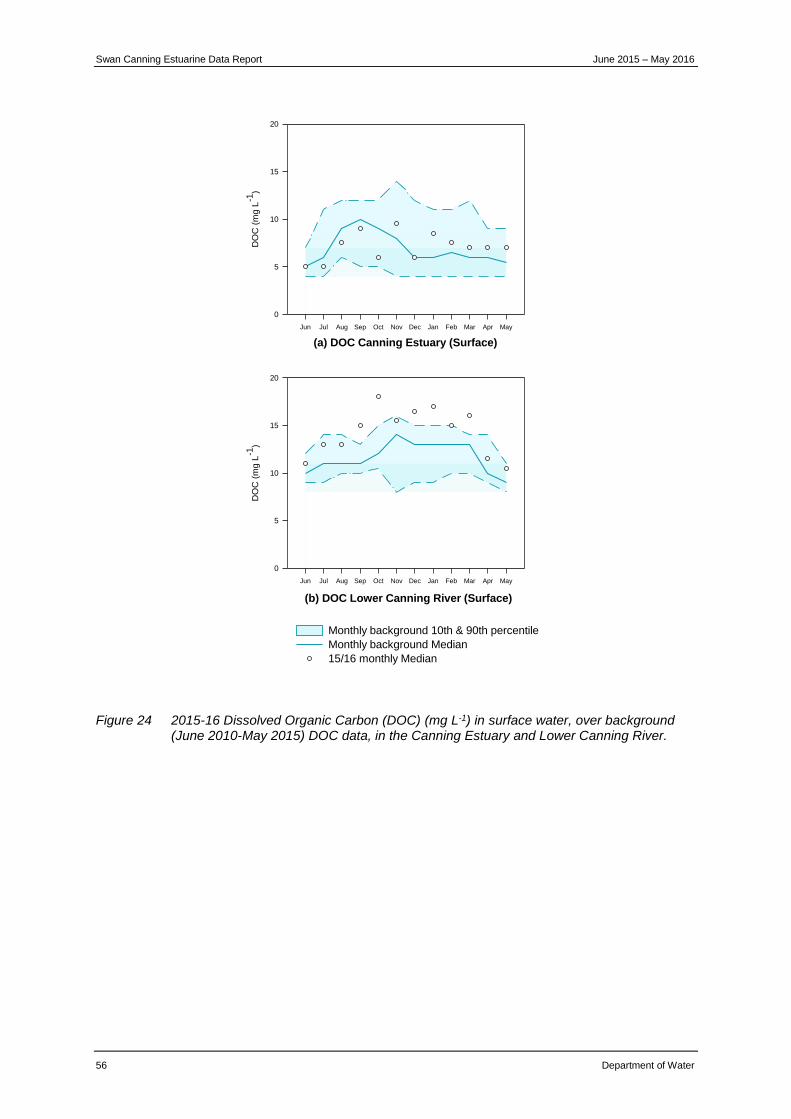
Swan Canning Estuarine Data Report June 2015 – May 2016
56 Department of Water
Figure 24 2015-16 Dissolved Organic Carbon (DOC) (mg L-1) in surface water, over background (June 2010-May 2015) DOC data, in the Canning Estuary and Lower Canning River.
(a) DOC Canning Estuary (Surface)
Jun Jul Aug Sep Oct Nov Dec Jan Feb Mar Apr May
DO
C (
mg L
-1)
0
5
10
15
20
Monthly background 10th & 90th percentile
Monthly background Median
15/16 monthly Median
(b) DOC Lower Canning River (Surface)
Jun Jul Aug Sep Oct Nov Dec Jan Feb Mar Apr May
DO
C (
mg L
-1)
0
5
10
15
20
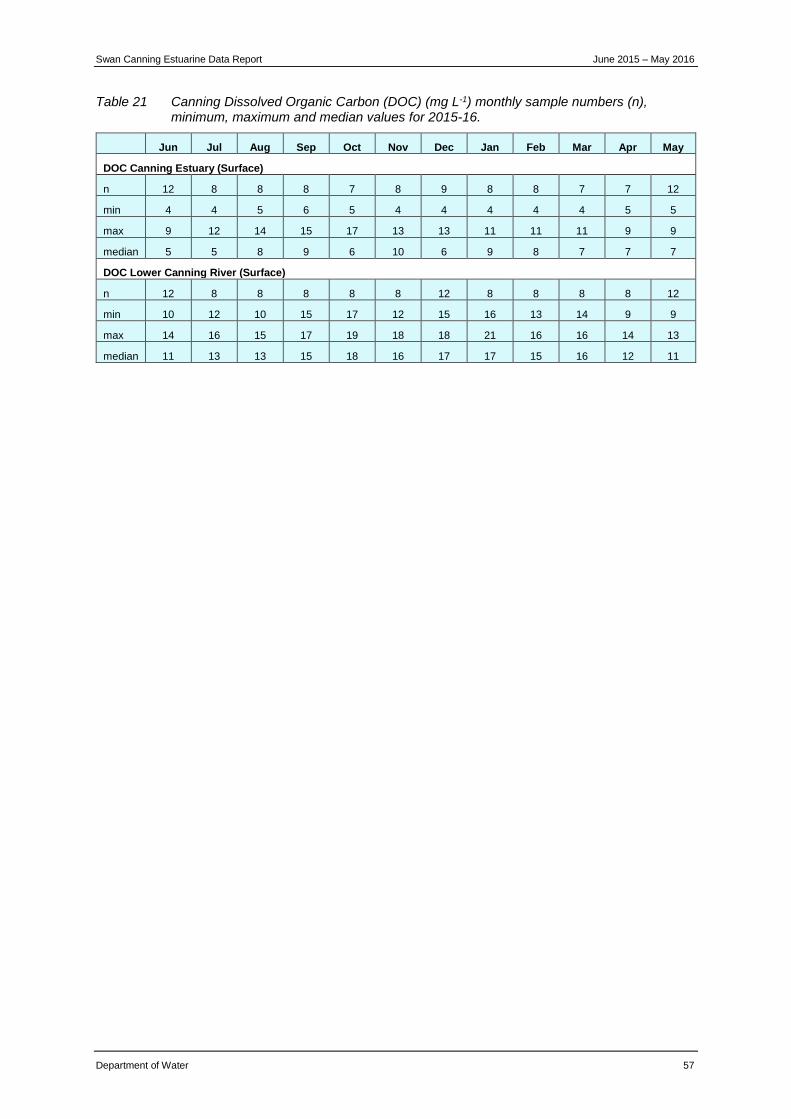
Swan Canning Estuarine Data Report June 2015 – May 2016
Department of Water 57
Table 21 Canning Dissolved Organic Carbon (DOC) (mg L-1) monthly sample numbers (n), minimum, maximum and median values for 2015-16.
Jun Jul Aug Sep Oct Nov Dec Jan Feb Mar Apr May
DOC Canning Estuary (Surface)
n 12 8 8 8 7 8 9 8 8 7 7 12
min 4 4 5 6 5 4 4 4 4 4 5 5
max 9 12 14 15 17 13 13 11 11 11 9 9
median 5 5 8 9 6 10 6 9 8 7 7 7
DOC Lower Canning River (Surface)
n 12 8 8 8 8 8 12 8 8 8 8 12
min 10 12 10 15 17 12 15 16 13 14 9 9
max 14 16 15 17 19 18 18 21 16 16 14 13
median 11 13 13 15 18 16 17 17 15 16 12 11
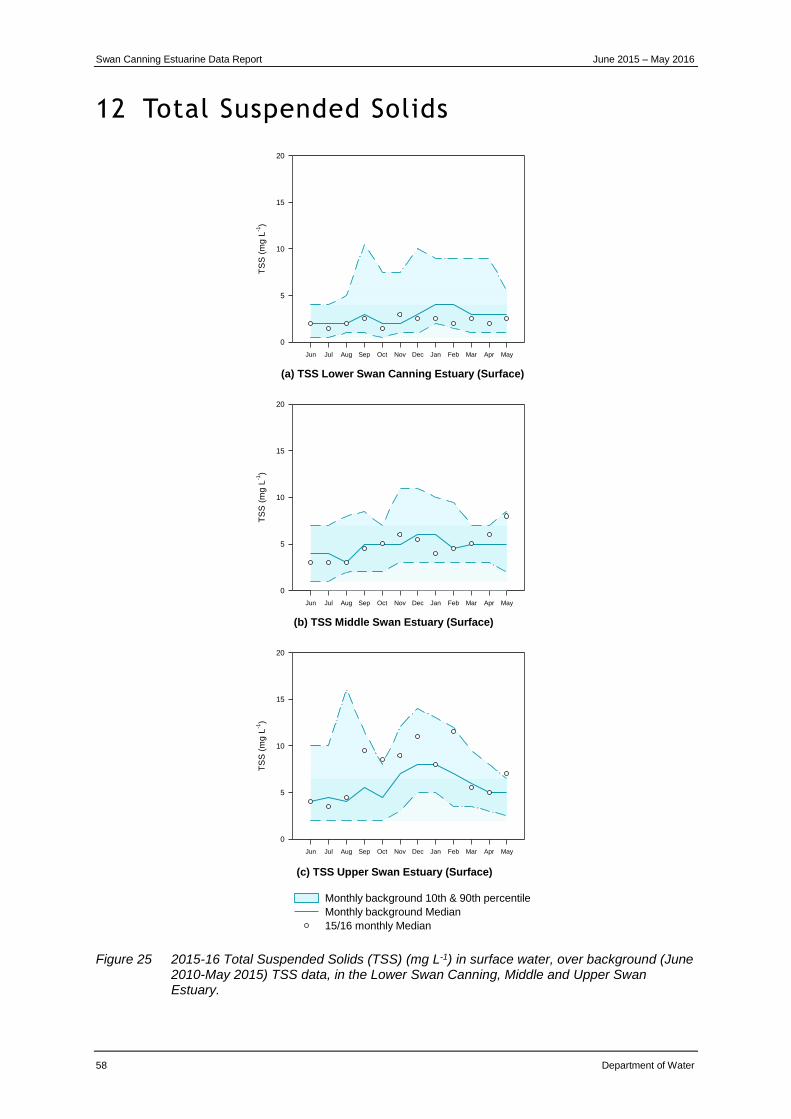
Swan Canning Estuarine Data Report June 2015 – May 2016
58 Department of Water
12 Total Suspended Solids
Figure 25 2015-16 Total Suspended Solids (TSS) (mg L-1) in surface water, over background (June 2010-May 2015) TSS data, in the Lower Swan Canning, Middle and Upper Swan Estuary.
(b) TSS Middle Swan Estuary (Surface)
Jun Jul Aug Sep Oct Nov Dec Jan Feb Mar Apr May
TS
S (
mg
L-1)
0
5
10
15
20
(a) TSS Lower Swan Canning Estuary (Surface)
Jun Jul Aug Sep Oct Nov Dec Jan Feb Mar Apr May
TS
S (
mg
L-1)
0
5
10
15
20
Monthly background 10th & 90th percentile
Monthly background Median
15/16 monthly Median
(c) TSS Upper Swan Estuary (Surface)
Jun Jul Aug Sep Oct Nov Dec Jan Feb Mar Apr May
TS
S (
mg
L-1)
0
5
10
15
20
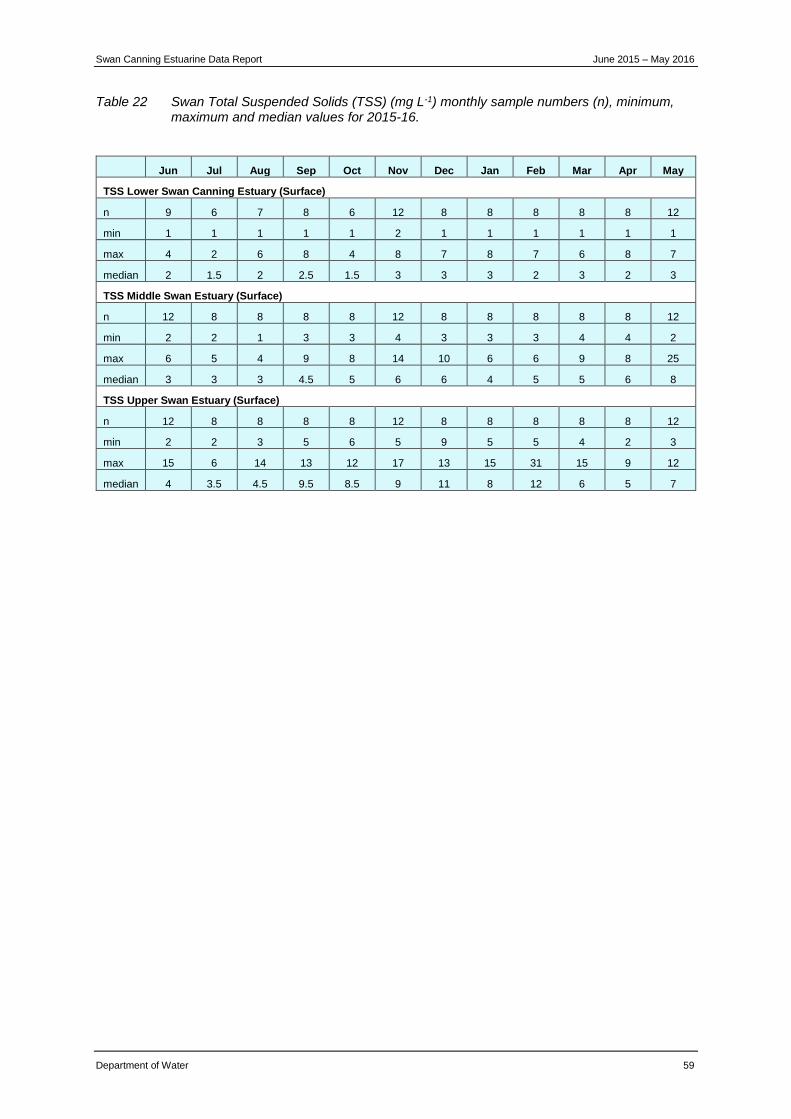
Swan Canning Estuarine Data Report June 2015 – May 2016
Department of Water 59
Table 22 Swan Total Suspended Solids (TSS) (mg L-1) monthly sample numbers (n), minimum, maximum and median values for 2015-16.
Jun Jul Aug Sep Oct Nov Dec Jan Feb Mar Apr May
TSS Lower Swan Canning Estuary (Surface)
n 9 6 7 8 6 12 8 8 8 8 8 12
min 1 1 1 1 1 2 1 1 1 1 1 1
max 4 2 6 8 4 8 7 8 7 6 8 7
median 2 1.5 2 2.5 1.5 3 3 3 2 3 2 3
TSS Middle Swan Estuary (Surface)
n 12 8 8 8 8 12 8 8 8 8 8 12
min 2 2 1 3 3 4 3 3 3 4 4 2
max 6 5 4 9 8 14 10 6 6 9 8 25
median 3 3 3 4.5 5 6 6 4 5 5 6 8
TSS Upper Swan Estuary (Surface)
n 12 8 8 8 8 12 8 8 8 8 8 12
min 2 2 3 5 6 5 9 5 5 4 2 3
max 15 6 14 13 12 17 13 15 31 15 9 12
median 4 3.5 4.5 9.5 8.5 9 11 8 12 6 5 7
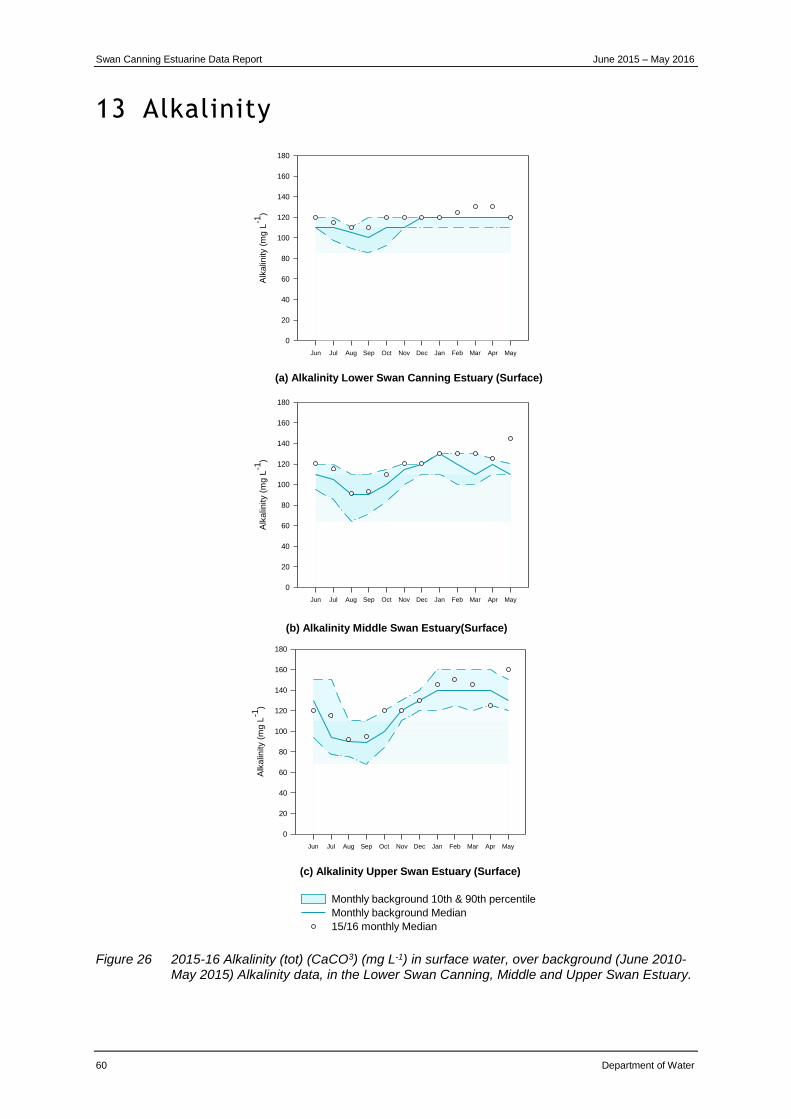
Swan Canning Estuarine Data Report June 2015 – May 2016
60 Department of Water
13 Alkalinity
Figure 26 2015-16 Alkalinity (tot) (CaCO3) (mg L-1) in surface water, over background (June 2010-May 2015) Alkalinity data, in the Lower Swan Canning, Middle and Upper Swan Estuary.
(a) Alkalinity Lower Swan Canning Estuary (Surface)
Jun Jul Aug Sep Oct Nov Dec Jan Feb Mar Apr May
Alk
alin
ity (
mg L
-1)
0
20
40
60
80
100
120
140
160
180
Monthly background 10th & 90th percentile
Monthly background Median
15/16 monthly Median
(c) Alkalinity Upper Swan Estuary (Surface)
Jun Jul Aug Sep Oct Nov Dec Jan Feb Mar Apr May
Alk
alin
ity (
mg L
-1)
0
20
40
60
80
100
120
140
160
180
(b) Alkalinity Middle Swan Estuary(Surface)
Jun Jul Aug Sep Oct Nov Dec Jan Feb Mar Apr May
Alk
alin
ity (
mg L
-1)
0
20
40
60
80
100
120
140
160
180
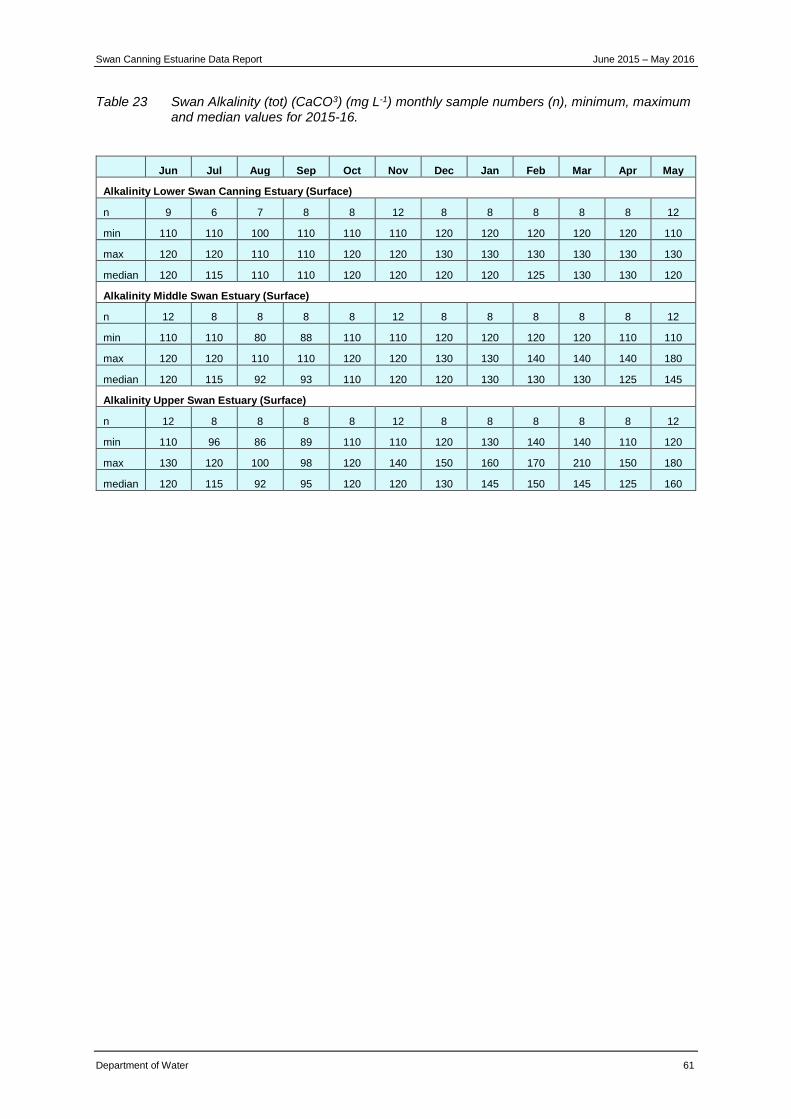
Swan Canning Estuarine Data Report June 2015 – May 2016
Department of Water 61
Table 23 Swan Alkalinity (tot) (CaCO3) (mg L-1) monthly sample numbers (n), minimum, maximum and median values for 2015-16.
Jun Jul Aug Sep Oct Nov Dec Jan Feb Mar Apr May
Alkalinity Lower Swan Canning Estuary (Surface)
n 9 6 7 8 8 12 8 8 8 8 8 12
min 110 110 100 110 110 110 120 120 120 120 120 110
max 120 120 110 110 120 120 130 130 130 130 130 130
median 120 115 110 110 120 120 120 120 125 130 130 120
Alkalinity Middle Swan Estuary (Surface)
n 12 8 8 8 8 12 8 8 8 8 8 12
min 110 110 80 88 110 110 120 120 120 120 110 110
max 120 120 110 110 120 120 130 130 140 140 140 180
median 120 115 92 93 110 120 120 130 130 130 125 145
Alkalinity Upper Swan Estuary (Surface)
n 12 8 8 8 8 12 8 8 8 8 8 12
min 110 96 86 89 110 110 120 130 140 140 110 120
max 130 120 100 98 120 140 150 160 170 210 150 180
median 120 115 92 95 120 120 130 145 150 145 125 160
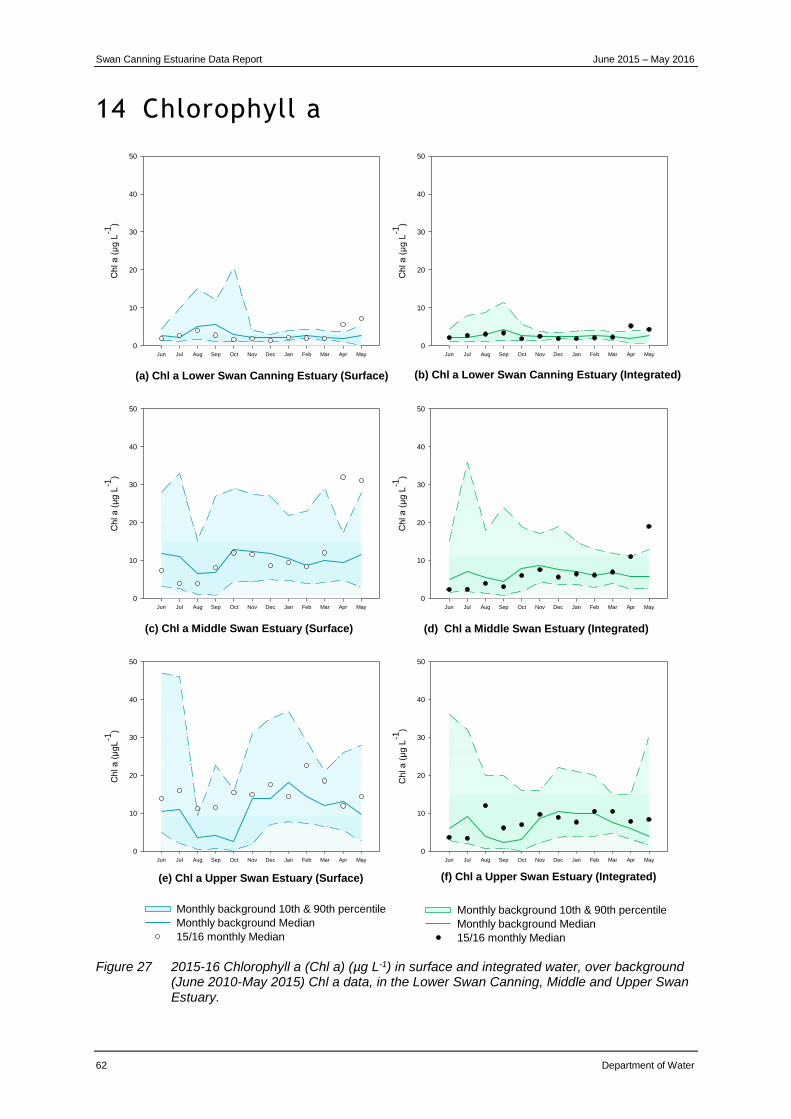
Swan Canning Estuarine Data Report June 2015 – May 2016
62 Department of Water
14 Chlorophyll a
Figure 27 2015-16 Chlorophyll a (Chl a) (µg L-1) in surface and integrated water, over background (June 2010-May 2015) Chl a data, in the Lower Swan Canning, Middle and Upper Swan Estuary.
(b) Chl a Lower Swan Canning Estuary (Integrated)
Jun Jul Aug Sep Oct Nov Dec Jan Feb Mar Apr May
Chl a (
µg L
-1)
0
10
20
30
40
50
Monthly background 10th & 90th percentile
Monthly background Median
15/16 monthly Median
(a) Chl a Lower Swan Canning Estuary (Surface)
Jun Jul Aug Sep Oct Nov Dec Jan Feb Mar Apr May
Chl a (
µg L
-1)
0
10
20
30
40
50
Monthly background 10th & 90th percentile
Monthly background Median
15/16 monthly Median
(d) Chl a Middle Swan Estuary (Integrated)
Jun Jul Aug Sep Oct Nov Dec Jan Feb Mar Apr May
Chl a (
µg L
-1)
0
10
20
30
40
50
(c) Chl a Middle Swan Estuary (Surface)
Jun Jul Aug Sep Oct Nov Dec Jan Feb Mar Apr May
Chl a (
µg L
-1)
0
10
20
30
40
50
(f) Chl a Upper Swan Estuary (Integrated)
Jun Jul Aug Sep Oct Nov Dec Jan Feb Mar Apr May
Chl a (
µg L
-1)
0
10
20
30
40
50
(e) Chl a Upper Swan Estuary (Surface)
Jun Jul Aug Sep Oct Nov Dec Jan Feb Mar Apr May
Chl a (
µgL
-1)
0
10
20
30
40
50
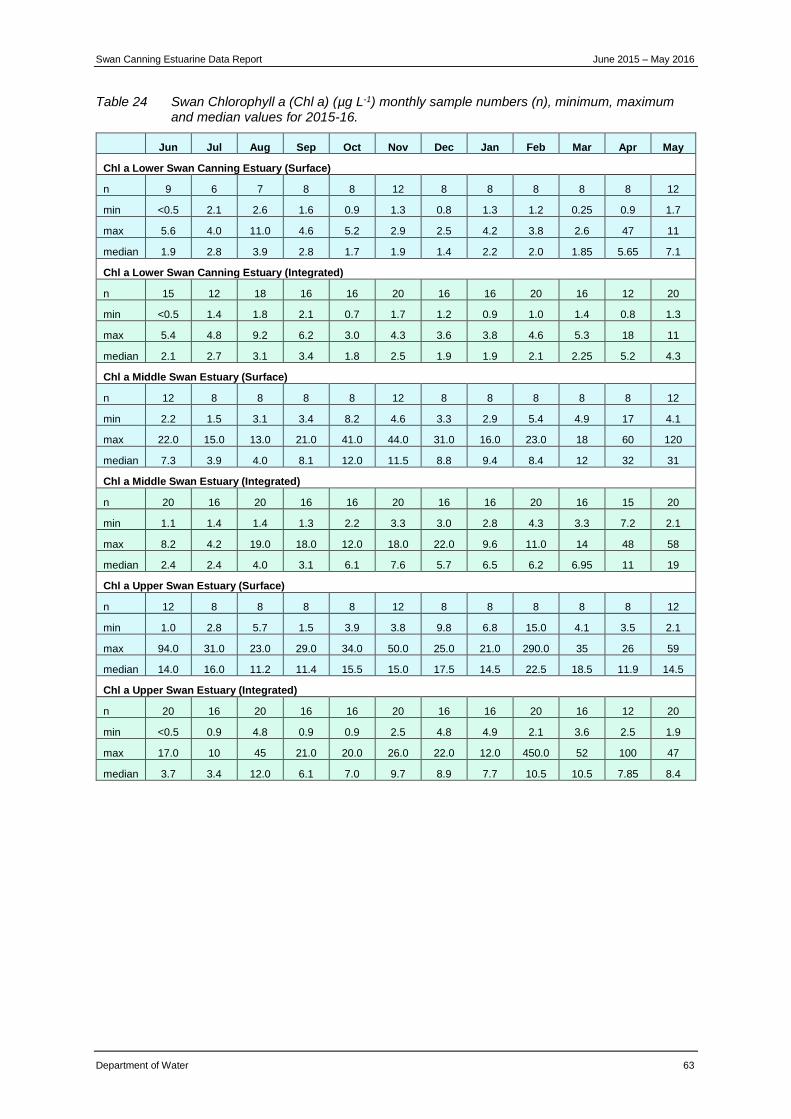
Swan Canning Estuarine Data Report June 2015 – May 2016
Department of Water 63
Table 24 Swan Chlorophyll a (Chl a) (µg L-1) monthly sample numbers (n), minimum, maximum and median values for 2015-16.
Jun Jul Aug Sep Oct Nov Dec Jan Feb Mar Apr May
Chl a Lower Swan Canning Estuary (Surface)
n 9 6 7 8 8 12 8 8 8 8 8 12
min <0.5 2.1 2.6 1.6 0.9 1.3 0.8 1.3 1.2 0.25 0.9 1.7
max 5.6 4.0 11.0 4.6 5.2 2.9 2.5 4.2 3.8 2.6 47 11
median 1.9 2.8 3.9 2.8 1.7 1.9 1.4 2.2 2.0 1.85 5.65 7.1
Chl a Lower Swan Canning Estuary (Integrated)
n 15 12 18 16 16 20 16 16 20 16 12 20
min <0.5 1.4 1.8 2.1 0.7 1.7 1.2 0.9 1.0 1.4 0.8 1.3
max 5.4 4.8 9.2 6.2 3.0 4.3 3.6 3.8 4.6 5.3 18 11
median 2.1 2.7 3.1 3.4 1.8 2.5 1.9 1.9 2.1 2.25 5.2 4.3
Chl a Middle Swan Estuary (Surface)
n 12 8 8 8 8 12 8 8 8 8 8 12
min 2.2 1.5 3.1 3.4 8.2 4.6 3.3 2.9 5.4 4.9 17 4.1
max 22.0 15.0 13.0 21.0 41.0 44.0 31.0 16.0 23.0 18 60 120
median 7.3 3.9 4.0 8.1 12.0 11.5 8.8 9.4 8.4 12 32 31
Chl a Middle Swan Estuary (Integrated)
n 20 16 20 16 16 20 16 16 20 16 15 20
min 1.1 1.4 1.4 1.3 2.2 3.3 3.0 2.8 4.3 3.3 7.2 2.1
max 8.2 4.2 19.0 18.0 12.0 18.0 22.0 9.6 11.0 14 48 58
median 2.4 2.4 4.0 3.1 6.1 7.6 5.7 6.5 6.2 6.95 11 19
Chl a Upper Swan Estuary (Surface)
n 12 8 8 8 8 12 8 8 8 8 8 12
min 1.0 2.8 5.7 1.5 3.9 3.8 9.8 6.8 15.0 4.1 3.5 2.1
max 94.0 31.0 23.0 29.0 34.0 50.0 25.0 21.0 290.0 35 26 59
median 14.0 16.0 11.2 11.4 15.5 15.0 17.5 14.5 22.5 18.5 11.9 14.5
Chl a Upper Swan Estuary (Integrated)
n 20 16 20 16 16 20 16 16 20 16 12 20
min <0.5 0.9 4.8 0.9 0.9 2.5 4.8 4.9 2.1 3.6 2.5 1.9
max 17.0 10 45 21.0 20.0 26.0 22.0 12.0 450.0 52 100 47
median 3.7 3.4 12.0 6.1 7.0 9.7 8.9 7.7 10.5 10.5 7.85 8.4
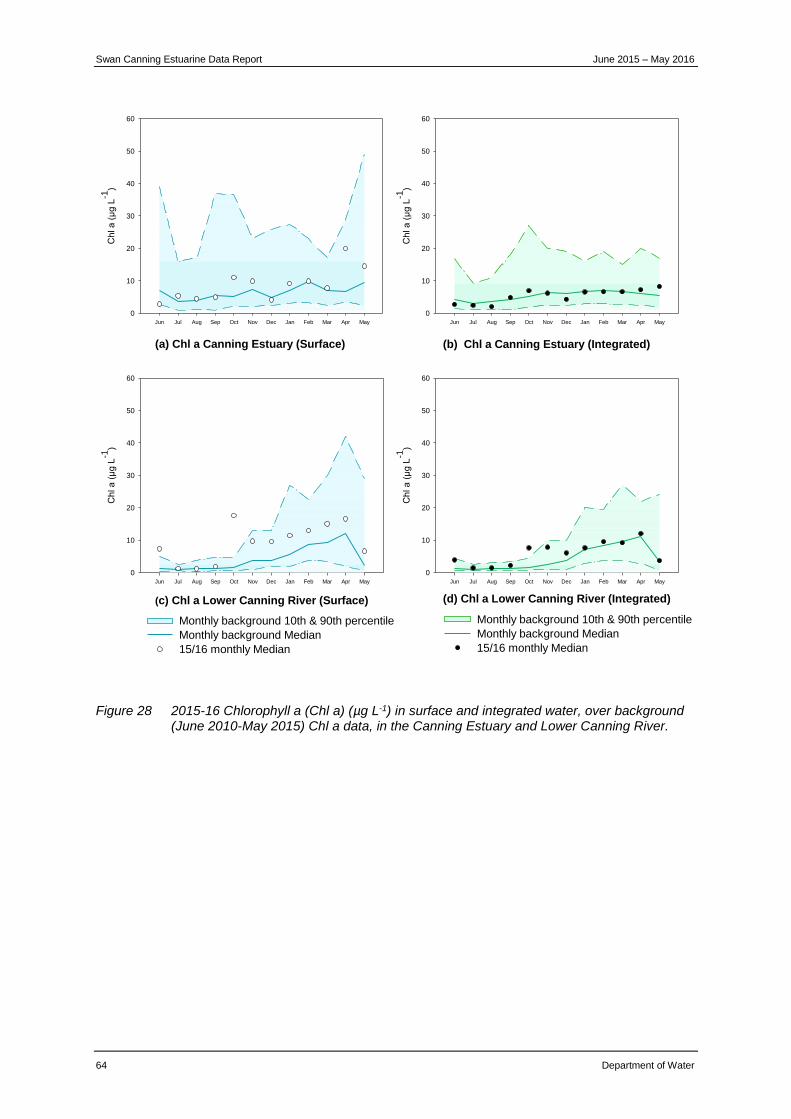
Swan Canning Estuarine Data Report June 2015 – May 2016
64 Department of Water
Figure 28 2015-16 Chlorophyll a (Chl a) (µg L-1) in surface and integrated water, over background (June 2010-May 2015) Chl a data, in the Canning Estuary and Lower Canning River.
(c) Chl a Lower Canning River (Surface)
Jun Jul Aug Sep Oct Nov Dec Jan Feb Mar Apr May
Ch
l a
(µ
g L
-1)
0
10
20
30
40
50
60
(d) Chl a Lower Canning River (Integrated)
Jun Jul Aug Sep Oct Nov Dec Jan Feb Mar Apr May
Ch
l a
(µ
g L
-1)
0
10
20
30
40
50
60
(a) Chl a Canning Estuary (Surface)
Jun Jul Aug Sep Oct Nov Dec Jan Feb Mar Apr May
Ch
l a
(µ
g L
-1)
0
10
20
30
40
50
60
Monthly background 10th & 90th percentile
Monthly background Median
15/16 monthly Median
(b) Chl a Canning Estuary (Integrated)
Jun Jul Aug Sep Oct Nov Dec Jan Feb Mar Apr May
Ch
l a
(µ
g L
-1)
0
10
20
30
40
50
60
Monthly background 10th & 90th percentile
Monthly background Median
15/16 monthly Median
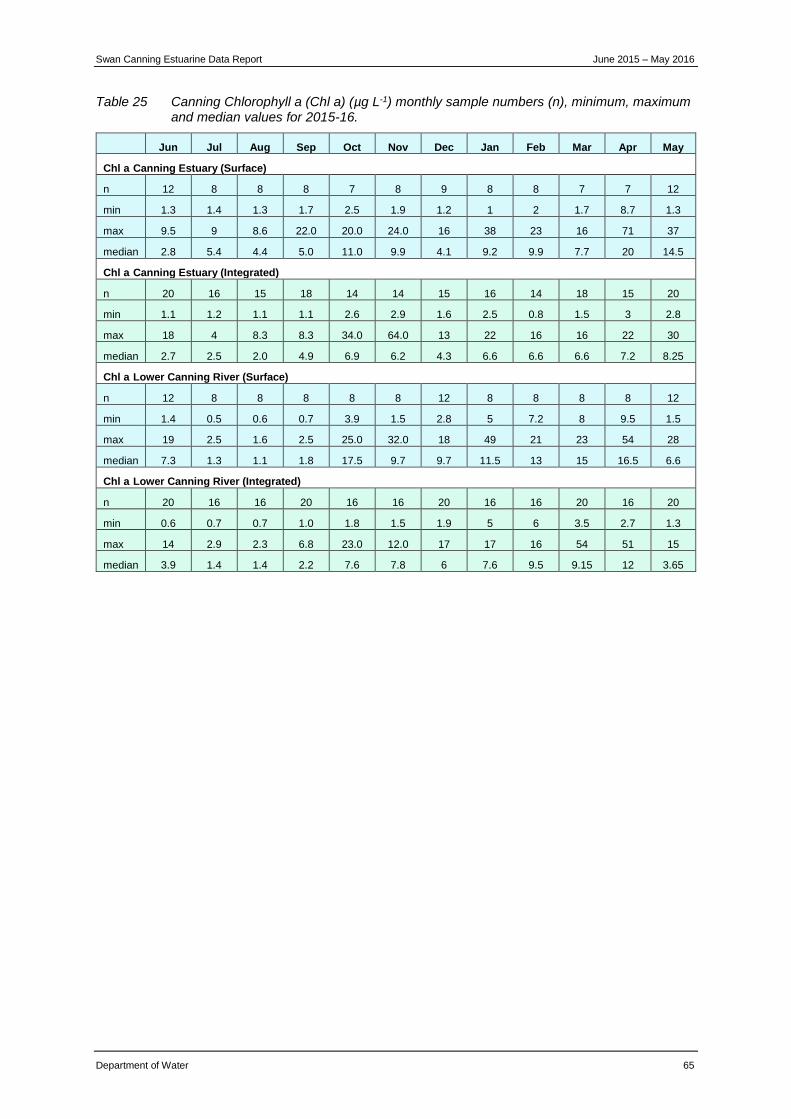
Swan Canning Estuarine Data Report June 2015 – May 2016
Department of Water 65
Table 25 Canning Chlorophyll a (Chl a) (µg L-1) monthly sample numbers (n), minimum, maximum and median values for 2015-16.
Jun Jul Aug Sep Oct Nov Dec Jan Feb Mar Apr May
Chl a Canning Estuary (Surface)
n 12 8 8 8 7 8 9 8 8 7 7 12
min 1.3 1.4 1.3 1.7 2.5 1.9 1.2 1 2 1.7 8.7 1.3
max 9.5 9 8.6 22.0 20.0 24.0 16 38 23 16 71 37
median 2.8 5.4 4.4 5.0 11.0 9.9 4.1 9.2 9.9 7.7 20 14.5
Chl a Canning Estuary (Integrated)
n 20 16 15 18 14 14 15 16 14 18 15 20
min 1.1 1.2 1.1 1.1 2.6 2.9 1.6 2.5 0.8 1.5 3 2.8
max 18 4 8.3 8.3 34.0 64.0 13 22 16 16 22 30
median 2.7 2.5 2.0 4.9 6.9 6.2 4.3 6.6 6.6 6.6 7.2 8.25
Chl a Lower Canning River (Surface)
n 12 8 8 8 8 8 12 8 8 8 8 12
min 1.4 0.5 0.6 0.7 3.9 1.5 2.8 5 7.2 8 9.5 1.5
max 19 2.5 1.6 2.5 25.0 32.0 18 49 21 23 54 28
median 7.3 1.3 1.1 1.8 17.5 9.7 9.7 11.5 13 15 16.5 6.6
Chl a Lower Canning River (Integrated)
n 20 16 16 20 16 16 20 16 16 20 16 20
min 0.6 0.7 0.7 1.0 1.8 1.5 1.9 5 6 3.5 2.7 1.3
max 14 2.9 2.3 6.8 23.0 12.0 17 17 16 54 51 15
median 3.9 1.4 1.4 2.2 7.6 7.8 6 7.6 9.5 9.15 12 3.65
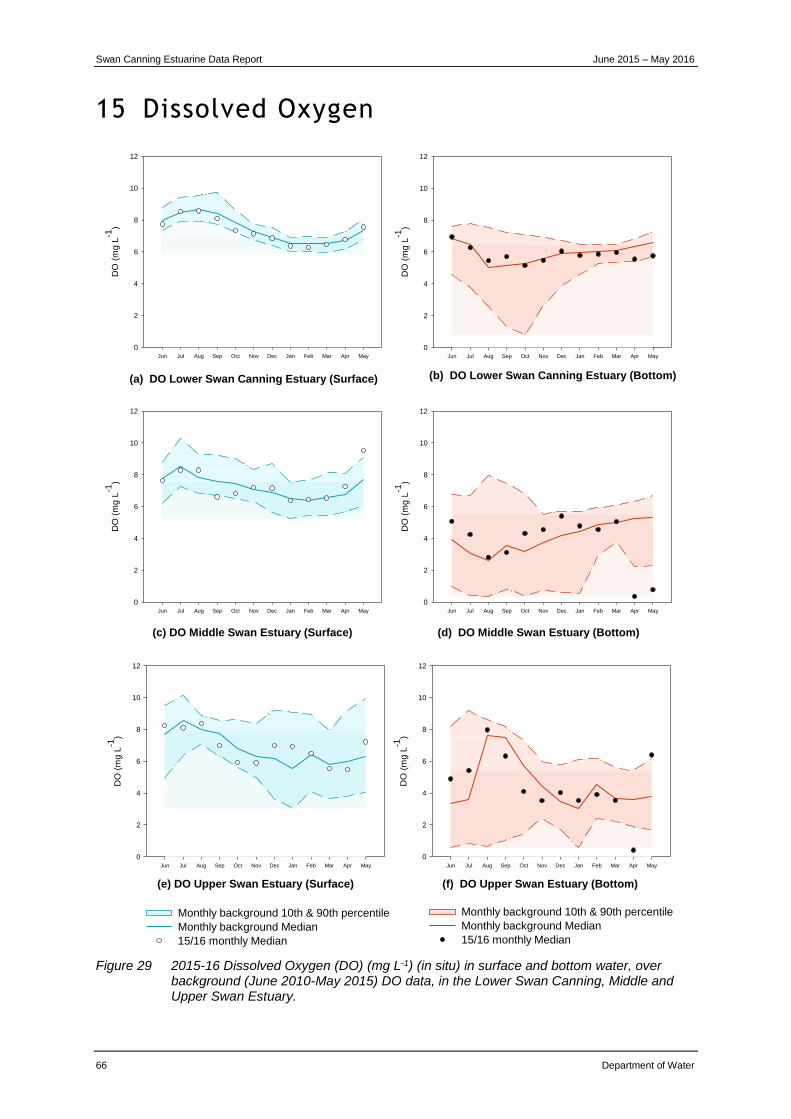
Swan Canning Estuarine Data Report June 2015 – May 2016
66 Department of Water
15 Dissolved Oxygen
Figure 29 2015-16 Dissolved Oxygen (DO) (mg L-1) (in situ) in surface and bottom water, over background (June 2010-May 2015) DO data, in the Lower Swan Canning, Middle and Upper Swan Estuary.
(e) DO Upper Swan Estuary (Surface)
Jun Jul Aug Sep Oct Nov Dec Jan Feb Mar Apr May
DO
(m
g L
-1)
0
2
4
6
8
10
12
(b) DO Lower Swan Canning Estuary (Bottom)
Jun Jul Aug Sep Oct Nov Dec Jan Feb Mar Apr May
DO
(m
g L
-1)
0
2
4
6
8
10
12
Monthly background 10th & 90th percentile
Monthly background Median
15/16 monthly Median
(c) DO Middle Swan Estuary (Surface)
Jun Jul Aug Sep Oct Nov Dec Jan Feb Mar Apr May
DO
(m
g L
-1)
0
2
4
6
8
10
12
(d) DO Middle Swan Estuary (Bottom)
Jun Jul Aug Sep Oct Nov Dec Jan Feb Mar Apr May
DO
(m
g L
-1)
0
2
4
6
8
10
12
(a) DO Lower Swan Canning Estuary (Surface)
Jun Jul Aug Sep Oct Nov Dec Jan Feb Mar Apr May
DO
(m
g L
-1)
0
2
4
6
8
10
12
Monthly background 10th & 90th percentile
Monthly background Median
15/16 monthly Median
(f) DO Upper Swan Estuary (Bottom)
Jun Jul Aug Sep Oct Nov Dec Jan Feb Mar Apr May
DO
(m
g L
-1)
0
2
4
6
8
10
12
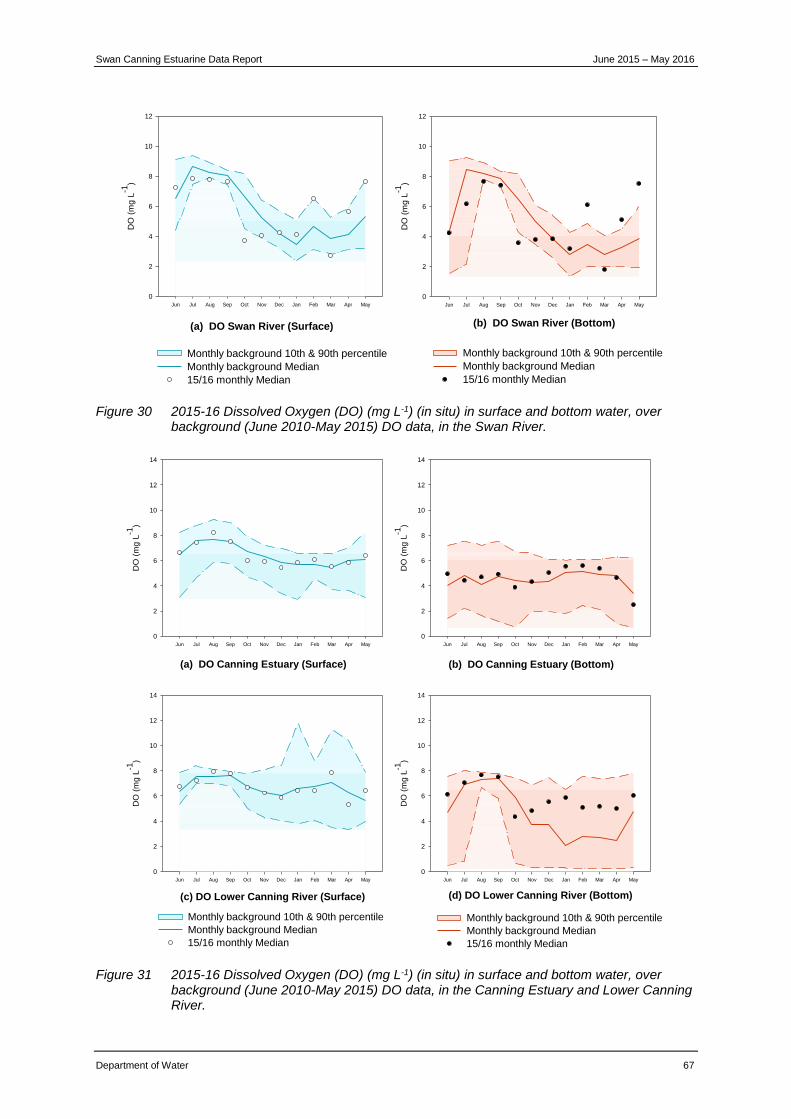
Swan Canning Estuarine Data Report June 2015 – May 2016
Department of Water 67
Figure 30 2015-16 Dissolved Oxygen (DO) (mg L-1) (in situ) in surface and bottom water, over background (June 2010-May 2015) DO data, in the Swan River.
Figure 31 2015-16 Dissolved Oxygen (DO) (mg L-1) (in situ) in surface and bottom water, over background (June 2010-May 2015) DO data, in the Canning Estuary and Lower Canning River.
(b) DO Swan River (Bottom)
Jun Jul Aug Sep Oct Nov Dec Jan Feb Mar Apr May
DO
(m
g L
-1)
0
2
4
6
8
10
12
Monthly background 10th & 90th percentile
Monthly background Median
15/16 monthly Median
(a) DO Swan River (Surface)
Jun Jul Aug Sep Oct Nov Dec Jan Feb Mar Apr May
DO
(m
g L
-1)
0
2
4
6
8
10
12
Monthly background 10th & 90th percentile
Monthly background Median
15/16 monthly Median
(c) DO Lower Canning River (Surface)
Jun Jul Aug Sep Oct Nov Dec Jan Feb Mar Apr May
DO
(m
g L
-1)
0
2
4
6
8
10
12
14
(d) DO Lower Canning River (Bottom)
Jun Jul Aug Sep Oct Nov Dec Jan Feb Mar Apr May
DO
(m
g L
-1)
0
2
4
6
8
10
12
14
(a) DO Canning Estuary (Surface)
Jun Jul Aug Sep Oct Nov Dec Jan Feb Mar Apr May
DO
(m
g L
-1)
0
2
4
6
8
10
12
14
Monthly background 10th & 90th percentile
Monthly background Median
15/16 monthly Median
(b) DO Canning Estuary (Bottom)
Jun Jul Aug Sep Oct Nov Dec Jan Feb Mar Apr May
DO
(m
g L
-1)
0
2
4
6
8
10
12
14
Monthly background 10th & 90th percentile
Monthly background Median
15/16 monthly Median
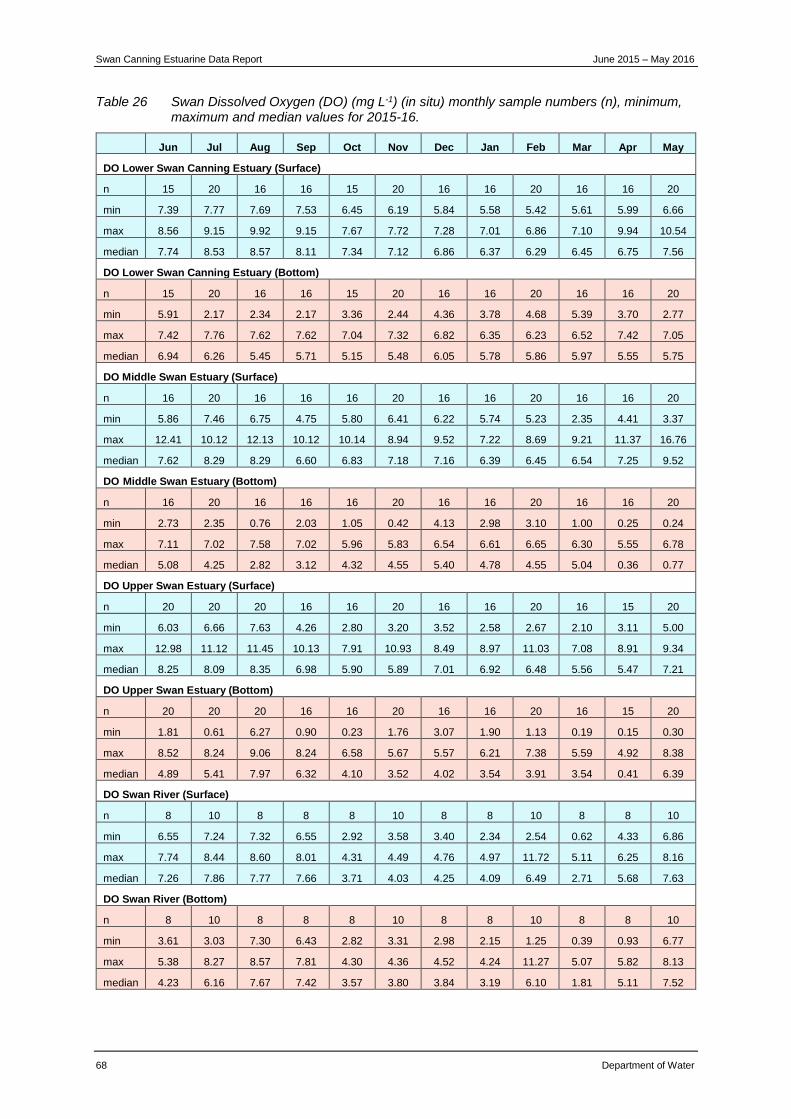
Swan Canning Estuarine Data Report June 2015 – May 2016
68 Department of Water
Table 26 Swan Dissolved Oxygen (DO) (mg L-1) (in situ) monthly sample numbers (n), minimum, maximum and median values for 2015-16.
Jun Jul Aug Sep Oct Nov Dec Jan Feb Mar Apr May
DO Lower Swan Canning Estuary (Surface)
n 15 20 16 16 15 20 16 16 20 16 16 20
min 7.39 7.77 7.69 7.53 6.45 6.19 5.84 5.58 5.42 5.61 5.99 6.66
max 8.56 9.15 9.92 9.15 7.67 7.72 7.28 7.01 6.86 7.10 9.94 10.54
median 7.74 8.53 8.57 8.11 7.34 7.12 6.86 6.37 6.29 6.45 6.75 7.56
DO Lower Swan Canning Estuary (Bottom)
n 15 20 16 16 15 20 16 16 20 16 16 20
min 5.91 2.17 2.34 2.17 3.36 2.44 4.36 3.78 4.68 5.39 3.70 2.77
max 7.42 7.76 7.62 7.62 7.04 7.32 6.82 6.35 6.23 6.52 7.42 7.05
median 6.94 6.26 5.45 5.71 5.15 5.48 6.05 5.78 5.86 5.97 5.55 5.75
DO Middle Swan Estuary (Surface)
n 16 20 16 16 16 20 16 16 20 16 16 20
min 5.86 7.46 6.75 4.75 5.80 6.41 6.22 5.74 5.23 2.35 4.41 3.37
max 12.41 10.12 12.13 10.12 10.14 8.94 9.52 7.22 8.69 9.21 11.37 16.76
median 7.62 8.29 8.29 6.60 6.83 7.18 7.16 6.39 6.45 6.54 7.25 9.52
DO Middle Swan Estuary (Bottom)
n 16 20 16 16 16 20 16 16 20 16 16 20
min 2.73 2.35 0.76 2.03 1.05 0.42 4.13 2.98 3.10 1.00 0.25 0.24
max 7.11 7.02 7.58 7.02 5.96 5.83 6.54 6.61 6.65 6.30 5.55 6.78
median 5.08 4.25 2.82 3.12 4.32 4.55 5.40 4.78 4.55 5.04 0.36 0.77
DO Upper Swan Estuary (Surface)
n 20 20 20 16 16 20 16 16 20 16 15 20
min 6.03 6.66 7.63 4.26 2.80 3.20 3.52 2.58 2.67 2.10 3.11 5.00
max 12.98 11.12 11.45 10.13 7.91 10.93 8.49 8.97 11.03 7.08 8.91 9.34
median 8.25 8.09 8.35 6.98 5.90 5.89 7.01 6.92 6.48 5.56 5.47 7.21
DO Upper Swan Estuary (Bottom)
n 20 20 20 16 16 20 16 16 20 16 15 20
min 1.81 0.61 6.27 0.90 0.23 1.76 3.07 1.90 1.13 0.19 0.15 0.30
max 8.52 8.24 9.06 8.24 6.58 5.67 5.57 6.21 7.38 5.59 4.92 8.38
median 4.89 5.41 7.97 6.32 4.10 3.52 4.02 3.54 3.91 3.54 0.41 6.39
DO Swan River (Surface)
n 8 10 8 8 8 10 8 8 10 8 8 10
min 6.55 7.24 7.32 6.55 2.92 3.58 3.40 2.34 2.54 0.62 4.33 6.86
max 7.74 8.44 8.60 8.01 4.31 4.49 4.76 4.97 11.72 5.11 6.25 8.16
median 7.26 7.86 7.77 7.66 3.71 4.03 4.25 4.09 6.49 2.71 5.68 7.63
DO Swan River (Bottom)
n 8 10 8 8 8 10 8 8 10 8 8 10
min 3.61 3.03 7.30 6.43 2.82 3.31 2.98 2.15 1.25 0.39 0.93 6.77
max 5.38 8.27 8.57 7.81 4.30 4.36 4.52 4.24 11.27 5.07 5.82 8.13
median 4.23 6.16 7.67 7.42 3.57 3.80 3.84 3.19 6.10 1.81 5.11 7.52
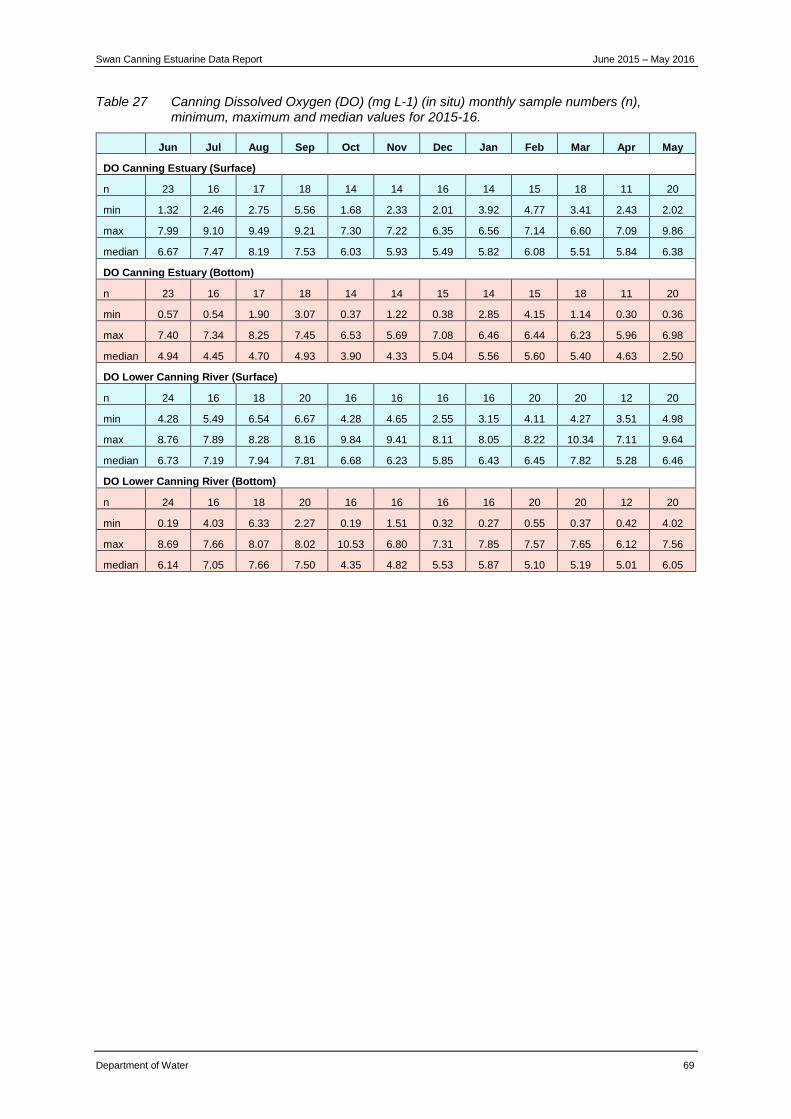
Swan Canning Estuarine Data Report June 2015 – May 2016
Department of Water 69
Table 27 Canning Dissolved Oxygen (DO) (mg L-1) (in situ) monthly sample numbers (n), minimum, maximum and median values for 2015-16.
Jun Jul Aug Sep Oct Nov Dec Jan Feb Mar Apr May
DO Canning Estuary (Surface)
n 23 16 17 18 14 14 16 14 15 18 11 20
min 1.32 2.46 2.75 5.56 1.68 2.33 2.01 3.92 4.77 3.41 2.43 2.02
max 7.99 9.10 9.49 9.21 7.30 7.22 6.35 6.56 7.14 6.60 7.09 9.86
median 6.67 7.47 8.19 7.53 6.03 5.93 5.49 5.82 6.08 5.51 5.84 6.38
DO Canning Estuary (Bottom)
n 23 16 17 18 14 14 15 14 15 18 11 20
min 0.57 0.54 1.90 3.07 0.37 1.22 0.38 2.85 4.15 1.14 0.30 0.36
max 7.40 7.34 8.25 7.45 6.53 5.69 7.08 6.46 6.44 6.23 5.96 6.98
median 4.94 4.45 4.70 4.93 3.90 4.33 5.04 5.56 5.60 5.40 4.63 2.50
DO Lower Canning River (Surface)
n 24 16 18 20 16 16 16 16 20 20 12 20
min 4.28 5.49 6.54 6.67 4.28 4.65 2.55 3.15 4.11 4.27 3.51 4.98
max 8.76 7.89 8.28 8.16 9.84 9.41 8.11 8.05 8.22 10.34 7.11 9.64
median 6.73 7.19 7.94 7.81 6.68 6.23 5.85 6.43 6.45 7.82 5.28 6.46
DO Lower Canning River (Bottom)
n 24 16 18 20 16 16 16 16 20 20 12 20
min 0.19 4.03 6.33 2.27 0.19 1.51 0.32 0.27 0.55 0.37 0.42 4.02
max 8.69 7.66 8.07 8.02 10.53 6.80 7.31 7.85 7.57 7.65 6.12 7.56
median 6.14 7.05 7.66 7.50 4.35 4.82 5.53 5.87 5.10 5.19 5.01 6.05
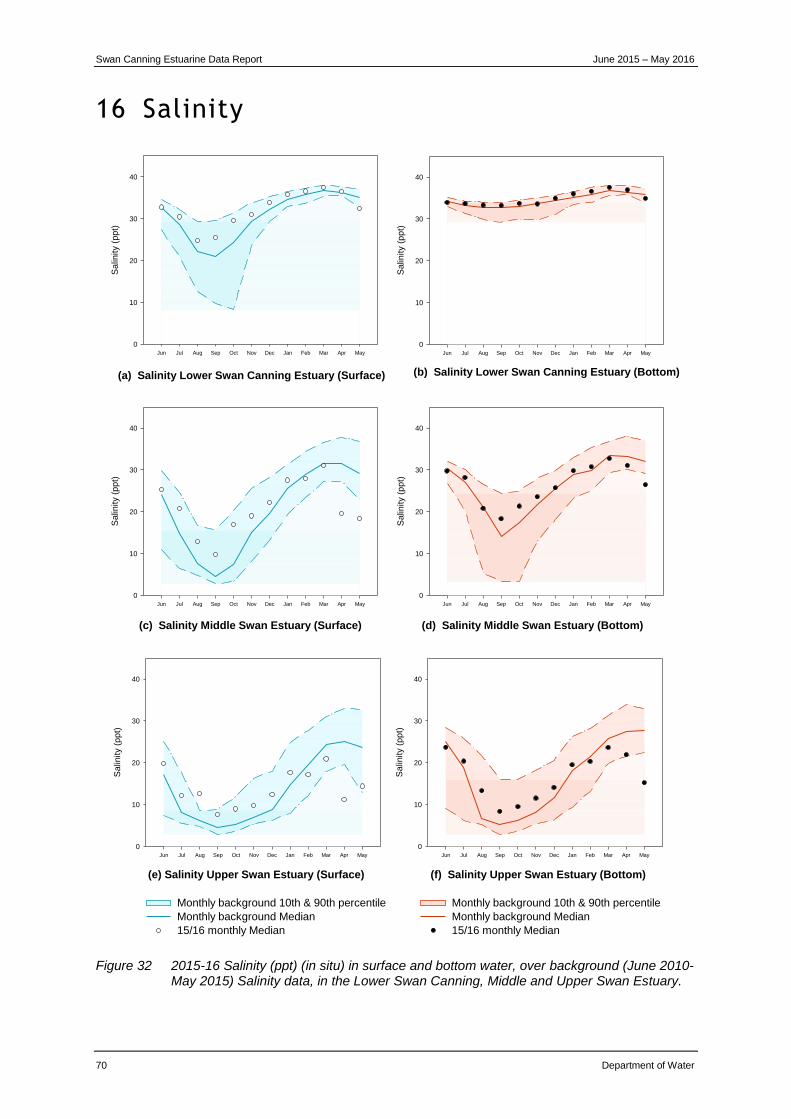
Swan Canning Estuarine Data Report June 2015 – May 2016
70 Department of Water
16 Salinity
Figure 32 2015-16 Salinity (ppt) (in situ) in surface and bottom water, over background (June 2010-May 2015) Salinity data, in the Lower Swan Canning, Middle and Upper Swan Estuary.
(e) Salinity Upper Swan Estuary (Surface)
Jun Jul Aug Sep Oct Nov Dec Jan Feb Mar Apr May
Sa
linity (
pp
t)
0
10
20
30
40
(b) Salinity Lower Swan Canning Estuary (Bottom)
Jun Jul Aug Sep Oct Nov Dec Jan Feb Mar Apr May
Sa
linity (
pp
t)
0
10
20
30
40
Monthly background 10th & 90th percentile
Monthly background Median
15/16 monthly Median
(c) Salinity Middle Swan Estuary (Surface)
Jun Jul Aug Sep Oct Nov Dec Jan Feb Mar Apr May
Sa
linity (
pp
t)
0
10
20
30
40
(d) Salinity Middle Swan Estuary (Bottom)
Jun Jul Aug Sep Oct Nov Dec Jan Feb Mar Apr May
Sa
linity (
pp
t)
0
10
20
30
40
(a) Salinity Lower Swan Canning Estuary (Surface)
Jun Jul Aug Sep Oct Nov Dec Jan Feb Mar Apr May
Sa
linity (
pp
t)
0
10
20
30
40
Monthly background 10th & 90th percentile
Monthly background Median
15/16 monthly Median
(f) Salinity Upper Swan Estuary (Bottom)
Jun Jul Aug Sep Oct Nov Dec Jan Feb Mar Apr May
Sa
linity (
pp
t)
0
10
20
30
40
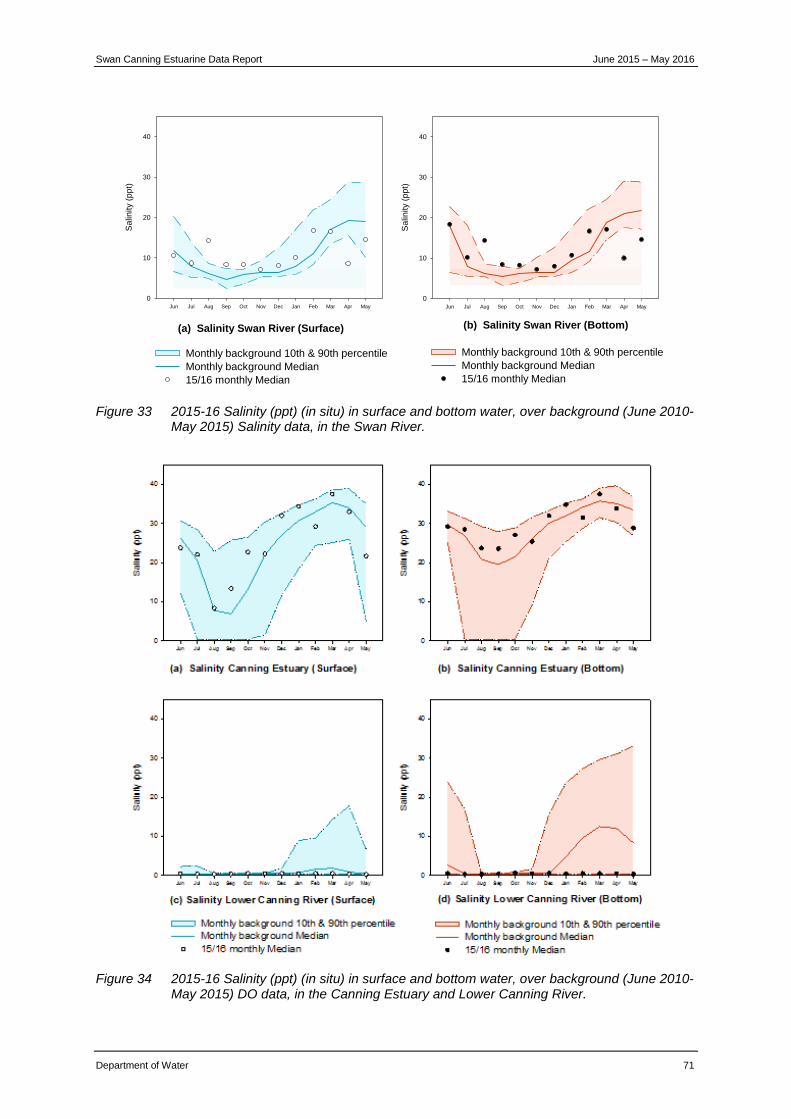
Swan Canning Estuarine Data Report June 2015 – May 2016
Department of Water 71
Figure 33 2015-16 Salinity (ppt) (in situ) in surface and bottom water, over background (June 2010-May 2015) Salinity data, in the Swan River.
Figure 34 2015-16 Salinity (ppt) (in situ) in surface and bottom water, over background (June 2010-May 2015) DO data, in the Canning Estuary and Lower Canning River.
(b) Salinity Swan River (Bottom)
Jun Jul Aug Sep Oct Nov Dec Jan Feb Mar Apr May
Sa
linity (
pp
t)
0
10
20
30
40
Monthly background 10th & 90th percentile
Monthly background Median
15/16 monthly Median
(a) Salinity Swan River (Surface)
Jun Jul Aug Sep Oct Nov Dec Jan Feb Mar Apr May
Sa
linity (
pp
t)
0
10
20
30
40
Monthly background 10th & 90th percentile
Monthly background Median
15/16 monthly Median
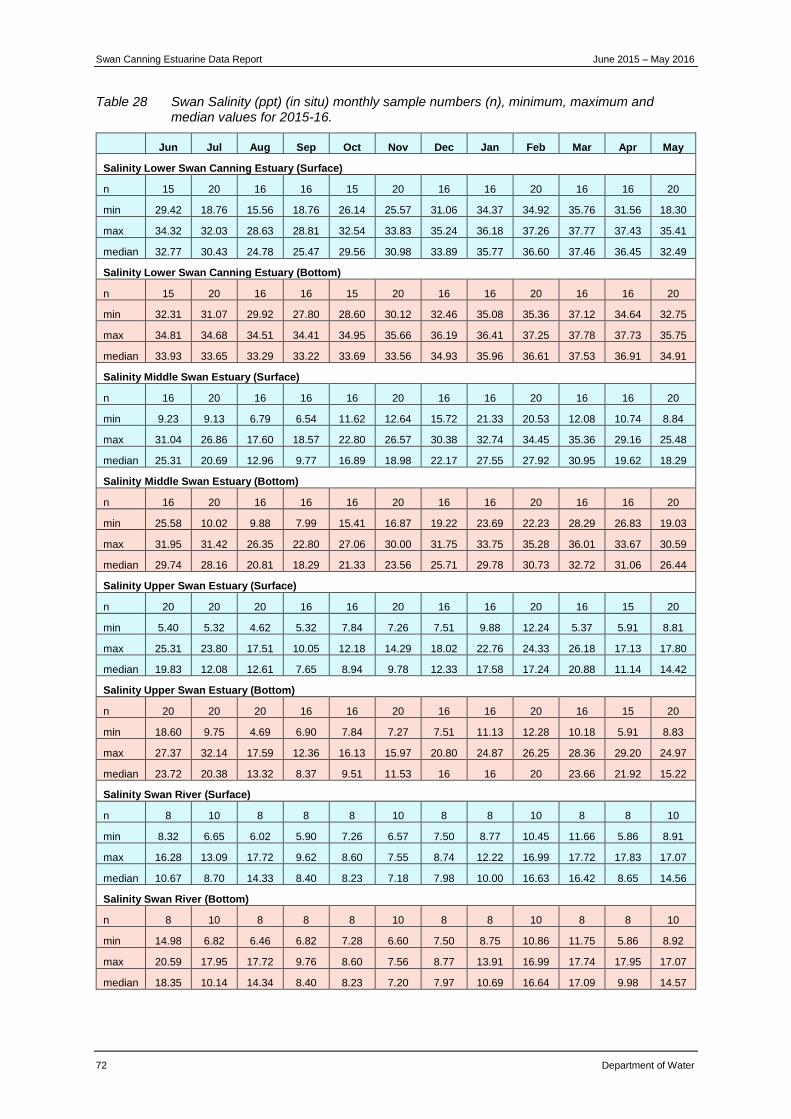
Swan Canning Estuarine Data Report June 2015 – May 2016
72 Department of Water
Table 28 Swan Salinity (ppt) (in situ) monthly sample numbers (n), minimum, maximum and median values for 2015-16.
Jun Jul Aug Sep Oct Nov Dec Jan Feb Mar Apr May
Salinity Lower Swan Canning Estuary (Surface)
n 15 20 16 16 15 20 16 16 20 16 16 20
min 29.42 18.76 15.56 18.76 26.14 25.57 31.06 34.37 34.92 35.76 31.56 18.30
max 34.32 32.03 28.63 28.81 32.54 33.83 35.24 36.18 37.26 37.77 37.43 35.41
median 32.77 30.43 24.78 25.47 29.56 30.98 33.89 35.77 36.60 37.46 36.45 32.49
Salinity Lower Swan Canning Estuary (Bottom)
n 15 20 16 16 15 20 16 16 20 16 16 20
min 32.31 31.07 29.92 27.80 28.60 30.12 32.46 35.08 35.36 37.12 34.64 32.75
max 34.81 34.68 34.51 34.41 34.95 35.66 36.19 36.41 37.25 37.78 37.73 35.75
median 33.93 33.65 33.29 33.22 33.69 33.56 34.93 35.96 36.61 37.53 36.91 34.91
Salinity Middle Swan Estuary (Surface)
n 16 20 16 16 16 20 16 16 20 16 16 20
min 9.23 9.13 6.79 6.54 11.62 12.64 15.72 21.33 20.53 12.08 10.74 8.84
max 31.04 26.86 17.60 18.57 22.80 26.57 30.38 32.74 34.45 35.36 29.16 25.48
median 25.31 20.69 12.96 9.77 16.89 18.98 22.17 27.55 27.92 30.95 19.62 18.29
Salinity Middle Swan Estuary (Bottom)
n 16 20 16 16 16 20 16 16 20 16 16 20
min 25.58 10.02 9.88 7.99 15.41 16.87 19.22 23.69 22.23 28.29 26.83 19.03
max 31.95 31.42 26.35 22.80 27.06 30.00 31.75 33.75 35.28 36.01 33.67 30.59
median 29.74 28.16 20.81 18.29 21.33 23.56 25.71 29.78 30.73 32.72 31.06 26.44
Salinity Upper Swan Estuary (Surface)
n 20 20 20 16 16 20 16 16 20 16 15 20
min 5.40 5.32 4.62 5.32 7.84 7.26 7.51 9.88 12.24 5.37 5.91 8.81
max 25.31 23.80 17.51 10.05 12.18 14.29 18.02 22.76 24.33 26.18 17.13 17.80
median 19.83 12.08 12.61 7.65 8.94 9.78 12.33 17.58 17.24 20.88 11.14 14.42
Salinity Upper Swan Estuary (Bottom)
n 20 20 20 16 16 20 16 16 20 16 15 20
min 18.60 9.75 4.69 6.90 7.84 7.27 7.51 11.13 12.28 10.18 5.91 8.83
max 27.37 32.14 17.59 12.36 16.13 15.97 20.80 24.87 26.25 28.36 29.20 24.97
median 23.72 20.38 13.32 8.37 9.51 11.53 16 16 20 23.66 21.92 15.22
Salinity Swan River (Surface)
n 8 10 8 8 8 10 8 8 10 8 8 10
min 8.32 6.65 6.02 5.90 7.26 6.57 7.50 8.77 10.45 11.66 5.86 8.91
max 16.28 13.09 17.72 9.62 8.60 7.55 8.74 12.22 16.99 17.72 17.83 17.07
median 10.67 8.70 14.33 8.40 8.23 7.18 7.98 10.00 16.63 16.42 8.65 14.56
Salinity Swan River (Bottom)
n 8 10 8 8 8 10 8 8 10 8 8 10
min 14.98 6.82 6.46 6.82 7.28 6.60 7.50 8.75 10.86 11.75 5.86 8.92
max 20.59 17.95 17.72 9.76 8.60 7.56 8.77 13.91 16.99 17.74 17.95 17.07
median 18.35 10.14 14.34 8.40 8.23 7.20 7.97 10.69 16.64 17.09 9.98 14.57
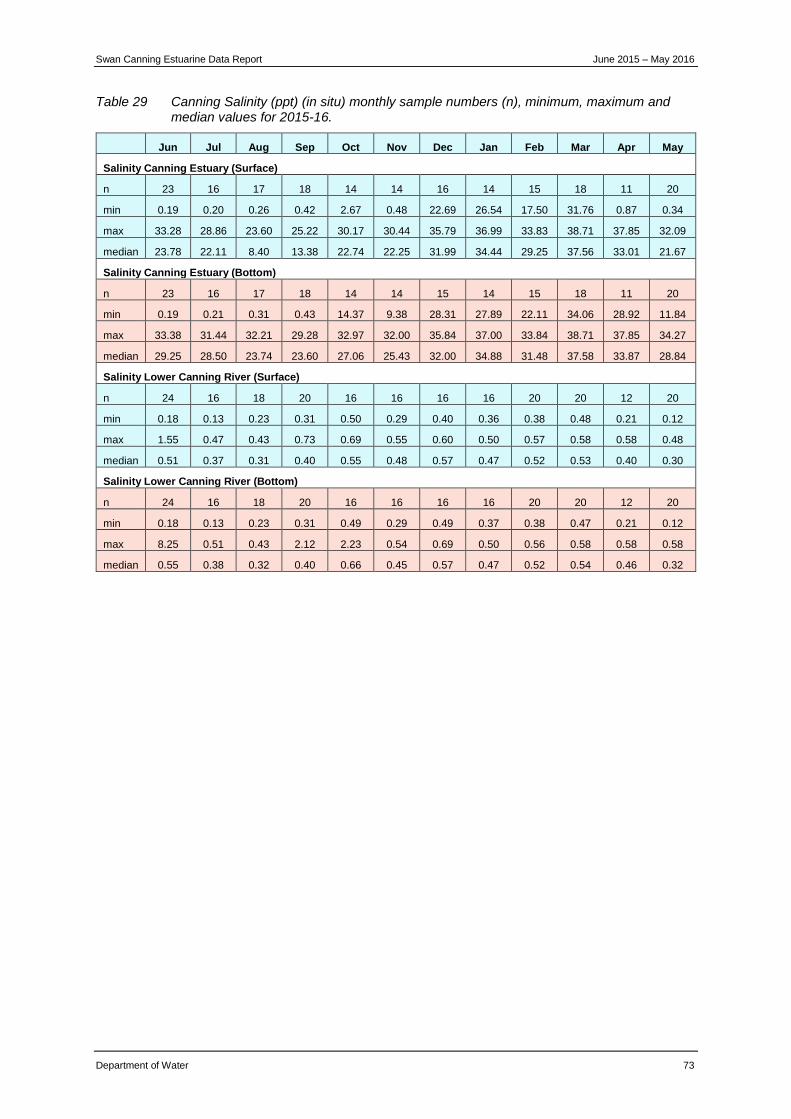
Swan Canning Estuarine Data Report June 2015 – May 2016
Department of Water 73
Table 29 Canning Salinity (ppt) (in situ) monthly sample numbers (n), minimum, maximum and median values for 2015-16.
Jun Jul Aug Sep Oct Nov Dec Jan Feb Mar Apr May
Salinity Canning Estuary (Surface)
n 23 16 17 18 14 14 16 14 15 18 11 20
min 0.19 0.20 0.26 0.42 2.67 0.48 22.69 26.54 17.50 31.76 0.87 0.34
max 33.28 28.86 23.60 25.22 30.17 30.44 35.79 36.99 33.83 38.71 37.85 32.09
median 23.78 22.11 8.40 13.38 22.74 22.25 31.99 34.44 29.25 37.56 33.01 21.67
Salinity Canning Estuary (Bottom)
n 23 16 17 18 14 14 15 14 15 18 11 20
min 0.19 0.21 0.31 0.43 14.37 9.38 28.31 27.89 22.11 34.06 28.92 11.84
max 33.38 31.44 32.21 29.28 32.97 32.00 35.84 37.00 33.84 38.71 37.85 34.27
median 29.25 28.50 23.74 23.60 27.06 25.43 32.00 34.88 31.48 37.58 33.87 28.84
Salinity Lower Canning River (Surface)
n 24 16 18 20 16 16 16 16 20 20 12 20
min 0.18 0.13 0.23 0.31 0.50 0.29 0.40 0.36 0.38 0.48 0.21 0.12
max 1.55 0.47 0.43 0.73 0.69 0.55 0.60 0.50 0.57 0.58 0.58 0.48
median 0.51 0.37 0.31 0.40 0.55 0.48 0.57 0.47 0.52 0.53 0.40 0.30
Salinity Lower Canning River (Bottom)
n 24 16 18 20 16 16 16 16 20 20 12 20
min 0.18 0.13 0.23 0.31 0.49 0.29 0.49 0.37 0.38 0.47 0.21 0.12
max 8.25 0.51 0.43 2.12 2.23 0.54 0.69 0.50 0.56 0.58 0.58 0.58
median 0.55 0.38 0.32 0.40 0.66 0.45 0.57 0.47 0.52 0.54 0.46 0.32
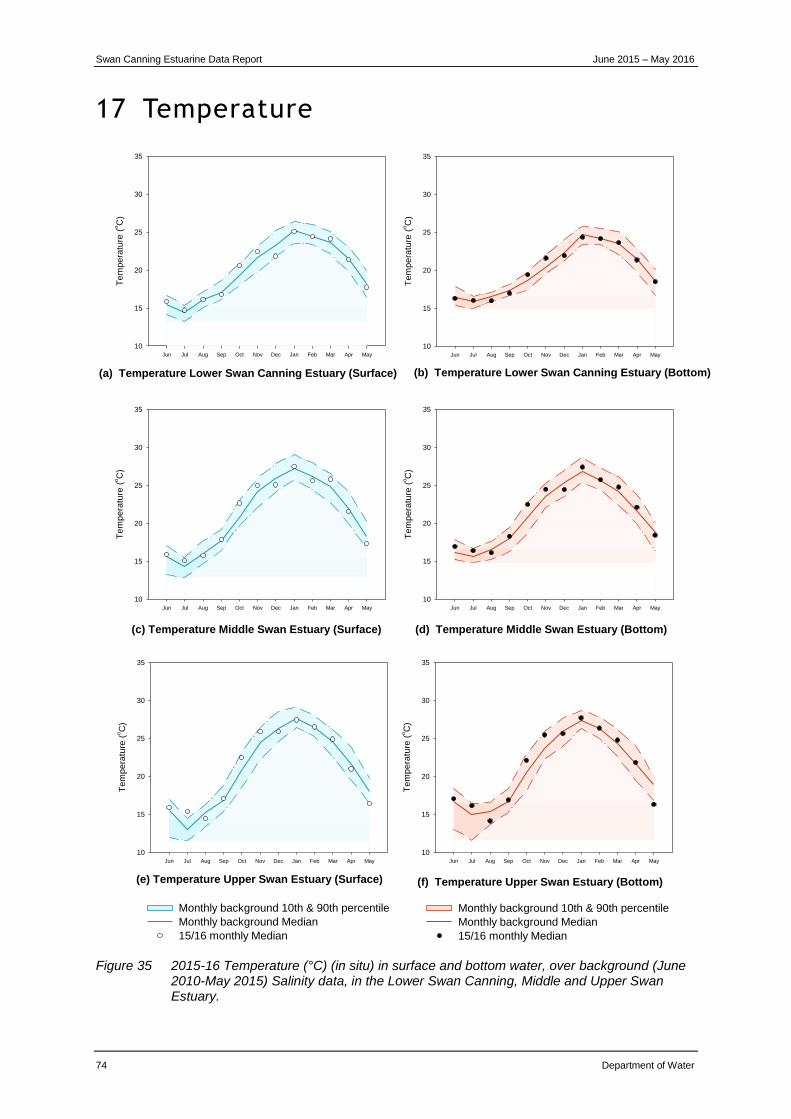
Swan Canning Estuarine Data Report June 2015 – May 2016
74 Department of Water
17 Temperature
Figure 35 2015-16 Temperature (°C) (in situ) in surface and bottom water, over background (June 2010-May 2015) Salinity data, in the Lower Swan Canning, Middle and Upper Swan Estuary.
(e) Temperature Upper Swan Estuary (Surface)
Jun Jul Aug Sep Oct Nov Dec Jan Feb Mar Apr May
Te
mpe
ratu
re (
oC
)
10
15
20
25
30
35
(b) Temperature Lower Swan Canning Estuary (Bottom)
Jun Jul Aug Sep Oct Nov Dec Jan Feb Mar Apr May
Te
mpe
ratu
re (
oC
)
10
15
20
25
30
35
Monthly background 10th & 90th percentile
Monthly background Median
15/16 monthly Median
(c) Temperature Middle Swan Estuary (Surface)
Jun Jul Aug Sep Oct Nov Dec Jan Feb Mar Apr May
Te
mpe
ratu
re (
oC
)
10
15
20
25
30
35
(d) Temperature Middle Swan Estuary (Bottom)
Jun Jul Aug Sep Oct Nov Dec Jan Feb Mar Apr May
Te
mpe
ratu
re (
oC
)
10
15
20
25
30
35
(a) Temperature Lower Swan Canning Estuary (Surface)
Jun Jul Aug Sep Oct Nov Dec Jan Feb Mar Apr May
Te
mpe
ratu
re (
oC
)
10
15
20
25
30
35
Monthly background 10th & 90th percentile
Monthly background Median
15/16 monthly Median
(f) Temperature Upper Swan Estuary (Bottom)
Jun Jul Aug Sep Oct Nov Dec Jan Feb Mar Apr May
Te
mpe
ratu
re (
oC
)
10
15
20
25
30
35

Swan Canning Estuarine Data Report June 2015 – May 2016
Department of Water 75
Figure 36 2015-16 Temperature (°C) (in situ) in surface and bottom water, over background (June 2010-May 2015) Salinity data, in the Swan River.
Figure 37 2015-16 Temperature (°C) (in situ) in surface and bottom water, over background (June 2010-May 2015) DO data, in the Canning Estuary and Lower Canning River.
(b) Temperature Swan River (Bottom)
Jun Jul Aug Sep Oct Nov Dec Jan Feb Mar Apr May
Te
mp
era
ture
(oC
)
10
15
20
25
30
35
Monthly background 10th & 90th percentile
Monthly background Median
15/16 monthly Median
(a) Temperature Swan River (Surface)
Jun Jul Aug Sep Oct Nov Dec Jan Feb Mar Apr May
Te
mp
era
ture
(oC
)
10
15
20
25
30
35
Monthly background 10th & 90th percentile
Monthly background Median
15/16 monthly Median
(c) Temperature Lower Canning River (Surface)
Jun Jul Aug Sep Oct Nov Dec Jan Feb Mar Apr May
Te
mp
era
ture
(oC
)
10
15
20
25
30
35
(d) Temperature Lower Canning River (Bottom)
Jun Jul Aug Sep Oct Nov Dec Jan Feb Mar Apr May
Te
mp
era
ture
(oC
)
10
15
20
25
30
35
(a) Temperature Canning Estuary (Surface)
Jun Jul Aug Sep Oct Nov Dec Jan Feb Mar Apr May
Te
mp
era
ture
(oC
)
10
15
20
25
30
35
Monthly background 10th & 90th percentile
Monthly background Median
15/16 monthly Median
(b) Temperature Canning Estuary (Bottom)
Jun Jul Aug Sep Oct Nov Dec Jan Feb Mar Apr May
Te
mp
era
ture
(oC
)
10
15
20
25
30
35
Monthly background 10th & 90th percentile
Monthly background Median
15/16 monthly Median
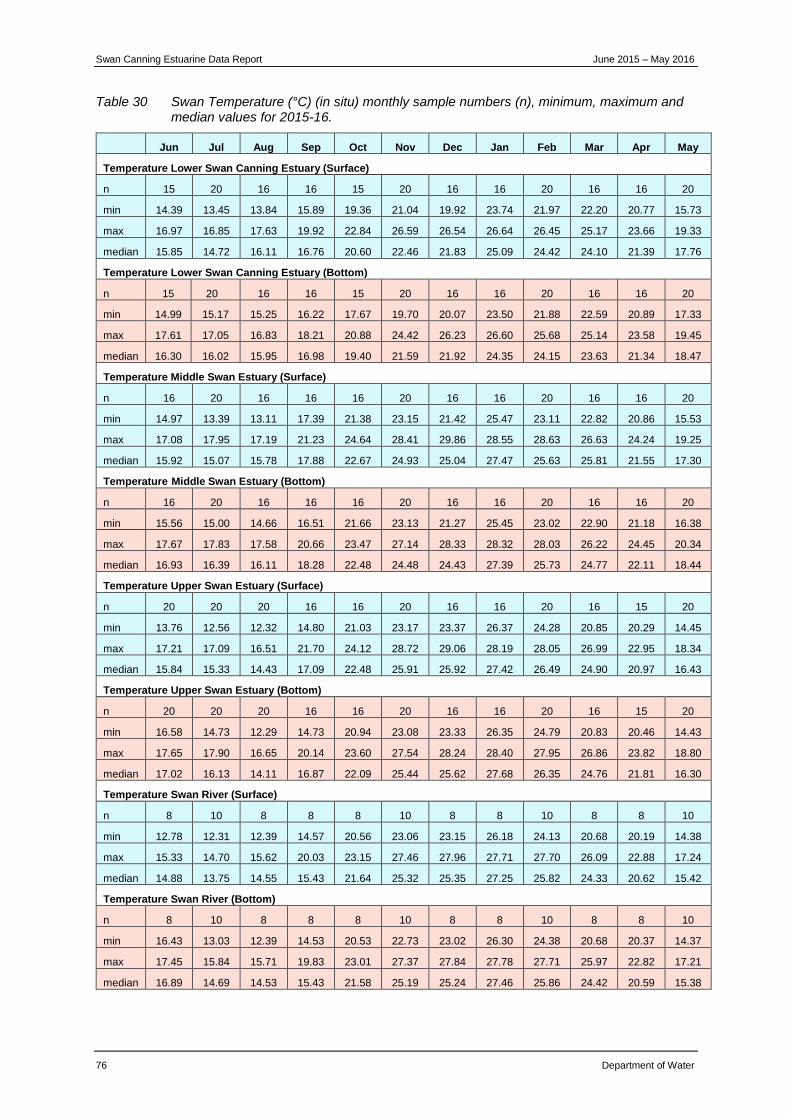
Swan Canning Estuarine Data Report June 2015 – May 2016
76 Department of Water
Table 30 Swan Temperature (°C) (in situ) monthly sample numbers (n), minimum, maximum and median values for 2015-16.
Jun Jul Aug Sep Oct Nov Dec Jan Feb Mar Apr May
Temperature Lower Swan Canning Estuary (Surface)
n 15 20 16 16 15 20 16 16 20 16 16 20
min 14.39 13.45 13.84 15.89 19.36 21.04 19.92 23.74 21.97 22.20 20.77 15.73
max 16.97 16.85 17.63 19.92 22.84 26.59 26.54 26.64 26.45 25.17 23.66 19.33
median 15.85 14.72 16.11 16.76 20.60 22.46 21.83 25.09 24.42 24.10 21.39 17.76
Temperature Lower Swan Canning Estuary (Bottom)
n 15 20 16 16 15 20 16 16 20 16 16 20
min 14.99 15.17 15.25 16.22 17.67 19.70 20.07 23.50 21.88 22.59 20.89 17.33
max 17.61 17.05 16.83 18.21 20.88 24.42 26.23 26.60 25.68 25.14 23.58 19.45
median 16.30 16.02 15.95 16.98 19.40 21.59 21.92 24.35 24.15 23.63 21.34 18.47
Temperature Middle Swan Estuary (Surface)
n 16 20 16 16 16 20 16 16 20 16 16 20
min 14.97 13.39 13.11 17.39 21.38 23.15 21.42 25.47 23.11 22.82 20.86 15.53
max 17.08 17.95 17.19 21.23 24.64 28.41 29.86 28.55 28.63 26.63 24.24 19.25
median 15.92 15.07 15.78 17.88 22.67 24.93 25.04 27.47 25.63 25.81 21.55 17.30
Temperature Middle Swan Estuary (Bottom)
n 16 20 16 16 16 20 16 16 20 16 16 20
min 15.56 15.00 14.66 16.51 21.66 23.13 21.27 25.45 23.02 22.90 21.18 16.38
max 17.67 17.83 17.58 20.66 23.47 27.14 28.33 28.32 28.03 26.22 24.45 20.34
median 16.93 16.39 16.11 18.28 22.48 24.48 24.43 27.39 25.73 24.77 22.11 18.44
Temperature Upper Swan Estuary (Surface)
n 20 20 20 16 16 20 16 16 20 16 15 20
min 13.76 12.56 12.32 14.80 21.03 23.17 23.37 26.37 24.28 20.85 20.29 14.45
max 17.21 17.09 16.51 21.70 24.12 28.72 29.06 28.19 28.05 26.99 22.95 18.34
median 15.84 15.33 14.43 17.09 22.48 25.91 25.92 27.42 26.49 24.90 20.97 16.43
Temperature Upper Swan Estuary (Bottom)
n 20 20 20 16 16 20 16 16 20 16 15 20
min 16.58 14.73 12.29 14.73 20.94 23.08 23.33 26.35 24.79 20.83 20.46 14.43
max 17.65 17.90 16.65 20.14 23.60 27.54 28.24 28.40 27.95 26.86 23.82 18.80
median 17.02 16.13 14.11 16.87 22.09 25.44 25.62 27.68 26.35 24.76 21.81 16.30
Temperature Swan River (Surface)
n 8 10 8 8 8 10 8 8 10 8 8 10
min 12.78 12.31 12.39 14.57 20.56 23.06 23.15 26.18 24.13 20.68 20.19 14.38
max 15.33 14.70 15.62 20.03 23.15 27.46 27.96 27.71 27.70 26.09 22.88 17.24
median 14.88 13.75 14.55 15.43 21.64 25.32 25.35 27.25 25.82 24.33 20.62 15.42
Temperature Swan River (Bottom)
n 8 10 8 8 8 10 8 8 10 8 8 10
min 16.43 13.03 12.39 14.53 20.53 22.73 23.02 26.30 24.38 20.68 20.37 14.37
max 17.45 15.84 15.71 19.83 23.01 27.37 27.84 27.78 27.71 25.97 22.82 17.21
median 16.89 14.69 14.53 15.43 21.58 25.19 25.24 27.46 25.86 24.42 20.59 15.38
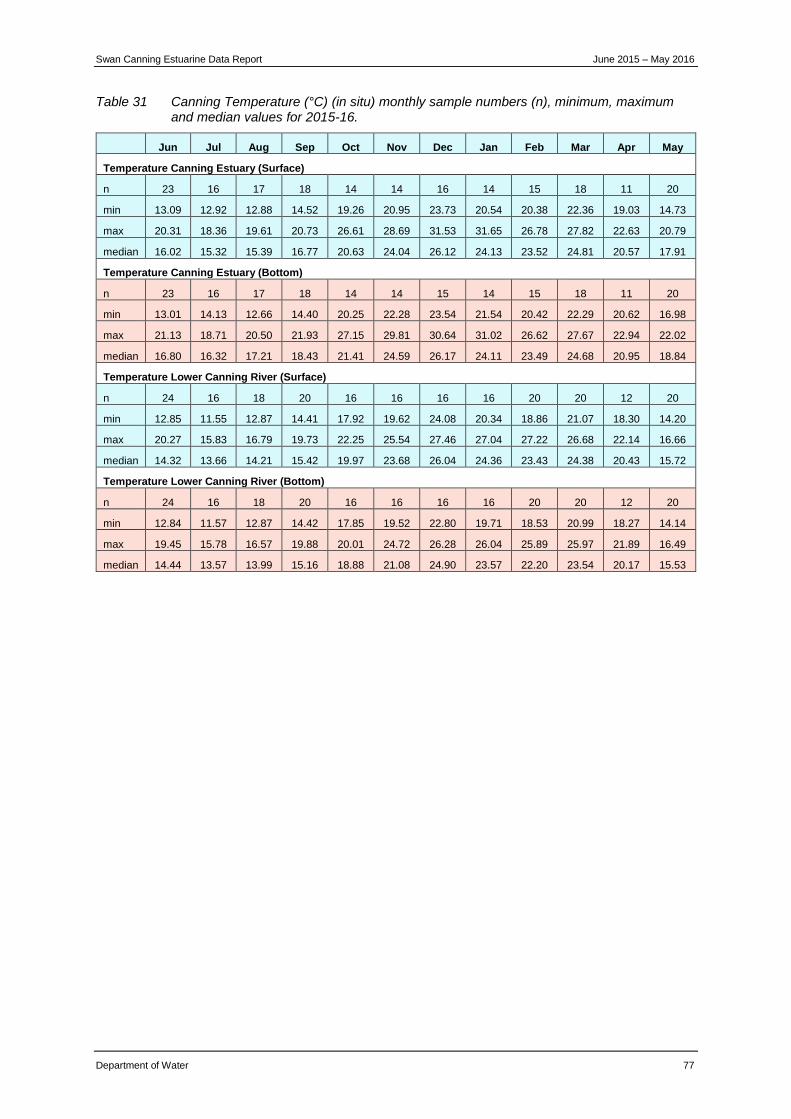
Swan Canning Estuarine Data Report June 2015 – May 2016
Department of Water 77
Table 31 Canning Temperature (°C) (in situ) monthly sample numbers (n), minimum, maximum and median values for 2015-16.
Jun Jul Aug Sep Oct Nov Dec Jan Feb Mar Apr May
Temperature Canning Estuary (Surface)
n 23 16 17 18 14 14 16 14 15 18 11 20
min 13.09 12.92 12.88 14.52 19.26 20.95 23.73 20.54 20.38 22.36 19.03 14.73
max 20.31 18.36 19.61 20.73 26.61 28.69 31.53 31.65 26.78 27.82 22.63 20.79
median 16.02 15.32 15.39 16.77 20.63 24.04 26.12 24.13 23.52 24.81 20.57 17.91
Temperature Canning Estuary (Bottom)
n 23 16 17 18 14 14 15 14 15 18 11 20
min 13.01 14.13 12.66 14.40 20.25 22.28 23.54 21.54 20.42 22.29 20.62 16.98
max 21.13 18.71 20.50 21.93 27.15 29.81 30.64 31.02 26.62 27.67 22.94 22.02
median 16.80 16.32 17.21 18.43 21.41 24.59 26.17 24.11 23.49 24.68 20.95 18.84
Temperature Lower Canning River (Surface)
n 24 16 18 20 16 16 16 16 20 20 12 20
min 12.85 11.55 12.87 14.41 17.92 19.62 24.08 20.34 18.86 21.07 18.30 14.20
max 20.27 15.83 16.79 19.73 22.25 25.54 27.46 27.04 27.22 26.68 22.14 16.66
median 14.32 13.66 14.21 15.42 19.97 23.68 26.04 24.36 23.43 24.38 20.43 15.72
Temperature Lower Canning River (Bottom)
n 24 16 18 20 16 16 16 16 20 20 12 20
min 12.84 11.57 12.87 14.42 17.85 19.52 22.80 19.71 18.53 20.99 18.27 14.14
max 19.45 15.78 16.57 19.88 20.01 24.72 26.28 26.04 25.89 25.97 21.89 16.49
median 14.44 13.57 13.99 15.16 18.88 21.08 24.90 23.57 22.20 23.54 20.17 15.53
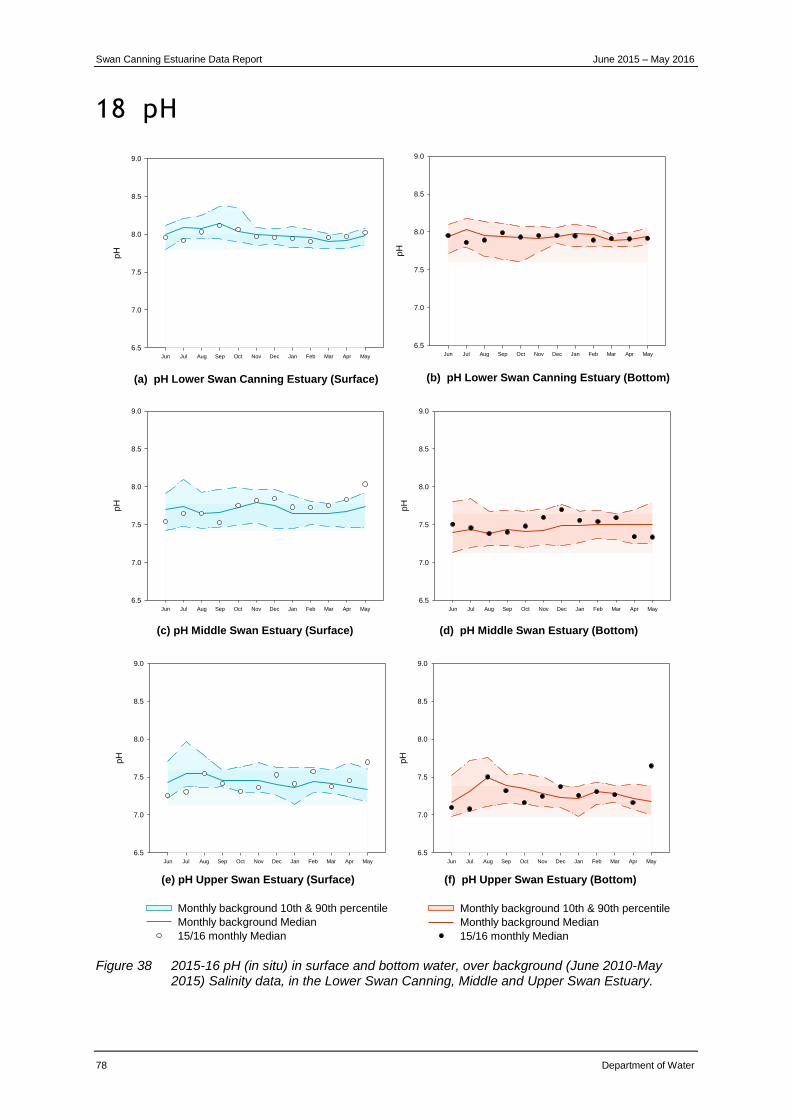
Swan Canning Estuarine Data Report June 2015 – May 2016
78 Department of Water
18 pH
Figure 38 2015-16 pH (in situ) in surface and bottom water, over background (June 2010-May 2015) Salinity data, in the Lower Swan Canning, Middle and Upper Swan Estuary.
(e) pH Upper Swan Estuary (Surface)
Jun Jul Aug Sep Oct Nov Dec Jan Feb Mar Apr May
pH
6.5
7.0
7.5
8.0
8.5
9.0
(b) pH Lower Swan Canning Estuary (Bottom)
Jun Jul Aug Sep Oct Nov Dec Jan Feb Mar Apr May
pH
6.5
7.0
7.5
8.0
8.5
9.0
Monthly background 10th & 90th percentile
Monthly background Median
15/16 monthly Median
(c) pH Middle Swan Estuary (Surface)
Jun Jul Aug Sep Oct Nov Dec Jan Feb Mar Apr May
pH
6.5
7.0
7.5
8.0
8.5
9.0
(d) pH Middle Swan Estuary (Bottom)
Jun Jul Aug Sep Oct Nov Dec Jan Feb Mar Apr May
pH
6.5
7.0
7.5
8.0
8.5
9.0
(a) pH Lower Swan Canning Estuary (Surface)
Jun Jul Aug Sep Oct Nov Dec Jan Feb Mar Apr May
pH
6.5
7.0
7.5
8.0
8.5
9.0
Monthly background 10th & 90th percentile
Monthly background Median
15/16 monthly Median
(f) pH Upper Swan Estuary (Bottom)
Jun Jul Aug Sep Oct Nov Dec Jan Feb Mar Apr May
pH
6.5
7.0
7.5
8.0
8.5
9.0
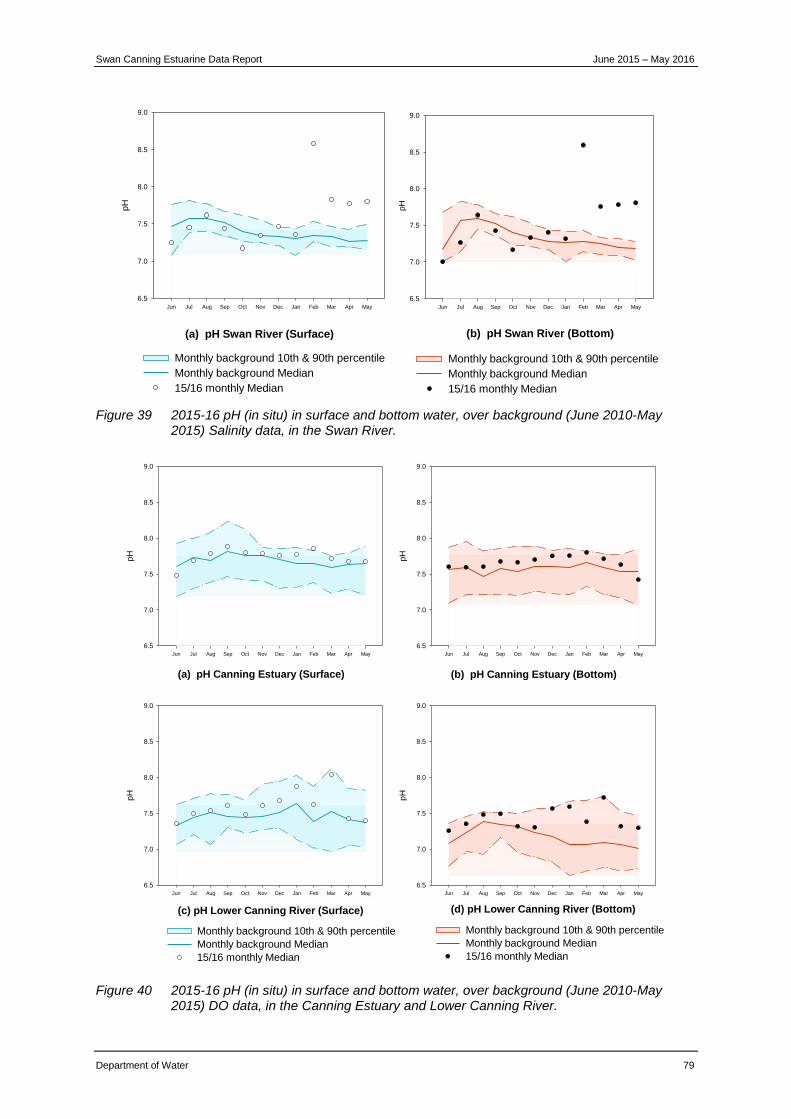
Swan Canning Estuarine Data Report June 2015 – May 2016
Department of Water 79
Figure 39 2015-16 pH (in situ) in surface and bottom water, over background (June 2010-May 2015) Salinity data, in the Swan River.
Figure 40 2015-16 pH (in situ) in surface and bottom water, over background (June 2010-May 2015) DO data, in the Canning Estuary and Lower Canning River.
(b) pH Swan River (Bottom)
Jun Jul Aug Sep Oct Nov Dec Jan Feb Mar Apr May
pH
6.5
7.0
7.5
8.0
8.5
9.0
Monthly background 10th & 90th percentile
Monthly background Median
15/16 monthly Median
(a) pH Swan River (Surface)
Jun Jul Aug Sep Oct Nov Dec Jan Feb Mar Apr May
pH
6.5
7.0
7.5
8.0
8.5
9.0
Monthly background 10th & 90th percentile
Monthly background Median
15/16 monthly Median
(c) pH Lower Canning River (Surface)
Jun Jul Aug Sep Oct Nov Dec Jan Feb Mar Apr May
pH
6.5
7.0
7.5
8.0
8.5
9.0
(d) pH Lower Canning River (Bottom)
Jun Jul Aug Sep Oct Nov Dec Jan Feb Mar Apr May
pH
6.5
7.0
7.5
8.0
8.5
9.0
(a) pH Canning Estuary (Surface)
Jun Jul Aug Sep Oct Nov Dec Jan Feb Mar Apr May
pH
6.5
7.0
7.5
8.0
8.5
9.0
Monthly background 10th & 90th percentile
Monthly background Median
15/16 monthly Median
(b) pH Canning Estuary (Bottom)
Jun Jul Aug Sep Oct Nov Dec Jan Feb Mar Apr May
pH
6.5
7.0
7.5
8.0
8.5
9.0
Monthly background 10th & 90th percentile
Monthly background Median
15/16 monthly Median

Swan Canning Estuarine Data Report June 2015 – May 2016
80 Department of Water
Table 32 Swan pH (in situ) monthly sample numbers (n), minimum, maximum and median values for 2015-16.
Jun Jul Aug Sep Oct Nov Dec Jan Feb Mar Apr May
pH Lower Swan Canning Estuary (Surface)
n 15 20 16 16 15 20 16 16 20 16 16 20
min 7.86 7.88 7.91 7.89 7.90 7.82 7.59 7.75 7.59 7.76 7.82 7.75
max 8.09 8.24 8.15 8.24 8.10 8.12 8.05 8.07 8.00 8.01 8.18 8.42
median 8.00 8.02 8.06 8.11 8.06 7.97 7.96 7.94 7.91 7.96 7.97 8.02
pH Lower Swan Canning Estuary (Bottom)
n 15 20 16 16 15 20 16 16 20 16 16 20
min 7.92 7.73 7.74 7.73 7.79 7.75 7.49 7.78 7.53 7.78 7.74 7.71
max 8.12 8.14 8.13 8.17 8.08 8.11 8.07 8.10 8.02 8.00 8.05 8.07
median 7.99 7.93 7.97 7.99 7.93 7.95 7.95 7.95 7.89 7.91 7.91 7.92
pH Middle Swan Estuary (Surface)
n 16 20 16 16 16 20 16 16 20 16 16 20
min 7.41 7.56 7.55 7.31 7.57 7.72 7.44 7.64 7.56 7.19 7.35 7.53
max 8.08 7.99 8.25 7.99 8.04 8.10 8.01 7.86 7.88 7.85 8.13 8.67
median 7.75 7.71 7.70 7.53 7.75 7.82 7.84 7.73 7.72 7.76 7.83 8.04
pH Middle Swan Estuary (Bottom)
n 16 20 16 16 16 20 16 16 20 16 16 20
min 7.37 7.32 7.25 7.21 7.19 7.29 7.40 7.46 7.30 7.14 7.17 7.26
max 7.86 7.79 7.77 7.75 7.84 7.81 7.81 7.73 7.78 7.78 7.91 7.88
median 7.61 7.55 7.42 7.40 7.48 7.60 7.70 7.56 7.54 7.59 7.34 7.34
pH Upper Swan Estuary (Surface)
n 20 20 20 16 16 20 16 16 20 16 15 20
min 7.12 7.19 7.40 7.23 7.12 7.18 7.36 7.29 7.23 7.21 7.17 7.45
max 8.04 7.87 8.23 7.87 7.57 7.98 7.71 7.58 8.70 8.03 8.10 8.03
median 7.36 7.40 7.61 7.42 7.31 7.36 7.53 7.41 7.57 7.38 7.45 7.70
pH Upper Swan Estuary (Bottom)
n 20 20 20 16 16 20 16 16 20 16 15 20
min 6.88 6.98 7.36 7.09 7.01 7.07 7.23 7.10 7.13 7.08 6.90 7.22
max 7.39 7.77 7.98 7.58 7.48 7.43 7.48 7.40 8.67 8.04 8.06 7.98
median 7.18 7.23 7.58 7.32 7.16 7.25 7.37 7.26 7.31 7.27 7.16 7.65
pH Swan River (Surface)
n 8 10 8 8 8 10 8 8 10 8 8 10
min 7.16 7.40 7.48 7.27 7.10 7.23 7.37 7.26 7.30 7.27 7.31 7.42
max 7.29 7.57 7.66 7.57 7.29 7.58 7.63 7.71 8.77 8.18 8.04 7.95
median 7.25 7.46 7.62 7.44 7.18 7.34 7.46 7.36 8.58 7.83 7.78 7.80
pH Swan River (Bottom)
n 8 10 8 8 8 10 8 8 10 8 8 10
min 6.88 7.02 7.50 7.29 7.10 7.24 7.35 7.18 7.12 7.26 7.14 7.51
max 7.05 7.54 7.67 7.54 7.28 7.43 7.52 7.61 8.67 8.23 8.00 7.95
median 7.00 7.27 7.64 7.43 7.17 7.33 7.41 7.32 8.60 7.76 7.78 7.81
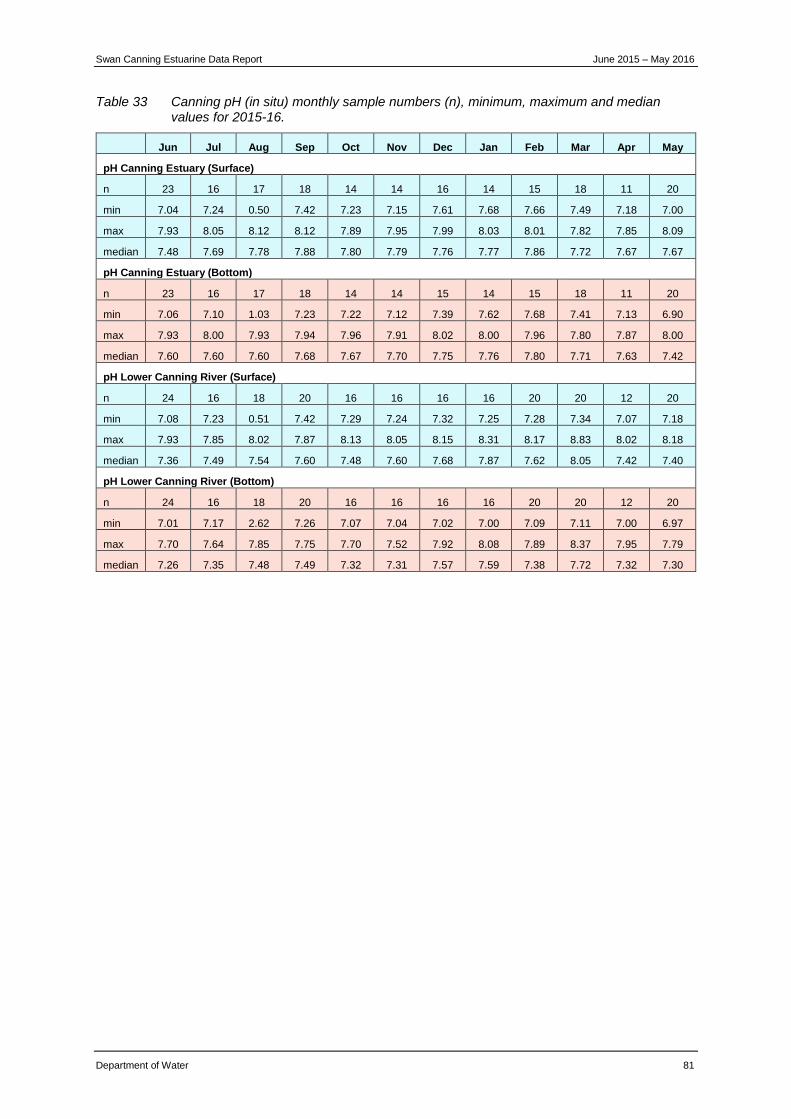
Swan Canning Estuarine Data Report June 2015 – May 2016
Department of Water 81
Table 33 Canning pH (in situ) monthly sample numbers (n), minimum, maximum and median values for 2015-16.
Jun Jul Aug Sep Oct Nov Dec Jan Feb Mar Apr May
pH Canning Estuary (Surface)
n 23 16 17 18 14 14 16 14 15 18 11 20
min 7.04 7.24 0.50 7.42 7.23 7.15 7.61 7.68 7.66 7.49 7.18 7.00
max 7.93 8.05 8.12 8.12 7.89 7.95 7.99 8.03 8.01 7.82 7.85 8.09
median 7.48 7.69 7.78 7.88 7.80 7.79 7.76 7.77 7.86 7.72 7.67 7.67
pH Canning Estuary (Bottom)
n 23 16 17 18 14 14 15 14 15 18 11 20
min 7.06 7.10 1.03 7.23 7.22 7.12 7.39 7.62 7.68 7.41 7.13 6.90
max 7.93 8.00 7.93 7.94 7.96 7.91 8.02 8.00 7.96 7.80 7.87 8.00
median 7.60 7.60 7.60 7.68 7.67 7.70 7.75 7.76 7.80 7.71 7.63 7.42
pH Lower Canning River (Surface)
n 24 16 18 20 16 16 16 16 20 20 12 20
min 7.08 7.23 0.51 7.42 7.29 7.24 7.32 7.25 7.28 7.34 7.07 7.18
max 7.93 7.85 8.02 7.87 8.13 8.05 8.15 8.31 8.17 8.83 8.02 8.18
median 7.36 7.49 7.54 7.60 7.48 7.60 7.68 7.87 7.62 8.05 7.42 7.40
pH Lower Canning River (Bottom)
n 24 16 18 20 16 16 16 16 20 20 12 20
min 7.01 7.17 2.62 7.26 7.07 7.04 7.02 7.00 7.09 7.11 7.00 6.97
max 7.70 7.64 7.85 7.75 7.70 7.52 7.92 8.08 7.89 8.37 7.95 7.79
median 7.26 7.35 7.48 7.49 7.32 7.31 7.57 7.59 7.38 7.72 7.32 7.30
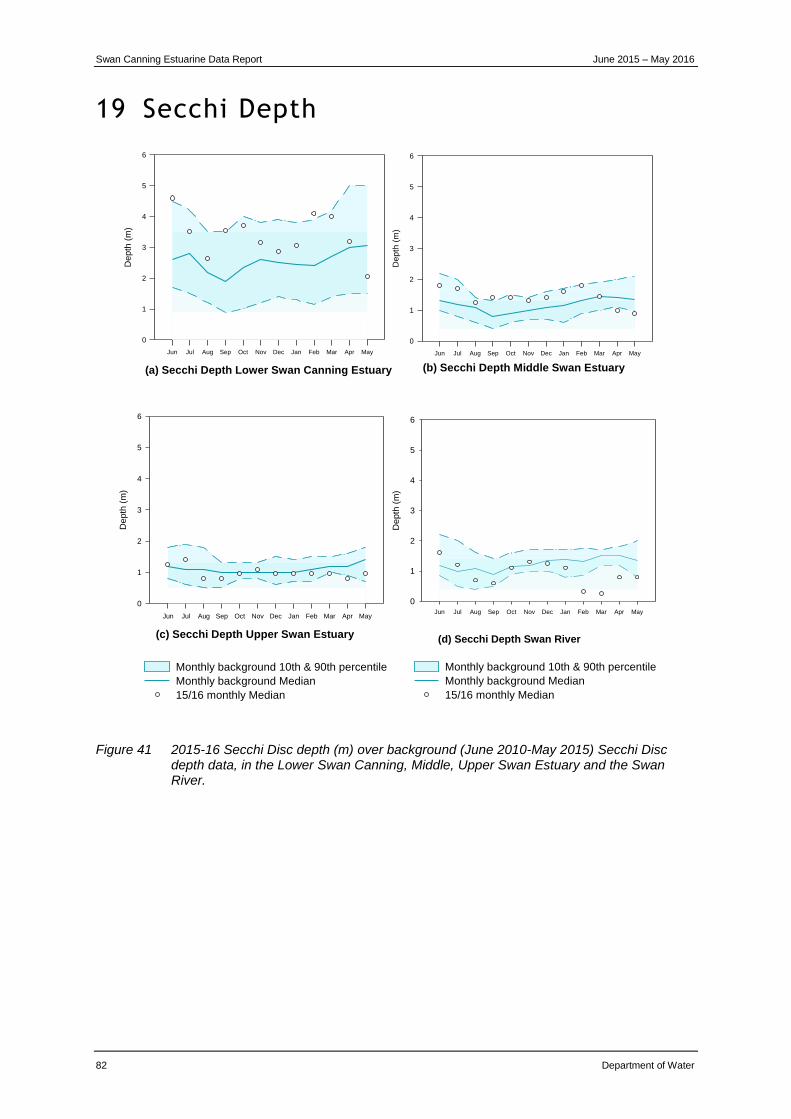
Swan Canning Estuarine Data Report June 2015 – May 2016
82 Department of Water
19 Secchi Depth
Figure 41 2015-16 Secchi Disc depth (m) over background (June 2010-May 2015) Secchi Disc depth data, in the Lower Swan Canning, Middle, Upper Swan Estuary and the Swan River.
(d) Secchi Depth Swan River
Jun Jul Aug Sep Oct Nov Dec Jan Feb Mar Apr May
Depth
(m
)
0
1
2
3
4
5
6
(a) Secchi Depth Lower Swan Canning Estuary
Jun Jul Aug Sep Oct Nov Dec Jan Feb Mar Apr May
Depth
(m
)
0
1
2
3
4
5
6
Monthly background 10th & 90th percentile
Monthly background Median
15/16 monthly Median
(c) Secchi Depth Upper Swan Estuary
Jun Jul Aug Sep Oct Nov Dec Jan Feb Mar Apr May
Depth
(m
)
0
1
2
3
4
5
6
(b) Secchi Depth Middle Swan Estuary
Jun Jul Aug Sep Oct Nov Dec Jan Feb Mar Apr May
De
pth
(m
)
0
1
2
3
4
5
6
Monthly background 10th & 90th percentile
Monthly background Median
15/16 monthly Median
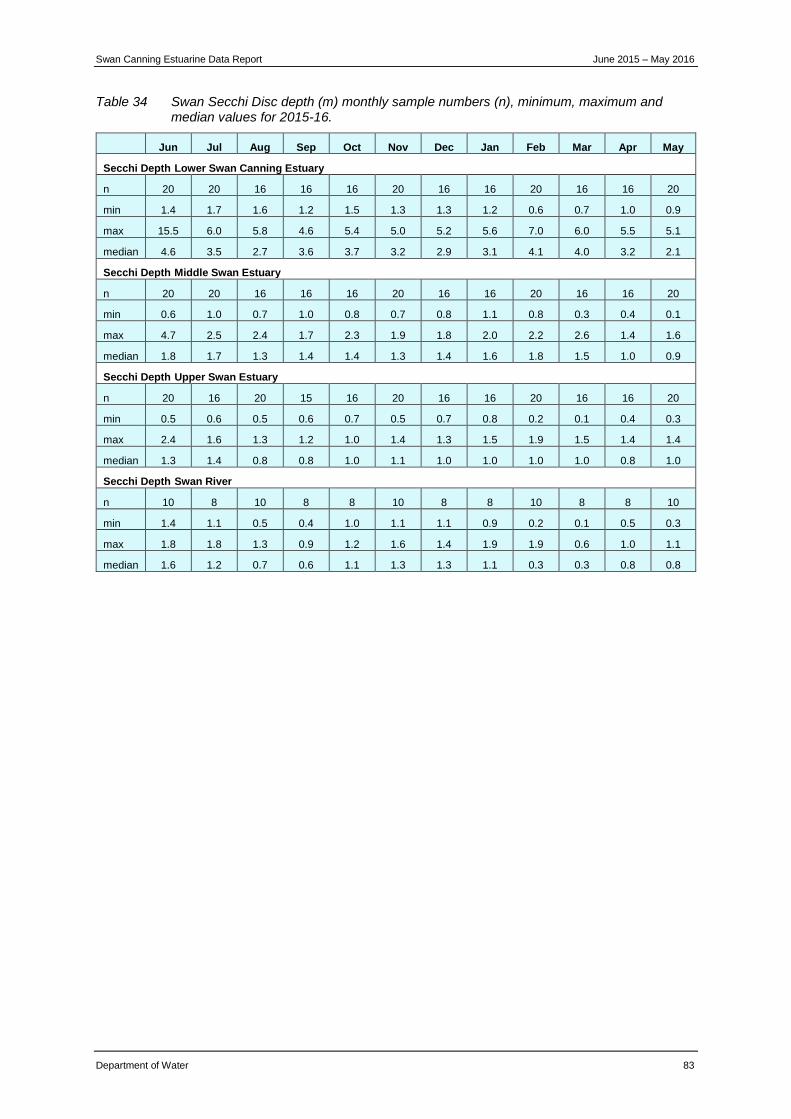
Swan Canning Estuarine Data Report June 2015 – May 2016
Department of Water 83
Table 34 Swan Secchi Disc depth (m) monthly sample numbers (n), minimum, maximum and median values for 2015-16.
Jun Jul Aug Sep Oct Nov Dec Jan Feb Mar Apr May
Secchi Depth Lower Swan Canning Estuary
n 20 20 16 16 16 20 16 16 20 16 16 20
min 1.4 1.7 1.6 1.2 1.5 1.3 1.3 1.2 0.6 0.7 1.0 0.9
max 15.5 6.0 5.8 4.6 5.4 5.0 5.2 5.6 7.0 6.0 5.5 5.1
median 4.6 3.5 2.7 3.6 3.7 3.2 2.9 3.1 4.1 4.0 3.2 2.1
Secchi Depth Middle Swan Estuary
n 20 20 16 16 16 20 16 16 20 16 16 20
min 0.6 1.0 0.7 1.0 0.8 0.7 0.8 1.1 0.8 0.3 0.4 0.1
max 4.7 2.5 2.4 1.7 2.3 1.9 1.8 2.0 2.2 2.6 1.4 1.6
median 1.8 1.7 1.3 1.4 1.4 1.3 1.4 1.6 1.8 1.5 1.0 0.9
Secchi Depth Upper Swan Estuary
n 20 16 20 15 16 20 16 16 20 16 16 20
min 0.5 0.6 0.5 0.6 0.7 0.5 0.7 0.8 0.2 0.1 0.4 0.3
max 2.4 1.6 1.3 1.2 1.0 1.4 1.3 1.5 1.9 1.5 1.4 1.4
median 1.3 1.4 0.8 0.8 1.0 1.1 1.0 1.0 1.0 1.0 0.8 1.0
Secchi Depth Swan River
n 10 8 10 8 8 10 8 8 10 8 8 10
min 1.4 1.1 0.5 0.4 1.0 1.1 1.1 0.9 0.2 0.1 0.5 0.3
max 1.8 1.8 1.3 0.9 1.2 1.6 1.4 1.9 1.9 0.6 1.0 1.1
median 1.6 1.2 0.7 0.6 1.1 1.3 1.3 1.1 0.3 0.3 0.8 0.8
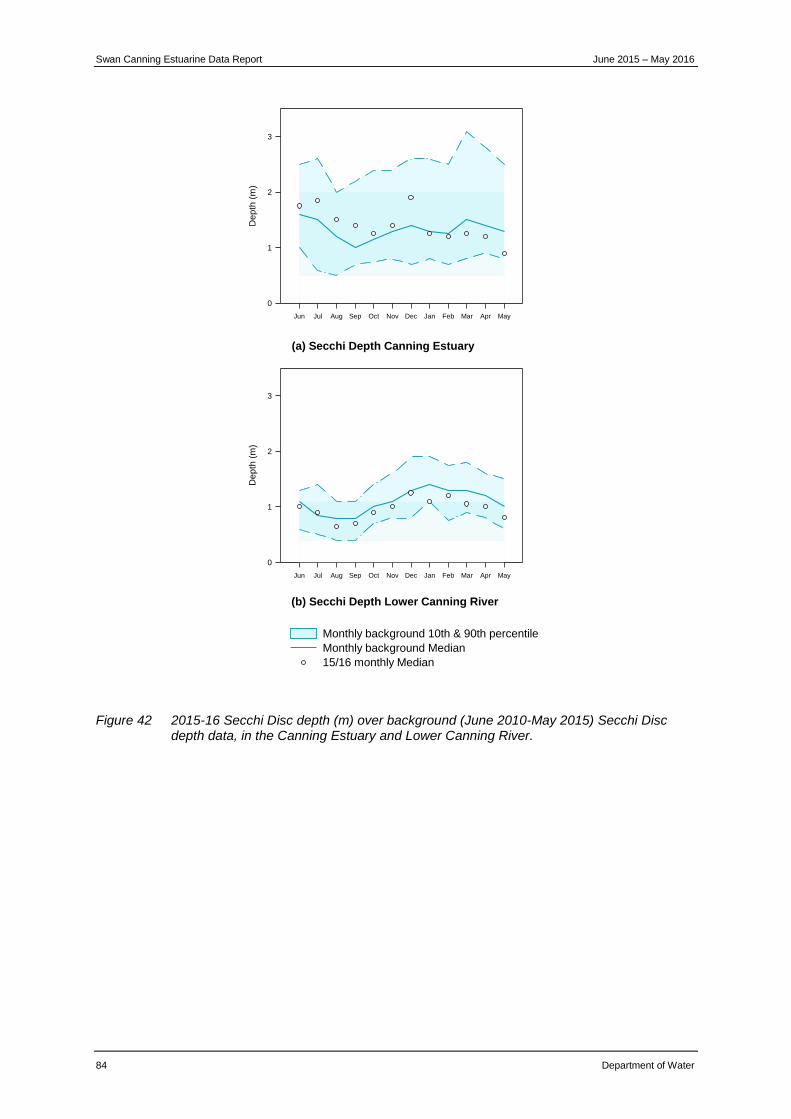
Swan Canning Estuarine Data Report June 2015 – May 2016
84 Department of Water
Figure 42 2015-16 Secchi Disc depth (m) over background (June 2010-May 2015) Secchi Disc depth data, in the Canning Estuary and Lower Canning River.
(a) Secchi Depth Canning Estuary
Jun Jul Aug Sep Oct Nov Dec Jan Feb Mar Apr May
De
pth
(m
)
0
1
2
3
Monthly background 10th & 90th percentile
Monthly background Median
15/16 monthly Median
(b) Secchi Depth Lower Canning River
Jun Jul Aug Sep Oct Nov Dec Jan Feb Mar Apr May
De
pth
(m
)
0
1
2
3
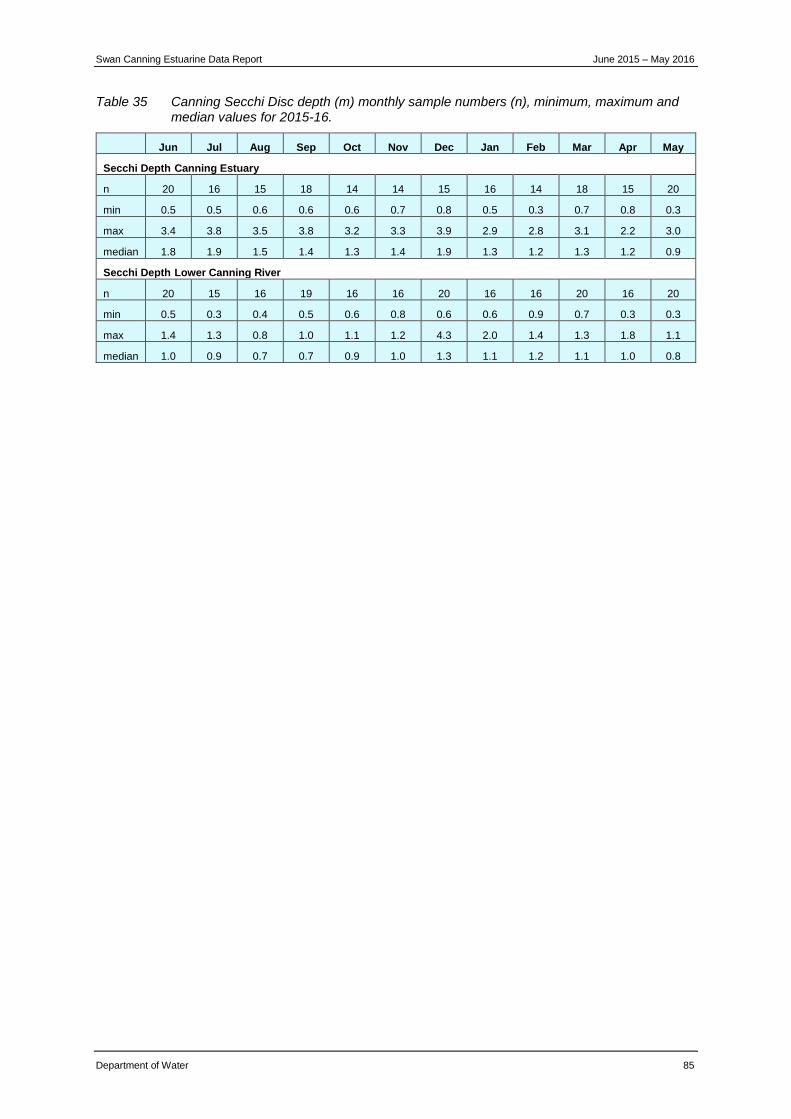
Swan Canning Estuarine Data Report June 2015 – May 2016
Department of Water 85
Table 35 Canning Secchi Disc depth (m) monthly sample numbers (n), minimum, maximum and median values for 2015-16.
Jun Jul Aug Sep Oct Nov Dec Jan Feb Mar Apr May
Secchi Depth Canning Estuary
n 20 16 15 18 14 14 15 16 14 18 15 20
min 0.5 0.5 0.6 0.6 0.6 0.7 0.8 0.5 0.3 0.7 0.8 0.3
max 3.4 3.8 3.5 3.8 3.2 3.3 3.9 2.9 2.8 3.1 2.2 3.0
median 1.8 1.9 1.5 1.4 1.3 1.4 1.9 1.3 1.2 1.3 1.2 0.9
Secchi Depth Lower Canning River
n 20 15 16 19 16 16 20 16 16 20 16 20
min 0.5 0.3 0.4 0.5 0.6 0.8 0.6 0.6 0.9 0.7 0.3 0.3
max 1.4 1.3 0.8 1.0 1.1 1.2 4.3 2.0 1.4 1.3 1.8 1.1
median 1.0 0.9 0.7 0.7 0.9 1.0 1.3 1.1 1.2 1.1 1.0 0.8
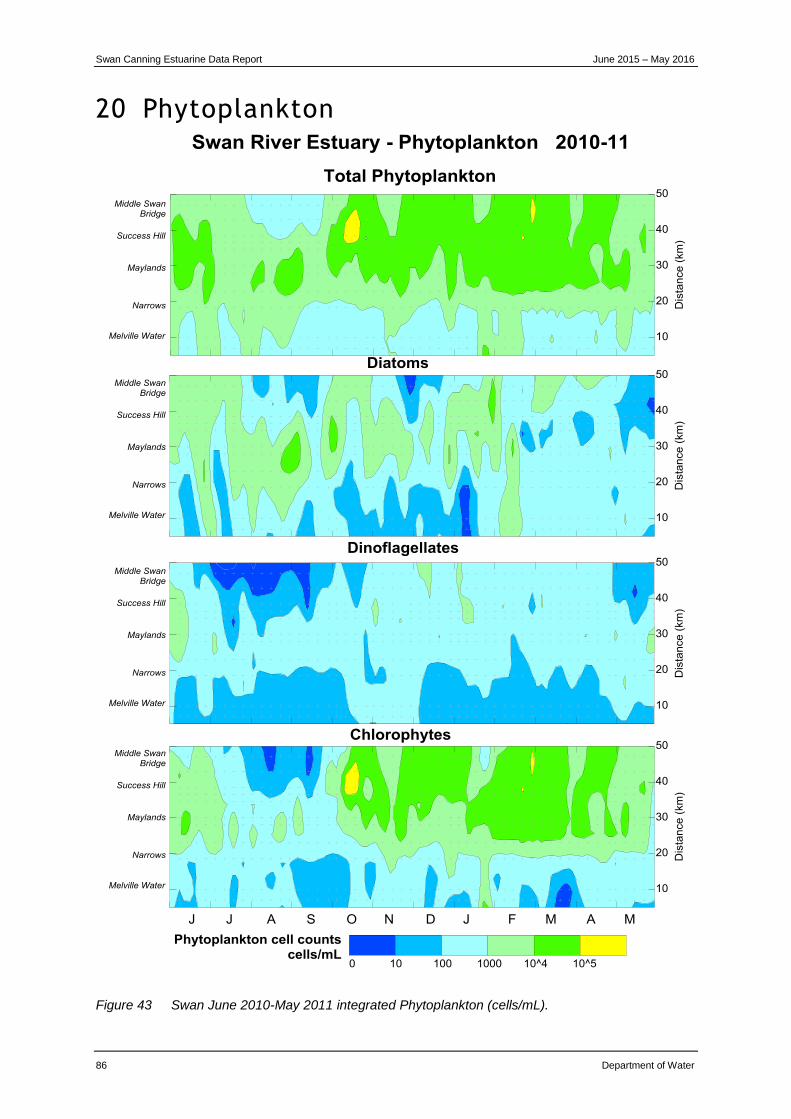
Swan Canning Estuarine Data Report June 2015 – May 2016
86 Department of Water
20 Phytoplankton
Figure 43 Swan June 2010-May 2011 integrated Phytoplankton (cells/mL).
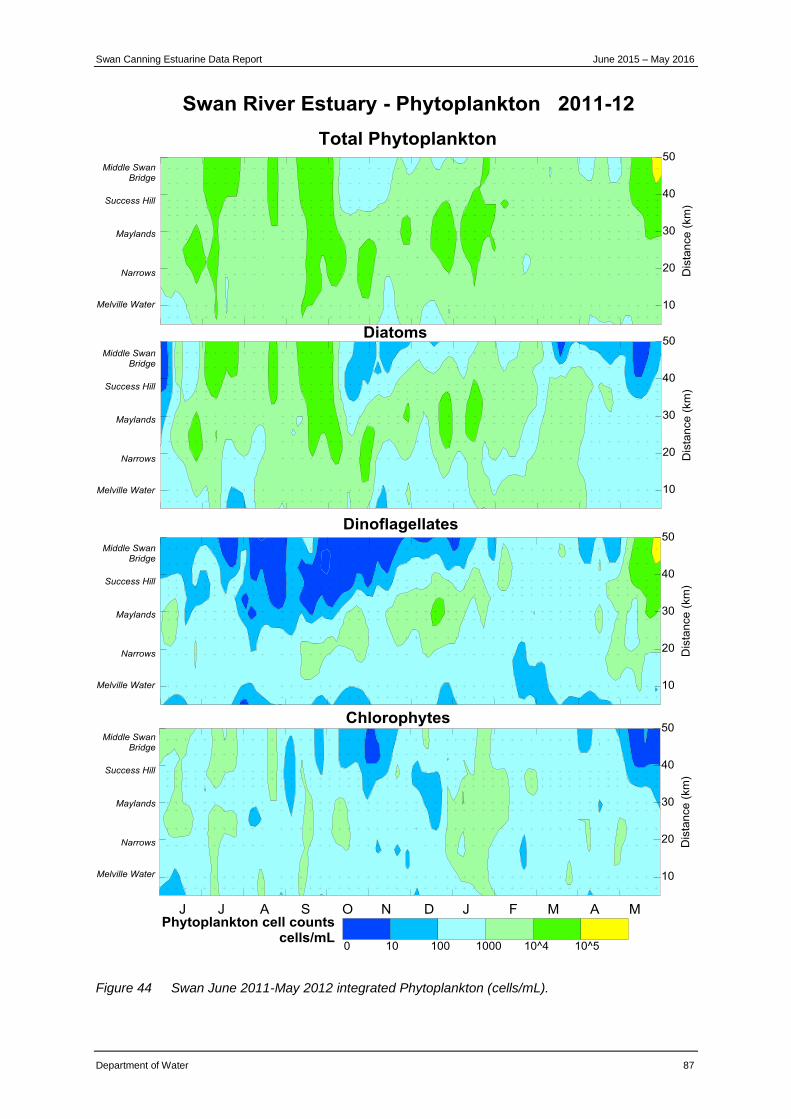
Swan Canning Estuarine Data Report June 2015 – May 2016
Department of Water 87
Figure 44 Swan June 2011-May 2012 integrated Phytoplankton (cells/mL).
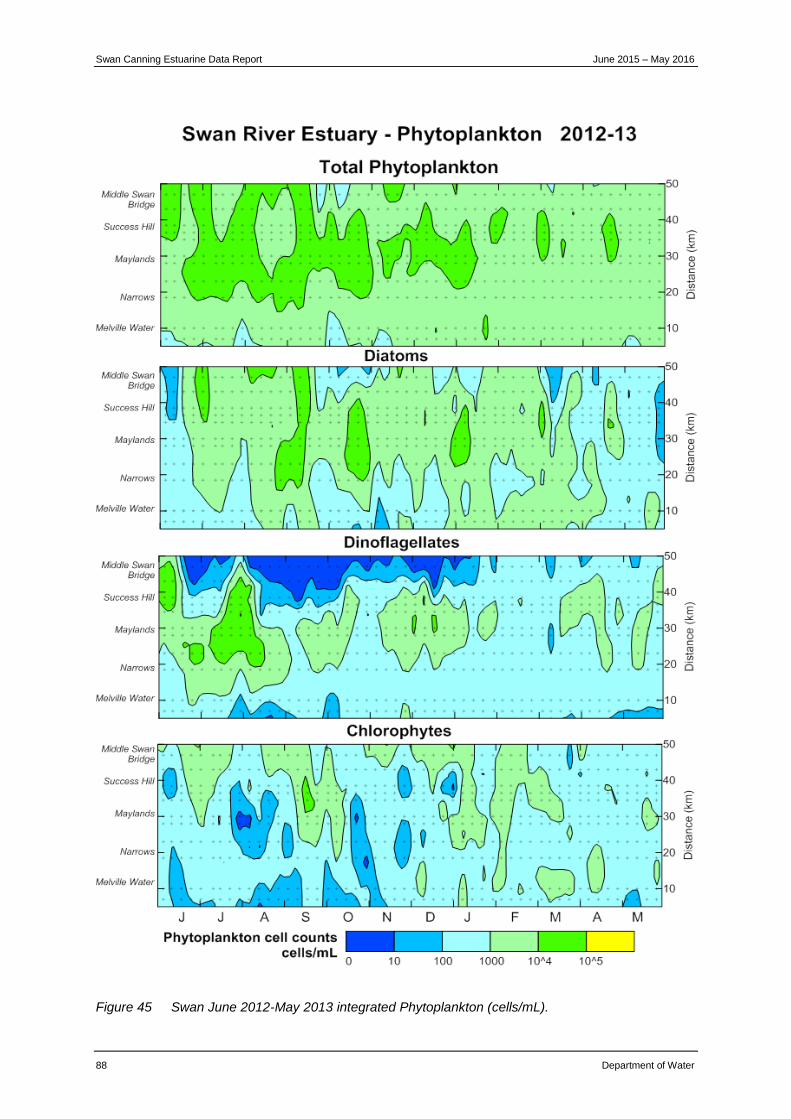
Swan Canning Estuarine Data Report June 2015 – May 2016
88 Department of Water
Figure 45 Swan June 2012-May 2013 integrated Phytoplankton (cells/mL).
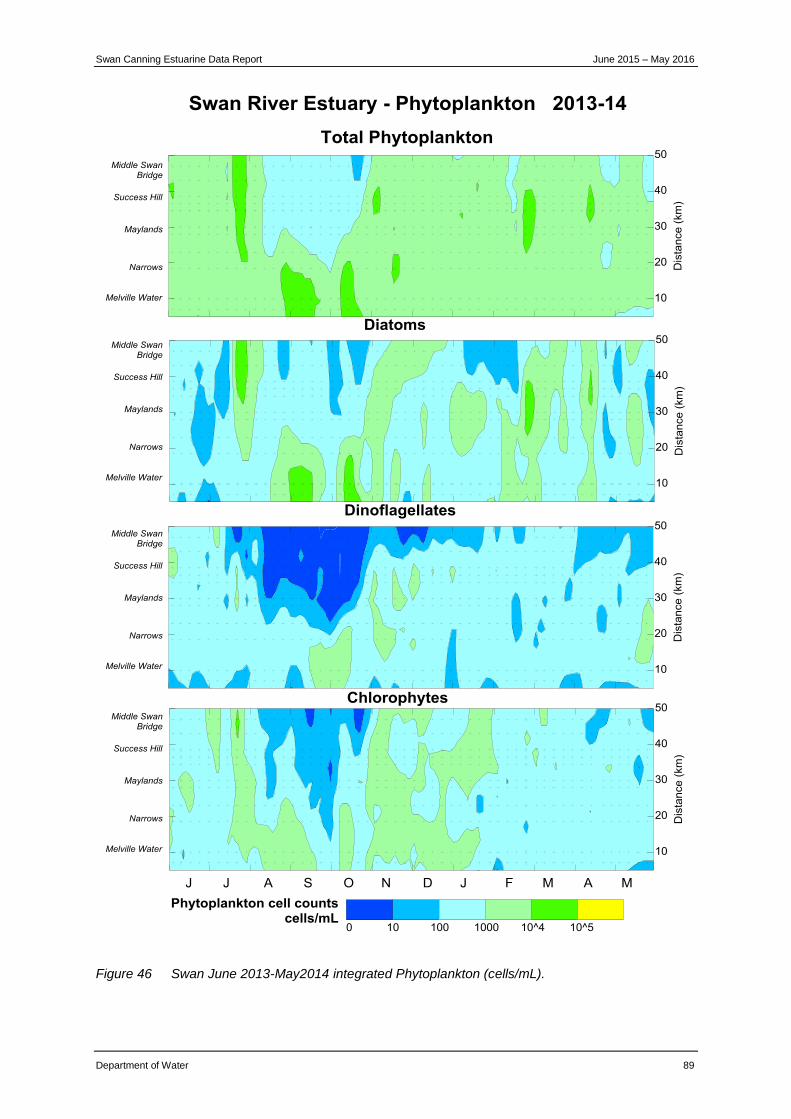
Swan Canning Estuarine Data Report June 2015 – May 2016
Department of Water 89
Figure 46 Swan June 2013-May2014 integrated Phytoplankton (cells/mL).
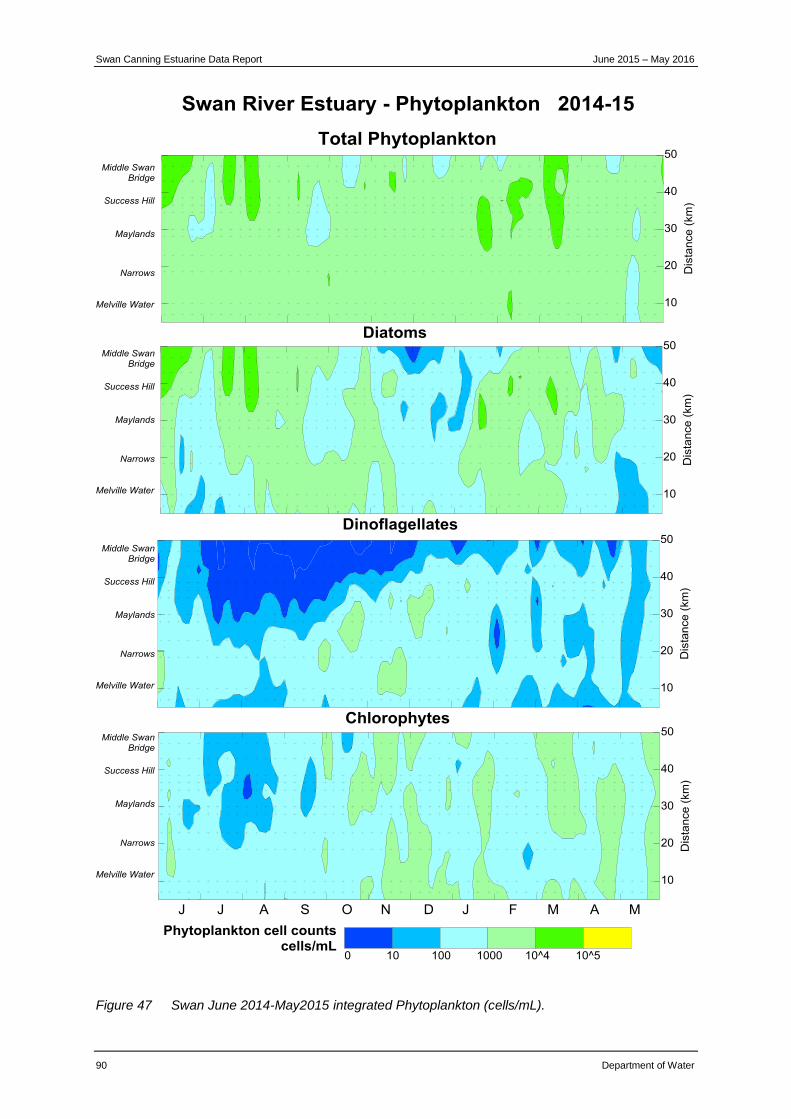
Swan Canning Estuarine Data Report June 2015 – May 2016
90 Department of Water
Figure 47 Swan June 2014-May2015 integrated Phytoplankton (cells/mL).
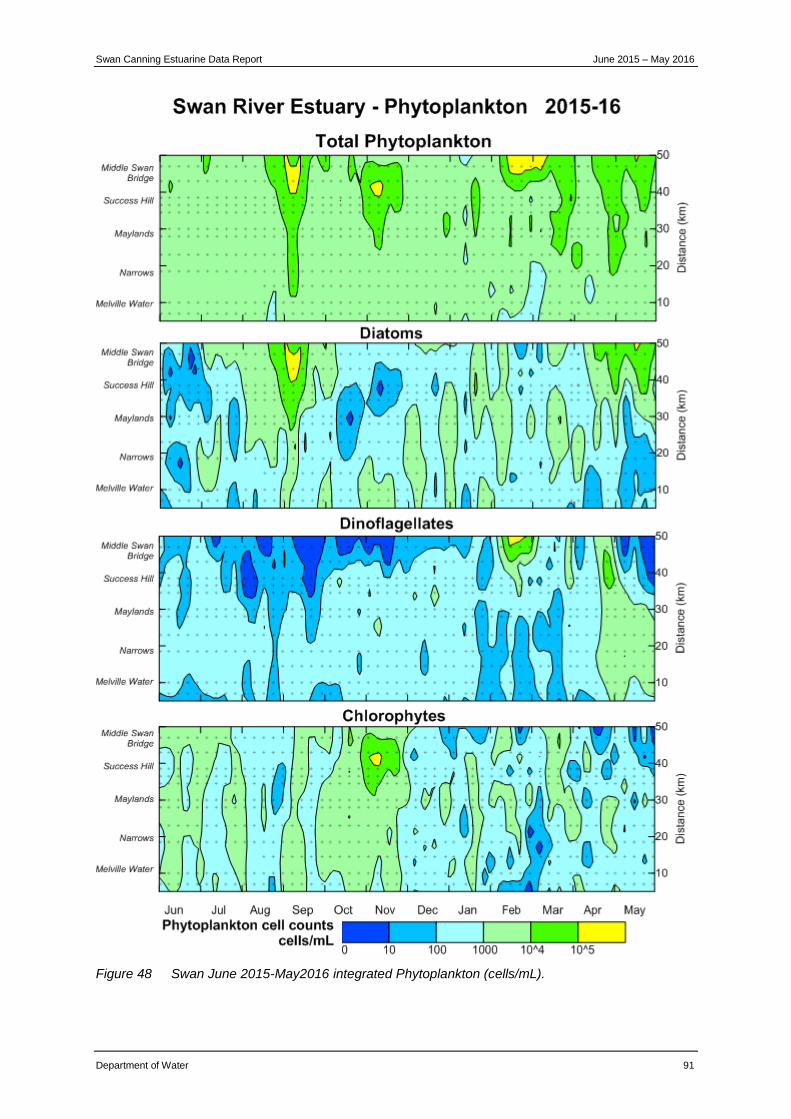
Swan Canning Estuarine Data Report June 2015 – May 2016
Department of Water 91
Figure 48 Swan June 2015-May2016 integrated Phytoplankton (cells/mL).
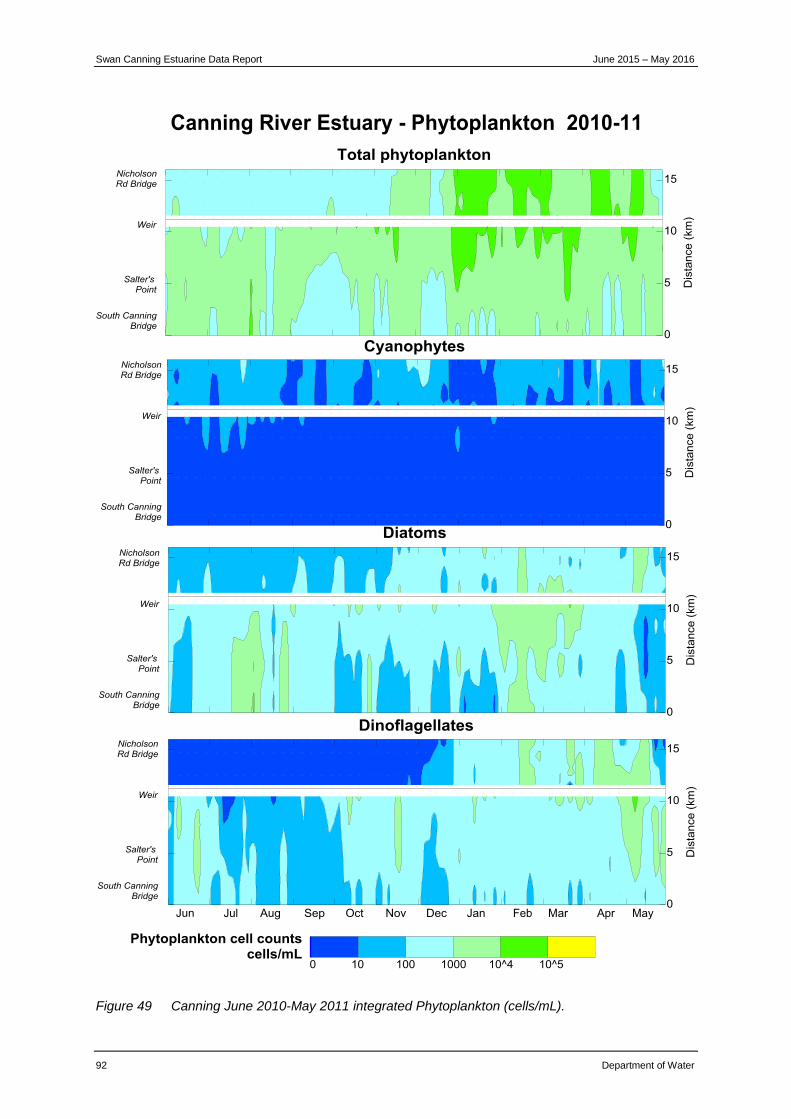
Swan Canning Estuarine Data Report June 2015 – May 2016
92 Department of Water
Figure 49 Canning June 2010-May 2011 integrated Phytoplankton (cells/mL).
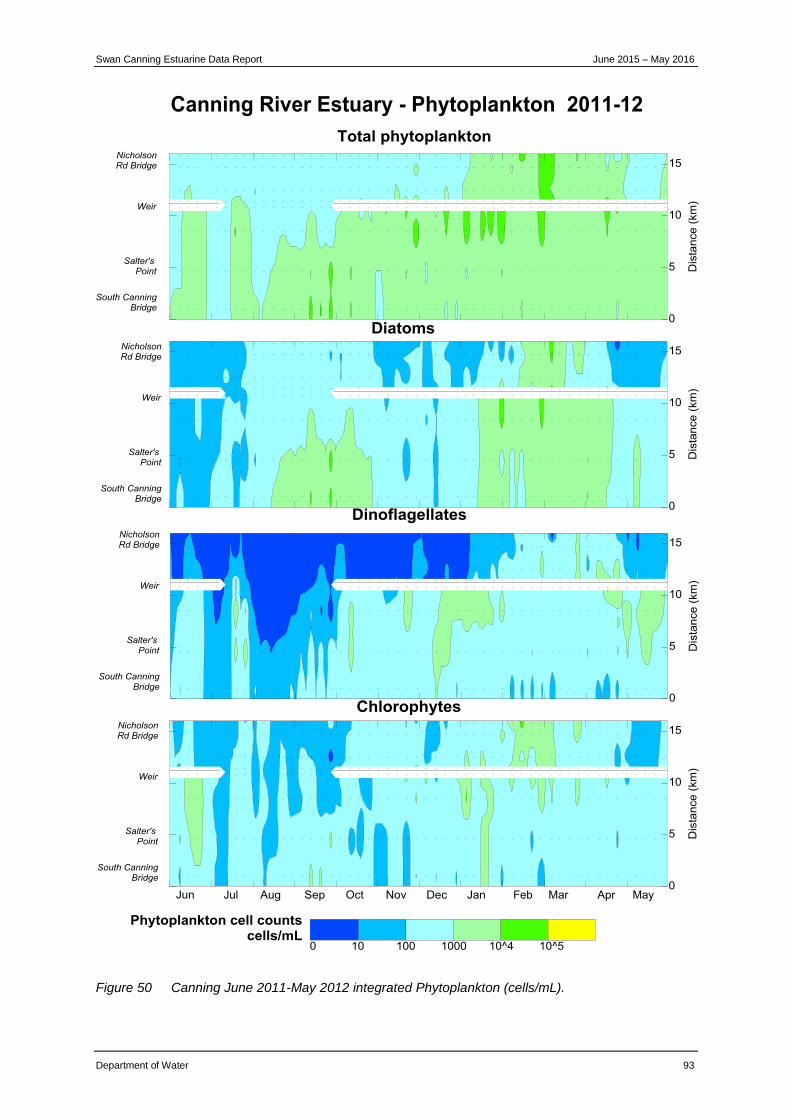
Swan Canning Estuarine Data Report June 2015 – May 2016
Department of Water 93
Figure 50 Canning June 2011-May 2012 integrated Phytoplankton (cells/mL).

Swan Canning Estuarine Data Report June 2015 – May 2016
94 Department of Water
Figure 51 Canning June 2012-May 2013 integrated Phytoplankton (cells/mL).
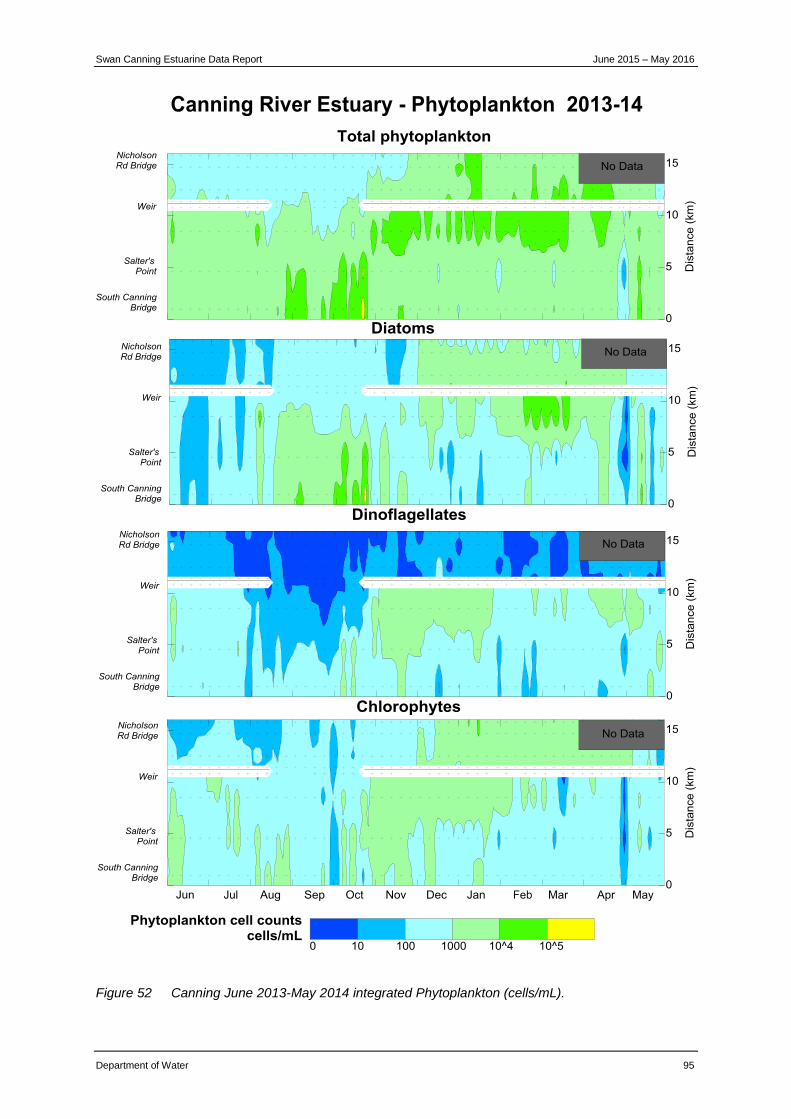
Swan Canning Estuarine Data Report June 2015 – May 2016
Department of Water 95
Figure 52 Canning June 2013-May 2014 integrated Phytoplankton (cells/mL).
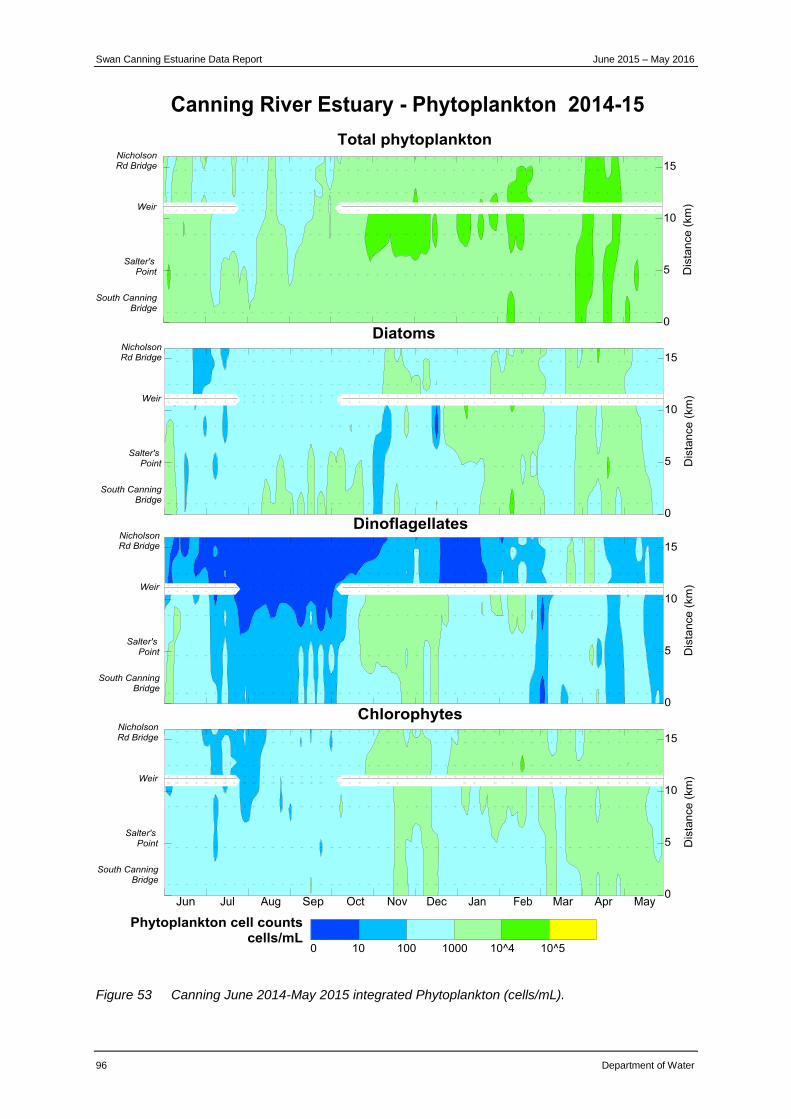
Swan Canning Estuarine Data Report June 2015 – May 2016
96 Department of Water
Figure 53 Canning June 2014-May 2015 integrated Phytoplankton (cells/mL).
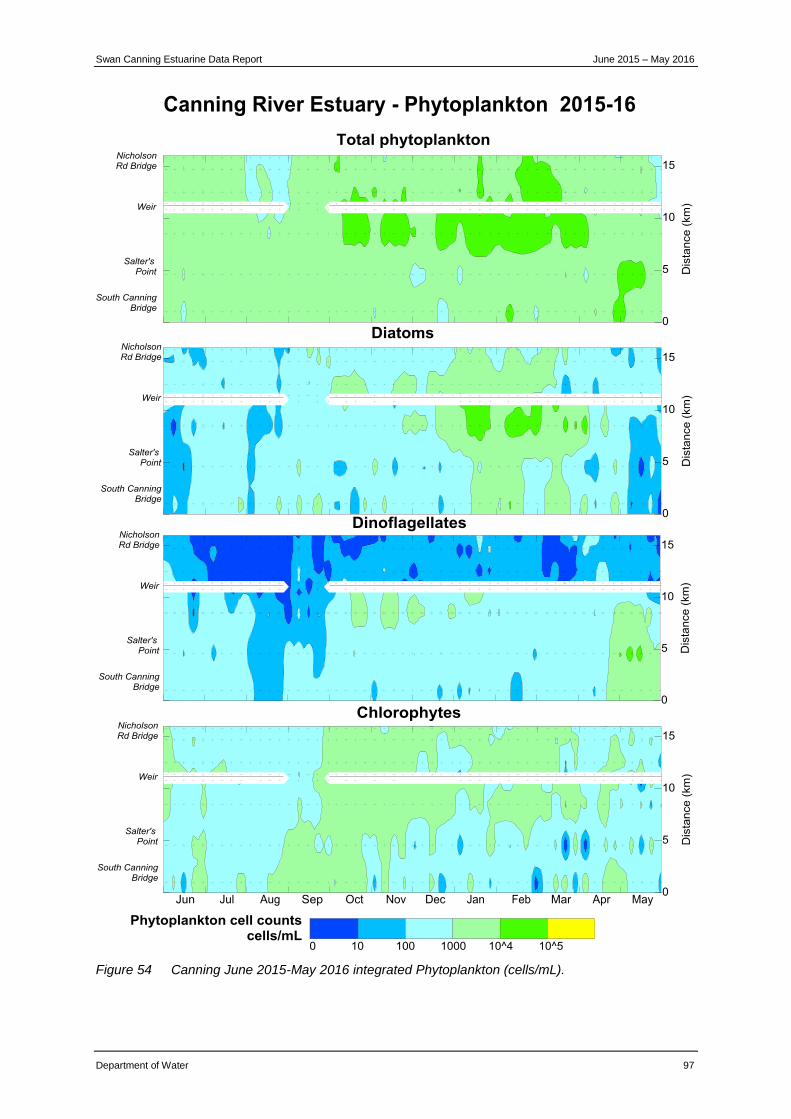
Swan Canning Estuarine Data Report June 2015 – May 2016
Department of Water 97
Figure 54 Canning June 2015-May 2016 integrated Phytoplankton (cells/mL).