swapping headline for core inflation - munich personal repec
TRANSCRIPT

MPRAMunich Personal RePEc Archive
Swapping Headline for Core Inflation:An Asset Liability ManagementApproach
Nicolas Fulli-Lemaire and Ernesto Palidda
University of Paris 2, Amundi AM, Ecole nationale des ponts etchaussees, Credit Agricole SA
7. August 2012
Online at https://mpra.ub.uni-muenchen.de/42853/MPRA Paper No. 42853, posted 28. November 2012 13:15 UTC

Electronic copy available at: http://ssrn.com/abstract=2125962
Swapping Headline for Core Inflation: An Asset Liability Management Approach
Nicolas Fulli-Lemaire1 Amundi Asset Management
Paris II University
Ernesto Palidda1 Credit Agricole S.A.
ENPC
Third Version: 16/11/2012
Abstract
Headline inflation in most industrialized countries, the US in particular, has been shown to be mean reverting to core inflation in the medium term, whilst at the same time the pass-through of exogenous commodity price shocks from the headline to the core has dramatically gone down as a result of a major macroeconomic paradigm change. It yields lower relative volatility for the latter and creates a drive for investing in commodities as a hedge for the spread between both inflation measures. In this paper, we argue for a risk reduction in ALM strategy in the form of a shift from targeting core rather than headline inflation for long-term hedgers while proposing an overlaying core versus headline swap to hedge the potential asset-liability gap. A market curve for core inflation could be derived from the trading of these derivatives and enable easy mark-to-market valuation of any core-linked securities, thus easing the way for future primary issues. Any supply and demand market disequilibria between long-term sellers of headline inflation and short-term sellers of core inflation could be matched by the intermediation of market makers which could price the derivative based on the cross-hedging potential of commodities.
Keywords: ALM, LDI, Long-term Investment, Inflation Hedging, Core Inflation, Commodities, Inflation Pass-through, Arbitrage Pricing, Synthetic Futures, Inflation Derivative. JEL classification: C58, C63, E31, F01, G11, G12, G13, G13, G23, G24, Q02.
1 This document presents the ideas and the views of the authors only and does not reflect Crédit Agricole S.A.’s or Amundi’s opinion in any way. It does not constitute investment advice and is for information purpose only.

Electronic copy available at: http://ssrn.com/abstract=2125962
2
Contents
Introduction ................................................................................................................................................. 3
1. Shifting structure of headline and core inflation and long-term liabilities implications .............. 5
1.1. Macro and econometric analysis ................................................................................................... 5
1.2. Risk reduction using a core vs. headline inflation swap ................................................................ 8
2. Fair value pricing of the swap under an efficient market hypothesis ........................................... 10
2.1. Backward-looking pricing ........................................................................................................... 10
2.2. Forward-looking pricing using synthetic futures ......................................................................... 13
3. Theoretical pricing of the instrument using a Black-Scholes approach ....................................... 15
3.1. Structuring the derivative for Black-Scholes Pricing .................................................................. 15
3.2. Pricing results using the modified Black-Scholes framework ..................................................... 18
Conclusion .................................................................................................................................................. 20
Appendix .................................................................................................................................................... 21
Graphs of the synthetic futures pricing of the security for other maturities ............................................ 21
Graphs of the Black-Scholes pricing of the security for other maturities ............................................... 22
References .................................................................................................................................................. 24
List of Figures ............................................................................................................................................ 26
List of Tables .............................................................................................................................................. 26

Electronic copy available at: http://ssrn.com/abstract=2125962
Swapping Headline for Core Inflation: an ALM Approach
3
Introduction
Whether inflation indexation should be performed based on core rather than headline inflation benchmarks or on CPI rather than RPI indices has been a core concern for central banks and pension funds, academics and practitioners alike. To this day, most inflation-targeting central banks around the world display headline inflation targets to anchor expectations, and some have even switched from core to headline targeting in the last decade or so in order to have targets that are directly understandable by politicians, financial markets practitioners and the general public: South Korea switched to headline targets in 2007 (Bank of Korea, 2006) and Thailand might follow suit (McCauley, 2007), leaving South Africa’s and Norway’s central banks as the only two displaying explicit core targets out the 23 of them using inflation-targeting. Still, academics used to present core inflation as the most efficient monetary policy target as in (Mishkin & Schmidt-Hebbel, 2007) or (Wynne, 1999). More recent works like (Gregorio, 2012) or (Walsh, 2011) tend to challenge that assumption in light of recent events where food inflation displayed persistency, especially in less advanced countries. But in spite of this tide of evidence pointing towards headline inflation indexation, we defend in this paper the idea that the time may have come to rethink our long-term inflation hedging strategies and move towards a core indexation of long-term inflation liabilities to the greater benefit of those seeking protection from monetary erosion.
Econometric studies in all major economies (van den Noord & André, 2007), and for the US in particular (Todd & Stephen, 2010) have evidenced that while headline inflation has been increasingly affected by exogenous commodity price shocks since the late eighties, their pass-through into core prices has dramatically reduced to become statistically nil after the mid-nineties. It thus creates a drive to allocate commodities in inflation hedging portfolios as they naturally hedge the spread between the stable core and the volatile headline indices (Fulli-Lemaire, 2012). But investing in commodities is still a complex and risky adventure for which not all types of investors have the adequate mandate or appetite to engage themselves into it. Yet, headline inflation has been shown to be mean reverting to its core peer in the medium term (Gelos & Ustyugova, 2012), and since the pass-through differential previously exposed results in a lower relative volatility of core inflation indices as compared to headline ones, we argue in this paper for a risk reduction in asset-liability-management strategy in the form of a shift from headline to core inflation indexation of long-term inflation liabilities commonly found in pension funds and liability driven asset managers. The rationale of this move being that the commodity-shock driven volatility effect of headline inflation spikes is averaged out over time, making long-term hedgers indifferent between both inflation liability targets while achieving a theoretically much less costly hedge because of the lower volatility of a core inflation benchmark. The obvious caveat of this alternative strategy is that no such outrightly core-inflation-indexed security exists today: there are no core yielding assets that could match consumer-price-indexed linked bonds in enabling investors to obtain headline inflation linked cash-flows. Though it is worth mentioning

4
that Deutsche Bank recently introduced an investable core-proxy index (Li & Zeng, 2012) that could well be the frontrunner of a primary core-linked security market.
In the meantime, to make up for the lack of a core-linked asset, we propose to overlay the traditional liability management investment portfolio with a swap to transfer the difference between the headline and the core inflation in return for a fixed rate that would be paid to long-term investors by short-term hedgers which cannot benefit from such long duration averaging processes. That is why short-term investors cannot be at risk on the volatile part of the inflation index but can be at risk on the core inflation which is extremely sluggish over short horizons and variations of which are, to a large extent, capped by those of the nominal rates: we therefore argue for a nominal investment strategy coupled with the receiving end of the inflation spread from the swap for short-term investors, and a linker investment coupled with the other end of the swap transaction for long-term investors, which would obviously have to roll their positions to match the maximum investment horizon of their short-term counterparties. The market for such a swap will most likely be unbalanced as short-term investor demand might be inferior to long-term players’ offers. This would accordingly render the fair value of the swap priced under an efficient market hypothesis on synthetic forwards potentially inadequate as market-makers in the form of investment banks’ trading desks might be necessary to support the market.
If such were the case, since this derivative is unarbitrable as it cannot be hedged on any market underlier because of the core inflation exposure, we would propose a cross-hedging strategy on commodities as the difference between core and headline inflation is highly correlated to them (Fulli-Lemaire, 2012), and has been increasingly so in the last twenty years. The pricing of the security would therefore be made on a cross-hedging cost basis under an incomplete market framework. The cross-hedging dimension will not be touched in this paper as we will remain under the efficient market hypothesis which includes the assumption that the security is outrightly arbitrable. We shall deviate slightly from this framework in the last section to introduce the optional setting which could constitute the basis for the cross-hedging strategy, but only in order to enhance the swap pricing by introducing the risk asymmetry between fixed and floating swap spread investors which justifies the existence of the risk premium that long-term investors are precisely trying to capture.
The core versus headline swap would thus yield both an intermediated commodity investment for inflation protection buyers which cannot do so directly, and would also permit the construction of a market curve for core inflation as linkers enabled the construction of a headline one a decade ago in the US, which would potentially ease the way for core-linked securities issuances.

Swapping Headline for Core Inflation: an ALM Approach
5
1. Shifting structure of headline and core inflation and long-term liabilities implications
1.1. Macro and econometric analysis
The first and foremost difficulty in addressing the issue of core inflation, as any practitioner’s paper such as (Mankikar & Paisley, 2002) or any scholarly paper such as (Bermingham, 2007) never fails to mention, is the lack of a common definition of core inflation, not mention an unambiguous way to measure it (Wynne, 1999). For the purpose of this paper, we shall skip this otherwise interesting debate in macroeconomic and monetary policy by using the commonly accepted official definition of the core US inflation as measured by the Bureau of Labor Statistics and published by the Saint Louis Federal Reserve in the form of the Consumer Price Index for All Urban Consumers, “All Items Less Food & Energy, Not Seasonally Adjusted” (CPILFENS). We shall also use its headline counterpart, the “Consumer Price Index for All Urban Consumers: All Items” (CPIAUCNS).
Figure 1: Core vs. Headline inflation in the US over a 50-year period
Until quite recently, core inflation was assumed to be a lagged indicator of headline inflation as it supposedly reflected monetary effects driving long-term price trends without the noise added by short-term effects captured by the headline inflation measure. Moreover, core inflation was assumed to be driven by the performance of headline inflation with a lag during which the inflation pass-through operated by gradually closing the gap between the two indicators. As an illustration of this phenomenon, Figure 1 presents the trend in the US core and headline inflation indices’ year-on-year returns over half a century and the oil shocks of the
‐5%
0%
5%
10%
15%
1960 1970 1980 1990 2000 2010
YoY_(H‐C) YoY Headline CPI YoY core CPI

6
seventies can clearly be seen as the ideal case study of this phenomenon: we have an initial shock in commodity markets, immediately followed by a steep rise in headline inflation which in turn drives core inflation upward until it closes the gap in a little over two years. The Headline-minus-Core (HmC) spread then turns briefly negative and the cycle goes on, with the mean reverting to around zero. Throughout the first forty years of the period studied, albeit for a very brief moment during the oil shocks of the seventies, this spread remained marginal compared to the overall level of both inflation indices. This theory thus seemed to hold fairly well until the turn of the century, at which point it could no longer explain the subsequent sequence of events: Figure 2 zooms-in on those last ten years or so on which we will focus in this paper.
Figure 2: Core vs. Headline Inflation in the US over the last decade
During this period, inflation levels remained historically low following the end of the
“Great Moderation” era (Stock & Watson, 2003): core inflation in particular remained very stable around 2% per annum whilst headline inflation, which had hovered around 2.4% p.a. in the decade before the crisis, started to become more volatile as it rose then fell at the turn of the decade. But throughout this period, core inflation seemed unmoved by event seemingly driving the headline inflation. Moreover, the spread between the two indices rose to a significant fraction of the core level for a sustained period of time, which in itself was historically unheard of: the pass-through had clearly ceased to operate in the way it used to. Econometrists used to believe that exogenous oil price shocks were the main drivers of macroeconomic variables’ volatility as in (Hamilton, 1983). Yet, as (Hooker, 1999) noted, this straightforward causal relationship ceased to be unequivocally statistically significant in the mid-eighties as a major paradigm shift ongoing at the time profoundly altered the nature of the links between those exogenous commodity price
‐6%
‐4%
‐2%
0%
2%
4%
6%
2000 2001 2002 2003 2004 2005 2006 2007 2008 2009 2010 2011
YoY_(H‐C) YoY Headline CPI YoY Core CPI

Swapping Headline for Core Inflation: an ALM Approach
7
shocks and both inflation measures by differentiating their responses to them: macroeconomic variables such as output or core inflation were less responsive whilst headline inflation became increasingly impacted by them. This diminishing overall impact of exogenous oil price shocks since the mid-eighties was extensively studied by macroeconomist following the seminal article of (Blanchard & Gali, 2007) which provided some explanations to what might be the causes of this reduction which they attributed to better monetary policies, reduced energy intensiveness and nominal wage rigidity relaxation. The consequences of which were indeed measured by (van den Noord & André, 2007) and (Todd & Stephen, 2010) in the following manner: since approximately the mid-eighties, the pass-through of exogenous oil price shocks into headline inflation was increasing while the pass-through into core inflation had most probably ceased to operate in the mid-nineties.
As emerging economies steadily increased their commodity consumption throughout the latter part of the twentieth century, the growth of which vastly outmatched the rise in production required to contain prices, we witnessed a dramatic increase in their overall prices, in particular on energy and agricultural commodities. It thereby fuelled a more than a decade long commodity bull-run of historic proportions which started in the mid-nineties and is still fairly active today but for a short break due to the US subprime crises and the ensuing “Great Recession” (Farmer, 2011) which had dented consumption and depressed prices for a short while before they resumed their steady rise. Combined with an increasingly powerful pass-through into headline inflation, rapidly rising and volatile commodity prices spurred headline inflation indices in a clearly different pattern from the way it affected core inflation, which did not seem to be responding to commodity price shocks impacting headline inflation as it used to: since roughly the beginning of the crisis, we have seen huge swings in headline inflation with a year-on-year peak-to-trough range of 6.34% compared to a mere 0.94% for core inflation. Correlation between headline and core inflation, estimated by five year rolling window, halved from a fifty-year average of 70.34% to a mere 36.66% in the last decade.
As can be seen in the following (Figure 3), the HmC spread now contributes a significant amount of total inflation volatility. In the last ten years, it ranged from almost 2/3 of the total variance (adjusted for the covariance term for comparison purposes) over a one-year horizon to over a third for longer durations. This structural change in the US economy and its repercussions through the integration in global financial markets has an interesting econometric effect for the purpose of this paper in the form of the appearance of a co-integration relationship between commodity indices and the volatile fraction of inflation as measured by the HmC spread identified in (Fulli-Lemaire, 2012). It evidences a secular increase in the trend of the correlation between commodity indices and this volatile fraction of the headline inflation. In the last couple of years, the correlation measured over twenty quarters has settled over 80%. In addition, it evidences that since the end of the nineties, a long-term relationship in the form of co-integration between the two variables has been very statistically significant. This econometric analysis opens the way for an inflation hedging application of the previously evidenced properties.

8
Figure 3:
1.2. Ri
Arelationsdifferenshocks fthe volareferencspread iattributecould sofully invrisks ashedgingreplicatinowadayinvestorstrategy
Inthe targeon a cor(CHS) w
: Breakdown
isk reducti
As can be ship betweece between from the sevatile compoces at redemin benchmae much of tolve the probvested in inssociated wg strategy, aning commodys, such typrs like pensi
looks incre
n essence, wet maturity re index wilwhile short-
of the varian
ion using a
deduced fren core and
anchoring lventies and onent of in
mption for aark volatilitythis instabilblem as therflation linke
with commond have a sdity indicespe of investion or mutuaeasingly des
we can driveof their invell place them-term hedge
nce of the real
a core vs. h
rom the preheadline in
liabilities tothe eighties
nflation has liability dry levels as lity to shocre is little aled bonds ordity investi
strong potens performantments are nal funds andirable and i
e a wedge bestment: lonmselves as hers will fav
lized inflation
headline inf
evious subsnflation as wo a headlines apart, this resulted in
riven investmcan be seen
cks in commlternative inr swaps (Fuing easily ntial for disances makes not within td retail asses proposed h
between twong-term invheadline infvor a headli
n into core an
flation swa
ection, thiswe used to k or to a corehistoricallyn a significment appron in the premodity mar
nflation hedgulli-Lemairecould annihaster. Moreit much si
the reach anet managers.hereunder.
o classes ofvestors wishflation sellerine indexati
d non-core co
ap
s paradigm know and re inflation r high and pcant gap riach, not to evious (Figrkets, invesging investm, 2012). Yehilate the uover, even impler to innd mandate. A less risk
f inflation hing to benchrs in the Coion and wil
omponents
shift has bresults in a sreference. Tersistent insisk betweenmention a sure 3). Sincting directl
ment apart fet, the compusefulness if structurednvest in come of most inky indirect i
hedgers dephmark their
ore vs. Headll therefore
broken the significant
The two oil stability of n the two significant ce we can y in them
from being plexity and of such a d products mmodities
nstitutional investment
pending on r strategies dline Swap be on the

Swapping Headline for Core Inflation: an ALM Approach
9
receiving end of the more volatile headline inflation leg. Since there is a maturity mismatch between those two investor classes, deals will either have to be intermediated by a bank which will perform the inter-temporal intermediation, or more simply, its duration will be constrained by the short investor horizon. Long-term investors will have to roll their short-term positions as it is customary in ALM for many other fixed-income investment issues. The rest of the paper will focus on this second possibility.
Let FR represent a fixed rate settled at inception such that the Mark-To-Market (MtM) value of the swap be nil. The CHS can then be written as:
|
It can be rewritten in a Fixed-For-Float (FFF) format:
|
Long-term investors will therefore pay the HmC spread and receive a fixed rate while short-term investors will place themselves at the other end of the deal. In such a FFF format, it can easily be seen that from a risk perspective, the spread payers face a more risky deal (even through the spread can turn negative at times). For such a reason, there will obviously be a risk premium included in the determination of the fixed rate to the benefit of float payers.
Since we know that variations in the HmC spread should be strongly correlated with variations in investable commodity indices, this swap could be cross-hedged with a synthetic cross-replicating commodity portfolio. If such were the case, this instrument could be marketed by investment banks acting as intermediaries between institutional investors and commodity markets. It would therefore answer institutional investors’ risk-versus-benefit problem of a direct investment in commodities while providing them with an instrument to hedge the gap risk between the two inflation indices. Yet, pricing such an instrument is a true challenge in itself for two reasons:
Firstly, both legs of the swap are settled through monthly fixing of the core and the headline inflation which results in significant pricing complexity arising from the time gap risk. There is little novelty in it as time-gaps are standard difficulty in fixed income asset pricing. What is relatively new in this case is that since there is no marketable security linked to core inflation to this day as they are securities linked to the headline inflation such as Treasury Inflation Protected Securities (TIPS), we obviously neither can price the core leg of the swap in a direct mark-to-market approach nor hedge it on any underlier.
Secondly, as we mentioned in the preceding point that there are no marketable securities linked to core inflation but that we do know that the net cash flows of the swap being the HmC spread and that it is probably highly correlated to commodity indices, we can envisage a cross-hedging of the swap on a cross-replicating commodity portfolio. Such a hedging strategy based on correlations

10
would add an extra “decorrelation risk” that has to be borne by the sellers of the derivative and which should be measured as accurately as it possibly can be in order to price it.
We will then proceed in three steps: Firstly, the instrument will be priced in a “Perfect Foresight Environment” (PFE) using realized values of the variables in order to perform a backward-looking simulation exercise to assess the viability of the strategy assuming there is no pricing issue. Secondly, placing ourselves in an “Efficient Market Hypothesis” (EMH), we will assume the core inflation index is investable and construct a synthetic future curve for it from which we will derive a no-arbitrage pricing of the security. Last but not least, we will introduce the optional framework required to perform the cross-hedging while abstaining from further developing the cross-replicating portfolio and the pricing it yields, as this would constitute another paper in itself. We shall nonetheless offer an alternative pricing to the previously exposed no-arbitrage one by adopting the (Korn & Kruse, 2004) formula which we hope will enhance the pricing of the swap by factoring in better the risk premium as it is an adaptation of the Black-Scholes (Black & Scholes, 1973) framework to price inflation derivatives.
2. Fair value pricing of the swap under an efficient market hypothesis
2.1. Backward-looking pricing
As a first test of the usefulness of the CHS strategy, we will in this first subsection run a simple validation exercise: under a PFE, pricing issues are shunned by using the ex-post price of the security derived from the ex-post values of the core and the headline inflation indices, which in turn yields the ex-post optimal swap rate. From these values, we can derive the returns for buyers and sellers of the inflation spread.
Before that, we have to propose strategies for our two potential types of participants in the trade to which we will henceforth refer to as Long-term (LT) and Short-term (ST) hedgers. We will define the following strategies for them:
The LT strategy is defined by a long position in inflation-linked bonds of matching maturity and a short position on the inflation spread which ensures a real return, a core inflation floor and the fixed swap rate.
The ST strategy is defined by a long position on nominal bonds of ad hoc maturity and a long position on the inflation spread. It therefore yields a nominal return and an inflation spread floor minus the fixed rate paid for the hedging swap.
We therefore have LT participants which have passive short positions on the core-headline spread while achieving a core floor while ST participants remain at risk on the core inflation rate whilst they are wholly covered against the inflation spread. LT hedgers should

Swapping Headline for Core Inflation: an ALM Approach
11
benefit from the sale of the swap by capturing the risk premium associated with the volatility spread between headline and core inflation, while at the same time “average-out” the spikes of the spread over the various rolls. On the other side of the deals, ST buyers are at risk on the core inflation part which at their short-medium horizon is completely manageable considering the extra income investing in “volatile inflation”-hedged nominal assets brings.
We then define the benchmark strategies against which we will compare our alternative one as a pure investment in linkers for both short-term and long-term participants. In real terms, the cash flows for both portfolios are netted on a different benchmark: a core inflation one for LT and a headline inflation one for ST investors. We therefore have the following nominal and real returns for LT (LTR and CLT), ST (STR and RST), and real returns for the short (RRR) and long (CRR) benchmark:
Nominal investor returns: –
Real investor returns: –
Real benchmark returns:
The results obtained from this backward-looking simulation of the portfolios derived from our strategy are presented in the Figure 4 below. We have the nominal and real returns for short-term participants (STRh and RSTh) and long-term ones (LTRh and CLTh) and the real returns on the ST and LT benchmark portfolios (RRRh and CRRh).
Figure 4: PFE pricing, LT vs. ST and vs. Benchmark real performance for a 5-year horizon
1990 1992 1994 1996 1998 2000 2002 2004 2006-1
0
1
2
3
4
5
6
7
8
Start Date
%
Long vs. Short 5Y Perfect Foresight Real Performance
RSTh
CLTh
1990 1992 1994 1996 1998 2000 2002 2004 2006-1
0
1
2
3
4
5
Start Date
%
Comparative 5Y Perfect Foresight Real Perf of H vs. C Benchmark
CRRh
CLTh

12
As could have been expected, over the five-year investment horizon example presented in the previous figure, there is a clear performance spread between our LT and ST portfolios to the benefit of the latter. It is a logical reflection of the risk-return premium associated with a nominal investment. On the benchmarked comparison for the LT investor, there seems to be little interest in engaging in the alternative strategy as the benchmark performs better overall throughout the sample period even though the alternative strategy is purely deterministic with respect to its indexation while the benchmark is not.
The same conclusion can be found again in the backward looking pricing exercise results presented in the Table 1: since there is no risk added in engaging in the swap in a perfect foresight environment (as it is entered at the precise value at which it will be settled) there is no clear incentive to sell the volatile fraction of the headline inflation as there is no added risk premium to be captured by LT investors. This becomes increasingly less so as the maturity of the deal increases for LT investors and there is even an added volatility compared to the benchmark strategy. It is obviously the opposite for the ST investors (albeit over very short investment horizon) and with also a larger volatility at any horizon considered here.
Table 1: ILB + Swap vs. ILB for LT investors in the perfect foresight environment
Horizon 1 Y 2Y 5Y 10Y
ST Portfolio RSTh RRRh RSTh RRRh RSTh RRRh RSTh RRRh
Mean 1.81% 1.85% 2.41% 2.18% 3.72% 2.55% 5.51% 3.38%
Std. 2.24% 1.64% 2.09% 1.42% 1.68% 1.45% 1.17% 0.93%
IR ‐0.01 0.13 1.06 1.50
Ex‐post max Real Premium
‐0.04% 0.23% 1.17% 2.13%
LT Portfolio CLTh CRRh CLTh CRRh CLTh CRRh CLTh CRRh
Mean 1.85% 2.07% 2.18% 2.40% 2.55% 2.83% 3.38% 3.71%
Std. 1.64% 1.84% 1.42% 1.33% 1.45% 1.33% 0.93% 1.04%
IR ‐0.20 ‐0.32 ‐0.68 ‐1.13
Ex‐post min Risk Premium
0.21% 0.22% 0.28% 0.33%
But what is certainly the most interesting result that can be obtained from this simulation exercise lies in the last line of the tables for LT and ST investors presenting the minimum and maximum ex-post risk premium that can be added to the fixed-rate fair values without underperforming both benchmarks. We can therefore conclude that pricing issues apart, there is

Swapping Headline for Core Inflation: an ALM Approach
13
room to trade for both investors for deals with maturities that strictly exceed one year as the minimum required ex-post risk premium is under the maximum premium for those horizons.
2.2. Forward-looking pricing using synthetic futures
Using the same strategies as before, we now perform a pricing exercise by no-arbitrage valuation under an efficient market hypothesis. In order to so, we compute the fair-value swap rate using simulated future prices derived from anticipations published by the survey of professional forecasters for core and headline inflation as there were no liquid listed securities even for headline inflation at the time. For the earlier part of the sample in which there was no core forecast available, we reconstructed it assuming the most simple continuity hypothesis with a slope derived from the headline curve. For this dataset, we compute outrightly the swap rate and use it to obtain the nominal and real returns on our LT (SLT and SLC) and ST (SST and SSR) portfolio with the same benchmarks as before. We present in (Figure 5) the results in the five-year horizon case.
Figure 5: Futures based pricing, LT vs. ST and vs. Benchmark real performance for a 5-year horizon
Again, we see a positive spread in favor of ST investors compared to LT ones as the nominal investment pays off. We also underperform our benchmark portfolio in the LT case. Since we placed ourselves in an EMF and we used expectations to compute the spread value, there is no reason to believe the risk premium was included in the computation and, in light of
1990 1992 1994 1996 1998 2000 2002 2004 2006-4
-2
0
2
4
6
8
Start Date
%
LT vs. ST 5Y SR-priced Real Performance
SSR
SLR
1990 1992 1994 1996 1998 2000 2002 2004 2006-2
-1
0
1
2
3
4
5
6
Start Date
%
Comparative 5Y Performance of Headline vs. Core Benchmark for SR
CRR
SLC

14
those arguments, the results seem all the more logical. The performance in (Table 2) presented hereunder reinforces this assumption:
Table 2: ILB + Swap vs. ILB for LT investors in using simulated futures for pricing
Horizon 1 Y 2Y 5Y 10Y
ST Portfolio SSR RRR SSR RRR SSR RRR SSR RRR
Mean 2.07% 2.07% 2.61% 2.41% 3.87% 2.83% 5.81% 3.72%
Std. 1.94% 1.84% 1.86% 1.33% 1.80% 1.33% 1.05% 1.04%
IR 0.00 0.16 0.90 1.54
Ex‐post max Real Premium
0.00% 0.20% 1.04% 2.09%
LT Portfolio SLC CRR SLC CRR SLC CRR SLC CRR
Mean 1.60% 2.07% 1.99% 2.41% 2.38% 2.83% 3.00% 3.72%
Std. 2.10% 1.84% 1.85% 1.33% 1.58% 1.33% 1.15% 1.04%
IR ‐0.19 ‐0.26 ‐0.48 ‐1.11
Ex‐post min Risk Premium
0.47% 0.42% 0.45% 0.72%
The results we found in this exercise are in accordance with the previous one: there is only a marginal increase in the performance of the LT strategy in terms of information ratios (corresponding to an increase in gross return coupled with a decrease in the volatility). Once again, the difference between the ex-post minimum and maximum risk premium upholds the belief that there is room to trade strictly above the two year horizon in this case.
It is therefore necessary to seek an alternative pricing of the swap rate which would include a strong risk-premium to outperform our benchmark strategies for LT investors while preserving the outperformance of ST ones at the same time. Considering the previously exposed min-max risk premium range computes ex-post, there is room to maneuver. Such an increase in the SR would increase the return for LT investors without changing the volatility of the returns as the rate is fixed at inception. Since our pricing using simulated forwards cannot take into account this characteristic of the trade, in the subsequent and last section of this paper, we will envisage a pricing of this premium using an option-theory derived model based on a modified version of the Black-Scholes formula (Korn & Kruse, 2004). We hope it will be more adequate to take into account the difference in volatility levels between the core and headline underlier of the swap, which should in turn necessarily result in a pricing premium to the benefit of the inflation spread seller.

Swapping Headline for Core Inflation: an ALM Approach
15
3. Theoretical pricing of the instrument using a Black-Scholes approach
3.1. Structuring the derivative for Black-Scholes Pricing
By placing ourselves in an EMH, we implicitly assumed that the value of the swap should be a direct reflection of the mark-to-market value of the underlying securities, which obviously implies that these securities are investable whereas they precisely are not. Our security is therefore clearly unarbitrable. When we made the assumption that the market for such an instrument would be balanced between sellers and buyers, we shunned that difficulty as only the pricing issue remained: none of the parties actually has to compute a dynamic hedge of the security through its lifetime from inception to settlement and no one therefore needed to invest in the underlying securities. But, on the one hand, as we exposed in the previous section, this conceptual framework is clearly insufficient as it fails to correctly price-in the risk premium in the fixed rate and it is also insufficient in the case of market makers intermediated trades: traders will have to dynamically hedge the security throughout its lifetime and therefore will need to have an investable underlying to create the replicating hedging portfolios. The following option-derived (Mark-to-Model) pricing framework deviates from the EMH as it breaks the Absence of Arbitrage Opportunity (AAO) assumption. Its aim is to better apprehend the risk asymmetry which underscores the risk premium which we are trying to price. But without the cross-correlation element, we will still fall short of the investable asset requirement identified above.
Without losing generality, we will restrict ourselves to the pricing of a Zero Coupon Swap (ZCS) as any other type of couponed swap can be decomposed as a sum of ZCS. The CHS premium can therefore be written as:
, ∙ , , ,∙
At inception, we want to set the swap Rate ( ) such that the swap premium is nil. Let , be such that:
0 ⇒ , , ,
As before, we will use our simulated futures for both underlyings to make-up for the lack of an historic dataset.
The natural way to price the swap would be to separate the discrete, low frequency gap-hedging problem from the cross hedging problem as is customary in fixed-income literature: we would, begin with, ignore the discrete fixing problem of inflation linked -securities as we assume the price is derived from Breakeven Inflation rates (BEI) equivalents which are traded in almost continuous time. We would then define a synthetic underlying of our swap to be with ,
, , which would represent the volatile fraction of inflation. Yet, such an underlying
16
would ocould be
Isensitivicurrent s& Krusinstrume
Let H beinflation
We have
Then, ∀
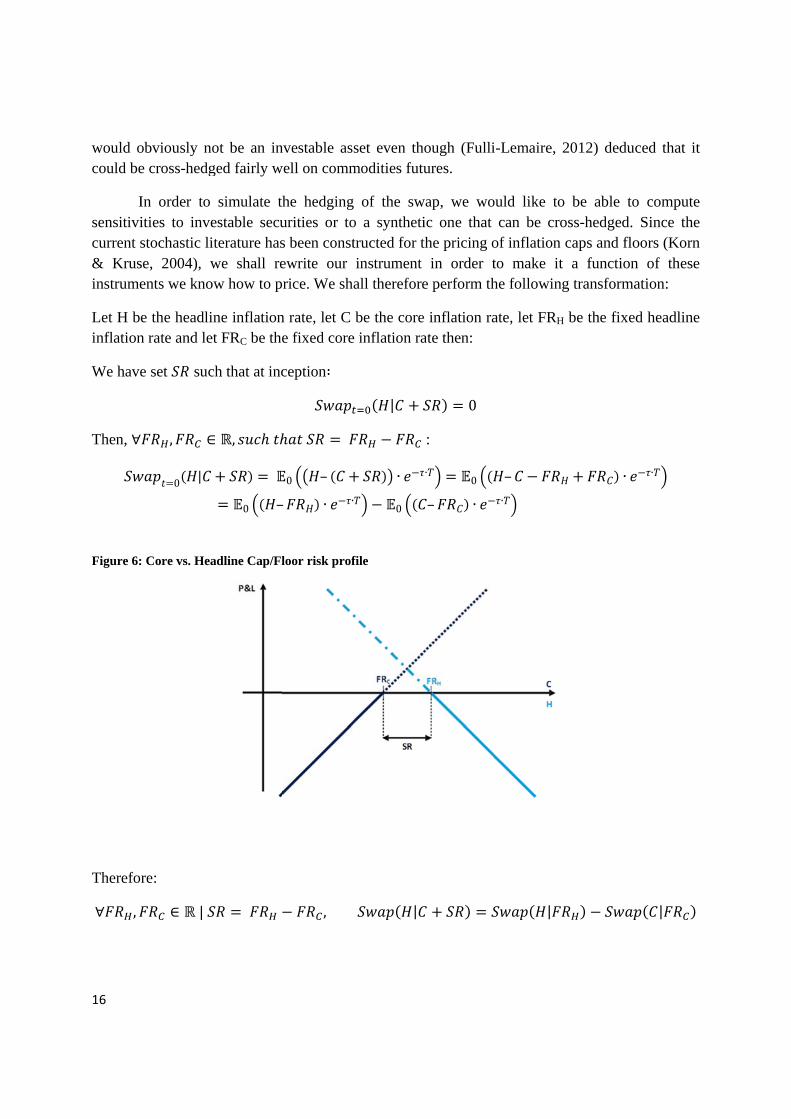
Figure 6:
Therefor
∀ ,
obviously ne cross-hedg
In order to ities to investochastic lise, 2004), wents we kno
e the headlin rate and le
e set suc
, ∈
0 |
: Core vs. Hea
re:
∈ |
ot be an inged fairly w
simulate thestable secuiterature haswe shall re
ow how to p
ine inflationet FRC be the
ch that at inc
∈ ,
0 –
adline Cap/Fl
nvestable aswell on comm
he hedgingurities or tos been constewrite our rice. We sh
n rate, let C e fixed core
ception∶
0 –
– ∙ ∙
loor risk prof
,
set even thmodities futu
g of the swo a synthetitructed for tinstrument all therefore
be the coree inflation ra
|
∙
∙0
file
|
ough (Fulliures.
wap, we woic one that the pricing o
in order te perform th
e inflation raate then:
0
:
∙0
– ∙
i-Lemaire, 2
ould like to can be cro
of inflation to make it he following
ate, let FRH
–
∙
|
2012) deduc
be able tooss-hedged. caps and floa function
g transforma
be the fixed
∙
ced that it
o compute Since the
oors (Korn n of these ation:
d headline
∙
|

Swapping Headline for Core Inflation: an ALM Approach
17
Since we have by cap-floor parity:
| | | | | | | | |
⇒ | | | | |
By placing ourselves as the receiver of the inflation spread and wishing to hedge its trade, we are therefore short of the swap. Since option prices are by definition non-negative, we only wish to hedge:
| |
Using the modified Black-Scholes formula of (Korn & Kruse, 2004), we derive the option prices for both options assuming the Core and Headline inflation indices respect the following geometric Brownian motion:
∙ ∙ ∙ ∙∙ ∙ ∙ ∙
Where is constructed such that:
We can therefore create the replicating portfolios for both options by computing the deltas of both options:
∆ ∆
Since C is not an investable asset, we compute the investment in :
∆ ∆ ∆ ∆
⇒ ∆
∆ –
We therefore obtain the replicating portfolios for our options composed of the two underlyings, one of which is not outrightly investable. For the purpose of this paper, we shall limit ourselves to using the initial pricing of the security obtained through the use of the (Korn & Kruse, 2004) modified Black-Scholes framework. We shall skip the otherwise interesting aspect of the dynamic gamma hedging using the replicating portfolios which requires a more complex cross-hedging strategy on commodities using the existing literature on incomplete markets and which will be the subjects of another paper.
In the hypothesis of a two-sided long versus short-term investor deal, only the swap rate value is needed as there are no reasons to hedge the derivative. But in the case of an

18
intermediated deal where the seller is not hedging any cash flows but is trading the security on a market-making basis, hedging this risk on the market is of the essence. As hedging the security becomes critical, there is no way we can skip the cross-hedging cost dimension which would have to be included in the analysis and requires a switch in pricing method towards a hedging-cost approach.
3.2. Pricing results using the modified Black-Scholes framework
We present in this sub-section the results of this pricing exercise which is meant to test whether an optional method can adequately price-in the risk premium we exposed in the previous sections. In accordance with the previously exposed validations, we place ourselves in the same long versus short-term investor framework and we now price the swap rate using the (Korn & Kruse, 2004) modified Black-Scholes framework to incorporate the risk-premium. The result of this simulation is presented in the following figure 7 for our five year example. We have the nominal and real returns on our LT (LTR and CLT) and ST (STR and RST) portfolio with the same benchmarks as before.
Figure 7: BS pricing, LT vs. ST and vs. Benchmark real performance for a 5 year horizon
Reassuringly for our proposed strategy, the BS-priced portfolio for our long-term investor
(CLT) displays somewhat better results that the benchmark (CRR) strategy with equivalent maturity in this five year investment horizon benchmark case. Also, the spread between LT and ST real returns has narrowed to the point where hardly any sign can clearly be given to it. The following Table 3 presents the general performance results for our key durations:
1990 1992 1994 1996 1998 2000 2002 2004 2006-3
-2
-1
0
1
2
3
4
5
6
7
Start Date
%
LT vs. ST 5Y BS-priced Real Performance
RST
CLT
1990 1992 1994 1996 1998 2000 2002 2004 2006-1
0
1
2
3
4
5
6
Start Date
%
Comparative 5Y Performance of Headline vs. Core Benchmark for BS
CRR
CLT

Swapping Headline for Core Inflation: an ALM Approach
19
Table 3: BS results
Horizon 1 Y 2Y 5Y 10Y
ST Portfolio RST RRR RST RRR RST RRR RST RRR
Mean 1.59% 2.07% 2.10% 2.41% 3.26% 2.83% 5.26% 3.72%
Std. 2.13% 1.84% 2.15% 1.33% 2.02% 1.33% 1.27% 1.04%
IR ‐0.251 ‐0.187 0.329 1.134
Ex‐post max Real Premium
‐0.47% ‐0.31% 0.43% 1.54%
LT Portfolio CLT CRR CLT CRR CLT CRR CLT CRR
Mean 2.07% 2.07% 2.49% 2.41% 3.00% 2.83% 3.66% 3.72%
Std. 2.05% 1.84% 1.71% 1.33% 1.49% 1.33% 1.00% 1.04%
IR 0.003 0.059 0.162 ‐0.069
Ex‐post min Risk Premium
‐0.01% ‐0.09% ‐0.16% 0.06%
The option derived pricing seems in effect to be much better at factoring in the risk premium as our LT alternative strategy is above its benchmark except for the 10 year case for which the IR is very slightly negative. The ten year case negative result should be taken with precaution since our sample size makes this last caveat probably not that strong: a much longer sample or a simulation exercise would be needed to attain the necessary length in order to have significantly robust statistical result. The ST performance seems to suffer slightly for very short durations (under two years) but still outperforms its benchmark above that horizon. Overall, we once again have a strong case for our strategy over medium horizons and less good over very short horizons if we consider the ex-post min-max risk-premium range.

20
Conclusion
Inflation hedging for long-term investors has remained an elusive problem despite the introduction of inflation linked securities in the bond market in the early eighties, followed by indexed swaps in the derivative market at the turn of the millennia. Even if these novel asset classes have become mainstream tools for institutional investors like insurance companies and pension funds, long-term investors have been left grappling with diminishing real returns and insufficient liquidity to match their liabilities. Forays into alternative hedging strategies involving exotic asset classes and complex products has long been held for good reasons as a receipt for disaster as institutional investors never truly should have a mandate to invest in hedging strategies too far from their liabilities. And indeed, as the perfect financial storm hit at the end of the decade, many were probably left wondering why they ever had attempted such an endeavor, even if the dismal performance of linkers could have provided a comfort of some sort, though obviously not to their claimants.
Considering the previously exposed econometric arguments, and the sobering counter-performance of linkers and alternatives alike in the last decade, this paper proposes a new kind of approach to long-term inflation hedging in the form of a differentiation of benchmark between long and short-term investors. In light of the results presented, our novel strategy consisting of an investment in nominal assets for short duration and buying the volatile fraction of the inflation index makes sense for short-term investors while investing in linkers and selling the spread for long-term hedgers turn out to be a clear enhancement of the pure linker strategy which is currently the benchmark of the industry.
Again, as we clearly laid out in the paper, the market for such a derivative might not be in equilibrium and would require an intermediation in the form of market makers. These traders would need an investable underlier for the swap to hedge their residual position. As the core inflation index is currently not investable but the swap spread used in the security has been shown to be strongly correlated to commodities, a cross-correlation approach might be relevant and offers interesting opportunities for traders who would deal the core-headline swap presented here. Exploring this novel trading strategy would be an interesting natural extension of this paper.

Swapping Headline for Core Inflation: an ALM Approach
21
Appendix
Graphs of the synthetic futures pricing of the security for other maturities
Figure 8: SR pricing of the swap rate over a 1-year horizon
Figure 9: SR pricing of the swap rate over a 2-year horizon
1990 1992 1994 1996 1998 2000 2002 2004 2006 2008 2010 2012-3
-2
-1
0
1
2
3
4
5
6
7
Start Date
%
LT vs. ST 1Y SR-priced Real Performance
SSR
SLC
1990 1992 1994 1996 1998 2000 2002 2004 2006 2008 2010 1990-3
-2
-1
0
1
2
3
4
5
6
7
Start Date
%
Comparative 1Y Performance of Headline vs. Core Benchmark for SR
CRR
SLC
1990 1992 1994 1996 1998 2000 2002 2004 2006 2008 2010-2
-1
0
1
2
3
4
5
6
Start Date
%
LT vs. ST 2Y SR-priced Real Performance
SSR
SLC
1990 1992 1994 1996 1998 2000 2002 2004 2006 2008 2010-2
-1
0
1
2
3
4
5
6
Start Date
%
Comparative 2Y Performance of Headline vs. Core Benchmark for SR
CRR
SLC

22
Figure 10: SR pricing of the swap rate over a 10-year horizon
Graphs of the Black-Scholes pricing of the security for other maturities
Figure 11: BS pricing of the swap rate over a 1-year horizon
1990 1992 1994 1996 1998 2000 2002-1
0
1
2
3
4
5
6
7
8
9
Start Date
%
LT vs. ST 10Y SR-priced Real Performance
SSR
SLC
1990 1992 1994 1996 1998 2000 2002-1
0
1
2
3
4
5
6
Start Date
%
Comparative 10Y Performance of Headline vs. Core Benchmark for SR
CRR
SLC
1990 1992 1994 1996 1998 2000 2002 2004 2006 2008 2010 2012-6
-4
-2
0
2
4
6
8
Start Date
%
LT vs. ST 1Y BS-priced Real Performance
RST
CLT
1990 1992 1994 1996 1998 2000 2002 2004 2006 2008 2010 2012-4
-2
0
2
4
6
8
Start Date
%
Comparative 1Y Performance of Headline vs. Core Benchmark for BS
CRR
CLT

Swapping Headline for Core Inflation: an ALM Approach
23
Figure 12: BS pricing of the swap rate over a 2-year horizon
Figure 13: BS pricing of the swap rate over a 10-year horizon
1990 1992 1994 1996 1998 2000 2002 2004 2006 2008 2010-6
-4
-2
0
2
4
6
8
Start Date
%
LT vs. ST 2Y BS-priced Real Performance
RST
CLT
1990 1992 1994 1996 1998 2000 2002 2004 2006 2008 2010-2
-1
0
1
2
3
4
5
6
7
Start Date
%
Comparative 2Y Performance of Headline vs. Core Benchmark for BS
CRR
CLT
1990 1992 1994 1996 1998 2000 20020
1
2
3
4
5
6
7
8
9
Start Date
%
LT vs. ST 10Y BS-priced Real Performance
RST
CLT
1990 1992 1994 1996 1998 2000 20020
1
2
3
4
5
6
Start Date
%
Comparative 10Y Performance of Headline vs. Core Benchmark for BS
CRR
CLT

24
References
Bank of Korea. (2006, September). Monetary policy report. 71-73.
Bermingham, C. (2007, Winter). How Useful is Core Inflation for Forecasting Headline Inflation? The Economic and Social Review, 355–377.
Black, F., & Scholes, M. (1973). The Pricing of Options and Corporate Liabilities. Journal of Political Economy, 81, 637-654.
Blanchard, O. J., & Gali, J. (2007, September). The Macroeconomic Effects of Oil Shocks: Why are the 2000s So Different from the 1970s? NBER Working Paper(13368).
Farmer, R. E. (2011, October). The Stock Market Crash of 2008 Caused the Great Recession: Theory and Evidence. (NBER, Ed.) NBER Working Paper(17479), pp. 1-37.
Fulli-Lemaire, N. (2012, October 15). Allocating Commodities in Inflation Hedging Portfolios: A Core Driven Global Macro Strategy. Retrieved from SSRN Working Paper: http://ssrn.com/abstract=2028988
Gelos, G., & Ustyugova, Y. (2012, September). Inflation Responses to Commodity Price Shocks – How and Why Do Countries Differ? IMF Working Paper, 1-31.
Gregorio, J. D. (2012, April). Commodity Prices, Monetary Policy and Inflation. Retrieved from IMF Working Papers: http://www.imf.org/external/np/seminars/eng/2011/tur/pdf/JDeG.pdf
Hamilton, J. D. (1983, April). Oil and the Macroeconomy since World War II. Journal of Political Economy, 91(2), 228-248.
Hooker, M. A. (1999). Oil and the Macroeconomy Revisited. Working Papers -- U.S. Federal Reserve Board's Finance & Economic Discussion Series, 1-24.
Korn, R., & Kruse, S. (2004). A simple model to value inflation-linked financial products. (Springer, Ed.) Blatter der, XXVI(3), 351-367.
Li, A., & Zeng, S. (2012, August 6). DB Core US CPI Index. (D. Bank, Ed.) DB Fixed Income Special Report, pp. 1-8.
Mankikar, A., & Paisley, J. (2002, Winter ). What do Measures of Core Inflation Really Tell Us? Bank of England Quarterly Bulletin.
McCauley, R. N. (2007, March 15). Core versus headline inflation targeting in Thailand. Retrieved from BIS Working Paper: http://www.bis.org/repofficepubl/arpresearch200609.2.pdf

Swapping Headline for Core Inflation: an ALM Approach
25
Mishkin, F. S., & Schmidt-Hebbel, K. (2007, July). One Decade of Inflation Targeting in the World: What Do We Know and What Do We Need to Know? NBER Working Paper. Retrieved from NBER Working papers: http://www.nber.org/papers/w8397
Stock, J. H., & Watson, M. W. (2003). Has the Business Cycle Changed and Why? In M. Gertler, & K. Rogoff (Eds.), NBER Macroeconomics Annual 2002 (Vol. 17, pp. 159-230). MIT Press.
Todd, E. ,., & Stephen, J. ,. (2010, October). Time Variation in the Inflation Passthrough. Journal of Money, Credit and Banking, 42(7).
van den Noord, P., & André, C. (2007). Why has Core Inflation Remained so Muted in the Face of the Oil Shock. OECD Papers, 7(4), 1-34.
Walsh, J. P. (2011, April). Reconsidering the Role of Food Prices in Inflation. Retrieved from IMF Working Paper: http://www.imf.org/external/pubs/ft/wp/2011/wp1171.pdf
Wynne, M. A. (1999, June). Core Inflation: A Review of Some Conceptual Issues. Retrieved from Federal Reserve Bank of Dallas, Research Department Working Paper: http://www.dallasfed.org/assets/documents/research/papers/1999/wp9903.pdf

26
List of Figures
Figure 1: Core vs. Headline inflation in the US over a 50-year period ......................................................... 5 Figure 2: Core vs. Headline Inflation in the US over the last decade ........................................................... 6 Figure 3: Breakdown of the variance of the realized inflation into core and non-core components ............. 8 Figure 4: PFE pricing, LT vs. ST and vs. Benchmark real performance for a 5-year horizon .................... 11 Figure 5: Futures based pricing, LT vs. ST and vs. Benchmark real performance for a 5-year horizon .... 13 Figure 6: Core vs. Headline Cap/Floor risk profile ..................................................................................... 16 Figure 7: BS pricing, LT vs. ST and vs. Benchmark real performance for a 5 year horizon ...................... 18 Figure 8: SR pricing of the swap rate over a 1-year horizon ....................................................................... 21 Figure 9: SR pricing of the swap rate over a 2-year horizon ....................................................................... 21 Figure 10: SR pricing of the swap rate over a 10-year horizon ................................................................... 22 Figure 11: BS pricing of the swap rate over a 1-year horizon ..................................................................... 22 Figure 12: BS pricing of the swap rate over a 2-year horizon ..................................................................... 23 Figure 13: BS pricing of the swap rate over a 10-year horizon ................................................................... 23
List of Tables
Table 1: ILB + Swap vs. ILB for LT investors in the perfect foresight environment ................................. 12 Table 2: ILB + Swap vs. ILB for LT investors in using simulated futures for pricing ............................... 14 Table 3: BS results ...................................................................................................................................... 19