swedish university of agricultural sciences - slu.se · organblodflöden laboratoriedjur...
TRANSCRIPT

Sveriges lantbruksuniversitet Fakulteten för veterinärmedicin och husdjursvetenskap
PHYSIOLOGICAL RANGES AND VARIABILITY IN ORGAN BLOOD FLOW IN LABORATORY ANIMALS
Camilla Anger
Självständigt arbete i veterinärmedicin, 15 hp
Veterinärprogrammet, examensarbete för kandidatexamen Nr. 2014: 09
Institutionen för biomedicin och veterinär folkhälsovetenskap
Uppsala 2014

Sveriges lantbruksuniversitet Fakulteten för veterinärmedicin och husdjursvetenskap
Physiological ranges and variability in organ blood flow in laboratory animals Inventering av fysiologiska organblodflöden och variabilitet hos försöksdjur Camilla Anger Handledare: Johan Gabrielsson, SLU, Institutionen för biomedicin och veterinär folkhälsovetenskap Examinator: Eva Tydén, SLU, Institutionen för biomedicin och veterinär folkhälsovetenskap Omfattning: 15 hp Kurstitel: Självständigt arbete i veterinärmedicin Kurskod: EX0700 Program: Veterinärprogrammet Nivå: Grund, G2E Utgivningsort: SLU Uppsala Utgivningsår: 2014
Omslagsbild: Hämtad från xkcd.com Serienamn, delnr: Veterinärprogrammet, examensarbete för kandidatexamen Nr. 2014: 09
Institutionen för biomedicin och veterinär folkhälsovetenskap, SLU
On-line publicering: http://epsilon.slu.se
Nyckelord: organblodflöden laboratoriedjur farmakokinetik regionala blodflöden scaling fysiologiska parametrar Key words: organ blood flow, cardiac output, laboratory animals, scaling, physiologically based pharmacokinetics, microspheres, physiological parameters

CONTENTS
Physiological Ranges and Variability in Organ Blood Flow in Laboratory Animals ................ 1
Summary ................................................................................................................................ 1
Sammanfattning ..................................................................................................................... 2
Introduction ............................................................................................................................ 3
Material & methods ................................................................................................................ 3
Review of literature ................................................................................................................ 5
Discussion ............................................................................................................................ 14
Conclusion ........................................................................................................................ 18
References ............................................................................................................................ 19

Summary
Background: Organ blood flow rates are useful in allometric scaling and for the application of Physiologically Based Pharmacokinetic Modeling (PBPK). These models are typically used for extrapolating pharmacokinetic data across different species, which has important applications in drug discovery and safety assessment. Therefore, it is also essential to consider the natural variability in the physiological parameters of animals. The objective of this literature survey is to provide such data on how organ blood flow rates can vary in our most common laboratory animals. Method: A literature survey was done in scientific databases. Data on organ blood flow rates were compiled from review articles and clinical studies. Primarily blood flow rates from healthy, unaffected animals were included. Since there is a great variation in measuring techniques, only the most commonly used methods were included to ensure comparability of data across different studies. Blood flow rates are presented in units of ml∙min-1. Recalculations were done whenever necessary. There is an inconsistency in nomenclature of organ blood flow rates, particularly of hepatic and gastrointestinal blood flow rates. Results: Blood flow rates from articles are compiled in the result section. Blood flow rates from major organs and tissues from mouse, gerbil, hamster, rat, marmoset, guinea pig, rabbit, Rhesus monkey, dog, pig, sheep and man are presented in Tables 1-12. Ranges of blood flow rates are presented in Table 13. Discussion: Since very few studies could be obtained on marmoset, gerbil and guinea pig organ blood flow rates, more studies on these animals are needed. A greater variation of study methods in other species is also desired. Studies on blood flow rates in both conscious and anesthetized animals are needed because anesthetics are commonly used in many pharmacological experiments. A stringent evaluation of measuring technique is essential for assessment of the validity of data. All studies have taken precautions to eliminate various sources of experimental error. The microsphere technique is the most common method for measuring organ blood flow. The technique may give misleading blood flow rates in smaller laboratory animals (mouse, hamster) because of its invasiveness. Cannulation of two arteries and catheterization of the heart may affect circulation in animals with smaller arteries. Variability in organ blood flow rates originate from both biological variations within and between individuals as well as from extrinsic variation due to protocol design, measuring technique and data assessment.
1

Sammanfattning
Bakgrund: Organblodflöden kan användas vid allometric scaling och i Physiologically Based Pharmakinetic Modeling (PBPK), som kan användas för att extrapolera data från ett djurslag till ett annat. Det har viktiga applikationer inom toxikologiska studier av läkemedelssubstanser och toxiner. För att resultatet från modellerna ska vara så verklighetstrogna som möjligt är det viktigt att ha den naturliga variabiliteten hos försöksdjuren i åtanke. Syftet med literaturstudien är att ge en lättillgänglig sammanställning av de värden som organblodflöden hos de vanligaste försöksdjuren kan variera mellan. Metod: En literatursökning genomfördes i vetenskapliga databaser. Från sökresultaten sammanställdes organblodflödesvärden från review-artiklar och kliniska studier. Från de kliniska studierna användes Baseline- eller kontrollvärden. Endast värden från friska, opåverkade djur togs med. Eftersom det finns viss variation i mätmedor som används i literaturen togs beslut att endast inkludera de mer kända mätmetoderna för att få mer jämförbara värden. Blodflödesvärdena presenteras i enhet ml∙min-1. Viss inkonsekvens råder i nomenklaturen. Framförallt mag/tarmkanalen och leverns blodflödesvärden namnges olika i olika studier. Vid tvekan utelämnades oklart definerat värden från studien. Resultat: Blodflödesvärden från samtliga utvalda artiklar sammanställs under resultat. Värden från de största organ från mus, gerbil, hamster, råtta, marmoset, marsvin, kanin, rhesusapa, hund, gris, får och människa presenteras i tabell 1 – 12. De funna intervallen presenteras för alla djurslag i tabell 13. Diskussion: Det hade varit önskvärt att ha med fler studier som underlag för vissa av djurslagen (marmoset, gerbil, marsvin). Det hade även varit önskvärt med större variation i studiemetod hos andra djurslag, till exempel studier från både sövda och vakna djur (hund). Det är viktigt att artiklarna har utvärderat sin mätmetod för att eliminera felkällor i mätningen, alla inkluderade artiklar har visat att deras mätmetod är tillförlitlig. Microsphere-tekniken är den vanligaste mätmetoden bland de valda studierna. Hos riktigt små försöksdjur (mus, hamster) kan man ifrågasätta om inte mätmetoden i sig påverkar de fysiologiska blodflödena. Microsphere-tekniken medför kanylsättning i två artärer och isättning av hjärtkateter vilket kan påverka cirkulationen hos djur med små artärer. Variationen hos de funna värdena grundar sig både i biologisk variation i och mellan individer och i variationen som kommer från studieprotokoll, mätteknik, tolkning och beräkningar.
2

Introduction
Pharmacokinetics is the study of all steps from absorption to elimination of a foreign substance in vivo. It can be paraphrased as what the body does to the drug. Knowledge of pharmacokinetic parameters is crucial in safety studies, drug candidate selection or for an optimal dose calculation. In vivo data on absorption and elimination of a substance can be applied to in silico models to predict the behavior of the substance in man. One of these widely used models is physiologically based pharmacokinetic (PBPK) modeling. PBPK modeling divides the animal model into actual realistic physiological compartments which represents different organs and tissues. PBPK models require data on physiological parameters for all compartments included in the system in order to accurately predict substance behavior (Clewell and Clewell Iii, 2008). Organ blood flow rates are one of these systemic-specific properties (Rowland et al., 2011). Organ blood flow rates are also of interest in allometric scaling. “Allometry (literally `of another measure’) describes the disproportionate changes in shape, size or function that are observed when comparing separate isolated features in animals spanning a range of body sizes” (Lindstedt and Schaeffer, 2002). This means that in allometry one relates body weight to a physiological parameter such as clearance or blood flow. The theory is that a physiological parameter Y often can be expressed as a power function in the form
𝑌 = 𝑎 ∗ 𝑀𝑏
where M is body mass, and a (intercept) and b (allometric coefficient) are parameters obtained from empirical studies (Lindstedt and Schaeffer (2002), Upton (2008), Gabrielsson and Hjorth (2012)). Organ blood flow rates from multiple animals can be analyzed with regression analysis which gives the allometric coefficient for organ blood flow rates. Allometric equations can predict physiological information in species from which data is difficult to obtain. They can be used to extrapolate drug doses across different species. While organ blood flow rates are abundant for the most common laboratory species, such data is lacking for some of the new animal models. There is need for information on how blood flow rates vary within and across species. In order to provide more accurate models, natural variability in organ blood flow rates need to be considered. The objective of this study is to provide accessible information on the naturally occurring intervals of organ blood flow rates for the most commonly applied laboratory animals, such as mouse, gerbil, hamster, rat, marmoset, guinea pig, rabbit, Rhesus monkey, dog, sheep and pig. Material & methods
Literature search
A literature survey was done using the online databases PubMed, Web of Science, Scopus and PrimateLit. The article and literature search function at the SLU library was also used. Search
3
terms used were variations of “organ [or cardiac/hepatic/renal etc.] blood flow” AND [animal species], which yielded the majority of articles reviewed. Another set of search terms that proved successful were “Physiological parameters” AND [animal species]. In compliance with the limited number of articles allowed, review articles have been used to a larger extent. Gabrielsson and Hjorth (2012) was chosen as the basis of species, organs and rates to extend upon. Exclusion criteria for articles have been studies performed without control groups and studies in which the animals had had any procedure done that would severely impact the physiological state. Studies on prenatal and neonatal subjects were also excluded. However, several articles in which the objective of the study has been to assess organ blood flow rates in animals whose states differ from the normal state (e.g., pregnant females, animals in a resting state) are included. To avoid circular reference, studies cited in provided review articles have been omitted unless specifically selected. Units
Blood flow rates in this study have wherever feasible been presented as blood flow rate in the unit mL∙min-1. Values from these studies have been recalculated to mL∙min-1 when presented. Organ weights from Gabrielsson and Hjorth, 2012 have been used whenever missing in the original publication. Data on skin weights of mice and rhesus monkey were taken from Lindstedt and Schaeffer, 2002 and Lees et al., 1971 respectively. When organ weights are difficult to estimate (e.g. skin and gut) organ blood flow rates are retained and presented as mL∙min-1 ∙100 g tissue-1 for comparison. Inconsistencies
Animal body weights varied across different publications. In species where the differences found were noticeable, body weights are presented with organ blood flow rates. The effect on body weight differences on organ blood flow rates are discussed further below. Presented blood flow rates for skeletal muscle are inconsistent, sometimes referring to blood flow in a specific skeletal muscle and sometimes to total skeletal muscle mass blood flow. When encountered, muscle flow rates are converted to total muscle mass blood flow, or, when impossible, omitted. Adipose tissue demonstrates similar difficulties, sometimes being split into white and brown adipose tissue. Only adipose tissue blood flow rates referring to total adipose tissue blood flow have been included. Gut blood flow rates are sometimes referred to as GI-tract blood flow, or reported as separate stomach and intestine blood flow rates. Gut and GI-tract are read interchangeable terms when likely, while rates called splanchnic blood flow rates have been excluded. Liver blood flow rates are sometimes referred to as hepatic artery and portal venous flow or solely hepatic artery flow. This makes comparison more difficult. The rate has been omitted when likely to refer solely to hepatic artery flow. Hepatic artery and portal blood flow rates have been recalculated to total liver blood flow rate when available.
4
Assessment of organ and tissue perfusion rates
The selected studies span over decades. The earliest comes from 1968. Consequentially, the available methods have evolved. Only studies using Rubidium injection, labeled butanol injections or injection of radioactive microspheres have been included to eliminate sources of error. Detailed description of the microsphere technique have been described elsewhere (Reeves et al., 1988). Since multiple injections of microspheres have been linked to incorrect measurement of splanchnic blood flow rates (Ishise et al., 1980), measurements from the first injection have been chosen when applicable. Review of literature
Review articles
Gabrielsson and Hjorth (2012) presented organ blood flow rates in the most common laboratory animals (i.e. mouse, gerbil, hamster, guinea pig, rat, marmoset, rabbit, Rhesus monkey, dog, mini pig and sheep) as a comparison with human data. Three major review studies of Prothero (1982), Davies and Morris (1993) and Lindstedt and Schaeffer (2002) presented organ blood flow rates of several laboratory animals. Prothero presented liver blood flow rates in dog, rabbit and rat referring to 8, 4 and 3 studies respectively. Studies on pregnant, juvenile, neutered or unhealthy animals were omitted from the data collection. Davies and Morris presented physiological values of mouse, rat, rabbit, dog, Rhesus monkey and human. Values were gathered from studies with similar methodology. Alternative references have been used for validation of data. Each blood flow rate is collected from two or three studies. Lindstedt and Schaeffer presented data of mouse, rat, dog and man. The values were calculated from multiple references. Parameters were given as mL∙min-1 ∙100 g tissue-1, with organ weights also provided as g∙kg-1 to compensate for values given in different formats from a wide range of species. Sheep and pig organ blood flow rates were compiled by Upton (2008) using a unit format of mL∙min-1 ∙100 g tissue-1. Wyler et al. (1979) compiled values from previous studies on the organ blood flow rates of dogs were presented in the discussion section. Values were presented in unit mL∙min-1 ∙100 g tissue-1. In a literature survey of physiologically based pharmacokinetic modelling Gerlowski and Jain (1983) presented blood flow rates for mouse, rat, hamster, dog, rabbit as well as for an unspecified primate strain. Mouse
Organ blood flow rates in BALB/C mice were presented in Gjedde and Gjedde (1980). This study is referenced in Lindstedt and Schaeffer (2002). The values are identical to those in Gerlowski and Jain (1983). The method used was by simultaneous injection of labelled butanol in the femoral vein and extraction of blood in the femoral artery.
5

A control group of 6 mice underwent a mock operation to mimic the trauma of In a clinical study of the effects of trauma and hemorrhage on organ blood flow rates in mice (Wang et al., 1993). Organ blood flow rates were presented in comparison to hemorrhaged and resuscitated mice, as mL∙min-1 ∙100 g tissue-1. Measurements were made using the microsphere method. An early study of the microsphere technique in mice yielded renal and hepatic blood flow rates (Sarin et al., 1990). In a similar study on the microsphere technique, cardiac output and regional blood flow rates to major organs as well as skin and muscle was determined from conscious mice (Barbee et al., 1992) (Table 1). Table 1. Organ blood flow rates (mL· min-1) in the mouse
Reference 1 2 3 4 5 6 7 Brain 0.46 0.47 - 0.39 0.31 - 0.56 Liver 1.80 - 1.10 0.95 3.50 2.60 - Kidneys 1.30 2.06 0.80 0.42 2.72 2.50 1.79 Heart 0.28 0.93 0.28 - 0.63 - 1.15 Spleen 0.09 - 0.05 0.05 0.08 - - Gut 1.50 - 0.90 - 2.03 - - Muscle 0.91 2.14 0.50 - 2.76 - 1.95 B. Marrow 0.37 - 0.17 - - - - Adipose tiss. - - - - - - - Skin 0.41 0.86 - - 0.42 - 1.33
1 - Gabrielsson and Hjorth (2012), 2 - Lindstedt and Schaeffer (2002), 3 - Gerlowski and Jain (1983), 4 - Gjedde and Gjedde (1980), 5 - Wang et al. (1993), 6 - Sarin et al. (1990), 7 - Barbee et al. (1992) Gerbil
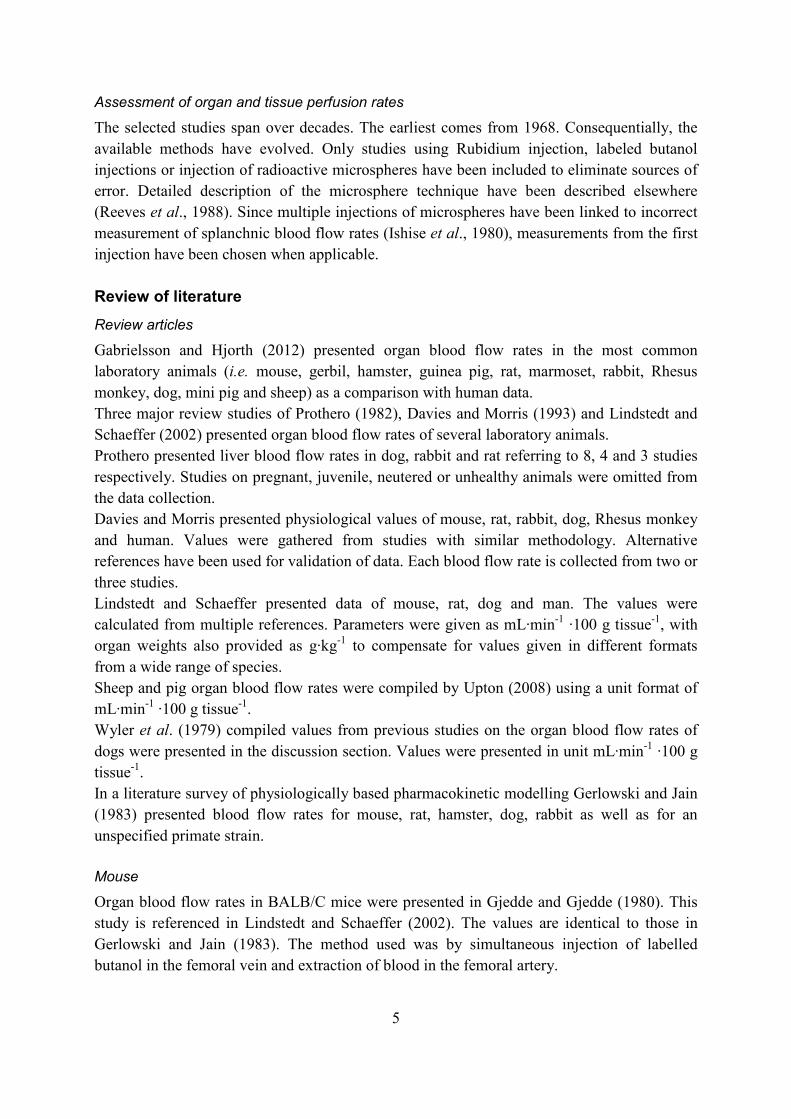
Adult Mongolian gerbils were studied under anesthesia using a modified microsphere technique (Matsumoto et al., 1982). Blood flow rates are presented for all major organs, as well as bone and muscle (Table 2).
6
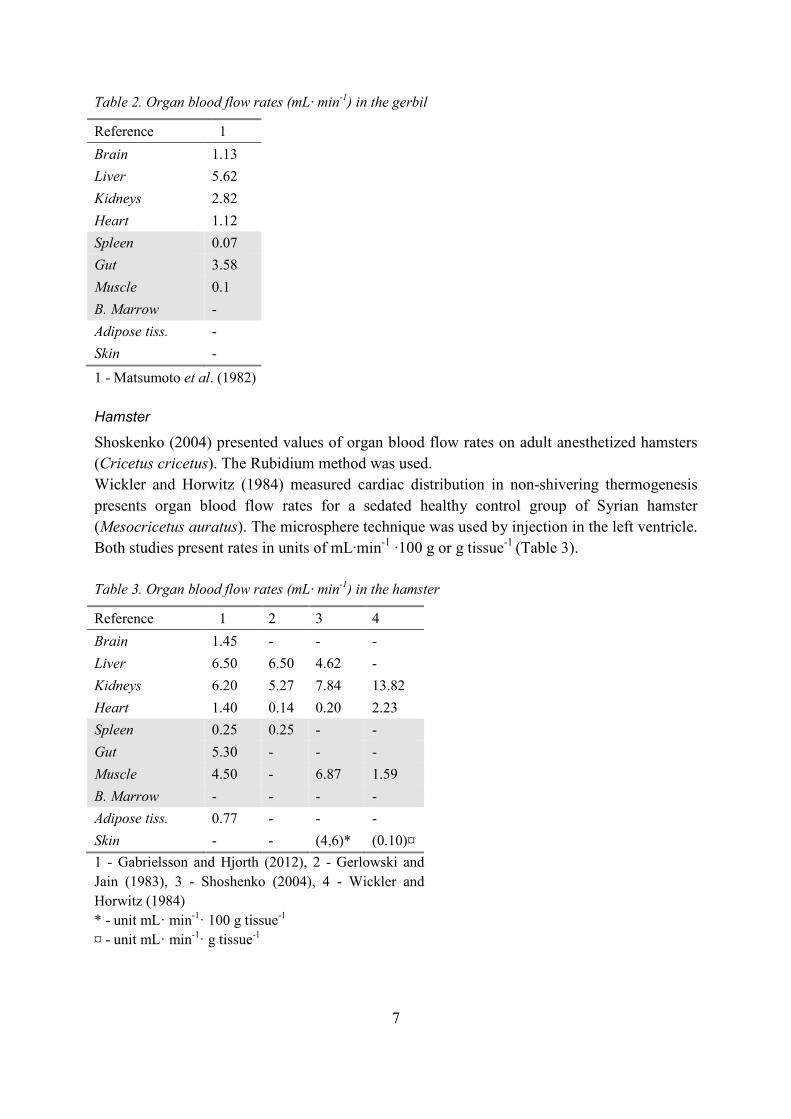
Table 2. Organ blood flow rates (mL· min-1) in the gerbil
Reference 1 Brain 1.13 Liver 5.62 Kidneys 2.82 Heart 1.12 Spleen 0.07 Gut 3.58 Muscle 0.1 B. Marrow - Adipose tiss. - Skin -
1 - Matsumoto et al. (1982) Hamster
Shoskenko (2004) presented values of organ blood flow rates on adult anesthetized hamsters (Cricetus cricetus). The Rubidium method was used. Wickler and Horwitz (1984) measured cardiac distribution in non-shivering thermogenesis presents organ blood flow rates for a sedated healthy control group of Syrian hamster (Mesocricetus auratus). The microsphere technique was used by injection in the left ventricle. Both studies present rates in units of mL∙min-1 ∙100 g or g tissue-1 (Table 3). Table 3. Organ blood flow rates (mL· min-1) in the hamster
Reference 1 2 3 4 Brain 1.45 - - - Liver 6.50 6.50 4.62 - Kidneys 6.20 5.27 7.84 13.82 Heart 1.40 0.14 0.20 2.23 Spleen 0.25 0.25 - - Gut 5.30 - - - Muscle 4.50 - 6.87 1.59 B. Marrow - - - - Adipose tiss. 0.77 - - - Skin - - (4,6)* (0.10)¤ 1 - Gabrielsson and Hjorth (2012), 2 - Gerlowski and Jain (1983), 3 - Shoshenko (2004), 4 - Wickler and Horwitz (1984) * - unit mL· min-1· 100 g tissue-1 ¤ - unit mL· min-1· g tissue-1
7

Rat
Ishise et al (1980) used the microsphere technique for conscious rat organ blood flow rates for all major organ systems was measured in conscious rats. Tsuchiya et al. (1978) measured blood flow rates in two groups of conscious rats. Anesthetized rats were used as a control group in a study of traumatic head injury and organ blood flow (Yuan et al., 1990). The blood flow rates for heart, liver, spleen and kidneys are presented in mL∙min-1 ∙100 g tissue-1. A study on thoracic epidural anesthesia had a control group of anesthetized rats with blood flow rates of major organ groups presented in mL∙min-1 ∙100 g tissue-1 (Schaeper et al., 2010). In a study of aortic core temperature and its relation to organ blood flow rates in the rat blood flow rates of the kidney, liver, GI-tract, skin, muscle and fat were measured in healthy anesthetized rats during their natural warming or cooling cycle (Closa et al., 1993). The effect of food restriction on lactating rat dams was studied with a control group of lactating (day 14 after parturition) female rats, yielding blood flow rates for kidney, liver and GI-tract (Sakanashi et al., 1987) (Table 4). All studies used the microsphere method for measuring blood flow rates Table 4. Organ blood flow rates (mL· min-1) in the rat
Reference 1 2 3 4 5 6 7 8 9 10 11 12
Brain 1.3 0.7 - 1.0 1.7 1.9 1.5 - 3.4 - - -
Liver 13.8 - 19.4 - 19.3 18.9 18.5 - - 32.1 20.1 -
Kidneys 9.2 4.0 - 12.8 17.6 20.0 21.9 8.6 10.9 16.7 7.6 8.3
Heart 3.9 1.5 - 1.6 3.9 5.6 6.1 2.8 3.8 - - -
Spleen 0.6 - - 1.0 1.4 0.8 0.5 2.6 0.8 - - -
Gut 7.5 14.2 - 14.6 - - - - - - - 16.7
Muscle 7.5 7.2 - 22.4 2.8 0.6 0.8 - 9.6 18.9 7.5 -
B. Marrow - - - - - - - - - - - -
Adipose tiss 0.4 1.2 - 3.6 - - - - - - - -
Skin 5.8 2.1 - - 3.4 - - - - 8.5 3.7 -
Mean body weight in brackets 1 - Davies and Morris (1993) [250 g], 2 - Lindstedt and Schaeffer (2002) [345 g], 3 – Prothero (1982) [245 g], 4 - Gerlowski and Jain (1983) [500 g], 5 - Ishise et al. (1980) [371 g], 6, 7 - Tsuchiya et al. (1978) [473 g , 447 g], 8 - Yuan et al. (1990) [440 g], 9 - Schaeper et al. (2010) [320 g], 10 - Closa et al. (1993) [warming, 185 g], 11 - Closa et al. (1993) [cooling, 185 g], 12 - Sakanashi et al. (1987) [undisclosed weight] Marmoset
Gabrielsson and Hjorth, 2012 presented the only Marmoset organ blood flow rates that could be obtained (Table 5).
8
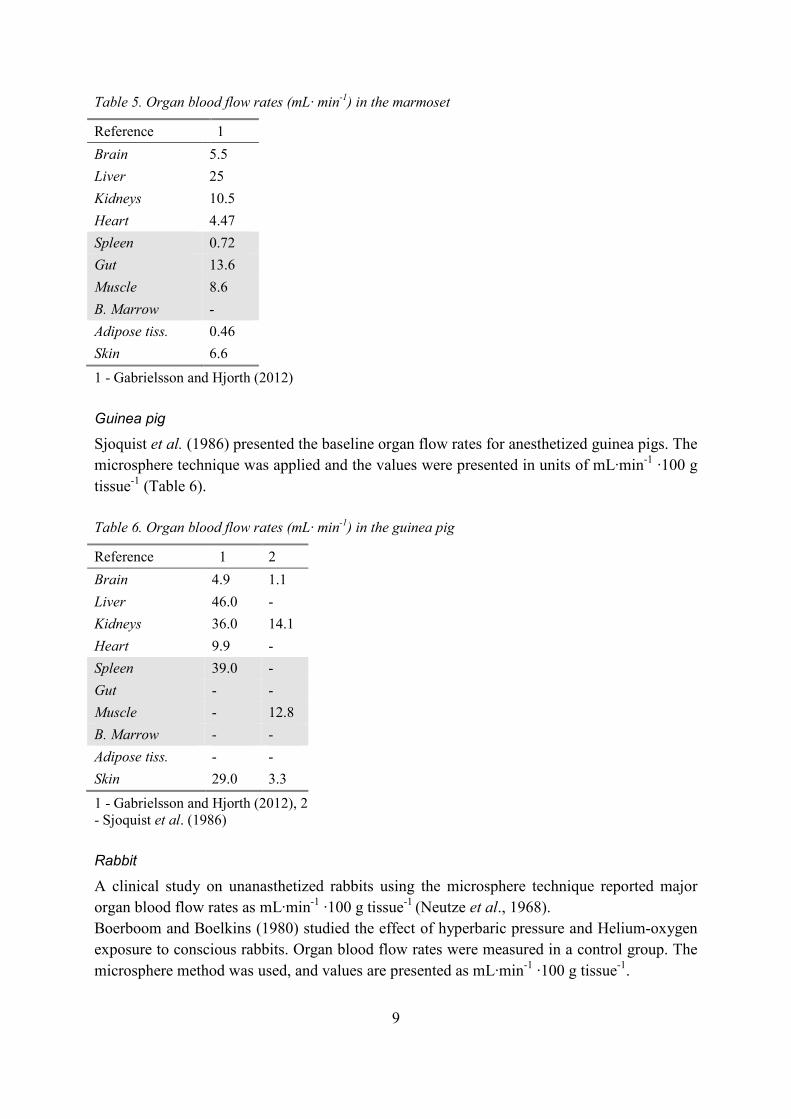
Table 5. Organ blood flow rates (mL· min-1) in the marmoset
Reference 1 Brain 5.5 Liver 25 Kidneys 10.5 Heart 4.47 Spleen 0.72 Gut 13.6 Muscle 8.6 B. Marrow - Adipose tiss. 0.46 Skin 6.6
1 - Gabrielsson and Hjorth (2012) Guinea pig
Sjoquist et al. (1986) presented the baseline organ flow rates for anesthetized guinea pigs. The microsphere technique was applied and the values were presented in units of mL∙min-1 ∙100 g tissue-1 (Table 6). Table 6. Organ blood flow rates (mL· min-1) in the guinea pig
Reference 1 2 Brain 4.9 1.1 Liver 46.0 - Kidneys 36.0 14.1 Heart 9.9 - Spleen 39.0 - Gut - - Muscle - 12.8 B. Marrow - - Adipose tiss. - - Skin 29.0 3.3
1 - Gabrielsson and Hjorth (2012), 2 - Sjoquist et al. (1986) Rabbit
A clinical study on unanasthetized rabbits using the microsphere technique reported major organ blood flow rates as mL∙min-1 ∙100 g tissue-1 (Neutze et al., 1968). Boerboom and Boelkins (1980) studied the effect of hyperbaric pressure and Helium-oxygen exposure to conscious rabbits. Organ blood flow rates were measured in a control group. The microsphere method was used, and values are presented as mL∙min-1 ∙100 g tissue-1.
9

Reeves et al. (1988) compared organ blood flow rates in untreated versus saline-treated conscious and unconscious rabbits using the microsphere technique. Organ blood flow rates from the untreated conscious rabbits were presented as percentage of cardiac output. Jones and Parker (1988) studied the organ blood flow rates of conscious lactating rabbits were studied using the Rubidium technique (Table 7). Table 7. Organ blood flow rates (mL· min-1) in the rabbit
Reference 1 2 3 4 5 6 7 Brain - - - 11 11 - -
Liver 177 177 144 136 - 89 148 Kidneys 80 80 - 70 40 72 96 Heart 16 16 - 13 13 - 11
Spleen 9 9 - 9 4 1 -
Gut 111 111 - 111 - 62 202
Muscle 155 155 - 155 70 - - B. Marrow 24 11 - - - - - Adipose tiss. 32 - - (26,5)* - - -
Skin - - - (13.7)* - - -
1 - Gabrielsson and Hjorth (2012), 2 - Gerlowski and Jain (1983), 3 – Prothero (1982), 4 - Neutze et al. (1968), 5 - Boerboom and Boelkins (1980), 6 - Reeves et al. (1988), 7 - Jones and Parker (1988) * - unit mL· min-1· 100 g tissue-1
Rhesus monkey
Organ blood flow rates from conscious restrained Rhesus monkeys were presented by Forsyth et al. (1968). A comparative study on Rhesus monkey organ blood flow in fetal, newborn and adult subjects presented values for the major organs as a percentage of cardiac output (Behrman and Lees, 1971). A study on effects on regional blood flow rates on avoidance training presented baseline values in units of mL∙min-1 ∙100 g tissue-1 (Forsyth, 1971). Blood flow rates were obtained from two separate groups of rhesus monkeys under epidural anesthesia (Sivarajan et al., 1976). In a similarly performed study on spinal anesthesia, organ blood flow rates of two groups of rhesus monkeys were presented (Sivarajan et al., 1975). Hypotension-inducing drugs were studied in monkeys (Sivarajan et al., 1985). The units of blood flow rates were given as mL∙min-1∙100 g tissue-1 in studies by Sivarajan. Values for organ blood flow from a control group of conscious rhesus monkeys were presented in a study on halothane anesthesia (Lees et al., 1971). Values were presented as mL∙min-1 ∙100 g tissue-1. All studies on rhesus monkeys used radioactive microsphere technique for measuring organ blood flow rates (Table 8)
10

Table 8. Organ blood flow rates (mL· min-1) in the Rhesus monkey
Reference 1 2 3 4 5 6 7 8 9 10 11
Brain 72 - 72 72 73 74 54 55 64 101 75
Liver 218 92 - 218 - 396 318 300 311 95 -
Kidneys 138 74 88 138 239 245 175 172 240 203 85
Heart 60 65 96 60 71 95 66 55 71 27 99
Spleen 21 - 33 21 22 - - - - - 3
Gut 125 75 77 126 200 - - - - - 75
Muscle 90 50 - - 675 - - - - - -
B. Marrow 51 23 - - - - - - - - -
Adipose tiss. 20 - - - - - - - - - -
Skin 54 - - 54 238 - - - - 129 53
Body weights in brackets 1 - Gabrielsson and Hjorth (2012) [5 kg], 2 - Gerlowski and Jain (1983) [5 kg], 3 - Behrman and Lees (1971) [7,9 kg], 4 - Forsyth et al. (1968) [4,1 kg], 5 – Forsyth (1971) [3,8-4,7 kg], 6,7 - Sivarajan et al. (1976) [3,9-7,4 kg], 8,9 - Sivarajan et al. (1975) [4,9-8,4 kg], 10 - Sivarajan et al. (1985) [5,6-7,1 kg], 11 - Lees et al. (1971) [undisclosed weight] Dog
Zwissler et al. (1991) used the microsphere technique on anesthetized dogs. Fan et al. (1979) studied shunting of blood flow rates by means of the microsphere technique in anesthetized dogs. Organ blood flow rates from anesthetized dogs during hypothermia were studied by Kawashima et al. (1976). The microsphere technique was used in all clinical studies. All organ blood flow rates were presented in unit mL∙min-1 ∙ g or 100 g tissue-1. Organ blood flow rates in dogs are presented in Table 9.
11

Table 9. Organ blood flow rates (mL· min-1) in the dog
Reference 1 2 3 4 5 6 7 8 9 Brain 45 48 - - - - 28 - 68 Liver 309 - 396 208 470 - - - - Kidneys 216 365 - 180 180 90 105 216 318 Heart 54 147 - 80 80 60 72 - 122 Spleen 25 - - 20 20 14 15 37 25 Gut 216 - - - - 82 - - - Muscle 250 511 - 414 874 138 460 - 400 B. Marrow 37 - - - - 20 - - - Adipose tiss. 35 - - (2)* (30)* - - - - Skin 100 149 - (7)* (7)* - - - (6)*
Body weights in brackets 1 - Gabrielsson and Hjorth (2012) [10 kg], 2 - Lindstedt and Schaeffer (2002) [18 kg], 3 – Prothero (1982) [10 kg], 4, 5 - Wyler et al. (1979) [undisclosed weight] – min (4) and max (5) values, 6 - Gerlowski and Jain (1983) [12 kg], 7 - Zwissler et al. (1991) [19 kg], 8 - Fan et al. (1979) [20-25 kg], 9 - Kawashima et al. (1976) [14 kg] * - unit mL· min-1· 100 g tissue-1 Mini pig
Data from resting, conscious standard pigs were presented in a study (Tranquilli et al., 1982). Method of measurement was the microsphere technique. Organ blood flow rates were presented in unit mL∙min-1 ∙100 g tissue-1 (Table 10). Table 10. Organ blood flow rates in the pig and mini pig (in mL· min-1)
Reference 1 2 3 4 Brain 61 37 61 65 Liver 419 189 629 - Kidneys 293 122 288 649 Heart 73 35 89 - Spleen 34 23 - 235 Gut 293 132 - 937 Muscle 339 - 520 - B. Marrow 50 - - - Adipose tiss. 47 - 360 - Skin 136 36 - - Organ weights in brackets 1 - Gabrielsson and Hjorth (2012) [15 kg], 2 - Wyler et al. (1979) [3 kg], 3 - Upton (2008) [25 kg], 4 - Tranquilli et al. (1982) [37.1 kg]
12
Sheep
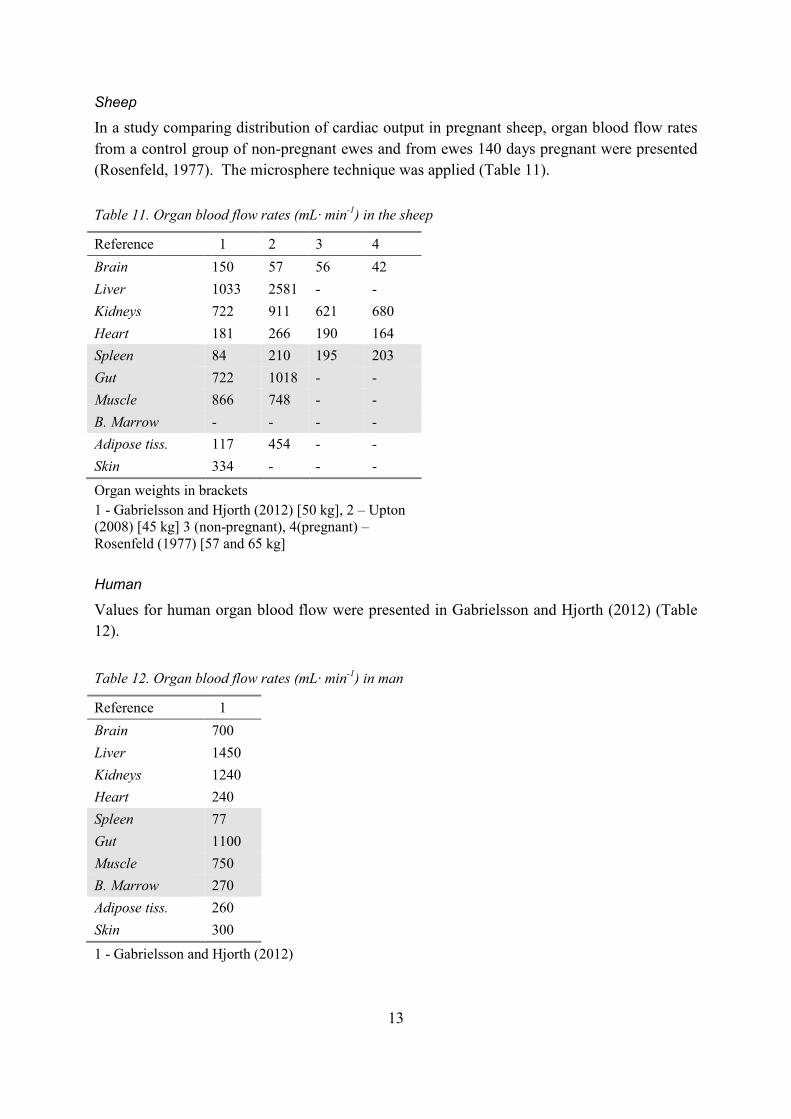
In a study comparing distribution of cardiac output in pregnant sheep, organ blood flow rates from a control group of non-pregnant ewes and from ewes 140 days pregnant were presented (Rosenfeld, 1977). The microsphere technique was applied (Table 11).
Table 11. Organ blood flow rates (mL· min-1) in the sheep
Reference 1 2 3 4 Brain 150 57 56 42 Liver 1033 2581 - - Kidneys 722 911 621 680 Heart 181 266 190 164 Spleen 84 210 195 203 Gut 722 1018 - - Muscle 866 748 - - B. Marrow - - - - Adipose tiss. 117 454 - - Skin 334 - - - Organ weights in brackets 1 - Gabrielsson and Hjorth (2012) [50 kg], 2 – Upton (2008) [45 kg] 3 (non-pregnant), 4(pregnant) – Rosenfeld (1977) [57 and 65 kg] Human
Values for human organ blood flow were presented in Gabrielsson and Hjorth (2012) (Table 12).
Table 12. Organ blood flow rates (mL· min-1) in man
Reference 1 Brain 700 Liver 1450 Kidneys 1240 Heart 240 Spleen 77 Gut 1100 Muscle 750 B. Marrow 270 Adipose tiss. 260 Skin 300 1 - Gabrielsson and Hjorth (2012)
13

Summary
All data are presented as ranges including the highest and lowest reported literature values and summarized in Table 13. Discussion General considerations
Relative values were recalculated to absolute organ blood flow rates for comparison in this survey. The difference in weights across subjects in different studies may be a source for variability. The validity of the microsphere technique is dependent on 1) adequate mixing of microspheres in the vascular space; 2) non-entrapment of microspheres due to arterial-venous shunts; 3) effects of the microsphere emboli on the systemic circulation (Kawashima et al., 1976). Smaller animals may be more sensitive to the surgical stress caused by the microsphere technique although specific precautions were taken in the studies. Studies from both conscious and anesthetized animals are reported in this survey. Conscious animals give a better picture of a normal physiological state. However, stress may confound the true response. Stress symptoms might be avoided in anesthetized animal, but the impact of the pharmacodynamic effects of the anesthetic must be considered. Ideally, all studies should report values on both normal conscious and anesthetized states. Variability
Variability in blood flow rates within the same species can be attributed to both intrinsic and extrinsic factors. Intrinsic factors consist of biological variability within and between individuals (Lindstedt and Schaeffer, 2002). Individual internal factors vary with temperature, light, hormonal balance, pathological state, age, nutritional status, reproductive status etc. Another important factor is sub-clinical infections that may interfere with homeostasis. Between individual variability is due to gender, age, genetics, clinical history, environmental factors etc. Extrinsic factors of variability are the different study protocols, surgical techniques, measurement techniques and interpretation of data. Since organ blood flow requires a highly technological and precise measurement (unlike for example organ weight), differences in techniques might contribute to large between study variability (Lindstedt and Schaeffer, 2002). Outlier values from studies have only been omitted when attributed to inconsistencies in nomenclature, as discussed in methods.
14
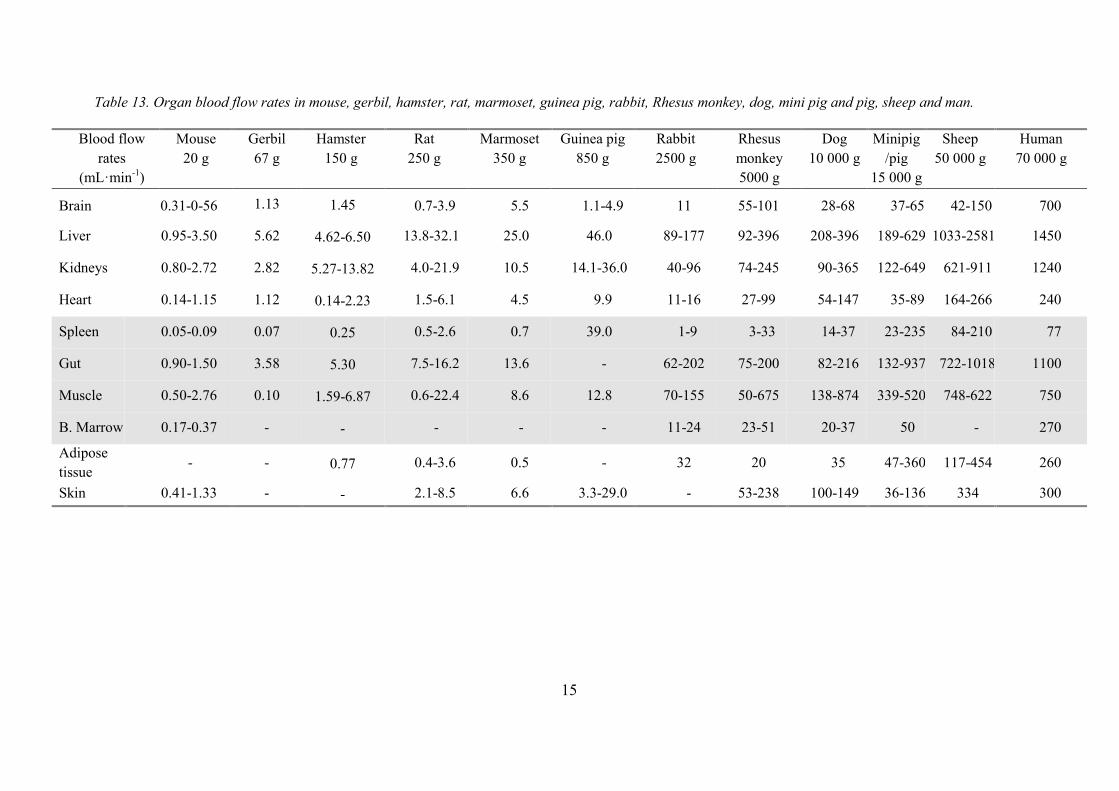
Table 13. Organ blood flow rates in mouse, gerbil, hamster, rat, marmoset, guinea pig, rabbit, Rhesus monkey, dog, mini pig and pig, sheep and man.
Blood flow rates
(mL·min-1)
Mouse 20 g
Gerbil 67 g
Hamster 150 g
Rat 250 g
Marmoset 350 g
Guinea pig 850 g
Rabbit 2500 g
Rhesus monkey 5000 g
Dog 10 000 g
Minipig /pig
15 000 g
Sheep 50 000 g
Human 70 000 g
Brain 0.31-0-56 1.13 1.45 0.7-3.9 5.5 1.1-4.9 11 55-101 28-68 37-65 42-150 700
Liver 0.95-3.50 5.62 4.62-6.50 13.8-32.1 25.0 46.0 89-177 92-396 208-396 189-629 1033-2581 1450
Kidneys 0.80-2.72 2.82 5.27-13.82 4.0-21.9 10.5 14.1-36.0 40-96 74-245 90-365 122-649 621-911 1240
Heart 0.14-1.15 1.12 0.14-2.23 1.5-6.1 4.5 9.9 11-16 27-99 54-147 35-89 164-266 240
Spleen 0.05-0.09 0.07 0.25 0.5-2.6 0.7 39.0 1-9 3-33 14-37 23-235 84-210 77
Gut 0.90-1.50 3.58 5.30 7.5-16.2 13.6 - 62-202 75-200 82-216 132-937 722-1018 1100
Muscle 0.50-2.76 0.10 1.59-6.87 0.6-22.4 8.6 12.8 70-155 50-675 138-874 339-520 748-622 750
B. Marrow 0.17-0.37 - - - - - 11-24 23-51 20-37 50 - 270
Adipose tissue - - 0.77 0.4-3.6 0.5 - 32 20 35 47-360 117-454 260
Skin 0.41-1.33 - - 2.1-8.5 6.6 3.3-29.0 - 53-238 100-149 36-136 334 300
15

Mouse
Small animal like mice are inherently difficult models for the application of the microsphere measurement technique to because of their small structure and low plasma volume. Some studies show that in order to provide an accurate measurement, at least 300 (or 400 according to Barbee et all (1992), Wang et al, (1993)) microspheres need to be trapped in an individual organ (Sarin et al., 1990). This makes measurement of organs with smaller mass, such as the sex organs, more difficult. The method of injection of labelled butanol might therefore be more applicable in small animals since the test method is less invasive. Venous injection and arterial sampling are the only necessary invasive operations (Gjedde and Gjedde, 1980). Cannulation of two arteries and placement of a catheter in or close to the heart is necessary in the microsphere technique. The catheter diameter is insignificant compared to artery size in a larger animal, while in a mouse the catheter might disturb circulation. Adequate mixing of microspheres in vivo is crucial for reliable results. This might pose a problem when injection is made into the carotid artery instead of the left ventricular chamber of the heart or in the aortic arch (Sarin et al., 1990). However, this can be checked by measuring radioactivity in symmetrical vascular spaces; the femoral arteries or the kidneys. Control mice underwent a sham operation in addition to being put through an invasive microsphere measurement technique (Wang et al., 1993). Blood flow rates obtained can be questioned in terms of compliance with blood flow rates in the physiological state. The total plasma volume in mice is limited to 8.0 ml and any traumatic surgery in addition to the blood sampling for measuring may give unphysiological values. As the values from the study were presented partially in graphs, this might be an additional source of error. Gerbil
Gerbils are susceptible to cerebral ischemia when the carotid arteries are ligated, which renders the usual method of cannulation of the carotid artery more unsafe. This led Matsumoto et al (1982) to use a modified microsphere technique with microsphere injection through cardiac puncture rather than arterial injection. Because of the need for cardiac puncture, the animals are anesthetized with ketamine during blood flow measurements. Matsumoto et al (1982) was the only source found for gerbil organ blood flow rates. The study, while of high quality, only consists of 7 subjects. Further studies on organ blood flow rates in the conscious gerbil are needed. Hamster
Data of Shoshenko (2004) differ from data in review articles (Gabrielsson and Hjorth (2012), Gerlowski and Jain (1983)). This might be due to the low number of subjects (n=2) or to the difference in body mass between the animals used (760 g in Shoshenko (2004) and 150 g in Gerlowski and Jain (1983)). The weights of the Syrian hamster were identical to those in the review articles (Wickler and Horwitz, 1984).
16
Rat
Closa et al. (1993) studied the natural variability of organ blood flow rates in rats under to core temperature oscillations. The results demonstrated 1) that cardiac output was reduced during the cooling phase and 2) a significant redistribution of cardiac output took place, with brown adipose tissue, renal and skin blood flow rates decreasing. This is worth noting when using rats as a model animal. Organ blood flow rates from lactating rats were presented by Sakanashi et al. (1987). This allowed one to observe the differences in the distribution of cardiac output in post-parturition rats. Compared to other values obtained, gut blood flow rate increases in lactating rats. However, a large portion of animals (20/25) were excluded from the study which casts a shadow on the study as a whole. Guinea Pig
All rates from Sjoquist et al. (1986) are lower than those found in Gabrielsson and Hjorth (2012). Without knowing the sources used in the latter it is difficult to speculate why. The need to convert the units used in Sjoquist et al (1986) to mL∙min-1 further complicates the comparison since the organ weights comes out of Gabrielsson et al (2013). Marmoset
More studies on marmosets are necessary to evaluate the organ blood flow rates. Rabbit
Many of the rates from the review studies are identical but no overlap in references has been found in this survey. It is possible that a common source might be found when back-tracing the references further. Jones and Parker (1988) suggest that blood flow to the kidney is decreased in favor of mammary blood flow in lactating rabbits. It is difficult to draw any conclusions from the parameters collected in this survey, since overall cardiac output is increased in lactating females. Thus, only comparison of renal blood flow rates as a fraction of cardiac output can be assessed. Rhesus Monkey
Rates from Gabrielsson and Hjorth (2012) and Forsyth et al. (1968) are identical except for gut blood flow. Although the former is not mentioned as a reference, it is likely that the value originates from this source and the differing value is an administrational error. The spleen blood flow from Lees et al. (1971) is remarkably low (3 mL∙min-1). Animal weight was undisclosed in Lees et al, 1971 and in Behrman and Lees (1971), study subjects were noticeably heavier at 7.9 kg than the mean weights of the other studies. Muscle blood flow from Forsyth et al. (1971) is remarkably high. Conversion to ml∙min-1 was done using muscle weight from Gabrielsson and Hjorth (2012), and the difference in weights between the subjects of the studies may account for some part in the stand out value, but is probably not the complete answer.
17

Dog
Intervals of hepatic and skeletal muscle blood flow rate intervals are presented in Wyler et al. (1979). The mean body weights of the subjects were not given and might be a source for variability. Fan et al. (1979) describe shunting as microspheres failing to get trapped in the tissue but continue through the vascular circulation, leading to underestimation of organ blood flow. 15-µm spheres have a lower tendency to shunting than 9-µm spheres and were therefore chosen to be included in this survey. All studies included have been carried out in anesthetized dogs. Further studies on conscious dogs are needed. Mini pig and pig
Two studies utilize mini pigs (3-15 kg), and another two regular pigs (25-37.1 kg). This makes comparison more difficult because body weights differ greatly and there is also a possibility that there could be considerable metabolic differences between the two strains. The blood flow rates through fat and skeletal muscle tissue in the standard pig (Upton, 2008) differ greatly from those of the mini pig (Gabrielsson and Hjorth, 2012). The blood flow rates (apart from brain blood flow) from Tranquilli et al. (1982) stand out considerably, which a higher weight of participating pigs only partially account for. The mini pigs studied by Wyler et al. (1979) are juvenile and weigh less than mini pigs in Gabrielsson and Hjorth (2012). Mini pigs of the latter are 5 times heavier (3 kg) than the former (15 kg), which needs to be considered. Sheep
As discussed previously, comparison between pregnant and non-pregnant individuals is difficult since pregnancy changes both cardiac output and its distribution (Rosenfeld, 1977). Conclusion
Blood flow rates were obtained from review articles and clinical studies on 11 species of laboratory animals. Maximum and minimum organ and tissue blood flow rates are presented in Table 13. The variability reflects both the biological variability caused by difference within and between subjects, but also the variability caused by differences in techniques and study protocols. It is important to consider natural variability when applying in vivo data to in silico models.
18
References Barbee, R. W., B. D. Perry, R. N. Re, and J. P. Murgo (1992), MICROSPHERE AND DILUTION
TECHNIQUES FOR THE DETERMINATION OF BLOOD FLOWS AND VOLUMES IN CONSCIOUS MICE: American Journal of Physiology, v. 263, p. R728-R733.
Tillgänglig: http://ajpregu.physiology.org/content/263/3/R728 [2014-03-24]
Behrman, R. E., and M. H. Lees (1971), ORGAN BLOOD FLOWS OF FETAL, NEWBORN AND ADULT RHESUS MONKEY - COMPARATIVE STUDY: Biology of the Neonate, v. 18, p. 330.
Boerboom, L. E., and J. N. Boelkins (1980), HEMODYNAMICS IN AWAKE RABBITS DURING HYPERBARIC HELIUM-OXYGEN EXPOSURE: Journal of Applied Physiology, v. 48, p. 281-283.
Tillgänglig: http://jap.physiology.org/content/48/2/281 [2014-03-24]
Clewell, R. A., and H. J. Clewell Iii (2008), Development and specification of physiologically based pharmacokinetic models for use in risk assessment: Regulatory Toxicology and Pharmacology, v. 50, p. 129-143.
Tillgänglig: http://www.sciencedirect.com/science/article/pii/S0273230007001699?via=ihub [2014-03-24]
Closa, D., J. M. Gomezsierra, E. Latres, M. Alemany, and X. Remesar (1993), SHORT-TERM OSCILLATIONS OF AORTIC CORE TEMPERATURE AND THERMOGENIC ORGAN BLOOD-FLOW IN THE RAT: Experimental Physiology, v. 78, p. 243-253.
Tillgänglig: http://ep.physoc.org/content/78/2/243 [2014-03-24]
Davies, B., and T. Morris (1993), Commentary: Physiological Parameters in Laboratory Animals and Humans, Pharmaceutical Research, p. 1093-1095.
Fan, F. C., G. B. Schuessler, R. Y. Z. Chen, and S. Chien (1979), DETERMINATIONS OF BLOOD-FLOW AND SHUNTING OF 9-MU-M AND 15-MU-M SPHERES IN REGIONAL BEDS: American Journal of Physiology, v. 237, p. H25-H33.
Tillgänglig: http://ajpheart.physiology.org/content/237/1/H25 [2014-03-24]
Forsyth, R. P. (1971), REGIONAL BLOOD-FLOW CHANGES DURING 72-HOUR AVOIDANCE SCHEDULES IN MONKEY: Science, v. 173, p. 546.
Tillgänglig: http://www.jstor.org/stable/1732255 [2014-03-24]
Forsyth, R. P., A. S. Nies, F. Wyler, J. Neutze, and K. L. Melmon (1968), NORMAL DISTRIBUTION OF CARDIAC OUTPUT IN UNANESTHETIZED RESTRAINED RHESUS MONKEY: Journal of Applied Physiology, v. 25, p. 736
Tillgänglig: http://jap.physiology.org/content/25/6/736 [2014-03-24]
Gabrielsson, J., and S. Hjorth (2012), Quantative Pharmacology: An Introduction to Integrative Pharmacokinetic-Pharmacodynamic Analysis, Stockholm: Swedish Pharmaceutical Press
Gerlowski, L. E., and R. K. Jain (1983), PHYSIOLOGICALLY BASED PHARMACOKINETIC MODELING - PRINCIPLES AND APPLICATIONS: Journal of Pharmaceutical Sciences, v. 72, p. 1103-1127.
Gjedde, S. B., and A. Gjedde (1980), ORGAN BLOOD-FLOW RATES AND CARDIAC-OUTPUT OF THE BALB-C MOUSE: Comparative Biochemistry and Physiology a-Physiology, v. 67, p. 671-674.
Tillgänglig: http://www.sciencedirect.com/science/article/pii/0300962980902583?via=ihub [2014-03-24]
19

Ishise, S., B. L. Pegram, J. Yamamoto, Y. Kitamura, and E. D. Frohlich (1980), REFERENCE SAMPLE MICROSPHERE METHOD - CARDIAC-OUTPUT AND BLOOD FLOWS IN CONSCIOUS RAT: American Journal of Physiology, v. 239, p. H443-H449.
Tillgänglig: http://ajpheart.physiology.org/content/239/4/H443 [2014-03-24]
Jones, C. S., and D. S. Parker (1988), Mammary blood flow and cardiac output during initiated involution of the mammary gland in the rabbit: Comparative Biochemistry and Physiology Part A: Physiology, v. 91, p. 21-25.
Tillgänglig: http://www.sciencedirect.com/science/article/pii/0300962988915861?via=ihub [2014-03-24]
Kawashima, Y., K. Okada, I. Kosugi, H. Innami, Y. Yamaguchi, T. Fujihara, and H. Yamamura, (1976), CHANGES IN DISTRIBUTION OF CARDIAC-OUTPUT BY SURFACE-INDUCED DEEP HYPOTHERMIA IN DOGS: Journal of Applied Physiology, v. 40, p. 876-882.
Tillgänglig: http://jap.physiology.org/content/40/6/876 [2014-03-24]
Lees, M. H., J. Hill, A. J. Ochsner, and C. Thomas (1971), REGIONAL BLOOD FLOWS OF RHESUS MONKEY DURING HALOTHANE ANESTHESIA: Anesthesia and Analgesia Current Researches, v. 50, p. 270
Tillgänglig: http://journals.lww.com/anesthesia-analgesia/Citation/1971/03000/Regional_Blood_Flows_of_the_Rhesus_Monkey_During.22.aspx [2014-03-24]
Lindstedt, S. L., and P. J. Schaeffer (2002), Use of allometry in predicting anatomical and physiological parameters of mammals: Laboratory Animals, v. 36, p. 1-19.
Tillgänglig: http://lan.sagepub.com/content/36/1/1.full.pdf+html [2014-03-24]
Matsumoto, M., K. Kimura, A. Fujisawa, T. Matsuyama, T. Asai, O. Uyama, S. Yoneda, and H. Abe (1982), REGIONAL BLOOD FLOWS MEASURED IN MONGOLIAN GERBIL BY A MODIFIED MICROSPHERE METHOD: American Journal of Physiology, v. 242, p. H990-H995.
Tillgänglig: http://ajpheart.physiology.org/content/242/6/H990 [2014-03-24]
Neutze, J. M., F. Wyler, and A. M. Rudolph (1968), USE OF RADIOACTIVE MICROSPHERES TO ASSESSS DISTRIBUTION OF CARDIAC OUTPUT IN RABBITS: American Journal of Physiology, v. 215, p. 486
Tillgänglig: http://ajplegacy.physiology.org/content/215/2/486 [2014-03-24]
Prothero, J. W. (1982), Organ scaling in mammals: The liver: Comparative Biochemistry and Physiology Part A: Physiology, v. 71, p. 567-577.
Tillgänglig: http://www.sciencedirect.com/science/article/pii/0300962982902055?via=ihub [2014-03-24]
Reeves, P. T., R. F. Minchin, and K. F. Ilett (1988), MEASUREMENT OF ORGAN BLOOD-FLOW IN THE RABBIT: Journal of Pharmacological Methods, v. 20, p. 187-196.
Rosenfeld, C. R. (1977), DISTRIBUTION OF CARDIAC-OUTPUT IN OVINE PREGNANCY: American Journal of Physiology, v. 232, p. H231-H235.
Tillgänglig: http://ajpheart.physiology.org/content/232/3/H231 [2014-03-24]
Rowland, M., C. Peck, and G. Tucker (2011), Physiologically-Based Pharmacokinetics in Drug Development and Regulatory Science: Annual Review of Pharmacology and Toxicology, Vol 51, 2011, v. 51, p. 45-73.
20
Tillgänglig: http://www.annualreviews.org/doi/abs/10.1146/annurev-pharmtox-010510-100540?url_ver=Z39.88-2003&rfr_dat=cr_pub%3Dpubmed&rfr_id=ori%3Arid%3Acrossref.org&journalCode=pharmtox [2013-03-24]
Sakanashi, T. M., H. E. Brigham, and K. M. Rasmussen (1987), Effect of dietary restriction during lactation on cardiac output, organ blood flow and organ weights of rats: The Journal of nutrition, v. 117, p. 1469-74.
Tillgänglig: http://jn.nutrition.org/content/117/8/1469 [2014-03-24]
Sarin, S. K., C. Sabba, and R. J. Groszmann (1990), SPLANCHNIC AND SYSTEMIC HEMODYNAMICS IN MICE USING A RADIOACTIVE MICROSPHERE TECHNIQUE: American Journal of Physiology, v. 258, p. G365-G369
Tillgänglig: http://ajpgi.physiology.org/content/258/3/G365 [2014-0324]
Schaeper, J., R. Ahmed, F. H. Perschel, M. Schaefer, H. Habazettl, and M. Welte (2010), Thoracic Epidural Anesthesia Attenuates Endotoxin-induced Impairment of Gastrointestinal Organ Perfusion: Anesthesiology, v. 113, p. 126-133.
Tillgänglig: http://journals.lww.com/anesthesiology/Fulltext/2010/07000/Thoracic_Epidural_Anesthesia_Attenuates.20.aspx [2014-03-24]
Shoshenko, K. A. (2004), The organ blood flow under conditions of motor rest in rodents with different body mass: Journal of Evolutionary Biochemistry and Physiology, v. 40, p. 312-320.
Tillgänglig: http://link.springer.com/article/10.1023/B:JOEY.0000042636.40799.f4 [2014-03-24]
Sivarajan, M., D. W. Amory, and L. E. Lindbloom (1976), SYSTEMIC AND REGIONAL BLOOD-FLOW DURING EPIDURAL ANESTHESIA WITHOUT EPINEPHRINE IN RHESUS-MONKEY: Anesthesiology, v. 45, p. 300-310.
Tillgänglig: http://journals.lww.com/anesthesiology/Abstract/1976/09000/Systemic_and_Regional_Blood_Flow_during_Epidural.10.aspx [2014-03-24]
Sivarajan, M., D. W. Amory, L. E. Lindbloom, and R. S. Schwettmann (1975), SYSTEMIC AND REGIONAL BLOOD-FLOW CHANGES DURING SPINAL ANESTHESIA IN RHESUS-MONKEY: Anesthesiology, v. 43, p. 78-88.
Tillgänglig: http://journals.lww.com/anesthesiology/Abstract/1975/07000/Systemic_and_Regional_Blood_flow_Changes_during.17.aspx [2014-03-24]
Sivarajan, M., D. W. Amory, and S. M. McKenzie (1985), REGIONAL BLOOD FLOWS DURING INDUCED HYPOTENSION PRODUCED BY NITROPRUSSIDE OR TRIMETHAPHAN IN THE RHESUS-MONKEY: Anesthesia and Analgesia, v. 64, p. 759-766.
Tillgänglig: http://journals.lww.com/anesthesia-analgesia/pages/articleviewer.aspx?year=1985&issue=08000&article=00002&type=abstract [2014-03-24]
Sjoquist, P. O., G. Duker, and B. W. Johansson (1986), EFFECTS OF INDUCED HYPOTHERMIA ON ORGAN BLOOD-FLOW IN A HIBERNATOR AND A NONHIBERNATOR: Cryobiology, v. 23, p. 440-446.
Tillgänglig: http://www.sciencedirect.com/science/article/pii/0011224086900295?via=ihub [2014-03-24]
21
Tranquilli, W. J., M. Manohar, C. M. Parks, J. C. Thurmon, M. C. Theodorakis, and G. J. Benson (1982), SYSTEMIC AND REGIONAL BLOOD-FLOW DISTRIBUTION IN UNANESTHETIZED SWINE AND SWINE ANESTHETIZED WITH HALOTHANE + NITROUS-OXIDE, HALOTHANE, OR ENFLURANE: Anesthesiology, v. 56, p. 369-379.
Tillgänglig: http://journals.lww.com/anesthesiology/Abstract/1982/05000/Systemic_and_Regional_Blood_Flow_Distribution_in_.8.aspx [2014-03-24]
Tsuchiya, M., R. A. Ferrone, G. M. Walsh, and E. D. Frohlich (1978), REGIONAL BLOOD FLOWS MEASURED IN CONSCIOUS RATS BY COMBINED FICK AND MICROSPHERE METHODS: American Journal of Physiology, v. 235, p. H357-H360.
Tillgänglig: http://ajpheart.physiology.org/content/235/3/H357 [2014-03-24]
Upton, R. N. (2008), Organ weights and blood flows of sheep and pig for physiological pharmacokinetic modelling: Journal of Pharmacological and Toxicological Methods, v. 58, p. 198-205.
Tillgänglig: http://www.sciencedirect.com/science/article/pii/S1056871908001822?via=ihub [2014-03-24]
Wang, P., Z. F. Ba, J. Burkhardt, and I. H. Chaudry (1993), TRAUMA-HEMORRHAGE AND RESUSCITATION IN THE MOUSE - EFFECTS ON CARDIAC-OUTPUT AND ORGAN BLOOD-FLOW: American Journal of Physiology, v. 264, p. H1166-H1173.
Tillgänglig: http://ajpheart.physiology.org/content/264/4/H1166 [2014-03-24]
Wickler, S. J., and B. A. Horwitz (1984), BLOOD-FLOW IN NORMAL AND DYSTROPHIC HAMSTERS DURING NONSHIVERING THERMOGENESIS: American Journal of Physiology, v. 247, p. R189-R195.
Tillgänglig: http://ajpregu.physiology.org/content/247/1/R189 [2014-03-24]
Yuan, X. Q., C. E. Wade, D. S. Prough, and D. S. DeWitt (1990), Traumatic brain injury creates biphasic systemic hemodynamic and organ blood flow responses in rats: Journal of neurotrauma, v. 7, p. 141-53.
Tillgänglig: http://online.liebertpub.com/doi/abs/10.1089/neu.1990.7.141 [2014-03-24]
Zwissler, B., R. Schosser, C. Weiss, V. Iber, M. Weiss, C. Schwickert, P. Spengler, and K. Messmer, (1991), METHODOLOGICAL ERROR AND SPATIAL VARIABILITY OF ORGAN BLOOD-FLOW MEASUREMENTS USING RADIOLABELED MICROSPHERES: Research in Experimental Medicine, v. 191, p. 47-63.
Tillgänglig: http://link.springer.com/article/10.1007/BF02576659 [2014-03-24]
22