switzerland - iuj.ac.jp · pdf fileavailable on our website at ... 47 tourism receipts ......
TRANSCRIPT
COUNTRY PROFILE 2002
SwitzerlandThis Country Profile is a reference work, analysing thecountry’s history, politics, infrastructure and economy. It isupdated annually. The Economist Intelligence Unit’squarterly Country Reports analyse current trends andprovide a two-year forecast.
The full publishing schedule for Country Profiles is nowavailable on our website at http://www.eiu.com/schedule
The Economist Intelligence Unit15 Regent St, London SW1Y 4LRUnited Kingdom
The Economist Intelligence UnitThe Economist Intelligence Unit is a specialist publisher serving companies establishing and managingoperations across national borders. For over 50 years it has been a source of information on businessdevelopments, economic and political trends, government regulations and corporate practice worldwide.
The EIU delivers its information in four ways: through our digital portfolio, where our latest analysis isupdated daily; through printed subscription products ranging from newsletters to annual referenceworks; through research reports; and by organising seminars and presentations. The firm is a member ofThe Economist Group.
LondonThe Economist Intelligence Unit15 Regent StLondonSW1Y 4LRUnited KingdomTel: (44.20) 7830 1007Fax: (44.20) 7830 1023E-mail: [email protected]
New YorkThe Economist Intelligence UnitThe Economist Building111 West 57th StreetNew YorkNY 10019, USTel: (1.212) 554 0600Fax: (1.212) 586 0248E-mail: [email protected]
Hong KongThe Economist Intelligence Unit60/F, Central Plaza18 Harbour RoadWanchaiHong KongTel: (852) 2585 3888Fax: (852) 2802 7638E-mail: [email protected]
Website: www.eiu.com
Electronic deliveryThis publication can be viewed by subscribing online at www.store.eiu.com
Reports are also available in various other electronic formats, such as CD-ROM, Lotus Notes, on-linedatabases and as direct feeds to corporate intranets. For further information, please contact your nearestEconomist Intelligence Unit office
Copyright© 2002 The Economist Intelligence Unit Limited. All rights reserved. Neither this publication norany part of it may be reproduced, stored in a retrieval system, or transmitted in any form or by anymeans, electronic, mechanical, photocopying, recording or otherwise, without the prior permissionof The Economist Intelligence Unit Limited.
All information in this report is verified to the best of the author’s and the publisher’s ability. However,the EIU does not accept responsibility for any loss arising from reliance on it.
ISSN 0269-6010
Symbols for tables“n/a” means not available; “–” means not applicable
Printed and distributed by Patersons Dartford, Questor Trade Park, 151 Avery Way, Dartford, Kent DA1 1JS, UK.
EIU Country Profile 2002 © The Economist Intelligence Unit Limited 2002
1
EIU Country Profile 2002 © The Economist Intelligence Unit Limited 2002
Contents
3 Basic data
4 Politics4 Political development6 Constitution, institutions and administration8 Political forces
11 International relations and defence
15 Resources and infrastructure15 Population16 Education17 Health17 Natural resources and the environment18 Transport, communications and the Internet20 Energy provision
21 The economy21 Economic structure22 Economic policy25 Economic performance27 Regional trends
28 Economic sectors28 Agriculture29 Manufacturing30 Construction31 Financial services34 Other services
35 The external sector35 Trade in goods37 Invisibles and the current account38 Capital flows and foreign debt38 Foreign reserves and the exchange rate
40 Appendices40 Sources of information41 Reference tables41 Resident population by age and nationality42 Total employment42 Unemployment42 Transport43 Telecommunications43 Production, trade and consumption of fuels and electricity43 Government finances44 Money supply44 Interest rates
2
EIU Country Profile 2002 © The Economist Intelligence Unit Limited 2002
45 Gross domestic product45 Gross domestic product by expenditure45 Prices and earnings46 Agricultural production46 Industrial production47 Construction47 Swiss Stock Exchange47 Retail trade turnover47 Tourism receipts48 Main trading partners49 Balance of payments, IMF series49 Balance of payments, national estimates50 Foreign reserves50 Exchange rates
Switzerland 3
© The Economist Intelligence Unit Limited 2002 EIU Country Profile 2002
Switzerland
Basic data
41,285 sq km (24% arable, 13% pasture, 31% forest)
7,258,500 (December 31st 2001; provisional estimate)
Population (end-2000, latest available data)
Zurich 337,900Geneva 175,000Basle 166,000Berne (capital) 122,500Lausanne 114,900
Temperate
Hottest month, July, 13-24°C (average daily minimum and maximum); coldestmonth, January, –3-2°C; driest month, December, 64 mm average rainfall;wettest month, July, 136 mm average rainfall
German (64%), French (19%), Italian (8%), Romansch (1%), others (8%)
Metric system
Swiss franc (Swfr)=100 centimes or rappenAverage exchange rates in 2001: Swfr1.69:US$1; Swfr1.51:€1Exchange rates on April 2nd 2002: Swfr1.66:US$1; Swfr1.46:€1.
1 hour ahead of GMT (2 hours ahead in summer, late-March to late-October)
January 1st, 2nd (partial); March 29th; April 1st; May 1st (partial); May 9th,20th; August 1st; November 1st (partial); December 8th (partial), 25th, 26th,31st (partial)
Land area
Population
Main cities
Climate
Weather in Zurich(altitude 493 metres)
Languages
Measures
Currency
Time
Public holidays in 2002
4 Switzerland
EIU Country Profile 2002 © The Economist Intelligence Unit Limited 2002
Politics
Switzerland is a federal state and a parliamentary democracy with strong directdemocratic elements. Several national referendums are held every year, and theneed to build strong support for legislation so that it can pass a referendum ifsufficient signatures are collected has led to a consensus-oriented politicalprocess. The federal government has been run since 1959 by a four-partycollegial arrangement known as the “magic formula”, comprising all the fourmajor parties, the right-wing Radical Democratic Party (FDP), the centristChristian Democratic Party (CVP), the populist right-wing Swiss People’s Party(SVP) and the left-wing Social-democratic Party (SP). In the 1999 parliamentaryelection these four parties together won three-quarters of the seats in the lowerhouse. The parliamentary representation of the SVP rose from being thesmallest of the four parties to the second largest, in part due to its shift towardsaggressive populism. Following the election the SVP demanded that the partycomposition of the seven-member Federal Council be adjusted to reflect itsgreater strength. So far this demand has not been met, but it is sure to remainon the agenda, particularly at the time of the parliamentary election in 2003.
Political development
The current Swiss Confederation (Confoederatio Helvetica, CH), consisting of26 semi-autonomous cantons and half-cantons, evolved from a pact betweenthe people of three valley communities in 1291, while the modern federal statewas created in 1848. Legend has it that the founding pact of the free peasantsof Uri, Schwyz and Unterwalden was a pledge to aid each other in endingHabsburg dominion. By shooting at the emperor’s bailiff, William Tell gave thesignal for the expulsion of the oppressors. In reality, the so-called Rütli Oath,named after the meadow beside Lake Lucerne where it was sworn, was analliance to preserve the peasants’ traditional autonomy under Habsburg rule.
As time went by, more valleys and towns joined the alliance, committingthemselves to mutual assistance, peaceful settlement of disputes and a rejectionof foreign judges. Their co-existence was founded on the principles of localautonomy and federalism, which still underpin the present Swiss constitution.By the end of the 14th century the confederation was on the way to being anindependent state, based on equality between political entities, whatever theirsize and economic strength.
The Rütli Oath followed the opening of the Gotthard Pass across the Alps inthe 1230s. The route rapidly became an important link between southernEurope and the rest of the continent, embroiling the valley communities inEuropean power politics. Wars of conquest by the independent members of theconfederation during the 15th century were abruptly terminated after a heavydefeat by the French at the battle of Marignano in northern Italy in 1515.Thereafter, a peace treaty with France and a pact to supply mercenaries keptthe Swiss out of foreign wars. The confederation made its first formaldeclaration of military neutrality in 1647 during the 30 years’ war (1618-48).
Foundation ofconfederation in 1291
Civil war and invasiondespite pledge of neutrality
Switzerland 5
© The Economist Intelligence Unit Limited 2002 EIU Country Profile 2002
Switzerland’s status of permanent military neutrality was later enshrined ininternational law at the Congress of Vienna in 1815.
Important recent events
December 1992: Swiss voters reject membership of the European Economic Area, an18-member free-trade zone with the EU.
December 1996: Switzerland joins NATO’s Partnership for Peace.
August 1998: Swiss banks reach a US$1.25bn settlement with Jewish organisations tohead off lawsuits over wartime claims.
April 1999: Voters approve a revised constitution, but the revision focuses merely onthe modernisation and restructuring of the text, rather than any substantial changes.
October 1999: The Swiss People’s Party (SVP) makes unprecedented gains in theparliamentary election. In December it mounts an unsuccessful challenge for anadditional post in the cabinet, the Federal Council.
May 2000: Voters approve a package of seven bilateral accords with the EU, signed inJune 1999 after five years of negotiations, but EU governments continue to delayratification. The accords are expected to come into effect during the first half of 2002.
December 2000: The two houses of parliament in joint session select Samuel Schmidto succeed Adolf Ogi (SVP) as a member of the Federal Council, following the latter’sresignation. Although a senior member of the SVP, Mr Schmid was not one of theparty’s two official candidates for the post.
March 2001: The electorate rejects a people’s initiative demanding the immediate startof EU accession negotiations by an unexpectedly high margin, with 76.7% votingagainst the proposal. The result convinces the Federal Council to in effect postpone anyhopes of EU membership until the latter part of this decade.
June 2001: Voters approve military reforms including the provision of armed Swisstroops for operations run by the UN or the OSCE (Organisation for Security and Co-operation in Europe). In 1994 voters had rejected a motion to provide Swiss troops forUN peacekeeping operations.
March 2002: The electorate approves a people’s initiative, backed by the governmentand three of the four major parties, to join the UN. Although the popular vote, with54.6% of votes in favour, was clear enough, the second requirement, the backing ofmore than half of the voters in a majority of cantons, was only narrowly achieved, with12 cantons voting in favour and 11 against.
The confederation survived two centuries of civil war between Catholics andProtestants that followed the Protestant Reformation in the 16th century, aswell as an invasion by Napoleon Bonaparte in the winter of 1797-98 designedto secure the mountain routes to Italy. In 1848, after a brief civil war in 1847,the Swiss opted for a federal political structure, although the name of
6 Switzerland
EIU Country Profile 2002 © The Economist Intelligence Unit Limited 2002
confederation remained. Many elements of the 1848 constitution still survive,although the formalised system of direct democracy first appeared in a revisedconstitution of 1874.
Switzerland industrialised rapidly in the 19th century and by 1850 was thesecond most industrialised country in Europe after Great Britain. The periodbetween the first world war (1914-18) and the second world war (1939-45) wasmarked by labour unrest, including a general strike in 1918. In 1937 employersand trade unions made a pact of industrial peace, which continues to governworkplace relations. Switzerland derived important economic benefits fromremaining neutral during both world wars, an experience that strengthenedthe country’s isolationist political tendencies. In the half-century since thesecond world war, Switzerland has built on its reputation for exceptionalpolitical stability. The drawback of this has been the exceptionally slowmodernisation of some political structures, illustrated by the fact that universalfemale suffrage in federal elections was only granted in 1971.
Underlying tensions between the principal linguistic groups have regularlymanifested themselves on the political scene, and contributed to the creation ofthe francophone canton of Jura in 1979 in a secession from the predominantlyGerman-speaking canton of Berne. The “Roestigraben”, the cleavage betweenfrancophone and German-speaking regions, has also led to divergent votingpatterns in some referendums. The two groups differ notably on internationalintegration and neutrality, but also economic liberalisation. The francophonecommunity is more ready to accept closer formal ties with the outside world andfavours a higher degree of state intervention in the economy, whereas the German-speaking community puts a higher emphasis on preserving national neutrality ina strict sense and wants to reduce political interference in the economy.However, this has not called into question the stability of the confederation.
Constitution, institutions and administration
The federal constitution defines the relationship between the federal governmentand the cantons. Each canton comprises numerous communes, totalling morethan 3,000 in all, with varying degrees of autonomy. The federal government isresponsible for foreign policy, defence, pensions, post, telecommunications,railways and the currency. Everything that is not specifically given to the federalgovernment by a constitutional provision is the responsibility of the cantons,including education, utilities, roads (except national highways), hospitals andmost of the judiciary and policing. The fiscal powers of cantons and communesare also far-reaching, while the powers of the federal government to levy taxesare relatively restricted.
The Federal Assembly (Bundesversammlung/Assemblée fédérale), the FederalCouncil (Bundesrat/Conseil fédéral) and the Federal Court (Bundesgericht/Tribunal fédéral) are the authorities at the federal level. The federal institutionsare weak compared with those of most European countries, given that manyfunctions rest with the cantons and because of the direct democratic rights ofthe electorate.
Decentralised politicalstructure
Federal institutions
Switzerland 7
© The Economist Intelligence Unit Limited 2002 EIU Country Profile 2002
Forms of direct democracy in Switzerland
A popular initiative enables the people to propose changes to the federal or cantonalconstitutions and to cantonal and communal legislation. At the federal level, a proposalbacked by the signatures of 100,000 voters must be put to the whole electorate and isaccepted if approved by a majority of voters on the national level and by a majority inmore than half of the cantons.
A referendum allows the Swiss people to vote on legislative and constitutionalchanges. Laws passed by both houses may be submitted to a referendum if required byeight cantons or 50,000 registered voters, with some exceptions. A referendum ismandatory for constitutional changes and some international agreements.
The number of initiatives and referendums has increased greatly in recent years, with anaverage of three votes on about ten separate issues annually at the federal level aloneduring the 1990s, but voter turnout has declined and rarely exceeds one-half of thoseeligible. The government has shelved its plans to raise the number of signatures requiredfor popular initiatives and referendums in order to improve legislative flexibility.However, popular initiatives demanding the extension of direct democratic rights werealso rejected in referendums.
The Federal Assembly (parliament) has two chambers, the National Council(lower house) and the Council of States (upper house), elected every four years.The 200 members of the National Council are elected by proportionalrepresentation in most cantons. The Council of States comprises two represent-atives from each of the 20 full cantons and one representative from each of thesix half-cantons. For a proposal to be passed, a majority in each chamber ofparliament has to approve it. Party affiliation is not strictly enforced.
The Federal Council is the executive authority. Each of its seven members,elected individually by, but not necessarily from, the two houses of parliamentin joint session, is the head of a department or ministry. One member of theFederal Council is elected in rotation as president for one year, solely forrepresentative purposes. The federal councillors make important decisionsjointly and must accept collective responsibility for these decisions,notwithstanding individual party policy. This entails for example that SPfederal councillors may publicly support liberalisation measures and SVPfederal councillors back plans for a more active international role of thecountry, despite their respective parties’ opposition to these measures. Since1959 the four main parties have agreed on a tacit, unwritten power-sharingformula to distribute seats in the Federal Council. According to this agreement,there are two representatives each from the FDP, the CVP and the SP, and onerepresentative from the SVP. Due to the sharp rise in support for the SVP at thelast general election in 1999 and in cantonal elections since then, the party isclaiming one more seat in the Federal Council. This has become the mostserious challenge to the “magic formula” since its inception, and aredistribution of seats between the four parties after the next general electionappears very likely.
8 Switzerland
EIU Country Profile 2002 © The Economist Intelligence Unit Limited 2002
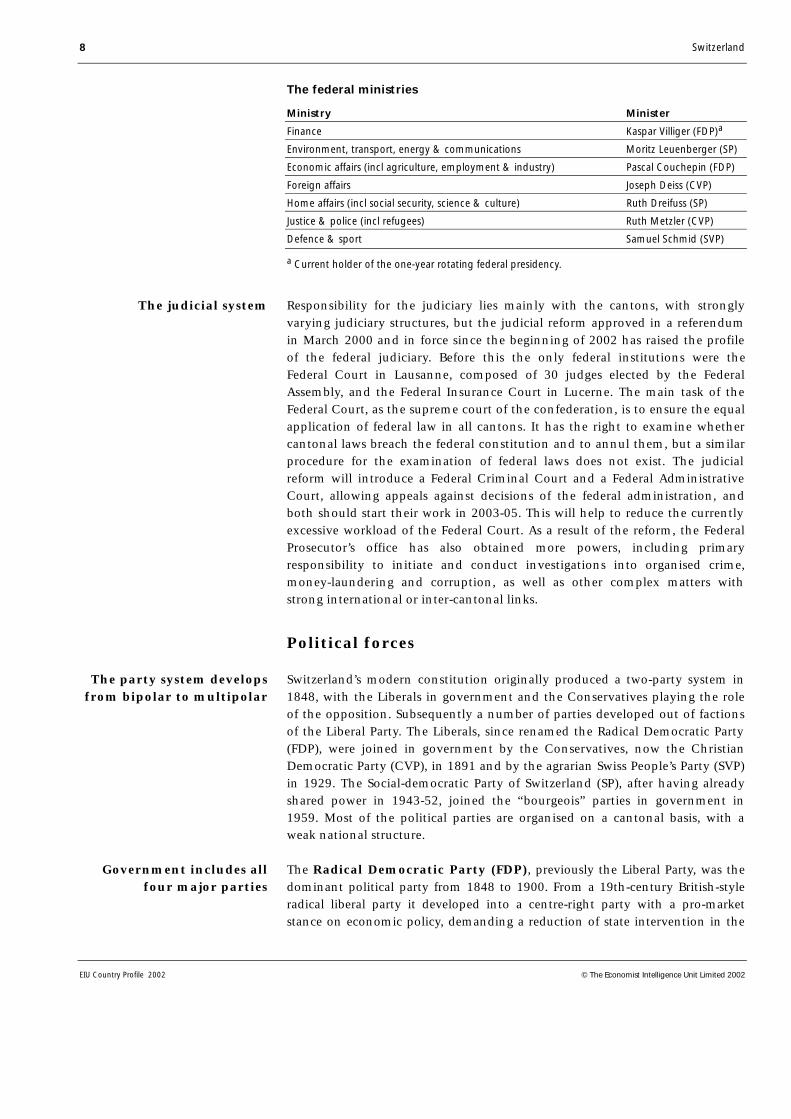
The federal ministries
Ministry Minister
Finance Kaspar Villiger (FDP)a
Environment, transport, energy & communications Moritz Leuenberger (SP)
Economic affairs (incl agriculture, employment & industry) Pascal Couchepin (FDP)
Foreign affairs Joseph Deiss (CVP)
Home affairs (incl social security, science & culture) Ruth Dreifuss (SP)
Justice & police (incl refugees) Ruth Metzler (CVP)
Defence & sport Samuel Schmid (SVP)
a Current holder of the one-year rotating federal presidency.
Responsibility for the judiciary lies mainly with the cantons, with stronglyvarying judiciary structures, but the judicial reform approved in a referendumin March 2000 and in force since the beginning of 2002 has raised the profileof the federal judiciary. Before this the only federal institutions were theFederal Court in Lausanne, composed of 30 judges elected by the FederalAssembly, and the Federal Insurance Court in Lucerne. The main task of theFederal Court, as the supreme court of the confederation, is to ensure the equalapplication of federal law in all cantons. It has the right to examine whethercantonal laws breach the federal constitution and to annul them, but a similarprocedure for the examination of federal laws does not exist. The judicialreform will introduce a Federal Criminal Court and a Federal AdministrativeCourt, allowing appeals against decisions of the federal administration, andboth should start their work in 2003-05. This will help to reduce the currentlyexcessive workload of the Federal Court. As a result of the reform, the FederalProsecutor’s office has also obtained more powers, including primaryresponsibility to initiate and conduct investigations into organised crime,money-laundering and corruption, as well as other complex matters withstrong international or inter-cantonal links.
Political forces
Switzerland’s modern constitution originally produced a two-party system in1848, with the Liberals in government and the Conservatives playing the roleof the opposition. Subsequently a number of parties developed out of factionsof the Liberal Party. The Liberals, since renamed the Radical Democratic Party(FDP), were joined in government by the Conservatives, now the ChristianDemocratic Party (CVP), in 1891 and by the agrarian Swiss People’s Party (SVP)in 1929. The Social-democratic Party of Switzerland (SP), after having alreadyshared power in 1943-52, joined the “bourgeois” parties in government in1959. Most of the political parties are organised on a cantonal basis, with aweak national structure.
The Radical Democratic Party (FDP), previously the Liberal Party, was thedominant political party from 1848 to 1900. From a 19th-century British-styleradical liberal party it developed into a centre-right party with a pro-marketstance on economic policy, demanding a reduction of state intervention in the
The judicial system
The party system developsfrom bipolar to multipolar
Government includes allfour major parties
Switzerland 9
© The Economist Intelligence Unit Limited 2002 EIU Country Profile 2002
economy and resisting attempts to raise taxes. It generally backs the FederalCouncil’s plans for a more active role on the international scene, although it hasshifted to a more cautious, long-term outlook on EU accession.
The Christian Democratic Party (CVP) developed from the originalConservative opposition and is primarily focused on the traditionally Catholiccantons of central Switzerland and some francophone areas. The CVP’s politicalplatform tends to be conservative and paternalistic, and favours a more activeforeign policy, including EU membership.
The Social-democratic Party (SP), an offshoot of the Liberal Party, is asocialist party embracing a fairly wide spectrum of left-leaning views. Unlikemany socialist parties in other European countries, the SP has not undergone ashift to the centre and still backs relatively left-leaning policies. It tends to resisteconomic liberalisation and deregulation, and has frequently backed referendumsagainst such policies.
The Swiss People’s Party (SVP) has distanced itself from its old Liberal Partyroots as the moderate wing of the party has declined in the past decade. Themore radical faction with its populist, nationalistic, right-wing platform is nowthe dominant force in the party, and its anti-EU and anti-UN position hasenabled the SVP to draw voters from radical right-wing parties outside the federalcoalition. The SVP has a strong base among rural communities and smallbusinesses in German-speaking areas, and is seeking to boost its importance infrancophone regions where the party is weak. It has also broadened its policyfocus in recent years with a strong anti-welfare stance and an emphasis onshareholders’ rights designed to appeal to the business community.
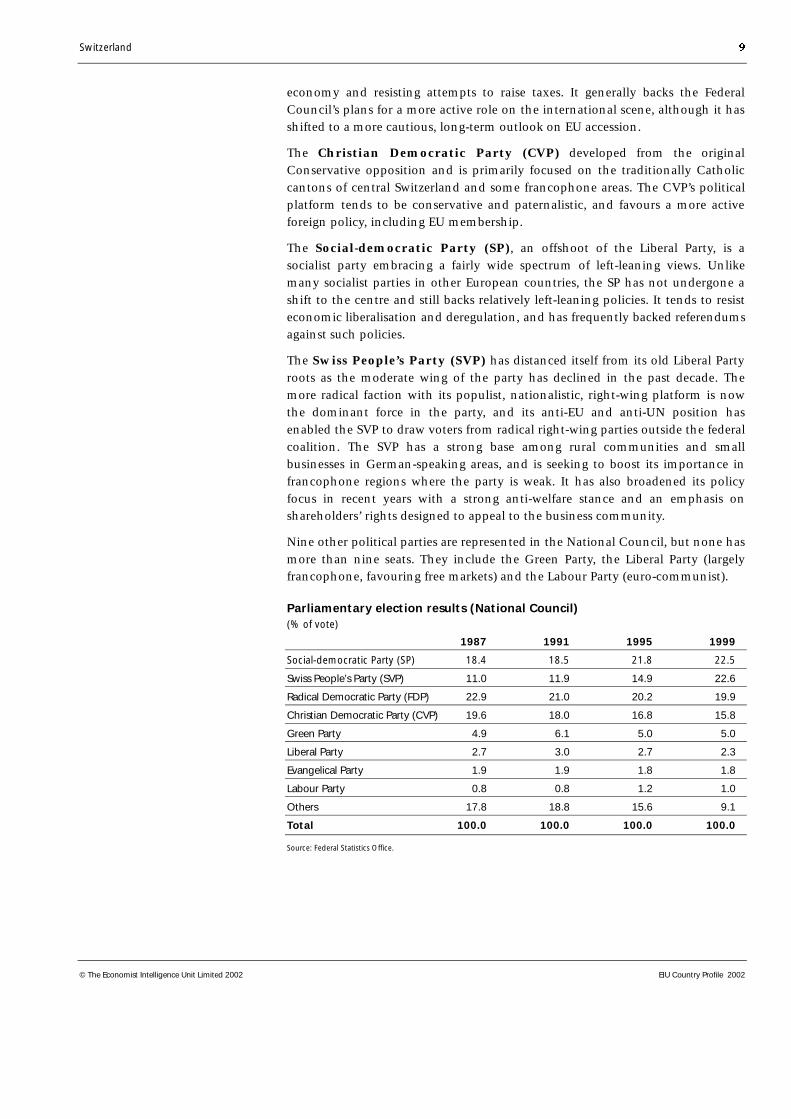
Nine other political parties are represented in the National Council, but none hasmore than nine seats. They include the Green Party, the Liberal Party (largelyfrancophone, favouring free markets) and the Labour Party (euro-communist).
Parliamentary election results (National Council)(% of vote)
1987 1991 1995 1999
Social-democratic Party (SP) 18.4 18.5 21.8 22.5
Swiss People’s Party (SVP) 11.0 11.9 14.9 22.6
Radical Democratic Party (FDP) 22.9 21.0 20.2 19.9
Christian Democratic Party (CVP) 19.6 18.0 16.8 15.8
Green Party 4.9 6.1 5.0 5.0
Liberal Party 2.7 3.0 2.7 2.3
Evangelical Party 1.9 1.9 1.8 1.8
Labour Party 0.8 0.8 1.2 1.0
Others 17.8 18.8 15.6 9.1
Total 100.0 100.0 100.0 100.0
Source: Federal Statistics Office.
10 Switzerland
EIU Country Profile 2002 © The Economist Intelligence Unit Limited 2002
Main political figures
Christoph Blocher (SVP): Switzerland’s most prominent Eurosceptic andisolationist, leading the SVP’s cantonal organisation in Zurich and representingthe party in the National Council. A charismatic politician and successfulindustrialist, his more radical wing dominates the SVP and he has vowed to usethe referendum system to oppose key areas of foreign and welfare policy. Hewas at the forefront of opposition to UN membership.
Christiane Brunner (SP): Elected leader of the country’s largest party inOctober 2000, Ms Brunner is a former trade union leader and women’s rightsactivist. She was rejected by parliament as an SP candidate for the Federal Councilin 1993 after a strong personal campaign against her. One of Geneva’s repre-sentatives in the Council of States and a popular figure on the left wing of theparty.
Pascal Couchepin (FDP): Elected to the Federal Council in March 1998. Aformer mayor of Martigny in the canton of Valais, Mr Couchepin is a firmsupporter of economic liberalisation and deregulation, which has brought himinto frequent conflict with the SP. He has also been the prime mover behind ashift in Federal Council policy to slow down its long-term aim of EU membership.
Joseph Deiss (CVP): Foreign minister since March 1999. Bilingual (French/German) economics professor from Fribourg University. Mr Deiss led the campaignfor UN membership, but was weakened by referendum setbacks on prospectiveEU membership negotiations, which are now only a distant prospect.
Ruth Dreifuss (SP): Interior minister since 1993 and, in 1999, the first womanto hold the rotating Swiss presidency. A former trade unionist, she was the firstperson from Switzerland’s tiny Jewish community to be elected to the FederalCouncil. Ostensibly from Geneva (to qualify as a francophone) but actually bornin German-speaking Aargau, Ms Dreifuss has dealt with the politically sensitiveissues of social security and pensions reform, as well as spiralling healthinsurance costs.
Moritz Leuenberger (SP): Head of the Ministry of Environment, Transport,Energy and Communications, Mr Leuenberger was elected in 1995. Hisresponsibility for the liberalisation and privatisation of the telecoms andelectricity markets has repeatedly brought him into conflict with his own party.
Ruth Metzler (CVP): Born in 1964, Ms Metzler took over the Ministry ofJustice and Police in March 1999 as Switzerland’s youngest-ever minister. Alawyer from German-speaking Appenzell-Innerrhoden, Switzerland’s smallest(half-) canton, she has placed particular emphasis on asylum policy and isengaged in reforms to naturalisation laws.
Samuel Schmid (SVP): Elected in December 2000 as new federal councillorwith responsibility for defence and sports, Mr Schmid replaced Adolf Ogi, whoresigned for personal reasons. A representative of the moderate Bernese factionof his party, he was not an official candidate of the SVP. Mr Schmid isresponsible for army reforms and helped steer legislation allowing armed Swisstroops to be engaged in international peacekeeping through a referendum,despite his own party’s opposition to the reform.
Switzerland 11
© The Economist Intelligence Unit Limited 2002 EIU Country Profile 2002
Kaspar Villiger (FDP): A German-speaking industrialist from Lucerne, he wasdefence minister in 1989-95 and is now finance minister. In 2002 he also holdsthe rotating presidency of the Federal council. Mr Villiger has staunchly backedfiscal consolidation programmes, but has had to resist increasing demands formore substantial tax reductions than those suggested by the government. He isat the forefront of the political defence of banking secrecy in negotiations withthe EU on new bilateral accords.
International relations and defence
While Switzerland as a whole has cautiously shifted towards a more engagedinternational role since the end of the cold war, it has largely been through adesire for economic co-operation. This has entailed greater participation insome international organisations, including the World Bank and theInternational Monetary Fund, as well as closer economic ties with the EU. Butdemands to surrender sovereign rights to international organisations, forexample through EU membership, or to take a less restrictive stance on thecountry’s neutrality, by greater involvement in international defence co-operation, remain a principal cause of political friction.
Situated in the heart of Europe, Switzerland has inevitably built close economicties with the EU, by far its most important trading partner. However, politicallinks with the EU have developed only gradually. A member of the EuropeanFree-Trade Association (EFTA), Switzerland has had a free-trade agreement withthe European Economic Community (EEC, now EU) since 1972, and there arenumerous other agreements with Brussels on practical issues such as rules oforigin and tackling customs fraud. In May 1992 the Federal Council submittedan application for membership, but the accession process was halted inDecember after Swiss voters narrowly rejected the country’s proposed accessionto the European Economic Area (EEA), which allows non-EU members toparticipate in the European single market. A further obstacle was placed in theway of the government’s stated long-term aim when a popular initiativedemanding the immediate start of accession negotiations was strongly rejectedin a referendum in March 2001. The initiative was opposed not only by the anti-EU camp, but also by many supporters of EU accession, including the governmentwho believed that the timing was not right. Consequently, the extent of thedefeat—76.7% voted no, with the highest turnout in any referendum since1992—should not be interpreted as a sign of equally strong opposition to EUaccession over the longer term. Nevertheless, it has slowed the momentumtowards EU accession, and substantive moves are now unlikely during the nextlegislative term (2003-07).
Large parts of the population resent the limitations on direct-democratic rightsthat would result from EU accession, as EU legislation (which would not be subjectto referendums) would have supremacy over Swiss law. Many also feel that thecountry has fared well by remaining aloof from international engagement, andtherefore do not want to give up its traditional political isolation. On theeconomic side, EU membership would probably entail an end to Switzerland’scherished bank secrecy (although even outside the EU it may be difficult to
Relations with the EU
12 Switzerland
EIU Country Profile 2002 © The Economist Intelligence Unit Limited 2002
defend) and an increase in the value-added tax (VAT) rate from the current 7.6%to the EU minimum of 15%. Participation in the euro area would also entail arise in interest rates, although as a corollary it would abandon exposure of Swissindustry to exchange rate fluctuations vis-à-vis the euro. The disadvantages ofremaining outside the EU that cannot be tackled by bilateral co-operationinclude some non-tariff trade barriers and the fact that Switzerland cannotparticipate in decisions that have a very strong impact on its economy because ofeconomic close integration with the EU.
First package of bilateral agreements with Brussels
A package of seven bilateral agreements with Brussels, which was accepted by67.2% of Swiss voters in a referendum in May 2000, will come into force in thefirst half of 2002, about a year behind schedule because of delayed ratificationby some EU member states. The agreements cover the following areas:
Air transport: Improved access for Swiss carriers in Europe and reciprocalrights for EU carriers in Switzerland. Implementation will come in two steps,directly after the accords come into effect and two years later, with negotiationson complete liberalisation due to begin five years after the start of implementation.
Road transport: In return for better access to the EU’s road haulage market by2005 and concessions in aviation, relaxation of Switzerland’s 28-tonne lorryweight limit in stages, with access for the EU’s 40-tonne trucks three years afterthe accords come into effect. Under a new system of taxing heavy lorries byweight, distance travelled and pollution caused, trucks will have to pay a transitfee rising progressively from Swfr172 initially to Swfr325 (about US$185) sevenyears later. Transalpine road haulage will be subject to a limit and the Swiss hopeto force most transit traffic onto a north-south “piggy-back” rail service by 2008.
Free movement of people: Swiss people will benefit from full free movementin the EU within two years of the agreement coming into force, whereas theSwiss quota system for work permits as applied to EU and EFTA citizens will bescrapped only after five years. Swiss quotas may also be reintroduced for a limitedperiod if inflows of west European immigrants are strong. Seven years after theaccord becomes effective Switzerland can (and probably will) hold a referendumon whether to opt out of the pact. The agreement also includes mutualrecognition of diplomas and social security entitlements.
Access to agricultural markets: Lowering of non-tariff barriers to trade inagricultural goods, as well as some tariffs on farm products, which will boostexports of Swiss cheese and imports of some EU-produced fruit and vegetablesinto Switzerland.
Elimination of technical obstacles to trade: Mutual recognition oftrademarks, technical regulations and other rules and procedures for testingand certification of industrial goods.
Public procurement: Access for EU companies to procurement by localcommunes, and by the water, energy and railway sectors in Switzerland, withreciprocal rights for Swiss companies in the EU. Federal and cantonal contractsare already open to foreign competition under the public procurement agreement
Switzerland 13
© The Economist Intelligence Unit Limited 2002 EIU Country Profile 2002
of the World Trade Organisation (WTO). The Swiss telecoms sector was openedto competition in January 1998, at the same time as the EU market.
Research and development: Observer status for Switzerland on the variouscommittees managing EU research programmes (and awarding contracts), inreturn for a contribution to the EU’s research budget.
With EU membership now only a distant prospect, Swiss-EU relations arefocused on bilateral ties. A first package of bilateral agreements with the EU isdue to take effect in the first half of 2002. The government claims that theaccords could add Swfr8bn (US$5.2bn), or 2%, to Swiss GDP over the next decade.Negotiations on a new package of agreements started in 2001. Switzerland’s mainpriority in the new round of talks is participation in the EU’s Schengenagreement covering co-operation on justice and home affairs, with particularfocus on controlling the inflow of asylum-seekers. The EU has put strongemphasis on co-operation against fraud and tax evasion and major differenceshave emerged over Swiss banking secrecy.
Another key area of domestic political tension has been the issue of UNmembership, which, after having been rejected in 1986, was approved in areferendum on March 3rd 2002. While the popular vote, with 54.6% in favour,was reasonably clear, the second requirement for approval, a majority of votes inmore than half of the cantons was only just met, with 12 cantons voting infavour and 11 against. The Swiss have often interpreted their country’s neutralityas requiring not only abstention from participation in wars abroad but also frommembership in major international organisations. The narrowness of the resultsuggests that these reservations remain very virulent.
Switzerland has only observer status in the UN General Assembly, although itparticipates in and is host to many UN organisations. It is also a full member ofthe OECD, the Council of Europe, the Organisation for Security and Co-operationin Europe (OSCE), the World Trade Organisation (WTO) and EFTA. Since the endof the cold war the government has attempted to take a more active role inforeign relations by further integrating the country into the network ofinternational organisations. In 1992 the electorate backed membership of theInternational Monetary Fund (IMF) and the World Bank. Proposals to use troopsfor a wider range of peacekeeping missions and to arm soldiers serving abroadwere also approved in a referendum in June 2001, in effect reversing a previousrejection of government proposals in 1994.
Several initiatives undertaken by the Swiss government to uncover the truth andreturn assets to their rightful owners are due to be completed in 2002, notablypayments by an official Holocaust compensation fund to victims mainly ineastern Europe, and the wider-ranging historical investigation into Switzerland’swartime history by the Bergier Commission. The settlement of Nazi-era claimshas been a priority for the government, as Swiss entanglement in and allegedbenefits from the Holocaust have severely tarnished the reputation of the country.However, another cornerstone of its effort to secure international rehabilitationfor Switzerland’s wartime role, the Solidarity Foundation, which is intended tofund charitable projects, has run into strong political opposition at home, and its
UN membership
Nazi gold and Jewish assets
14 Switzerland
EIU Country Profile 2002 © The Economist Intelligence Unit Limited 2002
funding will still have to pass direct-democratic hurdles. The plan to endow theFoundation with a share of the proceeds from the sale of 1,300 tonnes of theSwiss National Bank’s gold reserves that are no longer needed for monetarypolicy purposes has run into opposition from the SVP. The party launched apopular initiative to promote its proposal to devote the whole of the proceeds ofthe gold sales to the pension system.
In August 1998 the two largest Swiss banks, the Union Bank of Switzerland (UBS)and Credit Suisse, agreed to pay US$1.25bn to settle the dispute with Jewishorganisations over Switzerland’s treatment of gold looted by the Nazis during thesecond world war and the assets of Jewish victims of the Holocaust. The dealremoved all claims against other Swiss banks, industry, the Swiss governmentand the Swiss National Bank (SNB, the central bank), as well as financial sanctionsimposed or threatened by US state and local financial officials. After a forensicaudit (which the banks claim cost them up to Swfr1bn) by the Volckercommission, details of 21,000 accounts with a “possible or probable” relation-ship to victims of the Holocaust were published in February 2001.
A major reform of the armed forces, involving a shift towards a moreprofessional army and greater international engagement in order to meet majorexternal threats, is likely to be put to a referendum in 2003 in time forimplementation in 2004. The plans will lower the age at which reserve dutiesend (currently 42) to 30 and reduce the total amount of service due, followinggrowing complaints from companies about the cost of releasing employees onpaid leave to carry out their military service every year. The plans include anincrease in the number of professional soldiers in the military from 3,600 in2000 to 120,000 and a reduction of reserves from 351,200 to 80,000. Militaryservice will remain compulsory for all Swiss men in good health. In a referendumin June 2001 the electorate approved a law allowing armed Swiss troops toparticipate in UN and OSCE peacekeeping missions. Switzerland currentlyprovides unarmed military observers for some UN operations (including Koreaand the Middle East) and unarmed support staff for the Kosovo Force (KFOR)troops in Yugoslavia.
Defence expenditure has fallen steadily over the past decade: the 2001 budgetallocated Swfr4.7bn to defence, compared with more than Swfr6bn in 1990.However, the economic costs, which include the cost to firms of employees awayon compulsory army training (estimated at Swfr7.5bn by the Ministry ofDefence), are far higher. Switzerland also has a comprehensive civil defencesystem that requires each commune to establish a local civil defence organisationand to provide sufficient nuclear shelters for the entire population.
Military forces, 2000
Army/air forceProfessional soldiers 3,600Reserves 351,200
Total 354,800
Source: International Institute for Strategic Studies, The Military Balance 2001/2002.
Neutrality and defence
Switzerland 15
© The Economist Intelligence Unit Limited 2002 EIU Country Profile 2002
Resources and infrastructure
Population
The 2000 census shows a total population of 7.21m, which represented anincrease of 5.9% compared with 1990. Average population growth of 0.7%between 1990 and 1998 was higher than the EU average of 0.3%. Populationgrowth in Switzerland was similar to that in Ireland, the Netherlands andAustria. However, in Switzerland and Austria this was mainly a result of netimmigration rather than natural population growth. Life expectancy inSwitzerland is also very high by international comparison: in 1998 it was 82.5years for women and 76.5 years for men, which was considerably higher thanthe EU average of 80.9 and 74.6 respectively.
Since the 1980s population growth has been driven more by net immigrationthan by natural population growth. The share of the foreign population amongthe resident population (excluding asylum-seekers and seasonal workers) hasrisen from 16.2% in 1970 to 20.5% in 2000, one of the highest ratios in the EU.
The high proportion of foreigners in Switzerland is also the result of a very lowrate of naturalisation, due to strict naturalisation laws. In 1999 only 1.5% ofresident foreigners acquired a Swiss passport, a ratio which is low by EUstandards. Yet almost one-quarter of the resident foreign population was born inSwitzerland and 36% of the rest have been living there for more than 15 years.Almost two-thirds of the foreigners living in Switzerland are EU nationals (fromItaly, Portugal and Germany). During the early 1990s and again during theKosovo war in 1998 there was a rapid rise in the number of people fromYugoslavia, but following stabilisation in the Balkans many have since returned.Resentment towards foreigners, fostered by an insular mentality, particularly inthe smaller German-speaking cantons, has been a long-term characteristic of thepolitical scene in Switzerland.
The problems associated with population ageing pose a major challenge toSwitzerland over the coming decades. The Federal Statistics Office projects thatby 2020 the size of the population will have reached 7.5m, with the rate ofaverage population growth expected to fall from 0.7% in 2000 to 0.2%. Naturalpopulation growth is forecast to slow but to remain positive. The importanceof net immigration is projected to rise, with the liberalisation of labourmovements as part of the bilateral treaty with the EU likely to intensify thistrend. The main challenge will be the change in the age structure, with theshare of old people (over 64 years) projected to rise from 14.7% in 2000 to19.1% by 2020, and the dependency ratio (people over 65 years relative tothose aged 20-64 years) set to rise from 23.7% in 2000 to 32.1% in 2020.However, Switzerland is relatively well prepared to deal with these challenges.Demographic trends are more favourable than in many EU countries and thepension system is well equipped to deal with population ageing.
16 Switzerland
EIU Country Profile 2002 © The Economist Intelligence Unit Limited 2002
Education
In 1998 Switzerland spent an equivalent of 5.4% of GDP on public education,which is below the ratios in France, Austria and the Scandinavian countries butmoderately above the OECD average of 5.1%. Between 1992 and 1998 statespending on education stagnated, which, given a rising number of pupils, led toan increase in class sizes. The Swiss education system is highly decentralised,both for financing and policymaking purposes. Municipalities and cantons arethe main source of finance for pre-school, primary and secondary education,while universities are co-financed between cantons and the federal government.There are eight cantonal universities, seven regional colleges of higher educationoffering degree-level vocational training and two federal polytechnics.
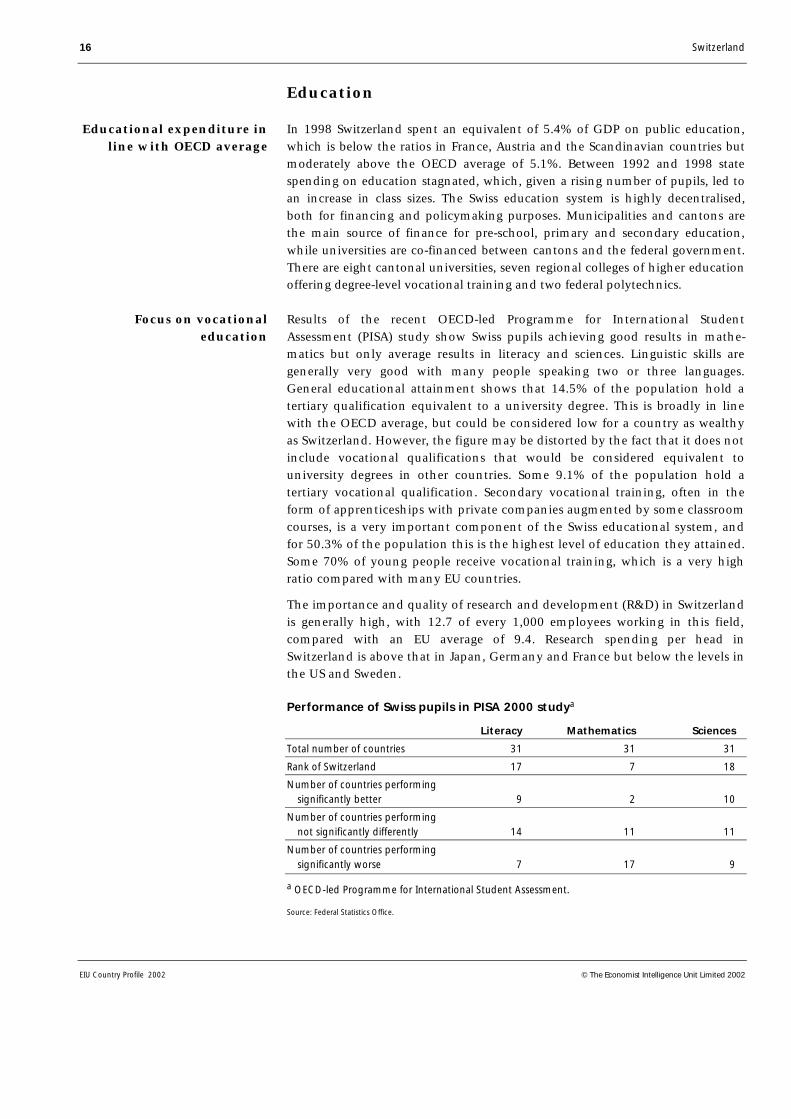
Results of the recent OECD-led Programme for International StudentAssessment (PISA) study show Swiss pupils achieving good results in mathe-matics but only average results in literacy and sciences. Linguistic skills aregenerally very good with many people speaking two or three languages.General educational attainment shows that 14.5% of the population hold atertiary qualification equivalent to a university degree. This is broadly in linewith the OECD average, but could be considered low for a country as wealthyas Switzerland. However, the figure may be distorted by the fact that it does notinclude vocational qualifications that would be considered equivalent touniversity degrees in other countries. Some 9.1% of the population hold atertiary vocational qualification. Secondary vocational training, often in theform of apprenticeships with private companies augmented by some classroomcourses, is a very important component of the Swiss educational system, andfor 50.3% of the population this is the highest level of education they attained.Some 70% of young people receive vocational training, which is a very highratio compared with many EU countries.
The importance and quality of research and development (R&D) in Switzerlandis generally high, with 12.7 of every 1,000 employees working in this field,compared with an EU average of 9.4. Research spending per head inSwitzerland is above that in Japan, Germany and France but below the levels inthe US and Sweden.
Performance of Swiss pupils in PISA 2000 studya
Literacy Mathematics Sciences
Total number of countries 31 31 31
Rank of Switzerland 17 7 18
Number of countries performing significantly better 9 2 10
Number of countries performing not significantly differently 14 11 11
Number of countries performing significantly worse 7 17 9
a OECD-led Programme for International Student Assessment.
Source: Federal Statistics Office.
Focus on vocationaleducation
Educational expenditure inline with OECD average
Switzerland 17
© The Economist Intelligence Unit Limited 2002 EIU Country Profile 2002
Health
The number of doctors has doubled over the past 20 years to stand at 1.8 per1,000 inhabitants in 1997, far below the EU average of 3.1. However, the numberof hospital beds per 1,000 inhabitants was 6.5, compared with an EU average of6.6. On both measures Switzerland stands well above the OECD average and thequality of service provided is considered to be very high. However, the healthcaresystem is very expensive and lacks efficiency. Total spending on healthcareamounted to 10.2% of GDP in 1997 (compared with 5% in 1960), well above theEU average of 8.5%, although Germany had an even higher ratio (10.7%).Private households pay two-thirds of these costs (largely via compulsory healthinsurance), the public sector around 25%, and companies and social securityfinance the rest.
The reliance on private financing has increased during the past decade, risingfrom 61% in 1991 to 66% in 1996. This trend probably continued in subsequentyears judging by the significant increase in healthcare premiums (by 12% in1997, 5% in 1998, 3% in 1999, 4% in 2000, 6% in 2001 and by another 10% in2002). The Federal Statistics Office has calculated that this has reducedhousehold disposable income by 0.3% and 0.4% in 2000 and 2001 respectively.An attempt to reform the health insurance act (KVG), which was lastoverhauled in 1996, is currently under way, and the main aim is to save coststhrough greater competition between doctors. Another measure currentlydebated is to cut pharmaceutical costs by allowing cheaper imports.
Natural resources and the environment
More than half of Switzerland is covered by the Alpine massif, which extendsfrom west to east. The Jura mountains form a spine along its northern flank,while the Alps carve a climatic and hydrological division between the largernorthern part and the southern part of the country. The main industrial centresand the most productive farms are concentrated in the long strip of relativelylow-lying land that runs from Geneva in the west through Zurich to St Gallen inthe east. The Rhone and Rhine rivers rise in the Swiss Alps, and Basle on theRhine is an important river port. Otherwise, waterways are not used forcommercial traffic. Switzerland’s many lakes, of which Lake Geneva is thebiggest, support small-scale fishing and a wide variety of leisure activities.
The Alpine region provides hydroelectric power, which accounts for 60% ofdomestically produced electricity. Apart from this, Switzerland has no otherenergy sources and no minerals or other deposits to speak of, and much of itsfarmland is on barren uplands. The real economic importance of the Alps comesas a tourist attraction, although the mountainous geography tends to increasethe costs of major infrastructure investments, such as new roads or railway linesor the expansion of the mobile phone network. In addition, the Alpine regionsare often struck by natural disasters, notably avalanches. 1999 was a particularlybad year, with a wave of avalanches in February, flooding in May and adevastating storm in December. Investment and research into measures toprevent natural disasters remains at a high level, and more recently there has
Health expenditure isvery high
Alpine environmentimportant for tourism
18 Switzerland
EIU Country Profile 2002 © The Economist Intelligence Unit Limited 2002
been greater emphasis placed on a less intensive and more ecological use ofnature and of natural resources.
Transport, communications and the Internet
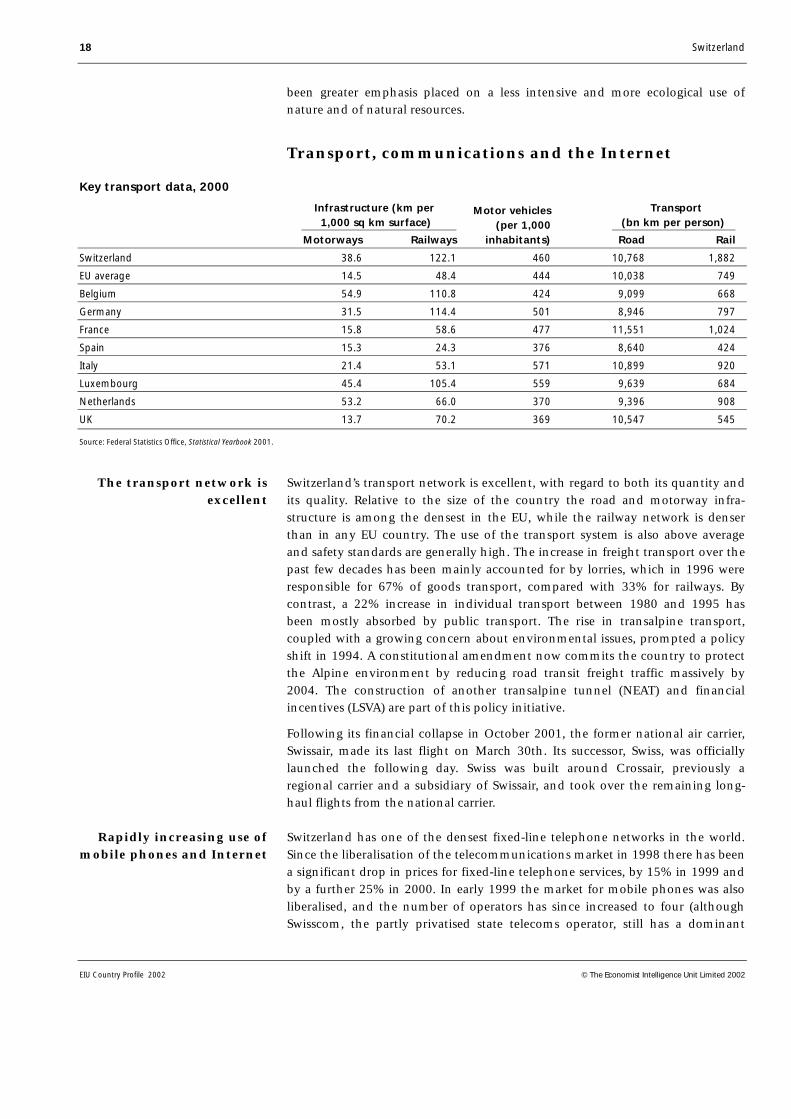
Key transport data, 2000
Infrastructure (km per Motor vehicles Transport
1,000 sq km surface) (per 1,000 (bn km per person) Motorways Railways inhabitants) Road Rail
Switzerland 38.6 122.1 460 10,768 1,882
EU average 14.5 48.4 444 10,038 749
Belgium 54.9 110.8 424 9,099 668
Germany 31.5 114.4 501 8,946 797
France 15.8 58.6 477 11,551 1,024
Spain 15.3 24.3 376 8,640 424
Italy 21.4 53.1 571 10,899 920
Luxembourg 45.4 105.4 559 9,639 684
Netherlands 53.2 66.0 370 9,396 908
UK 13.7 70.2 369 10,547 545
Source: Federal Statistics Office, Statistical Yearbook 2001.
Switzerland’s transport network is excellent, with regard to both its quantity andits quality. Relative to the size of the country the road and motorway infra-structure is among the densest in the EU, while the railway network is denserthan in any EU country. The use of the transport system is also above averageand safety standards are generally high. The increase in freight transport over thepast few decades has been mainly accounted for by lorries, which in 1996 wereresponsible for 67% of goods transport, compared with 33% for railways. Bycontrast, a 22% increase in individual transport between 1980 and 1995 hasbeen mostly absorbed by public transport. The rise in transalpine transport,coupled with a growing concern about environmental issues, prompted a policyshift in 1994. A constitutional amendment now commits the country to protectthe Alpine environment by reducing road transit freight traffic massively by2004. The construction of another transalpine tunnel (NEAT) and financialincentives (LSVA) are part of this policy initiative.
Following its financial collapse in October 2001, the former national air carrier,Swissair, made its last flight on March 30th. Its successor, Swiss, was officiallylaunched the following day. Swiss was built around Crossair, previously aregional carrier and a subsidiary of Swissair, and took over the remaining long-haul flights from the national carrier.
Switzerland has one of the densest fixed-line telephone networks in the world.Since the liberalisation of the telecommunications market in 1998 there has beena significant drop in prices for fixed-line telephone services, by 15% in 1999 andby a further 25% in 2000. In early 1999 the market for mobile phones was alsoliberalised, and the number of operators has since increased to four (althoughSwisscom, the partly privatised state telecoms operator, still has a dominant
The transport network isexcellent
Rapidly increasing use ofmobile phones and Internet
Switzerland 19
© The Economist Intelligence Unit Limited 2002 EIU Country Profile 2002
position). In 2000 the number of fixed-line telephones per 100 inhabitants was71, and for mobile phone users the figure was 65. Full liberalisation of the localloop remains the last major hurdle to clear for a fully liberalised telecoms market.However, following a recent decision by the High Court, further progress in thisrespect requires the government to prepare new legislation.
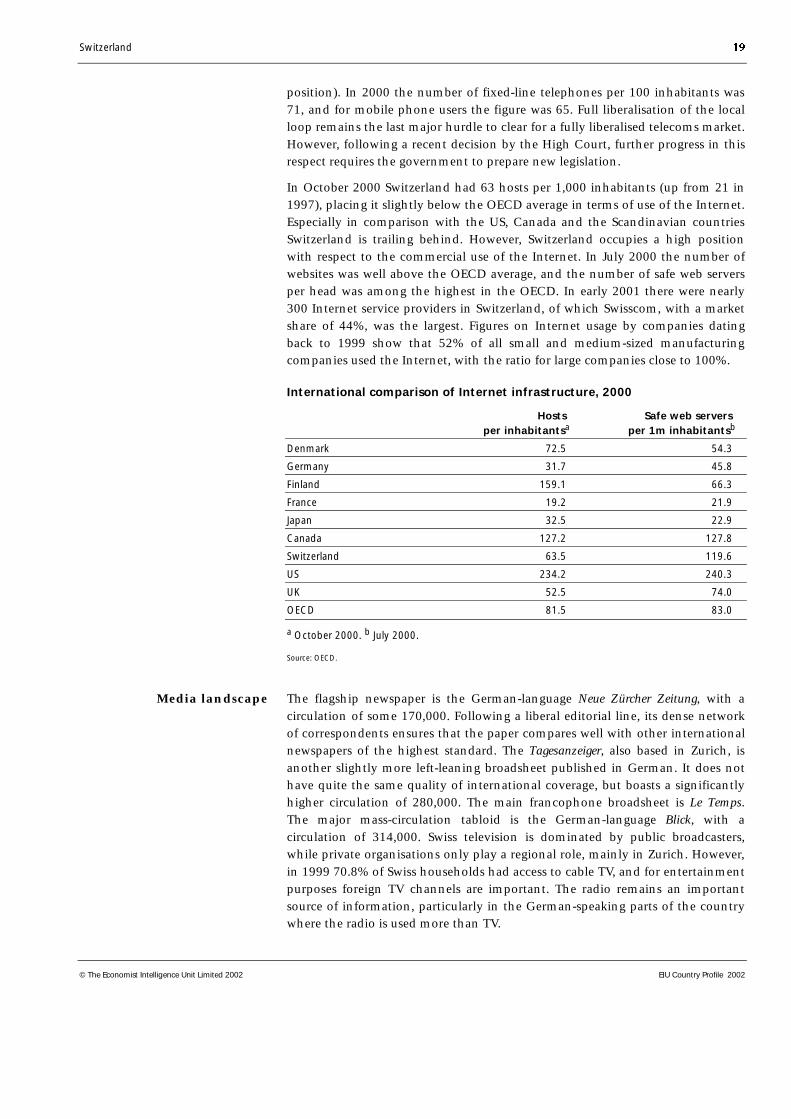
In October 2000 Switzerland had 63 hosts per 1,000 inhabitants (up from 21 in1997), placing it slightly below the OECD average in terms of use of the Internet.Especially in comparison with the US, Canada and the Scandinavian countriesSwitzerland is trailing behind. However, Switzerland occupies a high positionwith respect to the commercial use of the Internet. In July 2000 the number ofwebsites was well above the OECD average, and the number of safe web serversper head was among the highest in the OECD. In early 2001 there were nearly300 Internet service providers in Switzerland, of which Swisscom, with a marketshare of 44%, was the largest. Figures on Internet usage by companies datingback to 1999 show that 52% of all small and medium-sized manufacturingcompanies used the Internet, with the ratio for large companies close to 100%.
International comparison of Internet infrastructure, 2000
Hosts Safe web serversper inhabitantsa per 1m inhabitantsb
Denmark 72.5 54.3
Germany 31.7 45.8
Finland 159.1 66.3
France 19.2 21.9
Japan 32.5 22.9
Canada 127.2 127.8
Switzerland 63.5 119.6
US 234.2 240.3
UK 52.5 74.0
OECD 81.5 83.0
a October 2000. b July 2000.
Source: OECD.
The flagship newspaper is the German-language Neue Zürcher Zeitung, with acirculation of some 170,000. Following a liberal editorial line, its dense networkof correspondents ensures that the paper compares well with other internationalnewspapers of the highest standard. The Tagesanzeiger, also based in Zurich, isanother slightly more left-leaning broadsheet published in German. It does nothave quite the same quality of international coverage, but boasts a significantlyhigher circulation of 280,000. The main francophone broadsheet is Le Temps.The major mass-circulation tabloid is the German-language Blick, with acirculation of 314,000. Swiss television is dominated by public broadcasters,while private organisations only play a regional role, mainly in Zurich. However,in 1999 70.8% of Swiss households had access to cable TV, and for entertainmentpurposes foreign TV channels are important. The radio remains an importantsource of information, particularly in the German-speaking parts of the countrywhere the radio is used more than TV.
Media landscape
20 Switzerland
EIU Country Profile 2002 © The Economist Intelligence Unit Limited 2002
Energy provision
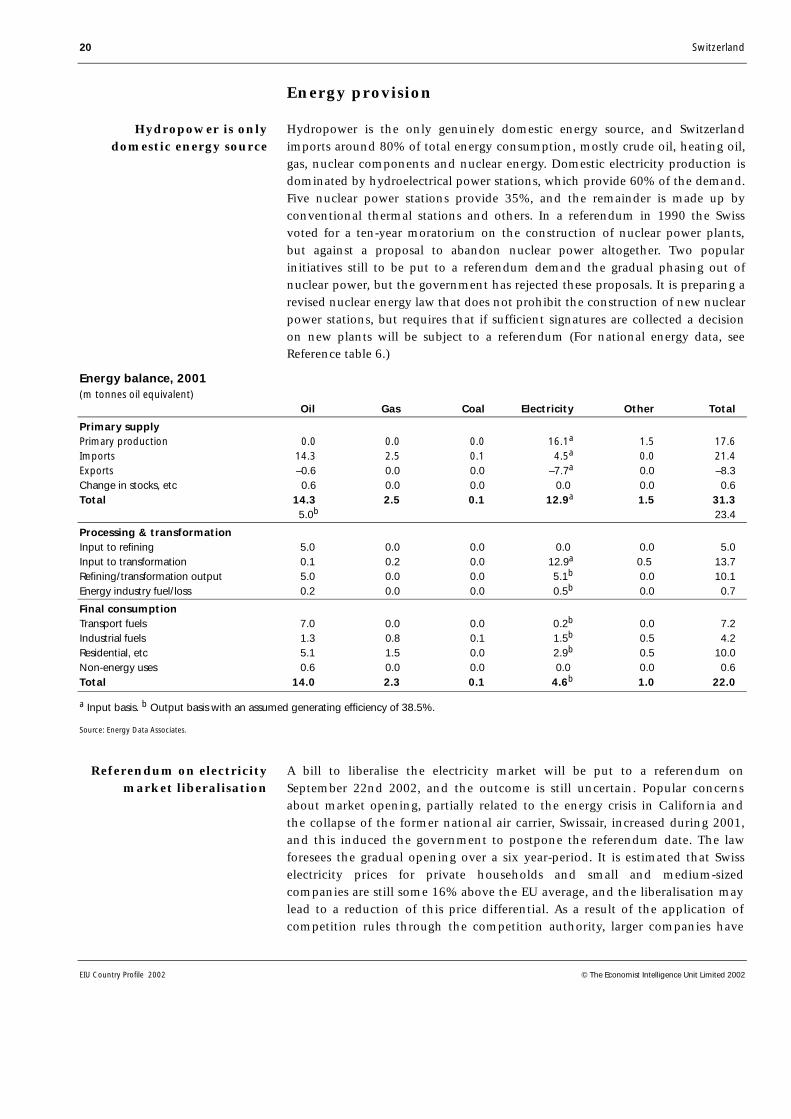
Hydropower is the only genuinely domestic energy source, and Switzerlandimports around 80% of total energy consumption, mostly crude oil, heating oil,gas, nuclear components and nuclear energy. Domestic electricity production isdominated by hydroelectrical power stations, which provide 60% of the demand.Five nuclear power stations provide 35%, and the remainder is made up byconventional thermal stations and others. In a referendum in 1990 the Swissvoted for a ten-year moratorium on the construction of nuclear power plants,but against a proposal to abandon nuclear power altogether. Two popularinitiatives still to be put to a referendum demand the gradual phasing out ofnuclear power, but the government has rejected these proposals. It is preparing arevised nuclear energy law that does not prohibit the construction of new nuclearpower stations, but requires that if sufficient signatures are collected a decisionon new plants will be subject to a referendum (For national energy data, seeReference table 6.)
Energy balance, 2001(m tonnes oil equivalent)
Oil Gas Coal Electricity Other Total
Primary supplyPrimary production 0.0 0.0 0.0 16.1a 1.5 17.6Imports 14.3 2.5 0.1 4.5a 0.0 21.4Exports –0.6 0.0 0.0 –7.7a 0.0 –8.3Change in stocks, etc 0.6 0.0 0.0 0.0 0.0 0.6Total 14.3 2.5 0.1 12.9a 1.5 31.3
5.0b 23.4
Processing & transformationInput to refining 5.0 0.0 0.0 0.0 0.0 5.0Input to transformation 0.1 0.2 0.0 12.9a 0.5 13.7Refining/transformation output 5.0 0.0 0.0 5.1b 0.0 10.1Energy industry fuel/loss 0.2 0.0 0.0 0.5b 0.0 0.7
Final consumptionTransport fuels 7.0 0.0 0.0 0.2b 0.0 7.2Industrial fuels 1.3 0.8 0.1 1.5b 0.5 4.2Residential, etc 5.1 1.5 0.0 2.9b 0.5 10.0Non-energy uses 0.6 0.0 0.0 0.0 0.0 0.6Total 14.0 2.3 0.1 4.6b 1.0 22.0
a Input basis. b Output basis with an assumed generating efficiency of 38.5%.
Source: Energy Data Associates.
A bill to liberalise the electricity market will be put to a referendum onSeptember 22nd 2002, and the outcome is still uncertain. Popular concernsabout market opening, partially related to the energy crisis in California andthe collapse of the former national air carrier, Swissair, increased during 2001,and this induced the government to postpone the referendum date. The lawforesees the gradual opening over a six year-period. It is estimated that Swisselectricity prices for private households and small and medium-sizedcompanies are still some 16% above the EU average, and the liberalisation maylead to a reduction of this price differential. As a result of the application ofcompetition rules through the competition authority, larger companies have
Referendum on electricitymarket liberalisation
Hydropower is onlydomestic energy source
Switzerland 21
© The Economist Intelligence Unit Limited 2002 EIU Country Profile 2002
already been able to benefit from substantial price cuts, by some 30% duringthe past few years. The path would also lead to the gradual opening of theconsumer market if the electricity market law is rejected in a referendum, butsuch an “uncontrolled market opening” would probably be less efficient thanthe more thoroughly regulated opening foreseen in the electricity market law.
The economy
Economic structure
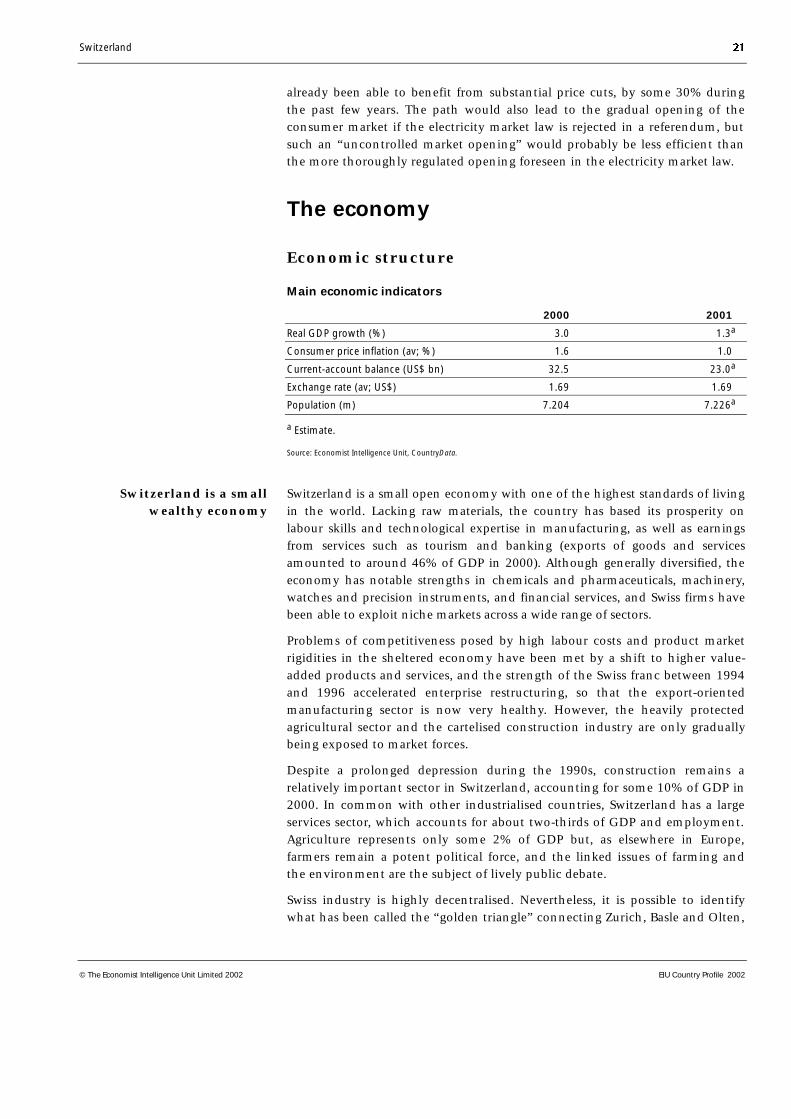
Main economic indicators
2000 2001
Real GDP growth (%) 3.0 1.3a
Consumer price inflation (av; %) 1.6 1.0
Current-account balance (US$ bn) 32.5 23.0a
Exchange rate (av; US$) 1.69 1.69
Population (m) 7.204 7.226a
a Estimate.
Source: Economist Intelligence Unit, CountryData.
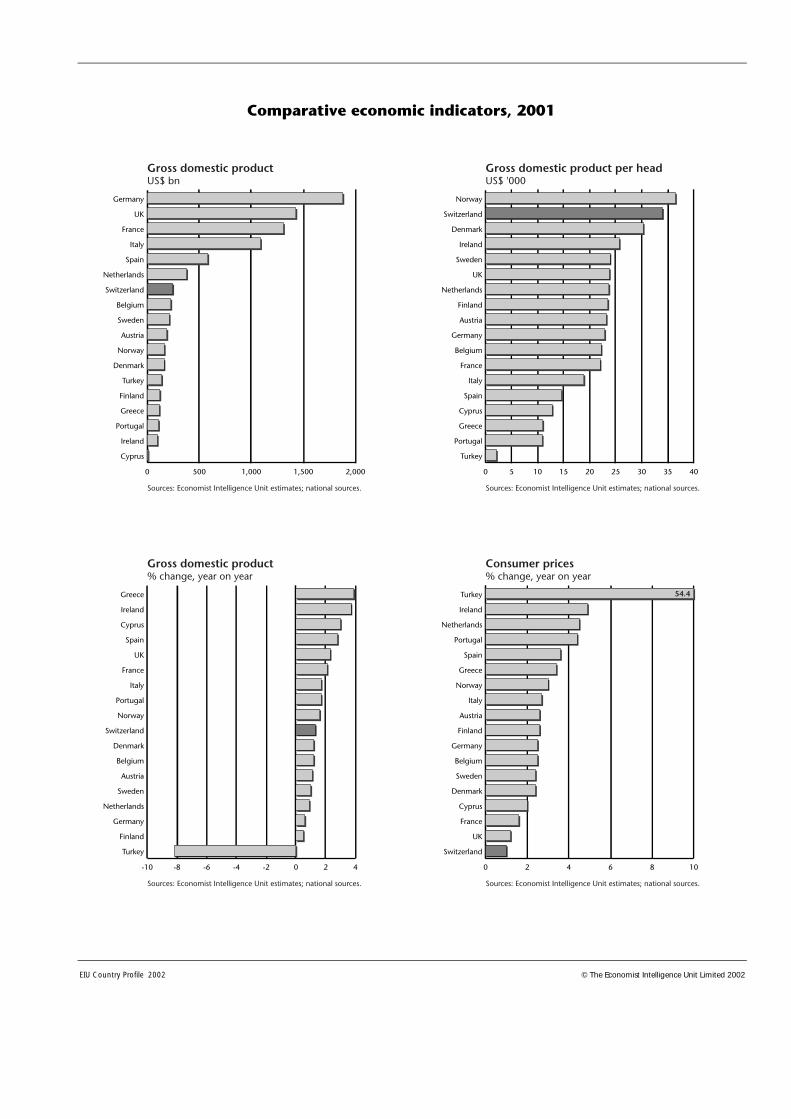
Switzerland is a small open economy with one of the highest standards of livingin the world. Lacking raw materials, the country has based its prosperity onlabour skills and technological expertise in manufacturing, as well as earningsfrom services such as tourism and banking (exports of goods and servicesamounted to around 46% of GDP in 2000). Although generally diversified, theeconomy has notable strengths in chemicals and pharmaceuticals, machinery,watches and precision instruments, and financial services, and Swiss firms havebeen able to exploit niche markets across a wide range of sectors.
Problems of competitiveness posed by high labour costs and product marketrigidities in the sheltered economy have been met by a shift to higher value-added products and services, and the strength of the Swiss franc between 1994and 1996 accelerated enterprise restructuring, so that the export-orientedmanufacturing sector is now very healthy. However, the heavily protectedagricultural sector and the cartelised construction industry are only graduallybeing exposed to market forces.
Despite a prolonged depression during the 1990s, construction remains arelatively important sector in Switzerland, accounting for some 10% of GDP in2000. In common with other industrialised countries, Switzerland has a largeservices sector, which accounts for about two-thirds of GDP and employment.Agriculture represents only some 2% of GDP but, as elsewhere in Europe,farmers remain a potent political force, and the linked issues of farming andthe environment are the subject of lively public debate.
Swiss industry is highly decentralised. Nevertheless, it is possible to identifywhat has been called the “golden triangle” connecting Zurich, Basle and Olten,
Switzerland is a smallwealthy economy
22 Switzerland
EIU Country Profile 2002 © The Economist Intelligence Unit Limited 2002
where many of Switzerland’s largest companies and banks have theirheadquarters. The “azure triangle”, with Geneva, Lausanne and Yverdon at itspoints, has a strong services and high-tech base.
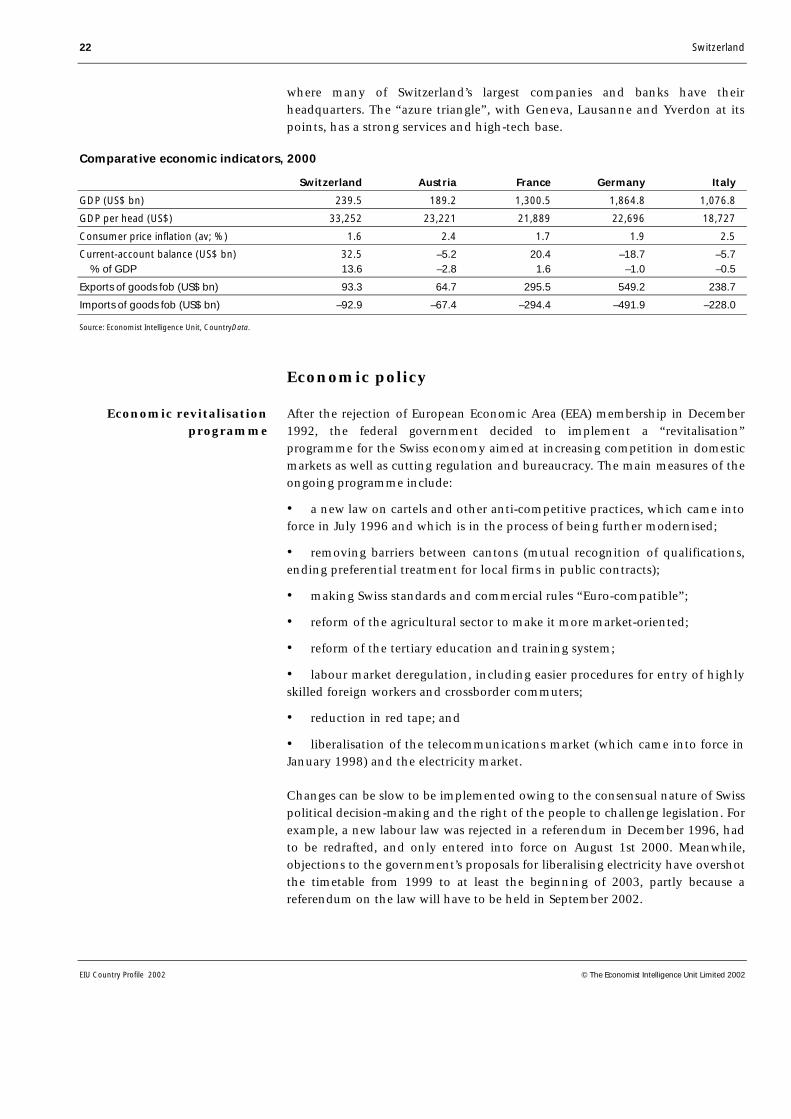
Comparative economic indicators, 2000
Switzerland Austria France Germany Italy
GDP (US$ bn) 239.5 189.2 1,300.5 1,864.8 1,076.8
GDP per head (US$) 33,252 23,221 21,889 22,696 18,727
Consumer price inflation (av; %) 1.6 2.4 1.7 1.9 2.5
Current-account balance (US$ bn) 32.5 –5.2 20.4 –18.7 –5.7 % of GDP 13.6 –2.8 1.6 –1.0 –0.5
Exports of goods fob (US$ bn) 93.3 64.7 295.5 549.2 238.7
Imports of goods fob (US$ bn) –92.9 –67.4 –294.4 –491.9 –228.0
Source: Economist Intelligence Unit, CountryData.
Economic policy
After the rejection of European Economic Area (EEA) membership in December1992, the federal government decided to implement a “revitalisation”programme for the Swiss economy aimed at increasing competition in domesticmarkets as well as cutting regulation and bureaucracy. The main measures of theongoing programme include:
• a new law on cartels and other anti-competitive practices, which came intoforce in July 1996 and which is in the process of being further modernised;
• removing barriers between cantons (mutual recognition of qualifications,ending preferential treatment for local firms in public contracts);
• making Swiss standards and commercial rules “Euro-compatible”;
• reform of the agricultural sector to make it more market-oriented;
• reform of the tertiary education and training system;
• labour market deregulation, including easier procedures for entry of highlyskilled foreign workers and crossborder commuters;
• reduction in red tape; and
• liberalisation of the telecommunications market (which came into force inJanuary 1998) and the electricity market.
Changes can be slow to be implemented owing to the consensual nature of Swisspolitical decision-making and the right of the people to challenge legislation. Forexample, a new labour law was rejected in a referendum in December 1996, hadto be redrafted, and only entered into force on August 1st 2000. Meanwhile,objections to the government’s proposals for liberalising electricity have overshotthe timetable from 1999 to at least the beginning of 2003, partly because areferendum on the law will have to be held in September 2002.
Economic revitalisationprogramme
Switzerland 23
© The Economist Intelligence Unit Limited 2002 EIU Country Profile 2002
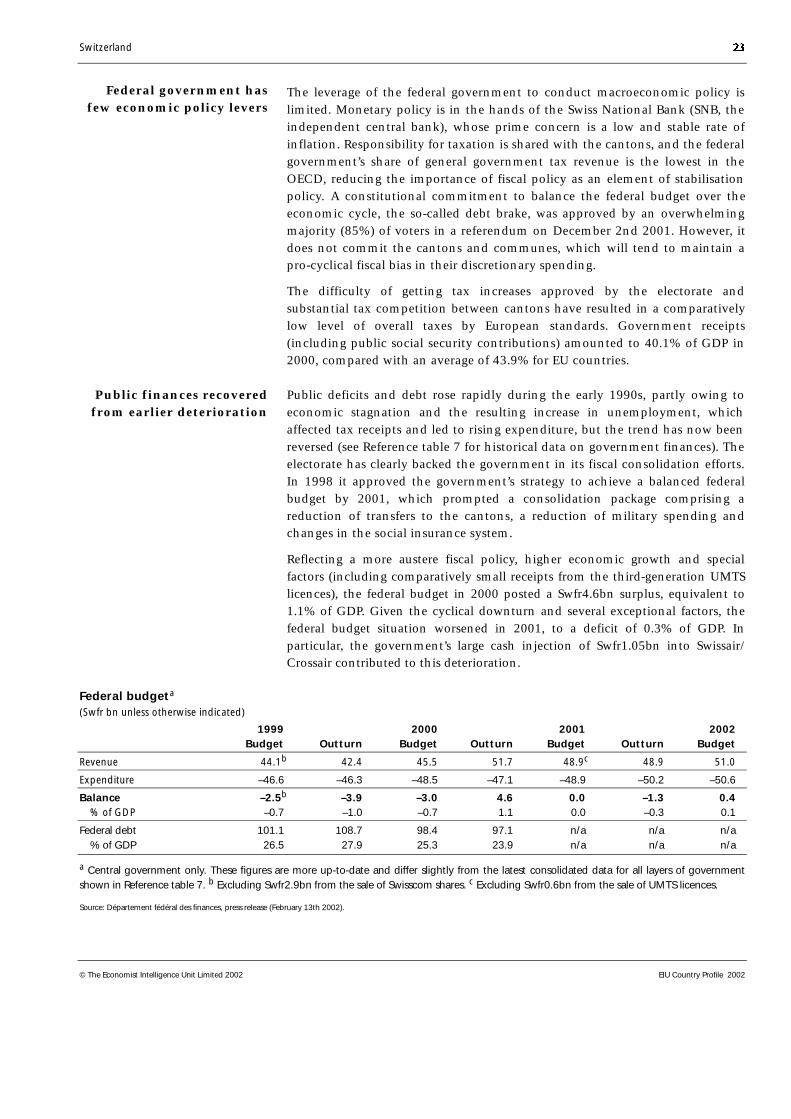
The leverage of the federal government to conduct macroeconomic policy islimited. Monetary policy is in the hands of the Swiss National Bank (SNB, theindependent central bank), whose prime concern is a low and stable rate ofinflation. Responsibility for taxation is shared with the cantons, and the federalgovernment’s share of general government tax revenue is the lowest in theOECD, reducing the importance of fiscal policy as an element of stabilisationpolicy. A constitutional commitment to balance the federal budget over theeconomic cycle, the so-called debt brake, was approved by an overwhelmingmajority (85%) of voters in a referendum on December 2nd 2001. However, itdoes not commit the cantons and communes, which will tend to maintain apro-cyclical fiscal bias in their discretionary spending.
The difficulty of getting tax increases approved by the electorate andsubstantial tax competition between cantons have resulted in a comparativelylow level of overall taxes by European standards. Government receipts(including public social security contributions) amounted to 40.1% of GDP in2000, compared with an average of 43.9% for EU countries.
Public deficits and debt rose rapidly during the early 1990s, partly owing toeconomic stagnation and the resulting increase in unemployment, whichaffected tax receipts and led to rising expenditure, but the trend has now beenreversed (see Reference table 7 for historical data on government finances). Theelectorate has clearly backed the government in its fiscal consolidation efforts.In 1998 it approved the government’s strategy to achieve a balanced federalbudget by 2001, which prompted a consolidation package comprising areduction of transfers to the cantons, a reduction of military spending andchanges in the social insurance system.
Reflecting a more austere fiscal policy, higher economic growth and specialfactors (including comparatively small receipts from the third-generation UMTSlicences), the federal budget in 2000 posted a Swfr4.6bn surplus, equivalent to1.1% of GDP. Given the cyclical downturn and several exceptional factors, thefederal budget situation worsened in 2001, to a deficit of 0.3% of GDP. Inparticular, the government’s large cash injection of Swfr1.05bn into Swissair/Crossair contributed to this deterioration.
Federal budgeta
(Swfr bn unless otherwise indicated)
1999 2000 2001 2002Budget Outturn Budget Outturn Budget Outturn Budget
Revenue 44.1b 42.4 45.5 51.7 48.9c 48.9 51.0
Expenditure –46.6 –46.3 –48.5 –47.1 –48.9 –50.2 –50.6
Balance –2.5b –3.9 –3.0 4.6 0.0 –1.3 0.4 % of GDP –0.7 –1.0 –0.7 1.1 0.0 –0.3 0.1
Federal debt 101.1 108.7 98.4 97.1 n/a n/a n/a % of GDP 26.5 27.9 25.3 23.9 n/a n/a n/a
a Central government only. These figures are more up-to-date and differ slightly from the latest consolidated data for all layers of governmentshown in Reference table 7. b Excluding Swfr2.9bn from the sale of Swisscom shares. c Excluding Swfr0.6bn from the sale of UMTS licences.
Source: Département fédéral des finances, press release (February 13th 2002).
Federal government hasfew economic policy levers
Public finances recoveredfrom earlier deterioration
24 Switzerland
EIU Country Profile 2002 © The Economist Intelligence Unit Limited 2002
The funding of the social security system, in particular of the state pensionscheme, is the subject of intense discussion. The dependency ratio—thepopulation aged under 15 and over 64 as a percentage of the total working-agepopulation—is expected to more than double by 2030, but the heavy relianceon a funded pension insurance system means that the resulting pressures onpublic finances will be less significant than in other OECD countries. Indeed,the OECD in its latest economic survey of Switzerland, published in December2000, made a favourable assessment of the Swiss pension system. The three-pillar system, with a pay-as-you-go state pension as the first pillar, a mandatoryprivate funded pension as a second pillar and additional voluntary provisionsas a third pillar, is generally in line with the OECD recommendations forpension policy. Nevertheless, maintaining the existing system of welfarebenefits could cost an extra Swfr15.3bn per year by 2010 and the governmentis pushing for less generous pension entitlements. Ongoing reforms of thepublic pension system (AHV), although introducing a flexible early retirementsystem, are mainly focused on securing the long-term viability of the system,for example, by raising the pensionable age for women by two years to 65, thesame level as men, and by preparing increases in the value-added tax (VAT) rateto subsidise the pension system.
Monetary policy is conducted by the Swiss National Bank (SNB, the centralbank), which has a long track record and excellent reputation for the success ofits anti-inflationary policy. The central bank is completely independent, andpolicy decisions are taken by a three-person governing board. In December 1999the SNB announced major changes of its monetary policy instruments. Thechanges included the abolition of the money supply target, which had becomeproblematic due to large fluctuations of the money supply induced by changesin the financial structure, such as an increased use of credit cards (see Referencetable 8 for historical data on money supply.) Instead, the SNB set an inflationrate of 2% as an upper reference value. This implied a step in the direction ofinflation targeting, but the central bank insists that its monetary policy strategyis more flexible than an inflation target. This flexibility is needed to allow thecentral bank to accept temporarily somewhat higher inflation in order to assuagea negative impact on economic growth from a sharp exchange-rate appreciation.A new central bank law is currently under debate. The most controversialelement is the redefinition of the mandate of the central bank. The current stateof debate suggests that the new law will stipulate price stability to be the maintarget of monetary policy, but that the SNB will also be committed to take intoaccount the development of the real economy.
Distortions in money supply growth led the SNB into an overly restrictivemonetary policy during the first half of the 1990s that contributed significantlyto prolonging the recession and slowing the recovery. As a reaction, the SNB’sprimary objective from 1995 onwards was to weaken the overly strong Swissfranc, which had severely hit the export industry. During the first half of 2000the SNB raised interest rates aggressively, as GDP growth prospects in Switzerlandwere seen to be greatly improved and fears of wage inflation took hold, and thecentral bank was equally quick to ease rates during 2001 to boost growth.
Ageing hits pension systemdespite sound policies
Successful anti-inflationarymonetary policy
Switzerland 25
© The Economist Intelligence Unit Limited 2002 EIU Country Profile 2002
The introduction of the euro at the beginning of 1999 has left Switzerland one ofonly five major west European countries with domestically determinedmonetary policy (the others being Norway, Sweden, the UK and Denmark,although in the latter case the leeway of the domestic authorities is limited byexchange-rate policy). For much of 1999 the Swiss franc remained very stableagainst the new currency, at a rate of around Swfr1.60:€1. This was the result ofthe SNB’s exchange-rate-oriented policy and the synchronisation of the businesscycle in the euro zone and in Switzerland. However, following the aggressivemonetary tightening in the first half of 2000 to combat inflationary pressures,the Swiss franc appreciated considerably against the euro. The increased globaluncertainty following the terrorist attacks in the US on September 11th 2001 hasalso led to a substantial appreciation of the Swiss franc, which continues to beconsidered as a safehaven currency. (Historical data on interest rates are shownin Reference table 9.)
Important economic institutions and organisations
Within the federal government, responsibility for economic policy is split between theMinistry of Economic Affairs (economic analyses and forecasts for government use,regional, agricultural and employment policies) and the Ministry of Finance (taxationand fiscal policy).
The Swiss Employers’ Association is the main representative employers’ organisation, butgiven that labour contracts are mostly negotiated on a company or sectoral level its overallimpact is fairly moderate. Much more important is the main industrialists’ organisation, theSwiss Business Federation (Economie Suisse), formed by the merger of the powerful SwissUnion of Commerce and Industry (Vorort) and the Society for the development of theSwiss Economy (wf) in 2000. The organisation has close links with the FDP and generallyrepresents industrialists’ interests, particularly in referendum campaigns. The Swiss Farmers’Union, which is close to the People’s Party, represents most Swiss farmers.
The Swiss Trade Union Federation (SGB) is the largest of several trade union groupings,with 395,420 members, and has links to the Social-democratic Party. The Federation ofPublic Employees has 163,790 members, and the Federation of Staff Associations(white-collar employees) has 120,150 members. In comparison with most otherEuropean countries, labour unions play only a relatively small role in political andeconomic life. This, like the limited importance of the Swiss Employers’ Association, canbe attributed to the structure of the Swiss labour market.
Economic performance
Switzerland enjoyed quite strong economic growth in the second half of the1980s, helped by a weakening of the Swiss franc, buoyant private consumptionand a construction boom. By 1990 the economy had begun to slow, as restrictivemonetary policies to curb inflation started to take effect. In 1991 the Swisseconomy dipped into recession, led by a steep decline in construction (mainly asa result of historically high interest rates) and a drop in exports as the worldeconomy weakened.
Buoyant expansion in 2000after sustained downturn
26 Switzerland
EIU Country Profile 2002 © The Economist Intelligence Unit Limited 2002
This was followed by six years of economic stagnation as high interest ratesand the strong currency continued to depress domestic demand and reduce thecompetitiveness of Swiss exports in flagging European markets. Real GDP didnot surpass its 1990 level until 1997. Modest growth in 1997 and 1998 wasencouraged by a decline in the international value of the Swiss currency andbuoyant exports. By late 1998, however, the repercussions of the Asian crisis inother parts of the world had begun to feed through into foreign deliveries andthere was a sharp slowdown in overall economic activity.
Domestic demand, which had proved fairly resilient during the downturn, laidthe foundation for a gradual acceleration in growth during 1999. The steadydecline in the unemployment rate—which fell below 2% in early 2000—raisedconsumer sentiment, while the brightening outlook for exports made growthmore evenly balanced. GDP growth of 3% in 2000 was the highest in a decade.However, the global economic slowdown during 2001 and the substantiallystronger Swiss franc after the September 11th terrorist attacks on the US hitexport and investment demand and brought growth to a virtual standstill bythe third quarter of 2001.
Swiss GDP growth during the 1990s was the lowest in the OECD. To asignificant extent, this can be attributed to rigidities in product and servicesmarkets of the sheltered parts of the economy. The increased restrictions onimmigration of foreign workers and the high level of domestic wagescontributed to the downturn in low-labour productivity industries, such astextile manufacturing. Despite slow economic growth Swiss GDP per head stillremains one of the highest in the world. (Historical data on GDP are given inReference tables 10 and 11.)
Gross domestic product(% real change)
Annual average2000 2001 1996-2000
GDP 3.0 1.3a 1.8
a Estimate.
Source: Federal Statistics Office.
Inflation peaked at almost 6% in 1991 and, after falling below 2% in 1996,remained on a steady downward track until 1999. A one-percentage-point rise inthe VAT rate to 7.5% in early 1999 added less than the expected 0.5% to theconsumer price index but, in combination with a surge in international oil pricesand a weakening currency against the US dollar, reversed the trend and broughtinflation back close to 2%. Wage settlements during most of the 1990s tended tobe very moderate, not least due to the recession in the first half of the decade,but the upswing in 2000 led to higher wage settlements for 2001. The tightnessin the labour market has eased again and, given considerable productivity gains,wage growth does not constitute a serious threat to price stability. In addition,during the 1990s many employers broke the tradition of compensating workersfor past inflation and moved increasingly to a system based on companyprofitability and employee performance. (Historical data on prices and earningsare given in Reference table 12.)
Domestic inflation risingfrom very low levels
Switzerland 27
© The Economist Intelligence Unit Limited 2002 EIU Country Profile 2002
Prices(% change, year on year)
Annual average2000 2001 1996-2000
Consumer prices 1.6 1.0 0.7
Import prices 6.7 n/a 0.1
Producer prices 0.9 0.5 –0.8
Source: Federal Statistics Office.
Post-war Switzerland enjoyed full employment until the recession of the 1990s,when the jobless rate climbed to unprecedented levels. According to nationaldefinitions, unemployment peaked at 5.7% in February 1997, and following afall to 1.6% in June 2001 (the lowest level for ten years) it has crept up again,reflecting the economic slowdown and the large number of dismissals inconnection with the demise of Swissair. The “true” rate of unemployment isundoubtedly higher than the official jobless count, as it includes only thoseofficially registered as unemployed. Jobseekers do not have any incentive toregister after the end of the period during which they receive unemploymentbenefits. Nevertheless, even taking this into account, unemployment is verylow by international comparison.
The generally very low level of unemployment can be attributed to a veryflexible labour market, both regarding wage settlements and laws on hiringand firing. The low level of taxation and social security contributions andrelatively restrictive conditions on unemployment benefits also create strongincentives to actively seeking employment. Working-time reductions and earlyretirement schemes that in other countries were often used to reduce theheadline rates of unemployment play only a very limited role in Switzerland,as both the effective retirement age and working hours are very high in aninternational comparison.
However, the low level of unemployment and very high labour forceparticipation—the highest in the OECD at 81.1% in 2000—means that it wouldbe very difficult to increase domestic labour supply significantly. Although scarcityof qualified labour had been a problem for a number of years, it became a seriousconcern during the recent economic upturn, with shortages of qualified labourreported by an increasing number of industries. Although the deterioratingeconomic outlook has eased the problem to some extent, the expected ageing ofthe population will tend to exacerbate this issue over the long term. (For data onemployment and unemployment see Reference tables 2 and 3.)
Regional trends
Switzerland’s three linguistic regions have quite different political and culturalroots, which is often reflected in the results of referendums. French-speakers tendto be more outward-looking and liberal on social issues, but also more in favourof state intervention in the field of economic policy. Their German-speakingcounterparts, in the rural areas at least, preserve a strong isolationist streak andconservative social values, and they generally are also in favour of a liberaleconomic policy. In June 1999, for example, the introduction of maternity
Labour market tightness iseasing again
The cantons
28 Switzerland
EIU Country Profile 2002 © The Economist Intelligence Unit Limited 2002
benefit was backed by voters in French- and Italian-speaking cantons butdecisively rejected by the German-speaking majority.
Switzerland’s cantons also have distinct economic identities, a remnant fromtheir long history as separate states. Some, such as Geneva, publish their owneconomic accounts, including foreign trade figures. The cantons vary widely insize, economic importance and wealth. In terms of income per head, Zug,famous for its low taxes, topped the league in 1997 at Swfr68,320 (US$47,100),compared with the Swiss average of Swfr44,500, according to national sources.Basle (Swfr65,704) and Zurich (Swfr56,048) came next. Local authorities derivethe bulk of their income from direct taxes, which vary significantly by cantonand commune.
Switzerland operates a regional policy that allows economically disadvantagedcantons to offer special tax breaks and other investment incentives. In 1999 thegovernment presented detailed proposals to reform the revenue-sharing systembetween central government and the cantons instituted 40 years ago. Followingdelays during the consultation stage the bill was presented to parliament inNovember 2001, but the reform is not expected to be implemented before 2006.The reform is hoped to result in efficiency savings of up to 20% of the Swfr13bnnow exchanged between the two levels of government, mainly by rationalisingthe allocation of responsibilities between them. In some areas, such as highereducation and waste disposal, the cantons will be obliged to co-operate witheach other to avoid wasteful duplication.
Economic sectors
Agriculture
Domestic agriculture supplies, on average, nearly 60% of domestic foodconsumption. Switzerland exports very little by way of agricultural products: in1999 exports accounted for only 16% of total agricultural turnover. Milk is byfar the most important agricultural product, accounting for one-third of totalagricultural output, followed by pig and cattle production, and cheese is themain export product. (Historical data on agricultural production are given inReference table 13.) Half of Switzerland’s cheese production is exported, 80% tothe EU. Dairy and stock-raising prevail in the mountain regions, while crops(grain, grapes, fruit and vegetables) are chiefly grown in the lowlands. In 1997forest and woodland covered 1.2m ha (12,126m sq km or around 30% of thetotal land area), of which one-quarter was privately owned. Swiss forests areprotected by a general ban on the destruction of woodland and obligatoryreplanting of trees to replace legal felling.
About 5% of the Swiss labour force is employed in agriculture, compared with4% in France and 2% in the UK. The number of farms declined by 18% between1990 and 1998 to 76,412, with an even sharper fall in the number of small part-time farms, which accounted for some 30% of the total. This was a continuationof the downward trend noted in previous decades, and policy changes in recentyears are likely to lead to a further decline.
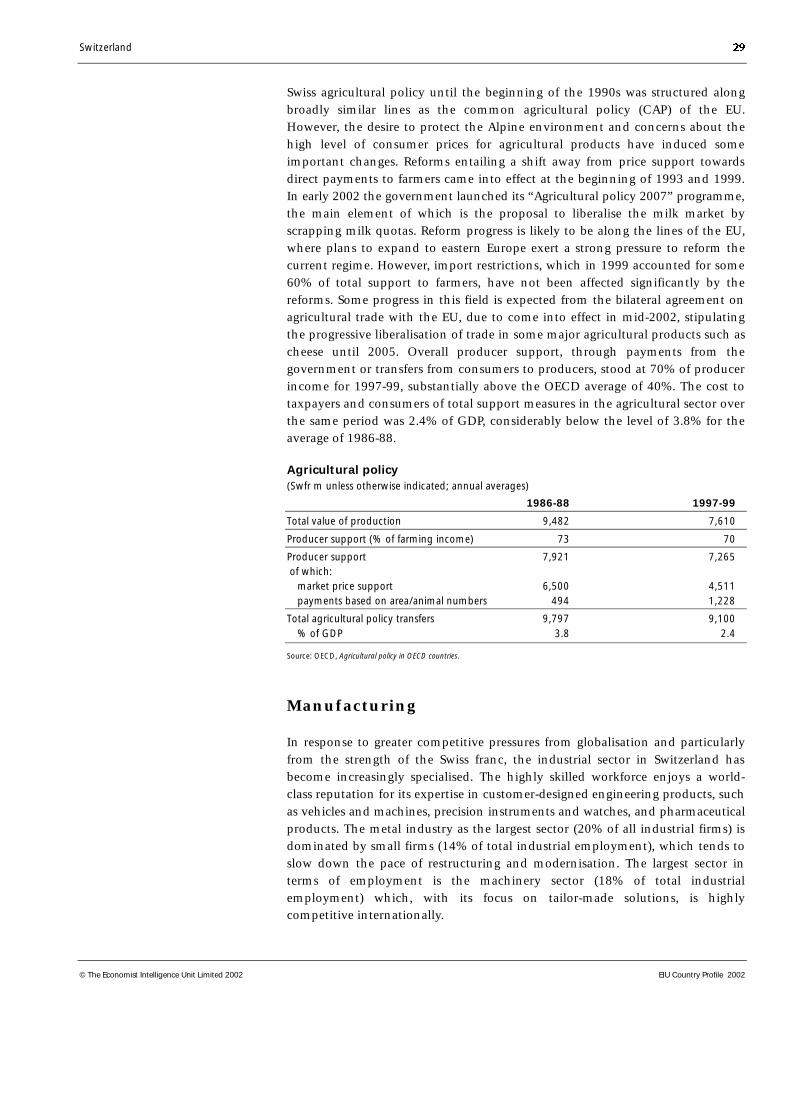
Switzerland 29
© The Economist Intelligence Unit Limited 2002 EIU Country Profile 2002
Swiss agricultural policy until the beginning of the 1990s was structured alongbroadly similar lines as the common agricultural policy (CAP) of the EU.However, the desire to protect the Alpine environment and concerns about thehigh level of consumer prices for agricultural products have induced someimportant changes. Reforms entailing a shift away from price support towardsdirect payments to farmers came into effect at the beginning of 1993 and 1999.In early 2002 the government launched its “Agricultural policy 2007” programme,the main element of which is the proposal to liberalise the milk market byscrapping milk quotas. Reform progress is likely to be along the lines of the EU,where plans to expand to eastern Europe exert a strong pressure to reform thecurrent regime. However, import restrictions, which in 1999 accounted for some60% of total support to farmers, have not been affected significantly by thereforms. Some progress in this field is expected from the bilateral agreement onagricultural trade with the EU, due to come into effect in mid-2002, stipulatingthe progressive liberalisation of trade in some major agricultural products such ascheese until 2005. Overall producer support, through payments from thegovernment or transfers from consumers to producers, stood at 70% of producerincome for 1997-99, substantially above the OECD average of 40%. The cost totaxpayers and consumers of total support measures in the agricultural sector overthe same period was 2.4% of GDP, considerably below the level of 3.8% for theaverage of 1986-88.
Agricultural policy(Swfr m unless otherwise indicated; annual averages)
1986-88 1997-99
Total value of production 9,482 7,610
Producer support (% of farming income) 73 70
Producer support 7,921 7,265 of which: market price support 6,500 4,511 payments based on area/animal numbers 494 1,228
Total agricultural policy transfers 9,797 9,100 % of GDP 3.8 2.4
Source: OECD, Agricultural policy in OECD countries.
Manufacturing
In response to greater competitive pressures from globalisation and particularlyfrom the strength of the Swiss franc, the industrial sector in Switzerland hasbecome increasingly specialised. The highly skilled workforce enjoys a world-class reputation for its expertise in customer-designed engineering products, suchas vehicles and machines, precision instruments and watches, and pharmaceuticalproducts. The metal industry as the largest sector (20% of all industrial firms) isdominated by small firms (14% of total industrial employment), which tends toslow down the pace of restructuring and modernisation. The largest sector interms of employment is the machinery sector (18% of total industrialemployment) which, with its focus on tailor-made solutions, is highlycompetitive internationally.
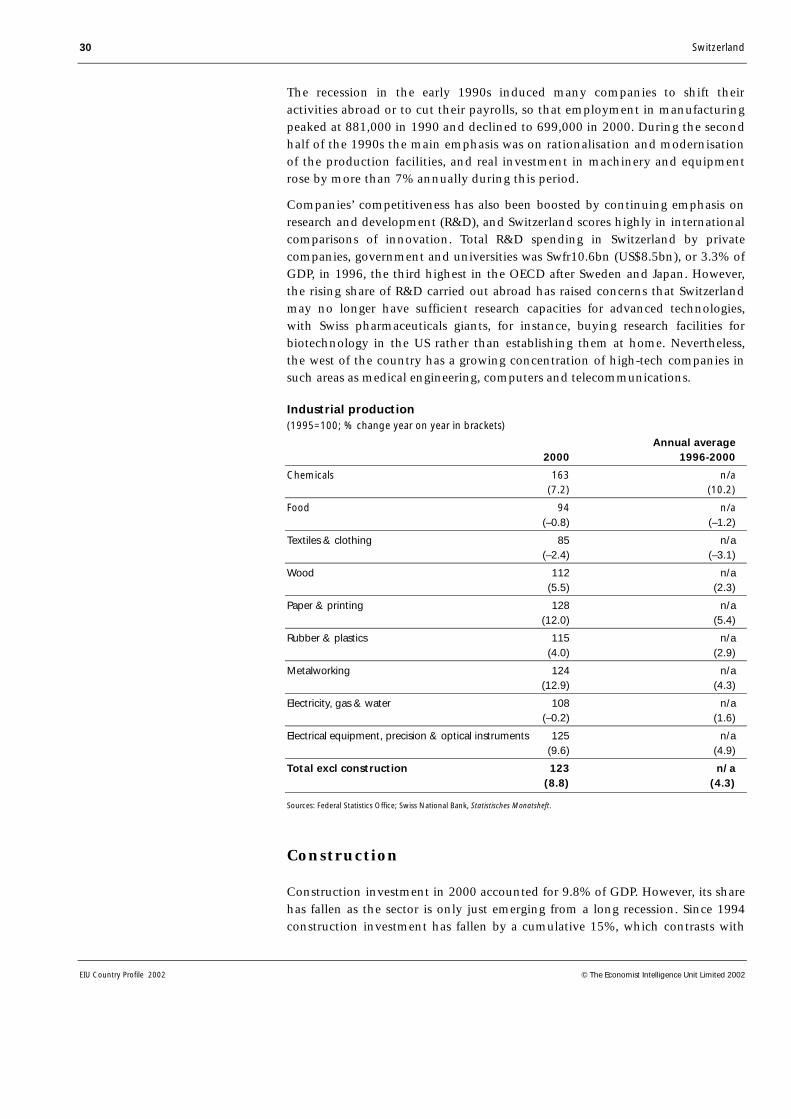
30 Switzerland
EIU Country Profile 2002 © The Economist Intelligence Unit Limited 2002
The recession in the early 1990s induced many companies to shift theiractivities abroad or to cut their payrolls, so that employment in manufacturingpeaked at 881,000 in 1990 and declined to 699,000 in 2000. During the secondhalf of the 1990s the main emphasis was on rationalisation and modernisationof the production facilities, and real investment in machinery and equipmentrose by more than 7% annually during this period.
Companies’ competitiveness has also been boosted by continuing emphasis onresearch and development (R&D), and Switzerland scores highly in internationalcomparisons of innovation. Total R&D spending in Switzerland by privatecompanies, government and universities was Swfr10.6bn (US$8.5bn), or 3.3% ofGDP, in 1996, the third highest in the OECD after Sweden and Japan. However,the rising share of R&D carried out abroad has raised concerns that Switzerlandmay no longer have sufficient research capacities for advanced technologies,with Swiss pharmaceuticals giants, for instance, buying research facilities forbiotechnology in the US rather than establishing them at home. Nevertheless,the west of the country has a growing concentration of high-tech companies insuch areas as medical engineering, computers and telecommunications.
Industrial production(1995=100; % change year on year in brackets)
Annual average2000 1996-2000
Chemicals 163 n/a(7.2) (10.2)
Food 94 n/a(–0.8) (–1.2)
Textiles & clothing 85 n/a(–2.4) (–3.1)
Wood 112 n/a(5.5) (2.3)
Paper & printing 128 n/a(12.0) (5.4)
Rubber & plastics 115 n/a(4.0) (2.9)
Metalworking 124 n/a(12.9) (4.3)
Electricity, gas & water 108 n/a(–0.2) (1.6)
Electrical equipment, precision & optical instruments 125 n/a(9.6) (4.9)
Total excl construction 123 n/a(8.8) (4.3)
Sources: Federal Statistics Office; Swiss National Bank, Statistisches Monatsheft.
Construction
Construction investment in 2000 accounted for 9.8% of GDP. However, its sharehas fallen as the sector is only just emerging from a long recession. Since 1994construction investment has fallen by a cumulative 15%, which contrasts with
Switzerland 31
© The Economist Intelligence Unit Limited 2002 EIU Country Profile 2002
the strong expansion of manufacturing investment in the same period. Veryhigh interest rates choked off construction growth in the early 1990s and over-supply in residential building, coupled with restrained infrastructure investmentby public authorities due to budget constraints, continued to weigh on the sectorlater in the decade. Construction employment has fallen from 331,000 in 1995,when the sector experienced a temporary recovery, to 297,000 in 2000.
The rate of homes occupied by their owners, at 31.3% in 1990 (the most recentavailable figure), is relatively low. Real estate is usually held by large propertycompanies that build, lease and let commercial and residential properties. Highreal estate and construction costs in combination with a lack of fiscalincentives make owner-occupancy relatively unattractive. The high costs reflectthe scarcity of real estate, high building standards, high wages, bureaucraticprocedures and, possibly, local cartels in the industry.
Infrastructure investment has been less volatile than other construction. Spendingon infrastructure accounted for nearly 13% of federal outlay in 1998, but theratio declined to 11% in the 1999 budget and further to 10.9% in 2000. Over thecoming years infrastructure investment will be sustained by the ongoing railinvestments (NEAT, Bahn 2000, noise containment, high-speed links), plans tocomplete the motorway network, and a general increase in cantonal andmunicipal building projects due to improved public finances (see Transport,communications and the Internet). However, competitive pressures haveintensified as a result of the liberalisation of public procurement provisionsunder new World Trade Organisation (WTO) rules. Wages in the constructionsector have fallen below average in recent years, mainly reflecting the industry’sdowntrend.
Financial services
Switzerland’s importance as a financial centre reflects a combination of factors,including a central geographic position in Europe, high political stability, astrong currency, low inflation, strict bank secrecy laws and a well-regulated andhighly developed financial services industry. The banking sector alone in 1999accounted for 11% of Swiss GDP and employed 3.7% of the total workforce.Given the small size of the country, the leading role of Swiss banks in Europe(two of Europe’s largest ten banks are Swiss) and internationally is remarkable.
Restructuring in the banking sector started in the 1990s with a ruling thatenforced greater competition between banks. The consolidation process wasreinforced by the globalisation of the financial services industry and by theinformation technology (IT) revolution. It led to a drastic reduction in the totalnumber of banks, each with its own network of branches, from 625 in 1990 to371 in 1999, although according to provisional data the number rose againslightly in 2000. Switzerland is still overbanked with one branch for every2,400 inhabitants (compared with 4,700 in the US), and the shift to Internetbanking makes more closures likely. There are now two large banks, UnionBank of Switzerland (UBS) and Credit Suisse Group, which control around two-thirds of the combined balance-sheet total.
The banking sector
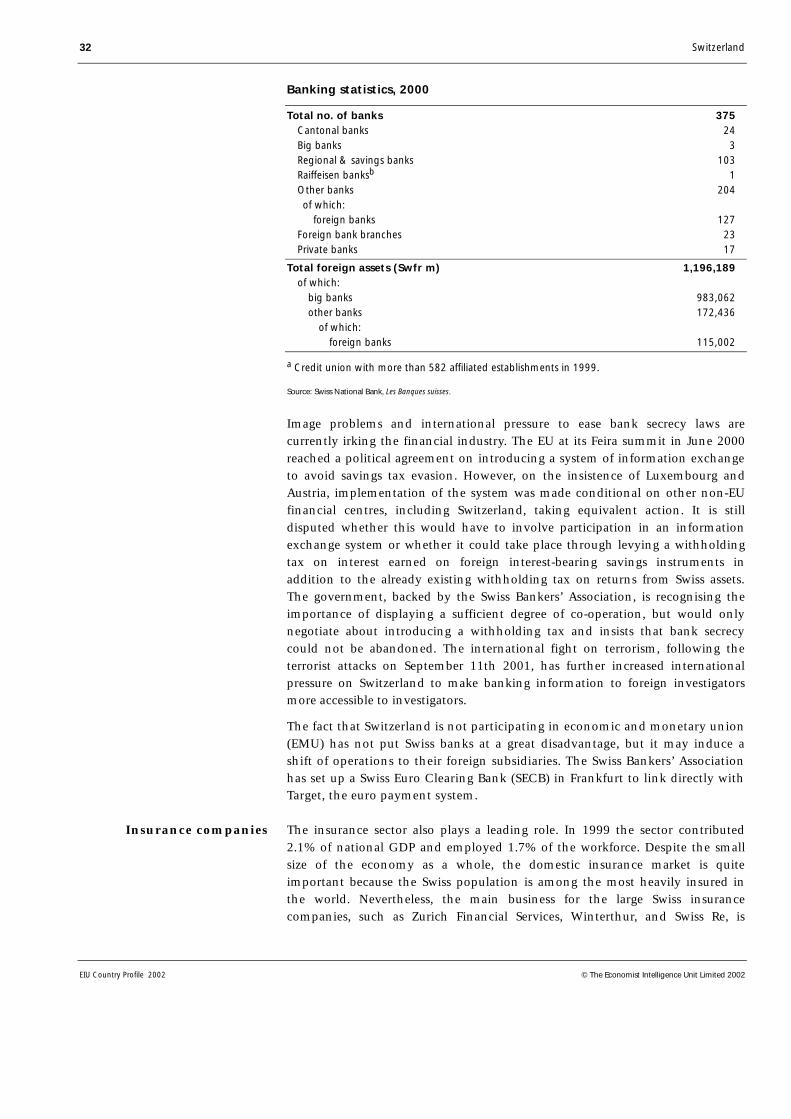
32 Switzerland
EIU Country Profile 2002 © The Economist Intelligence Unit Limited 2002
Banking statistics, 2000
Total no. of banks 375 Cantonal banks 24 Big banks 3 Regional & savings banks 103 Raiffeisen banksb 1 Other banks 204 of which: foreign banks 127 Foreign bank branches 23 Private banks 17
Total foreign assets (Swfr m) 1,196,189 of which: big banks 983,062 other banks 172,436 of which: foreign banks 115,002
a Credit union with more than 582 affiliated establishments in 1999.
Source: Swiss National Bank, Les Banques suisses.
Image problems and international pressure to ease bank secrecy laws arecurrently irking the financial industry. The EU at its Feira summit in June 2000reached a political agreement on introducing a system of information exchangeto avoid savings tax evasion. However, on the insistence of Luxembourg andAustria, implementation of the system was made conditional on other non-EUfinancial centres, including Switzerland, taking equivalent action. It is stilldisputed whether this would have to involve participation in an informationexchange system or whether it could take place through levying a withholdingtax on interest earned on foreign interest-bearing savings instruments inaddition to the already existing withholding tax on returns from Swiss assets.The government, backed by the Swiss Bankers’ Association, is recognising theimportance of displaying a sufficient degree of co-operation, but would onlynegotiate about introducing a withholding tax and insists that bank secrecycould not be abandoned. The international fight on terrorism, following theterrorist attacks on September 11th 2001, has further increased internationalpressure on Switzerland to make banking information to foreign investigatorsmore accessible to investigators.
The fact that Switzerland is not participating in economic and monetary union(EMU) has not put Swiss banks at a great disadvantage, but it may induce ashift of operations to their foreign subsidiaries. The Swiss Bankers’ Associationhas set up a Swiss Euro Clearing Bank (SECB) in Frankfurt to link directly withTarget, the euro payment system.
The insurance sector also plays a leading role. In 1999 the sector contributed2.1% of national GDP and employed 1.7% of the workforce. Despite the smallsize of the economy as a whole, the domestic insurance market is quiteimportant because the Swiss population is among the most heavily insured inthe world. Nevertheless, the main business for the large Swiss insurancecompanies, such as Zurich Financial Services, Winterthur, and Swiss Re, is
Insurance companies
Switzerland 33
© The Economist Intelligence Unit Limited 2002 EIU Country Profile 2002
abroad. In 1999 61% of the total premium income of Swfr124bn came fromabroad, with an important factor being the Swiss focus on reinsurance business.The main market is the EU (41%). Business areas with the strongest focus abroadare reinsurance (96% of premiums from abroad), and casualty insurance (70%).Swiss Re, for example, controls around 20% of the world life insurance marketand has a market share of almost 50% in the UK. Around one-third of itsworkforce is employed outside Switzerland. Meanwhile, the life insurance marketis predominantly local, with around two-thirds of premiums in the domesticmarket. Since the gradual deregulation in the 1990s the market has becomeincreasingly concentrated.
Important issues for financial services
Bank secrecy: Since 1934 bank secrecy, which does not protect against investigation incriminal cases, has been protected by law. Bribes in the private sector, tax evasion andbreaches of other countries’ exchange controls are not criminal offences in Switzerland,and the funds derived from these activities have the full protection of Swiss bank secrecyrules. However, the government insisted following the terrorist attacks of September 11ththat Swiss banking secrecy does not protect terrorist activity and money-laundering. TheEU reached a political agreement to introduce a system of information exchange tocombat savings tax evasion at the June 2000 Feira summit. Implementation was madeconditional on Switzerland and other financial centres taking “equivalent” action.
Money-laundering: In April 1998 a new money-laundering law covering all financialinstitutions came into force that gives banks and others a duty—not just a right, asbefore—to report financial transactions that they suspect are connected with organisedcrime. The judicial authorities may freeze assets pending an investigation. Banks that donot report suspicious transactions can be fined up to Swfr200,000 (US$138,000).However, the control organisations are underfunded and understaffed. The Frenchparliament published a report in February 2001 criticising Switzerland for insufficientprovisions against money-laundering.
Diligence convention: This “gentleman’s agreement” requires banks and thosehandling funds on behalf of others (for example, lawyers and accountants) to satisfythemselves as to the origin of funds and good reputation of depositors and beneficiariesof the funds.
Supervision: Strict reserve and liquidity requirements are imposed on the banks, whichare subject to the supervision of the Federal Banking Commission. In 1998 a special unitwas set up to oversee the two big banks, UBS and Credit Suisse. A government-appointed group of experts is examining Switzerland’s overall system of financialregulation in the light of increasingly close ties between the various financial centres.
Stockmarket regulation: Insider trading was outlawed in 1988. Stock exchangeoperations are based on self-regulation by the Swiss Stock Exchange as codified in a1997 law, but overall surveillance is carried out by the Federal Banking Commission.The 1997 law also sets out the first legal framework for the conduct of takeover bids,including provisions for the protection of minority shareholders.
34 Switzerland
EIU Country Profile 2002 © The Economist Intelligence Unit Limited 2002
Zurich is Europe’s fourth largest stock exchange and is also a big foreignexchange centre. The Swiss Exchange (SWX) was the first worldwide to introducean integrated electronic system combining clearing, settlement and regulatorysupervision. SWX is an active player in the heavily contested European market.Co-operation with London’s Tradepoint led to the creation of Virt-x, whichbranded Europe’s first crossborder exchange for blue-chip shares, which becameoperational in June 2001. Virt-x is based in London and subject to Londonsupervision, but trades on the SWX’s electronic platform. Switzerland also has acompetitive derivatives market, Eurex, which was created in 1998 after a mergerbetween the Swiss Options and Financial Futures Exchange and its Germanequivalent, Deutsche Terminbörse. In August 2000 Eurex formed a commontrading platform with the Chicago Board of Trading (CBOT).
The government has taken steps to improve further Switzerland’s attraction asa financial centre. Stamp duty was abandoned in early 2001 for certaincustomers and transactions for which the risk of turning to other stockmarketsis highest. The Swiss stockmarket indices are dominated by banking, insuranceand pharmaceutical stocks with a very small share of so called “new economy”stocks. This composition was the main reason why the Swiss stockmarketoutperformed other markets in 2000, although it underperformed in 2001 (Forhistorical data on the stockmarket, see Reference table 16.)
Other services
Switzerland’s retail sector is highly concentrated and heavily regulated. The threelargest market players have a combined market share of 31%, which is high byEuropean standards and is one reason for the high price level. The OECD hasestimated that goods and services for private consumption cost 40% more thanthe OECD average. However, competition has been revived in recent years, as themarket appears to be increasingly saturated and consumer patterns are changing.Consumers now spend an increasing share of their disposable income on services(insurance, health, IT and communication services), to the detriment of traditionalhardware retail categories, such as clothing and furniture. Shop opening hoursare strictly regulated, but there are variations between the cantons. More andmore small shop owners are being forced out of business, but the retailingnetwork remains very tight and productivity in the sector is accordingly low.(Historical data on retail sales are given in Reference table 17.)
The tourism industry is an important part of the services sector, although in1999 tourism earnings were for the first time lower than income from bankcommissions. One in 11 Swiss workers depends on tourism either directly orindirectly for income. In 1998 the country ranked 17th in the world as a touristdestination, attracting over 10m visitors. Most visitors to Switzerland are fromEurope (one-third from Germany). Despite Switzerland’s reputation as a skiingcentre, the largest numbers arrive during the summer months.
During the 1990s Switzerland’s reputation for high prices, reinforced by thestrong Swiss franc, together with the sluggish European economy, led to aconsiderable weakening of the tourism industry, and the number of overnightstays by tourists fell steadily from a 1991 peak of 78m to 67m in 1997. The
Stockmarket
Tourism
The retail sector
Switzerland 35
© The Economist Intelligence Unit Limited 2002 EIU Country Profile 2002
weaker Swiss franc and the global economic upswing, especially in the US, thenled to a recovery. However, there has been a drastic decline in the number ofbookings following the events of September 11th 2001, which together with thesubsequent appreciation of the Swiss franc point to a difficult period ahead forthe industry. (Historical data on tourism are given in Reference table 18.)
The external sector
Trade in goods
Foreign trade, 2001(Swfr m)
Exports of goods fob 131,717
Imports of goods cif –130,052
Trade balance 1,665
Source: Federal Customs Office.
Most trade is with EU members, Germany being Switzerland’s largest singletrading partner. Switzerland is a net importer of food and has to buy almost allof its energy and industrial raw materials abroad. Restructuring during the1990s has shifted the focus of the export sector towards high-value addedgoods, for example in the chemical and pharmaceutical industry and theprecision instruments industry. The lower price-sensitivity of demand for suchgoods implied a reduction of the vulnerability of overall exports to exchange-rate fluctuations, although it remains strong.
The trade account, usually reported excluding the volatile trade in preciousmetals and stones, objects of art and antiquities has traditionally been in deficit,but recession caused Switzerland to record a string of unusual surpluses from1993, as exports continued to grow more rapidly than imports. Export growthwas hampered by the effects of the Asian crisis, but the trade balance remainedpositive until 1999. However, the acceleration of domestic demand and thesharp increase in oil prices resulted in a trade deficit for 2000. The substantial fallin the volume of imports during 2001 in response to weaker investment demandand falling prices for energy products prompted a renewed swing to a positivebalance. Switzerland has a tradition of supporting free trade, and tariffs forindustrial goods—in so far as they still exist—are generally low. Only agricultureremains protected by high tariffs. (See Reference tables 19-21 for trade data.)
Main trading partners, 2001(% of total; excl precious metals and stones, antiquities and objects of art)
Exports fob Imports cif
EU 61.0 79.9
Germany 22.2 32.2
France 9.0 11.0
Italy 8.0 10.2
US 10.6 5.3
Source: Federal Customs Office.
Strong trade links with EU
36 Switzerland
EIU Country Profile 2002 © The Economist Intelligence Unit Limited 2002
Switzerland’s relations with regional trading partners
European Free-Trade Association (EFTA): Switzerland has been a member of EFTAsince its inception in May 1960, under the Convention of Stockholm. Free trade inindustrial goods between EFTA members was achieved by 1966. The grouping now hasonly three other members—Iceland, Liechtenstein (with which Switzerland has acustoms and currency union) and Norway.
European Union: In 1972 the then European Economic Community (EEC) and EFTAmembers concluded a free-trade agreement for industrial goods, which came into forceon April 1st 1973. Tariffs on industrial products were eliminated by 1978. In May 1992Switzerland lodged a formal application to join the European Community (EC) but wasforced to put this in abeyance after membership of the European Economic Area (EEA),which was built to extent the EU single market to EFTA countries, was rejected in areferendum the following December. However, a package of seven agreements with theEU that gives Switzerland many of the economic benefits of EEA membership will takeeffect in the first half of 2002, and negotiations for further bilateral accords are alreadyunder way.
Eastern Europe and others: Along with other EFTA members, Switzerland has free-trade accords with ten east European countries, Israel, the Palestinian Authority,Morocco, Turkey and Mexico (which came in force in mid-2001), and is negotiatingseveral others including one with Canada. Trade in agricultural goods is excluded fromthese agreements.
Direction and composition of trade, 2001(US$ m)
Exports fob Germany US France Italy Total
Foodstuffs, beverages & tobacco 437 117 220 159 2,049 of which: coffee, cocoa, tea & spices 75 23 44 13 357Chemicalsa 4,824 2,639 2,621 2,503 26,484 of which: medicinal & pharmaceutical products 1,459 1,309 1,037 1,047 10,875Wood & manufactures 126 8 55 116 476Paper & manufactures 540 39 206 107 1,481Textile fibres, yarn, cloth & manufactures 366 81 122 189 1,493Non-metallic mineral manufacturesb 544 1,026 525 434 5,504Iron & steel & manufacturesc 855 132 223 216 2,141Other metals & manufacturesc 945 219 276 223 2,629Machinery incl electric 5,844 2,464 1,753 1,357 22,326Road vehicles 386 90 92 32 989Other transport equipment 98 217 44 43 847Furniture 274 25 73 82 619Clothing 150 98 40 61 626Footwear 20 17 9 6 137Clocks & watches 465 940 427 498 6,317Optical, photographic, medical instruments 1,270 705 359 294 5,230Total incl others 17,786 9,273 7,344 6,535 82,057
continued
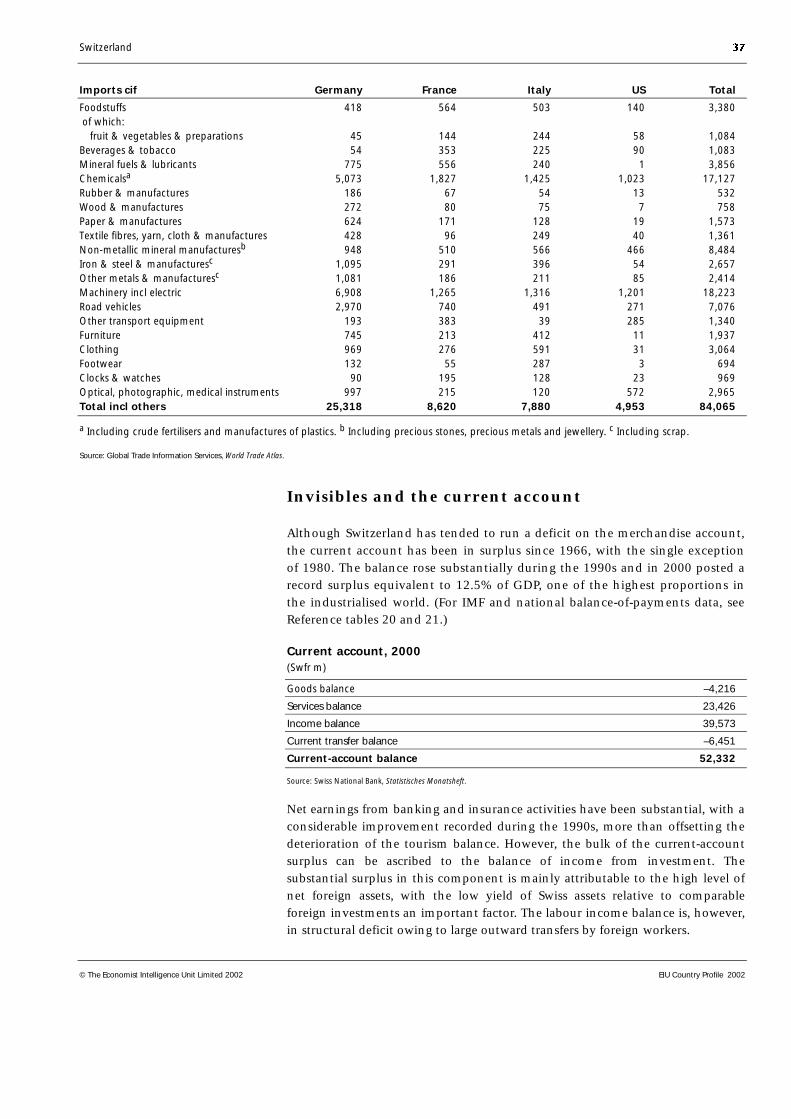
Switzerland 37
© The Economist Intelligence Unit Limited 2002 EIU Country Profile 2002
Imports cif Germany France Italy US Total
Foodstuffs 418 564 503 140 3,380 of which: fruit & vegetables & preparations 45 144 244 58 1,084Beverages & tobacco 54 353 225 90 1,083Mineral fuels & lubricants 775 556 240 1 3,856Chemicalsa 5,073 1,827 1,425 1,023 17,127Rubber & manufactures 186 67 54 13 532Wood & manufactures 272 80 75 7 758Paper & manufactures 624 171 128 19 1,573Textile fibres, yarn, cloth & manufactures 428 96 249 40 1,361Non-metallic mineral manufacturesb 948 510 566 466 8,484Iron & steel & manufacturesc 1,095 291 396 54 2,657Other metals & manufacturesc 1,081 186 211 85 2,414Machinery incl electric 6,908 1,265 1,316 1,201 18,223Road vehicles 2,970 740 491 271 7,076Other transport equipment 193 383 39 285 1,340Furniture 745 213 412 11 1,937Clothing 969 276 591 31 3,064Footwear 132 55 287 3 694Clocks & watches 90 195 128 23 969Optical, photographic, medical instruments 997 215 120 572 2,965Total incl others 25,318 8,620 7,880 4,953 84,065
a Including crude fertilisers and manufactures of plastics. b Including precious stones, precious metals and jewellery. c Including scrap.
Source: Global Trade Information Services, World Trade Atlas.
Invisibles and the current account
Although Switzerland has tended to run a deficit on the merchandise account,the current account has been in surplus since 1966, with the single exceptionof 1980. The balance rose substantially during the 1990s and in 2000 posted arecord surplus equivalent to 12.5% of GDP, one of the highest proportions inthe industrialised world. (For IMF and national balance-of-payments data, seeReference tables 20 and 21.)
Current account, 2000(Swfr m)
Goods balance –4,216
Services balance 23,426
Income balance 39,573
Current transfer balance –6,451
Current-account balance 52,332
Source: Swiss National Bank, Statistisches Monatsheft.
Net earnings from banking and insurance activities have been substantial, with aconsiderable improvement recorded during the 1990s, more than offsetting thedeterioration of the tourism balance. However, the bulk of the current-accountsurplus can be ascribed to the balance of income from investment. Thesubstantial surplus in this component is mainly attributable to the high level ofnet foreign assets, with the low yield of Swiss assets relative to comparableforeign investments an important factor. The labour income balance is, however,in structural deficit owing to large outward transfers by foreign workers.
38 Switzerland
EIU Country Profile 2002 © The Economist Intelligence Unit Limited 2002
Capital flows and foreign debt
The large current-account surplus is offset by huge capital outflows. Surpluseswere initially used mainly for the purchase of foreign shares and bonds, but inthe late 1980s direct investment rose strongly as Swiss companies began toexpand production operations abroad. Some 1.6m workers are employed inoverseas subsidiaries of Swiss companies, which led to direct foreign investmentsworth Swfr72bn (US$42.6bn) in 2000. The total stock of Swiss direct investmentabroad reached Swfr372.6bn at the end of 2000. Switzerland was able to attract arising amount of inward investment during the 1990s, but due to a substantialincrease in direct investment abroad the balance produced a record deficit.
Inflows of foreign direct investment (FDI) into Switzerland turned negative in1993 for the first time since statistical records began in 1984, influenced bothby the rejection of European Economic Area (EEA) membership in December1992 and by cyclical weakness. Inflows have recovered since then, and in 2000rose by 60% to Swfr27.5bn, but remained well below the levels recorded in the1980s. Swiss skills and the flexible labour market are nevertheless attracting anumber of high-tech firms in such areas as medical engineering and advancedelectronics where quality of output is all-important, but the existing labourshortages are likely to discourage direct investments in the future.
Foreign reserves and the exchange rate
Foreign reserves are at a relatively high level, certainly sufficient to allow theSwiss National Bank (SNB, the central bank) to intervene occasionally in themarket to stabilise the currency. A change in the constitution approved in April1999 to remove the commitment to the gold standard (which de facto had beenabandoned in the 1970s) has eliminated the need for the SNB to hold verysizeable gold reserves. In addition, the fact that the currency is floating alsomeans that the need for reserves for exchange-rate stabilisation is limited. As aconsequence, the SNB started to sell 1,300 tonnes of gold, equivalent to half ofits gold reserves, in May 2000. (See Reference table 22 for historical data onforeign reserves.)
The SNB, which once viewed the strength of the currency as a way of achievingits price stability objective, took decisive action in the mid-1990s to counteractcompetitive disadvantages for Swiss manufacturers arising from an appreciatingcurrency. Similar to past periods of exceptional instability on the internationalcurrency markets, the flight of investors to safehaven currencies led to anappreciation of the Swiss franc following the terrorist attacks on the US onSeptember 11th 2001. The SNB’s attempts to prevent an appreciation bylowering interest rates have been only partially successful, although they at leastled to a stabilisation against the euro. Following the introduction of the euro inearly 1999 the Swiss franc remained broadly stable against the new currency formore than a year, but this link weakened as the euro continued to depreciateheavily. During 2000 and 2001 the Swiss franc hence proved much strongeragainst the US dollar than the euro. The SNB is aware of the danger of makingthe Swiss franc indistinguishable from the euro. This would risk lifting interest
Switzerland 39
© The Economist Intelligence Unit Limited 2002 EIU Country Profile 2002
rates towards the levels prevailing in the euro area and of importing inflationduring periods of pronounced euro weakness. Given that the introduction ofeuro notes and coins in early 2002 also led to wider availability and use of theeuro in Switzerland, this may tend to undermine the Swiss franc’s status as anindependent currency and make the SNB more prone to occasionallydemonstrate its independence from the European Central Bank (ECB). (Forhistorical data on exchange rates, see Reference table 23.)
40 Switzerland
EIU Country Profile 2002 © The Economist Intelligence Unit Limited 2002
Appendices
Sources of information
Federal Customs Administration, Statistique du commerce extérieur de la Suisse(monthly), Berne
Federal Energy Office, Swiss Global Energy Statistics (annual), Berne
Federal Finance Administration, Finances publiques en Suisse (annual), Berne
Federal Finance Administration, Les finances de la Confédération en bref, Berne
Gotthard Bank, Foreign Banks in Switzerland (annual), Lugano
Société pour le développement de l’économie suisse, Miroir statistique de laSuisse (annual), Geneva
State Secretariat for Economic Affairs, La Vie économique/Die Volkswirtschaft(monthly), Berne
Swisscom, formerly Swiss Telecom, Facts and Figures (annual), Berne
Swiss Farmers’ Union, Landwirtschaftliche Monatszahlen (monthly), Brugg
Swiss Federal Statistics Office, Comptes nationaux de la Suisse (annual), Berne
Swiss Federal Statistics Office, Statistical Yearbook of Switzerland, Berne
Swiss Federal Statistics Office, Statistique de l’emploi et de la population activeoccupée (quarterly), Berne
Swiss Federal Statistics Office, Statistique de la production et de la valeur ajoutée(annual), Berne
Swiss National Bank, Les Banques suisses (annual), Zurich
Swiss National Bank, Statistisches Monatsheft (monthly bulletin), Zurich
Swiss Stock Exchange, Annual Report, Monthly Report and Factbook, Zurich
Swiss Tourism Federation, Swiss Tourism in Figures (annual), Berne
Energy Data Associates, 19-23 High Street, Pinner, Middlesex, HA5 5PJ
International Institute for Strategic Studies, The Military Balance (annual)
International Monetary Fund, International Financial Statistics (monthly)
OECD, Agricultural Policy in OECD Countries, Paris
OECD, Economic Survey of Switzerland (annual), Paris
OECD, Quarterly National Accounts, Paris
UN Food and Agriculture Organisation, Production Yearbook
National statistical sources
International statisticalsources
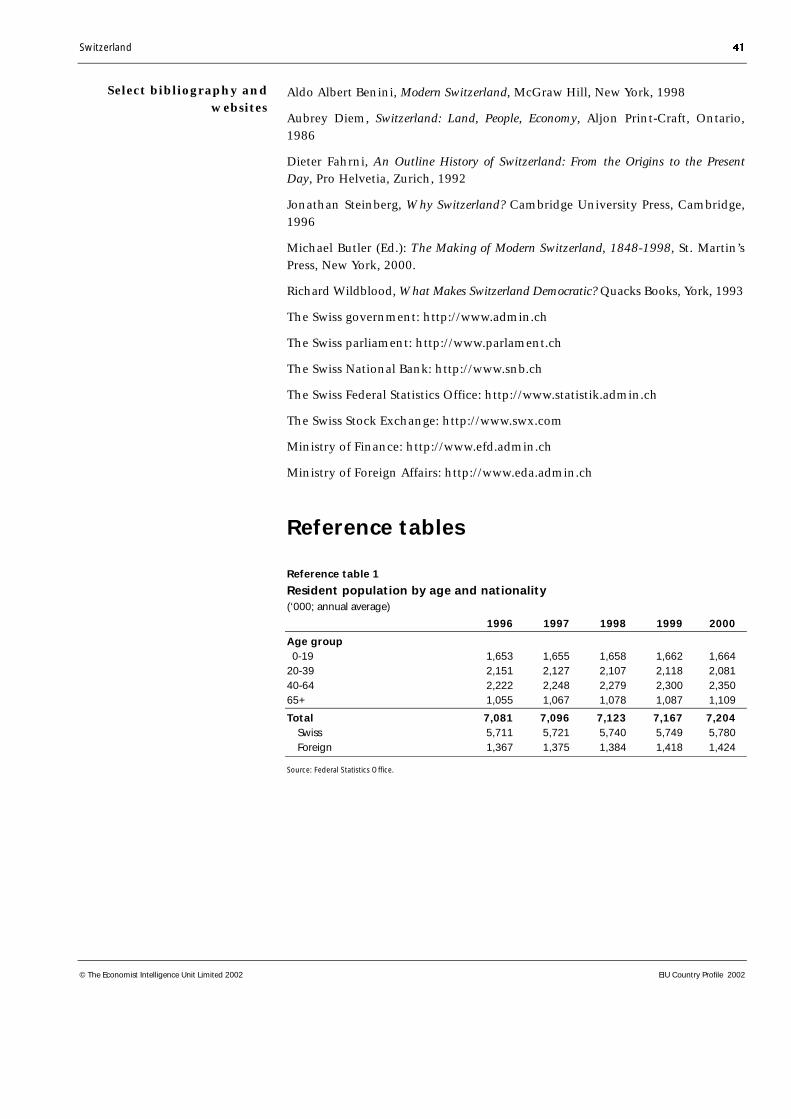
Switzerland 41
© The Economist Intelligence Unit Limited 2002 EIU Country Profile 2002
Aldo Albert Benini, Modern Switzerland, McGraw Hill, New York, 1998
Aubrey Diem, Switzerland: Land, People, Economy, Aljon Print-Craft, Ontario,1986
Dieter Fahrni, An Outline History of Switzerland: From the Origins to the PresentDay, Pro Helvetia, Zurich, 1992
Jonathan Steinberg, Why Switzerland? Cambridge University Press, Cambridge,1996
Michael Butler (Ed.): The Making of Modern Switzerland, 1848-1998, St. Martin’sPress, New York, 2000.
Richard Wildblood, What Makes Switzerland Democratic? Quacks Books, York, 1993
The Swiss government: http://www.admin.ch
The Swiss parliament: http://www.parlament.ch
The Swiss National Bank: http://www.snb.ch
The Swiss Federal Statistics Office: http://www.statistik.admin.ch
The Swiss Stock Exchange: http://www.swx.com
Ministry of Finance: http://www.efd.admin.ch
Ministry of Foreign Affairs: http://www.eda.admin.ch
Reference tables
Reference table 1
Resident population by age and nationality(‘000; annual average)
1996 1997 1998 1999 2000
Age group 0-19 1,653 1,655 1,658 1,662 1,66420-39 2,151 2,127 2,107 2,118 2,08140-64 2,222 2,248 2,279 2,300 2,35065+ 1,055 1,067 1,078 1,087 1,109
Total 7,081 7,096 7,123 7,167 7,204 Swiss 5,711 5,721 5,740 5,749 5,780 Foreign 1,367 1,375 1,384 1,418 1,424
Source: Federal Statistics Office.
Select bibliography andwebsites
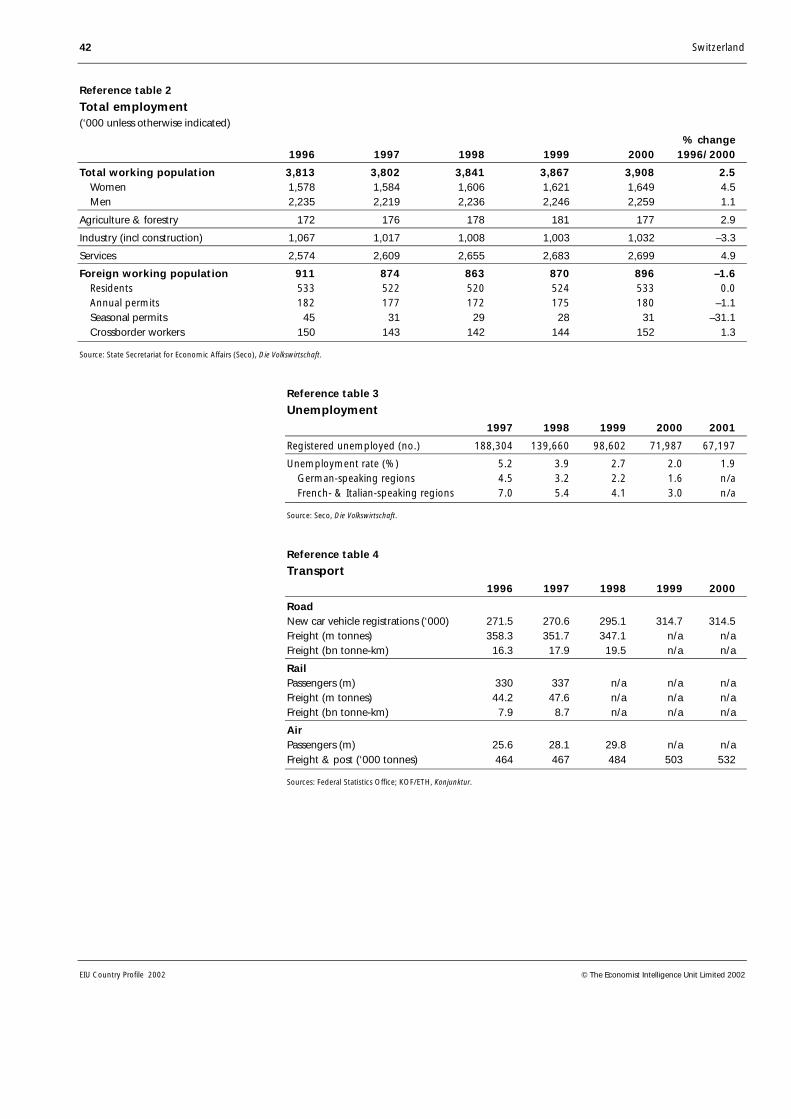
42 Switzerland
EIU Country Profile 2002 © The Economist Intelligence Unit Limited 2002
Reference table 2
Total employment(‘000 unless otherwise indicated)
% change1996 1997 1998 1999 2000 1996/2000
Total working population 3,813 3,802 3,841 3,867 3,908 2.5 Women 1,578 1,584 1,606 1,621 1,649 4.5 Men 2,235 2,219 2,236 2,246 2,259 1.1
Agriculture & forestry 172 176 178 181 177 2.9
Industry (incl construction) 1,067 1,017 1,008 1,003 1,032 –3.3
Services 2,574 2,609 2,655 2,683 2,699 4.9
Foreign working population 911 874 863 870 896 –1.6 Residents 533 522 520 524 533 0.0 Annual permits 182 177 172 175 180 –1.1 Seasonal permits 45 31 29 28 31 –31.1 Crossborder workers 150 143 142 144 152 1.3
Source: State Secretariat for Economic Affairs (Seco), Die Volkswirtschaft.
Reference table 3
Unemployment1997 1998 1999 2000 2001
Registered unemployed (no.) 188,304 139,660 98,602 71,987 67,197
Unemployment rate (%) 5.2 3.9 2.7 2.0 1.9 German-speaking regions 4.5 3.2 2.2 1.6 n/a French- & Italian-speaking regions 7.0 5.4 4.1 3.0 n/a
Source: Seco, Die Volkswirtschaft.
Reference table 4
Transport1996 1997 1998 1999 2000
RoadNew car vehicle registrations (‘000) 271.5 270.6 295.1 314.7 314.5Freight (m tonnes) 358.3 351.7 347.1 n/a n/aFreight (bn tonne-km) 16.3 17.9 19.5 n/a n/a
RailPassengers (m) 330 337 n/a n/a n/aFreight (m tonnes) 44.2 47.6 n/a n/a n/aFreight (bn tonne-km) 7.9 8.7 n/a n/a n/a
AirPassengers (m) 25.6 28.1 29.8 n/a n/aFreight & post (‘000 tonnes) 464 467 484 503 532
Sources: Federal Statistics Office; KOF/ETH, Konjunktur.
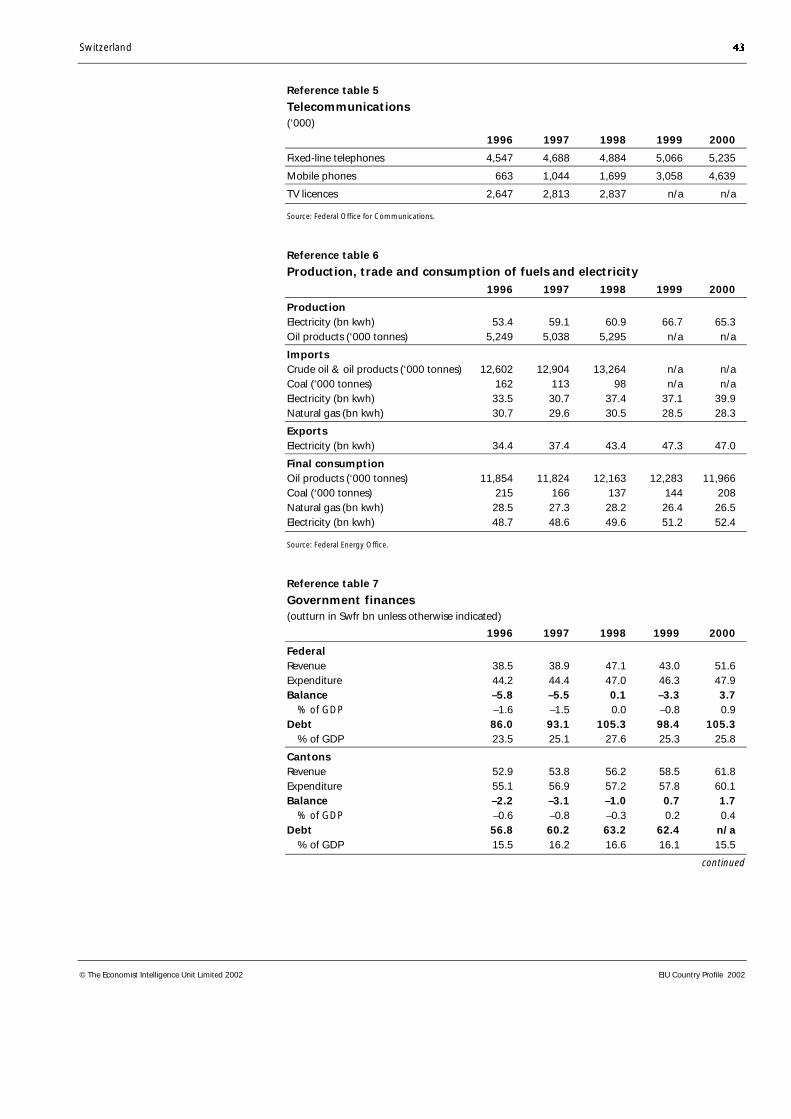
Switzerland 43
© The Economist Intelligence Unit Limited 2002 EIU Country Profile 2002
Reference table 5
Telecommunications(‘000)
1996 1997 1998 1999 2000
Fixed-line telephones 4,547 4,688 4,884 5,066 5,235
Mobile phones 663 1,044 1,699 3,058 4,639
TV licences 2,647 2,813 2,837 n/a n/a
Source: Federal Office for Communications.
Reference table 6
Production, trade and consumption of fuels and electricity1996 1997 1998 1999 2000
ProductionElectricity (bn kwh) 53.4 59.1 60.9 66.7 65.3Oil products (‘000 tonnes) 5,249 5,038 5,295 n/a n/a
ImportsCrude oil & oil products (‘000 tonnes) 12,602 12,904 13,264 n/a n/aCoal (‘000 tonnes) 162 113 98 n/a n/aElectricity (bn kwh) 33.5 30.7 37.4 37.1 39.9Natural gas (bn kwh) 30.7 29.6 30.5 28.5 28.3
ExportsElectricity (bn kwh) 34.4 37.4 43.4 47.3 47.0
Final consumptionOil products (‘000 tonnes) 11,854 11,824 12,163 12,283 11,966Coal (‘000 tonnes) 215 166 137 144 208Natural gas (bn kwh) 28.5 27.3 28.2 26.4 26.5Electricity (bn kwh) 48.7 48.6 49.6 51.2 52.4
Source: Federal Energy Office.
Reference table 7
Government finances(outturn in Swfr bn unless otherwise indicated)
1996 1997 1998 1999 2000
FederalRevenue 38.5 38.9 47.1 43.0 51.6Expenditure 44.2 44.4 47.0 46.3 47.9Balance –5.8 –5.5 0.1 –3.3 3.7 % of GDP –1.6 –1.5 0.0 –0.8 0.9Debt 86.0 93.1 105.3 98.4 105.3 % of GDP 23.5 25.1 27.6 25.3 25.8
CantonsRevenue 52.9 53.8 56.2 58.5 61.8Expenditure 55.1 56.9 57.2 57.8 60.1Balance –2.2 –3.1 –1.0 0.7 1.7 % of GDP –0.6 –0.8 –0.3 0.2 0.4Debt 56.8 60.2 63.2 62.4 n/a % of GDP 15.5 16.2 16.6 16.1 15.5
continued
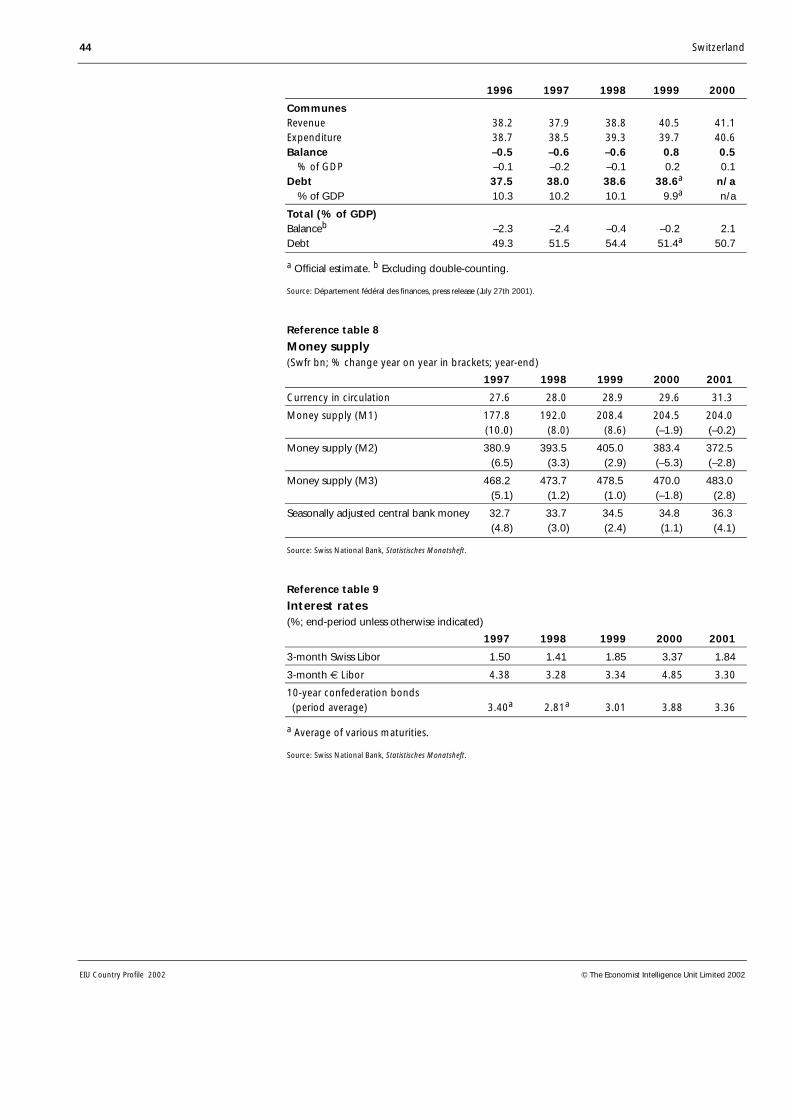
44 Switzerland
EIU Country Profile 2002 © The Economist Intelligence Unit Limited 2002
1996 1997 1998 1999 2000
CommunesRevenue 38.2 37.9 38.8 40.5 41.1Expenditure 38.7 38.5 39.3 39.7 40.6Balance –0.5 –0.6 –0.6 0.8 0.5 % of GDP –0.1 –0.2 –0.1 0.2 0.1Debt 37.5 38.0 38.6 38.6a n/a % of GDP 10.3 10.2 10.1 9.9a n/a
Total (% of GDP)Balanceb –2.3 –2.4 –0.4 –0.2 2.1Debt 49.3 51.5 54.4 51.4a 50.7
a Official estimate. b Excluding double-counting.
Source: Département fédéral des finances, press release (July 27th 2001).
Reference table 8
Money supply(Swfr bn; % change year on year in brackets; year-end)
1997 1998 1999 2000 2001
Currency in circulation 27.6 28.0 28.9 29.6 31.3
Money supply (M1) 177.8 192.0 208.4 204.5 204.0 (10.0) (8.0) (8.6) (–1.9) (–0.2)
Money supply (M2) 380.9 393.5 405.0 383.4 372.5 (6.5) (3.3) (2.9) (–5.3) (–2.8)
Money supply (M3) 468.2 473.7 478.5 470.0 483.0 (5.1) (1.2) (1.0) (–1.8) (2.8)
Seasonally adjusted central bank money 32.7 33.7 34.5 34.8 36.3 (4.8) (3.0) (2.4) (1.1) (4.1)
Source: Swiss National Bank, Statistisches Monatsheft.
Reference table 9
Interest rates(%; end-period unless otherwise indicated)
1997 1998 1999 2000 2001
3-month Swiss Libor 1.50 1.41 1.85 3.37 1.84
3-month € Libor 4.38 3.28 3.34 4.85 3.30
10-year confederation bonds (period average) 3.40a 2.81a 3.01 3.88 3.36
a Average of various maturities.
Source: Swiss National Bank, Statistisches Monatsheft.
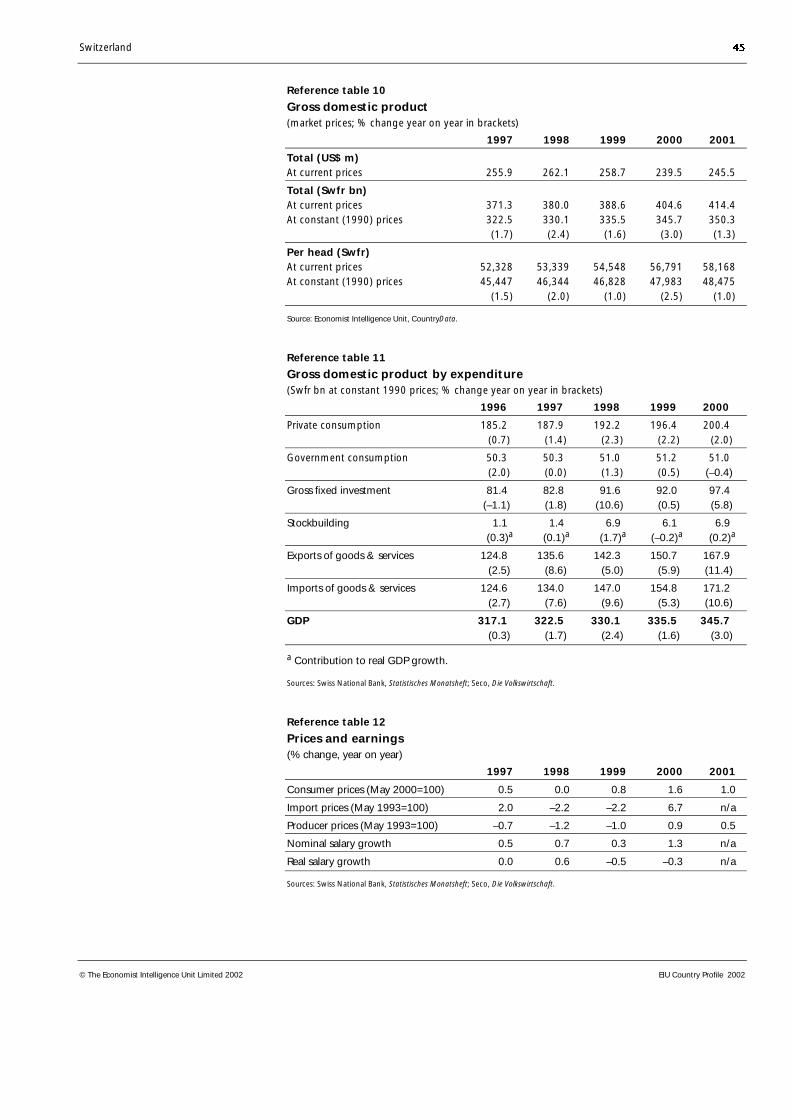
Switzerland 45
© The Economist Intelligence Unit Limited 2002 EIU Country Profile 2002
Reference table 10
Gross domestic product(market prices; % change year on year in brackets)
1997 1998 1999 2000 2001
Total (US$ m)At current prices 255.9 262.1 258.7 239.5 245.5
Total (Swfr bn)At current prices 371.3 380.0 388.6 404.6 414.4At constant (1990) prices 322.5 330.1 335.5 345.7 350.3
(1.7) (2.4) (1.6) (3.0) (1.3)
Per head (Swfr)At current prices 52,328 53,339 54,548 56,791 58,168At constant (1990) prices 45,447 46,344 46,828 47,983 48,475
(1.5) (2.0) (1.0) (2.5) (1.0)
Source: Economist Intelligence Unit, CountryData.
Reference table 11
Gross domestic product by expenditure(Swfr bn at constant 1990 prices; % change year on year in brackets)
1996 1997 1998 1999 2000
Private consumption 185.2 187.9 192.2 196.4 200.4 (0.7) (1.4) (2.3) (2.2) (2.0)
Government consumption 50.3 50.3 51.0 51.2 51.0 (2.0) (0.0) (1.3) (0.5) (–0.4)
Gross fixed investment 81.4 82.8 91.6 92.0 97.4 (–1.1) (1.8) (10.6) (0.5) (5.8)
Stockbuilding 1.1 1.4 6.9 6.1 6.9 (0.3)a (0.1)a (1.7)a (–0.2)a (0.2)a
Exports of goods & services 124.8 135.6 142.3 150.7 167.9 (2.5) (8.6) (5.0) (5.9) (11.4)
Imports of goods & services 124.6 134.0 147.0 154.8 171.2 (2.7) (7.6) (9.6) (5.3) (10.6)
GDP 317.1 322.5 330.1 335.5 345.7 (0.3) (1.7) (2.4) (1.6) (3.0)
a Contribution to real GDP growth.
Sources: Swiss National Bank, Statistisches Monatsheft; Seco, Die Volkswirtschaft.
Reference table 12
Prices and earnings(% change, year on year)
1997 1998 1999 2000 2001
Consumer prices (May 2000=100) 0.5 0.0 0.8 1.6 1.0
Import prices (May 1993=100) 2.0 –2.2 –2.2 6.7 n/a
Producer prices (May 1993=100) –0.7 –1.2 –1.0 0.9 0.5
Nominal salary growth 0.5 0.7 0.3 1.3 n/a
Real salary growth 0.0 0.6 –0.5 –0.3 n/a
Sources: Swiss National Bank, Statistisches Monatsheft; Seco, Die Volkswirtschaft.
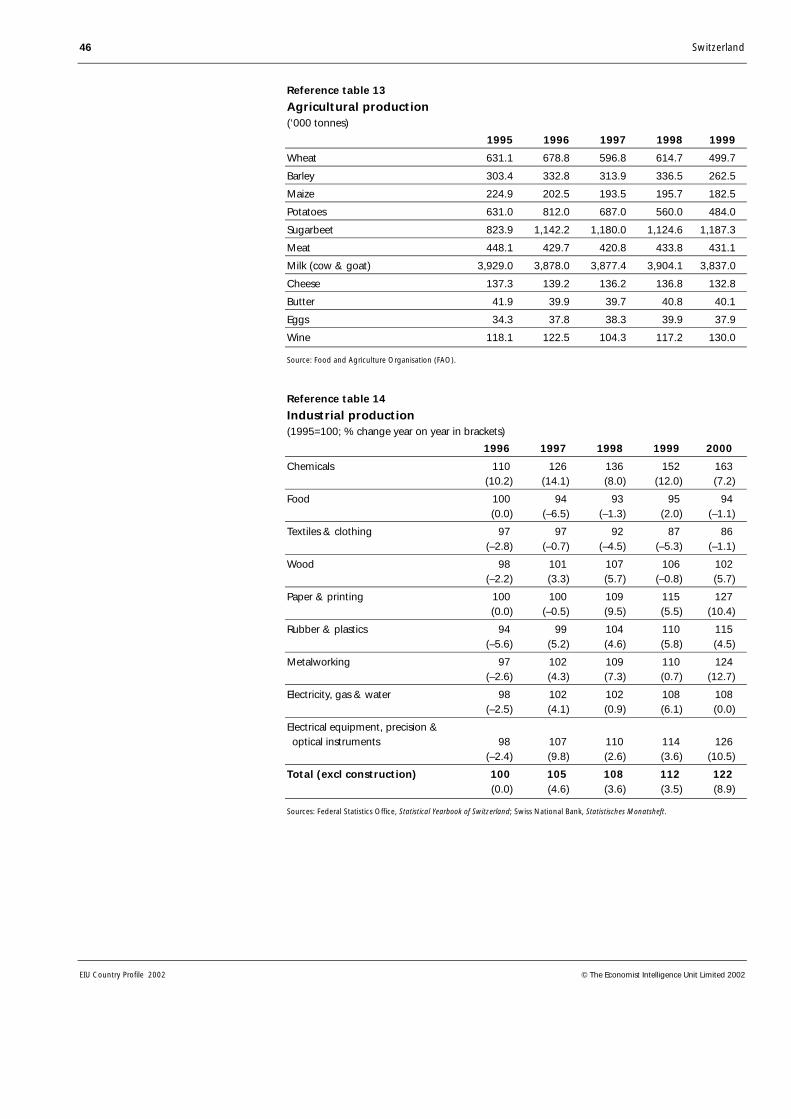
46 Switzerland
EIU Country Profile 2002 © The Economist Intelligence Unit Limited 2002
Reference table 13
Agricultural production(‘000 tonnes)
1995 1996 1997 1998 1999
Wheat 631.1 678.8 596.8 614.7 499.7
Barley 303.4 332.8 313.9 336.5 262.5
Maize 224.9 202.5 193.5 195.7 182.5
Potatoes 631.0 812.0 687.0 560.0 484.0
Sugarbeet 823.9 1,142.2 1,180.0 1,124.6 1,187.3
Meat 448.1 429.7 420.8 433.8 431.1
Milk (cow & goat) 3,929.0 3,878.0 3,877.4 3,904.1 3,837.0
Cheese 137.3 139.2 136.2 136.8 132.8
Butter 41.9 39.9 39.7 40.8 40.1
Eggs 34.3 37.8 38.3 39.9 37.9
Wine 118.1 122.5 104.3 117.2 130.0
Source: Food and Agriculture Organisation (FAO).
Reference table 14
Industrial production(1995=100; % change year on year in brackets)
1996 1997 1998 1999 2000
Chemicals 110 126 136 152 163 (10.2) (14.1) (8.0) (12.0) (7.2)
Food 100 94 93 95 94 (0.0) (–6.5) (–1.3) (2.0) (–1.1)
Textiles & clothing 97 97 92 87 86 (–2.8) (–0.7) (–4.5) (–5.3) (–1.1)
Wood 98 101 107 106 102 (–2.2) (3.3) (5.7) (–0.8) (5.7)
Paper & printing 100 100 109 115 127 (0.0) (–0.5) (9.5) (5.5) (10.4)
Rubber & plastics 94 99 104 110 115 (–5.6) (5.2) (4.6) (5.8) (4.5)
Metalworking 97 102 109 110 124 (–2.6) (4.3) (7.3) (0.7) (12.7)
Electricity, gas & water 98 102 102 108 108 (–2.5) (4.1) (0.9) (6.1) (0.0)
Electrical equipment, precision & optical instruments 98 107 110 114 126
(–2.4) (9.8) (2.6) (3.6) (10.5)
Total (excl construction) 100 105 108 112 122 (0.0) (4.6) (3.6) (3.5) (8.9)
Sources: Federal Statistics Office, Statistical Yearbook of Switzerland; Swiss National Bank, Statistisches Monatsheft.
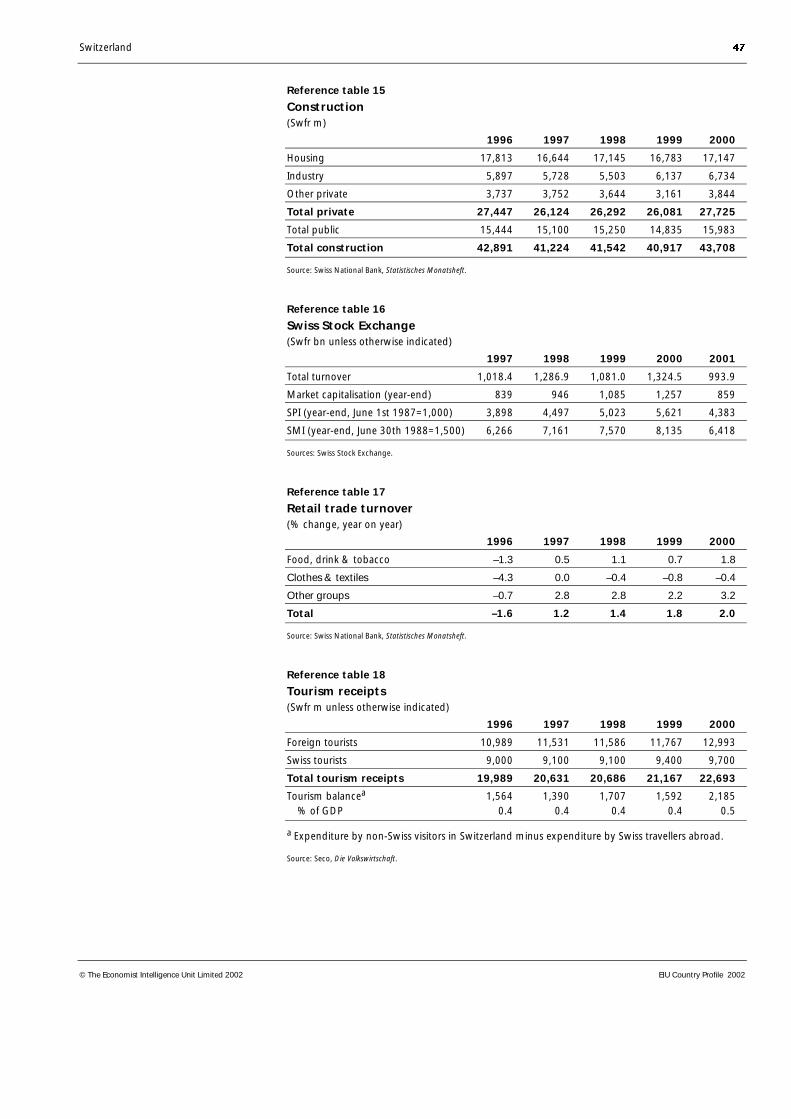
Switzerland 47
© The Economist Intelligence Unit Limited 2002 EIU Country Profile 2002
Reference table 15
Construction(Swfr m)
1996 1997 1998 1999 2000
Housing 17,813 16,644 17,145 16,783 17,147
Industry 5,897 5,728 5,503 6,137 6,734
Other private 3,737 3,752 3,644 3,161 3,844
Total private 27,447 26,124 26,292 26,081 27,725
Total public 15,444 15,100 15,250 14,835 15,983
Total construction 42,891 41,224 41,542 40,917 43,708
Source: Swiss National Bank, Statistisches Monatsheft.
Reference table 16
Swiss Stock Exchange(Swfr bn unless otherwise indicated)
1997 1998 1999 2000 2001
Total turnover 1,018.4 1,286.9 1,081.0 1,324.5 993.9
Market capitalisation (year-end) 839 946 1,085 1,257 859
SPI (year-end, June 1st 1987=1,000) 3,898 4,497 5,023 5,621 4,383
SMI (year-end, June 30th 1988=1,500) 6,266 7,161 7,570 8,135 6,418
Sources: Swiss Stock Exchange.
Reference table 17
Retail trade turnover(% change, year on year)
1996 1997 1998 1999 2000
Food, drink & tobacco –1.3 0.5 1.1 0.7 1.8
Clothes & textiles –4.3 0.0 –0.4 –0.8 –0.4
Other groups –0.7 2.8 2.8 2.2 3.2
Total –1.6 1.2 1.4 1.8 2.0
Source: Swiss National Bank, Statistisches Monatsheft.
Reference table 18
Tourism receipts(Swfr m unless otherwise indicated)
1996 1997 1998 1999 2000
Foreign tourists 10,989 11,531 11,586 11,767 12,993
Swiss tourists 9,000 9,100 9,100 9,400 9,700
Total tourism receipts 19,989 20,631 20,686 21,167 22,693
Tourism balancea 1,564 1,390 1,707 1,592 2,185 % of GDP 0.4 0.4 0.4 0.4 0.5
a Expenditure by non-Swiss visitors in Switzerland minus expenditure by Swiss travellers abroad.
Source: Seco, Die Volkswirtschaft.
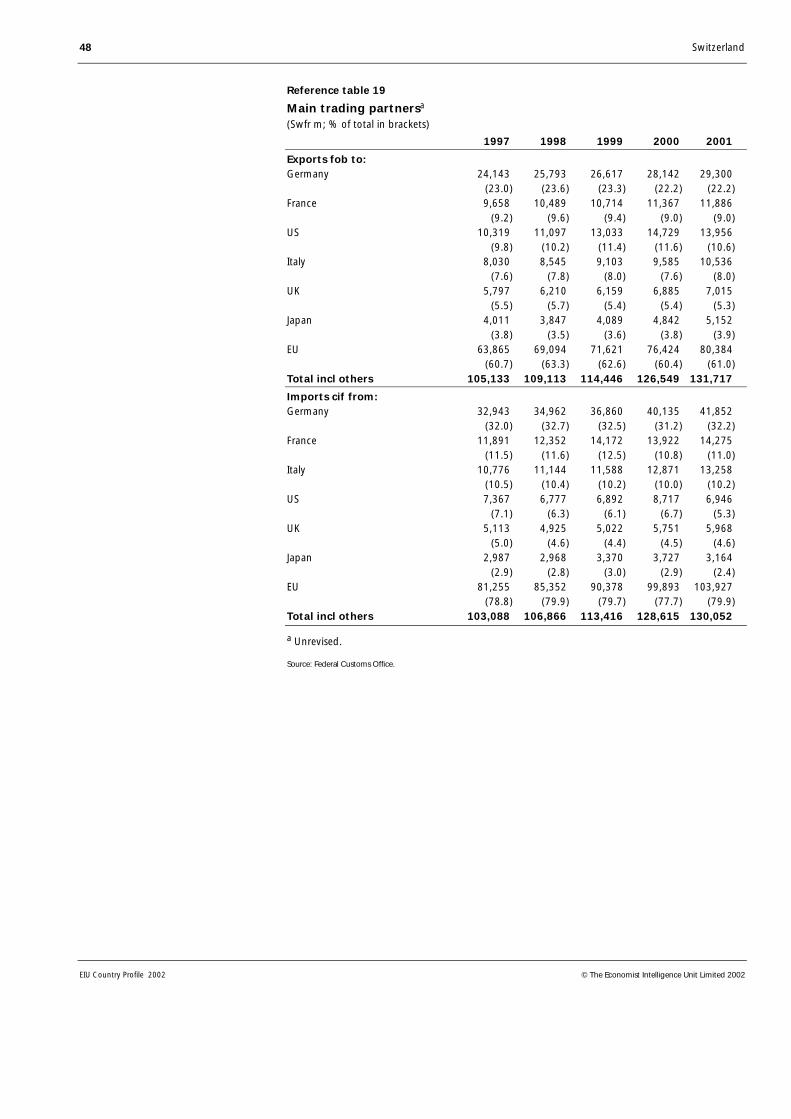
48 Switzerland
EIU Country Profile 2002 © The Economist Intelligence Unit Limited 2002
Reference table 19
Main trading partnersa
(Swfr m; % of total in brackets)
1997 1998 1999 2000 2001
Exports fob to:Germany 24,143 25,793 26,617 28,142 29,300
(23.0) (23.6) (23.3) (22.2) (22.2)France 9,658 10,489 10,714 11,367 11,886
(9.2) (9.6) (9.4) (9.0) (9.0)US 10,319 11,097 13,033 14,729 13,956
(9.8) (10.2) (11.4) (11.6) (10.6)Italy 8,030 8,545 9,103 9,585 10,536
(7.6) (7.8) (8.0) (7.6) (8.0)UK 5,797 6,210 6,159 6,885 7,015
(5.5) (5.7) (5.4) (5.4) (5.3)Japan 4,011 3,847 4,089 4,842 5,152
(3.8) (3.5) (3.6) (3.8) (3.9)EU 63,865 69,094 71,621 76,424 80,384
(60.7) (63.3) (62.6) (60.4) (61.0)Total incl others 105,133 109,113 114,446 126,549 131,717
Imports cif from:Germany 32,943 34,962 36,860 40,135 41,852
(32.0) (32.7) (32.5) (31.2) (32.2)France 11,891 12,352 14,172 13,922 14,275
(11.5) (11.6) (12.5) (10.8) (11.0)Italy 10,776 11,144 11,588 12,871 13,258
(10.5) (10.4) (10.2) (10.0) (10.2)US 7,367 6,777 6,892 8,717 6,946
(7.1) (6.3) (6.1) (6.7) (5.3)UK 5,113 4,925 5,022 5,751 5,968
(5.0) (4.6) (4.4) (4.5) (4.6)Japan 2,987 2,968 3,370 3,727 3,164
(2.9) (2.8) (3.0) (2.9) (2.4)EU 81,255 85,352 90,378 99,893 103,927
(78.8) (79.9) (79.7) (77.7) (79.9)Total incl others 103,088 106,866 113,416 128,615 130,052
a Unrevised.
Source: Federal Customs Office.
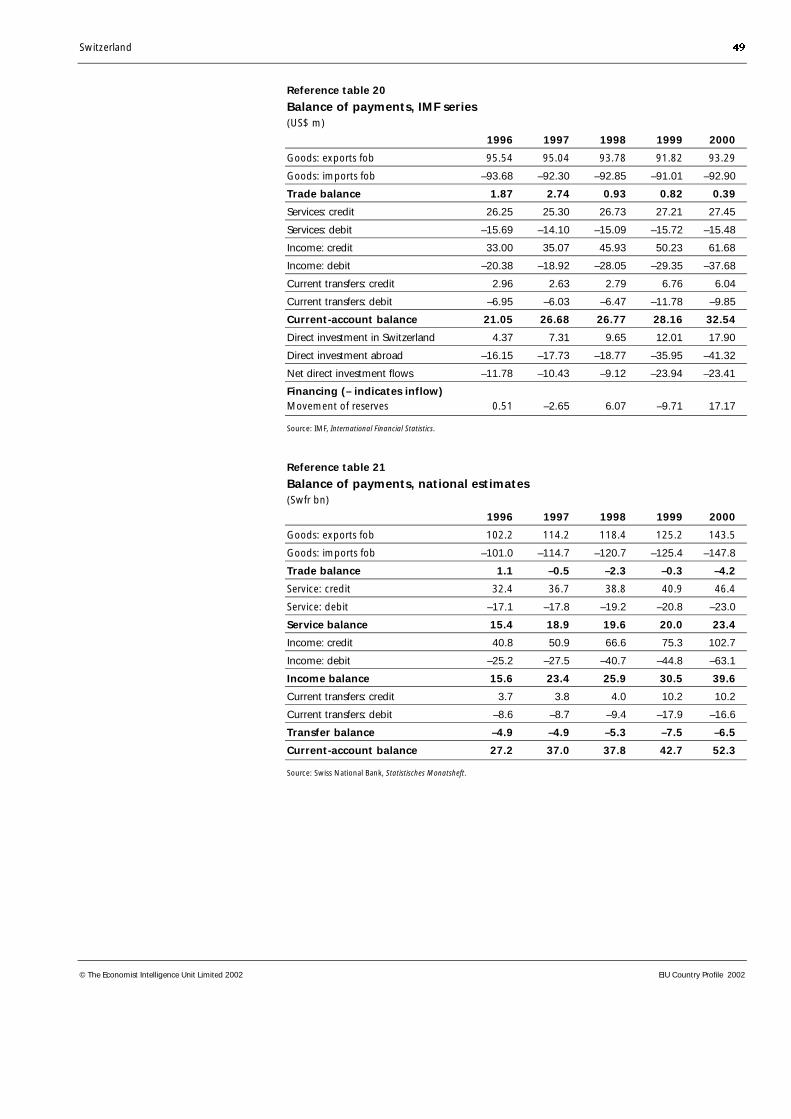
Switzerland 49
© The Economist Intelligence Unit Limited 2002 EIU Country Profile 2002
Reference table 20
Balance of payments, IMF series(US$ m)
1996 1997 1998 1999 2000
Goods: exports fob 95.54 95.04 93.78 91.82 93.29
Goods: imports fob –93.68 –92.30 –92.85 –91.01 –92.90
Trade balance 1.87 2.74 0.93 0.82 0.39
Services: credit 26.25 25.30 26.73 27.21 27.45
Services: debit –15.69 –14.10 –15.09 –15.72 –15.48
Income: credit 33.00 35.07 45.93 50.23 61.68
Income: debit –20.38 –18.92 –28.05 –29.35 –37.68
Current transfers: credit 2.96 2.63 2.79 6.76 6.04
Current transfers: debit –6.95 –6.03 –6.47 –11.78 –9.85
Current-account balance 21.05 26.68 26.77 28.16 32.54
Direct investment in Switzerland 4.37 7.31 9.65 12.01 17.90
Direct investment abroad –16.15 –17.73 –18.77 –35.95 –41.32
Net direct investment flows –11.78 –10.43 –9.12 –23.94 –23.41
Financing (– indicates inflow)Movement of reserves 0.51 –2.65 6.07 –9.71 17.17
Source: IMF, International Financial Statistics.
Reference table 21
Balance of payments, national estimates(Swfr bn)
1996 1997 1998 1999 2000
Goods: exports fob 102.2 114.2 118.4 125.2 143.5
Goods: imports fob –101.0 –114.7 –120.7 –125.4 –147.8
Trade balance 1.1 –0.5 –2.3 –0.3 –4.2
Service: credit 32.4 36.7 38.8 40.9 46.4
Service: debit –17.1 –17.8 –19.2 –20.8 –23.0
Service balance 15.4 18.9 19.6 20.0 23.4
Income: credit 40.8 50.9 66.6 75.3 102.7
Income: debit –25.2 –27.5 –40.7 –44.8 –63.1
Income balance 15.6 23.4 25.9 30.5 39.6
Current transfers: credit 3.7 3.8 4.0 10.2 10.2
Current transfers: debit –8.6 –8.7 –9.4 –17.9 –16.6
Transfer balance –4.9 –4.9 –5.3 –7.5 –6.5
Current-account balance 27.2 37.0 37.8 42.7 52.3
Source: Swiss National Bank, Statistisches Monatsheft.
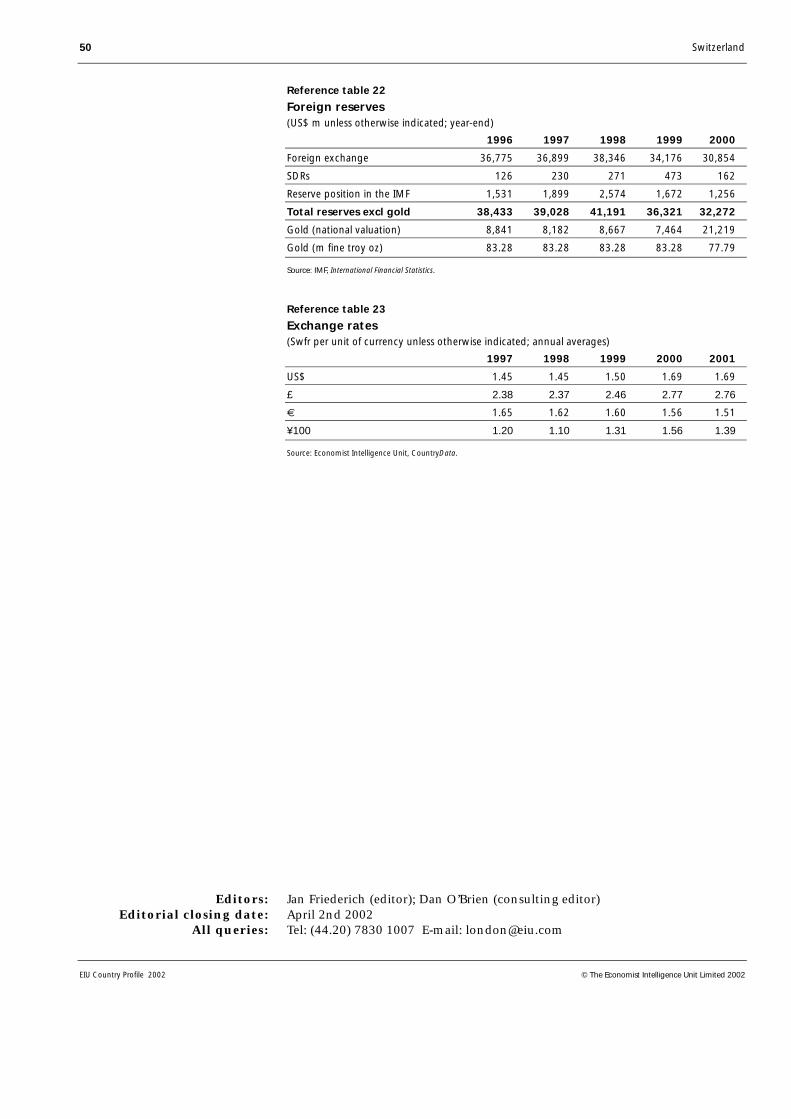
50 Switzerland
EIU Country Profile 2002 © The Economist Intelligence Unit Limited 2002
Reference table 22
Foreign reserves(US$ m unless otherwise indicated; year-end)
1996 1997 1998 1999 2000
Foreign exchange 36,775 36,899 38,346 34,176 30,854
SDRs 126 230 271 473 162
Reserve position in the IMF 1,531 1,899 2,574 1,672 1,256
Total reserves excl gold 38,433 39,028 41,191 36,321 32,272
Gold (national valuation) 8,841 8,182 8,667 7,464 21,219
Gold (m fine troy oz) 83.28 83.28 83.28 83.28 77.79
Source: IMF, International Financial Statistics.
Reference table 23
Exchange rates(Swfr per unit of currency unless otherwise indicated; annual averages)
1997 1998 1999 2000 2001
US$ 1.45 1.45 1.50 1.69 1.69
£ 2.38 2.37 2.46 2.77 2.76
€ 1.65 1.62 1.60 1.56 1.51
¥100 1.20 1.10 1.31 1.56 1.39
Source: Economist Intelligence Unit, CountryData.
Editors: Jan Friederich (editor); Dan O’Brien (consulting editor)Editorial closing date: April 2nd 2002
All queries: Tel: (44.20) 7830 1007 E-mail: [email protected]