swutc/04/473700-00021-1 august 2004
TRANSCRIPT

Technical Report Documentation Page 1. Report No. SWUTC/04/473700-00021-1
2. Government Accession No.
3. Recipient's Catalog No. 5. Report Date August 2004
4. Title and Subtitle ANALYSIS OF START-UP CROSS-GULF SHORT SEA SHIPPING ACTIVITIES WITH MEXICO SINCE 1990: PROBLEMS AND OPPORTUNITIES
6. Performing Organization Code
7. Author(s) C. James Kruse, David H. Bierling, Nathan J. Vajdos
8. Performing Organization Report No. Report 473700-00021 10. Work Unit No. (TRAIS)
9. Performing Organization Name and Address Texas Transportation Institute The Texas A&M University System College Station, Texas 77843-3135
11. Contract or Grant No. DTRS99-G-0006 13. Type of Report and Period Covered Research Report September 2003 – August 2004
12. Sponsoring Agency Name and Address Southwest Region University Transportation Center Texas Transportation Institute Texas A&M University System College Station, TX 77843-3135
14. Sponsoring Agency Code
15. Supplementary Notes Supported by a grant from the U.S. Department of Transportation, University Transportation Centers Program 16. Abstract At the same time that traffic congestion is increasing on our nation’s highways, international trade continues to show strong growth trends, especially NAFTA trade between the U.S. and Mexico. Because of this, much interest has surfaced in “short sea shipping,” loosely defined as sea shipping that does not involve more than one continent. This report looks at what has been attempted since 1990 in one subset of short sea shipping—U.S.-Mexico cross-Gulf services. The objective of the report is to determine what services have been attempted, what obstacles they encountered, and what policies might be implemented to encourage the success of future ventures. This was done through extensive literature searches, interviews with participants in previous ventures, and surveys and discussions with port authorities. In order to provide context for the study, a description of the U.S. Gulf and Mexican port systems is included along with brief summaries of each of the ports identified as being actively involved in the trade. Topics for further research are also identified. 17. Key Words NAFTA, Gulf of Mexico, Port, Ports, Shipping, Short Sea, Short Sea Shipping, Venture, Commodity, Trade, Transportation, Congestion, Cargo, Business, Research, Gulf Ports, Commerce, Shipping Services, Shipping Companies, Shipping Ventures
18. Distribution Statement No restrictions. This document is available to the public through NTIS: National Technical Information Service Springfield, Virginia 22161 http://www.ntis.gov
19. Security Classif.(of this report) Unclassified
20. Security Classif.(of this page) Unclassified
21. No. of Pages 82
22. Price
Form DOT F 1700.7 (8-72) Reproduction of completed page authorize


ANALYSIS OF START-UP CROSS-GULF SHORT SEA SHIPPING ACTIVITIES
WITH MEXICO SINCE 1990: PROBLEMS AND OPPORTUNITIES
by:
C. James Kruse, Director, Center for Ports & Waterways
Texas Transportation Institute
David H. Bierling Associate Transportation Researcher
Texas Transportation Institute
and
Nathan J. Vajdos Graduate Assistant Researcher Texas Transportation Institute
Prepared for:
Southwest Region University Transportation Center
SWUTC/04/473700-00021-1
Texas Transportation Institute Texas A&M University System
College Station, TX 77843-3135
August 2004


v
ABSTRACT At the same time that traffic congestion is increasing on our nation’s highways, international trade continues to show strong growth trends, especially NAFTA trade between the U.S. and Mexico. Because of this, much interest has surfaced in “short sea shipping,” loosely defined as sea shipping that does not involve more than one continent. This report looks at what has been attempted since 1990 in one subset of short sea shipping—U.S.-Mexico cross-Gulf services. The objective of the report is to determine what services have been attempted, what obstacles they encountered, and what policies might be implemented to encourage the success of future ventures. This was done through extensive literature searches, interviews with participants in previous ventures, and surveys and discussions with port authorities. In order to provide context for the study, a description of the U.S. Gulf and Mexican port systems is included along with brief summaries of each of the ports identified as being actively involved in the trade. Topics for further research are also identified.


vii
EXECUTIVE SUMMARY
THE TRADE PICTURE: LANDSIDE CONGESTION AND GRIDLOCK
In North America, regional, national, and trans-national cargo movement has been transformed from a largely maritime enterprise during the first centuries of continental development to a predominantly land-based enterprise with the extensive development of national railroad networks in the nineteenth century and national highway networks in the twentieth century. Freight movement over these networks has expanded through their ability to meet shipper needs of providing reliable, time-sensitive services at costs that the market can bear. There is a growing concern among shippers, cargo carriers, and national transportation agencies that these land-based networks are rapidly approaching and in some cases exceeding the capacities they were designed for. At the same time that the volume of cargo is swelling at Gulf ports, a shortage of truck capacity is developing. Nationwide, approximately 17,000 trucking companies have gone out of business in the last few years.1 The highway system itself is a concern. According to the National Chamber Federation’s “A Study of North American Port and Intermodal Systems,” the highway system that carries 60 percent of domestic freight has experienced a doubling of vehicle miles traveled in the past 20 years while total highway miles have increased one percent. Officials from the U.S. Department of Transportation’s Maritime Administration (MARAD) have stated in multiple presentations that the approximate cost to construct a new mile of highway is $32 million and that it costs $100 million for an interchange. Taken as a whole, this evidence suggests that the United States is not going to be able to afford to build its way out of congestion without some major changes in transportation patterns and practices. With continuing demand and growth of international trade, the resulting gridlock on these networks could paralyze portions of national economies dependent on this trade and have substantial adverse impacts on other sectors as well. As policy makers and stakeholders seek mitigating solutions to the specter of landside freight transport network paralysis, maritime transport has again emerged as a potential solution and outlet for interregional North American trade. One aspect of this maritime transport that is a current topic of discussion at the national level is short sea shipping. This report documents short sea shipping ventures between the United States and Mexico that have been attempted since 1990. While deep-sea shipments “normally consist of cargo moving over open ocean between continents,” short sea shipping operations “normally consist of cargo moving within a single continent over coastal waters.”2
1 “Can short sea measure up?” Journal of Commerce, April 19-25, 2004, p. 30-31. 2 I-95 Corridor Coalition Multi-Client Port Access Project, p. 4-1. (available at http://www.i95coalition.org/ITPG.html).

viii
The Landside Trade Picture
The current surface trade volume between the five U.S. Gulf states and Mexico is expected to steadily increase based on certain economic indicators. As trade barriers between the United States, Mexico, and other Latin American countries are lowered, the flow of traffic could increase substantially. Should traffic flows continue to increase at the same rate, demand will most likely exceed capacity. There are four possibilities that must be considered when accounting for and projecting current and future traffic flows. These possibilities are:
1. Traffic flow will remain essentially constant. 2. Traffic flow will increase. 3. Traffic flow will increase at a rate that far exceeds current trends. 4. Traffic flow will decrease.
To date, traffic flow has increased at a rate that exceeds projections made in the Latin America Trade & Transportation Study (LATTS) and has only strengthened the need for addressing alternatives to cross-border surface traffic. Trade forecasts from LATTS predicted that trade would increase by 300 percent by the year 2020 from 1996 levels.3 Trade values for U.S.-Mexico truck and rail cargo increased by approximately 100 percent each for the 1996-2003 period. Trade levels stabilized somewhat in the 2001-2003 time period from the 1996-2001 time period. Whether this is a result of temporary economic downturn, loss of market to other trade corridors, or capacity constraints is a topic of further research. Should U.S.-Mexico trade revert to a rate of increase similar to pre-2001 rates, increasing trade will pose a serious problem for surface transportation given the existing infrastructure. The longer term trends in trade and cross-border traffic are expected to continue, if not exceed, their projected rates if Mexico continues its efforts to promote market reforms. Its increased trade with the United States has led to cyclical behavior that is very much like that of the United States. Of course, it should be noted that if Mexico does alter its economic and trade policies, these trends may change abruptly. However, Mexico has made it very clear that it intends to continue its efforts to promote a free market economy. Considering the percentage of highway traffic that utilizes the five U.S. Gulf states and factoring in the forecasted increase in traffic congestion due to existing and projected miles of deficient capacity, evidence indicates that current supply will not meet projected future demand, when taking into consideration maintenance and construction of surface transportation infrastructure needed to meet projected future demand. Both carriers and Gulf of Mexico ports at which carriers call(ed) were surveyed regarding their perceptions of factors that contributed to the success or failure of cross-Gulf shipping ventures, particularly obstacles to success and proposed measures to address these obstacles.
3 LATTS, Power Point Presentation, www.wilbursmith.com

ix
FINDINGS – SHIPPER PERSPECTIVES
Where the research team could find individuals that are currently—or have previously been—involved with cross-Gulf operations, their observations on obstacles and potential remedies were solicited. In interviews with 11 short sea shipping companies several obstacles and potential actions that could be taken by governmental entities were mentioned. Each interviewee was asked to rank the obstacles and potential remedies they mentioned. Several important themes surfaced. One is that a shipper-oriented service is needed, with frequency of service being a very important component. This is consistent with much of the discussion taking place at seminars and in trade journals. Another element is the fact that there is already a well-entrenched border crossing infrastructure (both in terms of service and physical assets) that many people are comfortable with. To pull traffic away from this system will require a strong push to educate shippers, trucking companies, and logistics managers on the advantages of a cross-Gulf service. This implies that a service must be in place that has clear advantages for certain cargoes and destinations over surface transportation. It is important to note that to date truckers, shippers, and intermodal marketing companies have not been pushing short sea shipping very aggressively. It has been largely a government initiative. The Jones Act emerged as the third priority according to the score ranking, although of less relative importance than the top two concerns. The importance given the Jones Act is somewhat surprising. The Jones Act requires that cargo that has both its origin and destination in the United States must be handled by a U.S.-built, U.S.-owned, and U.S.-crewed vessel. Since cross-Gulf shipping is international in nature, it would seem that the Jones Act would only affect the ability of a foreign vessel to call on more than one port in the United States and thereby increase its revenue potential. This is a topic for future research. Two more themes seemed to receive equal attention: the lack of adequate port infrastructure (in Mexico) and a lack of federal funds for start-up. The first concern seems to include both the port and its connecting infrastructure. Where infrastructure needs to be developed, one consideration to keep in mind is that it costs less to develop Roll-On/Roll-Off (Ro/Ro) infrastructure than it does Load-On/Load-Off (Lo/Lo) infrastructure; Ro/Ro only requires truck ramps, rather than cranes, and thus involves lower cost. The latter concern appeared to focus primarily on a desire for a ship-building subsidy or some kind of operating subsidy in the early years of operation. As stated earlier, interviewees were also asked about the potential actions that governmental entities could implement to promote more cross-Gulf shipping. Not all of the interviewees stated what actions could be taken to mitigate or eliminate the stated obstacles. Those who did respond seemed to focus on the need of providing better market data and that the governments of both countries need to work on making it available – especially data on the Mexican marketplace. Next, they focused on funding through modification of more favorable Title XI funding criteria and exemption from the Harbor Maintenance Tax, as well as application of highway funds for congestion mitigation projects, tax incentives for vessel construction and capital assets, and funding for demonstration projects. The carriers did not explain how additional funding will directly solve many of the obstacles they identified, but perhaps carriers feel that additional funds these measures would free up can be used to address those obstacles that are more directly in their ability – or the ability of those they work closely with – to participate, such as

x
development of port infrastructure, use of start-up funds, or ability to conduct market assessments. Another measure of importance to the responders was a need to educate the public and the business community at large – especially those involved in border trade – on short sea shipping and its advantages.
FINDINGS – PORT PERSPECTIVES
The research team also contacted the ports that were involved in the cross-Gulf ventures identified in this report. Responses included in the analysis came from all but the Ports of Coatzacoalcos and Tampa. The ports serve as third party references since they are (were) actively involved with both the carriers and shippers involved in the ventures, and in some cases actively attempted to promote the venture. In order to see if nationality influenced perceptions of difficulties and potential remedies, the observations of the ports were separated by U.S. and Mexican ports. U.S. ports seemed to focus on the difficulty in attracting a backhaul (Mexico to U.S.) cargo and frequency of service (flexibility for the shipper). The former is interesting from the perspective that it was not a major concern of the carriers who were actively involved in the business. This would seem to indicate that the ports detected an imbalance in the direction of cargo flows, but the carriers were attempting to compensate for it with their rate structure and did not see it as a serious impediment to maintaining a profitable service. The latter issue of frequency of service echoes what the carriers stated—it is necessary to offer the shipper a high frequency of service in order to provide the shipper with flexibility. U.S. ports also believe that the Jones Act is an impediment to trade. As discussed in the analysis of carrier responses, the Jones Act makes it impossible for foreign vessels to include more than one U.S. port in their rotation, which would provide opportunities to smooth out revenue flows and generate more cargo. U.S. ports also cited lack of federal funding support as a serious impediment. Carriers also cited this as a serious obstacle, although they ranked several others as more severe. Finally, U.S. ports ranked a well-entrenched border crossing infrastructure as an obstacle, but not as highly as carriers did. Mexican ports expressed opinions very similar to those of their U.S. counterparts. They focused on frequency of service, the Jones Act, and the imbalance in trade—the same top 3 that were mentioned by U.S. ports (although not in the same order of priority). This is not surprising since the services under consideration are international and involve the same cargoes and equipment. It is interesting to note that the responses from ports on both sides of the border seemed to focus heavily on tax incentives for vessels and major capital assets. Beyond that the comments seemed to concentrate more on what the United States government should do (Jones Act, Harbor Maintenance Tax, etc.) as opposed to what the Mexican government should do. It also seemed to be a common concern that regardless of the specific action taken by government, there is a need to channel more of the resources dedicated to highway infrastructure (and related tasks) into infrastructure that would facilitate routes selected for short sea shipping with respect to cross-

xi
border transportation, thereby developing a critical mass. U.S. ports placed a high priority on acquiring better market data (especially for Mexico) as a remedy for the problem of backhaul cargoes or overall lack of cargoes. Both they and their Mexican counterparts would like to see the two governments do more marketing and public awareness campaigns on behalf of short sea (or cross-Gulf) shipping. Finally, U.S. ports tend to see a waiver from Jones Act requirements as a desirable measure, and Mexican ports tend to agree. It is also interesting to note several potential obstacles that were not mentioned by the parties interviewed: cost of labor (at least in U.S. ports), availability and cost of land for expansion, and fragmentation of responsibility among a myriad of agencies in the U.S. Federal government. This is not to say that they are not important issues, but they did not rank in the top three with any of the respondents. In all of the discussion with the various parties, the size of the port did not seem to matter. Obstacles and potential remedies seemed to focus on cargo carriers and on certain systemic issues. This would seem to indicate that the door is open to a wide variety of ports to participate in cross-Gulf shipping, especially on the U.S. side with its denser coverage and wide variety of facilities. Responses seemed to indicate that it was more a matter of the carrier’s equipment and operating philosophy than it was the ability of the port to handle the cargo transfers.
LESSONS LEARNED FROM CROSS-GULF VENTURES: SUCCESSES
Of the 21 services identified in our report, at least five cross-Gulf ventures have realized success since 1990, with four remaining in current operation today. NYK – Bulk successfully operated what was intended to be a short-term venture to alleviate problems experienced with cross-border rail traffic in 1999-2000. The four services that are still operating are American Eagle Tankers (AET), CG Railway (CGR), Industrial Maritime Carriers (IMC), and Línea Peninsular (LP). From these successful ventures, we can distill a number of “lessons learned” that may be transferable to other short sea shipping ventures in the Gulf or other geographic regions. Common practices among these carriers include operating in a niche market and limiting the variety of cargo, and meeting very specific needs using adequately sized and outfitted vessels. They also developed secure market bases in their operations and appear to schedule vessel sailings on a “frequent” and regular basis (perhaps they are able to do this as a result of their success in operations). Not all factors were able to be identified for all carriers, but in these cases, consistent patterns emerge.
Niche market and limited variety of cargo. Successful carriers in the cross-Gulf shipping ventures discussed in this analysis focused on transport for specific, niche markets. This may be because of specialized experience to meet a particular need, relationships between the carriers and shippers, or other factors. Meets specific needs using adequately sized / outfitted vessels. Experience of three cross-Gulf shipping ventures (CGR, IMC, LP) seems to indicate that smaller lot sizes are ideal, or at least, what the market can bear. Small lots (5,000 tons or less) are difficult to match up with conventional vessels and services. Such shipments are typically placed in a separate hold and only part of the hold is filled. Furthermore, handling costs are high on a

xii
per unit basis. Appropriately scaled vessels and landside operations would have a competitive advantage for the smaller lots. In two cases (AET, NYK), larger vessels were used. Developed secure market bases in their operations. In several cases, it appears that the carriers not only operated in niche markets, but they also developed practically “exclusive” services or at least were able to “lock in” significant portions of very broad market bases. Vessel sailings scheduled on a “frequent,” regular, or competitive basis. While it is difficult to define what exactly a “frequent” sailing schedule is, the successful cross-Gulf carriers appear to have at least a weekly frequency (or greater) to their sailing schedules, with a regularity that meets shipper needs, or provides a level of competitive advantage significantly greater than that available from landside modes. Services provided to shippers. Information about three of the five successful cross-Gulf shippers indicates that they provide particular services for shippers or makes some note of how they provide high quality customer service by meeting specific shipper needs or demands.
LESSONS LEARNED FROM CROSS-GULF VENTURES: FAILURES
Based partially on press reports and partially on personal interviews, the research team was able to identify several major causes for the discontinuance of 16 of the 21 ventures. They include the following:
Competition from other modes, particularly railroads (rate wars). In the case of Americas Marine Express, the railroads were able to effectively compete for traffic on the Memphis to New Orleans stretch by lowering their rates and thereby making it difficult to operate the marine service profitably. In other cases, existing trucking options proved to be more competitive both in terms of time and rates. Sweeping changes in the railroad industry on both sides of the border. Consolidations in the U.S. and privatization in Mexico provided rail service providers with new options that did not exist previously. Connections that were designed to compensate for lack of a border crossing or to address interline efficiencies were no longer needed. Additionally, the administrative and financial burden of making such sweeping changes made it almost impossible for management of previously interested railroads to focus on new short sea shipping ventures as priority business activities. Lack of working capital. In some cases, the enterprise simply did not have the financial resources to make it through the start-up period. Inability to attract sufficient cargo. The inability to attract cargo seems to be rooted in several causes. In some cases, there was insufficient market research to know what cargoes to pursue. In other cases, the vessel chosen for the service was either oversized or improperly configured for the market it was serving. Some services were aborted before they began operations because of a determination that there was not sufficient demand in the market they were targeting. Finally, some services simply did not have the resources to market their service effectively. Lack of equipment. In order to reduce capital requirements, certain ventures time chartered their vessels. When the charter expired they were unable to negotiate a new charter for the vessel or find a suitable replacement.

xiii
Inefficiencies in Mexico. At the time that some ventures were starting up (or intending to start up) there were costs and inefficiencies at their targeted Mexican ports of call that prevented them from offering the rates they wanted to offer. (It should be noted that in some cases, the concerns have been addressed, but they were important issues at the time.) Lack of services. It appears—both from our primary research and from press reports—that many services have failed due in large part to lack of frequency and flexibility. Trucking lines, railroads, and 3PLs (third party logistics providers), seem to have an inherent market advantage over potential cross-Gulf services. These companies have a history of talking directly with and usually getting the original bill of lading from the shippers. Without prior experience in this area, it could be very expensive and time consuming for barge operators and short sea shipping service providers to replace this service level. One possible solution, evidenced in successes of some cross-Gulf ventures cited above, may be to view short sea shipping as a component of an integrated logistics chain –part of a door-to-door solution, rather than perceived as competitors in head-to-head competition. Another suggestion might be to view trucking lines, railroads, and 3PLs as the primary customers, in addition to consideration of the ultimate shipper as the client.
ADDITIONAL RESEARCH NEEDS
Several of the factors mentioned by ports, individuals, and carriers merit future study and investigation. For instance, it would be useful to potential start-up investors to know the status of Mexican infrastructure (especially landside connections) and the plans the Mexican government has for infrastructure investment related to the more active ports. While there is general agreement that it is improving, more details on exactly what is being done and how quickly would be very helpful. It would also be useful to further examine exactly how the two governments could work together to produce the market data that cross-Gulf operators indicate they need. Even with the enactment of all the potential measures identified by the various parties, without good market data, start-up ventures are still being required to make decisions based on intuition or “gut feel” rather than reliable information. The U.S. is just now opening its highways to Mexican trucks as agreed under NAFTA. It remains to be seen whether Mexican owner/operators will see this as an opportunity they should pursue or if the current transportation system will remain the preferred mode of operation. Should Mexican owners/operators decide to penetrate the U.S. market, this could have an effect on the viability of cross-Gulf shipping operations. The effects of the opening of the U.S. to Mexican trucks on the entire binational system need to be evaluated. Finally, research needs to be conducted into how the governments of Mexico and the United States could work together to influence the development of infrastructure toward maritime shipments to a greater degree than they do today. While the two governmental systems and approaches are markedly different, a binational approach to developing infrastructure on both sides of the border could have a profound influence on how that infrastructure is oriented.


xv
TABLE OF CONTENTS
Page ABSTRACT ...................................................................................................................................v EXECUTIVE SUMMARY ........................................................................................................ vii DISCLAIMER ............................................................................................................................xvi ACKNOWLEDGMENTS........................................................................................................ xvii CHAPTER 1: SHORT SEA SHIPPING AND REPORT CONTEXT .....................................1
Introduction: The Trade Picture: Landside Congestion and Gridlock ........................................1 Characteristics of Short Sea Shipping .........................................................................................2 The Landside Trade Picture.........................................................................................................6
Texas........................................................................................................................................7 Louisiana .................................................................................................................................8 Mississippi ...............................................................................................................................8 Alabama...................................................................................................................................8 Florida......................................................................................................................................8 Trends and Projections ............................................................................................................8 Texas......................................................................................................................................10 Louisiana ...............................................................................................................................10 Mississippi .............................................................................................................................10 Alabama.................................................................................................................................10 Florida....................................................................................................................................11
Overview of U.S. Gulf Port System ..........................................................................................11 Overview of Mexican Port System............................................................................................12
Restructuring and Privatization .............................................................................................12 CHAPTER 2: U.S. AND MEXICAN PORTS INVOLVED IN THE STUDY.......................15
U.S. PORTS...............................................................................................................................15 Port: Bienville...........................................................................................................................15
Overview of Port ...................................................................................................................15 Port: Freeport ............................................................................................................................16
Overview of Port ...................................................................................................................16 Port: Galveston .........................................................................................................................17
Overview of Port ...................................................................................................................17 Port: Gulfport............................................................................................................................18
Overview of Port ...................................................................................................................18 Port: Houston............................................................................................................................19
Overview of Port ...................................................................................................................19 Port: Lake Charles ....................................................................................................................21
Overview of Port ...................................................................................................................21 Port: Mobile..............................................................................................................................22
Overview of Port ...................................................................................................................22 Port: New Orleans ....................................................................................................................24
Overview of Port ...................................................................................................................24 Port: Tampa ..............................................................................................................................25

xvi
Overview of Port ...................................................................................................................25 MEXICAN PORTS ...................................................................................................................27 Port: Altamira ...........................................................................................................................27
Overview of Port ...................................................................................................................27 Port: Coatzacoalcos ..................................................................................................................28
Overview of Port ...................................................................................................................28 Port: Dos Bocas ........................................................................................................................29
Overview of Port ...................................................................................................................29 Port: Progreso ...........................................................................................................................30
Overview of Port ...................................................................................................................30 Port: Tampico ...........................................................................................................................31
Overview of Port ...................................................................................................................31 Port: Tuxpan .............................................................................................................................32
Overview of Port ...................................................................................................................32 Port: Veracruz...........................................................................................................................33
Overview of Port ...................................................................................................................33 CHAPTER 3: SUMMARY OF CROSS-GULF SERVICES..................................................35
American Eagle Tankers ...........................................................................................................35 Americas Marine Express..........................................................................................................35 Cargo Transport Lines ...............................................................................................................36 CG Railway (a subsidiary of International Shipholding Corp.) ................................................36 CIS Shipping (a.k.a. Gulf of Mexico Express)..........................................................................37 Crowley Liner Services (formerly Crowley American Transport) ...........................................37 CSX Transportation (Gato Marino Service)..............................................................................38 Grupo Naviero Kano (planned to be called Nafta Xpress Lines)..............................................38 Gulf Bridge Ro/Ro.....................................................................................................................39 Gulf Caribbean Transport ..........................................................................................................39 ITT (International Trade & Transport Ltd.) ..............................................................................39 Illinois Central ...........................................................................................................................40 Industrial Maritime Carriers (Intermarine)................................................................................40 Línea Peninsular ........................................................................................................................40 Maya Lines ................................................................................................................................41 Mexican Gulf Lines ...................................................................................................................41 Mexus Ro/Ro Ltd. .....................................................................................................................41 NYK - Bulk ...............................................................................................................................42 Protexa Burlington International ...............................................................................................42 Sea Lion Ocean Freight (a subsidiary of American River International)..................................43 Scotia Prince (Yucatan Express) ...............................................................................................43
CHAPTER 4: ANALYSIS – LESSONS LEARNED...............................................................45
Findings – Shipper Perspectives................................................................................................45 Findings – Port Perspectives......................................................................................................51 Lessons Learned Elsewhere.......................................................................................................59 Lessons Learned From Cross-Gulf Ventures: Successes ..........................................................61 Lessons Learned From Cross-Gulf Ventures: Failures .............................................................63

xvii
Additional Research Needs .......................................................................................................64 Conclusion .................................................................................................................................64

xviii
LIST OF ILLUSTRATIONS Page Figure 1. Total Monthly U.S. Merchandise Trade with Mexico by Truck and Rail Modes. .........9 Table 1. Commodities Handled at Gulf of Mexico Ports. ..............................................................4 Table 2. Surface Trade Breakdown. ...............................................................................................6 Table 3. Trade Movement into Mexico. .........................................................................................7 Table 4. Bienville Port Information..............................................................................................15 Table 5. Freeport Port Information...............................................................................................16 Table 6. Galveston Port Information. ...........................................................................................17 Table 7. Gulfport Port Information...............................................................................................19 Table 8. Houston Port Information...............................................................................................21 Table 9. Lake Charles Port Information. ......................................................................................22 Table 10. Mobile Port Information...............................................................................................23 Table 11. New Orleans Port Information. ....................................................................................25 Table 12. Tampa Port Information. ..............................................................................................26 Table 13. Altamira Port Information. ...........................................................................................28 Table 14. Coatzacoalcos Port Information. ..................................................................................29 Table 15. Dos Bocas Port Information. ........................................................................................30 Table 16. Progreso Port Information. ...........................................................................................31 Table 17. Tampico Port Information. ...........................................................................................32 Table 18. Tuxpan Port Information. .............................................................................................33 Table 19. Veracruz Port Information............................................................................................34 Table 20. Carrier-Cited Obstacles to Short Sea Shipping Ventures in the Gulf of Mexico........45 Table 21. Frequency of Carrier-Cited Obstacles to Short Sea Shipping Ventures in the Gulf of Mexico. ...........................................................................................................46 Table 22. Priority Score Ranking of Carrier-Cited Obstacles to Short Sea Shipping Ventures in the Gulf of Mexico.............................................................................................47 Table 23. Carrier-Suggested Measures to Promote Short Sea Shipping Ventures in the Gulf of Mexico. ...............................................................................................................48 Table 24. Frequency of Carrier-Suggested Measures to Promote Short Sea Shipping Ventures in the Gulf of Mexico.............................................................................................49 Table 25. Priority Score Ranking of Carrier-Suggested Measures to Promote Short Sea Shipping Ventures in the Gulf of Mexico. ............................................................50 Table 26. U.S. Port-Cited Obstacles to Short Sea Shipping Ventures in the Gulf of Mexico. .....................................................................................................................51 Table 27. Frequency of U.S. Port-Cited Obstacles to Short Sea Shipping Ventures in the Gulf of Mexico. ...........................................................................................................52 Table 28. Priority Score Ranking of U.S. Port-Cited Obstacles to Short Sea Shipping Ventures in the Gulf of Mexico. ............................................................................53 Table 29. Mexican Port-Cited Obstacles to Short Sea Shipping Ventures in the Gulf of Mexico. .....................................................................................................................53 Table 30. Frequency of Mexican Port-Cited Obstacles to Short Sea Shipping Ventures in the Gulf of Mexico. ...........................................................................................................54

xix
Table 31. Priority Score Ranking of Mexican Port-Cited Obstacles to Short Sea Shipping Ventures in the Gulf of Mexico.............................................................................................54
Table 32. U.S. Port-Suggested Measures to Promote Short Sea Shipping Ventures in the Gulf of Mexico. ...........................................................................................................55 Table 33. Frequency of U.S. Port-Suggested Measures to Promote Short Sea Shipping Ventures in the Gulf of Mexico.............................................................................................56 Table 34. Priority Ranking Score of U.S. Port-Suggested Measures to Promote Short Sea
Shipping Ventures in the Gulf of Mexico. ............................................................................57 Table 35. Mexican Port-Suggested Measures to Promote Short Sea Shipping Ventures in the Gulf of Mexico. ...........................................................................................................57 Table 36. Frequency of Mexican Port-Suggested Measures to Promote Short Sea Shipping
Ventures in the Gulf of Mexico.............................................................................................58 Table 37. Priority Ranking Score of Mexican Port-Suggested Measures to Promote Short Sea Shipping Ventures in the Gulf of Mexico. ............................................................58 Table 38. Factors Contributing to the Success of Cross-Gulf Shipping Ventures. ......................62


xvi
DISCLAIMER The contents of this report reflect the views of the authors, who are responsible for the facts and the accuracy of the information presented herein. This document is disseminated under the sponsorship of the Department of Transportation, University Transportation Centers Program in the interest of information exchange. The U.S. Government assumes no liability for the contents or use thereof.

xvii
ACKNOWLEDGMENTS Support for this research was provided by a grant from the U.S. Department of Transportation, University Transportation Centers Program to the Southwest Region University Transportation Center. The authors express appreciation to the many individuals at the various port authorities and those with experience in Cross-Gulf shipping that took the time to discuss their experiences and observations with us. Special thanks are due to Capt. John G. Peterlin III of the Port of Galveston for sharing his original research and knowledge gained from his previous involvement in Cross-Gulf shipping. The research team also wishes to acknowledge the contributions of the Texas Transportation Institute’s administrative staff that provided editing assistance in the production of this document.

1
CHAPTER 1: SHORT SEA SHIPPING AND REPORT CONTEXT
INTRODUCTION: THE TRADE PICTURE: LANDSIDE CONGESTION AND GRIDLOCK
In North America, regional, national, and trans-national cargo movement has been transformed from a largely maritime enterprise during the first centuries of continental development to a predominantly land-based enterprise with the extensive development of national railroad networks in the nineteenth century and national highway networks in the twentieth century. Freight movement over these networks has expanded through their ability to meet shipper needs of providing reliable, time-sensitive services at costs that the market can bear. There is a growing concern among shippers, cargo carriers, and national transportation agencies that these land-based networks are rapidly approaching and in some cases exceeding the capacities they were designed for. At the same time that the volume of cargo is swelling at Gulf ports, a shortage of truck capacity is developing. Nationwide, approximately 17,000 trucking companies have gone out of business in the last few years.4 The highway system itself is a concern. According to the National Chamber Federation’s “A Study of North American Port and Intermodal Systems,” the highway system that carries 60 percent of domestic freight has experienced a doubling of vehicle miles traveled in the past 20 years while total highway miles have increased one percent. Officials from the U.S. Department of Transportation’s Maritime Administration (MARAD) have stated in multiple presentations that the approximate cost to construct a new mile of highway is $32 million and that it costs $100 million for an interchange. Taken as a whole, this evidence suggests that the United States is not going to be able to afford to build its way out of congestion without some major changes in transportation patterns and practices. With continuing demand and growth of international trade, the resulting gridlock on these networks could paralyze portions of national economies dependent on this trade and have substantial adverse impacts on other sectors as well. The U.S. Chamber of Commerce claims that congestion is already becoming a drag on U.S. competitiveness in the global marketplace. The Chamber warns that if the U.S. intermodal freight transportation system is allowed to fail, it will have severe economic consequences for the nation. As policy makers and stakeholders seek mitigating solutions to the specter of landside freight transport network paralysis, maritime transport has again emerged as a potential solution and outlet for interregional North American trade. One aspect of this maritime transport that is a current topic of discussion at the national level is short sea shipping. This report documents short sea shipping ventures between the United States and Mexico that have been attempted since 1990. While deep-sea shipments “normally consist of cargo moving over open ocean between continents,” short sea shipping operations “normally consist of cargo moving within a single continent over coastal waters.”5 First an overview is 4 “Can short sea measure up?” Journal of Commerce, April 19-25, 2004, p. 30-31. 5 I-95 Corridor Coalition Multi-Client Port Access Project, p. 4-1. (available at http://www.i95coalition.org/ITPG.html).

2
presented of commodity categories, shipping methods, and vessels that are typically found in short sea trade. Next, the U.S. and Mexican Gulf of Mexico Port Systems are discussed, including brief summaries of each port’s markets, volumes, and commodities. The following chapters focus more specifically on shipping ventures, including commodities, trade volumes, duration of operation, and ports-of-call. A brief analysis of “lessons learned” is also presented. U.S.-Mexico Gulf operations are compared with other U.S. ventures that have been attempted. Finally, a discussion of barriers and incentives for short sea operations is presented, along with potential aids to future short sea developments.
CHARACTERISTICS OF SHORT SEA SHIPPING
Cargo Handling Methods
As interest in Short Sea Shipping has grown substantially in recent years; so, too, has the availability of recent literature on the topic. The literature discusses, particularly in context of ventures and national programs in various regions of the U.S. (other than the Gulf Coast) and Europe, definitions of commodity handling, vessel characteristics, and existing policies and programs that are of influence. Some literature focuses specifically on short sea shipping; other literature focuses on short sea shipping as part of a larger context of freight movement in general. One such report is the I-95 Corridor Coalition Multi-Client Port Access Project (which is available at http://www.i95coalition.org/ITPG.html). MARAD appears to define short sea shipping in such broad contexts that it includes navigable inland waterways, while others consider it to include trans-continental shipping via the Panama Canal.6 The I-95 Corridor Coalition report discusses cargo handling in short sea shipping operations, adapted as follows:
Short sea shipping operations typically handle several types of cargos: • Bulk/breakbulk – bulk or breakbulk shipments include commodities such
as coal, grain, lumber, steel, or petroleum. These types of commodities are well suited to shipment by barge, as they are high-weight and low-value goods and are typically not time-sensitive.
• Roll-On/Roll-Off (Ro/Ro) cargo – normally consists of rolling cargo, such as automobiles, trailers, or other chassis-mounted cargo. These types of shipments are well suited to short sea movements, as they do not need cranes for loading or unloading, and hence can be loaded and unloaded at congested or less-developed ports with little or no shore-side infrastructure.
• Specialized cargo – that which is too heavy or cumbersome to be transported by truck or rail. [Author’s note: Specialized cargo is sometimes referred to as Project cargo.] Examples of such cargo include large electrical generation equipment, cranes, assembled drilling platforms, or other oversize/overweight cargo.
6 Tirschwell, Peter. “Defining the term short sea.” Journal of Commerce. November 24, 2003.

3
The I-95 Corridor Coalition report also includes containerized cargo and empty container repositioning as commodity categories. Ocean and domestic shipping containers are sometimes categorized with wheeled chassis in the use of the term “intermodal.” It is to a more narrow definition that the Journal of Commerce defines short sea shipping intermodal cargo:
• Intermodal cargo – “the concept of a waterborne intermodal system – an over-the-water version of the existing intermodal rail system that allows truck trailers, ocean containers, and domestic intermodal containers to be taken off of the road for the long-haul segment of their move.”7
Another cargo category not particularly defined in the I-95 Corridor Coalition report is General Cargo.
• General cargo – cargo “consisting of goods shipped unpacked or packed, for example, in cartons, crates, bags or bales, but specifically not cargo shipped in bulk, on trailers, or in shipping containers.”8
Our approach is to examine U.S.-Mexico maritime trade that is exclusively focused on Gulf of Mexico regional shipping. In this context, all cargo modes, distances, volumes, etc. are considered so long as they are exclusively focused on the U.S.-Mexico Gulf region. Thus, we do not consider operations that route through Gulf of Mexico ports as an extension of their ports-of-call en-route to the U.S. East Coast, South American Coasts or the Caribbean, or other hemispheres. Neither is vessel traffic considered that is exclusively passenger or cruise transport, although cargo operations and passenger transport are not infrequently mixed in these operations, and are thus considered in our study.
Commodities
Table 1 shows a list of commodities handled at Gulf of Mexico ports, compiled from information provided by the ports regarding their cargo operations. As shown in the table, a large number of commodities are handled at these ports in all cargo type categories. Product listing is in no particular order of significance or importance.
7 Tirschwell, Peter. “Defining the term short sea.” Journal of Commerce. November 24, 2003. 8 Brodie, Peter R. Illustrated Dictionary of Cargo Handling. Lloyd’s of London Press, Ltd., 1991. p. 68.

4
Table 1. Commodities Handled at Gulf of Mexico Ports. Ro/Ro Cargo:
• Containers (on chassis) • Trailers • Machinery and equipment • Automobiles • Heavy equipment • Rail cars and equipment
Specialized (Project) Cargo:
• Machinery and equipment • Metal structures • Heavy equipment • Oil field supplies and
equipment • Pressure vessels (reactors) • Rail cars and equipment
Bulk Cargo: • Petroleum / chemicals o General chemicals and
petrochemicals o Carbon coke and coal o Fertilizer o Synthetic resins o Polyethylene o Ethylene glycol o Crude, diesel and
gasoline o Liquid propane o Dimethylterephthalate o Terephthalic acid o Urea
• Agricultural and food products
o Sugar, honey, molasses o Orange juice and citrus
pellets o Coffee o Soybeans o Vegetable oil o Grains
• Corn • Bulk wheat • Bulk white corn • Bulk sorghum • Rice
o Beer o Potable water
• Bulk minerals o Iron ore and scrap o Fluorite, limonite,
limonite, rutile o Zinc concentrate o Sodium sulfate o Bulk alumina o Sulfur and salt o Phosphate and lime o Sodium, potassium,
selenium • Clay, limestone,
aggregates, silica • Cement and concrete • Barite/drilling mud • Wood Products o Woodchips o Pulp wood
Breakbulk and General Cargo:
• Metallurgical o Steel (in various
forms) o Sheet steel o Steel pipe o Metals o Steel ingots o Structural steel o Aluminum o Copper
• Agricultural and food products
o Bagged sugar o Bagged rice o Fruits
• Bananas • Pineapples • Fresh fruits
o Bagged grains o Bagged corn o Cotton o Cotton bales o Powdered milk o Meats
• Poultry • Frozen poultry • Other meats
• Gypsum sheetrock panels
• Autoparts • Paper • Tiles • Henequen products • Wood products o Lumber o Plywood o Mahogany
• Stone products o Aggregate o Sand, rock, stone o Granite o Limestone
• Rubber
Containerized Cargo: • Chemicals and petrochemicals • Machinery and equipment • Automobiles and autoparts • Electrical appliances • Fruits and vegetables • Grains • Furs • Gypsum sheetrock panels • Perishables • Paper • Beer • Honey • Tiles • Autoparts • Perishable food products • Powdered milk • Products manufactured from
henequen • Textiles from maquiladoras • Honey and perishables • Wood and stone for
construction • Explosives • Twine

5
Vessel Types
Vessel usage in maritime transport is driven by a number of factors, among these availability, cargo volumes, shipping frequency and schedule, port infrastructure, and navigability (maximum drafts and sea conditions). Given cargo demands and logistics considerations, the vessels used in shorter-distance regional short sea shipping operations are generally smaller than those used in trans-oceanic trades where high-volume economics drive vessel utilization. Other considerations are the markets and services provided by short sea shippers. Some operations focus exclusively on niche markets, for example transport of certain types of containerized traffic (refrigerated or food-aid) or petrochemical transport. Other operations function more as general cargo or “tramp” type services, adapting vessel usage, schedules, and operations according to available business and shipper needs. The I-95 Corridor Coalition report also discusses vessel types typically used in short sea shipping operations, adapted as follows:
There are several different types of vessels involved in short sea shipping operations, including pull barges, push barges, Load-On/Load-Off (Lo/Lo) ships, Roll-On/Roll-Off (Ro/Ro) ships, and high-speed vessels.
• Pull Barges – have a capacity of between 400 and 700 20-foot equivalent units (TEUs) and are capable of handling between 150 and 270 53-foot domestic containers. Containers … are secured on deck and stacked three or four high. These barges also handle bulk and breakbulk cargo. Barges are typically pulled by 5,000 horsepower tugs at a speed of approximately 10 knots (11.5 miles per hour). Pull barges are common in U.S. short sea shipping operations due, in part, to federal regulations governing domestic maritime trade.
• Push Barges – are similar to pull barges with the exception that there is a cut-out in the stern of the barge for a tug. The tug and the push barge are lashed together to act as a single vessel, allowing for greater speed and efficiency as compared to traditional pull barges.
• Load-On/Load-Off (Lo/Lo) Vessels – are used to transport containers in short sea operations. They are self-propelled vessels similar in design to large, ocean-going container ships, but are much smaller, with capacity between 100 and 1,000 TEUs. Some Lo/Lo vessels include deck-mounted cranes, which while they reduce capacity, allow easy loading and unloading of containers at ports without adequate shore-side cranes.
• Roll-On/Roll-Off (Ro/Ro) Vessels – are used in short sea shipping of rolling cargo, as the need for cargo handling systems and personnel is reduced, lowering port costs and allowing Ro/Ro vessels to call on smaller and less-developed ports. These vessels carry trailers, chassis-mounted containers, cars, and other rolling machinery, and sometimes use a “drive-through” system with access both forward and aft, speeding the loading and unloading process. The capacity of Ro/Ro vessels is typically half that of a

6
Lo/Lo vessel of similar size, as cargo cannot be stacked (due to wheels) and significant space is needed for on-load and off-load ramps. The reduced capacity of Ro/Ro ships is at least partially offset by the reduced cargo handling and port costs accrued by these vessels.
The I-95 Coalition Corridor report also discusses high-speed vessels that are “capable of attaining speeds of 28 knots (32 mph) or greater,” noting that these types of ships “have not yet been deployed in the U.S.” (p. 4-6). Other vessel types not defined in the I-95 Corridor Coalition report but typically encountered in short sea trade in the Gulf of Mexico include tankers and general cargo ships:
• Tankers – are “ships designed for the carriage of liquid in bulk, her cargo space consisting of several, or indeed many, tanks. Tankers carry a wide variety of products including crude oil, refined products, liquid gas, and wine. Size and capacity range from the ultra large crude carrier (ULCC.) of over half a million tons to the small coastal tanker of a few hundred tons. Tankers load their cargo by gravity from the shore or by shore pumps and discharge using their own pumps.”9
• General Cargo Ships – are ships designed to carry general cargo, “often having several decks because of the number of ports served and the range of products carried.”10
THE LANDSIDE TRADE PICTURE
Traffic flows between the U.S. Gulf States and Mexico are divided among the four main transportation modes: Marine, Air, Rail, and Highway. This section focuses on surface trade that includes rail and highway traffic. All figures are reflective of value and not tonnage. The five Gulf States of Texas, Louisiana, Mississippi, Alabama, and Florida combined make up over 33 percent of the total U.S.-Mexico surface trade with Mexico (all land modes), according to the U.S. Bureau of Transportation Statistics. Table 2 shows individual states’ respective surface trade values as compared to the total U.S.-Mexico surface trade for year 2002.
Table 2. Surface Trade Breakdown.11 State Surface Trade ($ Million) Trade (% of Total U.S.-MX)
Texas $62,530 31.34%Louisiana 484 0.24%Mississippi 325 0.16%Alabama 1,180 0.59%Florida 2,253 1.13%Total U.S.-MX Trade $199,538 33.46%
9 Brodie, Peter R. Illustrated Dictionary of Cargo Handling. Lloyd’s of London Press, Ltd., 1991. p. 152. 10 Ibid, p. 68. 11 Bureau of Transportation Statistics, Transborder Surface Freight Data, “BTS: Texas-Mexico Trade by All Surface Modes and All Commodities, 2002,” www.bts.gov/ntda/tbscd/reports.html.

7
Table 3 illustrates where this trade moves across the border into Mexico. A high percentage of this trade is concentrated at just a few border crossings.
Table 3. Trade Movement into Mexico. Top 10 U.S. Land Ports by Value of U.S.-Mexico
Surface Trade: 2001(Value in millions of current U.S. dollars)12
Rank in 2001 U.S. Port
All Surface Modes
Truck Rail
U.S.-Mexico Trade 200,797 160,600 32,446 1 Laredo, TX 79,607 55,298 24,179 2 El Paso, TX 37,931 34,697 1,575 3 Otay Mesa, CA 19,401 19,385 0 4 Nogales, AZ 12,509 9,964 2,543 5 Hidalgo, TX 12,423 12,211 0 6 Brownsville-Cameron, TX 10,911 10,139 735 7 Calexico East, CA 7,348 7,207 140 8 Eagle Pass, TX 6,739 3,599 3,129 9 Del Rio, TX 2,375 2,375 0 10 San Luis, AZ 1,007 994 0
Top 10 as % of total 94.7 97.1 99.6 According to the Latin America Trade & Transportation Study (LATTS) conducted by Wilbur Smith Associates, Mexico is the largest Latin American trading partner for the 13 southeastern U.S. states included in the study. Over 86 percent of Mexico’s imports come from the United States. Most of the trade with Mexico is cross-border traffic by rail and truck. Over ¾ of this cross-border trade crosses the border in Texas.
Texas
Texas–Mexico trade represents over 31 percent of all U.S.-Mexico trade (all land modes). Six of the top 10 U.S.-Mexico border crossings are in Texas and Laredo is 53 percent of the total surface trade for these six crossings—75 percent of the rail crossings. Laredo alone clears an average of 5,300 trucks and 1,200 railcars daily. Texas has more trade with Mexico (by value), than any other state in the U.S. The top five trade commodities accounted for over 67 percent of all Texas to Mexico surface trade. The top five trade commodities, with respective values in millions of dollars following, are electrical machinery and equipment ($20,872); nuclear reactors, boilers, machinery and mechanical appliances ($9,415); vehicles other than railway ($6,521); plastics ($3,350); and optical, photographic, cinematographic, measuring, checking, precision, medical, or surgical instruments ($2,159).
12 Bureau of Transportation Statistics, Transborder Surface Freight Data as of January 2002, //www.bts.gov/publications/us_international_trade_and_freight_transportation_trends/2003/pdf/entire.pdf

8
Louisiana
Louisiana-Mexico trade was valued at $484 million. Louisiana’s top five trade commodities make up over 60 percent of the total Louisiana to Mexico surface trade. These commodities (in millions of dollars) were plastics ($111); nuclear reactors, boilers, machinery, and mechanical appliances ($70); miscellaneous chemical products ($47); mineral fuels, mineral oils, and products for their distillation ($39); and paper and paperboard, articles of paper pulp ($26).
Mississippi
Mississippi-Mexico trade was valued at $325 million. Mississippi’s top trade five commodities make up over 65 percent of the total Mississippi to Mexico surface trade. These commodities (in millions of dollars) were nuclear reactors, boilers, machinery, and mechanical appliances ($84); electrical machinery and equipment ($57); tanning or dyeing extracts ($26); articles of apparel and clothing accessories, knitted ($23); and cotton (22).
Alabama
Alabama-Mexico trade was valued at $1,180 million. Alabama’s top five trade commodities make up over 66 percent of the total Alabama to Mexico surface trade. These commodities (in millions of dollars) were electrical machinery and equipment ($433); articles of apparel and clothing accessories, knitted ($92); articles of apparel and clothing accessories, not knitted ($90); aluminum and articles thereof ($85); and vehicles other than railway ($81).
Florida
Florida-Mexico trade was valued at $2,253 million. Florida’s top five trade commodities make up over 69 percent of the total Florida to Mexico surface trade. These commodities (in millions of dollars) were electrical machinery and equipment ($821); nuclear reactors, boilers, machinery and mechanical appliances ($248); vehicles other than railway ($229); optical, photographic, cinematographic, measuring, checking, precision, medical or surgical instruments ($165), and articles of apparel and clothing accessories, not knitted ($90).
Trends and Projections
The current surface trade volume between the five Gulf states and Mexico is expected to steadily increase based on certain economic indicators. As trade barriers between the United States, Mexico, and other Latin American countries are lowered, the flow of traffic could increase substantially. Should traffic flows continue to increase at the same rate, demand will most likely exceed capacity. There are four possibilities that must be considered when accounting for and projecting current and future traffic flows. These possibilities are:
5. Traffic flow will remain essentially constant.

9
6. Traffic flow will increase. 7. Traffic flow will increase at a rate that far exceeds current trends. 8. Traffic flow will decrease.
To date, traffic flow has increased at a rate that exceeds projections made in the LATTS study and has only strengthened the need for addressing alternatives to cross-border surface traffic. Trade forecasts from LATTS predicted that trade would increase by 300 percent by the year 2020 from 1996 levels.13 As shown in Figure 1, trade values for U.S.-Mexico truck and rail cargo increased by approximately 100 percent each for the 1996-2003 period. As shown, trade levels stabilized somewhat in the 2001-2003 time period from the 1996-2001 time period. Whether this is a result of temporary economic downturn, loss of market to other trade corridors, or capacity constraints is a topic of further research.
Figure 1. Total Monthly U.S. Merchandise Trade with Mexico by Truck and Rail Modes.
(Source: Bureau of Transportation Statistics White House Economic Statistics Briefing Room, Fourth Quarter, 2003).
Should U.S.-Mexico trade revert to a rate of increase similar to pre-2001 rates, increasing trade will pose a serious problem for surface transportation given the existing infrastructure. The longer term trends in trade and cross-border traffic are expected to continue, if not exceed, their projected rates if Mexico continues its efforts to promote market reforms. Its increased trade with the United States has led to cyclical behavior that is very much like that of the United States. Of course, it should be noted that if Mexico does alter its economic and trade policies, 13 LATTS, Power Point Presentation, www.wilbursmith.com

10
these trends may change abruptly. However, Mexico has made it very clear that it intends to continue its efforts to promote a free market economy. Considering the percentage of highway traffic that utilizes the five Gulf states (as discussed in the following section), and factoring in the forecasted increase in traffic congestion due to existing and projected miles of deficient capacity, evidence indicates that current supply will not meet projected future demand, when taking into consideration maintenance and construction of surface transportation infrastructure needed to meet projected future demand. Analyzing LATTS data on a state level indicates Texas and the other four Gulf states will see significant increases in the amount of surface transportation tied to Latin American trade. The following is a state-by-state analysis of the five Gulf states and the projected traffic flows.
Texas
The percentage of LATTS trucks (trucks moving merchandise involved in Latin American trade) to total trucks is expected to grow from 15 percent (1997) to 27.5 percent (2020). LATTS truck traffic is expected to increase five fold between 1997 and 2020. Additionally, rail tonnage is forecasted to increase over 500 percent by 2020 (11 million to 56 million tons) from 1997 levels. These trend projections are important because of the amount of surface traffic that Texas represents of the total U.S.-Mexico and U.S.-Latin America trade.
Louisiana
The percentage of LATTS trucks to total trucks is expected to grow from 12 percent (1997) to 28 percent (2020). LATTS truck traffic is expected to increase approximately 460 percent between 1997 and 2020. Additionally, rail tonnage is forecasted to increase 366 percent by 2020 (0.83 million to 3 million tons) from 1997 levels.
Mississippi
The percentage of LATTS trucks to total trucks is expected to grow from 9 percent (1997) to 21 percent (2020). LATTS truck traffic is expected to increase approximately 450 percent between 1997 and 2020. Additionally, rail tonnage is forecasted to increase 380 percent by 2020 (0.36 million to 1.39 million tons) from 1997 levels.
Alabama
The percentage of LATTS trucks to total trucks is expected to grow from 7 percent (1997) to 14 percent (2020). LATTS truck traffic is expected to increase approximately 460 percent between 1997 and 2020. Additionally, rail tonnage is forecasted to increase 440 percent by 2020 (0.63 million to 2.83 million tons) from 1997 levels.

11
Florida
The percentage of LATTS trucks to total trucks is expected to grow from 8 percent (1997) to 21 percent (2020). LATTS truck traffic is expected to increase approximately 490 percent between 1997 and 2020. Additionally, there is a forecasted rail tonnage is forecasted to increase 290 percent by 2020 (2.45 million to 7.35 million tons) from 1997 levels.
OVERVIEW OF U.S. GULF PORT SYSTEM
The United States portion of the Gulf of Mexico supports a well-developed port system comprised of ports and terminals with a wide range of capabilities. These facilities range anywhere from small shallow-draft ports to some of the nation’s largest port complexes. Thirty-one of these ports have joined together to promote the port industry and share best management practices under the auspices of the Gulf Ports Association of the Americas. Geographically, they cover an area from Brownsville, Texas, to Tampa Bay, Florida. The Association also has a Mexican component stretching from Altamira to Progreso with which these ports interact. Most of these ports are autonomous local governmental entities, one (Galveston) is a municipal utility, and two (Gulfport and Mobile) are state port authorities. Gulf ports contribute over $110 billion annually to the U.S. economy and provide almost one million jobs directly related to port activity.14 Gulf ports handle the vast majority of bulk cargo that is imported into and exported out of the United States, most of which is crude and petrochemical related. They occupy 13 spots among the top 25 ports in the country for foreign cargo volume (six are in the top 10). Over one billion tons of cargo moved through the Gulf ports in 2003. Based on volumes reported for 2003, Houston handles roughly ⅔ of all container traffic in the Gulf. New Orleans handles about 14 percent and Gulfport is third, handling approximately 11 percent of the Gulf’s containerized trade.15 Finally, Gulf ports play a significant role in national defense efforts. Two Gulf ports—Beaumont and Corpus Christi—collectively handled ⅓ of the military cargo shipped in support of Operation Enduring Freedom/Iraqi Freedom. The U.S. Navy has ships homeported in Pascagoula, Mississippi, and Corpus Christi, Texas. The Port of New Orleans serves as a homeport to MARAD and Military Traffic Management Command vessels. The Port of Houston is home to five Ready-Reserve vessels. Several Gulf ports are also home to major shipbuilding sectors of national defense contractors. The ports included in this study were selected because they have either hosted cross-Gulf services in the past, have attempted to, or currently do so. They are all deepwater ports with the exception of Port Bienville, Mississippi. This section discusses the history, facilities, operations, and cargo handled at the ports. It is important to keep in mind that tonnage figures reported for 14 http://www.gulfportsaa.com/gpaa_who_we_are.htm 15 Source: American Association of Port Authorities, http://www.aapa-ports.org/industryinfo/statistics.htm

12
these ports do not necessarily reflect tonnages moved through the port-owned facility. In most cases they represent a port complex as defined by the Army Corps of Engineers. For example, tonnages reported for the Port of Houston reflect tonnages handled at both publicly owned and privately-owned facilities along the length of the Ship Channel.
OVERVIEW OF MEXICAN PORT SYSTEM
Mexico is supported by a large port system composed of 108 ports and terminals distributed along the 11,500 km (7,100 miles) coastline of the country. These facilities are split roughly half and half between the Pacific Coast and the Mexican Gulf and Caribbean Coast. There are 39 ports dedicated to commercial activities, a similar number are fishing ports; 22 ports are specialized in tourism, and eight are specialized in oil traffic. The core of the traffic is, however, extremely concentrated. Most traffic goes through 27 commercial, industrial, and tourist ports and 10 terminals specialized in oil and mineral ore traffic. If oil is excluded, roughly half of the cargo volume is handled by five ports: Veracruz, Tampico, and Altamira on the Gulf of Mexico; and Manzanillo and Lázaro Cárdenas on the Pacific side.16 Manzanillo and Veracruz move about 75 percent of the country’s container traffic, measured in TEUs (Twenty Feet Equivalent Units).17 These two ports have the more modern container terminals of the country, and therefore their productivity and efficiency are expected to be higher than that of other ports.
Restructuring and Privatization
In 1995, Mexico reorganized each seaport under an individual Integrated Port Authority (API), to be run like a corporate board. Up to 100 percent foreign investment is permitted in terminal ownership and operations (i.e., stevedoring), and up to 49 percent investment in each seaport’s API. Modernization and reform of Mexican ports actually started in 1993 when the new Ports Law was enacted. This law allowed private firms to enter the port industry as operators. The federal government also dismantled the public agency Puertos Mexicanos, which up until 1993 was responsible for the ports network and was the only agency in the country authorized to build port infrastructure and to provide port services.
The reform rested on three key instruments: decentralization, privatization, and introduction of competition in the port system. Decentralization was accomplished by creating independent Port Administrations (Administraciones Portuarias Integrales, APIs) at each port or group of small ports, which are publicly owned companies to which the administration of ports was directly granted. This process began in February 1994, when the APIs were created and assumed the functions of planning, building infrastructure, and promoting the port. The board of the APIs
16 A. Estache, M. González, and L. Trujillo, Technical Efficiency Gains from Port Reform: The Potential for
Yardstick Competition in Mexico, World Bank Institute, Washington, DC, 2001. 17 Source: Secretaría de Comunicaciones y Transportes, as reported on web site of American Association of Port
Authorities, http://www.aapa-ports.org/pdf/MEXICO.PDF, April 14, 2004.

13
must include representatives from the states, municipalities, and the private sector. The APIs were granted the rights over the port assets, and authorized to grant concessions for those same assets to private firms, but in no case will such assets be permanently transferred to the private sector. APIs pay compensation to the federal government for the use of publicly owned assets. They generally operate as landlords. The federal government, through the Secretaría de Comunicaciones y Transportes (SCT), maintains the role of port authority, and SCT grants all concessions and licenses. Additionally, SCT acts as regulator in those cases where competition is absent or it is not strong enough, by determining maximum tariffs to be charged to users. Matters of safety are handled by the navigation authority (Capitanía de Puertos), which is an agency independent from SCT.
Privatization has been introduced through auctions for concession contracts between APIs and private firms to provide port services. For simple services, such as towage and pilotage, only a license is required, which can be obtained by any interested party sufficiently qualified. The last phase considered for the process of ports’ reform is the transfer of APIs to the private sector, by selling their shares to investors. This has not been very successful so far. There are no established dates or conditions for privatizing the APIs of the main ports of the country. There is currently only one private API (Acapulco), and two ports are in the process of privatization (Topolobambo and Guaymas). This lack of private interest in the operation of APIs contrasts with the strong penetration of the private sector in port services. Liberalization and competition resulted from some restrictions in the auctions for concessions, liberalization of tariffs, and elimination of cross-subsidies and barriers to entry. First, all requests by private firms to participate in public auctions to obtain concessions over port assets were evaluated by the competition agency, the Federal Commission for Competition (CFC), to avoid risks of excessive market power after privatization. In practice, this obligation did not impose a relevant restriction over the outcomes, since most applicants were authorized to participate without reservations. However, an important ruling was the initial restriction for firms not to win more than one concession on each coast (Pacific, Atlantic). This geographical restriction was later modified, and now the only restriction is that a firm must not gain a dominating position in the relevant market (this was applied, for example, for the tourist cruise markets). Second, port tariffs have been generally liberalized. Regulation is only used in those cases where it is considered that there is not enough competition between operators. The Ports Law establishes that CFC is to examine these questions and to determine when tariff regulation is or is not required. In addition, with respect to the labor market, the reform transformed collective bargaining into firm-level bargaining, thus allowing firms to negotiate with their workers according to local and business conditions. As a result, the number of port workers employed by the public sector has been reduced, but total port employment by private firms is rising, due to an increase in the activity of ports.


15
CHAPTER 2: U.S. AND MEXICAN PORTS INVOLVED IN THE STUDY
U.S. PORTS
PORT: BIENVILLE
Overview of Port
Port Bienville, established in 1963, is situated on the Gulf of Mexico in the southwest corner of the state of Mississippi. There are 18 industrial tenants in the Port’s industrial park employing over 1,200 individuals. Foreign Trade Zone (FTZ) No. 92 is located on 621 acres at the Port. The Port handles commodities “including twine, pulpwood, coal, general cargo, ferric sulfate, pressure vessels (reactors), lumber, structured steel, USDA food products, and explosives.”18 The Port is connected to the Mississippi Sound and the Intracoastal Waterway via a 12-foot channel.
Table 4. Bienville Port Information. Type
Shallow draft industrial port Tonnage
2002 Exports 22,000 TEUs Imports 19,000 TEUs
Total 41,000 TEUs 2003
Not Available Commodities
• Finished goods (Textiles)
• Oil field equipment & supplies
• Ethylene Glycol • Twine • Pulpwood • Coal
• General cargo • Ferric sulfate • Pressure vessels
(reactors) • Lumber • Structural steel • USDA food products • Explosives
Cross-Gulf Services Calling at the Port Línea Peninsular (active)
18 Economic Development Locations in the County, http://www.portandharbor.com/loc_pbip3.html

16
PORT: FREEPORT
Overview of Port
Established in 1925, Port Freeport is located just three miles from deep water offering transportation via highway, railroad, or intracoastal waterway, and a 400 ft-wide, 45 ft-deep channel. In addition to access, Port Freeport also possesses an abundance of available land. The Port’s land and operations currently include 186 acres of developed land and 7,723 acres of undeveloped land, five operating berths, a 45 ft-deep Freeport Harbor Channel and a 70 ft- deep sink hole. Future expansion plans include construction of a 1,300-acre multimodal facility, cruise terminal, and container terminal. Port Freeport is conveniently accessible by rail, waterway, and highway routes. There is direct access to the Gulf Intracoastal Waterway, Brazos River Diversion Channel, SH 36, and SH 288; rail service is provided by the Union Pacific Railroad. Port Freeport is a staging site for semi-submersible and tension-leg offshore platforms, and has a deep berthing area spanning 630 ft by 170 ft that was dredged to a depth of 70 ft for this purpose. Additionally, the Port maintains both covered and uncovered storage areas for use while marshalling cargo, container storage space, and parcels of land for specialized container operations. The Port’s proximity to Houston has also positioned Port Freeport for offshore drilling and production-related maritime activity. The Port is in the early stages of implementing a recently adopted master plan that will include a new multimodal terminal (the Green Fruit Terminal), as well as container and cruise terminals.
Table 5. Freeport Port Information. Type
Deep sea industrial port, with no cruise activity Tonnage
2002 Exports 2,306,134 st Imports 19,778106 st Domestic 5,079,632 st
Total 27,163,872 st Containers 74,484 TEUs
2003 Tonnage Figures Not Available Containers 67,784 TEUs
Commodities • Bananas • Fresh Fruit • Aggregate
• Rice • Chemicals (Resin, etc.) • Crude Oil
Cross-Gulf Services Calling at the Port American Eagle Tankers (active)

17
PORT: GALVESTON
Overview of Port
The Port of Galveston, started as a trading post in 1825, is located on the upper Texas coast at the mouth of Galveston Bay, just 30 minutes steaming time from the Gulf of Mexico. It is now the “27th Largest Throughput Port in the United States”19
The Port has facilities to handle all types of cargo including containers, dry and liquid bulk, breakbulk, Ro/Ro, refrigerated and project cargoes and cruise passengers. The Port has grown to over 850 acres of port facilities today.
In 1997, the Port entered into a 20-year lease to the Port of Houston for its Pier 10 container terminal at the east end of the port. The Port of Houston uses this facility for overflow containerized cargo from Houston’s Barbours Cut terminal. The volume of cargo handled at this terminal has not had a significant effect on the level of activity in Galveston. In December 2001, a long-discussed and hotly debated proposed merger with the Port of Houston was submitted to the voters of the City of Galveston and failed to achieve passage.20
Table 6. Galveston Port Information. Type
Deep sea industrial port, with ferry and cruise traffic Tonnage
2002 Exports 4,032,952 st Imports 1,215,501 st Domestic 3,887,370 st
Total 9,135,823 st Containers 42,780 TEUs Passengers 271,000
2003 Tonnage Figures Not Available
Containers 9,911 TEUs Passengers 377,00021
Commodities • Bulk Sugar • Containers • Bananas • Agricultural Equipment • Machinery
• Vehicles • Bulk Grain • Containers • Carbon Black • Light Fuels
Cross-Gulf Services Calling at the Port Burlington Northern/Protexa (inactive) ITT (International Trade and Transport Ltd.) (inactive)
19“Port Regionalization Galveston – Houston Port Regionalization”
http://gulliver.trb.org/conferences/2001SummerPorts/Session3Moore.pdf 20 Bonney, Joseph, “Galveston port seeks proposals,” Journal of Commerce, July 17, 2003. 21 Cruise Passenger Statistics, http://www.marad.dot.gov/Marad_Statistics/PRESS%20RELEASE%20-
%20Statistics/Top%2020%20Departure%20Ports-03.htm

18
PORT: GULFPORT
Overview of Port
The Port of Gulfport, established in 1902, is a 184-acre complex of public facilities located directly on the Gulf of Mexico, approximately 12 miles from sea buoys. Access to the Port is provided by a 12-mile shipping channel, which extends from vessel anchorage just south of Ship Island. The channel is approximately 250 ft wide and is maintained to a depth of 36 ft. The Port harbor and turning basin are approximately 1,320 ft wide. The South Basin is maintained to a depth of 36 ft, and the North Basin is maintained to a depth of 32 ft. At the national scale, Gulfport is a small port averaging approximately two million tons of cargo annually. The Port consists of 11 berths, ranging from 525 ft to 750 ft in length and from 32 ft to 36 ft in depth. These include two container berths, two breakbulk frozen cargo berths, one breakbulk refrigerated cargo berth, one bulk cargo berth, and five general cargo berths suitable for breakbulk, neo-bulk, project cargo, and ship’s-gear supported container operations. The Port is a major Port of Entry for bananas and other tropical fruits for the operations of Dole Fresh Fruit, Chiquita Brands, and Turbana Corporation. Additionally, the Port is a major Port of Export for frozen poultry to Russia from Tyson Foods and American Poultry International via the Port’s 93,000 sq ft freezer facility leased to I.T.O. Corporation. The Port also specializes in the receiving and blending of ilmenite ore which is imported from Australia and railed 12 miles inland from the Port to the DuPont titanium plant at DeLisle, MS. The current physical Port consists of:
• 184 acres • 5,800 ft of berthing space • 510,000 sq ft of covered storage • 16.9 acres of open container storage • A 55,000 sq ft chiller • A 93,000 sq ft dockside freezer facility • A commercial small-craft harbor • The Grand Casino and the COPA Casino

19
Table 7. Gulfport Port Information. Type
Deep sea industrial port and cruise terminal Tonnage
2002 Exports 901,812 st Imports 1,255,667 st Domestic 132,974 st
Total 2,290,453 st Containers 154,486 TEUs Passengers N/A
2003 Tonnage Figures Not Available Containers 199,897 TEUs Cruises 17 Passengers 58,00022
Commodities • Bulk agricultural commodities • Products manufactured from
henequen • Textiles from maquiladoras • Honey and perishables • Wood & stone for construction • Bananas • Ilmenite ore • Mahogany • Pineapples • Containerized cargo • Frozen poultry • Chemicals & products • Forest products
• Pulp & waste products • Sand, rock & stones • Iron ore & scrap • Non-ferrous ore & scrap • Sulfur, clay & salt • Paper products • Iron & steel products • Non-ferrous products • Wood products • Grain • Processed grain & feed • Meat – frozen & fresh • Machinery & equipment • Other agricultural products
Cross-Gulf Services Calling at the Port Cargo Transport Lines (inactive) Mexican Gulf Line (inactive)
PORT: HOUSTON
Overview of Port
As the largest city on the Gulf Coast and one of the largest cities in the U.S., Houston is by far the largest “load center” port for scheduled services from the Gulf Coast. The Port of Houston services more than 100 steamship lines that offer service between Houston and 200 ports around the world. It is also home to a $15 billion petrochemical complex, the largest in the nation and second largest worldwide. Houston offers a variety of container, breakbulk, and heavy-lift/project cargo services. There are extensive services available to Northern Europe, the 22 Cruise Passenger Statistics, http://www.marad.dot.gov/Marad_Statistics/PRESS%20RELEASE%20-
%20Statistics/Top%2020%20Departure%20Ports-03.htm

20
Mediterranean, South America, Central America, Mexico, the Middle East, Indian subcontinent, and Africa. Although Houston’s location keeps it out of the transpacific trades for the most part,23 most major transpacific carriers maintain offices in Houston and supervise intermodal rail moves from Houston to Southern California, where Houston-area shippers connect with carriers serving the Asian trades. The Port of Houston, established in 1927, is a 25-mile long complex of public and private facilities along the Houston Ship Channel, approximately 40 miles from the Gulf of Mexico. From Bolivar Roads at Galveston Bay, the Houston Ship Channel extends 46 miles inland to the deep-water Houston Turning Basin. Within the port complex, the Ship Channel is approximately 400 ft wide and is maintained to a depth of 40 ft. Much of the channel is now being dredged to a project depth of 45 ft and widened to 530 ft.24 The Port is ranked first in the United States in foreign waterborne commerce, second in total tonnage, and sixth in the world. The Port of Houston is made up of the Port Authority and the more than 150 private industrial companies along the ship channel. Approximately 175 million tons of cargo moved through the Port of Houston in 2002, with a total of 6,414 vessel calls in that year. The Port of Houston complex has over 200 piers and wharves, from the Turning Basin to Morgans Point, near Baytown, where the Ship Channel enters Galveston Bay. Approximately 60 of these piers handle general cargo. The remaining piers are specialized wharves and belong to the complex of refineries, chemical plants, steel mills, and other industries that line the channel. Foreign Trade Zone No. 84, in Harris County, has 1,500 acres of open land and warehouse space. At Bayport, a bulk liquid cargo terminal is capable of handling four ocean-going tankers and five barges at once, with a storage capacity of 400,000 barrels. Additionally, the Bayport Container and Cruise Terminal has been permitted and construction of Phase I has begun.25 Completion of the first phase of Bayport – including 1,660 ft of the ultimate 7,000-ft wharf and approximately 65 acres of the ultimate 1,043-acre facility – is targeted for mid-2006. The Barbours Cut Terminal, located at the Morgans Point facility, includes Ro/Ro facilities and six major container wharves, and containers are also handled in the Turning Basin area. The Port of Houston Authority (PHA) also manages a container terminal (East End Container Terminal) that it leases at the nearby Port of Galveston—a 45-acre facility with two berths. The Port owns and operates a grain elevator with a capacity of six million bushels. Tanker facilities for handling bulk liquid commodities are located at various refineries and manufacturing facilities along the Houston Ship Channel. Storage for up to 10,000,000 barrels of crude oil and liquid products is available. There are also six liquefied gas terminals within the Port of Houston complex. In 2003, Houston diversified its cargo even more by being designated to store exchange coffee on the New York Board of Trade’s Coffee Sugar & Cocoas Exchange.
23 With the recent West Coast labor strife, this situation is beginning to change, but it is too early to predict the
magnitude of the change. 24 Coastal Update, The Bayport FEIS, www.guidrynews.com/03Forum/13803Blackburn.htmU.S. Army Corps of
Engineers, Houston-Galveston Navigation Channel Project, http://www.swg.usace.army.mil/items/hgnc/#FACT 25 Port Authority Signs Bayport Permit, http://www.irconnect.com/poha/pages/news_releases.html?d=50476

21
Table 8. Houston Port Information. Type
Deep sea industrial port, some cruise traffic (growing) Tonnage
2002 Exports 35,161,162 st Imports 80,026,921 st Domestic 62,372,636 st
Total 177,560,719 st Containers 1,147,489 TEUs
2003 Tonnage Figures Not Available Containers 1,243,706 TEUs
Commodities • Petroleum products • Steel • Organic chemicals • Crude oil • Grain • Cement • Lime • Concrete • Minerals
• Ores • Rail equipment • Iron • Copper • Potassium • Selenium • Sodium • Rice • Clay
Cross-Gulf Services Calling at the Port American Eagle Tankers (active) Industrial Maritime Carriers (Intermarine) (inactive) Mexus Ro/Ro Ltd. (inactive) VAG Transport (inactive)
PORT: LAKE CHARLES
Overview of Port
In the mid 1920’s, the citizens of Lake Charles, LA, voted to dredge a deep water channel to the Gulf, build their own dock facilities, and establish Lake Charles as a deep water port approximately 34 miles from the Gulf of Mexico. Lake Charles is a center for international commerce with its port, oil and gas resources, a petrochemical complex, and aviation refurbishing facility. In 1924, the Louisiana Legislature created the Lake Charles Harbor & Terminal District that currently encompasses 203 square miles in Calcasieu Parish, and accommodates five million tons of cargo annually at its public facilities. The District owns and operates three marine terminals: the City Docks, Bulk Terminal No. 1, and the Industrial Canal. The District also owns and operates two industrial parks. A deep water port that supports the movement of cargo and industrial development along the Calcasieu Ship Channel, Port Lake Charles has a project depth of 40 ft and a bottom width of 400 ft. Principal cargoes moving through the District’s terminals

22
are bagged rice, flour and other food products, paper products, plywood, petroleum coke and other petroleum products, woodchips, barites, and rutile.
Table 9. Lake Charles Port Information. Type
Deep-water industrial port, no cruise traffic Tonnage
2002 Exports 4,325,982 st Imports 23,105,186 st Domestic 20,090,917 st
Total 47,522,085 st Containers 19,717 TEUs
2003 Tonnage Figures Not Available Containers 19,000 TEUs
Commodities • Bagged rice • Flour and other food products • Paper products • Plywood
• Petroleum coke and other petroleum products
• Woodchips • Barites • Rutile
Cross-Gulf Services Calling at the Port Crowley Liner Services (this service no longer calls at Lake Charles)
PORT: MOBILE
Overview of Port
Alabama's state-controlled port specializes in moving bulk cargoes such as coal (ranking as the nation’s top coal importer), but it does have a limited number of liner services. Shippers can get direct service to Northern Europe, and many carriers will arrange inducement calls at Mobile for large customers.26 The Alabama State Docks, which comprise the public facilities of the Port of Mobile, are located along the Intracoastal Waterway approximately 32 miles from the Gulf of Mexico. The Alabama State Docks also has 10 inland docks on four river systems (Tennessee, Chattahoochee, Alabama, and Warrior/Tombigbee). The entire port complex has direct access to more than 1,500 miles of navigable inland barge routes.27 Channel depths in the Port range from 40 ft to 45 ft. General cargo facilities at the Alabama State Docks include 27 berths, Ro/Ro accessibility, container-port operations, and over four million sq ft of cargo handling area adjacent to piers and tracks. 26 An “inducement call” is a non-scheduled service offered to a customer that has a significant amount of cargo to be
shipped. 27 The Alabama State Docks, http://www.stiegler.net/stdocks.html

23
The McDuffie Terminal bulk coal facility is the largest on the Gulf Coast and the second largest in the United States. In recent years, McDuffie has exported more coking coal than any other facility of its kind in the United States. Ship berths are dredged to 45 ft and can accommodate ships up to 985 ft. Storage space is available for two million tons of coal. The Bulk Material Handling Plant, located at Three Mile Creek, provides handling of both import and export bulk commodities, such as iron ore pellets, ilmenite, coke, import coal, gypsum, copper slag, and other bulk materials. The facility’s ship berths can accommodate vessels drawing up to 40 ft. Covered storage is available for 155,000 tons of dry bulk materials. Up to 800,000 tons of bulk commodities can be placed in open storage. Ships of up to 985 ft long can be accommodated at the 800-foot-long Riverside berth. The Port is in the process of acquiring a permit to construct the proposed Choctaw Point Container Terminal and Intermodal Yard. The marine terminal will initially consist of a 92-acre facility with two berths, 2,000 ft of berth space, and a depth of 45 ft. The Intermodal Yard will consist of roughly 57 acres.28
Table 10. Mobile Port Information. Type
Deep sea industrial port, no cruise traffic Tonnage
2002 Exports 8,488,843 st Imports 15,661,508 st Domestic 21,871,248 st
Total 46,021,599 st Containers 18,604 TEUs
2003 Tonnage 19,400,000 Tons Containers 26,302 TEUs
Commodities • Forest products • Petroleum • Coal • Iron ore
• Aluminum • Steel • Lumber • Wood pulp and chemicals
Cross-Gulf Services Calling at the Port Burlington Northern/Protexa (no longer operating) CG Railway (operating) ITT (never started) Illinois Central (never started)
28 Choctaw Point Terminals To Fuel Economic Growth, http://www.asdd.com/Asd/asd_special_p1.htm

24
PORT: NEW ORLEANS
Overview of Port
Established in 1718, the Port of New Orleans extends 33.7 miles, from river mile 81.2 Above Head of Passes (AHP) to mile 114.9 AHP.29 More than 6,000 ocean vessels annually move through New Orleans. The Port of New Orleans is a diverse general cargo port and also handles containerized cargo such as apparel, food products, and consumer merchandise. The Port’s general cargo volume averaged 11.2 million tons (1998-2002), with a record 14.1 million tons in 1998. The Port of New Orleans is serviced by six Class I rail carriers, 50 ocean carriers, 16 barge lines, and 75 truck lines.
Many major scheduled carriers offer services from New Orleans. There are also a number of successful niche carriers operating from the Port. In spite of its considerable container shipping business (second in the Gulf of Mexico), New Orleans has a heavy emphasis on breakbulk services, providing specialized warehouses and terminals for carriers who move general cargo that is not put into containers. Overall, the Port has 22 million sq ft of cargo handling area and six million sq ft of covered storage. Important features of the Port of New Orleans are (1) deep water, (2) proximity to other waterways and large population centers, and (3) facilities that can move many cargoes efficiently and economically. New Orleans is located at the convergence of the Mississippi River and the Gulf Intracoastal Waterway, which links the ports to commerce moving between north Florida and south Texas. The Port of New Orleans is the only seaport in the U.S. served by six Class I rail lines — Burlington Northern/Santa Fe, Canadian National, CSX, Kansas City Southern, Norfolk Southern, and Union Pacific, as well as all of the major steamship carriers, numerous barge lines, and national truck carriers. The Port of New Orleans has over 22 million sq feet of cargo handling area with wharves and terminals spread over 22 miles of waterfront along the Mississippi River, Industrial Canal, and Mississippi River-Gulf Outlet. Foreign Trade Zone No. 2, located adjacent to and north of the Napoleon Avenue Terminal, occupies 19 acres of space of which approximately 50 percent is covered. Additionally, New Orleans Cold Storage operates a dockside cold storage facility at the Port’s Jourdan Road Terminal on the Industrial Canal/Mississippi River Gulf Outlet. The 160,000 sq feet facility houses 10 “super blast” freezing cells. Also, the Port opened the Napoleon Avenue Container Terminal in March 2004. This terminal has an annual capacity of 366,000 TEUs.30
29 Ports of Lower Mississippi, http://www.epa.gov/gmpo/species/pdf/section3.pdf 30 Napoleon Avenue Container Terminal Dedication Set for March 3, http://www.portno.com/enews.htm

25
Table 11. New Orleans Port Information. Type
Deep sea industrial port, with some cruise traffic Tonnage
2002 Exports 29,836,223 st Imports 21,926,081 st Domestic 33,328,124 st
Total 85,000,428 st Containers 302,318 TEUs
2003 Tonnage Figures Not Available Containers 251,187 TEUs
Commodities • Steel • Forest Products • Containerized Cargo • Coffee
• Rubber • Copper • Crude Oil • Foodstuff
Cross-Gulf Services Calling at the Port American Eagle Tankers (active) CSX Transportation (inactive) Grupo Naviero Kano (inactive)
PORT: TAMPA
Overview of Port
The Port of Tampa is located on the West Coast of Florida, approximately 35 miles from the open waters of the Gulf of Mexico. Established over 120 years ago, the boundaries of the port district include parts of Tampa Bay, Hillsborough Bay, McKay Bay, Hillsborough River, and Old Tampa Bay. The City of Tampa is located on the Hillsborough River, 41 miles from the Gulf of Mexico. Deep-draft vessels use Egmont Channel, which is 43 ft deep and 700 ft wide. The East Bay Turning Basin is 2,700 ft wide. Other channels in the Port are maintained to 34 ft, with 34 ft to 39 ft at quays. Phosphate and related products comprise 93 percent of exports from the Port of Tampa. Top general-cargo commodities include scrap metal, steel products, poultry, fresh fruit, and forest products. Port of Tampa facilities include nine general cargo and container terminals, 14 chemical terminals, four cement terminals, five scrap metal facilities, three grain feed elevators, a liquid bulk terminal (used primarily for the import of orange juice concentrate), a cattle export facility, 26 berths of tanker terminals, and facilities for the Port’s cruise ship industry. There are also five ship repair yards, a dedicated intermodal complex under development, and Foreign Trade Zone (currently inactive). Bulk is the Port’s number one line of business. Approximately 25 million tons of phosphate and related products move through the port annually, more than at any other port in the world.

26
Increases in ammonia and sulfur imports have allowed more fertilizer and phosphate products to be produced locally, rather than overseas. Other major bulk commodities include cement, limestone, citrus pellets, and aggregate. Coal and petroleum imports fuel the regional economy. Tampa’s cruise business continues to grow as the Port opened Cruise Terminal 3, an 110,000 sq ft cruise terminal facility in addition to the existing three cruise terminals.
Table 12. Tampa Port Information. Type
Deep sea industrial port, with ferry and cruise traffic Tonnage
2002 Exports 8,226,333 st Imports 8,343,457 st Domestic 31,815,180 st Cruises 174 Passengers 323,000
Total 48,384,970 st Containers 6,141 TEUs
2003 Tonnage Figures Not Available Containers 8,173 TEUs Cruises 213 Passengers 418,000
Commodities • Petroleum Products • Phosphates • Coal • Scrap Metal • Steel Products • Poultry • Fresh Fruit • Forest Products • Cement • Orange Juice
• Grain • Granite • Limestone • Aggregate • Citrus Pellets • Liquid Propane • New & Used Cars • Frozen Poultry • Pulp and Paper
Cross-Gulf Services Calling at the Port Gulf Caribbean Transport (inactive) Maya Lines (inactive) MP Lines (active) Sea Lion Ocean Freight (inactive) Scotia Prince (inactive) Thompson Shipping (inactive)

27
MEXICAN PORTS
PORT: ALTAMIRA
Overview of Port
The Port of Altamira, Tamaulipas, was built between 1982 and 1989 and spans nearly 10,000 hectares (25,000 acres). Because of this, it claims to be Mexico’s biggest port. It is one of Mexico’s most important industrial ports and was one of the first to be privatized. There are three main components to the Port Complex: the Industrial Port facilities, one of Latin America’s largest industrial parks, and a major petrochemical complex. The main channel depth is 45.6 ft, and the connecting channel has a depth of 43 ft. The Port of Altamira’s specialty is in importing liquid cargo for Mexico’s chemical industry. There is also the Altamira Terminal Multimodal with refrigeration capabilities, and container handling facilities are also present. Some 45 percent of the Port’s imports are for the nation’s chemical and petrochemical industries, primarily those located in the State of Tamaulipas (63 percent), in the State of Nuevo Leon (24 percent) and the State of Mexico (8 percent). It is Mexico’s closest cargo port to the United States. Ten terminals are located at Altamira. Two of the terminals are multi-use with the ability to handle containers; five specialize in liquids, one in agriculture, one in automobiles, and one in mineral and breakbulk. The Port’s agriculture terminal is the largest facility of its type in Latin America. In addition to these facilities, there are seven service companies – from container repair to multimodal logistic services. Development at the Port Complex is planned with the environment in mind. More than 1,400 hectares have been reserved for an ecological belt surrounding the area. Also, the Port has received the ISO-14001 certification and stands as the first Latin American port to attain such an honor.

28
Table 13. Altamira Port Information. Type
Deep sea industrial port, no cruise traffic Tonnage
2002 Exports 1,480,667 mt Imports 5,815,602 mt Domestic 95,716 mt
Total 7,391,985 mt Containers 225,937 Automobiles 69,812
2003 Exports 1,710,044 mt Imports 5,836,167 mt Domestic 39,839 mt
Total 7,586,050 mt Containers 256,417 Automobiles 78,763
Commodities • Chemicals and petrochemicals • Containers • Machinery and equipment • Automobiles and auto parts • Electrical household appliances • Steel (in various forms) • Sugar • Dimethylteraphthalate (DMT)
• Metal structures • General cargo • Fruits and vegetables for export • Grains • Wood and furs • Bulk minerals • Iron ore and coal
Cross-Gulf Services Calling at the Port Burlington Northern/Protexa (no longer operating) CSX Transportation (never started)
PORT: COATZACOALCOS
Overview of Port
Located in the south of the State of Veracruz, Coatzacoalcos is a commercial and industrial port which in combination with the Pajaritos port facilities provides significant port capacity for the handling of high-volume shipments in large vessels. The main channel has a depth of 46 ft. The commercial facilities include 10 berthing positions with the ability to handle vessels up to 36 ft in draft, and a specialized terminal with a draft of 18 ft designed to handle rail barges of up to 13,800 tons. The petroleum part of the complex, Pajaritos, is operated by Petróleos Mexicanos (PEMEX). It services primarily the export of petroleum and its derivatives, as well as bulk minerals. Linked to Salina Cruz, which is only 300 km (180 miles) away, Coatzacoalcos offers an opportunity to operate an intermodal freight service for international shipments and is the base for industrial development, agricultural, fishing, and business activity in the Isthmus of Tehuantepec region.

29
Table 14. Coatzacoalcos Port Information. Type
Deep sea industrial port, no cruise traffic Tonnage
2002 Exports 1,186,991 mt Imports 1,233,271 mt Domestic 488,622 mt
Total 2,908,884 mt Containers Not Available Automobiles Not Available
2003 Not Available Commodities
• Sulfur • Salt • Beer • Urea • Molasses • Perishable food products • Terephthalic acid • Phosphate • Caustic Soda • Ammonium • Resins
• Chemical products • Bagged sugar • Bulk minerals • Powdered milk • Heavy machinery • Pipe • Cement • Bulk agricultural commodities • Chlorine • Solvents • Plastics
Cross-Gulf Services Calling at the Port Burlington Northern/Protexa (no longer operating) CG Railway (operating) ITT (never started) Illinois Central (never started)
PORT: DOS BOCAS
Overview of Port
Dos Bocas is Mexico’s most important petroleum port. The Port was constructed during the oil boom at the end of the 1970’s and began operations in 1982 with two monobuoys 21 km (13 miles) from the Port. The construction of the jetties began in 1982 and finished in 1985. The Port now exports 30 million tons of crude oil each year. The facilities also include a supply terminal for offshore activities in the Sound of Campeche. The inner harbor has a depth of 18 ft.

30
Table 15. Dos Bocas Port Information. Type
Deep sea industrial port, with no cruise traffic Tonnage
2002 Exports 30,243,655 mt Imports -0- Domestic 756,574 mt
Total 31,000,229 mt Containers -0- Automobiles -0- Passengers 86
2003 Not Available Commodities
Heavily oriented toward the oil & gas industry • Crude • Structural steel • Steel pipe • Diesel
• Cement • Potable water • Barite/drilling mud
Cross-Gulf Services Calling at the Port American Eagle Tankers (operating)
PORT: PROGRESO
Overview of Port
The Port of Progreso serves the states of Yucatán, Campeche, Tabasco, and Quintana Roo. It is the port of entry for agricultural bulk commodities, industrial products, fuel, and general cargo for the City of Mérida and its industrial corridor (36 km or 22 miles from the Port), as well as the rest of the region. It is also the port for export of textiles, meat and fish products, fruit, and other agricultural and industrial products coming from its primary zone of influence. The Port has been a catalyst for industrial, agricultural, and fishing development in the region and is a fundamental reason for the growth in exports from the region. Since the restructuring of 1995, the Port has also seen robust growth in container traffic. The Port has a navigation channel that is 31 ft in depth. It has five berthing areas, one of which is private (agricultural bulk commodities). It emphasizes the cruise business as an important part of its revenue mix.

31
Table 16. Progreso Port Information. Type
Deep sea industrial port and cruise terminal Tonnage
2002 Exports 140,975 mt Imports 1,662,622 mt Domestic 1,322,589 mt
Total 3,126,186 mt Containers 59,140 Automobiles -0- Passengers 130,200
2003 Exports 146,468 mt Imports 1,773,435 mt Domestic 1,646,527 mt
Total 16,255,800 mt Containers 60,369 Automobiles -0- Passengers 169,300
Commodities • Bulk agricultural commodities • Products manufactured from henequen • Textiles from maquiladoras
• Honey and perishables • Wood and stone for construction
Cross-Gulf Services Calling at the Port Carib Ocean Shipping (no longer operating) Crowley Liner Services (operating) Industrial Maritime Carriers (no longer operating) Línea Peninsular (operating) Maya Lines (never started) Mexican Gulf Line (no longer operating) Thompson Shipping (?)
PORT: TAMPICO
Overview of Port
Tampico, at the confluence of the Pánuco and Tamesí rivers, is connected by rail to Victoria City and from there by rail and highway to Corpus Christi. The port, which is 85 years old, extends on both sides of the Rio Pánuco for 22 km (13.6 miles), from the breakwaters in the Gulf of Mexico to a bridge known as El Prieto, a bridge that spans the river at that point inland. It has a controlling depth of approximately 32 ft. Tampico considers itself to be the second most important deepwater port on the Gulf of Mexico (behind Veracruz). It was designed to provide service to companies located within its general region. It has one public terminal and eight private terminals, as well as 10 patios for the construction of marine platforms. It is an important port for foreign trade in industrial,

32
petrochemical, agricultural, and mineral products. More than 20 steamship lines provide regular service to the port.
Table 17. Tampico Port Information. Type
Deep sea industrial port, no cruise traffic Tonnage
2002 Exports 3,144,417 mt Imports 3,445,354 mt Domestic 2,780,728 mt
Total 9,370,499 mt Containers 18,848 Automobiles 18,626
2003 Exports 1,903,795 mt Imports 2,586,489 mt Domestic 5,410,349 mt
Total 9,900,633 mt Containers 14,347 Automobiles - 0 -
Commodities • Cement • Sheet steel • Metallurgical grade fluorite • Limonite • D.M.T.
• Corn • Zinc concentrate • Sodium sulfate • Carbon coke • Iron ore
Cross-Gulf Services Calling at the Port Crowley Liner Services (ceased calling Tampico in 2001) Gulf Caribbean Transport (no longer operating)
PORT: TUXPAN
Overview of Port
Certified under ISO 9001, Tuxpan is the closest deep sea commercial port to Mexico City (300 km or 186 miles), with a direct influence on Gulf and South-Central Mexico, which generates 48 percent of the country’s Gross Domestic Product. It was the first port in the country to establish regular container service with a Ro/Ro system in 1973. The Port has one public terminal and 14 private terminals with their own facilities and equipment for handling a variety of cargo according to its special needs: agricultural bulk, liquids, general cargo, and containers. Two of the terminals specialize in the construction and repair of marine oil drilling platforms and of heavy equipment. Another receives chemical products, and yet another is dedicated to handling liquid products. Additionally, the port has a terminal for handling agricultural and bulk commodities with high-speed loading and discharging equipment,

33
and a terminal for handling unitized cargo, general cargo, and containers. A new terminal for chemical products and solvents is about to come on line.
Table 18. Tuxpan Port Information. Type
Deep sea industrial port, with some ferry and cruise traffic Tonnage
2002 Exports 1,988 mt Imports 7,345,840 mt Domestic 3,823,419 mt
Total 11,171,247 mt Containers 286 Automobiles -0- Passengers Not Available
2003 Exports 3,708 mt Imports 6,248,122 mt Domestic 4,154,480 mt
Total 10,406,310 mt Containers 101 Automobiles -0- Passengers Not Available
Commodities • Chemicals • Steel pipe • Heavy equipment • Containers • Metals • Cotton
• Cotton bales • Agricultural bulk commodities • Scrap • Steel • Gypsum sheetrock panels • Perishables
Cross-Gulf Services Calling at the Port Gulf Bridge Ro/Ro (no longer operating) Mexican Gulf Line (no longer operating) Mexus Ro/Ro (no longer operating)
PORT: VERACRUZ
Overview of Port
Veracruz is the oldest port on the North American continent, having been founded in 1519 by Hernán Cortés as “Villa Rica de la Vera Cruz.” It is a compact port surrounded by the city. Veracruz is the principal commercial port in Mexico, located less than 300 miles or 15 hours by truck from Mexico City. It has an excellent geographical location with over 60 million potential consumers in its immediate zone of influence. It is one of the country’s most important ports for the supply of bulk and industrial products for the primary production centers and business centers in Mexico.

34
There are five public terminals and seven private terminals at the Port. Cargos from practically every region of the Mexican Republic are handled in Veracruz. More than 30 steamship lines call at the port.
Table 19. Veracruz Port Information. Type
Deep sea industrial port, with cruise traffic Tonnage 2002
Exports 2,663,900 mt Imports 13,070,600 mt Domestic 21,300 mt
Total 15,755,800 mt Containers 548,400 Automobiles 417,534 Passengers 3,109
Tonnage 2003 Exports 2,639,000 mt Imports 13,606,800 mt Domestic 10,000 mt
Total 16,255,800 mt Containers 571,900 Automobiles 490,974 Passengers 1,909
Commodities EXPORTS IMPORTS
• Steel pipe • Refined sugar • Automobiles &
auto parts • Paper • Bulk Portland
cement • Beer
• Honey & molasses
• Terephthalic acid
• Silica • Chemical
products • Coffee • Synthetic resins • Polyethylene
• Bulk wheat • Bulk white
corn • Bulk sorghum • Soybeans • Rice • Tiles • Steel (ingots,
sheet steel, pipe, etc.)
• Automobiles & auto parts
• Vegetable oil • Paper • Bulk alumina • Fertilizer • Chemicals • Steel scrap
Cross-Gulf Services Calling at the Port Burlington Northern/Protexa (no longer operating) Cargo Transport Lines (no longer operating) Carib Ocean Shipping (no longer operating) CIS Shipping (no longer operating) Crowley Liner Services (operating) CSX Transportation (never started) Grupo Naviero Kano (never started) MP Lines (operating) NYK Bulk (no longer operating) Sea Lion Ocean Freight (no longer operating)

35
CHAPTER 3: SUMMARY OF CROSS-GULF SERVICES
AMERICAN EAGLE TANKERS
Duration 1994 to present Focus Crude oil Status Active
Ports of call Pajaritos, Dos Bocas, Cayo Arcas, Corpus Christi, Freeport, Houston, Port Neches, Loop, New Orleans
Factors affecting
New market resulting from industry restrictions
Summary: American Eagle Tankers (AET) was formed in 1994 to own and operate crude oil tankers. AET’s vision and strategy was to carve out a niche market through the U.S. Gulf lightering market and to provide quality tonnage to customers through a predominantly double hull fleet. Starting with 3 ships AET has grown to a fleet of 29 Atlantic Basin Aframax tankers and 2 very large crude carriers (VLCCs). AET’s Gulf Lightering business “evolved in response to the operating restrictions imposed by the region’s shallow coast lines.”31 This was “further reinforced by the development of major refining centers and inter-state pipeline networks in Louisiana and Texas, and North America’s growing dependence on crude oil imports.”32 AET initially focused on lightering in the Gulf of Mexico but has expanded operations to include voyage chartering, time chartering in the Gulf of Mexico, Atlantic Ocean, Caribbean Sea, North Sea, and Mediterranean Sea. However, most AET “charters are for voyages from ports in Latin America to ports along the U.S. Gulf or the U.S. Atlantic Coast.”33
AMERICAS MARINE EXPRESS34 (a Kirby subsidiary) Duration Early 1994 to August 1994
Focus U.S. exports of auto parts, appliances, food additives, fruits and vegetables, and machinery, and import of furniture, sporting goods, apparel, and other consumer goods.
Status Inactive Ports of call Memphis, Progreso, Santo Tomas Factors affecting Price competition Summary: American Marine Express was formed in February 1993 as a subsidiary of Houston-based Kirby Corporation that operated as an experimental barge service between Memphis, TN, and Mexico. American Marine Express eventually “scuttled its fledgling containership service … after losing money amid price competition.”35 The service marketed itself as a way to cut out the rail haul from upper Midwest states to New Orleans/Baton Rouge 31 AET & U.S. Gulf Lightering, www.aetweb.com/AETLightering.htm 32AET & U.S. Gulf Lightering, www.aetweb.com/AETLightering.htm 33AET & Voyage Chartering, www.aetweb.com/VoyageChartering.htm 34 This service does not technically fit the definition of “cross-Gulf shipping” used for this study, but was included
anyway because (1) it is the only attempt made to establish cross-Gulf shipping from an inland river port, and (2) the primary target market was Mexico.
35 Carlino, Maria, CSX Continues to Study Cross-Gulf Barge Service, Journal of Commerce, March 1, 1995.

36
and ship direct to Mexico and Honduras. The rail lines responded to the challenge by engaging in a price war until Americas Marine ceased operations. The direct, all-water service ended operations in August 1994 after conducting bi-weekly operations billed as the nation’s “first regularly scheduled liner service for international trade from an inland American port.” One benefit of AME’s service was that it bypassed oceangoing shiploading terminals on the lower Mississippi allowing the cargo to make a direct connection to ports in Mexico and abroad. AME utilized the Chinese built, European chartered Baltimar Euros (3,200-ton vessel, 298 ft long, 48 ft beam, with a cargo carrying capacity of 256 TEUs) for operations.
CARGO TRANSPORT LINES
Duration 1993 (operated from end of ’93 to mid ’94) Focus Paper & wood products Status Inactive Ports of call Gulfport, Veracruz, Frontera Factors affecting Management Restructuring Summary: Cargo Transport Lines (CTL) with the support of KLLM Transport Services conducted services from January 1993 to October 1994 between Gulfport, MS, Veracruz, MX, and Frontera, MX. CTL operated “two small vessels in the U.S. - Mexico trade, with a capacity of 92 twenty-foot equivalent units, or TEUs. The North American Free Trade Agreement played a large role in the decision to begin the line.”36 In October 1994 CTL halted operations to “restructure its management team,”37 but they never resumed operations.
CG RAILWAY (A SUBSIDIARY OF INTERNATIONAL SHIPHOLDING CORP.)
Duration March 2000 to Present Focus Beer, steel products, paper and forest products, and wood pulp Status Active Ports of call Mobile, Coatzacoalcos Factors affecting Route Selection Summary: CG Railway, Inc., a subsidiary of International Shipholding Corporation, is (for legal purposes) a Short Line railroad established March 2000. CG Railway has interline agreements with four trunkline railroads, allowing direct shipments without changing rail lines. A shipper can send his cargo from southern Mexico across the Gulf all the way to the Northeast or Midwest regions of the United States—or even Canada – without any interchanges. This was not possible before CG Railway’s service. Also, CG offers a single bill of lading to its customers. CG Railway sails between the ports of Mobile and Coatzacoalcos moving a variety of products including beer, steel products, paper and forest products, and wood pulp by means of
36 Tirschwell, Peter M., U.S. Exporters To Mexico Reluctant To Ship By Sea, Journal of Commerce, March 10, 1994 37 Taylor, Gary, Firms Wrestling With Snags in Water Shuttle Service, Journal of Commerce, October 17, 1994

37
two converted semi-submersible LASH vessels (585’ long, with a carrying capacity of 60 railcars each on eight sets of tracks).38 There is room on the vessels for some automobiles in addition to the railcars. The trade balance has been fairly even over CG Railway’s life. According to company statements, CG can make the trip from Mobile to Coatzacoalcos 10 to 14 days quicker than by overland transportation. CG Railway’s advantages of multi-vessel sailings, frequency, and direct rail connection have prolonged its initial success.
CIS SHIPPING (A.K.A. GULF OF MEXICO EXPRESS)
Duration 1999 to 2000 Focus Beer Status Inactive Ports of call Mobile, Veracruz Factors affecting Trucking Rates, Lack of Cargo Summary: Operating out of Mobile, AL, CIS Shipping serviced Veracruz, MX, in 1999 and 2000 as a roll-on/roll-off service known as the Gulf of Mexico Express. Beer was the primary cargo for the Gulf of Mexico Express, which eventually ended operations as a result of not being able to attract enough cargo. Additionally, “trucking rates were too competitive and transit times were more efficient by land.”39 CIS “attempted to go after some rail business, but the cost of the 53’ equipment was too expensive.”40
CROWLEY LINER SERVICES (FORMERLY CROWLEY AMERICAN TRANSPORT)
Duration 1999 Focus Textiles Status Inactive Ports of call Lake Charles, Progreso Factors affecting Size, New Tariff Treatment Summary: Crowley American Transport started a new service in January 1999 that operated for a short time as a roll-on/roll-off service that “links sailings from Lake Charles, LA, with the Yucatan peninsula port of Progreso….and aims to carve out a chunk of the lucrative and growing Section 807 traffic – mainly textiles – that gets special tariff treatment in the United States for goods manufactured in the Caribbean Basin.”41 Crowley operated the service using three Ro/Ro vessels that called on Lake Charles, LA, and Progreso, MX. 38 Hensel Jr., Bill, Rail Ferry Service Between Mobile and Mexico To Begin This Year, Journal of Commerce,
September 22, 2000. 39 Bonney, Joseph, Telephone Interview with Mr. Joseph Bonney, Journal of Commerce contributor. 40 Arias, Ricardo J., Telephone Interview with Mr. Ricardo J. Arias, Port of Houston Authority. 41 Hall, Kevin G., Carriers Try To Lure Cargo Off Roads And Onto Water, Journal of Commerce, February 17,
1999.

38
CSX TRANSPORTATION (GATO MARINO SERVICE)
Duration 1996 (planned for ’96, but never started) Focus Automobile parts Status Inactive Ports of call Mobile, New Orleans, Veracruz, Altamira Factors affecting Economic Factors Summary: CSX conducted extensive research during 1994 and 1995 on the feasibility of a cross-Gulf barge service, but eventually decided to not pursue such a venture. CSX Transportation, “citing economic factors…officially drowned Gato Marino, its planned cross-Gulf intermodal service that would have connected its Eastern rail customers by barge or vessel with Mexico.”42 CSX had substantial capital in place to support the venture that had planned on calling on the ports of Mobile, AL, New Orleans, LA, Veracruz, MX, and Altamira, MX. However, CSX “said several economic factors prompted CSX to halt its trans-Gulf project. Traffic forecasts for Gato, originally estimated at 25,000 loads annually, were revised downward after FNM provided U.S. railroads with the marketing data last year [1998]…The new load was understood to be less than half of the original expected volume.”43 Ultimately, CSX determined that the rail haul from the port to end user was too lengthy to make the ocean leg work.
GRUPO NAVIERO KANO (PLANNED TO BE CALLED NAFTA XPRESS LINES)
Duration 1997 (planned for ’97, but never started) Focus Coffee Status Inactive Ports of call New Orleans, Veracruz Factors affecting Equipment problems Summary: Grupo Naviero Kano made plans in 1997 to start a service connecting the ports of New Orleans, LA, with Veracruz, MX. “Coffee was to be the chief cargo, and the service aimed to win traffic from truckers who haul the product through Laredo, Texas.”44 The proposed Nafta Xpress Lines had investors in Norway backing the roll-on/roll-off project that would have been run by the former CFO of Transportación Marítima Mexicana, Harou Kano. Nafta Xpress Lines aimed “to be a facilitator of trade, a service provider for the trucking companies and the railway companies,”45 but unfortunately plans never materialized due to problems with vessel assignment from Swedish shipyard Stena AB.46
42 Watson, Rip, CSXT Deep-Sixes Mexico Rail-Water Plan, Journal of Commerce, March 2, 1995. 43 Watson, Rip, CSXT Deep-Sixes Mexico Rail-Water Plan, Journal of Commerce, March 2, 1995. 44 Hall, Kevin G., Carriers Try To Lure Cargo Off Roads And Onto Water, Journal of Commerce, February 17,
1999. 45 Hall, Kevin G., Ports Plan New Roll-On, Roll-Off Service To Mexico, Journal of Commerce, June 10, 1997. 46 Hall, Kevin G., Ports All-Water Coffee Service to Mexico Yet To Percolate, Journal of Commerce, February 10,
1999.

39
GULF BRIDGE RO/RO
Duration 1998 to 1999 Focus Bananas, Automotive and Dry Van Trailer Freight, Automobiles Status Inactive Ports of call Mobile, Tuxpan Factors affecting Expired Charter Summary: Gulf Bridge Ro/Ro operated a weekly roll-on/roll-off service in 1998 and 1999 that had capacity for 90 trailers and 450 cars.47 The service focused on the auto industry and moved vehicles between the ports of Mobile, AL, and Tuxpan, MX. Additionally, Gulf Bridge Ro/Ro wanted to “attract shippers of perishables, such as limes, concentrated juices, and vegetables.”48 Gulf Bridge eventually ended operations citing that their vessel charter expired, the owner sold the vessel, and that Gulf Bridge was unable to find a suitable replacement.49
GULF CARIBBEAN TRANSPORT
Duration March 2001 to September 2002 Focus Automobiles Status Inactive Ports of call Tampa, Tampico Factors affecting Insufficient data Summary: Gulf Caribbean Transport (GCT) operated a service between the ports of Tampa, FL, and Tampico, MX, from March 2001 until September 2002. The service focused on moving cars, trucks, and heavy equipment.
ITT (INTERNATIONAL TRADE & TRANSPORT LTD.)
Duration 1998 (Planned for ’98, but never started) Focus Chemicals, plastics, and petroleum Status Inactive Ports of call Galveston, Coatzacoalcos Factors affecting Insufficient data Summary: ITT planned to launch a rail barge service in 1998 between the ports of Galveston, TX, and potentially Progreso, MX, Veracruz, MX, or Coatzacoalcos, MX. ITT’s service “will target chemicals, but not necessarily as the anchor.”50 With sailings planned for twice weekly with barges of varying sizes, ITT had hoped for success with James Owens running operations, the former head of BN’s PBI service between the U.S. and Mexico. It is not clear why the service never started, but operations never commenced for ITT. 47 Hall, Kevin G., Tuxpan Port Plans Reefer Warehouse\Facility Will Be First for That Part of Mexico Will Enhance
New Roll-On Service To Mobile, Journal of Commerce, May 11, 1998. 48 Sutter, Mary, Mexico Gulf Ports Girding for Battle\Seek To Offer Faster Transit Than Trucks, Journal of
Commerce, July, 20, 1998. 49 Peterlin III, Captain John G, Personal Interview, Galveston, TX, March 4, 2004. 50 Hall, Kevin G., Return Of The Rail-Barge, Journal of Commerce, January 26, 1998.

40
ILLINOIS CENTRAL
Duration 1998 (planned for ’98, but never started) Focus Chemicals Status Inactive Ports of call Mobile, Coatzacoalcos Factors affecting
Acquisition
Summary: Illinois Central originally made plans to start a rail-barge service focusing on chemicals in 1998 with sailings between the ports of Mobile, AL and Coatzacoalcos, MX. The service was a joint venture with Scan Lines but never started because Canadian National acquired Illinois Central in 1998.
INDUSTRIAL MARITIME CARRIERS (INTERMARINE)
Duration February 2000 to Present Focus Textiles Status Active Ports of call Houston, Progreso Factors affecting
Insufficient data
Summary: In February 2000, Intermarine started a “weekly container-breakbulk service between Houston and Progreso, on Mexico’s Yucatan peninsula.”51 Industrial Maritime Carriers utilizes a shallow-draft, multi-purpose vessel. The service focuses on breakbulk, project, and heavy-lift cargoes. While Intermarine offers the Houston-Progreso service, it provides service around the globe, especially in project cargo.
LÍNEA PENINSULAR
Duration 1984 to Present Focus Finished Goods (Textiles) and Oil Field Equipment & Supplies Status Active Ports of call Port Bienville, Progreso Factors affecting
Multiple vessels, reliable scheduled service, captured “807” business early on
Summary: In 1984, Línea Peninsular started a service between Port Bienville, MS, and Progreso, MX, focusing on textiles and oil field equipment and supplies. With four round trips weekly, Línea Peninsular uses 5 small vessels (ranging in size from 2,300 deadweight tons to 3,000 DWT) to serve its customers. The company claims to carry 100 percent of the shipments for “807” manufacturing businesses in the Yucatán. Línea controls its own fleet of trucks in both countries and promises four-day Door-to-Door deliveries between the Yucatán Peninsula and the United States.
51 Intermarine Inc. Launches Houston-Progreso Service, Journal of Commerce, February 17, 2000.
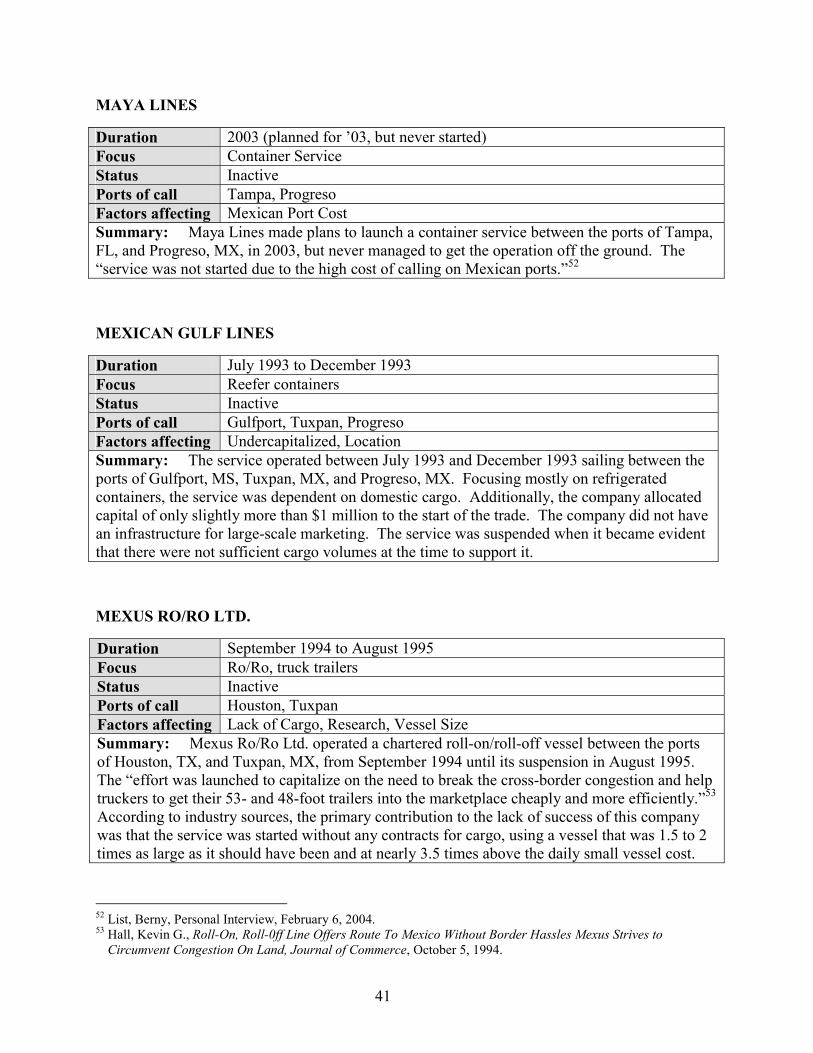
41
MAYA LINES
Duration 2003 (planned for ’03, but never started) Focus Container Service Status Inactive Ports of call Tampa, Progreso Factors affecting Mexican Port Cost Summary: Maya Lines made plans to launch a container service between the ports of Tampa, FL, and Progreso, MX, in 2003, but never managed to get the operation off the ground. The “service was not started due to the high cost of calling on Mexican ports.”52
MEXICAN GULF LINES
Duration July 1993 to December 1993 Focus Reefer containers Status Inactive Ports of call Gulfport, Tuxpan, Progreso Factors affecting Undercapitalized, Location Summary: The service operated between July 1993 and December 1993 sailing between the ports of Gulfport, MS, Tuxpan, MX, and Progreso, MX. Focusing mostly on refrigerated containers, the service was dependent on domestic cargo. Additionally, the company allocated capital of only slightly more than $1 million to the start of the trade. The company did not have an infrastructure for large-scale marketing. The service was suspended when it became evident that there were not sufficient cargo volumes at the time to support it.
MEXUS RO/RO LTD.
Duration September 1994 to August 1995 Focus Ro/Ro, truck trailers Status Inactive Ports of call Houston, Tuxpan Factors affecting Lack of Cargo, Research, Vessel Size Summary: Mexus Ro/Ro Ltd. operated a chartered roll-on/roll-off vessel between the ports of Houston, TX, and Tuxpan, MX, from September 1994 until its suspension in August 1995. The “effort was launched to capitalize on the need to break the cross-border congestion and help truckers to get their 53- and 48-foot trailers into the marketplace cheaply and more efficiently.”53 According to industry sources, the primary contribution to the lack of success of this company was that the service was started without any contracts for cargo, using a vessel that was 1.5 to 2 times as large as it should have been and at nearly 3.5 times above the daily small vessel cost.
52 List, Berny, Personal Interview, February 6, 2004. 53 Hall, Kevin G., Roll-On, Roll-0ff Line Offers Route To Mexico Without Border Hassles Mexus Strives to
Circumvent Congestion On Land, Journal of Commerce, October 5, 1994.

42
NYK - BULK
Duration 1999 to 2000 Focus Various Ford vehicles Status Inactive Ports of call Corpus Christi, Veracruz Factors affecting
Response to UP’s lack of equipment for moving automobiles through Laredo. Service canceled when UP acquired the necessary equipment.
Summary: This service ran from April 1999 to August 2000. It was initiated as a response to Union Pacific experiencing a short supply of multi-level rail cars. It was understood from the beginning that this would be short term until UP acquired additional rail cars. In round numbers, about 50,000 units were handled with no damage. The ships used were autocarrier Ro/Ro’s of approximately 25,000 to 27,000 Gross Registered Tons (10,500 to 10,900 Deadweight Tons, 541 ft Length Overall, and 90.6 ft beam).
PROTEXA BURLINGTON INTERNATIONAL
Duration 1993 (lasted 18 months) Focus Grain Status Inactive Ports of call Galveston, Coatzacoalcos, Altamira, Veracruz Factors affecting
Burlington Northern & Santa Fe merger
Summary: Burlington Northern and Grupo Protexa SA established a joint venture in early 1992 that made its first sailing in April 1993 as the rail-water operation Protexa Burlington International (PBI). PBI’s principal commodity carried was grain between the ports of Galveston, TX, and Coatzacoalcos, MX. PBI initially started with 2 barges, each with 54 railcars and then expanded operations to the Port of Veracruz in January 1994. By October 1994, with 4 barges in service, PBI ceased operations after carrying “nearly 3,500 railcars across the Gulf.”54 The primary reason that the service was suspended is that Grupo Protexa was assigned to the joint venture by the Mexican Government as partner and brought a lot of debt to the venture with them. As a consequence, Burlington Northern was said to be finding that much of the revenue from the partnership was not flowing back to them. At the same time that this problem was growing in 1994, the Burlington Northern (BN) became involved in a merger with the Santa Fe Railroad. This merger provided the BN with a border gateway that they did not previously have access to (owned by Santa Fe). After BN merged with Santa Fe to form BNSF, the PBI venture no longer made sense for BNSF to pursue due to existing land routes that were acquired as a result of the merger.
54 Taylor, Gary, Traffic To Mexico By Barge Still Limited, Journal of Commerce, March 14, 1996.

43
SEA LION OCEAN FREIGHT (A SUBSIDIARY OF AMERICAN RIVER INTERNATIONAL)
Duration 1997 Focus Orange Juice Concentrate, Chemicals, Tile, Beer, Automobiles Status Inactive Ports of call Tampa, Veracruz Factors affecting
Insufficient data
Summary: Sea Lion Ocean Freight started service that moved “freight between Tampa and Veracruz, Mexico.”55 The operation provided “non-stop ferry service every 10 days with a focus on all types of cargo as well as breakbulk and heavy-lift cargoes, and motor vehicles.”56 Sea Lion hoped to “capitalize on congestion by offering shippers what it calls the Gulf bridge – a water connection that shaves off 1,100 miles from land transport to the Mexican border.”57
SCOTIA PRINCE (YUCATAN EXPRESS)
Duration 2002 Focus Containers Status Inactive Ports of call Tampa, Puerto Morelos Factors affecting
Lack of Port Service, Navigational Issues
Summary: Scotia Prince operated a service between Tampa, FL, and Puerto Morelos, MX, throughout 2002 that focused on container shipments. The service was suspended January 2003 due to navigational issues and the need to service more than one port.58
55 New shipping service to connect Tampa with Mexico, The Tampa Bay Business Journal, December 16, 1997. 56 New shipping service to connect Tampa with Mexico, The Tampa Bay Business Journal, December 16, 1997. 57 Hall, Kevin G., Gulf Coast High, Journal of Commerce, December 31, 1997. 58 Yucatan Express suspends sailing to Morelos, The Tampa Bay Business Journal, January 7, 2003.


45
CHAPTER 4: ANALYSIS – LESSONS LEARNED Both carriers and Gulf of Mexico ports at which carriers call(ed) were surveyed regarding their perceptions of factors that contributed to the success or failure of cross-Gulf shipping ventures, particularly obstacles to success and proposed measures to address these obstacles. The results of these surveys are presented in Tables 21 through 38, along with discussions particular to the perspectives of carriers, U.S. ports and Mexican ports. Then, lessons learned from other short sea shipping ventures are discussed, followed by lessons learned from cross-Gulf shipping ventures that may be applied to other short sea shipping initiatives. Finally, needs for further research and conclusions are identified.
FINDINGS – SHIPPER PERSPECTIVES
Where the research team could find individuals that are currently—or have previously been—involved with cross-Gulf operations, their observations on obstacles and potential remedies were solicited. In interviews with 11 short sea shipping companies several obstacles and potential actions that could be taken by governmental entities were mentioned. Each interviewee was asked to rank the obstacles and potential remedies they mentioned. The obstacles are identified in Table 20.
Table 20. Carrier-Cited Obstacles to Short Sea Shipping Ventures in the Gulf of Mexico.
Obstacle 1 Obstacle 2 Obstacle 3 Rate Wars Education of northbound
shippers (entrenched system)
Cultural differences Focus on wrong markets Frequency of service Lack of adequate port
infrastructure Entrenched system Frequency of service Harbor Maintenance Tax Frequency of service Lack of adequate port
infrastructure Distance from port to final destination
Entrenched system Logistics managers don’t like change from currently used services (entrenched system)
Frequency of service
Frequency of service Differences between domestic & ocean containers
Jones Act & lack of federal start-up funds
Entrenched system at Laredo Lack of federal funds for start-up
Lack of coordination between surface & maritime carriers
Jones Act
Frequency of service Jones Act (tied for 1) Lack of adequate port infrastructure
Not enough cargo in 45 ft and 53 ft trailers that can be pulled off road
Transportation from Mexican ports to final destination very costly

46
Table 21 shows the frequency with which each obstacle is mentioned in Table 20.
Table 21. Frequency of Carrier-Cited Obstacles to Short Sea Shipping Ventures in the Gulf of Mexico.
Obstacle Mentioned # of Times Ranked in Top 3
Frequency of service 6 Entrenched system 5 Lack of adequate port infrastructure 3 Jones Act 3 Lack of federal funds for start-up 2 Rate Wars 1 Cultural differences 1 Focus on wrong markets 1 Harbor Maintenance Tax 1 Distance from port to final destination 1 Differences between domestic & ocean containers
1
Lack of coordination between surface & maritime carriers
1
Not enough cargo in 45 ft and 53 ft trailers that can be pulled off road
1
Transportation from Mexican ports to final destination very costly
1
In order to get another sense of the relative importance of these factors to the surveyed population, we can assign rank scores to each of the obstacles identified (that are among the top three obstacles listed), and total the scores for each obstacle to identify its relative importance. This weighting can be accomplished by applying a score of 3 to Obstacle 1, a 2 to Obstacle 2, and a 1 to Obstacle 3 (obstacles with tied rankings each receive the value of the ranking at which they are tied). The higher an obstacle’s cumulative score, the greater its relative importance to those surveyed. It is noted that additional obstacles (beyond a “top three”) that may have been identified by shippers are not included in this prioritization. However, this method is useful for identifying those top factors that particularly stood out in importance to shippers. Table 22 shows the priority score ranking of the obstacles identified in Table 21.

47
Table 22. Priority Score Ranking of Carrier-Cited Obstacles to Short Sea Shipping Ventures in the Gulf of Mexico.
Obstacle Mentioned Priority Ranking Score
Frequency of service 14 Entrenched system 13 Jones Act 5 Lack of adequate port infrastructure 4 Lack of federal funds for start-up 4 Rate Wars 3 Cultural differences 3 Focus on wrong markets 3 Not enough cargo in 45 ft and 53 ft trailers that can be pulled off road
3
Differences between domestic & ocean containers
2
Lack of coordination between surface & maritime carriers
2
Transportation from Mexican ports to final destination very costly
2
Distance from port to final destination 1 Harbor Maintenance Tax 1
Several important themes begin to surface. One is that a shipper-oriented service is needed, with frequency of service being a very important component. This is consistent with much of the discussion taking place at seminars and in trade journals. Another element is the fact that there is already a well-entrenched border crossing infrastructure (both in terms of service and physical assets) that many people are comfortable with. To pull traffic away from this system will require a strong push to educate shippers, trucking companies, and logistics managers on the advantages of a cross-Gulf service. This implies that a service must be in place that has clear advantages for certain cargoes and destinations over surface transportation. It is important to note that to date truckers, shippers, and intermodal marketing companies have not been pushing short sea shipping very aggressively. It has been largely a government initiative. The Jones Act emerged as the third priority according to the score ranking, although of less relative importance than the top two concerns. The importance given the Jones Act is somewhat surprising. The Jones Act requires that cargo that has both its origin and destination in the United States must be handled by a U.S.-built, U.S.-owned, and U.S.-crewed vessel. Since cross-Gulf shipping is international in nature, it would seem that the Jones Act would only affect the ability of a foreign vessel to call on more than one port in the United States and thereby increase its revenue potential. This is a topic for future research. Two more themes seemed to receive equal attention: the lack of adequate port infrastructure (in Mexico) and a lack of federal funds for start-up. The first concern seems to include both the port and its connecting infrastructure. Where infrastructure needs to be developed, one consideration

48
to keep in mind is that it costs less to develop Ro/Ro infrastructure than it does Lo/Lo infrastructure; Ro/Ro only requires truck ramps, rather than cranes, and thus involves lower cost. The latter concern appeared to focus primarily on a desire for a ship-building subsidy or some kind of operating subsidy in the early years of operation. As stated earlier, interviewees were also asked about the potential actions that governmental entities could implement to promote more cross-Gulf shipping. These potential actions were identified as shown in Table 23.
Table 23. Carrier-Suggested Measures to Promote Short Sea Shipping Ventures in the Gulf of Mexico.
First Measure Second Measure Third Measure Facilitate interaction between Mexican shippers and the carriers
Allow exemption from Harbor Maintenance Tax
Use highway funds on short sea shipping infrastructure as congestion mitigation projects
Tax incentives for vessels and major capital assets
Have U.S. & Mexican Commerce Depts do marketing and public awareness campaigns (tied for 1) (public/government education and marketing)
Develop better market data (tied for 1)
Develop better market data Improve port infrastructure Further loosen trade restrictions
Exemption from HMT Help educate government officials and public (public/government education and marketing)
Obtain buy-in of border broker community and trucking companies
Federal funds for landside infrastructure away from crowded container terminals
Tax incentives for vessels and major capital assets
Change Title XI debt-to-equity ratios (federal shipbuilding assistance)
Provide grants for demonstration projects
Waive the Jones Act & Use highway funds on short sea shipping infrastructure as congestion mitigation projects
Develop capital construction funds for short sea shipping vessels
Change Title XI debt-to-equity ratios (federal shipbuilding assistance)
Provide grants for demonstration projects
Develop better market data Use highway funds on short sea shipping infrastructure as congestion mitigation projects

49
Table 24 shows the frequency with which each suggested measure is mentioned in Table 23.
Table 24. Frequency of Carrier-Suggested Measures to Promote Short Sea Shipping Ventures in the Gulf of Mexico.
Suggested Measure # of Times Ranked in Top 3
Use highway funds on short sea shipping infrastructure as congestion mitigation projects
3
Develop better market data 3 Change Title XI debt-to-equity ratios (federal shipbuilding assistance)
2
Tax incentives for vessels and major capital assets
2
Provide grants for demonstration projects 2 Exemption from Harbor Maintenance Tax 2 Public/government education and marketing 2 Facilitate interaction between Mexican shippers and the carriers
1
Improve port infrastructure 1 Further loosen trade restrictions 1 Exemption from Harbor Maintenance Tax 1 Help educate government officials and public 1 Obtain buy-in of border broker community and trucking companies
1
Federal funds for landside infrastructure away from crowded container terminals
1
Waive the Jones Act 1 Develop capital construction funds for short sea shipping vessels
1
In order to get another sense of the relative importance of these factors to the surveyed population, they were rank-scored in the same way as the obstacles. Table 25 shows the priority score ranking of the promotion measures identified in Table 24.

50
Table 25. Priority Score Ranking of Carrier-Suggested Measures to Promote Short Sea Shipping Ventures in the Gulf of Mexico.
Suggested Measure Priority Ranking Score
Develop better market data 9 Change Title XI debt-to-equity ratios (federal shipbuilding assistance)
5
Exemption from Harbor Maintenance Tax 5 Public/government education and marketing 5 Use highway funds on short sea shipping infrastructure as congestion mitigation projects
4
Tax incentives for vessels and major capital assets 4 Provide grants for demonstration projects 3 Facilitate interaction between Mexican shippers and the carriers
3
Obtain buy-in of border broker community and trucking companies
3
Develop capital construction funds for short sea shipping vessels
3
Improve port infrastructure 2 Federal funds for landside infrastructure away from crowded container terminals
2
Waive the Jones Act 1 Further loosen trade restrictions 1
Not all of the interviewees stated what actions could be taken to mitigate or eliminate the stated obstacles. Those who did respond seemed to focus on the need of providing better market data and that the governments of both countries need to work on making it available – especially data on the Mexican marketplace. Next, they focused on funding through modification of more favorable Title XI funding criteria and exemption from the Harbor Maintenance Tax, as well as application of highway funds for congestion mitigation projects, tax incentives for vessel construction and capital assets, and funding for demonstration projects. The carriers did not explain how additional funding will directly solve many of the obstacles they identified, but perhaps carriers feel that additional funds these measures would free up can be used to address those obstacles that are more directly in their ability – or the ability of those they work closely with – to participate, such as development of port infrastructure, use of start-up funds, or ability to conduct market assessments. Another measure of importance to the responders was a need to educate the public and the business community at large – especially those involved in border trade – on short sea shipping and its advantages.

51
FINDINGS – PORT PERSPECTIVES
The research team also contacted the ports that were involved in the cross-Gulf ventures identified in this report. Responses included in the analysis came from all but the Ports of Coatzacoalcos and Tampa. The ports serve as third party references since they are (were) actively involved with both the carriers and shippers involved in the ventures, and in some cases actively attempted to promote the venture. In order to see if nationality influenced perceptions of difficulties and potential remedies, the observations of the ports were separated by U.S. and Mexican ports. The observations of U.S. Ports on the obstacles are shown in Table 26.
Table 26. U.S. Port-Cited Obstacles to Short Sea Shipping Ventures in the Gulf of Mexico.
First Obstacle Second Obstacle Third Obstacle Lack of backhaul cargo Frequency of service Lack of adequate capitalization
Lack of preclearance procedures similar to Canada-U.S. trade
Lack of adequate security in Mexican ports
Entrenched border transfer system
Logistics manager resists change (entrenched system)
Frequency of service
Jones Act Frequency of service Port operations issues Trucking rates difficult to beat
Lack of backhaul cargo Transit times
Harbor Maintenance Tax Lack of federal assistance Jones Act Lack of federal funding for start-ups
Frequency of service Lack of backhaul cargo
Lack of backhaul cargo Lack of adequate port infrastructure
Jones Act

52
Table 27 shows the frequency with which each obstacle is mentioned in Table 26.
Table 27. Frequency of U.S. Port-Cited Obstacles to Short Sea Shipping Ventures in the Gulf of Mexico.
Obstacle Mentioned # of Times Ranked in Top 3
Frequency of service 4 Lack of backhaul cargo 4 Jones Act 3 Lack of federal funds for start-up 2 Entrenched system 2 Lack of adequate port infrastructure 1 Harbor Maintenance Tax 1 Lack of adequate capitalization/ working capital
1
Lack of preclearance procedures similar to Canada-U.S. trade
1
Lack of adequate security in Mexican ports
1
Port operations issues 1 Trucking rates difficult to beat 1 Transit times 1
In order to get another sense of the relative importance of these factors to the surveyed population, they were rank-scored in the same way as the obstacles mentioned by the carriers, as discussed previously. Table 28 shows the priority score ranking of the promotion measures identified in Table 27.

53
Table 28. Priority Score Ranking of U.S. Port-Cited Obstacles to Short Sea Shipping Ventures in the Gulf of Mexico.
Obstacle Mentioned Priority Ranking Score
Lack of backhaul cargo 9 Frequency of service 7 Jones Act 5 Lack of federal funds for start-up 5 Entrenched system 5 Harbor Maintenance Tax 3 Lack of adequate capitalization/ working capital
3
Trucking rates difficult to beat 3 Lack of adequate port infrastructure 2 Lack of preclearance procedures similar to Canada-U.S. trade
2
Lack of adequate security in Mexican ports
1
Port operations issues 1 Transit times 1
Mexican port responses are shown in Table 29.
Table 29. Mexican Port-Cited Obstacles to Short Sea Shipping Ventures in the Gulf of Mexico.
First Obstacle Second Obstacle Third Obstacle Frequency of service Lack of backhaul cargo Jones Act Lack of backhaul cargo Lack of adequate port
infrastructure Frequency of service
Surface transportation impediments
Frequency of service Jones Act (tied for 1) HMT (tied for 1) Table 30 shows the frequency with which each obstacle is mentioned in Table 29.

54
Table 30. Frequency of Mexican Port-Cited Obstacles to Short Sea Shipping Ventures in the Gulf of Mexico.
Obstacle Mentioned # of Times Ranked in Top 3
Frequency of service 3 Lack of backhaul cargo 2 Jones Act 2 Lack of adequate port infrastructure 1 Harbor Maintenance Tax 1 Surface transportation impediments 1
In order to get another sense of the relative importance of these factors to the surveyed population, they were rank-scored in the same way as the obstacles mentioned by the carriers, as discussed previously. Table 31 shows the priority score ranking of the promotion measures identified in Table 30.
Table 31. Priority Score Ranking of Mexican Port-Cited Obstacles to Short Sea Shipping
Ventures in the Gulf of Mexico.
Obstacle Mentioned Priority Ranking Score
Frequency of service 7 Lack of backhaul cargo 5 Jones Act 4 Surface transportation impediments 3 Harbor Maintenance Tax 3 Lack of adequate port infrastructure 2
U.S. ports seemed to focus on the difficulty in attracting a backhaul (Mexico to U.S.) cargo and frequency of service (flexibility for the shipper). The former is interesting from the perspective that it was not a major concern of the carriers who were actively involved in the business. This would seem to indicate that the ports detected an imbalance in the direction of cargo flows, but the carriers were attempting to compensate for it with their rate structure and did not see it as a serious impediment to maintaining a profitable service. The latter issue of frequency of service echoes what the carriers stated—it is necessary to offer the shipper a high frequency of service in order to provide the shipper with flexibility. U.S. ports also believe that the Jones Act is an impediment to trade. As discussed in the analysis of carrier responses, the Jones Act makes it impossible for foreign vessels to include more than one U.S. port in their rotation, which would provide opportunities to smooth out revenue flows and generate more cargo. U.S. ports also cited lack of federal funding support as a serious impediment. Carriers also cited this as a serious obstacle, although they ranked several others as more severe. Finally, U.S. ports ranked a well-entrenched border crossing infrastructure as an obstacle, but not as highly as carriers did.
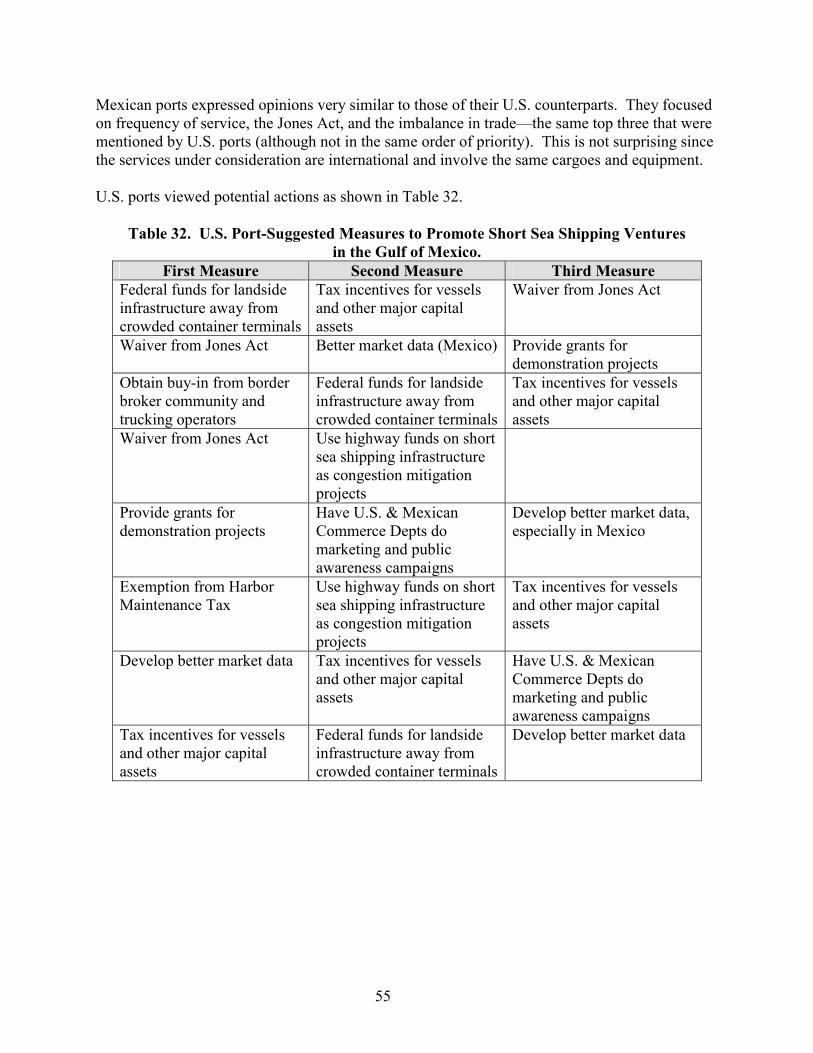
55
Mexican ports expressed opinions very similar to those of their U.S. counterparts. They focused on frequency of service, the Jones Act, and the imbalance in trade—the same top three that were mentioned by U.S. ports (although not in the same order of priority). This is not surprising since the services under consideration are international and involve the same cargoes and equipment. U.S. ports viewed potential actions as shown in Table 32.
Table 32. U.S. Port-Suggested Measures to Promote Short Sea Shipping Ventures in the Gulf of Mexico.
First Measure Second Measure Third Measure Federal funds for landside infrastructure away from crowded container terminals
Tax incentives for vessels and other major capital assets
Waiver from Jones Act
Waiver from Jones Act Better market data (Mexico) Provide grants for demonstration projects
Obtain buy-in from border broker community and trucking operators
Federal funds for landside infrastructure away from crowded container terminals
Tax incentives for vessels and other major capital assets
Waiver from Jones Act Use highway funds on short sea shipping infrastructure as congestion mitigation projects
Provide grants for demonstration projects
Have U.S. & Mexican Commerce Depts do marketing and public awareness campaigns
Develop better market data, especially in Mexico
Exemption from Harbor Maintenance Tax
Use highway funds on short sea shipping infrastructure as congestion mitigation projects
Tax incentives for vessels and other major capital assets
Develop better market data Tax incentives for vessels and other major capital assets
Have U.S. & Mexican Commerce Depts do marketing and public awareness campaigns
Tax incentives for vessels and other major capital assets
Federal funds for landside infrastructure away from crowded container terminals
Develop better market data

56
Table 33 shows the frequency with which each suggested measure is mentioned in Table 32.
Table 33. Frequency of U.S. Port-Suggested Measures to Promote Short Sea Shipping Ventures in the Gulf of Mexico.
Suggested Measure # of Times Ranked in Top 3
Tax incentives for vessels and major capital assets
5
Develop better market data 4 Federal funds for landside infrastructure away from crowded container terminals
3
Waive the Jones Act 3 Have U.S. & Mexican Commerce Depts do marketing and public awareness campaigns
2
Use highway funds on short sea shipping infrastructure as congestion mitigation projects
2
Provide grants for demonstration projects
2
Allow exemption from Harbor Maintenance Tax
1
Obtain buy-in from border broker community and trucking operators
1
In order to get another sense of the relative importance of these factors to the U.S. port population, they were rank-scored in the same way as the obstacles. Table 34 shows the priority score ranking of the promotion measures identified in Table 33.

57
Table 34. Priority Ranking Score of U.S. Port-Suggested Measures to Promote Short Sea Shipping Ventures in the Gulf of Mexico.
Suggested Measure Priority Ranking Score
Tax incentives for vessels and major capital assets
9
Develop better market data 7 Federal funds for landside infrastructure away from crowded container terminals
7
Waive the Jones Act 7 Use highway funds on short sea shipping infrastructure as congestion mitigation projects
4
Provide grants for demonstration projects
4
Have U.S. & Mexican Commerce Depts do marketing and public awareness campaigns
3
Allow exemption from Harbor Maintenance Tax
3
Obtain buy-in from border broker community and trucking operators
3
There was not as much feedback from Mexican ports. The feedback received can be summarized as shown in Table 35.
Table 35. Mexican Port-Suggested Measures to Promote Short Sea Shipping Ventures in the Gulf of Mexico.
First Measure Second Measure Third Measure Tax incentives for vessels and other major capital assets
Develop Capital Construction Fund for short sea shipping vessels
Change Title XI debt-to-equity ratios (federal shipbuilding assistance)
Tax incentives for vessels and other major capital assets
Have U.S. & Mexican Commerce Depts do marketing and public awareness campaigns
Use highway funds on short sea shipping infrastructure as congestion mitigation projects
Government funds for infrastructure (terminals) dedicated to short sea shipping
Waiver from Jones Act Exemption from Harbor Maintenance Tax
Tax incentives for vessels and other major capital assets

58
Table 36 shows the frequency with which each suggested measure is mentioned in Table 35. Table 36. Frequency of Mexican Port-Suggested Measures to Promote Short Sea Shipping
Ventures in the Gulf of Mexico.
Suggested Measure # of Times Ranked in Top 3
Tax incentives for vessels and major capital assets 3 Allow exemption from Harbor Maintenance Tax 1 Have U.S. & Mexican Commerce Depts do marketing and public awareness campaigns
1
Waive the Jones Act 1 Use highway funds on short sea shipping infrastructure as congestion mitigation projects
1
Change Title XI debt-to-equity ratios (federal shipbuilding assistance
1
Develop Capital Construction Fund for short sea shipping vessels
1
Government funds for infrastructure (terminals) dedicated to short sea shipping
1
In order to get another sense of the relative importance of these factors to the U.S. port population, they were rank-scored in the same way as the obstacles. Table 37 shows the priority score ranking of the promotion measures identified in Table 36. Table 37. Priority Ranking Score of Mexican Port-Suggested Measures to Promote Short
Sea Shipping Ventures in the Gulf of Mexico.
Suggested Measure Priority Ranking Score
Tax incentives for vessels and major capital assets 7 Waive the Jones Act 3 Government funds for infrastructure (terminals) dedicated to short sea shipping
3
Allow exemption from Harbor Maintenance Tax 2 Have U.S. & Mexican Commerce Depts do marketing and public awareness campaigns
2
Develop Capital Construction Fund for short sea shipping vessels
2
Use highway funds on short sea shipping infrastructure as congestion mitigation projects
1
Change Title XI debt-to-equity ratios (federal shipbuilding assistance
1

59
It is interesting to note that the responses from ports on both sides of the border seemed to focus heavily on tax incentives for vessels and major capital assets. Beyond that the comments seemed to concentrate more on what the United States government should do (Jones Act, Harbor Maintenance Tax, etc.) as opposed to what the Mexican government should do. It also seemed to be a common concern that regardless of the specific action taken by government, there is a need to channel more of the resources dedicated to highway infrastructure (and related tasks) into infrastructure that would facilitate routes selected for short sea shipping with respect to cross-border transportation, thereby developing a critical mass. U.S. ports placed a high priority on acquiring better market data (especially for Mexico) as a remedy for the problem of backhaul cargoes or overall lack of cargoes. Both they and their Mexican counterparts would like to see the two governments do more marketing and public awareness campaigns on behalf of short sea (or cross-Gulf) shipping. Finally, U.S. ports tend to see a waiver from Jones Act requirements as a desirable measure, and Mexican ports tend to agree. It is also interesting to note several potential obstacles that were not mentioned by the parties interviewed: cost of labor (at least in U.S. ports), availability and cost of land for expansion, and fragmentation of responsibility among a myriad of agencies in the U.S. Federal government. This is not to say that they are not important issues, but they did not rank in the top three with any of the respondents. In all of the discussion with the various parties, the size of the port did not seem to matter. Obstacles and potential remedies seemed to focus on cargo carriers and on certain systemic issues. This would seem to indicate that the door is open to a wide variety of ports to participate in cross-Gulf shipping, especially on the U.S. side with its denser coverage and wide variety of facilities. Responses seemed to indicate that it was more a matter of the carrier’s equipment and operating philosophy than it was the ability of the port to handle the cargo transfers.
LESSONS LEARNED ELSEWHERE
It is instructive to look at what has been attempted and accomplished in the area of short sea shipping in other regions of the United States (and to some degree Europe) to see what lessons are transferable to enhancing or developing cross-Gulf shipping services. Columbia Coastal Transport LLC has been held out as an example of a successful domestic short sea shipping carrier that might serve as a model for similar ventures. Columbia’s experience has been primarily with international cargo that moves domestically in feeder service for various steamship lines. Columbia strongly prefers using ocean containers as opposed to Ro/Ro cargo, because ocean containers can be stacked, thereby increasing utilization of limited cargo space. (Some would argue that the fact that truck trailers cannot be stacked is offset by the reduced time needed to load and discharge the vessel.) Columbia’s management has stated that public resources will be required to expand on short sea shipping, because private industry is already moving as much freight as it deems economically viable. Columbia’s opinion is that the social benefits (i.e., safety, reduced pollution, congestion alleviation, etc.) merit government support.

60
Conversely, Columbia’s New York to Albany service (commonly referred to as the Port-Inland Distribution Network, or PIDN) has struggled somewhat. It currently carries 60 to 80 containers a week. China Ocean Shipping Company (COSCO) uses the service to reposition empty containers, as does Zim. Evergreen is expected to follow suit. In order to promote higher utilization, the Port of New York/New Jersey has dropped its container handling rate from $425 to $350. The Port of Albany is offering $25 for each import or export container handled in Albany and is offering free container storage. Whether ports or state governments in the Gulf of Mexico region would be willing to implement such subsidies remains to be seen. Another example of successful short sea shipping is found in the 120 barges and motor tankers that daily carry between 1.2 million and 1.9 million bbl of petroleum products from refineries and oil terminals in New York harbor and the Delaware River to points ranging from the New Jersey seaboard to eastern Maine. A new voyage commences about every 48 minutes, 365 days a year. This may have limited applicability to the cross-Gulf scenario. It was outside the scope of the study to determine if the service that American Eagle Tankers provides already effectively services all or most of the market demand or whether there is room for additional service providers in the Gulf. A quick glance at the European experience is also useful. While much has been made of using the European system as a model in the United States, caution is in order. There are distinctive differences between the two systems. Europe offers more short sea opportunities geographically (more seas, islands, viable rivers, etc.), while the U.S. has focused mainly on north-south trade along the Mississippi/Ohio River system as its single most important option. European trade was developed primarily to facilitate the movement of freight between countries and to be compatible with rail and truck transportation—containers came later. Development of the system in Europe was not driven by trade between Europe and other regions—it is primarily an “intra-regional” system. The U.S. is narrowly focused on hub and spoke systems, which implies dependence on over-the-road trailers and on major domestic truck lines. That said, the European experience has something to offer. Their experience has shown that short sea shipping really begins to show its advantages only when the shipping distance exceeds 500 km (or 310 miles). This is primarily because there must be enough of a shipment distance by water to offset the extra expense on the land side due to extra handling of the cargo on and off the vessel. The interviews and literature used in this report provide a similar finding, although the minimum distance could arguably be greater. In practice this means that the Mexican market would be restricted to central and southern Mexico. Also, short sea cargo in Europe is mainly bulk and general cargo, rather than container cargo. Those barges that do handle containers typically have a capacity of 176 TEUs, although smaller barges of 28 to 40 TEUs are increasing in number as attempts are made to push services farther inland.59
59 Wiezorke, Dr. Christiane, Innovative Technologies for Intermodal Transfer Points, PTV Planung Transport,
Verkehr AG, February 2002, pp. 23-24. (available at http://www.eutp.org/download/itip/D2/D2-final.doc).

61
LESSONS LEARNED FROM CROSS-GULF VENTURES: SUCCESSES
We have explored lessons that may be applied to cross-Gulf ventures from short sea shipping ventures in other geographic locations. While certain examples have been highly publicized, the success of these ventures, at least to date, appears to be extremely limited. In contrast, of the 21 services identified in our report, at least five cross-Gulf ventures have realized success since 1990, with four remaining in current operation today. NYK – Bulk successfully operated what was intended to be a short-term venture to alleviate problems experienced with cross-border rail traffic in 1999-2000. The four services that are still operating are American Eagle Tankers (AET), CG Railway (CGR), Industrial Maritime Carriers (IMC), and Línea Peninsular (LP). From these successful ventures, we can distill a number of “lessons learned” that may be transferable to other short sea shipping ventures in the Gulf or other geographic regions. Common practices among these carriers include operating in a niche market and limiting the variety of cargo, and meeting very specific needs using adequately sized and outfitted vessels. They also developed secure market bases in their operations and appear to schedule vessel sailings on a “frequent” and regular basis (perhaps they are able to do this as a result of their success in operations). Not all factors were able to be identified for all carriers, but in these cases, consistent patterns emerge.
Niche market and limited variety of cargo. Successful carriers in the cross-Gulf shipping ventures discussed in this analysis focused on transport for specific, niche markets. This may be because of specialized experience to meet a particular need, relationships between the carriers and shippers, or other factors. Meets specific needs using adequately sized/outfitted vessels. Experience of three cross-Gulf shipping ventures (CGR, IMC, LP) seems to indicate that smaller lot sizes are ideal, or at least, what the market can bear. Small lots (5,000 tons or less) are difficult to match up with conventional vessels and services. Such shipments are typically placed in a separate hold and only part of the hold is filled. Furthermore, handling costs are high on a per unit basis. Appropriately scaled vessels and landside operations would have a competitive advantage for the smaller lots. In two cases (AET, NYK), larger vessels were used. Developed secure market bases in their operations. In several cases, it appears that the carriers not only operated in niche markets, but they also developed practically “exclusive” services or at least were able to “lock in” significant portions of very broad market bases. Vessel sailings scheduled on a “frequent,” regular, or competitive basis. While it is difficult to define what exactly a “frequent” sailing schedule is, the successful cross-Gulf carriers appear to have at least a weekly frequency (or greater) to their sailing schedules, with a regularity that meets shipper needs, or provides a level of competitive advantage significantly greater than that available from landside modes. Services provided to shippers. Information about three of the five successful cross-Gulf shippers indicates that they provide particular services for shippers or makes some note of how they provide high quality customer service by meeting specific shipper needs or demands.
Table 38 shows these factors, along with the carriers that utilized these factors and how that utilization was applied.

62
Table 38. Factors Contributing to the Success of Cross-Gulf Shipping Ventures. FACTOR CARRIER APPLICATION
AET Operates lightering and charter tankers for crude/petroleum transport.
CGR Transports primarily rail cars. IMC Focuses on breakbulk, project, and heavy-lift cargo.
LP Handles containers for textile industry and oil-field service cargo.
Niche market and limited variety of cargo
NYK Handled automobiles for single auto manufacturer.
AET Uses lightering tankers, most of approximately 100,000 DWT capacity.
CGR Uses two converted semi-submersible LASH vessels (585’ long, with a carrying capacity of 60 railcars each on eight sets of tracks).
LP Uses 5 small vessels (ranging in size from 2,300 deadweight tons to 3,000 DWT).
Meets specific needs using adequately sized / outfitted vessels
NYK Used autocarrier Ro/Ro’s of approximately 25,000 to 27,000 Gross Registered Tons (10,500 to 10,900 Deadweight Tons).
AET Interfaces with major refining centers and interstate pipeline networks in Louisiana and Texas.
CGR Has interline agreements with four trunkline railroads, allowing direct shipments without changing rail lines.
LP
Company claims to carry 100 percent of the shipments for “807” manufacturing businesses in the Yucatán; controls its own fleet of trucks in U.S. and Mexico.
Developed secure market bases in their operations
NYK Provided only feasible alternative to rail routes between Veracruz and Corpus Christi.
CGR
Company information states it can make the trip from Mobile to Coatzacoalcos 10 to 14 days faster than by overland transportation, and cites advantages of multi-vessel sailings and frequency (although specifics were not provided).
IMC Weekly service between Houston and Progreso.
LP Four round trips weekly between Port Bienville and Progreso.
Vessel sailings scheduled on a “frequent”, regular, or competitive basis
NYK Service more competitive than rail carrier facing equipment shortage could provide.
CGR Shipper can send cargo from southern Mexico to Northeast or Midwest U.S. and Canada without interchanges; Offers a single bill of lading.
LP Promises four-day door-to-door deliveries between the Yucatán Peninsula and the United States.
Services provided to shippers
NYK 50,000 units were handled with no damage.

63
LESSONS LEARNED FROM CROSS-GULF VENTURES: FAILURES
Based partially on press reports and partially on personal interviews, the research team was able to identify several major causes for the discontinuance of 16 of the 21 ventures. They include the following:
Competition from other modes, particularly railroads (rate wars). In the case of Americas Marine Express, the railroads were able to effectively compete for traffic on the Memphis to New Orleans stretch by lowering their rates and thereby making it difficult to operate the marine service profitably. In other cases, existing trucking options proved to be more competitive both in terms of time and rates. Sweeping changes in the railroad industry on both sides of the border. Consolidations in the U.S. and privatization in Mexico provided rail service providers with new options that did not exist previously. Connections that were designed to compensate for lack of a border crossing or to address interline efficiencies were no longer needed. Additionally, the administrative and financial burden of making such sweeping changes made it almost impossible for management of previously interested railroads to focus on new short sea shipping ventures as priority business activities. Lack of working capital. In some cases, the enterprise simply did not have the financial resources to make it through the start-up period. Inability to attract sufficient cargo. The inability to attract cargo seems to be rooted in several causes. In some cases, there was insufficient market research to know what cargoes to pursue. In other cases, the vessel chosen for the service was either oversized or improperly configured for the market it was serving. Some services were aborted before they began operations because of a determination that there was not sufficient demand in the market they were targeting. Finally, some services simply did not have the resources to market their service effectively. Lack of equipment. In order to reduce capital requirements, certain ventures time chartered their vessels. When the charter expired they were unable to negotiate a new charter for the vessel or find a suitable replacement. Inefficiencies in Mexico. At the time that some ventures were starting up (or intending to start up) there were costs and inefficiencies at their targeted Mexican ports of call that prevented them from offering the rates they wanted to offer. (It should be noted that in some cases, the concerns have been addressed, but they were important issues at the time.) Lack of services. It appears—both from our primary research and from press reports—that many services have failed due in large part to lack of frequency and flexibility. Trucking lines, railroads, and 3PLs (third party logistics providers), seem to have an inherent market advantage over potential cross-Gulf services. These companies have a history of talking directly with and usually getting the original bill of lading from the shippers. Without prior experience in this area, it could be very expensive and time consuming for barge operators and short sea shipping service providers to replace this service level. One possible solution, evidenced in successes of some cross-Gulf ventures cited above, may be to view short sea shipping as a component of an integrated logistics chain –part of a door-to-door solution, rather than perceived as competitors in head-to-head competition. Another suggestion might be to view trucking lines, railroads, and 3PLs as the primary customers, in addition to consideration of the ultimate shipper as the client.

64
ADDITIONAL RESEARCH NEEDS
Several of the factors mentioned by ports, individuals, and carriers merit future study and investigation. For instance, it would be useful to potential start-up investors to know the status of Mexican infrastructure (especially landside connections) and the plans the Mexican government has for infrastructure investment related to the more active ports. While there is general agreement that it is improving, more details on exactly what is being done and how quickly would be very helpful. It would also be useful to further examine exactly how the two governments could work together to produce the market data that cross-Gulf operators indicate they need. Even with the enactment of all the potential measures identified by the various parties, without good market data, start-up ventures are still being required to make decisions based on intuition or “gut feel” rather than reliable information. The U.S. is just now opening its highways to Mexican trucks as agreed under NAFTA. It remains to be seen whether Mexican owner/operators will see this as an opportunity they should pursue or if the current transportation system will remain the preferred mode of operation. Should Mexican owners/operators decide to penetrate the U.S. market, this could have an effect on the viability of cross-Gulf shipping operations. The effects of the opening of the U.S. to Mexican trucks on the entire binational system need to be evaluated. Finally, research needs to be conducted into how the governments of Mexico and the United States could work together to influence the development of infrastructure toward maritime shipments to a greater degree than they do today. While the two governmental systems and approaches are markedly different, a binational approach to developing infrastructure on both sides of the border could have a profound influence on how that infrastructure is oriented.
CONCLUSION
A common theme across all respondents was that frequency of service (flexibility of scheduling) is crucial to the success of cross-Gulf services. The inability to establish a high enough frequency has been a severe limiting factor on the success of such ventures. Carriers have experienced difficulty in convincing shippers and logistics managers to pull away from a well-established and entrenched cross-border transportation system. They see a role for the government to assist in promoting the maritime option. One way would be to promote the construction of infrastructure related to cross-Gulf (short sea) shipping, either by using funds previously dedicated to highways or by establishing grants to enable construction. The Jones Act requirements were also mentioned by all parties, but political realities seem to make this the most difficult obstacle to change. Respondents from both countries indicated that lack of market data, especially in Mexico, is a big obstacle, and one which the two governments should actively seek to remove. This could be done in conjunction with an effort by both governments to promote the use of maritime

65
transportation as an alternative to border crossings. These activities could help generate new transportation opportunities and help reduce the impact of the lack of backhaul cargoes. Respondents believe there is a role for government to play. It is obvious that they will have to work with trucking lines, railroads, and third party logistics providers to get the government involved and to set up a viable system. This system should focus on small lot sizes (less than 5,000 tons). Furthermore, given the distance a service must cover to be able to compete economically with surface transportation in terms of the total shipment cost, it should target the central and southern regions of Mexico as the most appropriate southern ports of call, if the European experience is any indicator. Finally additional research is indicated. This might focus on the following topics, among others:
the status of Mexican infrastructure (especially landside connections) and the plans the Mexican government has for infrastructure investment related to the more active ports, a method for the two governments to work together to produce the market data that cross-Gulf operators indicate they need, including an analysis of trade opportunities with central and southern Mexico, the effects of the opening of the U.S. to Mexican trucks, especially as they relate to the competitiveness of cross-Gulf shipping, a way for the governments of Mexico and the United States to work together to influence the development of infrastructure toward maritime shipments to a greater degree than they do today, the outlook for future trade between the U.S. and Mexico, with particular attention to infrastructure capacity, economics, and market constraints, and comparison of U.S.-Mexico short sea shipping with U.S.-Caribbean shipping.