sydney nsw 2000 australia gpo box 4173 sydney nsw 2001 tel … · · 2016-02-21chep north america...
TRANSCRIPT
22 February 2016 The Manager - Listings Australian Securities Exchange Limited Exchange Centre 20 Bridge Street SYDNEY NSW 2000
Via electronic lodgement Dear Sir / Madam COPIES OF SLIDES FOR WEBCAST At 10.15am AEDT today, Tom Gorman, Chief Executive Officer and Zlatko Todorcevski, Chief Financial Officer, will webcast a presentation of Brambles’ results for the half-year ended 31 December 2015. The slides for that webcast presentation are enclosed. The slides and webcast will be available on the Brambles’ website at www.brambles.com. Yours faithfully Brambles Limited Robert Gerrard Group Company Secretary
Brambles LimitedABN 89 118 896 021
Level 40 Gateway 1 Macquarie PlaceSydney NSW 2000 Australia
GPO Box 4173 Sydney NSW 2001Tel +61 2 9256 5222 Fax +61 2 9256 5299
www.brambles.com
For
per
sona
l use
onl
y

This page has intentionally been left blank
For
per
sona
l use
onl
y
Half-Year 2016 Results
22 February 2016
Overview and Results Highlights
Tom Gorman, CEO
2
For
per
sona
l use
onl
y
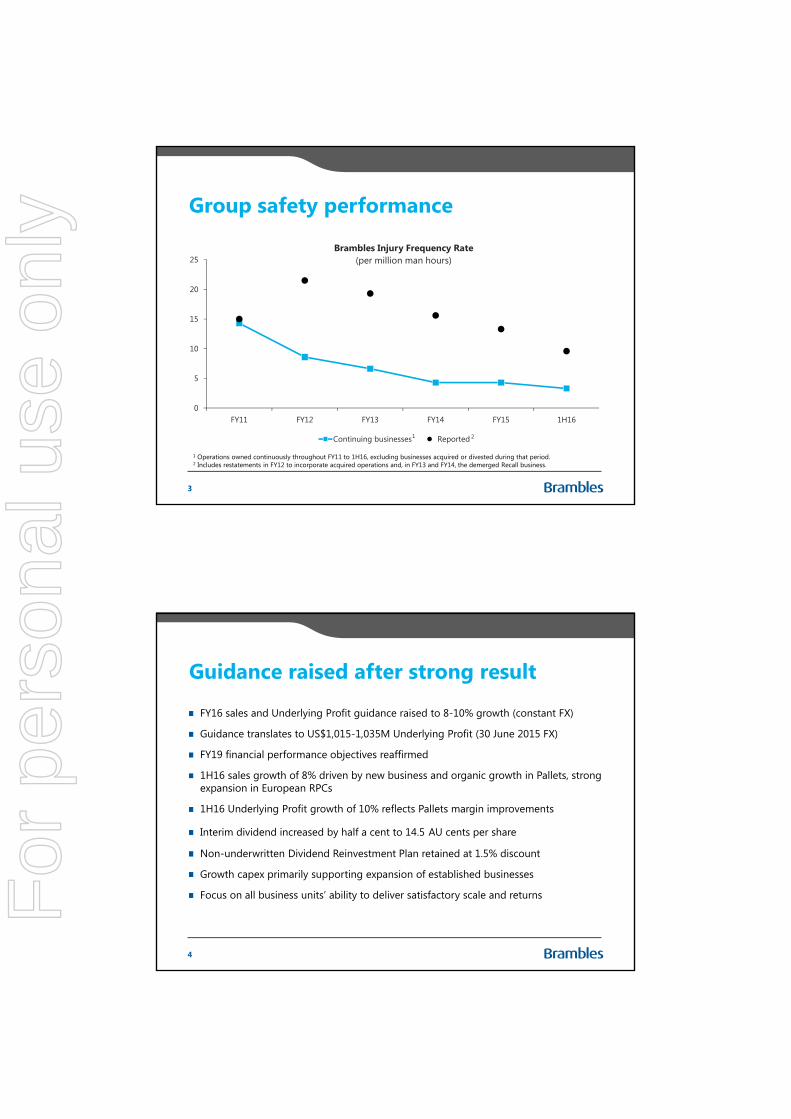
Group safety performance
0
5
10
15
20
25
FY11 FY12 FY13 FY14 FY15 1H16
Brambles Injury Frequency Rate (per million man hours)
Continuing businesses Reported
3
1 Operations owned continuously throughout FY11 to 1H16, excluding businesses acquired or divested during that period.2 Includes restatements in FY12 to incorporate acquired operations and, in FY13 and FY14, the demerged Recall business.
1 2
Guidance raised after strong result
FY16 sales and Underlying Profit guidance raised to 8-10% growth (constant FX)
Guidance translates to US$1,015-1,035M Underlying Profit (30 June 2015 FX)
FY19 financial performance objectives reaffirmed
1H16 sales growth of 8% driven by new business and organic growth in Pallets, strong expansion in European RPCs
1H16 Underlying Profit growth of 10% reflects Pallets margin improvements
Interim dividend increased by half a cent to 14.5 AU cents per share
Non-underwritten Dividend Reinvestment Plan retained at 1.5% discount
Growth capex primarily supporting expansion of established businesses
Focus on all business units’ ability to deliver satisfactory scale and returns
4
For
per
sona
l use
onl
y
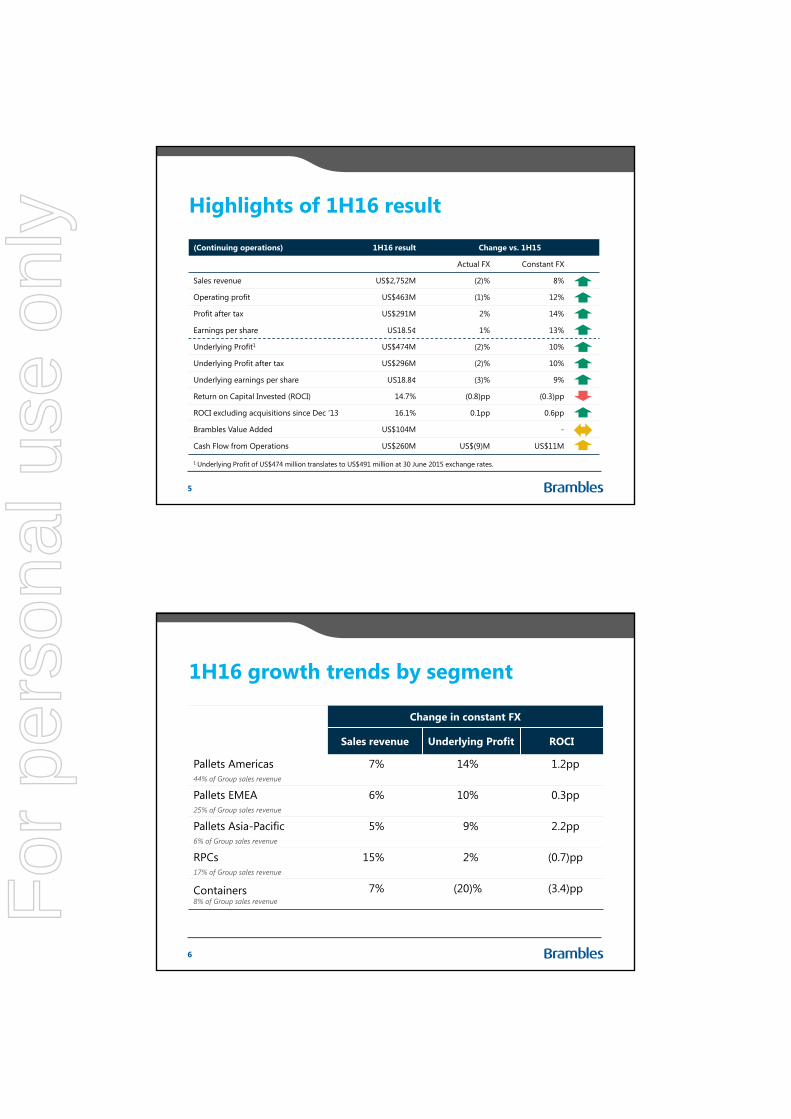
Highlights of 1H16 result
(Continuing operations) 1H16 result Change vs. 1H15
Actual FX Constant FX
Sales revenue US$2,752M (2)% 8%
Operating profit US$463M (1)% 12%
Profit after tax US$291M 2% 14%
Earnings per share US18.5¢ 1% 13%
Underlying Profit1 US$474M (2)% 10%
Underlying Profit after tax US$296M (2)% 10%
Underlying earnings per share US18.8¢ (3)% 9%
Return on Capital Invested (ROCI) 14.7% (0.8)pp (0.3)pp
ROCI excluding acquisitions since Dec ‘13 16.1% 0.1pp 0.6pp
Brambles Value Added US$104M -
Cash Flow from Operations US$260M US$(9)M US$11M
5
1 Underlying Profit of US$474 million translates to US$491 million at 30 June 2015 exchange rates.
1H16 growth trends by segment
Change in constant FX
Sales revenue Underlying Profit ROCI
Pallets Americas44% of Group sales revenue
7% 14% 1.2pp
Pallets EMEA25% of Group sales revenue
6% 10% 0.3pp
Pallets Asia-Pacific6% of Group sales revenue
5% 9% 2.2pp
RPCs17% of Group sales revenue
15% 2% (0.7)pp
Containers8% of Group sales revenue
7% (20)% (3.4)pp
6
For
per
sona
l use
onl
y
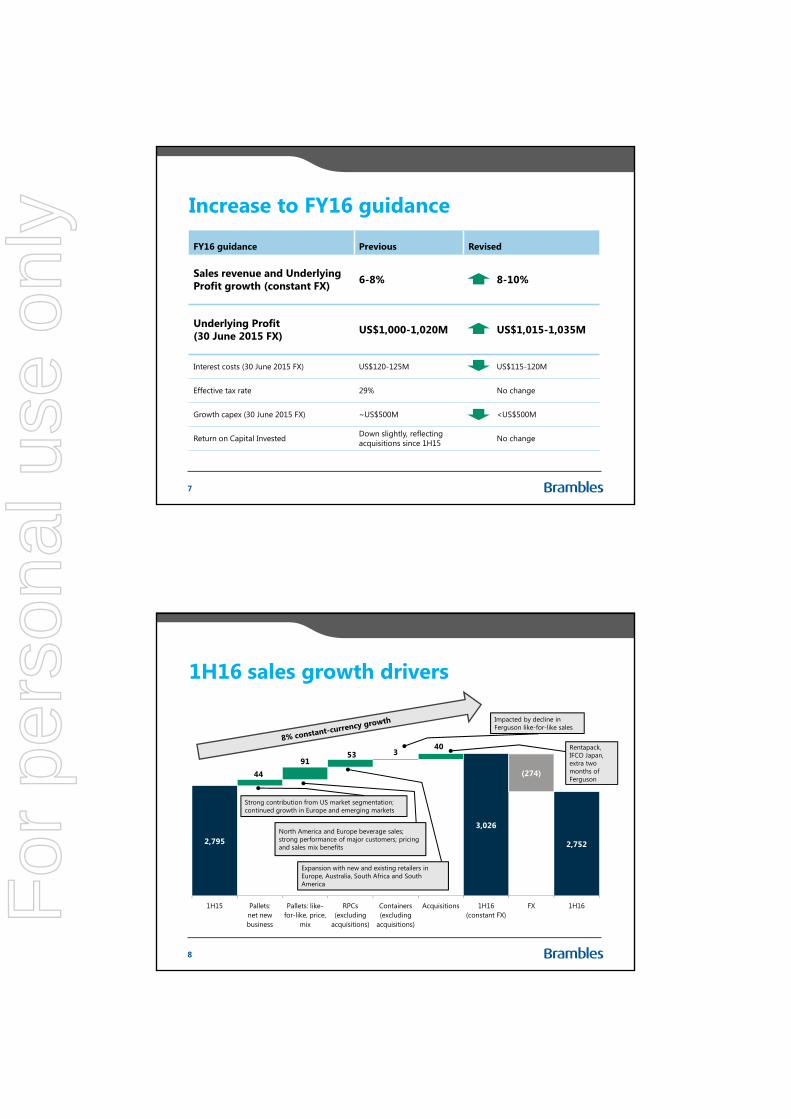
Increase to FY16 guidance
FY16 guidance Previous Revised
Sales revenue and Underlying Profit growth (constant FX) 6-8% 8-10%
Underlying Profit(30 June 2015 FX) US$1,000-1,020M US$1,015-1,035M
Interest costs (30 June 2015 FX) US$120-125M US$115-120M
Effective tax rate 29% No change
Growth capex (30 June 2015 FX) ~US$500M <US$500M
Return on Capital Invested Down slightly, reflecting acquisitions since 1H15 No change
7
1H16 sales growth drivers
2,795
3,026
2,752
4491
53 340
(274)
1H15 Pallets:net newbusiness
Pallets: like-for-like, price,
mix
RPCs(excluding
acquisitions)
Containers(excluding
acquisitions)
Acquisitions 1H16(constant FX)
FX 1H16
8
Strong contribution from US market segmentation; continued growth in Europe and emerging markets
North America and Europe beverage sales;strong performance of major customers; pricing and sales mix benefits
Expansion with new and existing retailers in Europe, Australia, South Africa and South America
Impacted by decline in Ferguson like-for-like sales
Rentapack, IFCO Japan, extra two months of Ferguson
For
per
sona
l use
onl
y
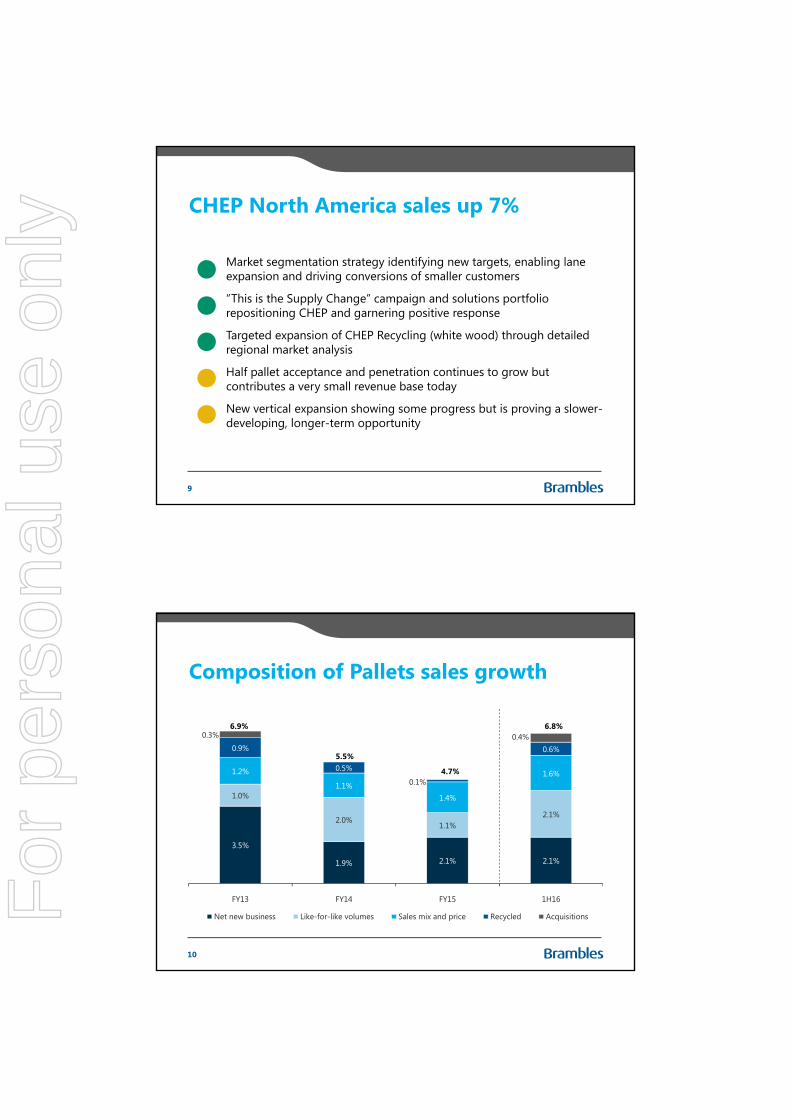
CHEP North America sales up 7%
Market segmentation strategy identifying new targets, enabling lane expansion and driving conversions of smaller customers
“This is the Supply Change” campaign and solutions portfolio repositioning CHEP and garnering positive response
Targeted expansion of CHEP Recycling (white wood) through detailed regional market analysis
Half pallet acceptance and penetration continues to grow but contributes a very small revenue base today
New vertical expansion showing some progress but is proving a slower-developing, longer-term opportunity
9
Composition of Pallets sales growth
3.5%
1.9% 2.1% 2.1%
1.0%
2.0%1.1%
2.1%
1.2%
1.1%1.4%
1.6%
0.9%
0.5%
0.1%
0.6%
0.3% 0.4%
FY13 FY14 FY15 1H16
Net new business Like-for-like volumes Sales mix and price Recycled Acquisitions
6.9%
5.5%
4.7%
6.8%
10
For
per
sona
l use
onl
y
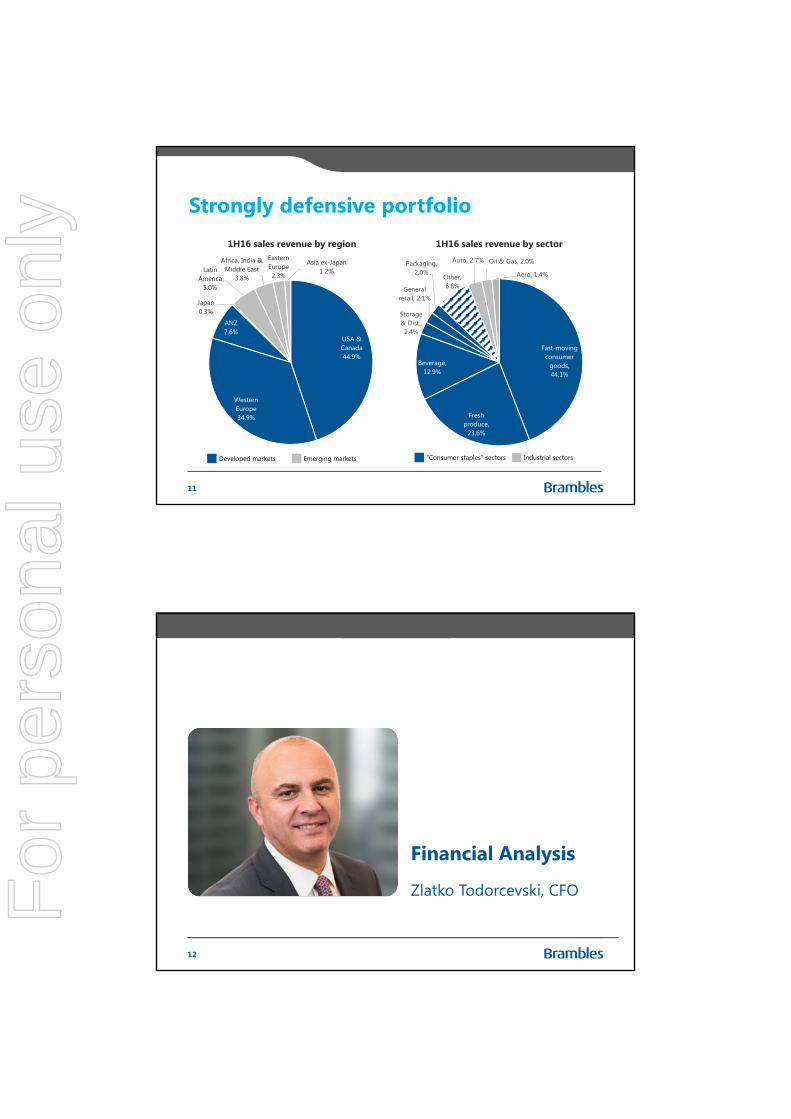
Strongly defensive portfolio
USA & Canada44.9%
Western Europe34.9%
ANZ7.6%
Japan0.3%
Latin America
5.0%
Africa, India & Middle East
3.8%
Eastern Europe2.3%
Asia ex-Japan1.2%
1H16 sales revenue by region
Fast-moving consumer
goods, 44.1%
Fresh produce,
23.6%
Beverage, 12.9%
Storage & Dist., 2.4%
General retail, 2.1%
Packaging, 2.0%
Other, 6.8%
Auto, 2.7% Oil & Gas, 2.0%
Aero, 1.4%
1H16 sales revenue by sector
11
Developed markets Emerging markets “Consumer staples” sectors Industrial sectors
Financial Analysis
Zlatko Todorcevski, CFO
12
For
per
sona
l use
onl
y
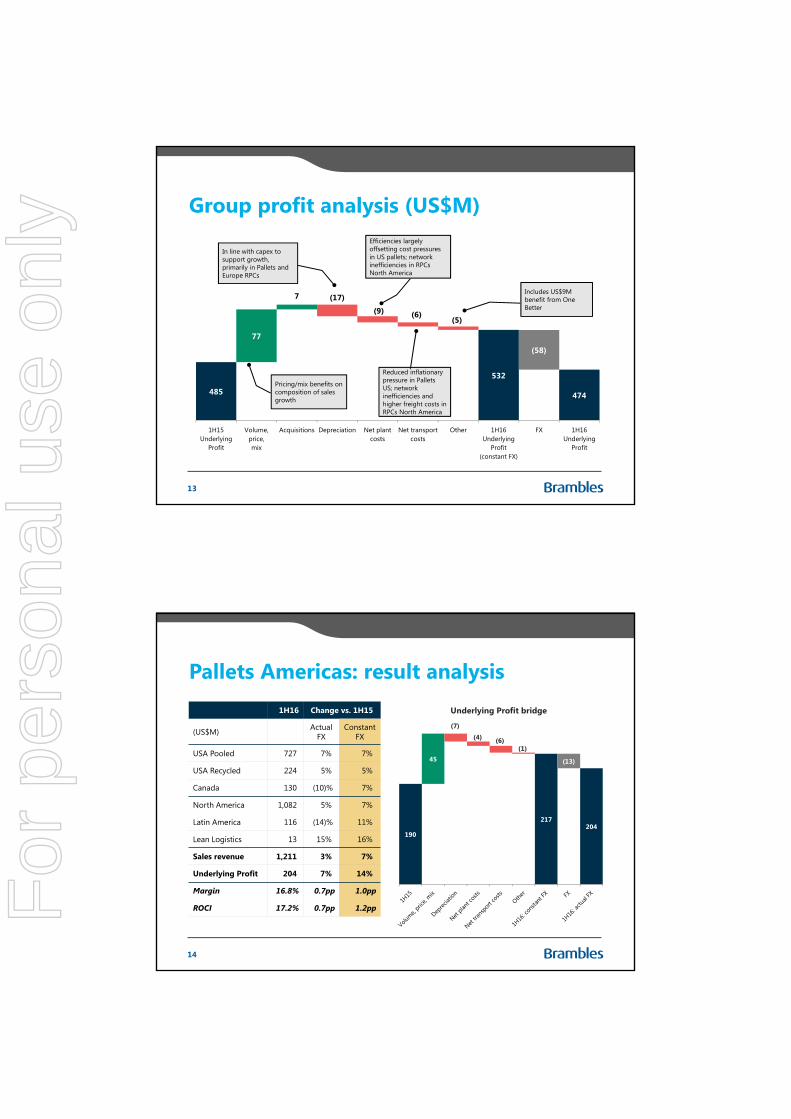
Group profit analysis (US$M)
13
485
532
474
77
7 (17)
(9) (6)(5)
(58)
1H15Underlying
Profit
Volume,price,mix
Acquisitions Depreciation Net plantcosts
Net transportcosts
Other 1H16Underlying
Profit(constant FX)
FX 1H16Underlying
Profit
In line with capex to support growth, primarily in Pallets and Europe RPCs
Includes US$9M benefit from One Better
Reduced inflationary pressure in Pallets US; network inefficiencies and higher freight costs in RPCs North America
Pricing/mix benefits on composition of sales growth
Efficiencies largely offsetting cost pressures in US pallets; network inefficiencies in RPCs North America
Pallets Americas: result analysis1H16 Change vs. 1H15
(US$M) Actual FX
Constant FX
USA Pooled 727 7% 7%
USA Recycled 224 5% 5%
Canada 130 (10)% 7%
North America 1,082 5% 7%
Latin America 116 (14)% 11%
Lean Logistics 13 15% 16%
Sales revenue 1,211 3% 7%
Underlying Profit 204 7% 14%
Margin 16.8% 0.7pp 1.0pp
ROCI 17.2% 0.7pp 1.2pp
190
217204
45
(7)
(4) (6)(1)
(13)
Underlying Profit bridge
14
For
per
sona
l use
onl
y
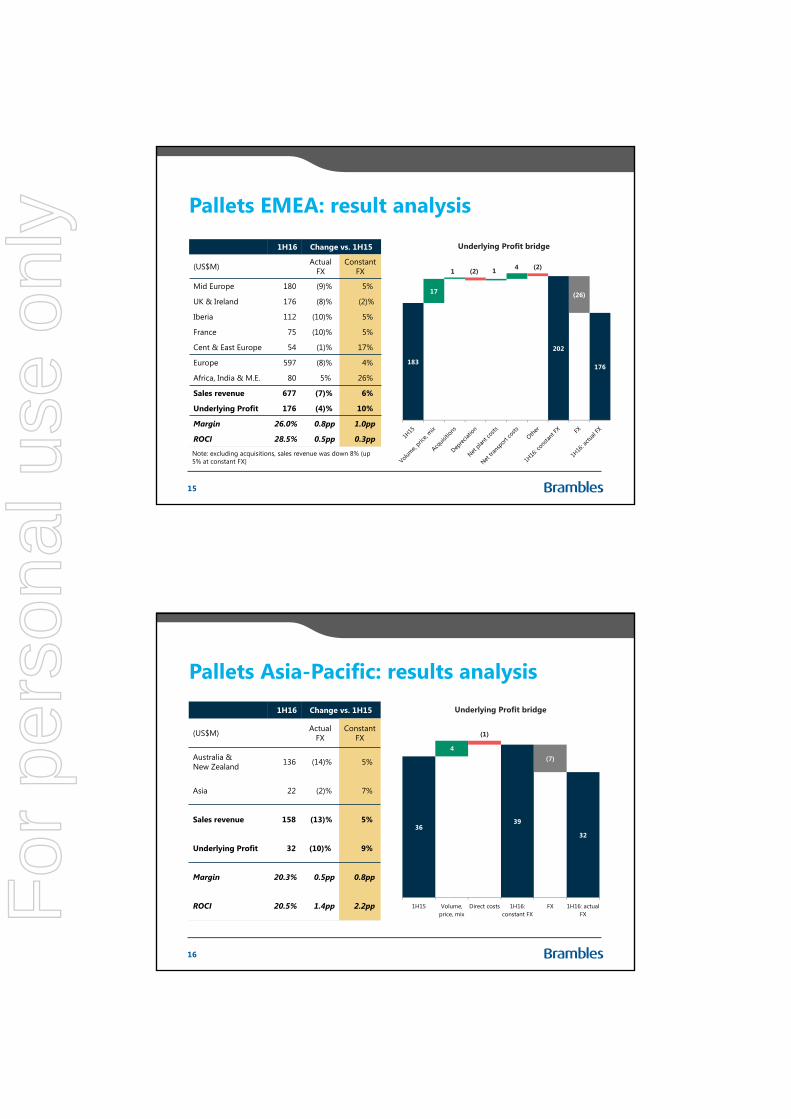
Pallets EMEA: result analysis
1H16 Change vs. 1H15
(US$M) Actual FX
Constant FX
Mid Europe 180 (9)% 5%
UK & Ireland 176 (8)% (2)%
Iberia 112 (10)% 5%
France 75 (10)% 5%
Cent & East Europe 54 (1)% 17%
Europe 597 (8)% 4%
Africa, India & M.E. 80 5% 26%
Sales revenue 677 (7)% 6%
Underlying Profit 176 (4)% 10%
Margin 26.0% 0.8pp 1.0pp
ROCI 28.5% 0.5pp 0.3pp
15
183
202
176
17
1 1 4(2) (2)
(26)
Underlying Profit bridge
Note: excluding acquisitions, sales revenue was down 8% (up 5% at constant FX)
Pallets Asia-Pacific: results analysis1H16 Change vs. 1H15
(US$M) Actual FX
Constant FX
Australia & New Zealand 136 (14)% 5%
Asia 22 (2)% 7%
Sales revenue 158 (13)% 5%
Underlying Profit 32 (10)% 9%
Margin 20.3% 0.5pp 0.8pp
ROCI 20.5% 1.4pp 2.2pp
16
3639
32
4
(1)
(7)
1H15 Volume,price, mix
Direct costs 1H16:constant FX
FX 1H16: actualFX
Underlying Profit bridge
For
per
sona
l use
onl
y
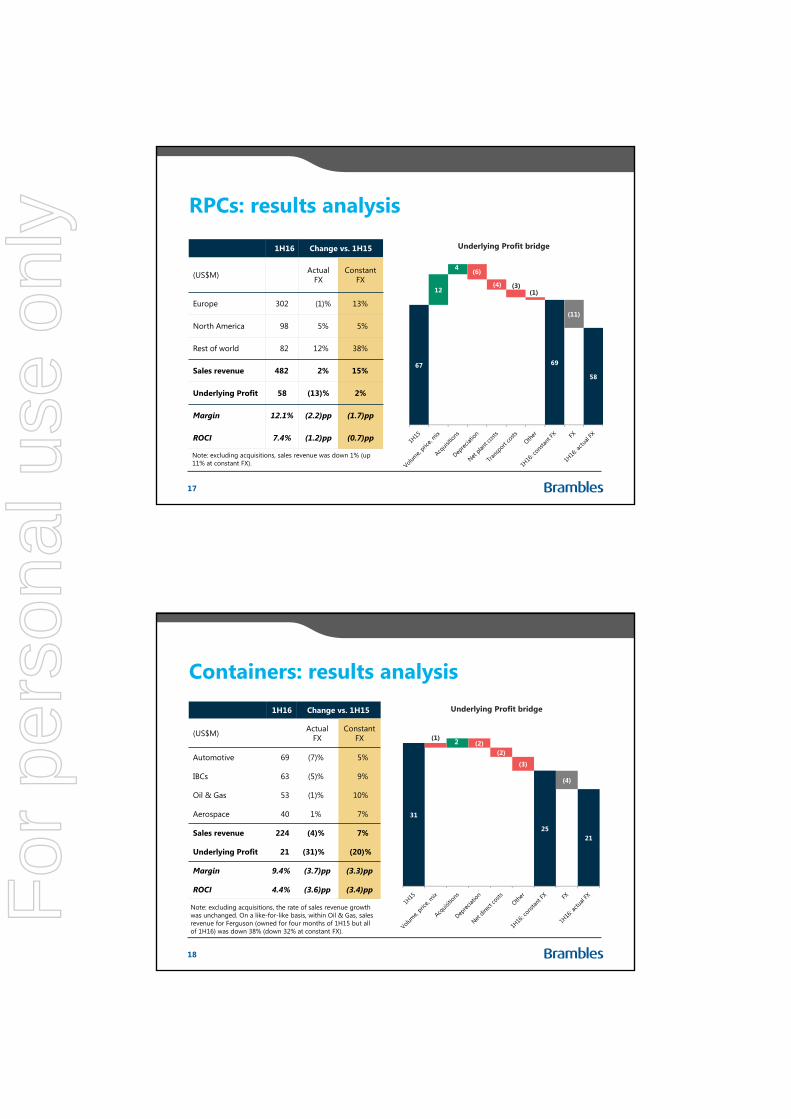
RPCs: results analysis
1H16 Change vs. 1H15
(US$M) Actual FX
Constant FX
Europe 302 (1)% 13%
North America 98 5% 5%
Rest of world 82 12% 38%
Sales revenue 482 2% 15%
Underlying Profit 58 (13)% 2%
Margin 12.1% (2.2)pp (1.7)pp
ROCI 7.4% (1.2)pp (0.7)pp
17
Note: excluding acquisitions, sales revenue was down 1% (up 11% at constant FX).
67 69
58
12
4 (6)
(4) (3)(1)
(11)
Underlying Profit bridge
Containers: results analysis1H16 Change vs. 1H15
(US$M) Actual FX
Constant FX
Automotive 69 (7)% 5%
IBCs 63 (5)% 9%
Oil & Gas 53 (1)% 10%
Aerospace 40 1% 7%
Sales revenue 224 (4)% 7%
Underlying Profit 21 (31)% (20)%
Margin 9.4% (3.7)pp (3.3)pp
ROCI 4.4% (3.6)pp (3.4)pp
18
Note: excluding acquisitions, the rate of sales revenue growth was unchanged. On a like-for-like basis, within Oil & Gas, sales revenue for Ferguson (owned for four months of 1H15 but all of 1H16) was down 38% (down 32% at constant FX).
31
2521
2(1)(2)
(2)
(3)
(4)
Underlying Profit bridge
For
per
sona
l use
onl
y
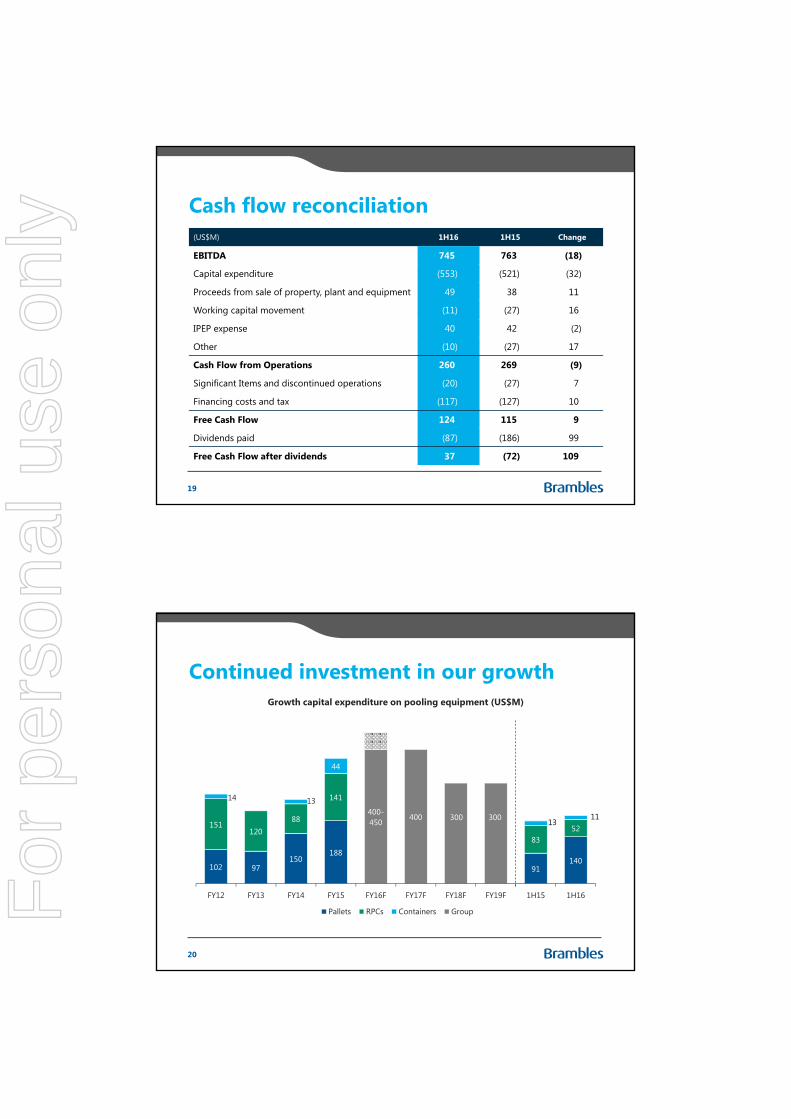
Cash flow reconciliation(US$M) 1H16 1H15 Change
EBITDA 745 763 (18)
Capital expenditure (553) (521) (32)
Proceeds from sale of property, plant and equipment 49 38 11
Working capital movement (11) (27) 16
IPEP expense 40 42 (2)
Other (10) (27) 17
Cash Flow from Operations 260 269 (9)
Significant Items and discontinued operations (20) (27) 7
Financing costs and tax (117) (127) 10
Free Cash Flow 124 115 9
Dividends paid (87) (186) 99
Free Cash Flow after dividends 37 (72) 109
19
Continued investment in our growth
102 97150
188
91140
151120
88
141
8352
14 13
44
1311400-
450400 300 300
FY12 FY13 FY14 FY15 FY16F FY17F FY18F FY19F 1H15 1H16
Growth capital expenditure on pooling equipment (US$M)
Pallets RPCs Containers Group
20
For
per
sona
l use
onl
y
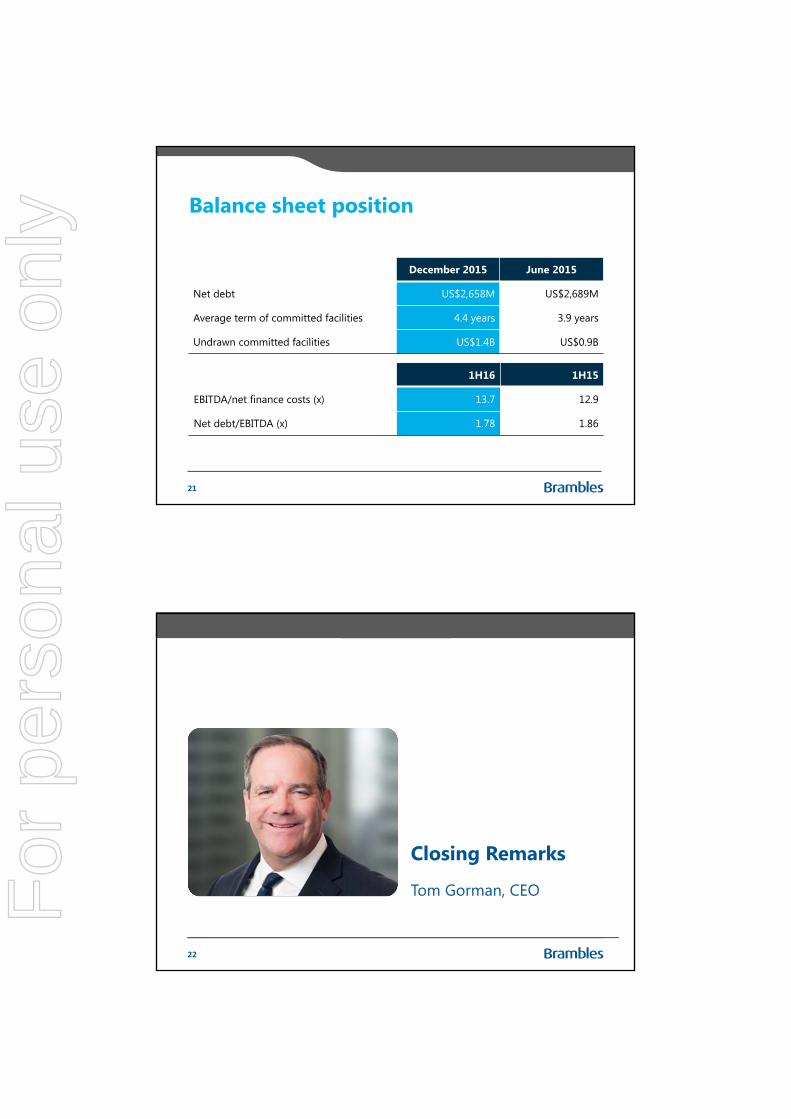
Balance sheet position
December 2015 June 2015
Net debt US$2,658M US$2,689M
Average term of committed facilities 4.4 years 3.9 years
Undrawn committed facilities US$1.4B US$0.9B
21
1H16 1H15
EBITDA/net finance costs (x) 13.7 12.9
Net debt/EBITDA (x) 1.78 1.86
Closing Remarks
Tom Gorman, CEO
22
For
per
sona
l use
onl
y
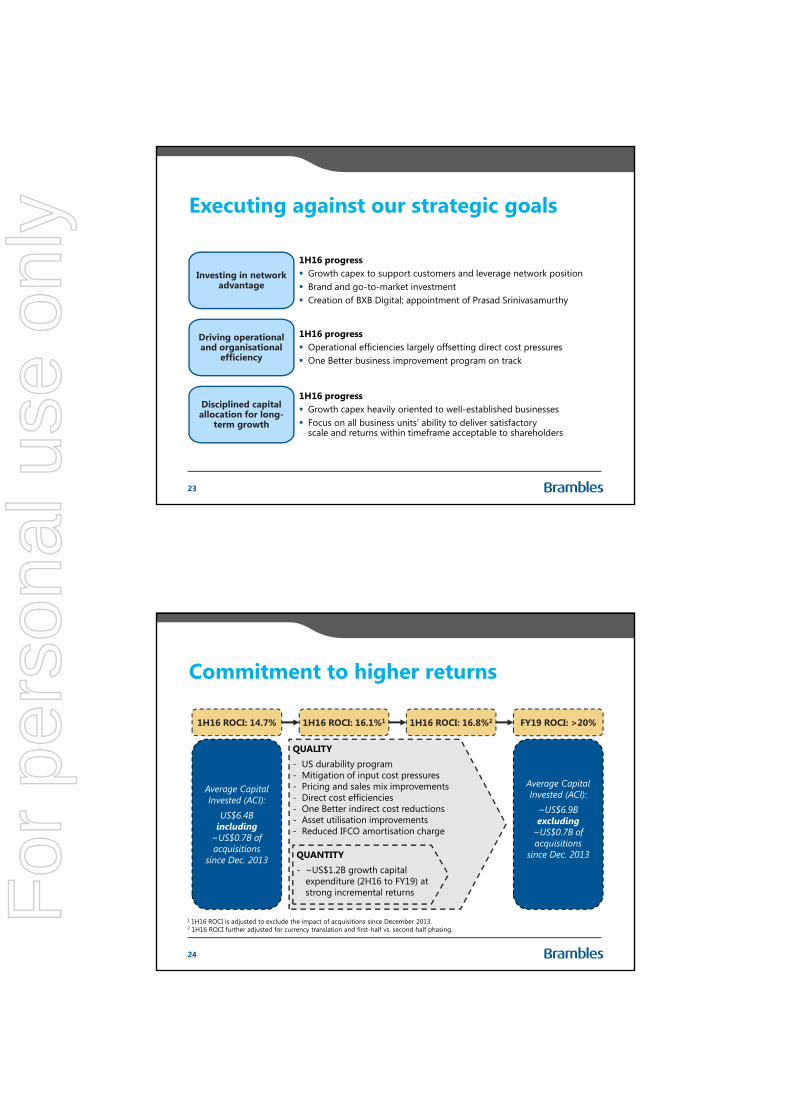
Executing against our strategic goals
Investing in network advantage
1H16 progress Growth capex to support customers and leverage network position Brand and go-to-market investment Creation of BXB Digital; appointment of Prasad Srinivasamurthy
Driving operational and organisational
efficiency
1H16 progress Operational efficiencies largely offsetting direct cost pressures One Better business improvement program on track
Disciplined capital allocation for long-
term growth
1H16 progress Growth capex heavily oriented to well-established businesses Focus on all business units’ ability to deliver satisfactory
scale and returns within timeframe acceptable to shareholders
23
Commitment to higher returns
24
QUALITY- US durability program- Mitigation of input cost pressures- Pricing and sales mix improvements - Direct cost efficiencies- One Better indirect cost reductions- Asset utilisation improvements- Reduced IFCO amortisation charge
1H16 ROCI: 14.7%
Average Capital Invested (ACI):
US$6.4B including
~US$0.7B of acquisitions
since Dec. 2013
FY19 ROCI: >20%
Average Capital Invested (ACI):
~US$6.9B excluding
~US$0.7B of acquisitions
since Dec. 2013QUANTITY- ~US$1.2B growth capital
expenditure (2H16 to FY19) at strong incremental returns
1H16 ROCI: 16.8%2
1 1H16 ROCI is adjusted to exclude the impact of acquisitions since December 2013.2 1H16 ROCI further adjusted for currency translation and first-half vs. second half phasing.
1H16 ROCI: 16.1%1
For
per
sona
l use
onl
y
Key points recap
Strong 1H16 result with good leverage from sales to profit
FY16 sales revenue and Underlying Profit guidance increased
Keen focus on effective capital allocation across all businesses
FY19 objectives reaffirmed
25
1
2
3
4
Half-Year 2016 Results
22 February 2016
For
per
sona
l use
onl
y
Appendices
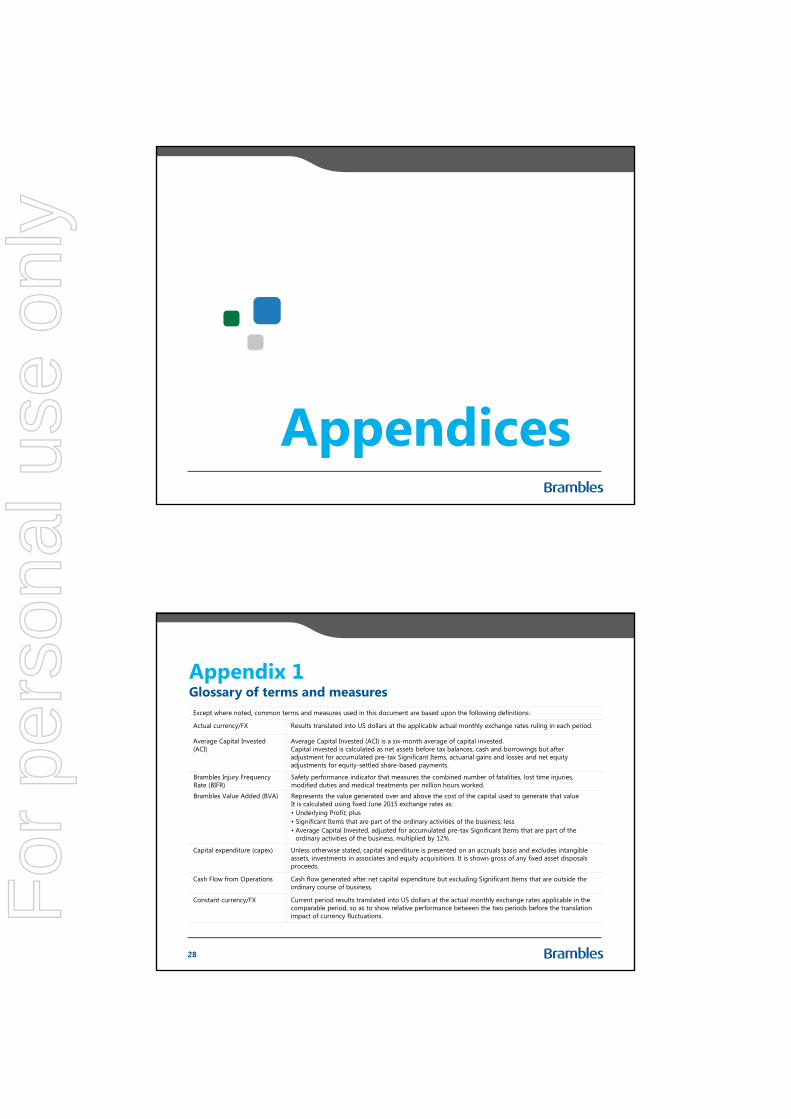
Appendix 1
Except where noted, common terms and measures used in this document are based upon the following definitions:
Actual currency/FX Results translated into US dollars at the applicable actual monthly exchange rates ruling in each period.
Average Capital Invested (ACI)
Average Capital Invested (ACI) is a six-month average of capital invested.Capital invested is calculated as net assets before tax balances, cash and borrowings but after adjustment for accumulated pre-tax Significant Items, actuarial gains and losses and net equity adjustments for equity-settled share-based payments.
Brambles Injury Frequency Rate (BIFR)
Safety performance indicator that measures the combined number of fatalities, lost time injuries, modified duties and medical treatments per million hours worked.
Brambles Value Added (BVA) Represents the value generated over and above the cost of the capital used to generate that valueIt is calculated using fixed June 2015 exchange rates as:• Underlying Profit; plus• Significant Items that are part of the ordinary activities of the business; less• Average Capital Invested, adjusted for accumulated pre-tax Significant Items that are part of the
ordinary activities of the business, multiplied by 12%.
Capital expenditure (capex) Unless otherwise stated, capital expenditure is presented on an accruals basis and excludes intangible assets, investments in associates and equity acquisitions. It is shown gross of any fixed asset disposals proceeds.
Cash Flow from Operations Cash flow generated after net capital expenditure but excluding Significant Items that are outside the ordinary course of business.
Constant currency/FX Current period results translated into US dollars at the actual monthly exchange rates applicable in the comparable period, so as to show relative performance between the two periods before the translation impact of currency fluctuations.
Glossary of terms and measures
28
For
per
sona
l use
onl
y
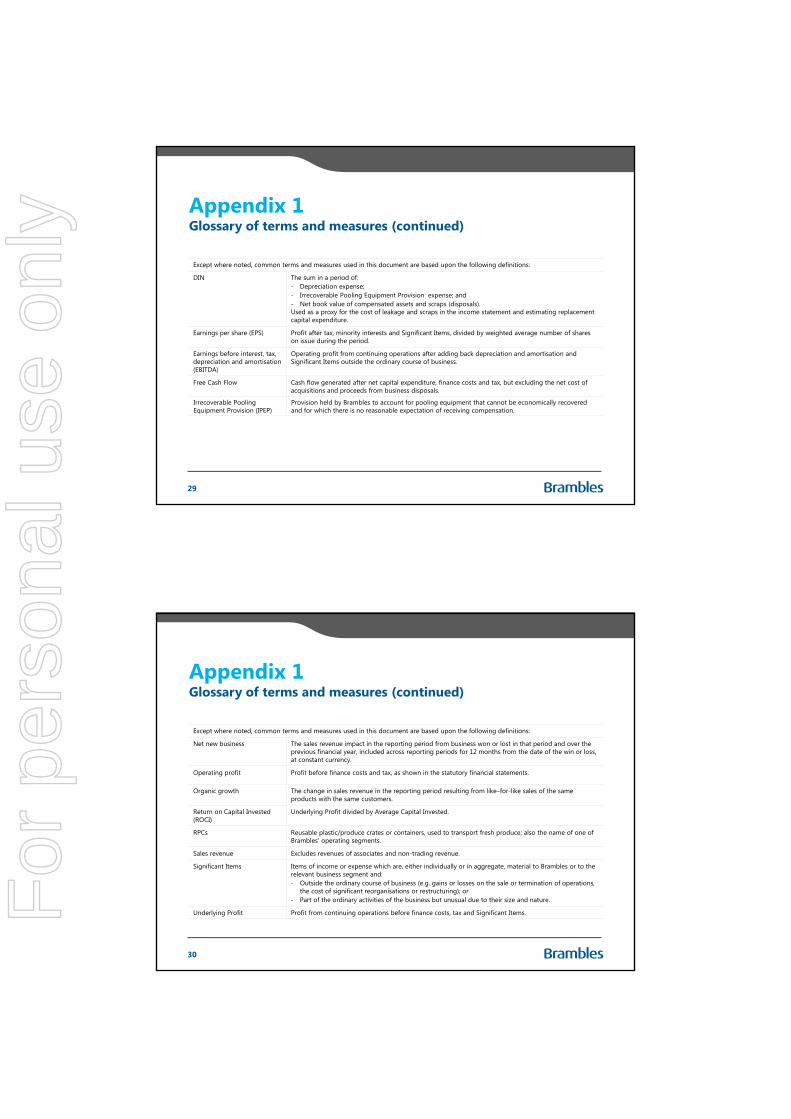
Appendix 1
Except where noted, common terms and measures used in this document are based upon the following definitions:
DIN The sum in a period of:- Depreciation expense;- Irrecoverable Pooling Equipment Provision expense; and - Net book value of compensated assets and scraps (disposals).Used as a proxy for the cost of leakage and scraps in the income statement and estimating replacement capital expenditure.
Earnings per share (EPS) Profit after tax, minority interests and Significant Items, divided by weighted average number of shares on issue during the period.
Earnings before interest, tax, depreciation and amortisation (EBITDA)
Operating profit from continuing operations after adding back depreciation and amortisation and Significant Items outside the ordinary course of business.
Free Cash Flow Cash flow generated after net capital expenditure, finance costs and tax, but excluding the net cost of acquisitions and proceeds from business disposals.
Irrecoverable Pooling Equipment Provision (IPEP)
Provision held by Brambles to account for pooling equipment that cannot be economically recovered and for which there is no reasonable expectation of receiving compensation.
Glossary of terms and measures (continued)
29
Appendix 1
Except where noted, common terms and measures used in this document are based upon the following definitions:
Net new business The sales revenue impact in the reporting period from business won or lost in that period and over the previous financial year, included across reporting periods for 12 months from the date of the win or loss, at constant currency.
Operating profit Profit before finance costs and tax, as shown in the statutory financial statements.
Organic growth The change in sales revenue in the reporting period resulting from like–for-like sales of the same products with the same customers.
Return on Capital Invested (ROCI)
Underlying Profit divided by Average Capital Invested.
RPCs Reusable plastic/produce crates or containers, used to transport fresh produce; also the name of one of Brambles’ operating segments.
Sales revenue Excludes revenues of associates and non-trading revenue.
Significant Items Items of income or expense which are, either individually or in aggregate, material to Brambles or to the relevant business segment and: - Outside the ordinary course of business (e.g. gains or losses on the sale or termination of operations,
the cost of significant reorganisations or restructuring); or - Part of the ordinary activities of the business but unusual due to their size and nature.
Underlying Profit Profit from continuing operations before finance costs, tax and Significant Items.
Glossary of terms and measures (continued)
30
For
per
sona
l use
onl
y
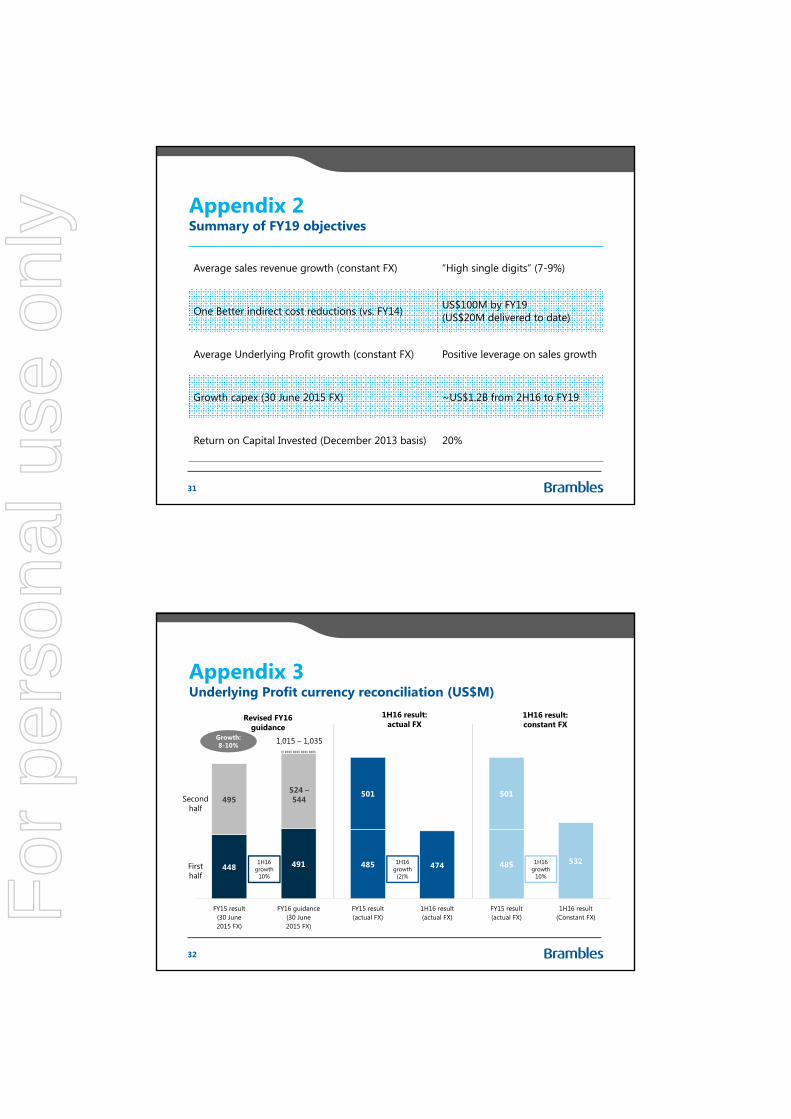
Appendix 2
Average sales revenue growth (constant FX) “High single digits” (7-9%)
One Better indirect cost reductions (vs. FY14) US$100M by FY19(US$20M delivered to date)
Average Underlying Profit growth (constant FX) Positive leverage on sales growth
Growth capex (30 June 2015 FX) ~US$1.2B from 2H16 to FY19
Return on Capital Invested (December 2013 basis) 20%
Summary of FY19 objectives
31
Appendix 3
448 491 485 474 485 532
495501 501
FY15 result(30 June2015 FX)
FY16 guidance(30 June2015 FX)
FY15 result(actual FX)
1H16 result(actual FX)
FY15 result(actual FX)
1H16 result(Constant FX)
Underlying Profit currency reconciliation (US$M)
32
Growth: 8-10%
Revised FY16 guidance
1H16 result: actual FX
1H16 result: constant FX
1,015 – 1,035
First half
Second half
524 –544
1H16 growth
(2)%
1H16 growth
10%
1H16 growth
10%
For
per
sona
l use
onl
y
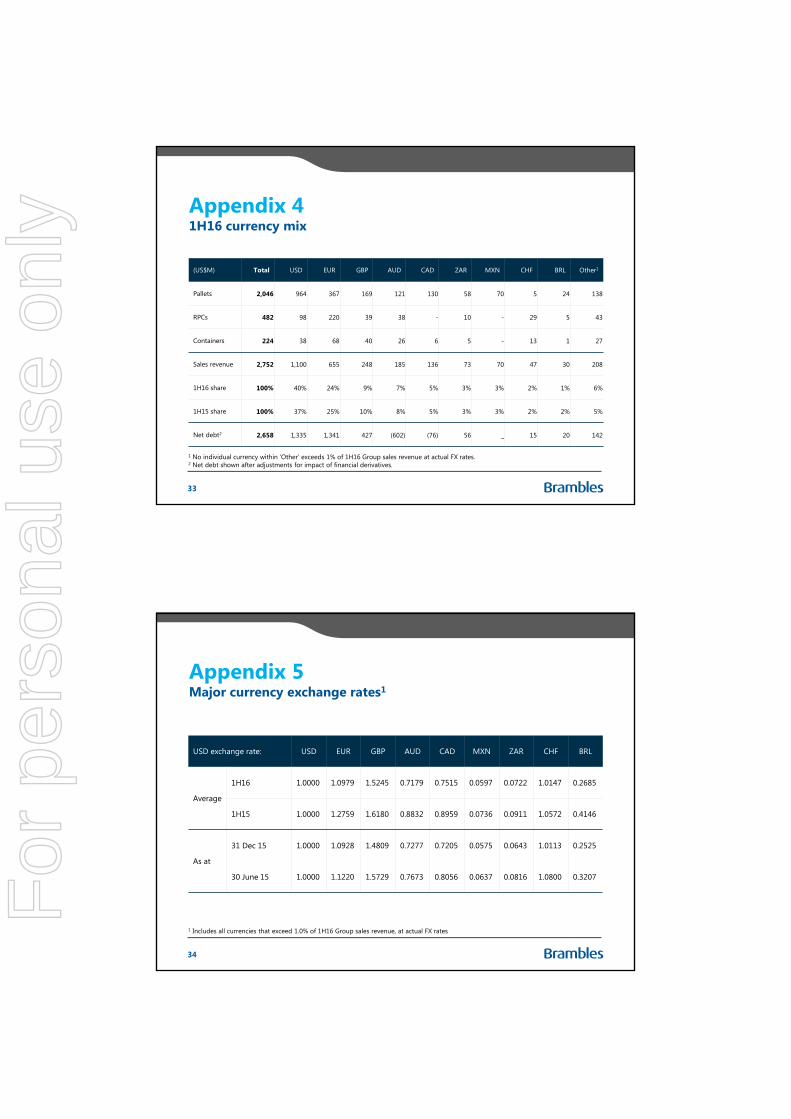
Appendix 4
(US$M) Total USD EUR GBP AUD CAD ZAR MXN CHF BRL Other1
Pallets 2,046 964 367 169 121 130 58 70 5 24 138
RPCs 482 98 220 39 38 - 10 - 29 5 43
Containers 224 38 68 40 26 6 5 - 13 1 27
Sales revenue 2,752 1,100 655 248 185 136 73 70 47 30 208
1H16 share 100% 40% 24% 9% 7% 5% 3% 3% 2% 1% 6%
1H15 share 100% 37% 25% 10% 8% 5% 3% 3% 2% 2% 5%
Net debt2 2,658 1,335 1,341 427 (602) (76) 56 _ 15 20 142
1H16 currency mix
33
1 No individual currency within ‘Other’ exceeds 1% of 1H16 Group sales revenue at actual FX rates.2 Net debt shown after adjustments for impact of financial derivatives.
Appendix 5
USD exchange rate: USD EUR GBP AUD CAD MXN ZAR CHF BRL
Average
1H16 1.0000 1.0979 1.5245 0.7179 0.7515 0.0597 0.0722 1.0147 0.2685
1H15 1.0000 1.2759 1.6180 0.8832 0.8959 0.0736 0.0911 1.0572 0.4146
As at
31 Dec 15 1.0000 1.0928 1.4809 0.7277 0.7205 0.0575 0.0643 1.0113 0.2525
30 June 15 1.0000 1.1220 1.5729 0.7673 0.8056 0.0637 0.0816 1.0800 0.3207
Major currency exchange rates1
34
1 Includes all currencies that exceed 1.0% of 1H16 Group sales revenue, at actual FX rates
For
per
sona
l use
onl
y
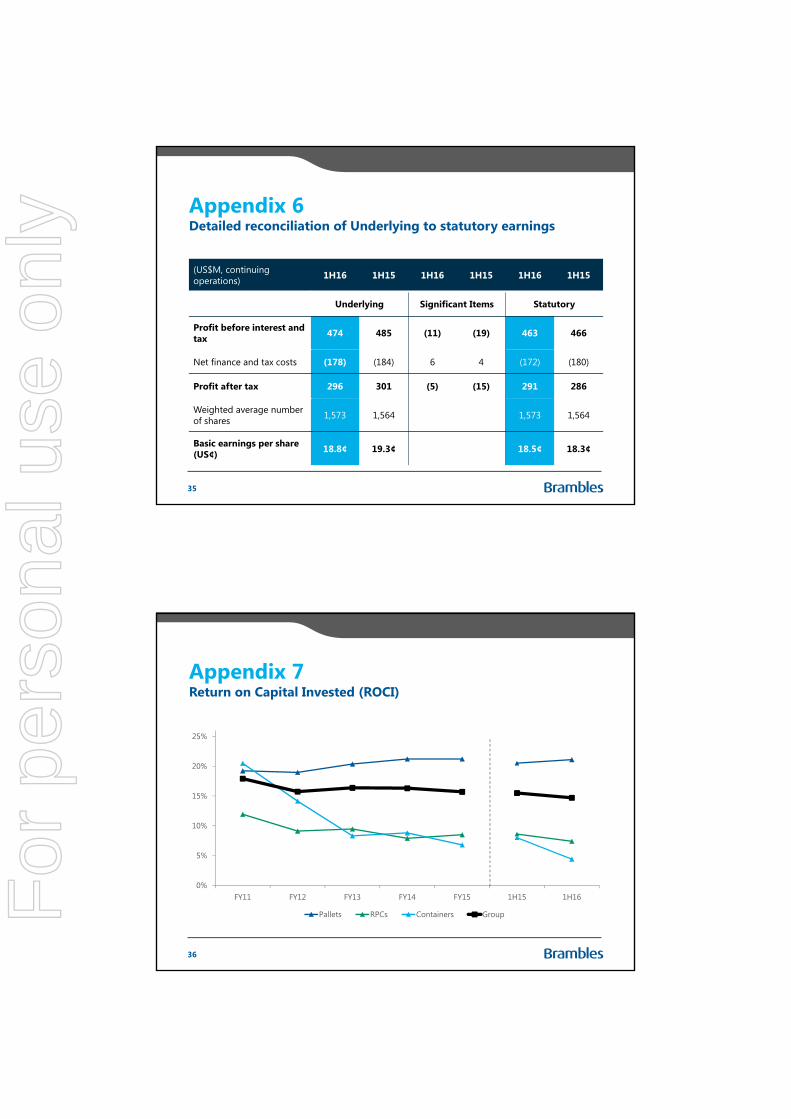
Appendix 6
(US$M, continuing operations) 1H16 1H15 1H16 1H15 1H16 1H15
Underlying Significant Items Statutory
Profit before interest and tax 474 485 (11) (19) 463 466
Net finance and tax costs (178) (184) 6 4 (172) (180)
Profit after tax 296 301 (5) (15) 291 286
Weighted average number of shares 1,573 1,564 1,573 1,564
Basic earnings per share (US¢) 18.8¢ 19.3¢ 18.5¢ 18.3¢
Detailed reconciliation of Underlying to statutory earnings
35
Appendix 7
0%
5%
10%
15%
20%
25%
FY11 FY12 FY13 FY14 FY15 1H15 1H16
Pallets RPCs Containers Group
Return on Capital Invested (ROCI)
36
For
per
sona
l use
onl
y
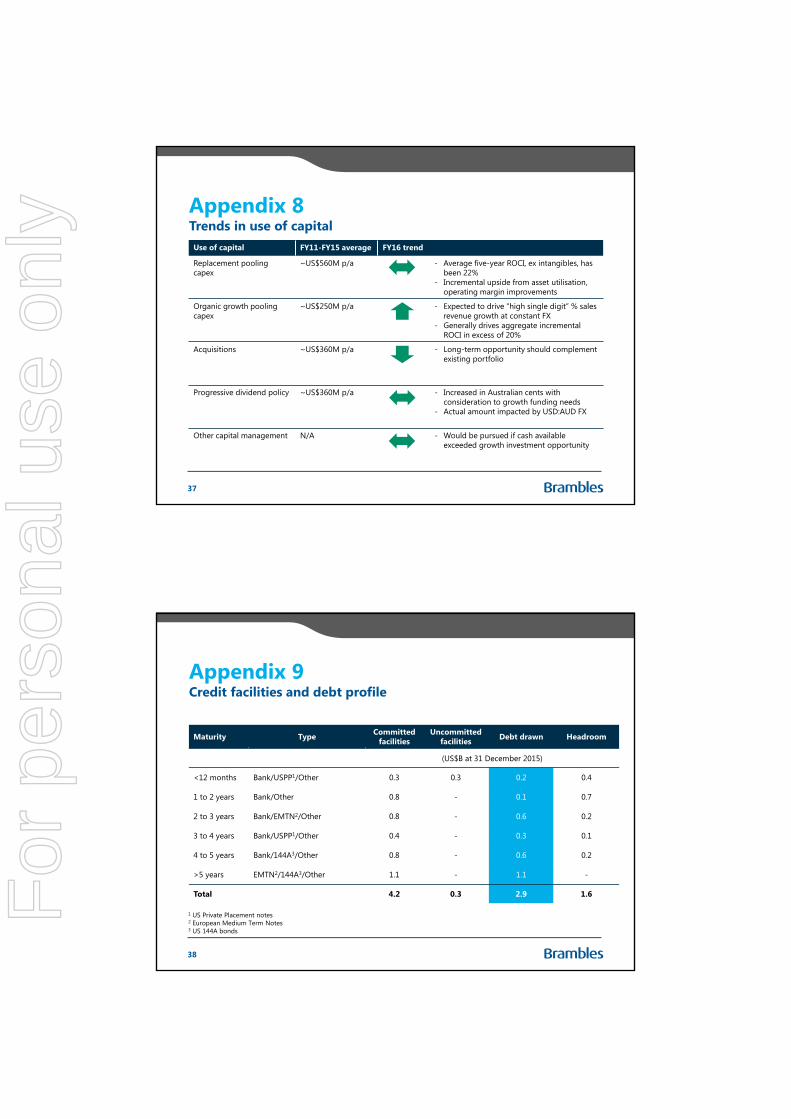
Appendix 8
Use of capital FY11-FY15 average FY16 trend
Replacement pooling capex
~US$560M p/a - Average five-year ROCI, ex intangibles, has been 22%
- Incremental upside from asset utilisation, operating margin improvements
Organic growth pooling capex
~US$250M p/a - Expected to drive “high single digit” % sales revenue growth at constant FX
- Generally drives aggregate incremental ROCI in excess of 20%
Acquisitions ~US$360M p/a - Long-term opportunity should complement existing portfolio
Progressive dividend policy ~US$360M p/a - Increased in Australian cents with consideration to growth funding needs
- Actual amount impacted by USD:AUD FX
Other capital management N/A - Would be pursued if cash available exceeded growth investment opportunity
Trends in use of capital
37
Appendix 9
Maturity Type Committed facilities
Uncommitted facilities Debt drawn Headroom
(US$B at 31 December 2015)
<12 months Bank/USPP1/Other 0.3 0.3 0.2 0.4
1 to 2 years Bank/Other 0.8 - 0.1 0.7
2 to 3 years Bank/EMTN2/Other 0.8 - 0.6 0.2
3 to 4 years Bank/USPP1/Other 0.4 - 0.3 0.1
4 to 5 years Bank/144A3/Other 0.8 - 0.6 0.2
>5 years EMTN2/144A3/Other 1.1 - 1.1 -
Total 4.2 0.3 2.9 1.6
Credit facilities and debt profile
1 US Private Placement notes2 European Medium Term Notes3 US 144A bonds
38
For
per
sona
l use
onl
y
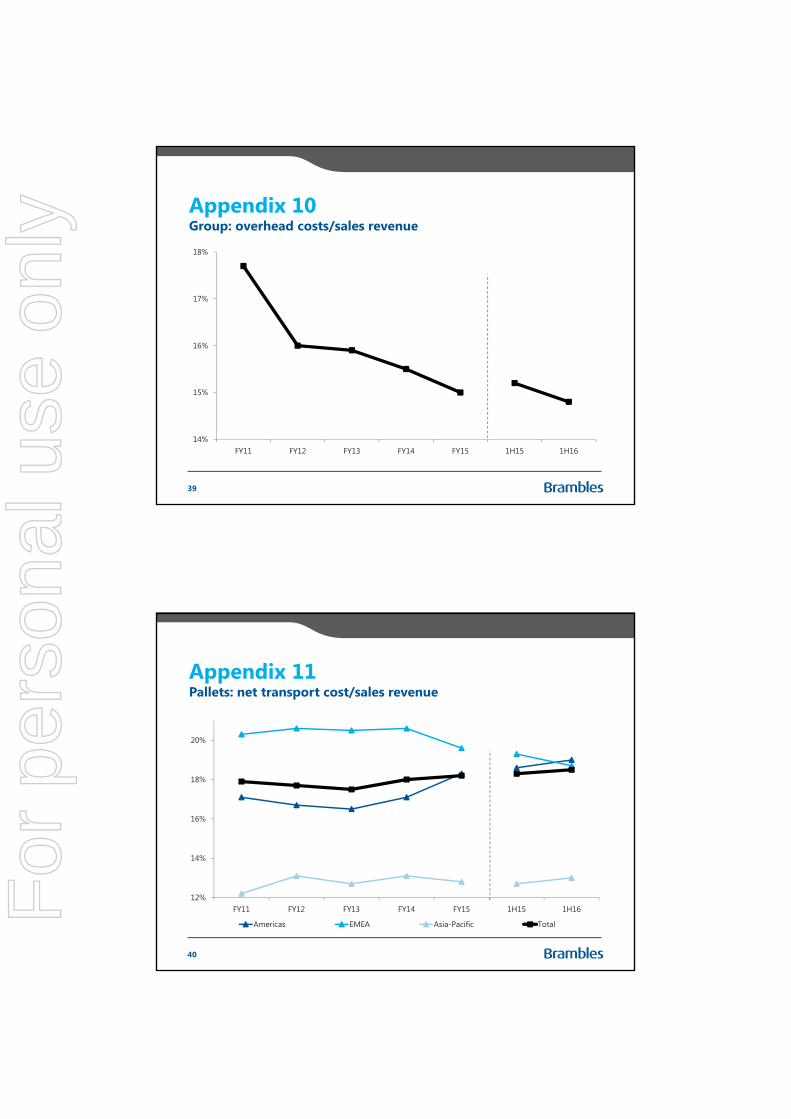
Appendix 10
14%
15%
16%
17%
18%
FY11 FY12 FY13 FY14 FY15 1H15 1H16
Group: overhead costs/sales revenue
39
Appendix 11
12%
14%
16%
18%
20%
FY11 FY12 FY13 FY14 FY15 1H15 1H16
Americas EMEA Asia-Pacific Total
Pallets: net transport cost/sales revenue
40
For
per
sona
l use
onl
y
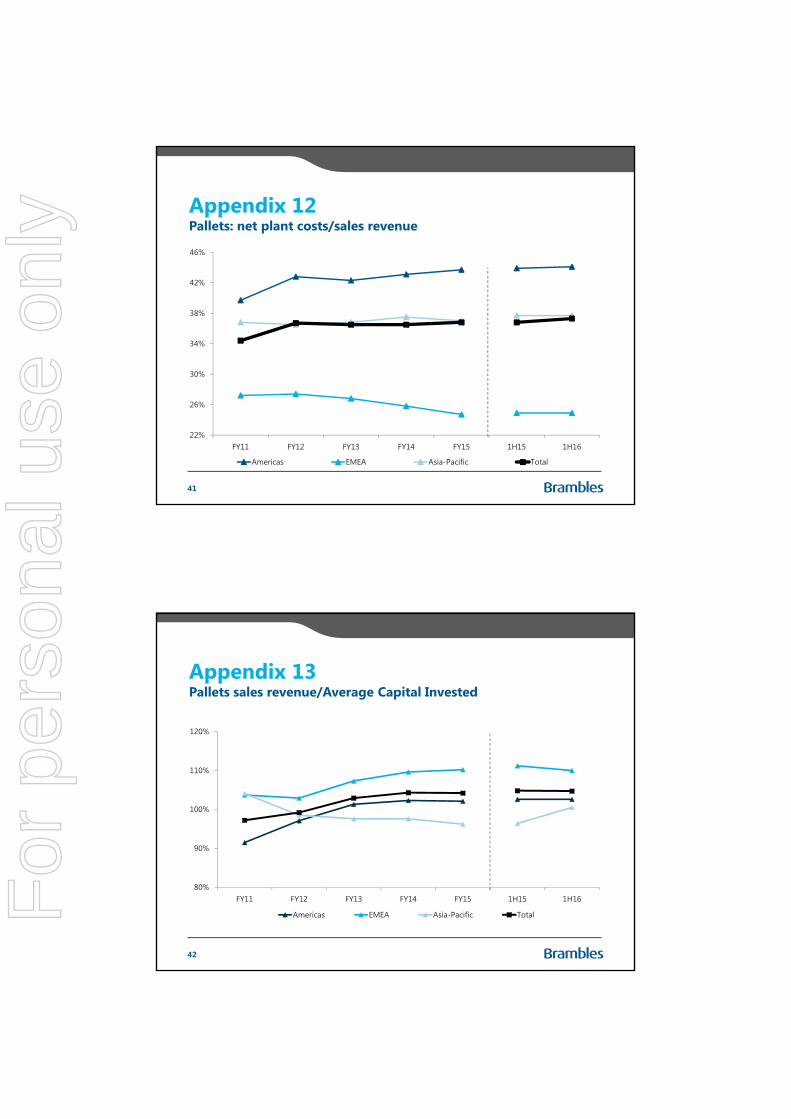
Appendix 12
22%
26%
30%
34%
38%
42%
46%
FY11 FY12 FY13 FY14 FY15 1H15 1H16
Americas EMEA Asia-Pacific Total
Pallets: net plant costs/sales revenue
41
Appendix 13
80%
90%
100%
110%
120%
FY11 FY12 FY13 FY14 FY15 1H15 1H16
Americas EMEA Asia-Pacific Total
Pallets sales revenue/Average Capital Invested
42
For
per
sona
l use
onl
y
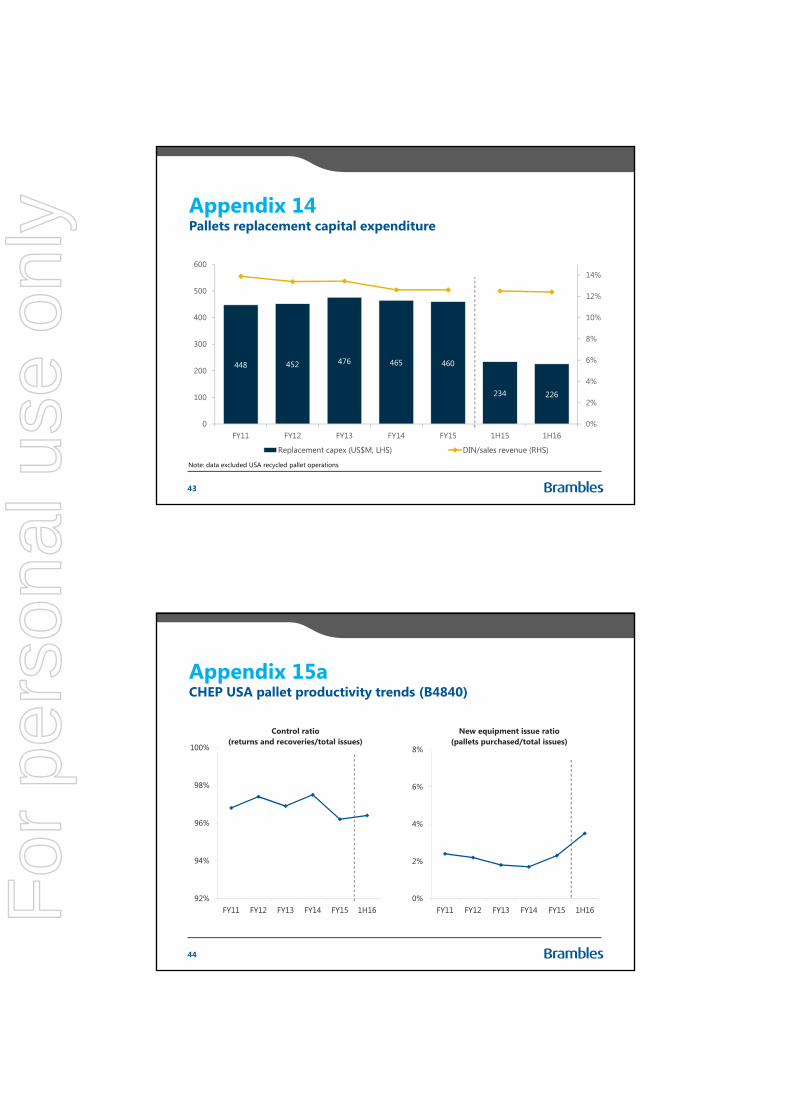
Appendix 14
448 452 476 465 460
234 226
0%
2%
4%
6%
8%
10%
12%
14%
0
100
200
300
400
500
600
FY11 FY12 FY13 FY14 FY15 1H15 1H16
Replacement capex (US$M, LHS) DIN/sales revenue (RHS)
Pallets replacement capital expenditure
43
Note: data excluded USA recycled pallet operations
Appendix 15aCHEP USA pallet productivity trends (B4840)
92%
94%
96%
98%
100%
FY11 FY12 FY13 FY14 FY15 1H16
Control ratio(returns and recoveries/total issues)
0%
2%
4%
6%
8%
FY11 FY12 FY13 FY14 FY15 1H16
New equipment issue ratio(pallets purchased/total issues)
44
For
per
sona
l use
onl
y
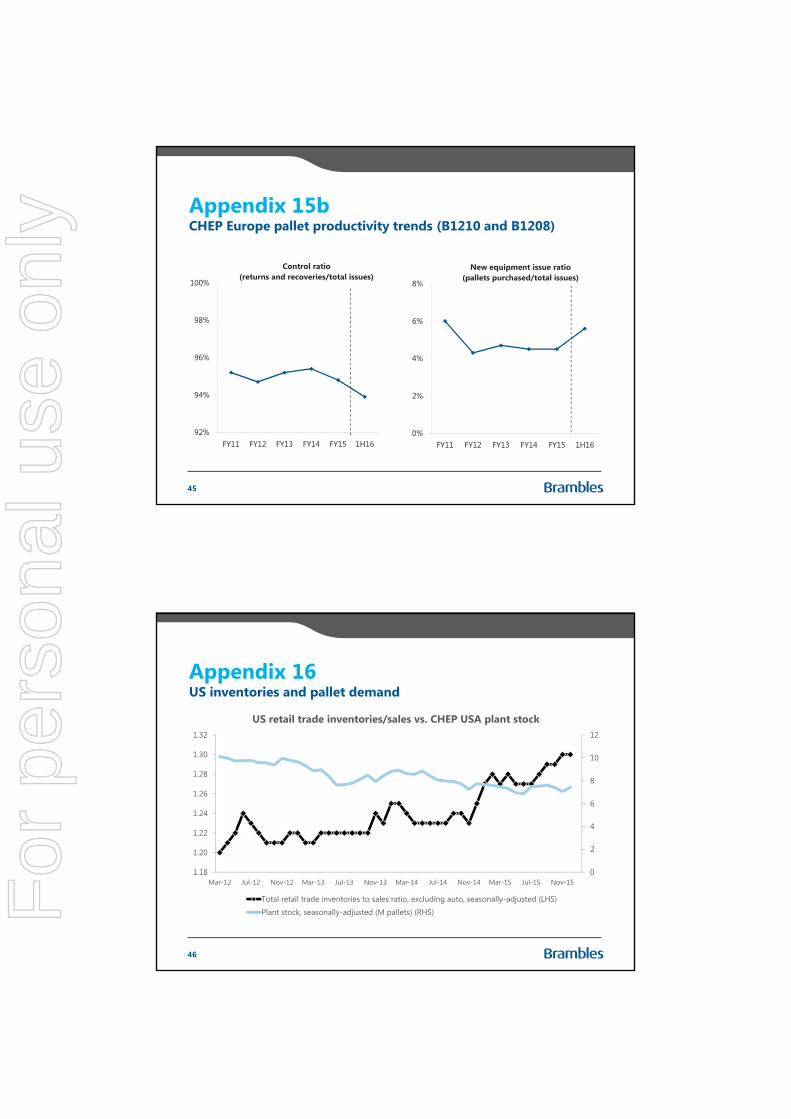
Appendix 15bCHEP Europe pallet productivity trends (B1210 and B1208)
92%
94%
96%
98%
100%
FY11 FY12 FY13 FY14 FY15 1H16
Control ratio(returns and recoveries/total issues)
0%
2%
4%
6%
8%
FY11 FY12 FY13 FY14 FY15 1H16
New equipment issue ratio(pallets purchased/total issues)
45
Appendix 16US inventories and pallet demand
46
0
2
4
6
8
10
12
1.18
1.20
1.22
1.24
1.26
1.28
1.30
1.32
Mar-12 Jul-12 Nov-12 Mar-13 Jul-13 Nov-13 Mar-14 Jul-14 Nov-14 Mar-15 Jul-15 Nov-15
US retail trade inventories/sales vs. CHEP USA plant stock
Total retail trade inventories to sales ratio, excluding auto, seasonally-adjusted (LHS)
Plant stock, seasonally-adjusted (M pallets) (RHS)For
per
sona
l use
onl
y
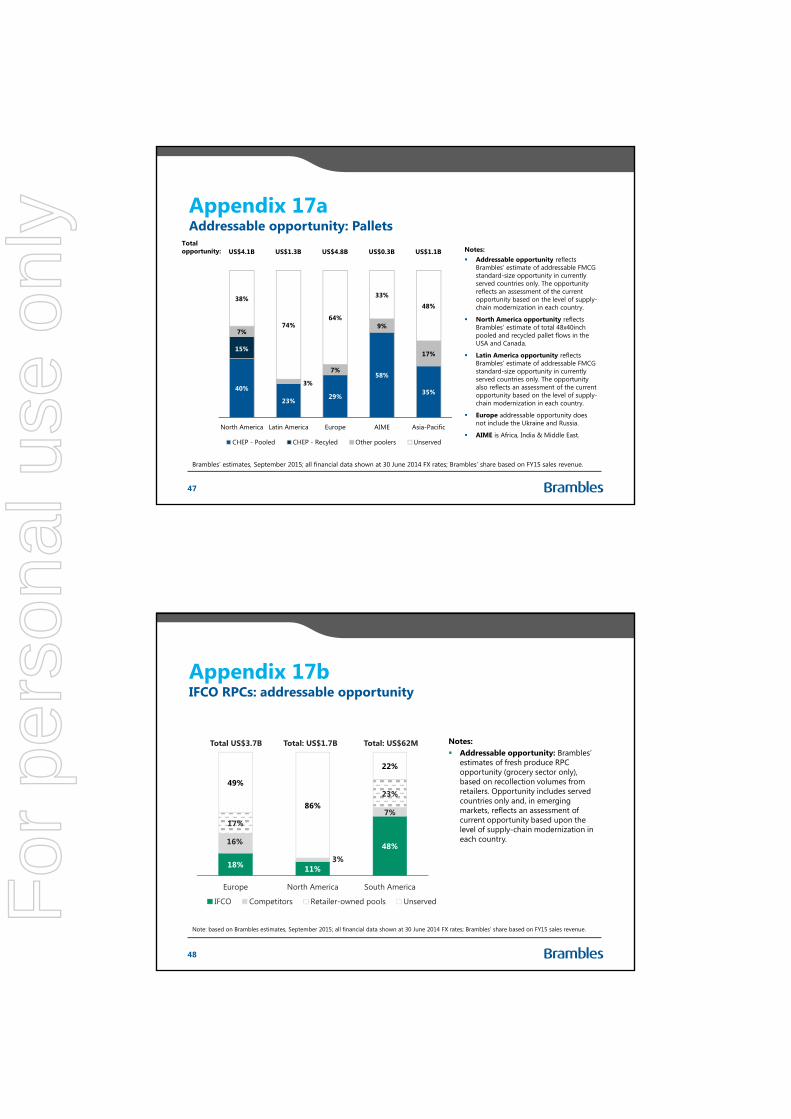
Appendix 17a
40%
23%29%
58%
35%
15%
7%
3%
7%
9%
17%
38%
74%64%
33%
48%
North America Latin America Europe AIME Asia-Pacific
CHEP - Pooled CHEP - Recyled Other poolers Unserved
Addressable opportunity: Pallets
47
US$4.1B US$1.3B Notes: Addressable opportunity reflects
Brambles’ estimate of addressable FMCG standard-size opportunity in currently served countries only. The opportunity reflects an assessment of the current opportunity based on the level of supply-chain modernization in each country.
North America opportunity reflects Brambles’ estimate of total 48x40inch pooled and recycled pallet flows in the USA and Canada.
Latin America opportunity reflects Brambles’ estimate of addressable FMCG standard-size opportunity in currently served countries only. The opportunity also reflects an assessment of the current opportunity based on the level of supply-chain modernization in each country.
Europe addressable opportunity does not include the Ukraine and Russia.
AIME is Africa, India & Middle East.
Brambles’ estimates, September 2015; all financial data shown at 30 June 2014 FX rates; Brambles’ share based on FY15 sales revenue.
US$4.8B US$0.3B US$1.1BTotal opportunity:
Appendix 17b
18% 11%
48%16%
3%
7%17%
23%49%
86%
22%
Europe North America South America
IFCO Competitors Retailer-owned pools Unserved
48
IFCO RPCs: addressable opportunity
Total US$3.7B Total: US$1.7B Total: US$62M
Note: based on Brambles estimates, September 2015; all financial data shown at 30 June 2014 FX rates; Brambles’ share based on FY15 sales revenue.
Notes: Addressable opportunity: Brambles’
estimates of fresh produce RPC opportunity (grocery sector only), based on recollection volumes from retailers. Opportunity includes served countries only and, in emerging markets, reflects an assessment of current opportunity based upon the level of supply-chain modernization in each country.
For
per
sona
l use
onl
y
Disclaimer
The release, publication or distribution of this presentation in certain jurisdictions may be restricted by law and therefore persons in such jurisdictions into which this presentation is released, published or distributed should inform themselves about and observe such restrictions.This presentation does not constitute, or form part of, an offer to sell or the solicitation of an offer to subscribe for or buy any securities, nor the solicitation of any vote or approval in any jurisdiction, nor shall there be any sale, issue or transfer of the securities referred to in this presentation in any jurisdiction in contravention of applicable law.Persons needing advice should consult their stockbroker, bank manager, solicitor, accountant or other independent financial advisor. Certain statements made in this presentation are forward-looking statements.These forward-looking statements are not historical facts but rather are based on Brambles’ current expectations, estimates and projections about the industry in which Brambles operates, and beliefs and assumptions. Words such as "anticipates," "expects," "intends," "plans," "believes," "seeks,” "estimates," and similar expressions are intended to identify forward-looking statements.These statements are not guarantees of future performance and are subject to known and unknown risks, uncertainties and otherfactors, some of which are beyond the control of Brambles, are difficult to predict and could cause actual results to differ materially from those expressed or forecasted in the forward-looking statements. Brambles cautions shareholders and prospective shareholders not to place undue reliance on these forward-looking statements, which reflect the view of Brambles only as of the date of this presentation.The forward-looking statements made in this presentation relate only to events as of the date on which the statements are made. Brambles will not undertake any obligation to release publicly any revisions or updates to these forward-looking statements to reflect events, circumstances or unanticipated events occurring after the date of this presentation except as required by law or by any appropriate regulatory authority
49
Investor Relations contacts
James HallVice President, Investor Relations & Corporate [email protected]+61 2 9256 5262+61 401 524 645
Raluca ChiriacescuManager, Investor [email protected]+61 2 9256 5211+61 427 791 189
50
For
per
sona
l use
onl
y
Half-Year 2016 Results
22 February 2016
For
per
sona
l use
onl
y