synergy between experiment and simulation in describing
TRANSCRIPT

Int. J. Electrochem. Sci., 8 (2013) 8005 - 8018
International Journal of
ELECTROCHEMICAL SCIENCE
www.electrochemsci.org
Synergy Between Experiment and Simulation in Describing the
Electrochemical Performance of Mg-doped LiNixCoyMnzO2
Cathode Material of Lithium Ion Battery
Yu-Hao Huang1,2
, Hung-Lung Chou1,3
, Fu-Ming Wang1,3,*
, Bing-Joe Hwang3,4
Shih-Chieh Liao2,
Tzu-Nung Huang2, Chia-Hung Su
5 and Hai-Hua Liu
5
1Graduate Institute of Applied Science and Technology, National Taiwan University of Science and
Technology, Taipei, Taiwan 2Material and Chemical Laboratories, Industrial Technology Research Institute, Hsinchu, Taiwan
3Sustainable Energy Center, National Taiwan University of Science and Technology, Taipei, Taiwan
4Department of Chemical Engineering, National Taiwan University of Science and Technology,
Taipei, Taiwan 5Department of Chemical Engineering, Ming-Chi University of Technology, Taipei, Taiwan
*E-mail: [email protected]
Received: 29 April 2013 / Accepted: 13 May 2013 / Published: 1 June 2013
Electrically powered vehicles (EV) are the next promising transportation candidate. However, energy
storage in EVs is a critical issue if transportation needs are to be met. Recently, three element-layered
structure materials of the type LiNi0.5Co0.2Mn0.3O2 have found application as cathodes in lithium ion
batteries. However, the performance of this battery type over a wide temperature range is poor, and
this limits its development into the EV market. We report the synthesis of Mg-doped
Li1.1Ni0.497Mg0.003Co0.2Mn0.3O2, prepared by solid-state methods for the improvement of battery
performance for EV applications. Differential scanning calorimetry (DSC) analysis revealed that
doping with Mg significantly enhances the thermal structural stability of LiNi0.5Co0.2Mn0.3O2.
Additionally, Mg doping increases discharge capacity by 5% and 10% for room- and low-temperature
(10 o
C) operation, respectively. The increase in thermal stability provided a 66% improvement in the
cycle life at high-temperature (60 oC) operation.
Keywords: Lithium ion battery; layer structure; Mg doped; cathode; thermal stability; low/ high
temperature
1. INTRODUCTION
Lithium ion batteries are the major energy source used by portable electronics and are a
primary candidate for powering electric vehicles because of their high energy density and good

Int. J. Electrochem. Sci., Vol. 8, 2013
8006
cyclability [1-5]. Lithium transition metal-oxide cathodes of the type Li[NixMnyCoz]O2 are promising
materials because of their high reversible capacity, low toxicity, and low cost of manufacture [6-13].
These complexes have a layered α-NaFeO2-type structure, with Ni, Co, and Mn ion oxidation states of
+2, +3, and +4, respectively, as determined by density functional theory (DFT) calculations and X-ray
absorption spectroscopy (XAS) measurements [14]. These three ions serve different functions within
the structure; Ni2+
is an electrochemically active ion, whereas the Mn4+
ion, with its octahedral
coordination, provides structural stability, and the Co3+
ion suppresses cation mixing between 3a and
3b sites [15]. LiNi1/3Mn1/3Co1/3O2 is a commercially available material; it has a specific capacity of
185 mAh g-1
. However, cationic mixing of Ni and Li ions at 3b crystallographic sites within the
LiNi1/3Mn1/3Co1/3O2 lattice deteriorates the long-term performance of the cells. Thus, Ni, Co, and Mn
content must be manipulated to provide optimal performance of these materials. Katiyar et al. reported
a LiNi0.66Co0.17Mn0.17O2 compound, prepared by substitution of Ni for Co and Mn. They designed the
material using computational methods to elucidate an optimal composition that provided high energy
density with good structural stability. LiNi0.66Co0.17Mn0.17O2 has a discharge capacity of 167 mAh g-1
at 1C, and exhibits only slow deterioration over the first 12 cycles [16]. Duh et al. reported doping with
Mg to reduce cation mixing. They demonstrated that LiNi0.57Mg0.03Co0.25Mn0.15O2 undergoes a low
rate of cation mixing and offers good structural integrity with a clear phase-transition boundary, a
discharge capacity of 199 mAh g-1
, and 79% retention after 20 cycles [17]. Although the performance
is an improvement on previous formulations, battery fading still occurs too fast, and Duh did not
identify a suitable Mg doping percentage to enhance the energy density of Li[NixMnyCoz]O2.
We report our computational structural calculations, a model simulation, and an experimental
study to determine the optimal amount of Mg dopant in LiNi0.5Co0.2Mn0.3O2 to maximize battery
performance at low and high temperatures. We also discuss our differential scanning calorimetric
(DSC) findings and the cycle performance at high temperature operation.
2. EXPERIMENTAL
2.1 Sample preparation
To prepare Mg-doped LiNi0.5Co0.2Mn0.3O2, the magnesium nitrate (Mg(NO3)2·6H2O) was
dissolved into deionized water and stirred at room temperature (25 ± 2 oC) for 30 min. 5 g of
commercial Ni0.5Co0.2Mn0.3(OH)2 (Henan Kelong New Energy Co., KL523) was then dispersed into
the above magnesium nitrate solution (20 mL) with continual stirring. The mixing solution was heated
at 100 ◦C until the water had evaporated, leaving black powder. Stoichiometric amounts of LiOH·H2O
(15% excess Li was used to compensate for possible Li loss during the sintering process [18]) were
mixed with the black powder by a dual axle planet type common rotation mixer, with zirconia balls,
for 2 h. The uniformly mixed powder was then heated at 900 oC for 8 h in an alumina crucible, to
obtain the Mg-doped LiNi0.5Co0.2Mn0.3O2.

Int. J. Electrochem. Sci., Vol. 8, 2013
8007
2.2 Characterization
The crystal structures of LiNi0.5Co0.2Mn0.3O2 and Mg-doped LiNi0.5Co0.2Mn0.3O2 materials
were examined by X-ray diffraction spectroscopy (XRD) (Rigaku D/max-b spectrometer) using Cu Kα
radiation with λ = 1.5406 Å. The surface morphology of the powders was obtained using a scanning
electron microscope (SEM) (JEOL JSM-6500F) equipped with an energy-dispersive spectrometer
(EDS).
2.3 Cell fabrication
The 18650-type cells were assembled in a dry room (Dew point:-50 to approximately -60 oC),
using a Celgard 2320 membrane as a separator and a double-sided cathode (thickness: 94 μm) and
anode (thickness: 84 μm). The cathode consisted 89 wt% active material (LiNi0.5Co0.2Mn0.3O2 or Mg-
doped LiNi0.5Co0.2Mn0.3O2), 4 wt% graphite powder KS-4 (Timcal), 2 wt% of Super P (Timcal), and
5 wt% polyvinylidene fluoride- PVDF (Kureha) as the binder. The composite electrode slurry was
coated onto aluminum foil (Nippon foil) and dried for 5 min at 110–130 oC in air, followed by 6 h in a
vacuum oven at 90 oC. The anode consisted of 96 wt% graphite (nature graphite) as the active material,
1 wt% of graphite powder KS-4 (Timcal), and 3 wt% of a water-based binder (LA-132). The electrode
slurry was coated onto copper foil (Nippon foil) and dried for 5 min at 110–130 oC in air, followed by
6 h in a vacuum oven at 90 oC. The cathode and anode dimensions were 55 mm × 950 mm and
57 mm × 980 mm, respectively. The electrodes were baked at 90 oC under vacuum prior to assembly in
a dry room. Approximately 6 mL of electrolyte was added followed by crimping the cell to seal it. The
electrolyte comprised 1M LiPF6 (Kishda) dissolved in a mixture of ethylene carbonate (EC) (Alfa-
Aesar), propylene carbonate (PC) (Alfa-Aesar), dimethyl carbonate (DMC) (Alfa-Aesar), and
ethylmethyl carbonate (EMC) (Alfa-Aesar) solvents in the volume ratio of 3:1:4:2 with 2 wt% of
vinylene carbonate (VC) electrolyte additive.
2.4 Electrochemical measurements
A cathode half cell system was assembled in a coin cell, and its electrochemical properties
were evaluated. Measurements were made using a potentiostat/galvanostat (HEKA-PG340 & CHI-
608d), with a charge-discharge range of 2.0-4.0 V. The Randles-Sevcik equation (Eq. 1) was used to
calculate the diffusion coefficient by plotting the peak current (ip) and the square root of the scan rate
(ν1/2
) for both the micro-electrode and the composite electrode:
ip = 2.69×10⁵
n3/2
AD1/2
C*ν
1/2 (1)
where ip is the peak current in amperes, F is the Faraday constant, C* is the initial
concentration in mol cm-3
, ν is the scan rate in Vs-1
, A is the electrode area in cm2, and D is the
diffusion constant in cm2s
-1.

Int. J. Electrochem. Sci., Vol. 8, 2013
8008
Electrochemical impedance spectroscopy (EIS) was examined in the frequency range of 10M
to 0.01 Hz with an AC amplitude of 5 mV.
The 18650 cells underwent galvanic cycling at room temperature (25 ± 2 oC) and at 60
oC at
constant current; the electrochemical analyzer cut-off voltages were set to 2.8 V and 4.3 V. The coin
cells were charged and discharged under constant current at ambient temperature (25 ± 2 oC) and at 10
oC, with the electrochemical analyzer cut-off voltages set during 2.8 V and 4.3 V versus the Li/Li
reduction potential.
2.5 Thermal stability
The thermal stabilities of Mg-doped and non-doped LiNi0.5Co0.2Mn0.3O2 were studied using
DSC (Perkin-Elmer, DSC 8500). The coin cell was charged to 4.3 V at 0.1 C and then disassembled in
a glove box. The electrode was washed with DMC and the DMC medium was then removed in
vacuum. Approximately 10 mg samples of the material were removed from the electrode by scraping
and sealed in gold-plated high-pressure copper pans. DSC scans were conducted under nitrogen at a
heating rate of 5 oC/min from 75 to 375
oC.
3. RESULTS AND DISCUSSION
3.1 Structural characterization
Figure 1. XRD spectrum of LiNi0.5Co0.2Mn0.3O2 and LiNi0.497Mg0.003Co0.2Mn0.3O2.
Fig. 1 shows the XRD pattern and Miller indices for Mg-doped and non-doped
LiNi0.5Co0.2Mn0.3O2. The main characteristic peaks were found at 2θ values of approximately 28o, 37
o,

Int. J. Electrochem. Sci., Vol. 8, 2013
8009
38.6o, 44.5
o, and 48
o, corresponding to the (003), (101), (006), (104), (105), and, (107) planes,
respectively. The figure shows that after sintering, the diffraction peaks of the two materials are
obviously strong and intense, indicating perfect crystalline structures. The patterns also confirm that
these two materials share the same single phase, the hexagonal α-NaFeO2 structure with the R 3 m
space group [19]. The XRD pattern for Mg-doped LiNi0.5Co0.2Mn0.3O2 shows an approximately 12%
lower diffraction intensity compared to pristine LiNi0.5Co0.2Mn0.3O2, and does not contain peaks from
any other crystal phases. Thus, Mg integrates into alternate layers of the [Ni0.5Co0.2Mn0.3O2](OH)2
precursor, substituting at some Ni sites during the synthesis process. The presence of Mg does not alter
the original Ni0.5Co0.2Mn0.3O2 structure. Compared to the directly synthesized precursor
[NixMgyCozMnmO2](OH)2, the proposed method provides a more stable compound. Because Mg2+
has
a lager ionic radius (r = 0.72 Å) than Ni
2+ (r
= 0.69Å), the lattice constants for Mg-doped
LiNi0.5Co0.2Mn0.3O2 were a = 2.8695 Å and c = 14.2401 Å, which are larger than the pristine
LiNi0.5Co0.2Mn0.3O2 constants (a = 2.8682 Å and c = 14.2386 Å). According to the reactant
stoichiometry and the current XRD analysis, this study concludes that the Mg-doped
LiNi0.5Co0.2Mn0.3O2 sample has the following stoichiometric formula: LiNi0.497Mg0.003Co0.2Mn0.3O2.
The (003) and (104) intensity ratios describe cation distribution within the lattice, and indicate the
degree of cation mixing in LiNi0.5Co0.2Mn0.3O2 [17]. In the case of the current study, the (003) and
(104) intensity ratios of LiNi0.497Mg0.003Co0.2Mn0.3O2 for cation mixing is l.33, indicating that this
material has a layered structure with limited cation mixing. The appearance of intense (006)/(102) and
(018)/(110) split peaks indicate a highly ordered layered structure, suggesting limited cation mixing in
LiNi0.497Mg0.003Co0.2Mn0.3O2.
3.2 DFT calcuations and simulation
This study performed a theoretical simulation to establish a model for understanding the
functional and energy characteristics of LiNi0.497Mg0.003Co0.2Mn0.3O2. Based on the results from XRD
patterns, the LiNi0.5Co0.2Mn0.3O2 and LiNi0.497Mg0.003Co0.2Mn0.3O2 models can be represented as
shown in Fig. 2. All assumptions and conditions of the parameter in the software is used to minimize
the energy of the model and are listed in the figure. According to the proposed model, the system
gradually relaxes to a balanced state at the energy minimum, indicating a stable structure. Convergence
is achieved when electrical forces on the relaxed atoms are less than 0.01 eV/Å. From the study
calculations, the total energy of each system exhibits a similar convergent trend after several dozen
iterations (Fig. 3). For DFT calculations, the Vienna ab initio simulation package (VASP) [26-29]
implements projector-augmented waves (PAW) [20-23] and generalized gradient approximation
(GGA) [24-25]. For plane wave calculations, the total energy convergence calculation for the
LiNi0.5Co0.2Mn0.3O2 (100) slab and the LiNi0.497Mg0.003Co0.2Mn0.3O2 (100) slab systems gave a cut-off
energy of 400 eV. To model the LiNi0.5Co0.2Mn0.3O2 (100) surface, slabs containing seven layers were
adopted, with 12 atoms per layer, as shown in Fig. 2a and 2c. The surface is constructed as a slab
within 3D periodic boundary conditions, and models are separated from their images in a direction
perpendicular to the surface by a 14 Å vacuum layer.

Int. J. Electrochem. Sci., Vol. 8, 2013
8010
Figure 2. The model of (a) top-view of LiNi0.5Co0.2Mn0.3O2(100) , and (b) top-view of
LiNi0.497Mg0.003Co0.2Mn0.3O2 (100), and (c) side-view of LiNi0.5Co0.2Mn0.3O2(100), and (d)
side-view of LiNi0.497Mg0.003Co0.2Mn0.3O2 (100), respectively.
The bottom two layers are kept fixed to the bulk coordinates; full atomic relaxations were
allowed for the top five layers. For these calculations, a 3 × 3 × 1 k-Point mesh was used for the 3 × 3
super cell. In the LiNi0.5Co0.2Mn0.3O2 (100) model, the super cell dimensions were
14.06 × 8.45 × 18.87 Å3.
The atoms in the model were allowed to relax until the forces on unconstrained atoms were less
than 0.01 eV/Å.
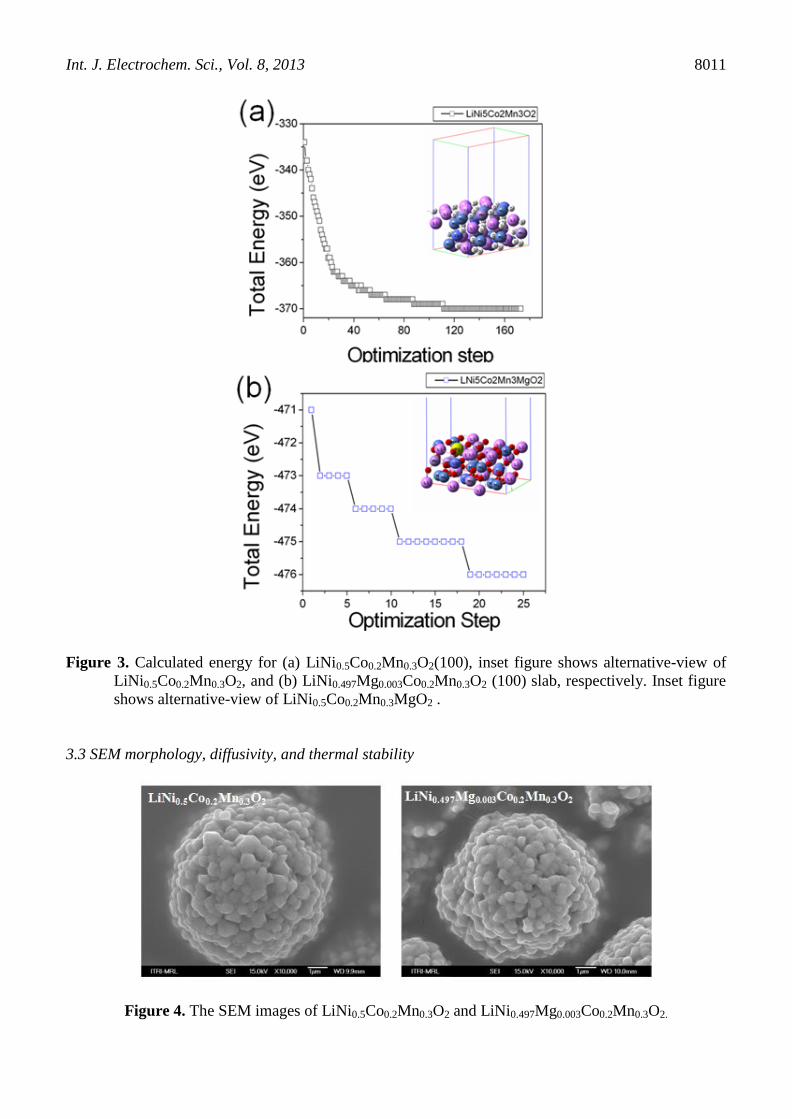
The results show that LiNi0.497Mg0.003Co0.2Mn0.3O2 has less total energy (-480.54 eV) than
LiNi0.5Co0.2Mn0.3O2 (-369.96 eV), indicating that Mg doping provides a relaxation interaction within
the lattice that maintains the LiNi0.5Co0.2Mn0.3O2 structure in a balanced state at an energy minima.
The data also demonstrate that LiNi0.497Mg0.003Co0.2Mn0.3O2 is stable at high temperatures because of
its highly stable infrastructure.
Int. J. Electrochem. Sci., Vol. 8, 2013
8011
Figure 3. Calculated energy for (a) LiNi0.5Co0.2Mn0.3O2(100), inset figure shows alternative-view of
LiNi0.5Co0.2Mn0.3O2, and (b) LiNi0.497Mg0.003Co0.2Mn0.3O2 (100) slab, respectively. Inset figure
shows alternative-view of LiNi0.5Co0.2Mn0.3MgO2 .
3.3 SEM morphology, diffusivity, and thermal stability
Figure 4. The SEM images of LiNi0.5Co0.2Mn0.3O2 and LiNi0.497Mg0.003Co0.2Mn0.3O2.

Int. J. Electrochem. Sci., Vol. 8, 2013
8012
Fig. 4 shows SEM images of LiNi0.5Co0.2Mn0.3O2 and LiNi0.497Mg0.003Co0.2Mn0.3O2. These two
materials are spherical secondary particles and their morphologies are similar. The secondary particle
sizes (D50) of LiNi0.5Co0.2Mn0.3O2 and LiNi0.497Mg0.003Co0.2Mn0.3O2 are in the range of 8-9 nm,
suggesting that Mg doping does not affect the morphology of the original LiNi0.5Co0.2Mn0.3O2.
We used the Randles-Sevcik equation to describe the Li+ ion diffusion behavior in the context
of either LiNi0.5Co0.2Mn0.3O2 or LiNi0.497Mg0.003Co0.2Mn0.3O2. The diffusion coefficient is estimated
from a plot of the scan rate versus the anodic peak current (Ipa). The red dashed line shown in the
figure for LiNi0.497Mg0.003Co0.2Mn0.3O2 has a slope of 1.091 × 10⁻¹²
cm2s
-1. The black solid line,
representing LiNi0.5Co0.2Mn0.3O2 (Fig. 5), has a lower slope of 8.751 × 10⁻¹³
cm2s
-1. Thus, the
LiNi0.497Mg0.003Co0.2Mn0.3O2 unit cell volume is increased by Mg doping because of the larger ionic
radius of Mg2+
compared to Ni2+
. Accordingly, lithium ions can easily diffuse through the augmented
lattice spaces, thus enhancing ionic transfer rates. Fig. 6 shows DSC profiles for LiNi0.5Co0.2Mn0.3O2
and LiNi0.497Mg0.003Co0.2Mn0.3O2 after charging to 4.3 V. The integrated area in the exothermic
direction represents the amount of heat generated from material decomposition, which results from the
release of oxygen [30]. The figure clearly shows that the LiNi0.497Mg0.003Co0.2Mn0.3O2 exothermic
onset temperature is shifted from 291 to 298 oC. In addition, the exothermic heat associated with
material decomposition at higher temperatures is also reduced from 516 to 500 J/g.
Figure 5. Cyclic voltammetry of LiCo0.5Ni0.2Mn0.3O2 and LiNi0.497Mg0.003Co0.2Mn0.3O2 to derive
lithium ion diffusion coefficient. The relationship of the peak current (ip) and the square root of
scan rate (ν1/2
)

Int. J. Electrochem. Sci., Vol. 8, 2013
8013
Figure 6. Differential scanning calorimetry profiles of LiNi0.5Co0.2Mn0.3O2 and
LiNi0.497Mg0.003Co0.2Mn0.3O2 after charged to 4.3V vs. Li/Li+
.
These results indicate that Mg doping improves the thermal stability of
LiNi0.497Mg0.003Co0.2Mn0.3O2 because the presence of Mg2+
cations in the inter-slab space provides
structural stability and maintains existing Mn-O bonds [30].
3.4 Electrochemical performance
In order to evaluate the amount effects of Mg doping into LiNi0.5Co0.2Mn0.3O2 structure, the 0.3
mol % and 3 mol % of Mg has been used to replace Ni position. Fig. 7a presents the charge and
discharge curves of LiNi0.5Co0.2Mn0.3O2, LiNi0.497Mg0.003Co0.2Mn0.3O2 and LiNi0.47Mg0.03Co0.2Mn0.3O2.
It is clear to observe that the discharge capacity has been improve by Mg doping. The discharge
capacity of LiNi0.497Mg0.003Co0.2Mn0.3O2 and LiNi0.47Mg0.03Co0.2Mn0.3O2 show 167 and 164 mAh g-1
,
which are all greater than LiNi0.5Co0.2Mn0.3O2. However, the discharge curves cannot reveal the
difference to the amount effects of Mg doping. Fig. 7b shows the incremental capacity analysis of
discharge curves of three samples. According to this figure, the curves of LiNi0.497Mg0.003Co0.2Mn0.3O2
and LiNi0.47Mg0.03Co0.2Mn0.3O2 slightly shift to the left side, representing the 0.3 mol % of Mg doping
influences the average working voltage of cathodic reaction. This polarization is more obvious when
the 3 mol % of Mg has doped into LiNi0.5Co0.2Mn0.3O2, indicating a serious electrochemical reaction of
Mg takes place. In addition, the 3 mol % of Mg ion reduction and its reduction reaction potential also
reveal clearly at 3.68V (a shoulder transition potential) rather than 0.3 mol % of Mg ion. Therefore, the

Int. J. Electrochem. Sci., Vol. 8, 2013
8014
above analysis shows 3 mol % of Mg is too much that doped into LiNi0.5Co0.2Mn0.3O2, although the
discharge capacity has been improved. A microelectrode linked cyclic voltammetry [31] will be
employed to evaluate the intrinsic diffusion properties and the Mg doping effects of the bulk
LiNi0.497Mg0.003Co0.2Mn0.3O2 in which compares LiNi0.5Co0.2Mn0.3O2.
Figure 7. (a) The charge-discharge curves and (b) the incremental capacity of discharge curve of
LiNi0.5Co0.2Mn0.3O2, LiNi0.497Mg0.003Co0.2Mn0.3O2 and LiNi0.47Mg0.03Co0.2Mn0.3O2 at room
temperature.
Figure 8. The Nyquist plot of the coin cell using LiNi0.5Co0.2Mn0.3O2 and LiNi0.497Mg0.003Co0.2Mn0.3O2
as the cathode electrode at (a) room temperature and (b) 10℃ measurements.

Int. J. Electrochem. Sci., Vol. 8, 2013
8015
Figs. 8a and 8b show the Nyquist plot of the coin cells after discharged. According to these
results, it is clear to indicate that the LiNi0.497Mg0.003Co0.2Mn0.3O2 cell provides a smaller semi circle,
representing the lower impedance (60.8 Ω) of the cell compare to the pristine LiNi0.5Co0.2Mn0.3O2
(69.1Ω) at room temperature measurement. The same behavior at 10 oC measurement, the cell that
employed LiNi0.497Mg0.003Co0.2Mn0.3O2 electrode shows lower impedance (187.2 Ω) compare to the
pristine LiNi0.5Co0.2Mn0.3O2 (228.6 Ω) duo to the 0.3 mol % of Mg doping in which enhances the ionic
diffusion.
Figure 9. The rate discharge curves of LiNi0.5Co0.2Mn0.3O2 and LiNi0.497Mg0.003Co0.2Mn0.3O2 at (a)
room temperature, (b)10℃ and the cycle life test at (c) room temperature, (d) 60 ℃.
Figs. 9a and 9b show the discharge rate performance of the lithium ion battery at room
temperature and at 10 oC, respectively. Fig. 9a and Table 1 show that the discharge capacity at 0.1 C of
167 mAh g-1
for LiNi0.497Mg0.003Co0.2Mn0.3O2 is approximately 4.3% greater than the
LiNi0.5Co0.2Mn0.3O2 of 160 mAh g-1
. However, the working voltage plateau of 3.74 V and the open
circuit voltage of 4.28 V are the same for both compounds, indicating that the molar ratio of lithium
ions in the LiNi0.497Mg0.003Co0.2Mn0.3O2 structure is greater than 1. According to the XRD results, the
a- and c-axes of the LiNi0.497Mg0.003Co0.2Mn0.3O2 structure are longer than those of
LiNi0.5Co0.2Mn0.3O2, indicating that the unit cell space in the LiNi0.497Mg0.003Co0.2Mn0.3O2 structure

Int. J. Electrochem. Sci., Vol. 8, 2013
8016
can accommodate an excess of lithium ions more effectively than the LiNi0.5Co0.2Mn0.3O2 interstices
can. Thus, the atomic ratio for LiNi0.5Co0.2Mn0.3Mg0.002O2 was recalculated based on the improved
discharge capacity, and the stoichiometric ratio was redefined to Li1.1Ni0.497Mg0.003Co0.2Mn0.3O2.
Fig. 9b and Table 1 show that the improvement in discharge capacity becomes significant at 10 oC.
This study attributed these improvements to the increases in ionic diffusion that is a result of Mg
doping. The resulting discharge capacity is enhanced by more than 12%. This suggests that doping
with Mg generates two benefits that improve capacity: the ability to store more lithium ions, and an
increased rate caused by the resulting high electric conductivity of this material.
Table 1. Charge and discharge capacity of (a) LiNi0.5Co0.2Mn0.3O2 and (b)
LiNi0.497Mg0.003Co0.2Mn0.3O2 at 0.1C.
Compound Charge Discharge Irr (%)
LiNi0.5Co0.2Mn0.3O2---RT 186 160 26
LiNi0.497Mg0.003Co0.2Mn0.3O2---RT 191 167 24
LiNi0.5Co0.2Mn0.3O2---10℃ 183 156 27
LiNi0.497Mg0.003Co0.2Mn0.3O2---10℃ 195 175 20
Unit: mAh g-1
Table 2. Discharge rate capacity of (a) LiNi0.5Co0.2Mn0.3O2 and (b) LiNi0.497Mg0.003Co0.2Mn0.3O2.
Compound 0.1C 0.5C 1.0C 2.0C
LiNi0.5Co0.2Mn0.3O2---RT 160 149 142 134
LiNi0.497Mg0.003Co0.2Mn0.3O2---RT 167 155 148 139
LiNi0.5Co0.2Mn0.3O2---10℃ 156 132 123 110
LiNi0.497Mg0.003Co0.2Mn0.3O2---10℃ 175 149 141 126
Unit: mAh g-1
Figs. 9c and 9d show the cycle-ability performance at room temperature and at 60 oC,
respectively. According to the figures and Table 2, the durability of a cell incorporating
Li1.1Ni0.497Mg0.003Co0.2Mn0.3O2 as the cathode material maintains excellent performance. Under 80%
retention cycle duration testing, Li1.1Ni0.497Mg0.003Co0.2Mn0.3O2 provided nearly 25% retention at room
temperature and 66% retention at 60 oC compared to the retention of LiNi0.5Co0.2Mn0.3O2 at those
temperatures, confirming the DSC and DFT simulation-based forecasts that
Li1.1Ni0.497Mg0.003Co0.2Mn0.3O2 is an excellent candidate for electrical vehicle applications.
4. CONCLUSION
Li1.1Ni0.497Mg0.003Co0.2Mn0.3O2 was prepared using a solid-state methodology. Mg doping did
not alter the phase from that of the pristine material, and no impurities were observed in the XRD

Int. J. Electrochem. Sci., Vol. 8, 2013
8017
spectrum. The DSC results of delithiated Li1.1Ni0.497Mg0.003Co0.2Mn0.3O2 indicate superior thermal
stability, with a higher temperature exothermic onset reaction compared to that of the pristine material,
LiNi0.5Co0.2Mn0.3O2. Electrochemical testing of 18650 cells revealed that cycle retention is greatly
improved over that of the non-doped material, particularly at elevated temperatures. The Mg-modified
cells also exhibited excellent discharge rates performance at 10 oC. The current study findings reveal
important evidence that Mg doping enhances ionic diffusion and extends the space available within the
crystal lattice for excess lithium ions storage. Furthermore, Mg doping minimizes the balance state of
energy in the structure, thus improving thermal stability.
ACKNOWLEDGEMENT
This research is supported by the Ministry of Economic Affairs, R.O.C (No.B354DN3100). The
authors are also grateful for the financial support from the National Science Council of Taiwan, R. O.
C, under Grant NSC 100-2628-E-011-018-MY2, 100-2923-E-011-001-MY3, 102-3113-E-011-002,
and 102-ET-E-011-003-ET.
References
1. J. M. Tarascon, M. Armand, Nature 414 (2001) 359.
2. B. Scrosati, J. Garche, J. Power Sources 195 (2010) 2419.
3. Y. G. Guo, J. S. Hu, L. J. Wan, Adv. Mater. 20 (2008) 2878.
4. M. Armand, J. M. Tarascon, Nature 451 (2008) 652.
5. P. G. Bruce, Solid State Ionics 179 (2008) 752.
6. F. Wu, M. Wang, Y. F. Su, L.Y. Bao, S. Chen, J. Power Sources 195 (2010) 2362.
7. T. Ohzukua, R. J. Brodd, J. Power Sources 174 (2007) 449.
8. S. W. Oh, S. H. Park, C. W. Park, Y. K. Sun, Solid State Ionics 171 (2004) 167.
9. M. Yoshio, H. Noguchi, J. Itoh, M. Okada, T. Mouri, J. Power Sources 90 (2000) 176.
10. D. C. Li, Y. Sasaki, M. Kageyama, K. Kobayakawa, Y. Sato, J. Power Sources 148 (2005) 85.
11. N. Yabuuchi, T. Ohzuku, J. Power Sources 119-121 (2003) 171.
12. Z. Liu, A. Yu, J Y. Lee, J. Power Sources 81-82 (2003) 416.
13. S. H. Park, C. S. Yoon, S. G. Kang, H. S. Kim, S. I. Moon, Y. K. Sun Electrochim. Acta 49 (2004)
557.
14. A. Deba, U. Bergmann, S. P. Cramer, E. J. Cairns, J. Appl. Phy. 97 (2005) 113523.
15. S. Dou, W. Wang, J. Solid State Electrochem. 15 (2011) 399.
16. J. S. Arias, C. V Rao, J Shojan, A Manivannan, L. Torres, Y Ishikawa, R S Katiyar, J. Power
Sources 211 (2012) 12.
17. P. Y. Liao, J. G. Duh, H. S. Sheu, J. Power Sources 183 (2008) 766.
18. B. Lin, Z. Wen, Z. Gu, X. Xu, J. Power Sources 174 (2007) 544.
19. K. Yang, L. Z. Fan, J. Guo, X. Qu, Electrochim. Acta 63 (2012) 364.
20. D. Vanderbilt, Phys. Rev. B: Condens. Matter 41 (1990) 7892.
21. P. E. Blochl, Phys. Rev. B: Condens. Matter 50 (1994) 17953.
22. M. C. Payne, M. P. Teter, D. C. Allan, T. A. Arias, J. D. Joannopoulos, Rev. Mod. Phy. 64 (1992)
1045.
23. G. Kresse, D. Joubert, Phys. Rev. B: Condens. Matter 59 (1999) 1758.
24. P. Hu, D. A. King, S. Crampin, M. H. Lee, M. C. Payne, Chem. Phys. Lett. 230 (1994) 501.
25. J. P. Perdew, J. A.Chevary, S. H. Vosko, K. A. Jackson, M. R. Pederson, D. J. Singh, C. Fiolhais,
Phys. Rev. B: Condens. Matter 46 (1992) 6671.
Int. J. Electrochem. Sci., Vol. 8, 2013
8018
26. G. Kresse, J. Hafner, Phys. Rev. B: Condens. Matter 47 (1993) 558.
27. G. Kresse, J. Furthmuller, Phys. Rev. B: Condens. Matter 54 (1996) 11169.
28. G. Kresse, J. Furthmuller, Comp. Mater. Sci. 6 (1996) 15..
29. K. Dokko, S. Koizumi, K. Sharaishi, K. Kanamura, J. Power Sources 165 (2007) 656.
30. C. W. Lee, Y. K. Sun, J. Prakash. Electrochim. Acta 49 (2004) 4425.
31. Y. H. Huang, F. M. Wang, T. T. Huang, J. M. Chen, B. J. Hwang, J. Rick, Int. J. Electrochem. Sci.,
7 (2012) 1205.
© 2013 by ESG (www.electrochemsci.org)