syntheses and dna interactions of acridine and
TRANSCRIPT
Georgia State University Georgia State University
ScholarWorks @ Georgia State University ScholarWorks @ Georgia State University
Chemistry Dissertations Department of Chemistry
12-4-2006
Syntheses and DNA Interactions of Acridine and Phenothiazine Syntheses and DNA Interactions of Acridine and Phenothiazine
Based Photosensitizers Based Photosensitizers
Beth Wilson
Follow this and additional works at: https://scholarworks.gsu.edu/chemistry_diss
Part of the Chemistry Commons
Recommended Citation Recommended Citation Wilson, Beth, "Syntheses and DNA Interactions of Acridine and Phenothiazine Based Photosensitizers." Dissertation, Georgia State University, 2006. https://scholarworks.gsu.edu/chemistry_diss/8
This Dissertation is brought to you for free and open access by the Department of Chemistry at ScholarWorks @ Georgia State University. It has been accepted for inclusion in Chemistry Dissertations by an authorized administrator of ScholarWorks @ Georgia State University. For more information, please contact [email protected].

Syntheses and DNA Interactions of
Acridine and Phenothiazine Based Photosensitizers
by
Beth Wilson
Under the Direction of Dr. Kathryn B. Grant
ABSTRACT
Photosensitizing molecules and/or metal complexes that interact with DNA via
intercalation and groove binding have potential applications as molecular structural
probes, as footprinting reagents and in photodynamic therapeutics. To this regard, small
molecules that bind to DNA and the energetics involved in these interactions, acridine-
based therapeutics, photosensitization, photodynamic therapy, phenothiazine-mediated
photosensitization, DNA photocleavage reaction mechanisms and photosensitizing metal
complexes are introduced in Chapter I. Next, in Chapter II, the synthesis of a
photonuclease consisting of a 3,6-acridinediamine chromophore attached to four metal-
coordinating imidazole rings is described. The DNA photocleavage yields, emission
quantum yields, and thermal denaturation studies by this acridine-imadazole conjugate in
the presence of 16 metal salts are also reported. In Chapter III is the synthesis of a
bisacridine covalently tethered to a copper(II)-binding pyridine linker. Additionally,
DNA photocleavage studies as well as DNA binding affinity and binding mode(s) of this
bisacridine incorporating the copper(II)-binding pyridine linker are examined. The
syntheses, characterization, DNA photocleavage studies, DNA thermal denaturation, and

viscometric measurements of three new phenothiazinium photosensitizers are described
in Chapters IV and V. Collectively, markedly enhanced DNA photocleavage yields are
observed in the presence of metals (Chapters II-III) or in comparison to a parent
molecule, Chapters II and IV. DNA melting isotherms show higher levels of duplex
stabilization with the acridines, specifically in the presence of several metals (Chapter II-
III) as well as with the phenothiazine-based ligands (Chapters IV-V). Moreover, different
DNA binding modes were observed depending on metal complexation (Chapter III) and
nucleic acid structure (Chapter IV). Finally, Chapter VI describes a small project
implemented as a National Science Foundation pedagogical laboratory exercise in which
a non-invasive procedure for DNA isolation from human cheek cells was utilized with
the polymerase chain reaction to amplify alleles encoding a single nucleotide
polymorphism involved in normal human color vision.
INDEX WORDS: Acridine, Allele-specific polymerase chain reaction, DNA photosensitization, Metal-assisted photocleavage, Phenothiazine, Photodynamic therapy

SYNTHESES AND DNA INTERACTIONS OF
ACRIDINE AND PHENOTHIAZINE BASED PHOTOSENSITIZERS
by
Beth Wilson
A Dissertation Submitted in Partial Fulfillment of Requirements for the Degree of
Doctor of Philosophy
in the College of Arts and Sciences
Georgia State University
2006

Copyright by
Beth Wilson and Dr. Kathryn B. Grant
2006

Syntheses and DNA Interactions of
Acridine and Phenothiazine Based Photosensitizers
by
Beth Wilson
Chair: Dr. Kathryn B. Grant Committee: Dr. Alfons L. Baumstark
Dr. Lucjan Strekowski
Electronic Version Approved by:
Office of Graduate Studies College of Arts and Sciences Georgia State University December 2006
iv
Acknowledgments
First and foremost, I dedicate this dissertation to Ms. Margie Oquendo. Margie
and I met as kids while growing up in Chicago. Our friendship, love and admiration for
one another has spanned over three decades. Margie is my friend, sister, doppleganger
and a true constant in my life. In our lives, we have shared many moments of sadness but
also of great joy. Our love continues to be transcribed and our friendship will forever be
translated.
Next, I would like to thank two individuals who have been the most instrumental
in my doctoral work and professional life. First I thank, Professor Baumstark for
discovering me (as he has said to me, “I remember when you took my 3110 class, you
used to sit in the corner by the sink…”) but more importantly for believing in me. He
then introduced me to Professor Grant; my advisor, mentor, and friend. Professor Grant
has shown me the path towards becoming a very conscientious scientist and has taught
me to always play hard, even if I did not expect to win. Thank you both, I sincerely hope
that I have made and continue to make you proud.
Fortuitously, I had the honor of working with Professors Lorente and Fernández
(Universidad de Alcalá, Spain). They have been terrific mentors (always there to provide
words of wisdom and scientific guidance), collaborators, and friends.
I gratefully acknowledge and extend my sincere thanks to Professor Strekowski
for serving as a member in my defense committee, for his instruction, and for his many
helpful organic discussions. Moreover, I am deeply grateful to Professors Dixon,
Germann, Netzel and Wilson for their dedication, instruction, insightful discussions and
for allowing me to utilize their laboratory space as well as equipment. Collectively, I
v
thank the Department of Chemistry staff and faculty members, in particular, Dr.
Chandrasekaren for always being generous with their limited time.
Personally, I thank my best friends the beautiful Miki Kassai, the fabulous
Subrata Mishra and the dashing Pete Issa for all the joy and laughter we shared. I love
you guys and I will miss my everyday encounters with you very much. In addition, I
thank my family, in particular, my brother Carlos for being a special and an extraordinary
human being.
Also I am grateful to past and present friends in the Grant group: Dr. Tjasa
Bantan-Polak, Dr. Lourdes Gude, Dr. Ghana Ravi, Dr. Xia Yang, Earl Fields and Sarah
Shealy.
Finally, I would like to extend my devout appreciation to Dr. Walter T. Wilson
for always loving, believing in, and caring for me even through difficult times.

vi
Table of Content
Acknowledgments iv
List of Tables xiii
List of Figures xiv
List of Schemes xviii
List of Abbreviations xix
CHAPTER I. Introduction 1
Small Molecules and DNA Interaction 1
Intercalation 1
Groove Binding 3
Bisintercalation 4
Energetics of Ligand-DNA Binding 5
Acridines 7
Phenothiazines 9
Photosensitization 9
Photodynamic Therapy 10
Phenothiazines as PDT Agents 11
DNA Damage and Photosensitization 14
Hydroxyl Radical Mediated Deoxyribose Damage 16
Hydroxyl Radical Mediated Base Damage 17
Electron Transfer and Singlet Oxygen Mediated DNA Damage 18
DNA Damage by Photoactive Agents 19
DNA Damage by Metal Complexes 21

vii
Photofootprinting 23
Specific Aims 24
References 28
CHAPTER II. Tunable DNA Photocleavage by an Acridine-Imadazole Conjugate 34
Abstract 34
Introduction 35
Results and Discussion 37
Synthesis 37
1H NMR Spectroscopy 40
Mass Spectrometry 41
Photocleavage Experiments 42
pH Profile 45
Inhibition of DNA Photocleavage 48
Photocleavage at Lower Concentrations 50
Absorbance and Emission Studies 51
Thermal Denaturation Studies 54
Spectrophotometric Determination of Fe(II) and V(IV) 57
Conclusions 65
Experimental Section 65
General Methods 65
Synthesis 67
Photocleavage Experiments 74
Thermal Melting Studies 75
viii
Scavenger Experiments 76
Quantum Yield Measurements 76
Colorimetric Detection of Fe(II) 77
Colorimetric Detection of V(IV) 77
References 79
Supporting Information 85
CHAPTER III. Copper-Activated DNA Photocleavage by a Pyridine-Linked Bis-
Acridine Intercalator 86
Abstract 86
Introduction 87
Materials and Methods 88
General Procedures 88
Synthesis 90
Viscometric Titrations 92
Competition Dialysis Assay 92
Thermal Melting Studies 94
Photocleavage of Supercoiled Plasmid DNA 94
Colorimetric Detection of Copper(I) 95
Inhibition of DNA Photocleavage 95
DNA Photocleavage at Nucleotide Resolution 96
Results and Discussion 97
Synthesis of Ligand 4 97
Viscometric Analysis 98

ix
Electrospray Ionization Mass Spectrometry 99
Competition Dialysis 100
Thermal Melting Studies 102
Photocleavage of Supercoiled Plasmid DNA 103
Colorimetric Detection of Copper(I) 105
Inhibition of DNA Photocleavage 107
DNA Photocleavage at Nucleotide Resolution 109
Conclusion 112
Footnotes 112
Literature Cited 114
Supporting Information 122
CHAPTER IV. Synthesis and DNA Interactions of a Bis-Phenothiazinium
Photosensitizer 126
Abstract 126
Introduction 127
Results and Discussion 129
Synthesis 129
UV-Visible Spectrophotometry 130
Photocleavage Experiments 131
Inhibition of DNA Photocleavage 133
DNA Photocleavage at Nucleotide Resolution 134
Thermal Denaturation Studies 137
Viscosity Assays 139

x
Conclusion 142
Experimental Section 143
General Methods 143
Synthesis 144
UV-Visible Spectrophotometry 146
Photocleavage Experiments 147
Inhibition of DNA Photocleavage 148
DNA Photocleavage at Nucleotide Resolution 148
Thermal Denaturation Studies 149
Viscosity Assays 150
Circular Dichroism Analysis 151
References 152
Supporting Information 156
CHAPTER V. Syntheses and DNA Photocleavage by Phenothiazinium-Piperazinexylene
Intercalators 161
Abstract 161
Introduction 161
Results and Discussion 163
Synthesis 163
UV-Visible Spectrophotometry 166
DNA Photocleavage 168
DNA Thermal Denaturation 170
Viscosity Measurements 172

xi
Conclusions 173
Experimental 174
General Methods 174
Synthesis 175
UV-Visible Spectrophotometry 179
DNA Photocleavage 179
Thermal Melting Studies 180
Viscosity Measurements 180
References 182
CHAPTER VI. Allele-Specific PCR-Based Genotyping of a Normal Variation in Human
Color Vision 184
Abstract 184
Introduction 184
Molecular Basis for Human Color Vission 185
DNA Extraction from Buccal Cells 186
Allele-Specific PCR 187
Experimental Procedure 187
Hazards 189
Results and Discussion 189
Conclusion 190
Notes 191
Literature Cited 192
Supplemental Material 193

xii
Part 1: DNA Extraction from Buccal Cell Samples using a QIAampTM DNA Mini
Kit 193
Experimental Procedure 193
Commentary 195
Instructor’s Notes 196
Literature Cited 196
Part 2: PCR Protocol, Genotyping a Serine/Alanine Polymorphism of the Long-
Wavelength Cone Opsin in Normal Human Color Vision 197
Experimental Procedure 197
Commentary 199
Instructor’s Notes 200
Literature Cited 201
Part 3: Agarose Gel Electrophoresis, Genotyping a Serine/Alanine Polymorphism
of the Long-Wavelength Cone Opsin in Normal Human Color Vision 202
Experimental Procedure: Gel Pouring Demonstration 202
Experimental Procedure: Loading and Running the Gel Demonstration 203
Commentary 205
Instructor’s Notes 206
Literature Cited 207
Hazards 207
Product Information and Manufacturers 208
Buffer Preparation 210
SUMMARY 211

xiii
List of Tables
Table 2.1. Zn(II) and Fe(III)-assisted photocleavage of pUC19 DNA by acridine orange,
proflavin, 7 and 10 45
Table 2.2. % DNA photocleavage by compound 7 as a function of buffer and pH 47
Table 2.3. % Inhibition of metal-assisted DNA photocleavage 50
Table 2.4. Absorbance, emission and thermal melting data 52
Table 3.1. Apparent association constants obtained by competition dialysis 102
Table 3.S1. Nucleic acid samples used in competition dialysis experiments 122
Table 3.2. Average % inhibition of DNA photocleavage by scavengers and BCS 109
Table 4.1. Absorbance data 131
Table 4.S1. Absorbance data at 10 µM of dye 156
Table 4.2. Percent inhibition of DNA photocleavage by compound 3 and MB 134
Table 4.S2. . Absorbance data at irradiation wavelength for 1 µM of dye 156
Table 5.1. Absorbance data 167

xiv
List of Figures
Figure 1.1. Representative classical and non-classical intercalators and groove binding
agents 2
Figure 1.2. Structures and high resolution DNA complexes of the bisintercalators
ditercalinium and WP631 5
Figure 1.3. Structures of medically important acridines 8
Figure 1.4. Structures of FDA approved PDT drugs 11
Figure 1.5. Structures of photoactive phenothiazinium salts 13
Figure 1.6. Mechanisms involved in DNA photosensitization 15
Figure 1.7. Fe(II)-bleomycin mediated C-4’ hydrogen atom abstraction 17
Figure 1.8. Hydroxyl radical, electron transfer, and singlet oxygen mediated guanine
base modifications 19
Figure 1.9. Anthraquinone and acridizinium DNA photocleaving agents 20
Figure 1.10. Representative DNA photocleaving metal complexes 22
Figure 1.11. Structures of acridine based photofootprinting reagents 24
Figure 2.1. A histogram depicting metal-assisted photocleavage of pUC19 plasmid DNA
by compounds 7 and 10 43
Figure 2.S1. The 3,6-acridinediamines 7, 10, acridine orange, and proflavin 85
Figure 2.2. Photograph of 1.0% non-denaturing agarose gel showing photocleavage of
pUC19 plasmid DNA by compound 7 and ZnCl2 44
Figure 2.3. Effects of compound 7 and ZnCl2 on calf thymus DNA melting as a function
of pH 48
Figure 2.4. A histogram depicting metal-assisted photocleavage of pUC19 plasmid DNA
xv
at lower concentrations 51
Figure 2.5. UV-visible spectra to detect the formation of Fe(II) and V(IV) 59
Figure 2.6. Fenton reaction 60
Figure 2.7. Synopsis graphic 84
Figure 3.1. Change in relative DNA contour length (η/ηo)1/3 of calf thymus DNA as a
function of the molar ratio of reagent to DNA bp 100
Figure 3.S1. Positive ion ESI mass spectrum showing complexes formed between ligand
4 and CuCl2 123
Figure 3.2. A bar graph representing the concentrations of DNA-bound ligand 4 detected
in competition binding dialysis experiments 101
Figure 3.S2 Histogram showing photocleavage of pUC19 plasmid DNA as a function of
ligand 4 and CuCl2 concentrations 124
Figure 3.3. Thermal melting curves and Tm values of calf thymus DNA in the absence and
presence of ligand 4 and CuCl2 103
Figure 3.S3. A storage-phosphor autoradiogram of DNA photocleavage products
resolved on a 10.0% denaturing polyacrylamide gel 125
Figure 3.4. A photograph of a 1.0% non-denaturing agarose gel showing photocleavage
of pUC19 plasmid DNA by 4 and in the presence of CuCl2 105
Figure 3.5. UV-visible spectra to assay for Cu(I)-BCS complex formation 107
Figure 3.6. Proposed model in which superoxide, hydrogen peroxide, and Cu(I)
contribute to the formation of Cu(I)-peroxide complex 109
Figure 3.7. Cleavage plots of a representative 40 bp DNA sequence as determine by DNA
photocleavage at nucleotide resolution assays 111

xvi
Figure 4.1. UV-visible spectra of compound 3 and in the presence of calf thymus DNA
and 1% SDS 130
Figure 4.S1. Proton NMR spectrum of compound 3 157
Figure 4.2. Bar graphs showing photocleavage of pUC19 plasmid DNA by compound 3
and MB as a function wavelength and irradiation time 132
Figure 4.S2. Aromatic region with integration of 1H spectrum of compound 3 158
Figure 4.3. A photograph of a 1.0% non-denaturing agarose gel showing photocleavage
of pUC19 plasmid DNA by compound 3 and MB as a function of concentration 133
Figure 4.S3. Aliphatic region with integration of 1H spectrum of compound 3 159
Figure 4.4. Cleavage plots of a representative 40 bp DNA sequence as determine by DNA
photocleavage at nucleotide resolution assays 136
Figure 4.S4. Viscometric measurements of alternating poly[(dA-dT)]2 DNA or
poly(dA) )•poly(dT) with compound 3 and MB 160
Figure 4.5. DNA melting curves of calf thymus DNA, 3, and MB and ΔTm as a function
of the molar ratio of dye to DNA bp 138
Figure 4.6. DNA melting curves of Clostridium perfringens DNA, 3, and MB 139
Figure 4.7. Viscometric measurements of calf thymus DNA in the presence of compound
3 and MB 141
Figure 4.8. CD spectra of compound 3 and poly(dA)•poly(dT) DNA 142
Figure 4.9. Table of content graphic 155
Figure 5.1. UV-visible spectra of compounds 5 and 6 and in the presence of calf thymus
DNA and 1.0% SDS 167
Figure 5.2. A photograph of a 1.0% non-denaturing agarose gel showing photocleavage
xvii
of pUC19 plasmid DNA by compounds 5 and 6 as a function of concentration 169
Figure 5.3. A bar graph showing photocleavage of pUC19 plasmid DNA by compounds 5
and 6 as a function of irradiation time 170
Figure 5.4. Melting curves of calf thymus DNA, compounds 5 and 6 171
Figure 5.5. Viscosity Measurements of calf thymus DNA with compounds 5 and 6 173
Figure 6.1. Allele-specific PCR amplification of two human red cone opsin polymorphic
variants 188
Figure 6.2. Photographs of 1.0% non-denaturing agarose gels showing human red cone
opsin allele-specific PCR reactions 190

xviii
List of Schemes
Scheme 2.1. Synthesis of N-(2-chloroethyl)-N-[1-(triphenylmethyl)-1H-imidazol-4-
ylmethyl]-1-(triphenylmethyl)-1H-imidazole-4-methanamine 38
Scheme 2.2. N-(2-Chloroethyl)-N-[1-(triphenylmethyl)-1H-imidazol-4-ylmethyl]-1-
(triphenylmethyl)-1H-imidazole-4-methanamine 39
Scheme 2.3. Synthesis of N,N’-Bis[2-[bis(1H-imidazol-4-ylmethyl)amino]ethyl]-3,6-
acridinediamine 40
Scheme 3.1. Synthesis 2,6-Bis{[((6-amino-acridin-3-yl)methoxycarbonylamino)-
ethyl]methylaminomethyl} pyridine 98
Scheme 4.1. Synthesis of N,N'-Bis[(7-dimethylamino)phenothiazin-5-ium-3-yl]-4,4'-
ethylenedipiperidine diiodide 129
Scheme 5.1. Preparation of 3-(dimethylamino)phenothiazin-5-ium triiodide 164
Scheme 5.2. Preparation of 1,1’-[1,4-Phenylenebis(methylene)]bispiperazine 165
Scheme 5.3. Syntheses of 7-dimethylamino-3-(1,1’-[1,4-phenylenebis (methylene)
bispiperazine])phenothiazin-5-ium iodide and N,N’-bis[(7-dimethylamino)
and phenothiazin-5-ium-3-yl]-1,1’-[1,4 phenylenebis(methylene)bispiperazine]
diiodide 165
xix
List of Abbreviations
AO acridine orange
BSC bathocuproinedisulfonic acid disodium salt hydrate
bp base pair
CP DNA Clostridium perfringens DNA
CT DNA calf thymus DNA
DMF N, N’-dimethylformamide
DMMB 1,9-dimethyl methylene blue
DMSO dimethyl sulfoxide
EDTA ethylenediaminetetraacetic acid
ESI electrospray ionization
EtOH ethanol
FDA Food and Drug Administration
H2O2 hydrogen peroxide
MB methylene blue
NMB 2,8-dimethyl methylene blue
NMR nuclear magnetic resonance
P proflavin
PCR polymerase chain reaction
PDT photodynamic therapy
SDS sodium dodecyl sulfate
SOD superoxide dismutase
1
CHAPTER I
Introduction
Small Molecules and DNA Interactions
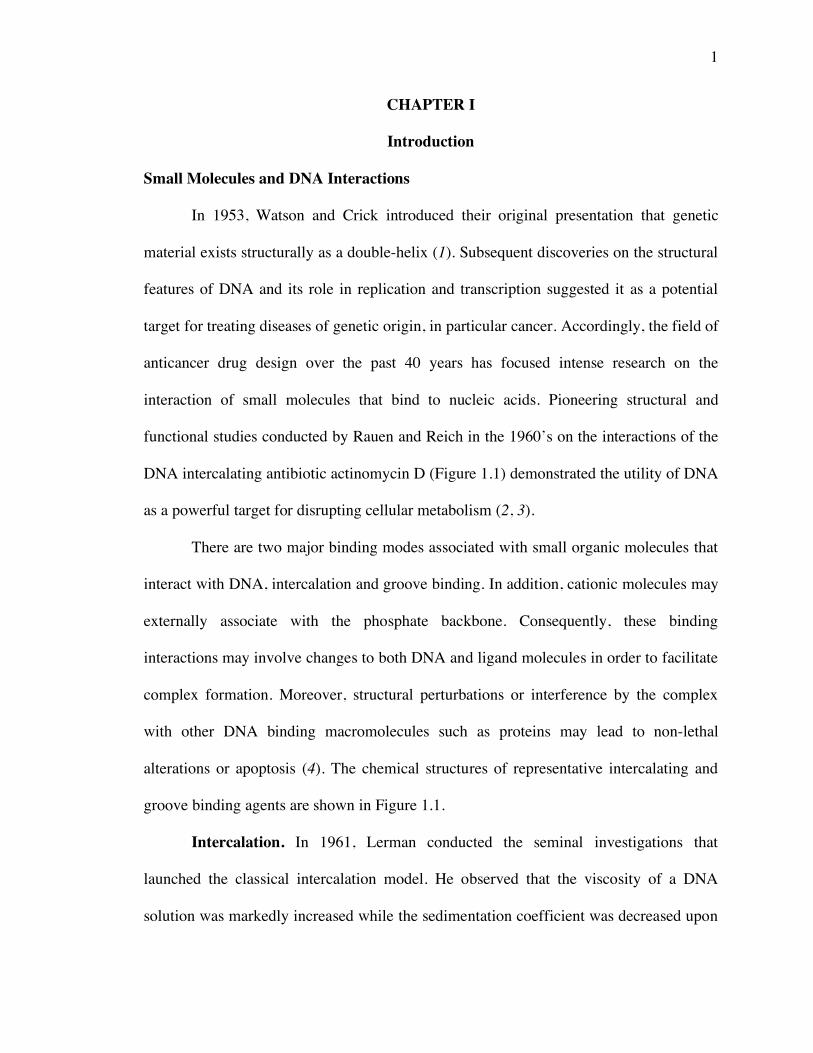
In 1953, Watson and Crick introduced their original presentation that genetic
material exists structurally as a double-helix (1). Subsequent discoveries on the structural
features of DNA and its role in replication and transcription suggested it as a potential
target for treating diseases of genetic origin, in particular cancer. Accordingly, the field of
anticancer drug design over the past 40 years has focused intense research on the
interaction of small molecules that bind to nucleic acids. Pioneering structural and
functional studies conducted by Rauen and Reich in the 1960’s on the interactions of the
DNA intercalating antibiotic actinomycin D (Figure 1.1) demonstrated the utility of DNA
as a powerful target for disrupting cellular metabolism (2, 3).
There are two major binding modes associated with small organic molecules that
interact with DNA, intercalation and groove binding. In addition, cationic molecules may
externally associate with the phosphate backbone. Consequently, these binding
interactions may involve changes to both DNA and ligand molecules in order to facilitate
complex formation. Moreover, structural perturbations or interference by the complex
with other DNA binding macromolecules such as proteins may lead to non-lethal
alterations or apoptosis (4). The chemical structures of representative intercalating and
groove binding agents are shown in Figure 1.1.
Intercalation. In 1961, Lerman conducted the seminal investigations that
launched the classical intercalation model. He observed that the viscosity of a DNA
solution was markedly increased while the sedimentation coefficient was decreased upon

2
the addition of acridine, proflavin or acridine orange. These observations led him to
suggest that the acridines induced structural perturbations and that an intercalative type of
binding mechanism would result in a lengthening of the DNA duplex (5). In addition, he
conducted flow dichroism and polarized fluorescence studies that demonstrated the plane
of the bound acridines was parallel to the DNA base pairs and perpendicular to the axis of
the double helix (6). Finally, Neville and Davies reported that X-ray fiber diffraction
patterns of DNA complexed with proflavin and acridine orange were consistent with
intercalation (7).
Figure 1.1. Representative classical (acridine, proflavin, acridine orange, and methylene blue) and non-classical (daunomycin and actinomycin D) intercalators and the groove binding agent netropsin.
N
NH2H2N
C2H5
NH2
O
HO
H3C O
OH
OH O
O
OCH3
HO
O
H3C
O
N
CC
CH3CH3
O
N
O
H
C CHH
C
Me
N
O
H
C CHMe2H
C
N
O
CH
C
CH2
O
NMe
CH2
C
N
O
Me
CH CHMe2
C
O
N
O
H
O
L-Thr
D-Val
L-Pro
Sar
L-MeVal
O
proflavin (P)
ethidium bromide daunomycin
actinomycin D
N
H
NN N
H CH3
CH3
CH3
H3C
acridine orange (AO)acridine
Cl Cl
N
NH
NH
NO HN
O
NH2
NH2
O
HN
H2N
NH2
netropsin
S
N
NN
methylene blue (MB)
Cl
H3C
CH3
CH3
CH3
N
HCl
NH2H2N
Br

3
In order for intercalation to ensue, the DNA base pairs separate by 3.4 Å to form a
cavity for the incoming chromophore through localized unwinding of the duplex. The
normal twist of B-form DNA is 36º (10 base pair per 360º turn). Therefore, to
accommodate the ligand in the intercalation site, a reduction of this rotation occurs.
However, the unwinding angle varies with the geometry of the ligand-DNA complex. For
example, the insertion of the phenanthradinium ring of ethidium bromide results in a
reduction of the 36º twist to 10º thereby creating an unwinding angle of 26º, while
proflavin and daunomycin unwind DNA by 17º and 11º, respectively (8). As the duplex
unwinds, the distance between the phosphate groups increases and results in the reduction
of localized charge density thereby facilitating the release of condensed counterions such
as sodium. The next step that occurs is the transfer of the aromatic ligand from solution to
the intercalation site, a favorable hydrophobic interaction since the nonpolar intercalating
aromatic ring is buried within the hydrophobic base pairs (9). Moreover, cationic
intercalators exhibit additional counterion release through a polyelectrolyte process as
described by Manning and Record (10, 11). Collectively, noncovalent forces including
the hydrophobic effect, a decrease in coulombic repulsion, van der Waals interactions, π-
π stacking, and hydrogen bonding stabilize the energy of the newly formed complex (9).
Furthermore, intercalators that possess substituents that form van der Waals contacts in
the minor groove and/or hydrogen bond with AT base pairs (e.g., daunomycin and
actionomycin D, Figure 1.1) may be influential in directing the thermodynamic binding
mechanism, the geometry of the complex and sequence selectivity (12, 13).
Groove Binding. The antibiotic netropsin (Figure 1.1) was the first reported AT-
specific DNA groove binding agent (14). In contrast to intercalators, the unfused

4
aromatic rings of groove-binders can adopt a cresent-like shape that matches the
curvature of the minor groove and bind without significant steric hinderance or
pertubation of the DNA duplex. A groove binding model involves two steps in which
hydrophobic transfer of the ligand from solution is then followed by noncovalent
molecular interactions including hydrogen bonding to AT base pairs and van der Waals
contacts within the walls of the groove (15). Another important feature of groove-binders
is that they can be designed to cover many base pairs and consequently may exhibit high
sequence-specificity recognition of nucleic acids (8).
Bisintercalation. Bisintercalators incorporate two covalently attached
intercalating ring systems to a linking chain of variable lengths (Figure 1.2).
Bisintercalating agents may offer several advantages: (i) higher binding affinity (since the
binding constant of a bisintercalator, in theory, should be the square of the binding
constant of the monomer), (ii) biological activity may be augmented as a function of
increased binding affinity and slower dissociation rates, (iii) potential sequence
selectivity, since the binding site size of a bisintercalator is increased relative to the
monomer. Moreover, the linker chain may provide numerous enhancements to the
structural design.
Several lines of evidence have indicated that bisintercalation is achieved when the
linker chain contains structurally rigid moieties and separates the two chromophores by
approximately ten angstroms (16-19). The former prevents self-stacking between the
heterocyclic aromatic rings and the latter violation of the nearest-neighbor exclusion
principle. Intramolecular interactions such as self-stacking compete with DNA binding
and therefore decrease affinity (17). Furthermore, the linker may impart additional
5
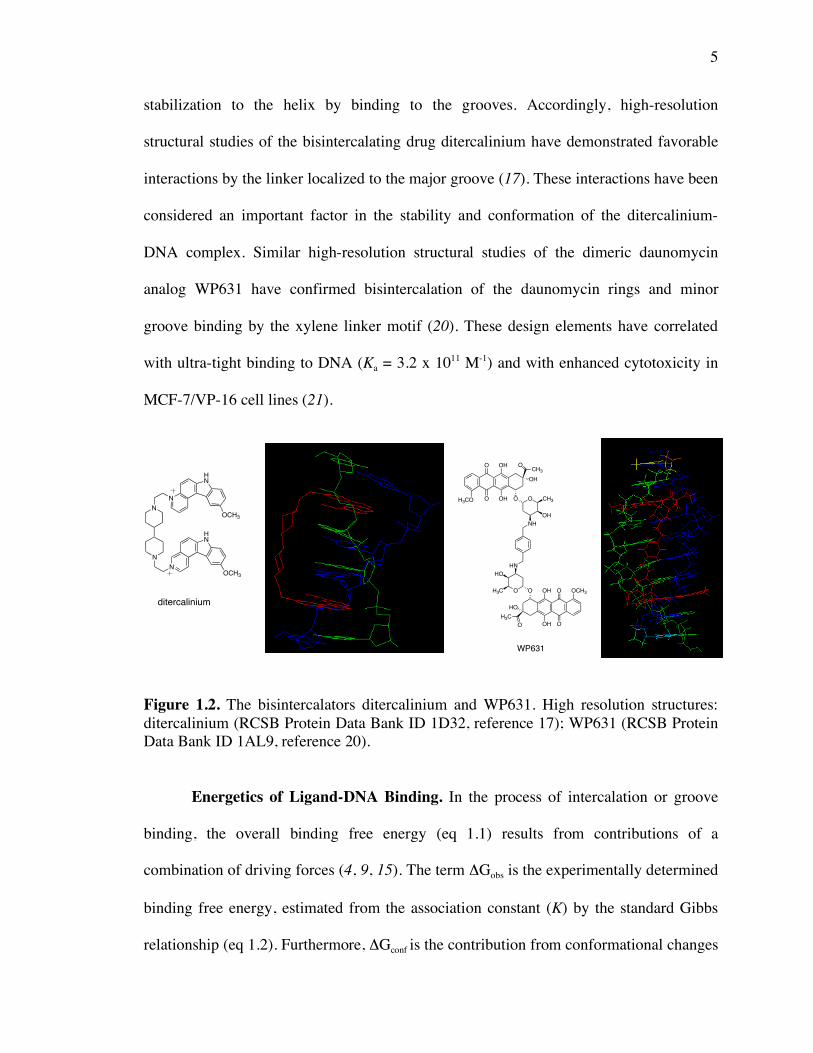
stabilization to the helix by binding to the grooves. Accordingly, high-resolution
structural studies of the bisintercalating drug ditercalinium have demonstrated favorable
interactions by the linker localized to the major groove (17). These interactions have been
considered an important factor in the stability and conformation of the ditercalinium-
DNA complex. Similar high-resolution structural studies of the dimeric daunomycin
analog WP631 have confirmed bisintercalation of the daunomycin rings and minor
groove binding by the xylene linker motif (20). These design elements have correlated
with ultra-tight binding to DNA (Ka = 3.2 x 10¹¹ M-1) and with enhanced cytotoxicity in
MCF-7/VP-16 cell lines (21).
Figure 1.2. The bisintercalators ditercalinium and WP631. High resolution structures: ditercalinium (RCSB Protein Data Bank ID 1D32, reference 17); WP631 (RCSB Protein Data Bank ID 1AL9, reference 20).
Energetics of Ligand-DNA Binding. In the process of intercalation or groove
binding, the overall binding free energy (eq 1.1) results from contributions of a
combination of driving forces (4, 9, 15). The term ΔGobs is the experimentally determined
binding free energy, estimated from the association constant (K) by the standard Gibbs
relationship (eq 1.2). Furthermore, ΔGconf is the contribution from conformational changes
N
NN
N
HN
OCH3
HN
OCH3
ditercalinium
OH
OHCH3
O
O O CH3
OHNH
HN
O
HO
H3C O
OH
OH O
O
OCH3
OH3CO OH
HO
O
O
H3C
WP631
6
in the DNA and ligand while ΔGt+r represents the free energy cost from the loss of
translational and rotational degrees of freedom upon complex formation. The terms ΔGhyd
and ΔGpe correspond to the hydrophobic transfer of the ligand from solution and the
polyelectrolyte counterion release, respectively. Lastly, the free energy contribution
arising from noncovalent molecular interactions between DNA and binding agents is
ΔGmol. With regards to intercalators, conformational changes and the loss of translational
and rotational freedom in order to accommodate the ligand within the base pairs result in
unfavorable free energy barriers for binding. Notwithstanding, such barriers are
overcome by favorable free energy contributions from hydrophobic transfer of the ligand
from solution, polyelectrolyte effect, and molecular noncovalent interactions within the
intercalation site (15). In the case of groove-binders, the losses in translational and
rotational freedom lead to unfavorable free energy barriers upon bimolecular
complexation. Similar to intercalators, these are compensated for by hydrophobic transfer
of the ligand from solution, polyelectrolyte effect, and molecular noncovalent interactions
(15). Although the free energy contributions are similar for both binding modes,
experimentally determined thermodynamic parameters suggest that intercalation is
mostly favored by enthalpic contributions while groove binding is an entropically driven
process (22). A larger entropic cost for distortion of the DNA structure by intercalation
and higher favorable entropy for groove binding due to the release of water molecules
from the minor groove have been proposed to account for this discrepancy (22).
ΔGobs = ΔGconf + ΔGt+r + ΔGhyd + ΔGpe + ΔGmol (1.1)
ΔGobs = -RT ln K (1.2)
7
Acridines
The acridines were first developed as dyes and during the early 20th century their
pharmacological properties were evaluated. At this time, proflavin was used as a topical
antibacterial and antifungal agent (23). In the 1940’s and to the present day (e.g.,
chloroquine, mepacrine, and pyronaridine; Figure 1.3), the acridines have been used as
antimalarial drugs (24). The first acridine-based therapeutic agents specifically designed
for cancer treatment were developed during the 1970’s. These efforts led to the
development of m-amsacrine (Figure 1.3), an 9-anilinoacridine introduced into clinical
use in 1976 (25). Accordingly, this acridine has been clinically utilized as a single agent
or in combination with other antineoplastic drugs in the treatment of acute
nonlymphocytic, lymphocytic (26, 27), and acute myeloid (28, 29) leukemias. However,
m-amsacrine has not generally been effective in the treatment of solid tumors (30).
Recent work on the anticancer activity of acridine derivatives (Figure 1.3) is focused on
the synthetically derived pyrazoloacridines (31) and on pyridoacridine alkaloids isolated
from marine organisms (32).
While the intercalative interactions and DNA binding affinity of acridines have in
general been correlated with cytotoxicity, new evidence has indicated that these agents
form ternary DNA-topoisomerase II enzyme complexes that disrupt cellular processes,
culminating in cellular death. Eukaryotic DNA topoisomerases (I and II) are enzymes
involved in topological processes that occur during transcription, recombination,
chromatin assembly, and chromosome partitioning at cell division (33, 34). Specifically,
type I topoisomerases catalyze the cleavage of a phosphate diester bond in one strand of
duplex DNA and then reseal the nick by allowing free rotation of the other strand. In

8
contrast, type II topoisomerases effect the cleavage of both strands and catalyze the
transport of DNA segments through the break. The mechanism for both types is ATP
driven and result in removing DNA supercoils (35). DNA binding agents are thought to
“poison” the DNA-enzyme association by forming ternary complexes, which are then
detected by the cell as damaged species. The interaction then triggers a cascade of events
that lead to the activation of p53 protein and to the induction of apoptosis (36).
Figure 1.3. Structures of medically important acridines.
To illustrate the previous discussion, m-amsacrine and its structural isomer o-
amsacrine (Figure 1.3) both bind to DNA via intercalation with an approximate 4-fold
increase in the binding affinity of o-amsacrine (Kobs = 4.0 x 10⁴ M-1) as compared to m-
amsacrine (Kobs = 1.6 x 10⁴ M-1) (37). However, m-amsacrine possesses higher levels of
cytotoxicity in cell cultures than o-amsacrine and has exhibited double-strand
topoisomerase II mediated DNA cleavage while o-amsacrine has not (38, 39). Studies
conducted by Zwelling and colleagues have demonstrated that m-amsacrine exerts its
Cl
HN
Me
N(CH3CH2)2
OMe
Cl
HN
OCH3
OH
N
N
NCl
HN
Me
N(CH3CH2)2
chloroquine mepacrine pyronaridine
N
HN
H3COHNSO2CH3
N
HN
H3CO
m-amsacrine o-amsacrine
NH
N N
N(CH3)2
H3CO
NO2
HNSO2CH3
pyrazoloacridine
N
N
O
NH2
pyridoacridine

9
cytotoxicity through the formation of a ternary complex between ligand, DNA and
topoisomerase II (39).
Phenothiazines
Methylene blue (MB), a DNA intercalating chromophore and the most
extensively studied phenothiazine (Figure 1.1) was developed as dyestuff during the late
1800’s. In 1891, Ehrlich successfully used methylene blue (MB) in patients infected with
malaria (40). However application of MB as an antimalarial agent was abandoned due to
the blue staining of the skin and to the development of acridine-based antimalarial agents
(41). Notwithstanding, a recent resurgence in investigating MB as a potential antimalarial
agent has been reported (42). Clinically, MB has been administered as an antidote for
nitrate poisoning, as well as employed in the treatment of methemoglobinemia and
ifosfamide-induced encephalopathy due to its low toxicity in human cells (41, 43).
Moreover, the phenothiazine molecule has been the basis for the development of
antihistamines and antipsychotic drugs such as promethazine and chlorpromazine,
respectively (43). Perhaps the most important and evolving application of MB and its
derivatives has been as photosensitizing agents in photodynamic therapy.
Photosensitization
While the effects of light had been known throughout ancient civilizations, the
first experimental account of photosensitization was reported by Oscar Raab in 1900. He
serendipitously observed that low concentrations of acridine were lethal to paramecium
during daylight experiments but not during nighttime experiments (44). These findings
were significant in proving the connection between light activation and therapeutic
outcome. Shortly thereafter, studies by von Tappeiner demonstrated the role of oxygen in

10
the light-dependent “photodynamic reaction” (45). In attempt to utilize photosensitization
for potential antitumor activity, Jesionek and von Tappeiner treated skin tumors with
visible light in the presence of eosin (46). The modern interest in photosensitization
began in the 1960’s with investigations by Lipson and Baldes that revealed the
localization of a mixture of porphyrins (known as hematoporphyrin derivative) in tumor
cells (47). The breakthrough however occurred in the 1970’s when Dougherty reported
that irradiation of murine mammary tumors with hematoporphyrin derivative resulted in
significant cell death (48).
Photodynamic Therapy. These pioneering studies led to present day
photodynamic therapy (PDT), an alternative approach to conventional chemotherapy that
involves the use of a photosensitizing drug and visible light. In the presence of oxygen,
the photoactivated drug generates reactive oxygen species that initiate a series of events
resulting in cell death. An advantage of PDT is the localization of the photosensitizer in
and selective irradiation of target tissue, thereby minimizing damage to surrounding
healthy cells. Accordingly, clinical protocols for systemic applications in the treatment of
numerous malignancies have been developed, including cancers of the lung,
gastrointestinal tract, head and neck regions, and bladder (49). Moreover, the successful
treatment of non-melanoma skin cancers (basal cell carcinoma and actinic keratosis) has
been documented with LevulanTM-mediated PDT (50). While the main focus of PDT has
been in oncology, its most triumphant application has been in the VisudyneTM-mediated
treatment of wet-macular degeneration, a non-malignant ophthalmic condition that is the
leading cause of blindness in the Western world (51). Currently, there are three
photosensitizing drugs approved for PDT by the U.S.A. Food and Drug Administration:

11
Photofrin,TM Visudyne,TM and LevulanTM (52). While currently utilized PDT agents
(Figure 1.4) are based on the porphyrin nucleus or mediate the in situ generation of
endogenous porphyrins (e.g., LevulanTM), other chromophores such as the phenothiazines
are gaining attention as potential PDT agents.
Figure 1.4. Structures of FDA approved PDT drugs.
Phenothiazines as PDT Agents. While the acridines have demonstrated PDT-
mediated in vivo destruction of animal tumor models (Chapter II), they are generally not
considered appropriate chromophores for PDT due to their light absorption properties.
Acridines absorb maximal wavelengths of light ranging from approximately 350-450 nm.
In contrast, MB and phenothiazine derivatives possessing electron-donating substituents
N
HNN
NH
OOOHH3CO
OH
OH
N
HNN
NH
H3CO
OOOHH3CO
O
O
H3CO
PhotofrinTM VisudyneTM
NH2
O
HO
O
HN
NNH
N
OHHOOO
LevulanTM
in vivo
endogenous protoporphyrin

12
maximally absorb light within the therapeutic window for PDT (600-800 nm).
Absorption within the therapeutic window is a desired feature, since the penetration of
light into tissues is limited by: 1) light scattering, which decreases at longer wavelengths,
and 2) absorption by pigmented biomolecules (49). With regards to PDT, MB and
derivatives (Figure 1.5) have demonstrated phototoxicity in several malignant cell lines
and colon tumors in mice. Specifically, Boehncke and co-workers demonstrated that
irradiation of human immortalized keratinocytes, mouse fibroblasts, human transformed
T-, and B-lymphoctes with polychromatic red light in the presence of MB exhibited
better ED50 values in all cell lines and in comparison to hematoporphyrin derivative or
aminolevulinic acid (53). Moreover, Wainwright and colleagues reported enhanced
cytotoxicity in multidrug resistant mammary tumor cells irradiated in the presence of MB
(54). Studies by Rice et al. revealed that photo-induced apoptosis of murine and human
melanoma cell lines occurred with MB but that the more lipophilic derivatives dimethyl
methylene blue (DMMB) and new methylene blue (NMB) were more phototoxic (55).
Additionally, the more lipophilic derivatives (DMMB and NMB) exhibited higher levels
of cellular uptake and retention. Similarly, Wainwright and co-workers correlated
increased phototoxicity in murine mammary tumor cell lines with higher levels of cellular
uptake and retention when employing DMMB or NMB as compared to MB (56).
Additionally, these authors observed lower rates of reduction with the more lipophilic
dyes and suggested that the electron donating effects of the methyl groups in the 1 and 9
or 2 and 8 positions of DMMB and NMB, respectively, accounted for this observation
(56).
13
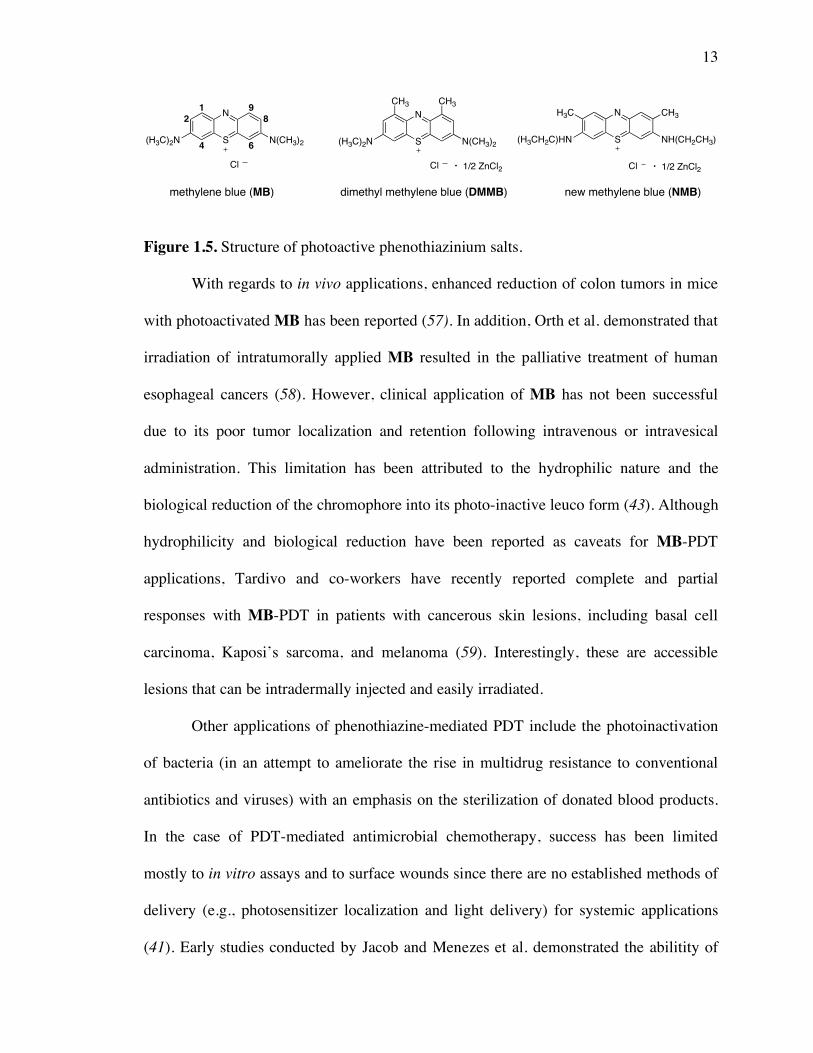
Figure 1.5. Structure of photoactive phenothiazinium salts.
With regards to in vivo applications, enhanced reduction of colon tumors in mice
with photoactivated MB has been reported (57). In addition, Orth et al. demonstrated that
irradiation of intratumorally applied MB resulted in the palliative treatment of human
esophageal cancers (58). However, clinical application of MB has not been successful
due to its poor tumor localization and retention following intravenous or intravesical
administration. This limitation has been attributed to the hydrophilic nature and the
biological reduction of the chromophore into its photo-inactive leuco form (43). Although
hydrophilicity and biological reduction have been reported as caveats for MB-PDT
applications, Tardivo and co-workers have recently reported complete and partial
responses with MB-PDT in patients with cancerous skin lesions, including basal cell
carcinoma, Kaposi’s sarcoma, and melanoma (59). Interestingly, these are accessible
lesions that can be intradermally injected and easily irradiated.
Other applications of phenothiazine-mediated PDT include the photoinactivation
of bacteria (in an attempt to ameliorate the rise in multidrug resistance to conventional
antibiotics and viruses) with an emphasis on the sterilization of donated blood products.
In the case of PDT-mediated antimicrobial chemotherapy, success has been limited
mostly to in vitro assays and to surface wounds since there are no established methods of
delivery (e.g., photosensitizer localization and light delivery) for systemic applications
(41). Early studies conducted by Jacob and Menezes et al. demonstrated the abilitity of
S
N
(H3C)2N N(CH3)2
1
2
4 6
8
9
S
N
(H3C)2N N(CH3)2
Cl
CH3 CH3
1/2 ZnCl2
S
N
(H3CH2C)HN NH(CH2CH3)
Cl 1/2 ZnCl2
CH3H3C
methylene blue (MB) dimethyl methylene blue (DMMB) new methylene blue (NMB)
Cl

14
MB to effect DNA photodamage in Escherichia coli and Proteus mirabilis, respectively
(60, 61). More recently, the Phoenix group has reported enhanced cell death by
photoactivated DMMB in Escherichia coli and Staphylococcus aureus cultures with
minimal lethal concentrations of 0.5 µM and 0.8 µM, respectively (62). Furthermore,
DMMB has shown high levels of photo-induced bactericidal activity against the
vancomycin-resistant Enterococcus faecalis and faecium strains (63).
Another important application of MB-PDT has been in the photoinacivation of
viral pathogens in blood products. The photodecontamination of plasma has been utilized
with MB in Germany since 1993 and more recently in other European communities (64).
Floyd and colleagues have recently reported that MB has shown efficacy in the
photoinactivation of human immunodeficiency virus (HIV). In their assays, HIV-1
infected cells that were treated with MB followed by irradiation with visible light (400-
700 nm) resulted in the attenuation of viral infectivity in a concentration dependent
manner (65).
DNA Damage and Photosensitization
DNA damage induced by chemical photosensitization has been extensively
investigated with endogenous porphyrins, xenobiotic dyes and metal complexes.
Collectively, these studies have led to a better understanding of phototoxicity and
phototherapy either to prevent cell damage or to enhance the cytotoxicity of anticancer
drugs. Moreover, DNA and RNA interacting photosensitizers may serve as structural and
molecular probes to further elucidate nucleic acids and other biomolecules interactions.

15
When a sensitizing molecule absorbs a photon of light, an electronic transition
results in the promotion of an electron from a ground state orbital to an unoccupied
orbital and the molecule is said to be in an excited state. This excited singlet has a
relatively short lifetime and can be de-activated back to the ground state with the
emission of a photon (fluorescence). Alternatively, the excited singlet can be de-activated
by an intersystem crossing (ISC) transition that populates the triplet excited state.
Because the triplet state has a longer lifetime, it tends to be important in many
photochemical reactions (66). Accordingly, the triplet excited state sensitiser (not directly
involved in DNA damage) can react with molecular oxygen to produce reactive oxygen
species (type I and II mechanisms) or accepts an electron from a biological substrate to
generate oxidized species (type I mechanism). These mechanisms are schematically
illustrated in Figure 1.6.
Figure 1.6. Mechanisms involved in DNA photosensitization.
energy
transfer
1O2
visible light
PS
O2
electron
transfer
3O2
guanine PS+3O2
type II
type I
H2O2
SOD
8-oxoG
DNA
fragmentation
Fe2+, Cu+
OH
Fe3+, Cu2+
HN
N N
HN
O
dR
H2N
O
B
OPO3R
RO3PO
O
B
OPO3R
RO3PO
DNA
fragmentation
1PS
3PS
ISC
HN
N
O
N
HN
O
H2N
dR
HN
N
O
N
HN
O
H2N
dR
8-oxoG
H2O
Cell
Death
guanine
Fenton reaction
HN
N N
N
O
dR
H2N
HN
N N
N
O
dR
H2N

16
Hydroxyl Radical Mediated Deoxyribose Damage. The hydroxyl radical (•OH)
is chemically generated (also can be generated through the homolysis of water by
ionizing radiation) via superoxide anions (type I mechanism) that can spontaneously (in
aqueous media) or catalytically (in vivo by superoxide dismutase, SOD) dismutate to
produce hydrogen peroxide. In the presence of redox active metals, hydrogen peroxide is
reduced thereby generating diffusible hydroxyl radicals through Fenton reactions (Figure
1.6). This electrophilic and highly reactive radical can efficiently abstract hydrogen
atoms from the deoxyribose units in DNA culminating in direct strand cleavage (frank
strand breaks; 67) and the production of alkaline-labile lesions. While single strand
breaks are usually not lethal, multiple •OH-mediated lesions result in double strand
breaks, which lead to permanent DNA damage (68). While hydrogen atom abstraction
can occur from all the carbon atoms of the deoxyribose sugars (69, 70), C-2’ carbon-
centered radicals are stabilized by the lone pair electrons of adjacent oxygen atoms which
renders atom abstraction form this carbon the least favorable (69, 71). The majority of
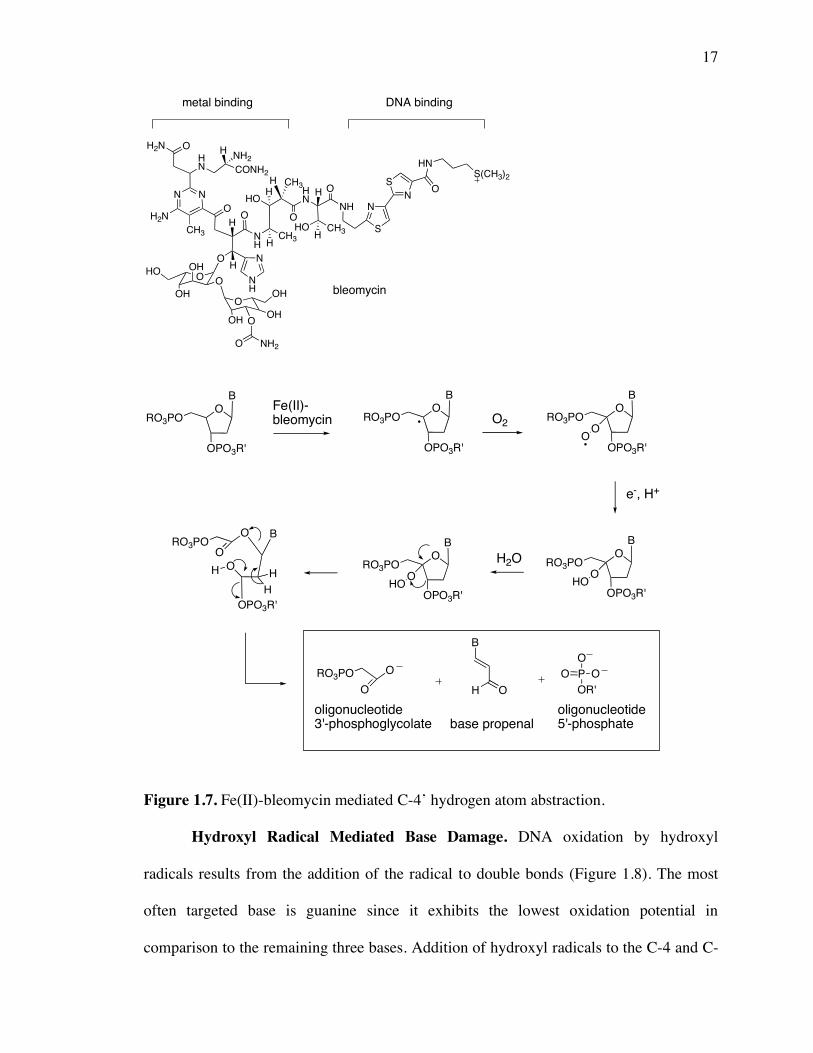
hydroxyl radical chemistry involves C-4’ hydrogen atom abstraction due to solvent
accessibility and increased lability of the C-H bond (69, 71). The mechanism of Fe(II)-
bleomycin mediated Frank strand cleavage via C-4’ hydrogen atom abstraction (which
leads to oligonucleotide 3’-phosphoglycolate, base propenal, and oligonucleotide 5’-
phosphate DNA fragments) is shown in Figure 1.7.
17
Figure 1.7. Fe(II)-bleomycin mediated C-4’ hydrogen atom abstraction.
Hydroxyl Radical Mediated Base Damage. DNA oxidation by hydroxyl
radicals results from the addition of the radical to double bonds (Figure 1.8). The most
often targeted base is guanine since it exhibits the lowest oxidation potential in
comparison to the remaining three bases. Addition of hydroxyl radicals to the C-4 and C-
N
S
N
S
HN
O
S(CH3)2
NH
OHNHO
H
CH3HOH
O
CH3H
NH
CH3
H
H
OO
NN
H
O
HN CONH2
HNH2
H2N
CH3
NH
N
H2N O
OH
OH
OH
OHO
O
OH OOH
OH
NH2O
bleomycin
metal binding DNA binding
OB
RO3PO
OPO3R'
Fe(II)-bleomycin
OB
RO3PO
OPO3R'
O2
OB
RO3PO
OPO3R'
OO
e-, H+
OB
RO3PO
OPO3R'
OHO
OB
RO3PO
OPO3R'
OHO
O BRO3PO
OPO3R'
O
OH
H
H
H2O
ORO3PO
O OH
B
O P
O
O
OR'
oligonucleotide3'-phosphoglycolate base propenal
oligonucleotide5'-phosphate

18
5 positions of guanine result in radical adducts. However, these adducts can gain
electrons from the medium or from cellular thiols in vivo and thus revert back to guanine
(72). Alternatively, addition across the C-8 position generates 7,8-dihydro-8-oxoguanine
(8-oxoG). These lesions do not typically result in direct strand cleavage and thus require
alkali treatment for further fragmentation to occur (73).
Electron Transfer and Singlet Oxygen Mediated DNA Damage. In general,
DNA oxidation by singlet oxygen (type II) or by electron transfer reactions (type I) leads
to base modifications (predominantly 8-oxoG; Figure 1.8) and do not often result in
permanent DNA damage as compared to deoxyribose chemistry. The majority of these
lesions require piperidine treatment post-irradiation in order to reveal the site of damage.
Notwithstanding, several accounts of direct strand cleavage at guanine bases by singlet
oxygen have appeared in the literature (74-76). More recently, Kochevar and colleagues
have reported that irradiation of HeLa cells incubated with Rose Bengal, a well known
singlet oxygen generator, induced apoptosis and DNA fragmentation (77). Because both
singlet oxygen and electron transfer mechanisms predominantly involve the formation of
alkaline-labile lesions at guanine bases, it is sometimes difficult to experimentally (via
nucleotide resolution assays) distinguish one mechanism from the other. However, the
Barton group has reported that damage by electron transfer exhibits a signature intense
cleavage at the first guanine in a ‘5-GG-3’ step, while damage by singlet oxygen occurs
equally at all guanines (78).

19
Figure 1.8. Hydroxyl radical, electron transfer and singlet oxygen guanine base modifications.
DNA Damage by Photoactive Agents. In contrast to light activated Fenton
reagents which specifically generate radicals that target deoxyribose hydrogen atoms,
DNA damage by many photonucleases may concomitantly involve type I and II
HN
N N
N
O
dR
H2N
OH HN
N N
N
O
Rd
H2N
HN
N N
N
O
dR
H2NHO
OH
guanine C-4 adduct C-5 adduct
-H2O
N
N N
N
O
dR
H2N
+e
+H
HN
N N
N
O
dR
H2N
guanine
OH HN
N N
N
O
dR
H2NH
OH
C-8 adduct
-e
-H
HN
N N
N
O
dR
H2N
OH
HN
N N
HN
O
dR
H2N
O
8-oxoG
-e
HN
N N
N
O
dR
H2N
H2O
HN
N N
N
O
dR
H2N
1O2

20
mechanisms. Therefore, the type of mechanism that predominates and the reactive
species that lead to damage highly depend on the specific photochemistry of the
photosensitiser, experimental conditions, and DNA binding interactions. For example,
Shuster’s group reported that DNA damage by a photoactivated intercalated
anthraquinone (Figure 1.9) produced guanine base lesions consistent with an electron
transfer mechanism. However, irradiated unbound molecules (excess concentration of
anthraquinone relative to DNA in solution) resulted in non-specific frank strand breaks
(79). Moreover, Bohne et al. reported two distinct mechanisms for DNA photocleavage
by an acridizinium salt (80, Figure 1.9). In the presence of oxygen, DNA photodamage
resulted from a singlet oxygen-mediated mechanism via energy transfer of the triplet
excited state acridizinium salt, while anaerobic conditions implicated the involvement of
hydroxyl radicals. Based on excited-state reduction potentials, the authors reasoned that
under anaerobic conditions photoinduced electron transfer between the excited
acridizinium and water might lead to a reduced chromophore and a water radical cation.
They also suggested that hydroxyl radicals were generated by subsequent deprotonation
of the water radical cation.
Figure 1.9. Anthraquinone and acridizinium DNA photocleaving agents.
N
R
Br
O
O
HN
O
NCH2CH3
CH2CH3
anthraquinonecarboxamide acridizinium bromide
21
Metal Complexes and DNA Photocleavage. Metal ions are involved in many
biological processes including hydrolysis and redox cycling reactions. Moreover, their
Lewis acidic charged centers are well suited to bind negatively charged biomolecules
including nucleic acids and proteins. Accordingly, the development of metal-based
therapeutics has been an area of active research. One of the most successful metal
complexes in medicine is cisplatin, a DNA interacting and clinically important anticancer
agent. In addition, studies on DNA binding and damage by Fe(II)-bleomycin as well as
by metal-porphyrin complexes have further contributed to the search for newer metal
complexes with improved antitumor properties.
Numerous metal complexes by virtue of their d-orbitals and redox properties have
been shown to promote photo-induced DNA damage. In this regard, representative
cobalt(II), copper(II), ruthenium(II), and rhodium(III) complexes have exhibited efficient
photonuclease activity (Figure 1.10). Nair and Vaidyanathan used a 2,6-
bis(benziimidazol-2-yl)pyridine cobalt(II) complex to conduct aerated plasmid nicking
assays that demonstrated DNA photocleavage by this cobalt(II)-complex (81). Based on
fluorescence quenching studies, the authors postulated that DNA damage might occur
through photoelectron transfer from guanine to the excited state of the complex. Zaleski’s
group found that copper(II) complexes of cis-1,8-bis(pyridin-3-oxy)oct-4-ene-2,6-diyne
produced photolytic degradation of pUC19 plasmid DNA via C-4’ hydrogen atom
abstraction. This enediyne ligand was shown to undergo metal-assisted photochemical
Bergman cyclization, thereby generating diradicals which efficiently abstracted C-4’
hydrogens atoms (82). Furthermore, Turro and co-workers demonstrated that a
supramolecular ruthenium(II)-viologen complex effected DNA photocleavage under

22
aerobic and anaerobic conditions (83). The authors suggested an electron transfer
mechanism involving guanine and the photooxidized ruthenium(III) center of the
complex. Lastly, Barton and co-workers reported direct strand cleavage via 3’-hydrogen
abstraction upon irradiation of an intercalated phenanthrenequinone diimine complex of
rhodium(III). Their studies indicated that the 3’-hydrogen located in the major groove
was a prime target for abstraction by a photoinduced phenanthrenequinone diimine
radical owing to the spatial conformation of the rhodium complex within the major
groove (84).
Figure 1.10. Representative DNA photocleaving metal complexes.
N
HN
N
N
N
N
NH
N
N
N
Co
2+
OO
OO
Cu
N
N
N
N
2+
N
N
Ru
N
N
N
N
N
N N
NCH3
CH3
6+
N
N
Rh
N
N
N
N
H
H
3+
benziimidazole pyridine cobalt(II) complex enediyne copper(II) complex
bipyridine-viologen ruthenium(II) complex
phenanthrenequinone diimine rhodium(III) complex
23
Photofootprinting
Footprinting is a widely utilized technique employed to map the sequence specific
sites of DNA binding drugs and proteins. While many enzymatic (e.g., DNase I and II)
and chemical footprinting agents (e.g., methidium-EDTA-iron(II) and 1,10-
phenanthroline copper(I)) have been successfully utilized, photofootprinting reagents
offer the advantage of controlling DNA cleavage with light (85). In this method, a
radiolabeled DNA fragment is reacted with a footprinting agent in the absence and
presence of DNA binding ligand. The footprinting agent then cleaves DNA at all residues
except for those sites where the ligand is bound. Accordingly, the uncleaved DNA
(ligand-bound sites) produce a “footprint,” an electrophoretic pattern that is devoid of
cleaved DNA bands. The footprinted site(s) are then compared to the electrophoretic
pattern produced by the footprinting agent run in the absence of the DNA binding ligand.
Typical footprinting agents cleave DNA without any sequence or base specificity, a
necessary requirement to prevent binding sequence ambiguity of the ligand or protein.
Examples of photofootprinting acridine agents have been reported. Jeppesen and
Nielsen described the photofootprinting capability of two acridine derivatives (DHA and
MAA; Figure 1.11). Their analyses revealed comparable reactivity of the the two
photoactive reagents to DNase I in identifying the binding sites of well known DNA
binding agents including distamycin and echinomycin (86). In another study, Saito and
co-workers reported efficient direct DNA strand breaks by a photoactive
dibenzoyldiazomethane-acridine conjugate (Figure 1.11). Furthermore, DNA nucleotide
resolution photocleavage assays by this dibenzoyldiazomethane-acridine conjugate

24
revealed cleavage at all residues without any sequence or base specificity, thereby
demonstrating its potential application as a photofootprinting reagent (87).
Figure 1.11. Structures of acridine based photofootprinting reagents.
Specific Aims
The objectives of the studies described in this dissertation were to synthesize
acridine and phenothiazine based photosensitizers (Chapters II-V) and then to evaluate
their DNA photocleavage efficiencies. The acridine and phenothiazine parent
chromophores were selected due to their well-documented DNA photosensitizing
capabilities and to their DNA binding interactions (predominantly via intercalation). In
each case, the compounds were designed to incorporate structural features that might
increase DNA binding affinity and/or effect metal complexation. Specifically,
HN
O
NH
N
O O
N2
N N
H
O
ON2
N
H3CO
N3
NH2
DHA
MAA
dibenzolyldiazomethane-acridine
25
photonuclease 7 described in Chapter II was designed to incorporate a central acridine
chromophore covalently attached to four metal-binding imidazole rings. This design
rationale was developed in an attempt to modulate and to enhance DNA photodamage in
the presence of metal ions. Accordingly, DNA photocleavage by compound 7 was
evaluated in the presence of 16 different metal salts.
The design rationale for the synthesis of compound 4 as described in Chapter III
was based on utilizing two units of an acridine chromophore covalently tethered to a
pyridine linker. In this case, the bisacridine element was employed to develop a putative
bisintercalator. Because bisintercalators have demonstrated higher DNA binding
affinities in comparison to monointercalators, DNA photodamage might be augmented as
a result of the stronger association between the bisintercalator and DNA. Additionally,
the pyridine linker was introduced specifically as a copper-binding motif to modulate and
to enhance DNA photocleavage in the presence of copper(II) ions.
In response to the interest in developing non-porphyrin chromophores possessing
suitable light properties for photodynamic therapy, three new compounds incorporating a
phenothiazine nucleus were synthesized, characterized and evaluated (Chapters IV-V).
The major objective involving their development was to design putative bisintercalating
agents capable of effecting enhanced levels of DNA photodamage at longer wavelengths.
A salient feature of photodynamic therapy is the requirement for strong
absorption of light by photosensitizing chromophores within the “therapeutic window”
(600-800 nm), in order to increase the depth of light penetration in tissues. This is met by
phenothiazine dyes possessing electron donating groups, a factor which motivated the
design of the linkers in compounds 3, 5, and 6. Moreover, the linkers are composed of six

26
member piperidine or piperazine and xylene ring systems to potentially provide
additional duplex stability by binding within the grooves of DNA.
The major goal of this project as described in Chapters II-V was to evaluate the
DNA photocleavage efficiencies produced by the compounds when irradiated in the
presence of pUC19 plasmid DNA. In these assays, pUC19 plasmid DNA was utilized due
to the fact that uncleaved and cleaved plasmid forms migrate through agarose gels at
different rates. Upon light exposure, the DNA-bound photosensitizers are expected to
generate reactive oxygen species, which then mediate direct DNA strand scission by
converting uncleaved supercoiled DNA into the nicked (single strand breaks) and linear
(double strand breaks) forms. The nicked, linear and supercoiled forms of pUC19
plasmid DNA are then easily visualized by staining the agarose gel with the fluorescent
and DNA intercalating dye ethidium bromide. The photocleavage yields are then
determined by utilizing light densitometry to quantitate each form of DNA produced
during irradiation in the presence of the photosensitizing nucleases.
Corollary assays to evaluate metal complex formation, fluorescence quantum
yields, DNA thermal denaturation, competitive equilibrium dialysis binding, viscosity,
reactive oxygen species sequestration and DNA photocleavage at nucleotide resolution
were conducted. Taken together, the projects integrated organic, biophysical, photo-, and
bio-chemical methods to dissect the factors involved in the enhancement of DNA
photosensitization.
Lastly, a small project was implemented as a National Science Foundation
workshop laboratory exercise involving a non-invasive DNA isolation technique and the
amplification of alleles encoding normal variations in human color vision (Chapter VI).

27
The goals of this exercise were aimed at providing the workshop participants with “hands
on” experience in currently utilized protocols in molecular biology.

28
References
(1) Watson, J. D.; Crick, F. H. C. Nature 1953, 171, 964-967.
(2) Kersten, H.; Kersten, W.; Rauen, H. M. Nature 1960, 187, 60-61.
(3) Reich, E. Science 1964, 143, 684-689.
(4) Graves, D. E.; Velea, L. M. Curr. Org. Chem. 2000, 4, 915-929.
(5) Lerman, L. S. J. Mol. Biol. 1961, 3, 18-30.
(6) Lerman, L. S. Proc. Natl. Acad. Sci. USA 1964, 49, 94-102.
(7) Neville, D. M. Jr.; Davies, D. R. J. Mol. Biol. 1966, 17, 57-74.
(8) Wilson, W. D. In Nucleic Acids in Chemistry and Biology; Blackburn, G. M.;
Gait, M. J., Eds.; Oxford University Press: New York, 1996; pp 331-370.
(9) Boresch, S.; Karplus, M. J. Mol. Biol. 1995, 254, 801-807.
(10) Manning, G. S. Q. Rev. Biophys. 1978, 11, 179-246.
(11) Record, M. T. Jr.; Anderson, C. F.; Lohman, T. M. Q. Rev. Biophys. 1978, 11,
103-178.
(12) Wang, A. H.-J. Curr. Opin. Struct. Biol. 1992, 2, 361-368.
(13) Krugh, T. R. Curr. Opin. Struct. Biol. 1994, 4, 351-364.
(14) Wartell, R. M.; Larson, J. E.; Wells, R. D. J. Biol. Chem. 1974, 249, 6719-6731.
(15) Chaires, J. B. Biopolymers 1997, 44, 201-215.
(16) Carpenter, M. L.; Lowe, G.; Cook, P. R. Nucleic Acids Res. 1996, 24, 1594-1601.
(17) Gao, Q.; Williams, L. D.; Egli, M.; Rabinovich, D.; Chen, S.-L.; Quigley, G. J.;
Rich, A. Proc. Natl. Acad. Sci. USA 1991, 88, 2422-2426.
(18) Gaugain, B.; Barbet, J.; Oberlin, R.; Roques, B. P.; LePecq, J. B. Biochemistry
1978, 17, 5071-5078.

29
(19) Léon, P.; Garbay-Jaureguiberry, C.; Lambert, B.; Le Pecq, J. B.; Roques, B. P.
J. Med. Chem. 1988, 31, 1021-1026.
(20) Robinson, H.; Priebe, W.; Chaires, J. B.; Wang, A. H. Biochemistry 1997, 36,
8663-8670.
(21) Chaires, J. B.; Leng, F.; Przewloka, T.; Fokt, I.; Ling, Y-H.; Perez-Soler, R.;
Priebe, W. J. Med. Chem. 1997, 40, 261-266.
(22) Chaires, J. B. Arch. Biochem. Biophys. 2006, 453, 24-29.
(23) Albert, A.; The Acridines; St. Martin’s Press: New York, 1966; pp 403-504.
(24) Greenwood, D. J. Antimicrob. Chemother. 1995, 36, 857-872.
(25) Grove, W. R.; Fortner, C. I.; Wiernik, P. H. Clin. Pharm. 1982, 1, 320-326.
(26) Van Mouwerik, T. J.; Caines, P. M.; Ballentine, R. Drug Intell. Clin. Pharm.
1987, 21, 330-334.
(27) Jehn, U. Bone Marrow Transplant. 1989, Suppl 3, 53-58.
(28) Harousseau, J.-L.; Cahn, J.-Y.; Pignon, B.; Witz, F.; Milpied, N.; Delain, M.;
Lioure, B.; Lamy, T.; Desablens, B.; Guilhot, F.; Caillot, D.; Abgrall, J.-F.;
Francois, S.; Briere, J.; Guyotat, D.; Casassus, P.; Audhuy, B.; Tellier, Z.;
Hurteloup, P.; Herve, P. Blood 1997, 90, 2978-2986.
(29) Brown, P.; Hoffmann, T.; Hansen, O. P.; Boesen, A. M.; Gronbaek, K.; Hippe, E.;
Jensen, M. K.; Thorling, K.; Storm, H. H.; Pedersen-Bjergaard, J. Leukemia 1997,
11, 37-41.
(30) Jelic, S.; Nikolic-Tomasevic, Z.; Kovcin, V.; Milanovic, N.; Tomasevic, Z.;
Jovanivic, V.; Vlajic, M. J. Chemother. 1997, 9, 364-370.
(31) Denny, W. A. Med. Chem. Rev. 2004, 1, 257-266.

30
(32) Demeunynck, M.; Charmantray, F.; Martelli, A. Curr. Pharm. Design 2001, 7,
1703-1724.
(33) Wang, J. C. Annu. Rev. Biochem. 1996, 65, 635-691.
(34) Pommier, Y.; Bertrand, R. In The Causes and Consequences of Chromosomal
Aberrations; Kirsch, I. R., Ed.; CRC Press: London, 1993; pp 277-309.
(35) Stivers, J. T. Biochemistry 1997, 36, 5212-5222.
(36) Martínez, R.; Chacón-García, L. Curr. Med. Chem. 2005, 12, 127-151.
(37) Wadkins, R. M.; Graves, D. E. Biochemistry 1991, 30, 4277-4283.
(38) Zwelling, L. A.; Michaels, S.; Erickson, L. C.; Ungerleider, R. S.; Nichols, M.;
Kohn, K. W. Biochemistry 1981, 20, 6553-6563.
(39) Minford, J.; Pommier, Y.; Filipski, J.; Kohn, K. W.; Kerrigan, D.; Mattern, M. R.;
Michaels, S.; Schwartz, R. E.; Zwelling, L. A. Biochemistry 1986, 25, 9-16.
(40) Guttmann, P.; Ehrlich, P. Berlin Klin. Wochschr. 1891, 39, 953-956.
(41) Harris, F.; Chatfield, L. K.; Phoenix, D. A. Curr. Drug Targets 2005, 6, 615-627.
(42) Wainwright, M.; Amaral, L. Trop. Med. Int. Health 2005, 10, 501-511.
(43) Wainwright, M.; Crossley, K. B. J. Chemother. 2002, 14, 431-443.
(44) Raab, O. Z. Biol. 1900, 39, 524-526.
(45) Jodlbauer, A.; von Tappeiner, H. Münch. Med. Wochenschr. 1904, 52, 1139-1141.
(46) Jesionek, A.; von Tappeiner, H. Arch. Klin. Med. 1905, 82, 223-227.
(47) Lipson, R. L.; Baldes, E. J. Arch. Dermatol. 1960, 82, 508-516.
(48) Dougherty, T. J.; Grindey, G. B.; Fiel, R.; Weishaupt, K. R.; Boyle, D. G. J. Natl.
Cancer Inst. 1975, 55, 115-121.
(49) Detty, M. R.; Gibson, S. L.; Wagner, S. J. J. Med. Chem. 2004, 47, 3897-3915.

31
(50) Babilas, P.; Karrer, S.; Sidoroff, A.; Landthaler, M.; Szeimies, R.-M.
Photodermatol. Photoimmunol. Photomed. 2005, 21, 142-149.
(51) Mellish, K. J.; Brown, S. B. Exp. Opin. Pharmacother. 2001, 2, 351-361.
(52) Brown, S. B.; Brown, E. A; Walker, I. Lancet Oncol. 2004, 5, 497-508.
(53) Boehncke, W.-H.; Rück, A.; Naumann, J.; Sterry, W.; Kaufmann, R. Lasers Surg.
Med. 1996, 19, 451-457.
(54) Wainwright, M.; Phoenix, D. A.; Burrow, S. M; Waring, J. J. Chemother. 1999,
11, 61-68.
(55) Rice, L.; Wainwright, M.; Phoenix, D. A. J. Chemother. 2000, 12, 94-104.
(56) Wainwrigth, M.; Phoenix, D. A.; Rice, L.; Burrow, S. M.; Waring, J. J.
Photochem. Photobiol. B. 1997, 40, 233-239.
(57) Orth, K.; Beck, G.; Genze, F.; Rück, A. J. Photochem. Photobiol. B. 2000, 57,
186-192.
(58) Orth, K.; Rück, A.; Stanescu, A.; Beger, H. G. Lancet 1995, 345, 519-520.
(59) Tardivo, J. P.; Del Giglio, A.; Santos de Oliveira, C.; Gabrielli, D. S.; Junqueira,
H. C.; Tada, D. B.; Severino, D.; Turchiello, R. F.; Baptista, M. S. Photodiag.
Photodyn. Ther. 2005, 2, 175-191.
(60) Jacob, H. E. Photochem. Photobiol. 1975, 21, 445-447.
(61) Menezes, S.; Capella, M. A. M.; Caldas, L. R. J. Photochem. Photobiol. B. 1990,
5, 505-517.
(62) Phoenix, D. A.; Sayed, Z.; Hussain, S.; Harris, F.; Wainwright, M. FEMS
Immunol. Med. Microbiol. 2003, 39, 17-22.

32
(63) Wainwright, M.; Phoenix, D. A.; Gaskell, M.; Marshall, B. J. Antimicrob.
Chemother. 1999, 44, 823-825.
(64) Abe, H.; Ikebuchi, K.; Hirayama, J.; Ikeda, H. Recent Res. Devel. Photochem.
Photobiol. 2001, 5, 163-173.
(65) Floyd, R. A.; Schneider, J. E. Jr.; Dittmer, D. P. Antivir. Res. 2004, 61, 141-151.
(66) Ochsner, M. J. Photochem. Photobiol. B. 1997, 39, 1-18.
(67) Lloyd, D. R.; Phillips, D. H.; Carmichael, P. L. Chem. Res. Toxicol. 1997, 10,
393-400.
(68) Prise, K. M.; Davies, S.; Michael, B. D. Radiat. Res. 1993, 134, 102-106.
(69) Breen, A. P.; Murphy, J. A. Free Radic. Biol. Med. 1995, 18, 1033-1077.
(70) Cadet, J.; Delatour, T.; Douki, T.; Gasparutto, D.; Pouget, J.-P.; Ravanat, J.-L.;
Sauvaigo, S. Mutat. Res. 1999, 424, 9-21.
(71) Pogozelski, W. K.; Tullius, T. D. Chem. Rev. 1998, 98, 1089-1107.
(72) Burrows, C. J.; Muller, J. G. Chem. Rev. 1998, 98, 1109-1151.
(73) Ravanat, J.-L.; Di Mascio, P.; Martinez, G. R.; Medeiros, M. H. G.; Cadet, J. J.
Biol. Chem. 2000, 275, 40601-40604.
(74) Blazek, E. R.; Peak, J. G.; Peak, M. J. Photochem. Photobiol. 1989, 49, 607-613.
(75) Churchill, M. E.; Schmitz, A. M.; Peak, J. G.; Peak, M. J. Photochem. Photobiol.
1990, 52, 1017-1023.
(76) Devasagayam, T. P. A.; Steenken, S.; Obendorf, M. S. W.; Schultz, W. A.; Sies,
H. Biochemistry 1991, 30, 6283-6289.
(77) Kochevar, I. E.; Lynch, M. C.; Zhuang, S.; Lambert, C. R. Photochem. Photobiol.
2000, 72, 548-553.

33
(78) Hall, D. B.; Kelley, S. O.; Barton, J. A. Biochemistry 1998, 37, 15933-15940.
(79) Breslin, D. T.; Schuster, G. B. J. Am. Chem. Soc. 1996, 118, 2311-2319.
(80) Bohne, C.; Faulhaber, K.; Giese, B.; Häfner, A.; Hofmann, A.; Ihmels, H.;
Köhler, A.-K.; Perä, S.; Schneider, F.; Sheepwash, M. A. L. J. Am. Chem. Soc.
2005, 127, 76-85.
(81) Vaidyanathan, V. G.; Nair, B. U. J. Inorg. Biochem. 2003, 94, 121-126.
(82) Benites, P. J.; Holmberg, R. C.; Rawat, D. S.; Kraft, B. J.; Klein, L. J.; Peters, D.
G.; Thorp. H. H.; Zaleski, J. M. J. Am. Chem. Soc. 2003, 125, 6434-6446.
(83) Fu, P. K.-L.; Bradley, P. M.; van Loyen, D.; Dürr, H.; Bossmann, S. H.; Turro, C.
Inorg. Chem. 2002, 41, 3808-3810.
(84) Sitlani, A.; Long, E. C.; Pyle, A. M.; Barton, J. A. J. Am. Chem. Soc. 1992, 114,
2303-2312.
(85) Armitage, B. Chem. Rev. 1998, 98, 1171-1200.
(86) Jeppesen, C.; Nielsen, P. E. Eur. J. Biochem. 1989, 182, 437-444.
(87) Nakatani, K.; Shirai, J.; Sando, S.; Saito, I. Tetrahedron Lett. 1997, 38, 6047-
6050.

34
CHAPTER II
Tunable DNA Photocleavage by an Acridine-Imadazole Conjugate
(This chapter is verbatim as it appears in Wilson, B.; Gude, L.; Fernández, M.-J.; Lorente, A.; Grant, K. B. Inorganic Chemistry 2005, 44, 6159-6173. The initial syntheses of compounds 1-10 were conducted by Drs. Gude, Fernández, and Lorente. Dr. Gude also conducted the characterization of the Zn(II)-complex by 1H NMR spectroscopy. Mass spectra were conducted by Dr. Siming Wang at Georgia State University. The contributions to the project by the author of this dissertation were as follows: preparation of compounds 1-7; conception and execution of all biological, biophysical, and photochemical experiments; and authorship of the original manuscript. The final manuscript was extensively revised by Dr. Grant.)
Abstract
We report the synthesis and characterization of photonucleases N,N’-bis[2-
[bis(1H-imidazol-4-ylmethyl)amino]ethyl]-3,6-acridinediamine (7) and N-[2-[bis(1H-
imidazol-4-ylmethyl)amino]ethyl]-3,6-acridinediamine (10), consisting of a central 3,6-
acridinediamine chromophore attached to 4 and 2 metal coordinating imidazole rings,
respectively. In DNA reactions employing 16 metal salts, photocleavage of pUC19
plasmid is markedly enhanced when compound 7 is irradiated in the presence of either
Hg(II), Fe(III), Cd(II), Zn(II), V(V), or Pb(II) (low intensity visible light, pH 7.0, 22 ºC, 8
µM 7 to 50 µM 7). We also show that DNA photocleavage by 7 can be modulated by
modifying buffer type and pH. Evidence of metal complex formation is provided by
EDTA experiments and by NMR and electrospray ionization mass spectral data. Sodium
azide, sodium benzoate, superoxide dismutase, and catalase indicate the involvement of
Type I and Type II photochemical processes in the metal-assisted DNA photocleavage
reactions. Thermal melting studies show that compound 7 increases the Tm of calf thymus
DNA by 10 + 1 °C at pH 7.0 and that the Tm is further increased upon the addition of
either Hg(II), Cd(II), Zn(II), or Pb(II). In the case of Fe(III) and V(V), a colorimetric
35
assay demonstrates that compound 7 sensitizes one electron photoreduction of these
metals to Fe(II) and V(IV), likely accelerating the production of Type I reactive oxygen
species. Our data collectively indicate that buffer, pH, Hg(II), Fe(III), Cd(II), Zn(II),
V(V), Pb(II), and light can be used to "tune" DNA cleavage by compound 7 under
physiologically relevant conditions. The 3,6-acridinediamine acridine orange has
demonstrated great promise for use as a photosensitizer in photodynamic therapy. In view
of the distribution of iron in living cells, compound 7 and other metal-binding acridine-
based photonucleases should be expected to demonstrate excellent photodynamic action
in vivo.
Introduction
Photodynamic therapy (PDT) has been proven to be an effective treatment option
for age-related macular degeneration, actinic keratoses, as well as for neoplastic diseases
such as lung, bladder, and esophageal cancers.1 PDT is also being explored for its
potential application in the photoinactivation of viruses (e.g., in blood disinfection) and
of multi-drug resistant bacteria.2 The procedure involves the administration of a
photoactive drug (photosensitizer) either systemically or topically followed by irradiation
of target tissue with light wavelengths specifically absorbed by the photosensitizer.
Damage to surrounding healthy tissue is mitigated by the preferential accumulation and
activation of the photosensitizer in diseased tissue. In this regard, PDT represents a very
attractive alternative to conventional chemotherapy. Nevertheless, only a few drugs,
mostly first and second generation porphyrin derivatives, have been approved for clinical
use in PDT.1a,3 The most extensively researched and utilized is Photofrin.® Yet, large
doses of this porphyrin are required to achieve therapeutic efficacy, the identity of the
36
active component(s) has not been determined, and the drug causes prolonged periods of
skin photosensitivity.4 There is now a great interest in the development of new
photoactive drugs that are therapeutically more effective and less toxic.
Following the absorption of a photon of light, PDT sensitizer molecules are
excited to a high energy singlet state. Subsequent intersystem crossing yields a long-lived
excited triplet state which can undergo energy transfer with ground state molecular
oxygen to generate cytotoxic singlet oxygen (1O2; Type II reaction). Alternatively, the
photosensitizer triplet participates in one electron oxidation of a nearby substrate such as
DNA (Type I reaction). In the case of molecular oxygen, Type I electron transfer from
the triplet to O2 produces superoxide (O2•−), which reacts further to generate hydrogen
peroxide and cytotoxic hydroxyl radicals (OH•). Although Type I processes play a
relatively minor role in PDT compared to Type II, singlet oxygen, hydroxyl radicals, and
one electron oxidation can all cause significant damage to DNA and other biomolecules,
eventually effecting necrosis and/or apoptosis of targeted cells.5 In addition, recent
investigations indicate that PDT may function by triggering localized inflammatory cell
and immune reaction responses.6
A precondition for efficacious photodynamic activity is selective and preferential
retention of the photosensitizer in diseased tissue. This prerequisite is met by sensitizing
chromophores that bind to nucleic acids with high affinity. The acridines are well known
DNA intercalating drugs that possess photo- and cytotoxic properties. The 3,6-
acridinediamines acridine orange and proflavin have been shown to photocleave DNA7 as
a function of increasing nucleic acid bound chromophore.7a,c Furthermore, acridine orange
has demonstrated selective localization in a number of tumor types and has effected
37
efficient in vivo photodestruction of epithelial tumors in mice, Walker carcinosarcoma
256 stomach tumors in rats, and musculoskeletal sarcomas in mice.8 In fact, Tatsuta et al.
reported comparable PDT-mediated necrosis of rat carcinosarcoma stomach tumors by
both acridine orange and hematoporphyrin.8c Finally, second and third generation
acridines have produced cytotoxic effects in a variety of cancerous tissues and are being
developed as HIV antivirals.9
In view of the close association of iron and other metals with genomic DNA10 and
the co-accumulation of iron and acridine orange in lysosomes and the cell nucleus,11
acridine-based photonucleases that sequester metals are potentially of great utility in
living cells. Towards this end, we report the syntheses of compounds 7 and 10,
containing a central DNA binding 3,6-acridinediamine chromophore attached to 4 and 2
metal coordinating imidazole rings, respectively. In a survey of 16 metal salts, we
demonstrate that the in vitro DNA photocleaving properties of compound 7 are markedly
enhanced by specific ions in the approximate order Fe(III) ≈ Hg(II) > Cd(II) > Zn(II) >
V(V) ≈ Pb(II). In the presence of these metals, pUC19 plasmid DNA is readily converted
into its nicked form upon exposure to low intensity, visible light (pH 7.0, 22 ºC, 8 µM 7
to 50 µM 7).
Results and Discussion
Synthesis.12 The tetraimidazole derivative of 3,6-acridinediamine 7 was
synthesized according to the procedures depicted in Schemes 2.1 and 2.2. In the first step
of the synthetic route, 2-[bis(1H-imidazol-4-ylmethyl)amino]ethanol (1) was obtained by
reaction of 4-(chloromethyl)-1H-imidazole hydrochloride with 2-aminoethanol in
refluxing ethanol. Afterwards, a solution of 1 in dry DMF with thionyl chloride was
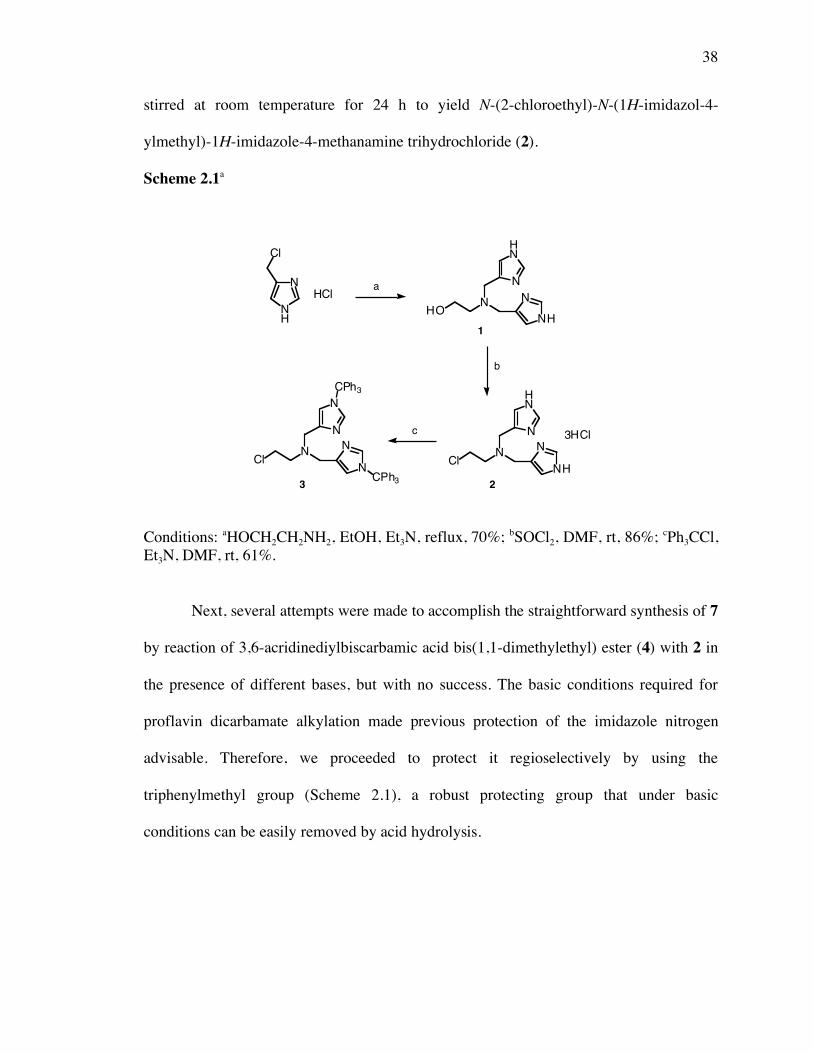
38
stirred at room temperature for 24 h to yield N-(2-chloroethyl)-N-(1H-imidazol-4-
ylmethyl)-1H-imidazole-4-methanamine trihydrochloride (2).
Scheme 2.1a
Conditions: aHOCH2CH2NH2, EtOH, Et3N, reflux, 70%; bSOCl2, DMF, rt, 86%; cPh3CCl, Et3N, DMF, rt, 61%.
Next, several attempts were made to accomplish the straightforward synthesis of 7
by reaction of 3,6-acridinediylbiscarbamic acid bis(1,1-dimethylethyl) ester (4) with 2 in
the presence of different bases, but with no success. The basic conditions required for
proflavin dicarbamate alkylation made previous protection of the imidazole nitrogen
advisable. Therefore, we proceeded to protect it regioselectively by using the
triphenylmethyl group (Scheme 2.1), a robust protecting group that under basic
conditions can be easily removed by acid hydrolysis.
N
NH
Cl
HCl
ClN
N
N
N
N
CPh3
CPh3
HON
NH
N
HN
N
ClN
NH
N
HN
N 3HCl
a
b
c
1
23

39
Scheme 2.2a
Conditions: a tBuOOCOCOOtBu, acetone, reflux, 72%; bCs2CO3, DMF, rt, 89%; c2 N HCl, 60 ˚C, d2 N NaOH, 87%.
We then evaluated conditions for the reaction of protected derivative 3 with
dicarbamate 4. Although we initially employed sodium hydride in DMF, which afforded
a mixture of the di- (5) and monoalkylated (6) products (in 54 and 32% yields,
respectively), a more convenient approach resulted from substitution of NaH with
Cs2CO3 (Scheme 2.2). This simplified the work-up process and increased the reaction
yield. Finally, all the protecting groups were removed simultaneously by treatment of 5 at
60 ˚C with 2 N hydrochloric acid. After basification of the reaction mixture, N,N’-bis[2-
[bis(1H-imidazol-4-ylmethyl)amino]ethyl]-3,6-acridinediamine (7) was precipitated and
purified.
The synthesis of bisimidazolic proflavin derivative 10 was carried out following a
similar procedure (Scheme 2.3). Compound 9 was prepared through the reaction of (6-
NH2N NH2
NN N
Boc
N
N
N
N
CPh3
N
CPh3
N
N
N
N
Ph3C
N
Ph3C Boc
NNH
NH
N
NH
N
HN
N
N
HN
N
HN
N
NN N
Boc Boc
HH
4
7
5
a
3, b
c, d
+ 6 (traces)
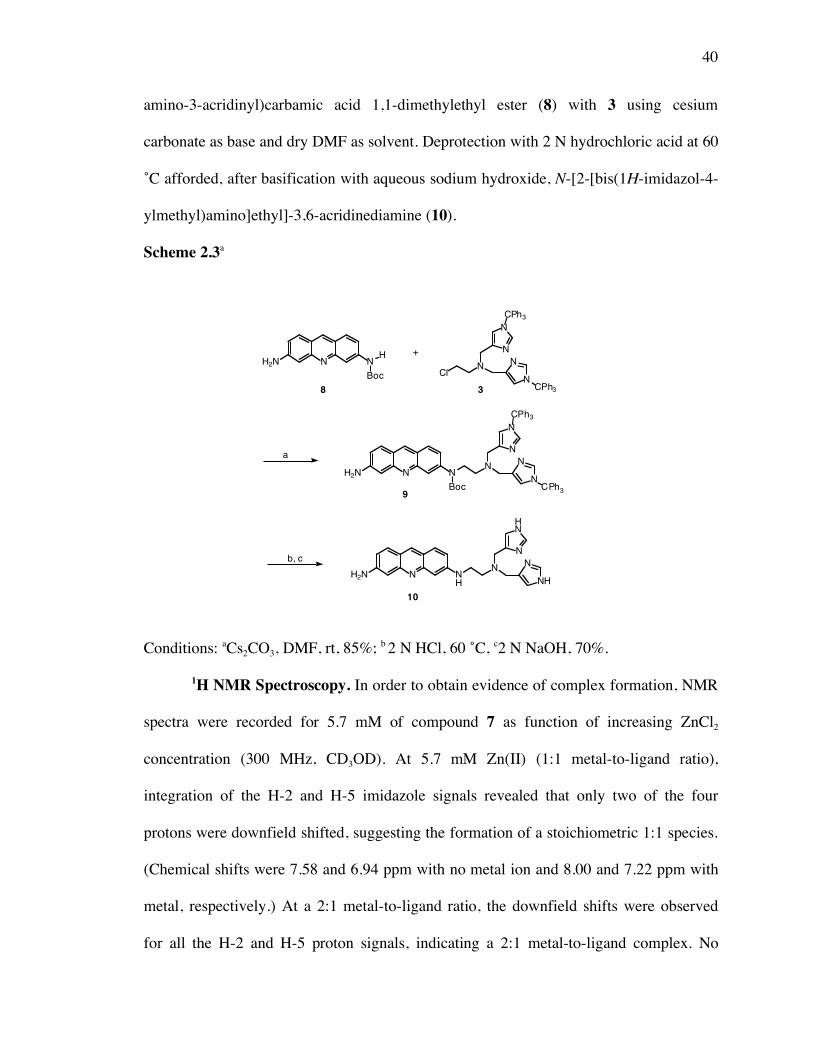
40
amino-3-acridinyl)carbamic acid 1,1-dimethylethyl ester (8) with 3 using cesium
carbonate as base and dry DMF as solvent. Deprotection with 2 N hydrochloric acid at 60
˚C afforded, after basification with aqueous sodium hydroxide, N-[2-[bis(1H-imidazol-4-
ylmethyl)amino]ethyl]-3,6-acridinediamine (10).
Scheme 2.3a
Conditions: aCs2CO3, DMF, rt, 85%; b 2 N HCl, 60 ˚C, c2 N NaOH, 70%.
1H NMR Spectroscopy. In order to obtain evidence of complex formation, NMR
spectra were recorded for 5.7 mM of compound 7 as function of increasing ZnCl2
concentration (300 MHz, CD3OD). At 5.7 mM Zn(II) (1:1 metal-to-ligand ratio),
integration of the H-2 and H-5 imidazole signals revealed that only two of the four
protons were downfield shifted, suggesting the formation of a stoichiometric 1:1 species.
(Chemical shifts were 7.58 and 6.94 ppm with no metal ion and 8.00 and 7.22 ppm with
metal, respectively.) At a 2:1 metal-to-ligand ratio, the downfield shifts were observed
for all the H-2 and H-5 proton signals, indicating a 2:1 metal-to-ligand complex. No
NH2N N
Boc
H
NH2N NH
N
NH
N
HN
N
NH2N N
Boc
N
N
N
N
CPh3
N
CPh3
ClN
N
N
N
N
CPh3
CPh3
+
10
9
8 3
a
b, c
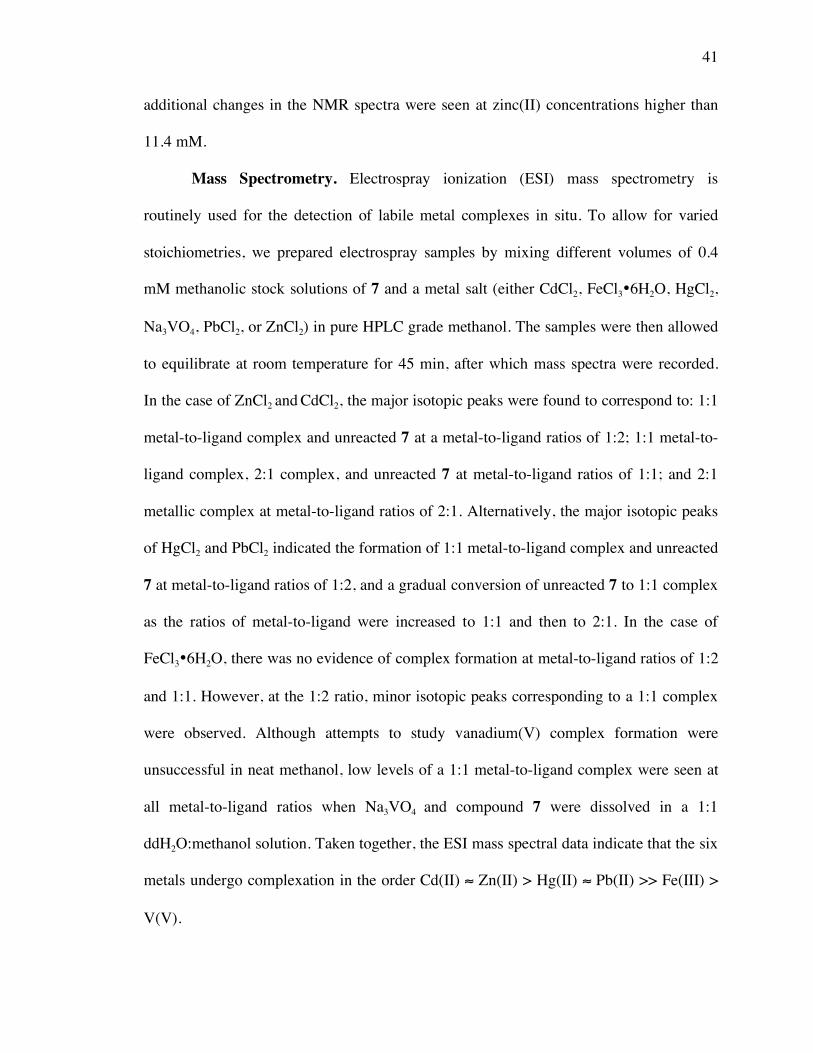
41
additional changes in the NMR spectra were seen at zinc(II) concentrations higher than
11.4 mM.
Mass Spectrometry. Electrospray ionization (ESI) mass spectrometry is
routinely used for the detection of labile metal complexes in situ. To allow for varied
stoichiometries, we prepared electrospray samples by mixing different volumes of 0.4
mM methanolic stock solutions of 7 and a metal salt (either CdCl2, FeCl3•6H2O, HgCl2,
Na3VO4, PbCl2, or ZnCl2) in pure HPLC grade methanol. The samples were then allowed
to equilibrate at room temperature for 45 min, after which mass spectra were recorded.
In the case of ZnCl2 and CdCl2, the major isotopic peaks were found to correspond to: 1:1
metal-to-ligand complex and unreacted 7 at a metal-to-ligand ratios of 1:2; 1:1 metal-to-
ligand complex, 2:1 complex, and unreacted 7 at metal-to-ligand ratios of 1:1; and 2:1
metallic complex at metal-to-ligand ratios of 2:1. Alternatively, the major isotopic peaks
of HgCl2 and PbCl2 indicated the formation of 1:1 metal-to-ligand complex and unreacted
7 at metal-to-ligand ratios of 1:2, and a gradual conversion of unreacted 7 to 1:1 complex
as the ratios of metal-to-ligand were increased to 1:1 and then to 2:1. In the case of
FeCl3•6H2O, there was no evidence of complex formation at metal-to-ligand ratios of 1:2
and 1:1. However, at the 1:2 ratio, minor isotopic peaks corresponding to a 1:1 complex
were observed. Although attempts to study vanadium(V) complex formation were
unsuccessful in neat methanol, low levels of a 1:1 metal-to-ligand complex were seen at
all metal-to-ligand ratios when Na3VO4 and compound 7 were dissolved in a 1:1
ddH2O:methanol solution. Taken together, the ESI mass spectral data indicate that the six
metals undergo complexation in the order Cd(II) ≈ Zn(II) > Hg(II) ≈ Pb(II) >> Fe(III) >
V(V).

42
Photocleavage Experiments. To determine the effects of various metals on DNA
photocleavage, compounds 7 and 10 were individually treated in the presence of
CaCl2•2H2O, CdCl2, (CH3)2SnCl2, CoCl2•H2O, CrCl3•6H2O, CuCl2•2H2O, FeCl3•6H2O,
HgCl2, MgCl2•6H2O, MnCl2•4H2O, Na3VO4, NiCl2•6H2O, PbCl2, Sc(CF3SO3)3, ZnCl2,
and ZrCl4. Photolysis reactions consisted of 20 mM sodium phosphate buffer pH 7.0 and
38 µM bp pUC19 plasmid DNA equilibrated in the absence and presence of: 25 µM
metal salt, 50 µM 7 or 10, and 25 µM metal salt with 50 µM 7 or 10.13 (In reactions
containing PbCl2 and Na3VO4, 20 mM sodium cacodylate buffer pH 7.0 was used to
substitute for sodium phosphate.) The samples were irradiated under aerobic conditions
with a low intensity, broad-spectrum 4 W T4T5/D fluorescent lamp for 50 min at 22 °C.
After this, photocleavage products were resolved on a 1.0% non-denaturing agarose gel
stained with ethidium bromide. ImageQuant Mac v. 1.2 software was then used to
quantitate the % conversion of supercoiled plasmid DNA to its nicked form (Figure 2.1).
This analysis revealed that DNA photocleavage by compound 7 was selectively enhanced
in the presence of Hg(II), Fe(III), Cd(II), Zn(II), V(V), and Pb(II). In the case of
compound 10, Hg(II), Fe(III), Cd(II), and Zn(II) also increased photocleavage, but at
lower levels in comparison to 7. (The fact that 7 possesses two additional imidazole rings
may confer upon this compound superior metal chelating ability.) As exemplified by the
representative gel shown in Figure 2.2 (50 µM 7, 25 µM ZnCl2), minimal levels of
photocleavage were always observed for DNA reactions irradiated in: the absence of
compound and metal (Lane 1), the absence of compound (Lane 2), the absence of metal
(Lane 3), and in a complete series of parallel reactions run in the dark (50 min, 22 °C;
Lanes 5-8). We therefore concluded that Hg(II), Fe(III), Cd(II), Zn(II), V(V), and Pb(II)
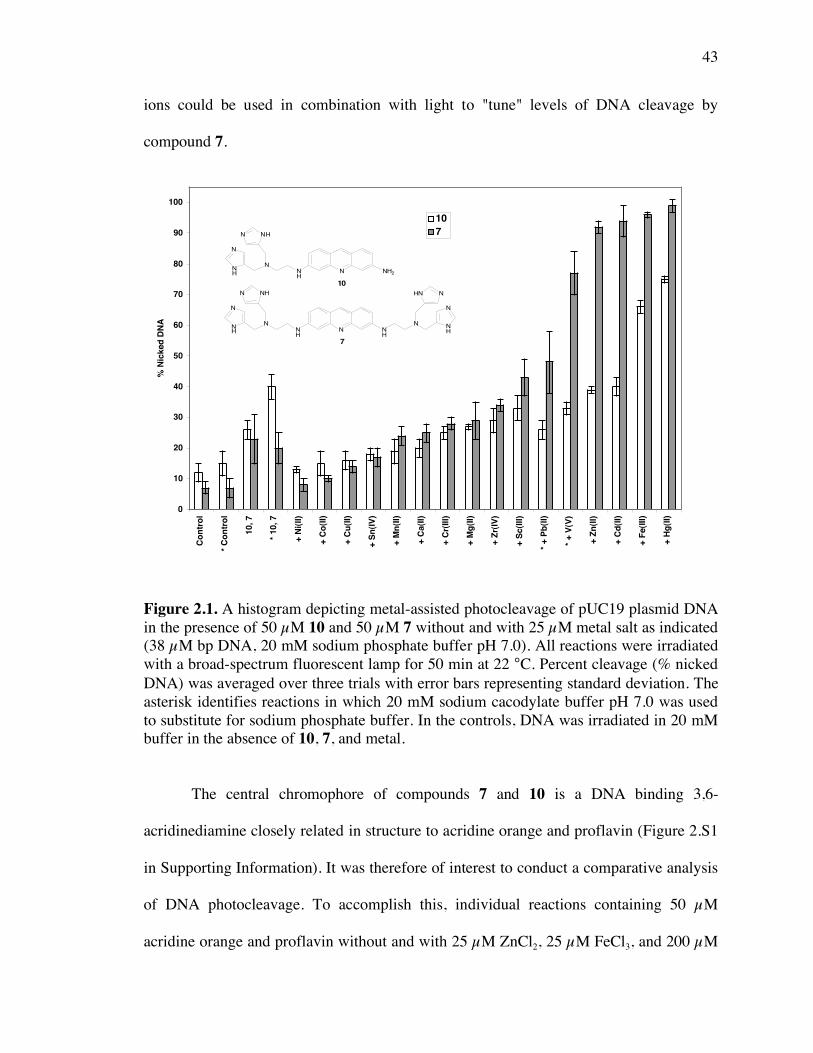
43
ions could be used in combination with light to "tune" levels of DNA cleavage by
compound 7.
Figure 2.1. A histogram depicting metal-assisted photocleavage of pUC19 plasmid DNA in the presence of 50 µM 10 and 50 µM 7 without and with 25 µM metal salt as indicated (38 µM bp DNA, 20 mM sodium phosphate buffer pH 7.0). All reactions were irradiated with a broad-spectrum fluorescent lamp for 50 min at 22 °C. Percent cleavage (% nicked DNA) was averaged over three trials with error bars representing standard deviation. The asterisk identifies reactions in which 20 mM sodium cacodylate buffer pH 7.0 was used to substitute for sodium phosphate buffer. In the controls, DNA was irradiated in 20 mM buffer in the absence of 10, 7, and metal.
The central chromophore of compounds 7 and 10 is a DNA binding 3,6-
acridinediamine closely related in structure to acridine orange and proflavin (Figure 2.S1
in Supporting Information). It was therefore of interest to conduct a comparative analysis
of DNA photocleavage. To accomplish this, individual reactions containing 50 µM
acridine orange and proflavin without and with 25 µM ZnCl2, 25 µM FeCl3, and 200 µM
0
10
20
30
40
50
60
70
80
90
100C
on
tro
l
* C
on
tro
l
10, 7
* 10, 7
+ N
i(II)
+ C
o(I
I)
+ C
u(I
I)
+ S
n(I
V)
+ M
n(I
I)
+ C
a(I
I)
+ C
r(III)
+ M
g(I
I)
+ Z
r(IV
)
+ S
c(I
II)
* +
Pb
(II)
* +
V(V
)
+ Z
n(I
I)
+ C
d(I
I)
+ F
e(I
II)
+ H
g(I
I)
% N
icked
DN
A
10
7
N NH
NH
N N
NHN
N
NH
NH
N
NHN
N NH2NH
N
NHN
N
NH
7
10

44
imidazole were irradiated for 50 min with the broad- spectrum fluorescent lamp (38 µM
bp pUC19 plasmid DNA, 20 mM sodium phosphate buffer pH 7.0, 22 °C). Yields were
calculated and compared to data from the previous experiment (Table 2.1).
Figure 2.2. Photograph of a 1.0% non-denaturing agarose gel showing photocleavage of pUC19 plasmid DNA (50 µM 7 and 25 µM ZnCl2 as indicated; 38 µM bp DNA; 20 mM sodium phosphate buffer pH 7.0; 22 °C). Lanes 1-4: reactions were irradiated with a broad-spectrum fluorescent lamp for 50 min. Lanes 5-8: parallel reactions maintained in the dark for 50 min. Abbreviations: N = nicked; S = supercoiled.
It is evident that acridine orange, proflavin, 7 and 10 all photocleave DNA at low
levels in the absence of metal. However, upon the addition of either 25 µM ZnCl2 or 25
µM FeCl3, significant enhancements were observed for 7 and 10, but not in the case of
acridine orange and proflavin. In an attempt to “mimic” the structure of compound 7, 4
mol equiv of imidazole were added along with each metal salt to the acridine orange and
proflavin reactions, but as shown in Table 2.1, levels of photocleavage were unaffected.
It is apparent that metal chelating imidazole must be covalently tethered to the DNA
S
Lane 1 2 3 4 5 6 7 8
7
ZnCl2
light
- - + +
- + - +
+ + + +
- - + +
- + - +
- - - -
N
3 2 12 84 3 2 3 7% nicked
45
binding 3,6-acridinediamine chromophore in order for Zn(II) and Fe(III) to enhance DNA
photocleavage.
Table 2.1. Zn(II) and Fe(III)-Assisted Photocleavage of pUC19 DNA by Acridine Orange, Proflavin, 7 and 10a
% nicked DNA:
reactants AO
P
7
10
DNA
14
14
7
12
DNA + 50 µM intercalator
28
15
23
26
DNA + 50 µM intercalator + 25 µM ZnCl2
30
13
92
39
DNA + 50 µM intercalator + 25 µM ZnCl2, 200 µM imidazole
35
11
NA
NA
DNA + 50 µM intercalator + 25 µM FeCl3 29
15
96
66
DNA + 50 µM intercalator + 25 µM FeCl3, 200 µM imidazole
27
17
NA
NA
a Photocleavage reactions consisted of 38 µM bp pUC19 plasmid DNA in sodium phosphate buffer pH 7.0 equilibrated without and with ZnCl2, FeCl3, imidazole, and the intercalators acridine orange, proflavin, 7, and 10. All reactions were irradiated with a broad-spectrum fluorescent lamp for 50 min at 22 °C. Abbreviations: AO = acridine orange; NA = not applicable; P = proflavin.
pH Profile. The Hg(II), Fe(III), Cd(II), Zn(II), V(V), and Pb(II)-assisted
photocleavage reactions were then studied by means of an extensive pH profile in which
50 µM 7, 25 µM metal salt and 38 µM bp pUC19 plasmid DNA were irradiated in a
variety of buffer systems: sodium cacodylate pH 5.0, 6.0, and 7.0; sodium phosphate pH
5.0, 6.0, 7.0, and 8.0; and sodium borate pH 8.0, and 9.0 (Table 2.2). The goal of this
experiment was to access the combined effects of buffer and pH in order to gain insight
into possible mechanisms underlying metal-assisted DNA photocleavage.
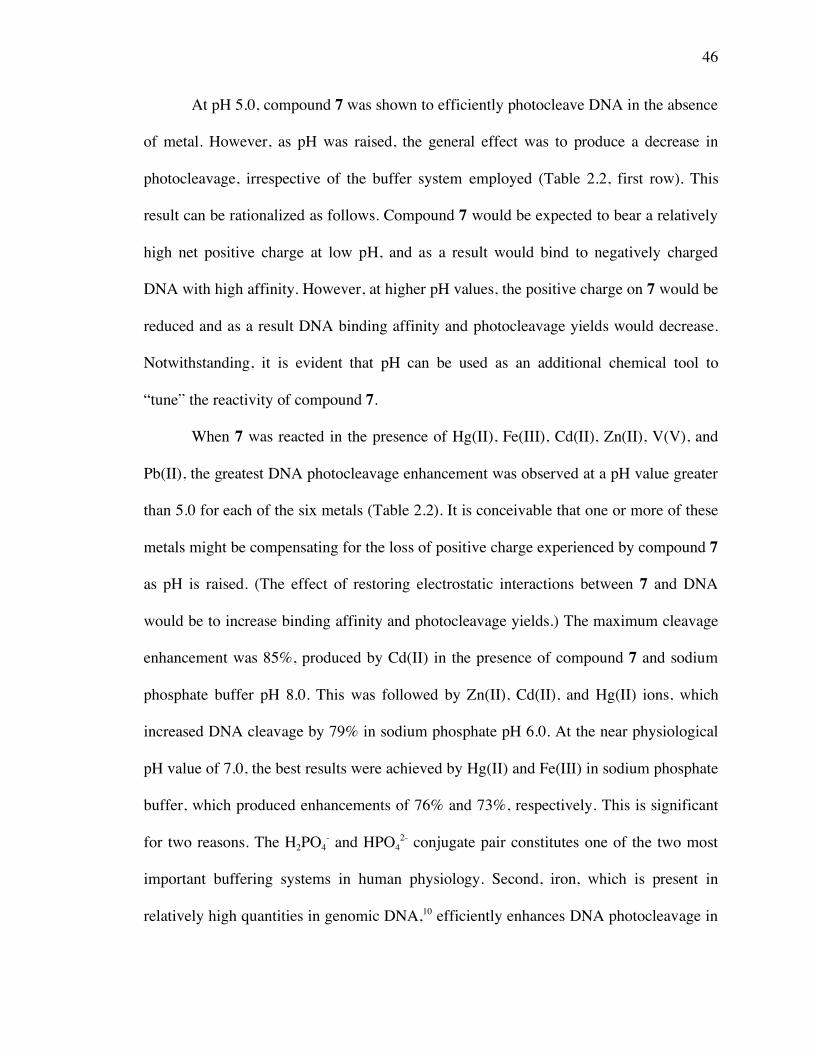
46
At pH 5.0, compound 7 was shown to efficiently photocleave DNA in the absence
of metal. However, as pH was raised, the general effect was to produce a decrease in
photocleavage, irrespective of the buffer system employed (Table 2.2, first row). This
result can be rationalized as follows. Compound 7 would be expected to bear a relatively
high net positive charge at low pH, and as a result would bind to negatively charged
DNA with high affinity. However, at higher pH values, the positive charge on 7 would be
reduced and as a result DNA binding affinity and photocleavage yields would decrease.
Notwithstanding, it is evident that pH can be used as an additional chemical tool to
“tune” the reactivity of compound 7.
When 7 was reacted in the presence of Hg(II), Fe(III), Cd(II), Zn(II), V(V), and
Pb(II), the greatest DNA photocleavage enhancement was observed at a pH value greater
than 5.0 for each of the six metals (Table 2.2). It is conceivable that one or more of these
metals might be compensating for the loss of positive charge experienced by compound 7
as pH is raised. (The effect of restoring electrostatic interactions between 7 and DNA
would be to increase binding affinity and photocleavage yields.) The maximum cleavage
enhancement was 85%, produced by Cd(II) in the presence of compound 7 and sodium
phosphate buffer pH 8.0. This was followed by Zn(II), Cd(II), and Hg(II) ions, which
increased DNA cleavage by 79% in sodium phosphate pH 6.0. At the near physiological
pH value of 7.0, the best results were achieved by Hg(II) and Fe(III) in sodium phosphate
buffer, which produced enhancements of 76% and 73%, respectively. This is significant
for two reasons. The H2PO4- and HPO4
2- conjugate pair constitutes one of the two most
important buffering systems in human physiology. Second, iron, which is present in
relatively high quantities in genomic DNA,10 efficiently enhances DNA photocleavage in
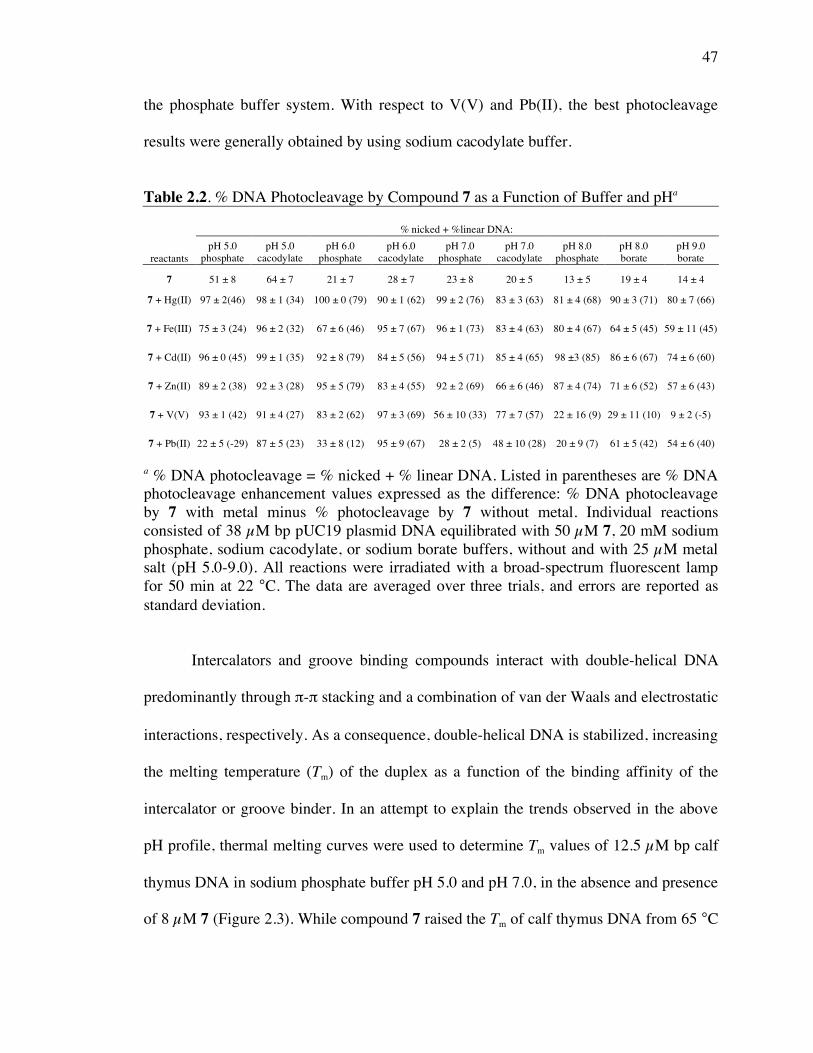
47
the phosphate buffer system. With respect to V(V) and Pb(II), the best photocleavage
results were generally obtained by using sodium cacodylate buffer.
Table 2.2. % DNA Photocleavage by Compound 7 as a Function of Buffer and pHa
% nicked + %linear DNA:
reactants pH 5.0
phosphate pH 5.0
cacodylate pH 6.0
phosphate pH 6.0
cacodylate pH 7.0
phosphate pH 7.0
cacodylate pH 8.0
phosphate pH 8.0 borate
pH 9.0 borate
7 51 ± 8 64 ± 7 21 ± 7 28 ± 7 23 ± 8 20 ± 5 13 ± 5 19 ± 4 14 ± 4
7 + Hg(II) 97 ± 2(46) 98 ± 1 (34) 100 ± 0 (79) 90 ± 1 (62) 99 ± 2 (76) 83 ± 3 (63) 81 ± 4 (68) 90 ± 3 (71) 80 ± 7 (66)
7 + Fe(III) 75 ± 3 (24) 96 ± 2 (32) 67 ± 6 (46) 95 ± 7 (67) 96 ± 1 (73) 83 ± 4 (63) 80 ± 4 (67) 64 ± 5 (45) 59 ± 11 (45)
7 + Cd(II) 96 ± 0 (45) 99 ± 1 (35) 92 ± 8 (79) 84 ± 5 (56) 94 ± 5 (71) 85 ± 4 (65) 98 ±3 (85) 86 ± 6 (67) 74 ± 6 (60)
7 + Zn(II) 89 ± 2 (38) 92 ± 3 (28) 95 ± 5 (79) 83 ± 4 (55) 92 ± 2 (69) 66 ± 6 (46) 87 ± 4 (74) 71 ± 6 (52) 57 ± 6 (43)
7 + V(V) 93 ± 1 (42) 91 ± 4 (27) 83 ± 2 (62) 97 ± 3 (69) 56 ± 10 (33) 77 ± 7 (57) 22 ± 16 (9) 29 ± 11 (10) 9 ± 2 (-5)
7 + Pb(II) 22 ± 5 (-29) 87 ± 5 (23) 33 ± 8 (12) 95 ± 9 (67) 28 ± 2 (5) 48 ± 10 (28) 20 ± 9 (7) 61 ± 5 (42) 54 ± 6 (40)
a % DNA photocleavage = % nicked + % linear DNA. Listed in parentheses are % DNA photocleavage enhancement values expressed as the difference: % DNA photocleavage by 7 with metal minus % photocleavage by 7 without metal. Individual reactions consisted of 38 µM bp pUC19 plasmid DNA equilibrated with 50 µM 7, 20 mM sodium phosphate, sodium cacodylate, or sodium borate buffers, without and with 25 µM metal salt (pH 5.0-9.0). All reactions were irradiated with a broad-spectrum fluorescent lamp for 50 min at 22 °C. The data are averaged over three trials, and errors are reported as standard deviation.
Intercalators and groove binding compounds interact with double-helical DNA
predominantly through π-π stacking and a combination of van der Waals and electrostatic
interactions, respectively. As a consequence, double-helical DNA is stabilized, increasing
the melting temperature (Tm) of the duplex as a function of the binding affinity of the
intercalator or groove binder. In an attempt to explain the trends observed in the above
pH profile, thermal melting curves were used to determine Tm values of 12.5 µM bp calf
thymus DNA in sodium phosphate buffer pH 5.0 and pH 7.0, in the absence and presence
of 8 µM 7 (Figure 2.3). While compound 7 raised the Tm of calf thymus DNA from 65 °C

48
to 94 °C at pH 5.0, the effect was much less pronounced at pH 7.0. In this case, the Tm
was raised from 75 °C to 84 °C. In the absence of compound 7, 4 µM ZnCl2 had no effect
on the melting temperature of the calf thymus DNA (Tm = 75 °C at pH 7.0). However, the
addition of 4 µM ZnCl2 to 8 µM 7 raised the Tm by 6 °C at pH 7.0, from 84 °C to 90 °C
(Figure 2.3). Taken together, these data suggest that Zn(II) increases binding affinity and
DNA photocleavage efficiency by restoring positive charge lost by 7 upon transition
from pH 5.0 to pH 7.0.
Figure 2.3. Effects of 8 µM compound 7, 4 µM ZnCl2, and 20 mM sodium phosphate buffers pH 5.0 and 7.0 on the thermal melting curve of 12.5 µM bp calf thymus DNA: , pH 5.0 buffer, Tm = 65 °C; , pH 7.0 buffer, Tm = 75 °C; Δ, compound 7 in pH 7.0 buffer, Tm = 84 °C; x: ZnCl2 and compound 7 in pH 7.0 buffer, Tm = 90 °C; +, compound 7 in pH 5.0 buffer, Tm = 94 °C.
Inhibition of DNA Photocleavage. Hydroxyl radical, hydrogen peroxide, singlet
oxygen, and superoxide scavengers all reduce the formation of DNA strand breaks
produced by the exposure of proflavin to visible light.7b,c A series of scavengers including
0 . 0 0
0 . 2 0
0 . 4 0
0 . 6 0
0 . 8 0
1 . 0 0
3 0 4 0 5 0 6 0 7 0 8 0 9 0 1 0 0
No
rma
lize
d
Ab
so
rba
nc
e
(26
0
nm
)
Temperature ( 0
C )
49
the metal chelating agent ethylenediaminetetraacetic acid (EDTA) was therefore utilized
to further investigate the mechanism(s) underlying metal-assisted DNA photocleavage by
compound 7. Individual photocleavage reactions consisted of 38 µM bp plasmid DNA in
pH 7.0 buffer, 50 µM 7, and 25 µM Hg(II), Fe(III), Cd(II), Zn(II), V(V), or Pb(II) in the
presence of scavenger. Sodium azide was used to trap the Type II reactive oxygen species
(ROS) singlet oxygen (1O2), while superoxide dismutase (SOD), catalase, and sodium
benzoate were employed for the Type I ROS superoxide (O2•−), hydrogen peroxide
(H2O2), and hydroxyl radicals (OH•), respectively. The data in Table 2.3 show that EDTA
consistently produced strong DNA photocleavage inhibition (> 78% in all cases). This
result indicates that complexation between compound 7 and each of the six metals is
likely to be a prerequisite for efficient cleavage. In the Hg(II)/sodium benzoate,
Fe(III)/sodium azide, Cd/sodium benzoate, Cd/SOD, and Pb(II)/SOD reactions,
essentially no protection was observed. Otherwise, levels of photocleavage inhibition
ranged from moderately low to high for all of the metal/scavenger combinations. (In the
case of sodium benzoate, weak inhibitory effects cannot rule out the existence of non-
diffusible hydroxyl radicals closely associated with the metal center of the complex.
Second, because SOD produces H2O2 which itself can contribute to cleavage, weak
inhibition by this enzyme cannot rule out superoxide.) In conclusion, the scavenger
experiments collectively indicate that, with the exception of iron, Type I and Type II
photochemical processes are involved in compound 7 metal-assisted DNA cleavage. The
Fe(III) reaction appears to proceed almost exclusively through a Type I pathway.

50
Table 2.3. % Inhibition of Metal-Assisted DNA Photocleavagea metal
azide (100 mM)
benzoate (100 mM)
SOD (50 U)
catalase (50 U)
EDTA (100 mM)
Hg(II) 35 ± 6 2 ± 2 16 ± 6 24 ± 12 78 ± 7
Fe(III) 9 ± 6 20 ± 3 23 ± 12 66 ± 4 79 ± 4
Cd(II) 18 ± 3 7 ± 9 0 ± 1 26 ± 7 79 ± 8
Zn(II) 38 ± 13 28 ± 10 18 ± 7 35 ± 3 79 ± 6
V(V) 38 ± 10 38 ± 10 18 ± 9 41 ± 11 78 ± 7
Pb(II) 28 ± 8 32 ± 19 5 ± 4 53 ± 7 79 ± 2
a Individual reactions consisting of 38 µM bp pUC19 plasmid DNA, 50 µM 7, 25 µM metal salt, and one of the above reagents were irradiated with a broad-spectrum fluorescent lamp for 50 min at 22 °C. The Zn(II), Cd(II), Hg(II) and Fe(III) reactions were in 20 mM sodium phosphate buffer pH 7.0 while the V(V) and Pb(II) reactions were in sodium cacodylate buffer pH 7.0. Percent inhibition was averaged over at least three trials with error reported as standard deviation. Working reagent concentrations are in parentheses.
Photocleavage at Lower Concentrations. Metal-assisted DNA photocleavage
reactions were conducted using 8 µM 7, 4 µM metal, and 12.5 µM bp pUC19 plasmid
DNA. Because distortions in UV-visible and emission spectra are typically associated
with highly concentrated chromophores, it was necessary for us to examine
photocleavage patterns at these lower concentrations of 7 and metal to establish the
feasibility of conducting additional spectroscopic studies. Reaction samples were
irradiated with the broad-spectrum fluorescent lamp for 50 min at 22 °C. After this, the %
conversion of supercoiled to nicked DNA produced by 7 in the presence of the 16 metal
salts was quantitated. As shown in Figure 2.4, a similar trend was observed in the DNA
photocleavage cleavage studies conducted at 50 µM 7 and 25 µM metal (Figure 2.1). The
metal ions Hg(II), Fe(III), Cd(II), Zn(II), V(V), and Pb(II) all enhanced photocleavage at
the lower reagent concentrations (Figure 2.4).

51
Figure 2.4. A histogram depicting metal-assisted photocleavage of pUC19 plasmid DNA in the presence of 8 µM 7 without and with 4 µM metal salt as indicated (12.5 µM bp DNA, 20 mM sodium phosphate buffer pH 7.0). All reactions were irradiated with a broad-spectrum fluorescent lamp for 50 min at 22 °C. Percent cleavage was averaged over three trials with error bars representing standard deviation. The asterisk identifies reactions in which 20 mM sodium cacodylate buffer pH 7.0 was used to substitute for sodium phosphate buffer.
Absorbance and Emission Studies. In an attempt to account for the relative
influence of the 16 metal salts on the efficiency of DNA photocleavage, we recorded
absorbance and fluorescence emission spectra of compound 7 equilibrated in 20 mM
sodium phosphate or 20 mM sodium cacodylate pH 7.0 buffer, without and with metal
salt (Table 2.4). We then calculated the % change in emission quantum yield resulting
from the addition of each of the 16 metals to 7 (%Δ Φem + metal) as well as the % change
in absorbance intensity (%Δ Abs + DNA) and emission quantum yield (%Δ Φem + DNA)
0
10
20
30
40
50
60
70
80
90
100
7
* 7
+ N
i(II)
+ C
o(I
I)
+ C
u(I
I)
+ S
n(I
V)
+ M
n(I
I)
+ C
a(I
I)
+ C
r(III)
+ M
g(I
I)
+ Z
r(IV
)
+ S
c(I
II)
* +
Pb
(II)
* +
V(V
)
+ Z
n(I
I)
+ C
d(I
I)
+ F
e(I
II)
+ H
g(I
I)
% N
icked
DN
A

52
and the change in the wavelength of maximum absorbance (Δ λmax + DNA) resulting from
the addition of calf thymus DNA (Table 2.4).
Table 2.4. Absorbance, Emission and Thermal Melting Dataa
absorbance studies
emission studies
Tm studies
reactants
abs
%Δ abs + DNA
λmax(nm)
Δ λmax
+ DNA Φem
%Δ Φm + metal
%Δ Φm + DNA
Tm (ºC)
ΔTm (ºC)
7 0.16 -6 459 8 0.090 NA -26 84 NA 7 + Hg(II) 0.15 -10 451 16 0.025 -72 16 86 2 7 + Fe(III) 0.20 -21 459 8 0.068 -24 -28 84 0 7 + Cd(II) 0.18 -17 448 18 0.036 -60 -42 90 6 7 + Zn(II) 0.17 -17 458 9 0.062 -31 -42 90 6 7 + Sc(III) 0.21 -23 459 8 0.083 -8 -30 84 0 7 + Zr(IV) 0.21 -24 459 8 0.083 -8 -31 83 -1 7 + Mg(II) 0.21 -21 459 8 0.088 -2 -24 84 0 7 + Cr(III) 0.21 -18 458 9 0.085 -6 -22 83 -1 7 + Ca(II) 0.22 -29 459 8 0.087 -3 -18 84 0 7 + Mn(II) 0.20 -18 459 8 0.088 -2 -21 84 0 7 + Sn(IV) 0.22 -19 459 8 0.101 +12 -26 84 0 7 + Cu(II) 0.18 -19 452 7 0.019 -79 -74 87 3 7 + Co(II) 0.17 -15 448 11 0.023 -74 -74 88 4 7 + Ni(II) 0.12 3 448 16 0.011 -88 -46 92 8 *7 0.16 -10 452 17 0.083 NA -17 85 NA *7 + V(V) 0.15 -27 451 20 0.080 -4 -12 86 1 *7 + Pb(II) 0.17 -24 452 18 0.074 -11 -40 87 2 aAbsorbance and Tm measurements were conducted using solutions consisting of 8 µM 7 in 20 mM sodium phosphate buffer pH 7.0 equilibrated without and with 12.5 µM bp calf thymus DNA and 4 µM metal salt (22 °C). Tm data were averaged over two trials producing an average standard deviation of ± 1 °C. Φem measurements were conducted at 25 °C with 7 in 20 mM sodium phosphate buffer pH 7.0 equilibrated without and with calf thymus DNA and metal salt. Absorbance in all Φemexperiments was ~ 0.04 at the 430 nm excitation wavelength. Φem values were averaged over three trials producing an average standard deviation of ± 0.002. Abbreviations: Abs = absorbance intensity at λmax; NA = not applicable; %Δ + DNA = percent change upon addition of DNA = [((7 + metal + DNA) – (7 + metal))/(7 + metal)] x 100; Δ = change upon addition of DNA = (7 + metal + DNA) – (7 + metal); %Δ + metal = percent change upon addition of metal = [((7 + metal) – (7))/(7)] x 100; Δ Tm = Tm(7 + Metal) - Tm(7). The asterisk identifies solutions in which 20 mM sodium cacodylate buffer pH 7.0 was used to substitute for 20 mM sodium phosphate buffer pH 7.0.
53
Bathochromic wavelength shifts and hypochromic absorption are characteristic of
the electronic spectra of many DNA-bound groove binders and most if not all DNA-
bound intercalators. The “%ΔAbs + DNA” and “Δ λmax + DNA” data in Table 2.4 show
that compound 7 demonstrates appreciable bathochromicity and hypochromicity in the
presence of DNA. While the data cannot be used to account for different photocleavage
levels, it is very likely that compound 7 continues to bind to DNA in the presence of each
of the 16 metals: red-shifts (positive “Δ λmax + DNA” values) are consistently produced
upon the addition of DNA, and with the exception of Ni(II), depressed absorption
(negative “%Δ Abs + DNA”) is observed. In addition, none of the metal-induced changes
in the electronic spectra of 7 appear to be of sufficient magnitude to markedly attenuate
or enhance DNA photocleavage levels.
Upon binding to DNA, acridine orange exhibits an increase in fluorescence
emission. In the case of proflavin, pronounced sequence dependent effects are observed.
Fluorescence emission is increased in the presence of A•T rich DNA and but is almost
completely quenched by G•C rich sequences.14 The “%Δ Φem + DNA” values in Table
2.4 indicate that fluorescence is reduced upon the addition of DNA to (i) compound 7 and
(ii) compound 7 in the presence of 15 out of 16 metals.
Table 2.4 also summarizes the effects of metal ions on compound 7 fluorescence
emission in the absence of DNA. The 14 “%Δ Φem + metal” values recorded in sodium
phosphate buffer show that the photoinactive metals Ni(II), Cu(II), Co(II) produce the
most significant reductions in fluorescence intensity, followed by the three photoactive
metals Hg(II), Cd(II), and Zn(II). The percent changes in emission quantum yield
produced by the photoactive metal Fe(III) and the seven photoinactive metals Sn(IV),

54
Sc(III), Zr(IV), Cr(III), Ca(II), Mg(II) and Mn(II) are all lower. Overall, the 14 metals
follow the order: Ni(II) > Cu(II) > Co(II) > Hg(II) > Cd(II) > Zn(II) > Fe(III) > Sn(IV) >
Sc(III) = Zr(IV) > Cr(III) > Ca(II) > Mg(II) = Mn(II). The two “%Δ Φem + metal” values
recorded in sodium cacodylate buffer show that Pb(II) is a more efficient quencher than
V(V).
According to Hard-Soft Acid-Base (HASB) Theory, the seven metals with the
largest “%Δ Φem + metal” values in their respective buffer systems are classified as either
borderline or soft acids (Ni(II), Cu(II), Co(II), Hg(II), Cd(II), Zn(II), and Pb(II)), while
the nine metals that have relatively minor effects on fluorescence emission (Fe(III),
Sn(IV), Sc(III), Zr(IV), Cr(III), Ca(II), Mg(II), Mn(II) and V(V)), are classified as hard
acids. Because imidazole is a borderline base, it is conceivable that compound 7 might
display a preference for forming stable complexes with the seven borderline and soft
metals. Therefore, it is possible that there is a relationship between the degree of
fluorescence quenching and the degree of complex formation between compound 7 and
each of the 16 metals.
Thermal Denaturation Studies. In our next set of experiments, we determined
the Tm values of 12.5 µM bp calf thymus DNA at pH 7.0 in the absence and presence of 8
µM 7 and 4 µM of the 16 metal salts. The change in DNA melting temperature effected
by the addition of metal to 7 was defined as Δ Tm = Tm (7 + Metal) - Tm (7) (Table 2.4). Under
our experimental conditions, the Tm obtained for calf thymus DNA was 74 + 1 °C. The
addition of each of the 16 metal salts to the DNA made little difference, since the
resulting Tm values ranged from 73 – 75 °C. Therefore, none of the metals were able to
effect the stability of double-helical calf thymus DNA on their own. Addition of 7 to the
55
calf thymus DNA raised the Tm to 84 °C in 20 mM sodium phosphate buffer pH 7.0.
When compound 7 and metals were present in combination, additional statistically
significant increases in Tm were observed for seven of the 16 metals: Ni(II), ΔTm = 8 °C;
Cd(II), ΔTm = 6 °C; Zn(II), ΔTm = 6 °C; Co(II), ΔTm = 4 °C; Cu(II), ΔTm = 3 °C;
Hg(II), ΔTm = 2 °C; and Pb(II), ΔTm = 2 °C. (Tm values determined over several trials
showed the error in measurement to be + 1 °C.)
Taken together, the thermal denaturation and fluorescence quenching data suggest
possible correlations between metal complex stability and DNA binding affinity. The
seven borderline and soft acids Ni(II), Cd(II), Zn(II), Co(II), Cu(II), Hg(II), and Pb(II)
produce: (i) appreciable positive ΔTm values indicative of the formation of stable
complexes that increase the binding affinity of 7 to DNA, and (ii) moderate to high “%Δ
Φem + metal” values in their respective buffer systems. Alternatively, the nine hard metals
Sn(IV), Mn(II), Ca(II), Cr(III), Mg(II), Zr(IV), Sc(III), V(V), and Fe(III) have no
appreciable effects on Tm and have lower “%Δ Φem + metal” values. Again, because
imidazole is a borderline base, it is reasonable that compound 7 should display a
preference for forming complexes with the seven borderline and soft metals rather than
with the nine hard metals.
The appreciable ΔTm values associated with Cd(II), Zn(II), Hg(II), and Pb(II) are
consistent with the observation that levels of DNA photocleavage are increased when
each of these four metals is added to compound 7 (Figure 2.1). In contrast, Ni(II), Co(II),
and Cu(II) have appreciable ΔTm values but at 25 µM concentrations yield the lowest
levels of DNA photocleavage out of the 16 metals tested (Ni(II) < Cu(II) < Co(II); Figure
2.1). In addition, Ni(II), Co(II), and Cu(II) produce the three largest “%Δ Φem + metal”

56
values in Table 2.4 (Ni(II) > Cu(II) > Co(II)). In the case of many photosensitizers5c
including the 3,6-acridinediamine proflavin,7b,c, 15 dye sensitized generation of singlet
oxygen (1O2; Type II reaction) and superoxide (O2•−; Type I reaction) are thought to arise
from the triplet state. With respect to compound 7, fluorescence quenching by any one of
the following three mechanisms could reduce the triplet state population, either directly
or indirectly: (i) heavy atom or paramagnetically induced spin-orbit coupling that
increases the rate of S1 → T1 and T1 → S0 processes, (ii) electron transfer between the
excited singlet state fluorophore and the metal ion, (iii) energy transfer from the excited
singlet state to the metal ion.16 The efficiency of Type I and Type II triplet state
photochemical processes that contribute to DNA photocleavage would then be decreased.
This hypothesis is consistent with the observation that compound 7 produces appreciably
Tm but extremely low levels of DNA photocleavage in the presence of Ni(II), Co(II), and
Cu(II) (Figures 2.1 and 2.4). In a study of acridine orange-DNA-metal ternary complexes,
Bregadze and co-workers observed significant emission quenching by Ni(II), Co(II), and
Cu(II) relative to Mn(II) and Zn(II).10 By calculating overlapping integrals and energy
transfer radii, the investigators concluded that Ni(II), Co(II), and Cu(II) had quenched the
excited singlet state of acridine orange by Förster-energy transfer.10, 17 While the
photoactive metals Cd(II), Zn(II), Hg(II), and Pb(II) also produce relatively high levels of
fluorescence quenching, there is no reason to assume that any of the 16 metal ions
evaluated in this study quench the singlet excited state of compound 7 by the same or
even a single mechanism.
The two remaining metals in the series of 16 constitute a special case. As
expected, the ΔTm and “%Δ Φem + metal” values of the hard acids V(V) and Fe(III) are

57
negligible. However, DNA photocleavage by compound 7 is increased in both cases. For
the six photoactive metals Hg(II), Fe(III), Cd(II), Zn(II), V(V), and Pb(II), complex
formation is indicated by scavenger experiments in which EDTA was shown to inhibit
metal-assisted DNA photocleavage by 7 (Table 2.3). Additional evidence was provided
by NMR and/or ESI mass spectra of 7 recorded in the presence of Hg(II), Fe(III), Cd(II),
Zn(II), V(V), and Pb(II). While extensive 2:1 metal-to-ligand complex formation was
observed only in the case of Cd(II) and Zn(II), 1:1 metallic complexes were formed by
all six photoactive metals the following order: Cd(II) ≈ Zn(II) > Hg(II) ≈ Pb(II) >>
Fe(III) > V(V). Thus, the extent of metal complex formation was found to be in good
agreement with the magnitude of the Tm increase: Cd(II) ≈ Zn(II) > Hg(II) ≈ Pb(II) >>
Fe(III) ≈ V(V). Taken together, these data indicate that V(V) and Fe(III) are likely to
form weak complexes with compound 7. There is at least one reasonable explanation to
account for the observation that both metals significantly enhance DNA photocleavage. It
is well known that electron transfer from the photochemically excited triplet states of
acridine orange,18a proflavin,18b and other 3,6-acridinediamines18b effect photoreduction of
Fe(III) to Fe(II). Although acridine-sensitized photoreduction of V(V) to V(IV) has not
been documented, irradiation of oxoperoxovanadium(V) in acidic media has been shown
to produce V(IV) with evolution of molecular oxygen.19 A potential source of
photocleavage enhancement might therefore involve compound 7-sensitized one electron
photoreduction of Fe(III) and V(V). The reduced metals would then be expected to
produce highly reactive, DNA damaging hydroxyl radicals by the Fenton reaction.20
Spectrophotometric Determination of Fe(II) and V(IV). In order to test for
photoreduction of Fe(III), we employed 1,10-phenanthroline, which forms a stable
58
complex with Fe(II) (λmax = 510 nm).21 Because vanadium(IV) reduces ferric to ferrous
ions, we then used a modified version of this colorimetric assay to detect V(IV).22 For
determination of Fe(II), individual photolysis reactions contained 20 mM sodium
phosphate buffer pH 7.0 with two or more of the following reagents: 50 µM compound
7, 25 µM FeCl3•6H2O, and 400 µM 1,10-phenanthroline monohydrate. The samples
were then irradiated with the broad-spectrum fluorescent lamp (50 min at 22 °C), while a
parallel set of reactions was kept in the dark. An irradiated reaction sample was then
equilibrated in 100 mM EDTA to promote Fe(II)/1,10-phenanthroline complex
disassociation. For V(IV) detection, the same procedure was employed except that: (i) 20
mM sodium cacodylate buffer pH 7.0 and 25 µM Na3VO4 were used during photolysis to
substitute for 20 mM sodium phosphate buffer and 25 µM FeCl3•6H2O; (ii) 25 µM
FeCl3•6H2O was added immediately after the sample irradiation interval to enable V(IV)
to reduce Fe(III) to Fe(II) and the Fe(II) product to form a complex with 1,10-
phenanthroline. UV-visible spectra were immediately recorded (Figure 2.5).
The reaction irradiated in the presence of compound 7, Fe(III), and 1,10-
phenanthroline produced an orange color change and a ~ 510 nm shoulder in the
absorption band of 7 (Figure 2.5A). A similar shoulder appeared upon the addition of
Fe(III) to the reaction irradiated in the presence of compound 7, V(V), and 1,10-
phenanthroline (Figure 2.5D). When EDTA was added to both reactions, the 510 nm
absorption became attenuated until the shoulder disappeared (Figure 2.5A and 2.5D).
The signature orange color change and absorption at ~ 510 nm were absent in all of the
dark reactions and in all of the reactions in which either 1,10-phenanthroline or
compound 7 were omitted (Figure 2.5). These data collectively indicate that compound 7
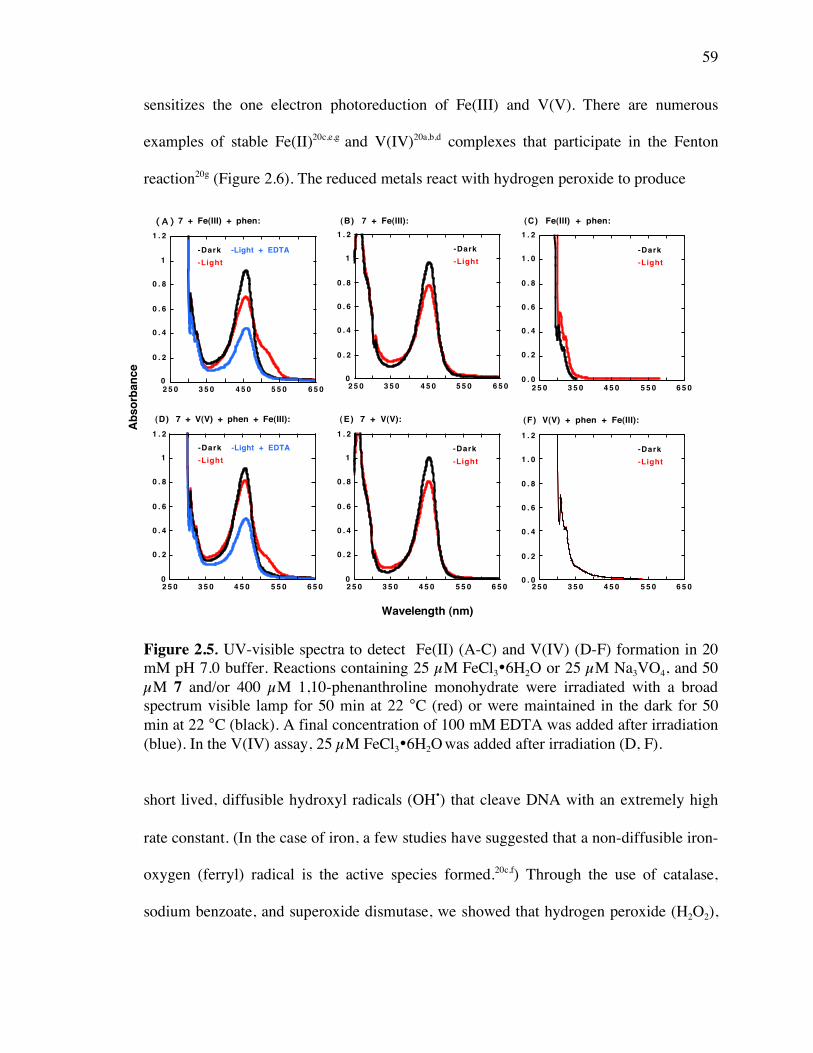
59
sensitizes the one electron photoreduction of Fe(III) and V(V). There are numerous
examples of stable Fe(II)20c,e,g and V(IV)20a,b,d complexes that participate in the Fenton
reaction20g (Figure 2.6). The reduced metals react with hydrogen peroxide to produce
Figure 2.5. UV-visible spectra to detect Fe(II) (A-C) and V(IV) (D-F) formation in 20 mM pH 7.0 buffer. Reactions containing 25 µM FeCl3•6H2O or 25 µM Na3VO4, and 50 µM 7 and/or 400 µM 1,10-phenanthroline monohydrate were irradiated with a broad spectrum visible lamp for 50 min at 22 °C (red) or were maintained in the dark for 50 min at 22 °C (black). A final concentration of 100 mM EDTA was added after irradiation (blue). In the V(IV) assay, 25 µM FeCl3•6H2O was added after irradiation (D, F).
short lived, diffusible hydroxyl radicals (OH•) that cleave DNA with an extremely high
rate constant. (In the case of iron, a few studies have suggested that a non-diffusible iron-
oxygen (ferryl) radical is the active species formed.20c,f) Through the use of catalase,
sodium benzoate, and superoxide dismutase, we showed that hydrogen peroxide (H2O2),
Ab
so
rban
ce
Wavelength (nm)
0
0 . 2
0 . 4
0 . 6
0 . 8
1
1 . 2
2 5 0 3 5 0 4 5 0 5 5 0 6 5 0
(B) 7 + Fe(III):
-Light
-Dark
0 . 0
0 . 2
0 . 4
0 . 6
0 . 8
1 . 0
1 . 2
2 5 0 3 5 0 4 5 0 5 5 0 6 5 0
Fe(III) + phen:
-Light
-Dark
(C)
0
0 . 2
0 . 4
0 . 6
0 . 8
1
1 . 2
2 5 0 3 5 0 4 5 0 5 5 0 6 5 0
(E ) 7 + V(V):
-Light
-Dark
0 . 0
0 . 2
0 . 4
0 . 6
0 . 8
1 . 0
1 . 2
2 5 0 3 5 0 4 5 0 5 5 0 6 5 0
V(V) + phen + Fe(III):(F)
-Light
-Dark
0
0 . 2
0 . 4
0 . 6
0 . 8
1
1 . 2
2 5 0 3 5 0 4 5 0 5 5 0 6 5 0
( A ) 7 + Fe(III) + phen:
-Light + EDTA
-Light
-Dark
0
0 . 2
0 . 4
0 . 6
0 . 8
1
1 . 2
2 5 0 3 5 0 4 5 0 5 5 0 6 5 0
(D) 7 + V(V) + phen + Fe(III):
-Light + EDTA
-Light
-Dark

60
hydroxyl radicals, superoxide anion radicals (O2•−) contribute to Fe(III) and V(V)-assisted
DNA photocleavage by compound 7 (Table 2.3). The H2O2 detected in these experiments
was most likely formed through dismutation of superoxide anion radicals (O2•−)20f
produced by Type I electron transfer from the excited triplet state of compound 7 to O2.
The fact that the H2O2 was generated in the presence of Fe(II) and V(IV) suggests that the
hydroxyl radicals originated from the Fenton reaction (Figure 2.6).
Figure 2.6. Fenton reaction. Abbreviation: M = metal.
According to Rehm and Weller theory, excited state redox potentials can be
calculated from corresponding ground state redox potentials and exited state energies.23
Thus, for acridine orange, the excited singlet state oxidation potential was estimated to be
–1.71 V in 0.18 M phosphate buffer pH 6.5.24 This value was obtained by Kittler and co-
workers using eq 1, in which U(*D/D•+) stands for excited state oxidation potential,
U(D/D•+) is the ground state oxidation potential, and E∞ is excited state energy.
U(*D/D•+) = U(D/D•+) — E∞ (2.1)
By substituting Kittler’s value for the ground state oxidation potential of acridine orange
in 0.18 M phosphate buffer pH 6.5 (0.70 V)24 and the excited triplet state energy of
acridine orange (2.13 eV) 25 into equation 1, we obtained an estimated value of –1.43 V
for the excited triplet state oxidation potential of acridine orange. Standard reduction
potentials at pH 7.0 are 0.991 V26 and 0.330 V27 for the V(V)/V(IV) and O2/O2•− couples,
respectively. In the case of iron, the reduction potential of the LFe(III)/LFe(II) couple
Mn -1
+ H2O2 Mn + OH + OH-
61
shows extreme variability based on the nature of the ligand L: at pH 7.0, standard values
range from –0.750 V to 1.15 V. 28 Notwithstanding, the estimated excited singlet and
excited triplet state oxidation potentials of acridine orange are more negative than all of
the above ground state reduction potentials, indicating that it should be possible for
acridine orange to sensitize one electron reduction of V(V), Fe(III), and O2. In the case of
Fe(III) and O2, this assertion is supported by the following experimental data. Acridine
orange photosensitized cell inactivation 29 and proflavin triplet state photosensitized DNA
cleavage 7b, 15b have both been associated with superoxide production, while the excited
triplet states of acridine orange,18a proflavin,18b and other 3,6-acridinediamines18b have
been shown to effect photoreduction of Fe(III) to Fe(II). Because the central core of
compound 7 is a 3,6-acridinediamine nearly identical in structure to acridine orange
(Figure 2.S1 in Supporting Information), the two chromophores are likely to have similar
excited singlet and triplet state oxidation potentials. Electron transfer from the excited
states of compound 7 to V(V), Fe(III), and O2 should also be feasible. This hypothesis is
consistent with the following lines of evidence reported in this paper. (i) In a series of
scavenger experiments, SOD was shown to inhibit Hg(II), Fe(III), Zn(II), and V(V)-
assisted DNA photocleavage, indicating that compound 7 is capable of photosensitizing
one electron reduction of O2 to O2•− (Table 2.3). (ii) In a spectrophotometric assay based
on 1,10-phenanthroline, compound 7 was shown to photosensitize one electron reduction
of Fe(III) and V(V) (Figure 2.5).
In summary, this report describes the synthesis and characterization of
compounds 7 and 10, which contain a central DNA binding 3,6-acridinediamine
chromophore attached to 4 and 2 metal coordinating imidazole rings, respectively. In a

62
survey of 16 metal salts, we have demonstrated that the highest levels of DNA
photocleavage are attained by 7 in the presence of either Hg(II), Fe(III), Cd(II), Zn(II),
V(V), or Pb(II) (pH 7.0, 22 ºC, 8 µM 7 to 50 µM 7). Scavenger experiments conducted
with sodium azide, superoxide dismutase, catalase, and sodium benzoate indicated the
involvement of Type I and Type II photochemical processes in these metal-assisted DNA
photocleavage reactions. Compound 7 afforded relatively low amounts of photocleavage
both in the absence of metal and in the presence of either Ni(II), Co(II), Cu(II), Sn(IV),
Mn(II), Ca(II), Cr(III), Mg(II), Zr(IV), or Sc(III). We also showed that photocleavage
could be modulated by modifying buffer type and pH.
Metallic complex formation between compound 7 and the six photoactive metals
Hg(II), Fe(III), Cd(II), Zn(II), V(V), and Pb(II) was implied by scavenger experiments in
which EDTA was shown to inhibit metal-assisted DNA photocleavage. Direct evidence
was provided by NMR and/or ESI mass spectral data.
On the basis of thermal melting and spectroscopic studies, we concluded that
several phenomena were likely to influence DNA photocleavage. When the 16 metals
were added to 7, significant changes in emission quantum yield and significant increases
in Tm were observed only for the seven borderline and soft metals in the series. The ΔTm
values of 8 °C for Ni(II), 6 °C for Cd(II), 6 °C for Zn(II), 4 °C for Co(II), 3 °C for Cu(II),
2 °C for Hg(II), and 2 °C for Pb(II) indicate that the seven borderline and soft metals
form complexes that increase the binding affinity of 7 to DNA. Alternatively, the
minimal “%Δ Φem + metal” and ΔTm values associated with Fe(III), Sn(IV), Sc(III),
Zr(IV), Cr(III), Ca(II), Mg(II), Mn(II) and V(V) suggest that that these nine hard metals
are unable to form strong complexes with the borderline imidazole rings of compound 7.

63
Regarding the six photoactive metals for which ESI mass spectra were recorded, the
extent of metal complex formation (Cd(II) ≈ Zn(II) > Hg(II) ≈ Pb(II) >> Fe(III) > V(V))
was found to be in good agreement with the above melting temperature trends. It is likely
that complex formation with positively charged metal enhanced electrostatic interactions
between compound 7 and the negatively charged DNA phosphate backbone. This may in
fact account for the increase in DNA photocleavage by compound 7 produced in the
presence of Hg(II), Cd(II), Zn(II), and Pb(II). Although Ni(II), Co(II), and Cu(II) also
raised Tm when added to compound 7, they were shown to efficiently quench
fluorescence and in turn to inhibit photocleavage. Melting temperature values were
unchanged upon addition of Fe(III) and V(V) to 7, in agreement with fluorescence
quenching data and with ESI spectra that showed weak complexation between the two
metals and 7. To account for the fact that DNA photocleavage was enhanced, we
employed a colorimetric assay to demonstrate that compound 7 sensitized the one
electron photoreduction of Fe(III) and V(V). The reduced metals would then accelerate
the production of highly reactive, DNA damaging hydroxyl radicals by the Fenton
reaction.20
Perhaps our most significant finding was the notable increase in compound 7
DNA photocleavage produced by Fe(III) in sodium phosphate buffer pH 7.0 (Figure 2.1,
Figure 2.4, Table 2.2). This is important in light of the fact that the H2PO4- and HPO4
2-
conjugate pair constitutes one of the two most important buffering systems in human
physiology. Second, iron is widely distributed throughout the human body and as a result,
has the potential to play an important role in the photodynamic action of compound 7 in
vivo. Several lines of experimental evidence have established that cellular lysosomes

64
contain low molecular weight pools of weakly chelated, redox active iron capable of
catalyzing the Fenton reaction.11, 30 (This iron pool is thought to arise from lysosomal
degradation of ferritin and other metalloproteins.) Upon entry into the cell, acridine
orange accumulates mainly in the lysosomes and to the lesser degree in the cytoplasm
and nucleus.11, 30a,c, 31 After this, iron catalyzed rupture of the lysosomal membranes is
triggered by reactive oxygen species generated upon exposure to H2O2.11, 30a,c, 32 Irradiation
of acridine orange with intense blue light also produces reactive oxygen species that
rupture the membranes.31b, 33 In both cases, the acridine orange is relocated from the
lysosomes to the cytoplasm and nucleus.11, 30a, 31b It has recently been suggested that
membrane rupture also triggers the diffusion of the weakly chelated iron from the
lysosomes into the nucleus, resulting in significant damage to genomic DNA by the
Fenton reaction.11
Acridine orange has demonstrated promise for use as a photosensitizer in
photodynamic therapy. It is selectively localized in a number of tumor types and has been
used to effect efficient in vivo photodestruction of epithelial tumors, Walker
carcinosarcoma 256 stomach tumors, and musculoskeletal sarcomas in animal models.8
Furthermore, the reactive oxygen species produced by irradiation of DNA bound acridine
orange are thought to play a role in triggering tumor cell death.8a,c, 31a, 34 The 3,6-
acridinediamine 7 possesses four iron chelating imidazole rings attached to a central
"acridine orange" core. In this paper, we have shown that iron markedly enhances DNA
photocleavage by compound 7 in vitro, while having little if any effect on photocleavage
produced by acridine orange (Table 2.1). We expect that it should also be possible for
compound 7 to demonstrate superior photodynamic action in vivo. It is conceivable that

65
compound 7 might chelate iron in lysosomes, facilitating the relocation of this metal to
the nucleus upon irradiation-induced membrane rupture. Subsequent binding of 7 to
nucleic acids would enable iron to catalyze the production of hydroxyl radicals within
angstroms of genomic DNA.
Conclusions
Our data indicate that buffer, pH, Hg(II), Fe(III), Cd(II), Zn(II), V(V), Pb(II) and
light can be used to "tune" DNA cleavage by compound 7 under physiologically relevant
conditions. In addition to its potential use as a photosensitizer in photodynamic therapy, 7
has serendipitously demonstrated metal chemosensing capabilities as indicated by our
spectrofluorometric experiments. Our immediate goal will be to explore the anti-tumor
properties of compound 7 in vivo. The use of metal coordinating imidazole rings may
represent an attractive chemical tool to enhance the photodynamic action of acridine
orange for chemotherapeutic purposes.
Experimental Section
General Methods. Melting points were determined in an Electrothermal IA9100
apparatus. Infrared spectra were taken on an FT-IR Perkin-Elmer 1725X
spectrophotometer. All 1H and 13C NMR spectra were recorded at 300 and 75 MHz,
respectively, on a Varian Mercury spectrometer. EI and CI mass spectra were generated
on a Hewlett-Packard HP-5988a spectrometer at 70 eV, while ESI and APCI mass
spectra were done either on an Automass Multi GC/API/MS Finnigan spectrometer or on
a Micromass Q-Tof hybrid mass spectrometer. FAB mass spectra were recorded using a
V.G. Autoexpec spectrometer with 3-nitrobenzyl alcohol as matrix. Elemental analyses
were performed with a Heraeus CHN analyzer. Merck silica gel 60 (230-400 ASTM

66
mesh) was employed for flash column chromatography. UV-visible spectra were
recorded with a Shimadzu UV-1601 spectrophotometer, while a Cary Bio100 UV-vis
spectrophotometer (Varian) was used to plot thermal melting curves.
Distilled, de-ionized water was utilized in the preparation of all buffers and
aqueous reactions. Chemicals were of the highest available purity and were used without
further purification. The metal salts CaCl2•2H2O, CdCl2, (CH3)2SnCl2, CoCl2•H2O,
CrCl3•6H2O, CuCl2•2H2O, FeCl3•6H2O, HgCl2, MgCl2•6H2O, MnCl2•4H2O, Na3VO4,
NiCl2•6H2O, PbCl2, Sc(CF3SO3)3, ZnCl2, and ZrCl4 were purchased from the Aldrich
Chemical Company (purity > 99%). Superoxide dismutase and catalase were from
Sigma. All other reagents, including cacodylic acid, ethidium bromide, 1,10-
phenanthroline monohydrate, sodium azide, sodium benzoate, sodium borate, sodium
cacodylate, sodium phosphate dibasic, and sodium phosphate monobasic, were from
Aldrich. Both 1H-imidazole-4-methanol hydrochloride,35 4-(chloromethyl)-1H-imidazole
hydrochloride36 were synthesized according to reported procedures. Transformation of E.
coli competent cells (Stratagene, XL-1 blue) with pUC19 plasmid DNA (Sigma) and
growth of bacterial cultures in Lauria-Bertani broth were performed using standard
laboratory protocols.37 The plasmid DNA was purified with a Qiagen Plasmid Mega Kit.
Calf thymus DNA (average size of ≤ 2000 bp, Invitrogen Catalog # 15633-019) was
utilized without further purification.
To promote complex formation, aqueous stock solutions containing 250 µM of 7
or 10 and 125 µM of each respective metal salt were equilibrated in the dark for 24 h at
22 °C. Subsequent photocleavage experiments and absorbance, emission and thermal
67
melting studies were conducted using the equilibrated solutions diluted to the appropriate
concentration.
2-[Bis(1H-imidazol-4-ylmethyl)amino]ethanol (1). To a solution of 2-
aminoethanol (0.6 mL, 9.8 mmol) in dry ethanol (20 mL) was added triethylamine (5.5
mL, 39.2 mmol). The reaction mixture was heated at reflux after which a solution of 4-
(chloromethyl)-1H-imidazole hydrochloride (3 g, 19.6 mmol) in dry ethanol (30 mL) was
added dropwise over 20 min. The mixture was heated at reflux for 3 h and the solvent
evaporated under reduced pressure. The resulting residue was stirred with
dichloromethane (100 mL) for 2 h, from which an oil was separated. The
dichloromethane was decanted and the oily product purified by flash column
chromatography using silica gel as adsorbent and methanol-ethyl acetate (1:1) as eluent.
This afforded 2 as a colorless oil in 70% yield. IR (KBr): 3108, 2879, 1628, 1571, 1450,
1085 cm-1. 1H NMR (CD3OD): δ 7.76 (d, J = 1.1 Hz, 2H, H-2), 7.16 (d, J = 1.1 Hz, 2H,
H-5), 3.88 (s, 4H, CH2Im), 3.70 (t, J = 5.5 Hz, 2H, CH2OH), 2.81 (t, J = 5.5 Hz, 2H,
CH2N). 13C NMR (CD3OD): δ 136.80 (C-2), 133.79 (C-4), 120.47 (C-5), 59.47 (CH2OH),
55.70 (CH2N), 50.23 (CH2Im). MS (CI): m/z 222 ([M + H]+, 32%), 170 (8), 161 (41), 142
(100), 109 (13), 90 (11), 81 (33). Anal. Calcd for C10H15N5O: C, 54.28; H, 6.83; N, 31.65.
Found: C, 54.04; H, 6.90; N, 31.91.
N-(2-Chloroethyl)-N-(1H-imidazol-4-ylmethyl)-1H-imidazole-4-methanamine
Trihydrochloride (2). To a solution of 2-[bis(1H-imidazol-4-ylmethyl)amino]ethanol (1)
(259 mg, 1.17 mmol) in dry DMF (5 mL) was added thionyl chloride (170 mL, 2.34
mmol). The reaction mixture was stirred at room temperature for 24 h and then
concentrated to dryness. The oily product thus obtained was dissolved in methanol,
68
precipitated with cold ethyl acetate, filtered out, and washed thoroughly with cold ethyl
acetate. The hygroscopic solid was dried and kept under vacuum. Yield: 352 mg (86%);
Mp: 173-174 ˚C. IR (KBr): 3412, 3118, 1701, 1621, 1439, 1277, 1169, 1087 cm-1. 1H
NMR (CD3OD): δ 8.92 (d, J = 1.0 Hz, 2H, H-2), 7.59 (d, J = 1.0 Hz, 2H, H-5), 3.96 (s,
4H, CH2Im), 3.65 (t, J = 6.5 Hz, 2H, CH2Cl), 2.93 (t, J = 6.5 Hz, 2H, CH2N). 13C NMR
(CD3OD): δ 135.63 (C-2), 131.43 (C-4), 119.22 (C-5), 55.80 (CH2N), 48.45 (CH2Im),
42.12 (CH2Cl). MS (ESI): m/z 240 [(M -3HCl) + H]+ (Calcd for C10H17Cl4N5 347). Anal.
Calcd for C10H17Cl4N5: C, 34.58; H, 4.94; Cl, 40.31; N, 20.18. Found: C, 34.72; H, 4.91;
N, 19.83.
N-(2-Chloroethyl)-N-[1-(triphenylmethyl)-1H-imidazol-4-ylmethyl]-1-
(triphenylmethyl)-1H-imidazole-4-methanamine (3). To a solution of N-(2-
chloroethyl)-N-(1H-imidazol-4-ylmethyl)-1H-imidazole-4-methanamine trihydrochloride
(2) (492 mg, 1.42 mmol) in dry DMF (8 mL) was added triethylamine (2 mL, 14.75
mmol). The reaction mixture was stirred at room temperature for 20 min and then a
solution of triphenylmethylchloride (2.10 g, 7.36 mmol) in anhydrous DMF (20 mL) was
added dropwise. After 2 h stirring, the reaction mixture was poured onto crushed ice. The
precipitate was filtered and purified by flash column chromatography using silica gel
(0.1% Ca enriched) as adsorbent and ethyl acetate as eluent to give 3 in 61% yield; Mp:
125-127 ˚C. IR (KBr): 3059, 3031, 2927, 1596, 1492, 1444, 1324, 1237 cm-1. 1H NMR
(CDCl3): δ 7.36 (d, J = 1.5 Hz, 2H, H-2 Im), 7.30-7.26 (m, 18H, Ph), 7.13-7.08 (m, 12H,
Ph), 6.60 (br s, 2H, H-5 Im), 3.64 (s, 4H, CH2Im), 3.41 (t, J = 7.4 Hz, 2H, CH2Cl), 2.84
(t, J = 7.4 Hz, 2H, CH2N). 13C NMR (CDCl3): δ 142.36 (Cipso Ph), 138.48 (C-2 Im),
138.25 (C-4 Im), 129.65, 127.98, 127.92 (Ph), 120.43 (C-5 Im), 75.10 (CPh3), 54.65

69
(CH2N), 51.90 (CH2Im), 42.13 (CH2Cl). MS (APCI): m/z 724 ([M + H]+) (Calcd for
C48H42ClN5 723). Anal. Calcd for C48H42ClN5: C, 79.63; H, 5.85; Cl, 4.83; N, 9.68.
Found: C, 79.92; H, 5.62; N, 9.45.
3,6-Acridinediylbiscarbamic Acid Bis(1,1-dimethylethyl) Ester (4). To a
solution of di-tert-butyl dicarbonate (26.4 mL, 115 mmol) in dry acetone (250 mL) was
added 3,6-acridinediamine (2 g, 9.56 mmol). The reaction mixture was heated at reflux
for 72 h and then concentrated to dryness. The crude product thus obtained was purified
by flash column chromatography on silica gel using hexane-ethyl acetate (1:1) as eluent.
The 3,6-acridinediylbiscarbamic acid bis(1,1-dimethylethyl) ester (4) was obtained in
72% yield; Mp: > 280 ˚C. IR (KBr): 3282, 2976, 1703, 1618, 1523, 1461, 1367, 1336,
1235, 1156 cm-1. 1H NMR (DMSO-d6): δ 9.81 (s, 2H, N-H), 8.75 (s, 1H, H-9), 8.19 (d, J
= 2.2 Hz, 2H, H-4, H-5), 7.96 (d, J = 9.1 Hz, 2H, H-1, H-8), 7.58 (dd, J = 9.1, 2.2 Hz,
2H, H-2, H-7), 1.52 (s, 18H, CMe3). 13C NMR (DMSO-d6): δ 152.90 (CO), 149.95 (C-4a,
C-10a), 141.39 (C-3, C-6), 135.26 (C-9), 129.18 (C-1, C-8), 122.01 (C-8a, C-9a), 119.67
(C-2, C-7), 112.40 (C-4, C-5), 79.88 (CMe3), 28.29 (CMe3). MS (EI): m/z 409 (M+, 17%),
353 (8), 309 (18), 297 (93), 254 (13), 253 (83), 235 (3), 210 (11), 209 (72), 208 (25), 182
(31), 181 (37), 179 (11), 154 (13), 153 (11), 127 (9). Anal Calcd for C23H27N3O4: C,
67.46; H, 6.65; N, 10.26. Found: C, 67.59; H, 6.53; N, 10.02. Continued elution with
ethyl acetate and then with ethyl acetate-acetone-triethylamine (5:5:1) afforded the (6-
amino-3-acridinyl)carbamic acid 1,1-dimethylethyl ester (8) in 10% yield.
Synthesis of 3,6-Acridinediylbis[2-[bis[[1-(triphenylmethyl)-1H-imidazol-4-
yl]methyl]-amino]ethyl]carbamic Acid Bis(1,1-dimethylethyl) Ester (5). A mixture of
3,6-acridinediylbiscarbamic acid bis(1,1-dimethylethyl) ester (4) (61 mg, 0.15 mmol) and

70
Cs2CO3 (635 mg, 1.95 mmol) in dry DMF (5 mL) was stirred at room temperature for 30
min, after which N-(2-chloroethyl)-N-[1-(triphenylmethyl)-1H-imidazol-4-ylmethyl]-1-
(triphenylmethyl)-1H-imidazole-4-methanamine (3) (225 mg, 0.31 mmol) in 5 mL DMF
was added. After 24 h of stirring at room temperature, 3 (225 mg, 0.31 mmol) in 6 mL
DMF was added. The reaction was stirred for another 24 h and then poured onto crushed
ice. The resulting precipitate was collected, washed thoroughly with cold water, dried and
purified by flash column chromatography on silica gel using ethyl acetate-methanol (9:1)
as eluent, yielding pure 3,6-acridinediyl-bis[2-[bis[[1-(triphenylmethyl)-1H-imidazol-4-
yl]methyl]-amino]ethyl]carbamic acid bis(1,1-dimethylethyl) ester (5) (239 mg, 89%);
Mp: 125-127 ˚C. IR (KBr): 3423, 3059, 2926, 2849, 1698, 1615, 1492, 1448, 1367, 1300,
1239, 1152, 1037 cm-1. 1H NMR (CDCl3): δ 8.37 (s, 1H, H-9 Acr), 7.87 (d, J = 1.8 Hz,
2H, H-4, H-5 Acr), 7.62 (d, J = 9.1 Hz, 2H, H-1, H-8 Acr), 7.43 (dd, J = 9.1, 1.8 Hz, 2H,
H-2, H-7 Acr), 7.31 (d, J = 1.1 Hz, 4H, H-2 Im), 7.23-7.15 (m, 36 H, Ph), 7.06-7.01 (m,
24 H, Ph), 6.49 (d, J = 1.1 Hz, 4H, H-5 Im), 3.92 (t, J = 7.3 Hz, 4H, CH2N-Acr), 3.58 (s,
8H, CH2Im), 2.84 (t, J = 7.3 Hz, 4H, CH2N), 1.39 (s, 18H, CMe3). 13C NMR (CDCl3):
δ 154.15 (CO), 149.41 (C-4a, C-10a Acr), 144.81 (C-3, C-6 Acr), 142.41 (Cipso Ph),
138.35 (C-2, C-4 Im), 134.62 (C-9 Acr), 129.63, 127.90, 127.83 (Ph), 127.49, (C-1, C-8
Acr), 126.97 (C-2, C-7 Acr), 124.31 (C-8a, C-9a Acr), 123.53 (C-4, C-5 Acr), 120.38 (C-
5 Im), 80.56 (CMe3), 74.97 (CPh3) 51.87 (CH2N), 50.78 (CH2Im), 48.53 (CH2N-Acr),
28.35 (CMe3). MS (FAB): m/z 1785 [M + H]+ (Calcd for C119H109N13O4 1784). Anal.
Calcd for C119H109N13O4: C, 80.06; H, 6.15; N, 10.20. Found: C, 80.27; H, 6.22; N, 9.97.
3,6-Acridinediyl-[2-[bis[[1-(triphenylmethyl)-1H-imidazol-4-yl]methyl]-
amino]ethyl]carbamic Acid Bis(1,1-dimethylethyl) Ester (6): Mp: 117-118 ˚C. IR
71
(KBr): 3415, 3058, 2975, 1698, 1617, 1569, 1544, 1492, 1450, 1367, 1240, 1152, 1037
cm-1. 1H NMR (CDCl3): δ 8.46 (s, 1H, H-9 Acr), 7.92 (d, J = 1.7 Hz, 1H, H-4 Acr), 7.87
(br s 2H, H-7, H-8 Acr), 7.76 (br s, H-5 Acr), 7.64 (d, J = 8.9 Hz, 1H, H-1 Acr), 7.41 (dd,
J = 8.9, 1.7 Hz, H-2 Acr), 7.31 (d, J = 1.3 Hz, 2H, H-2 Im), 7.23-7.20 (m, 18H Ph), 7.05-
7.02 (m, 12H, Ph), 6.52 (d, J = 1.3 Hz, 2H, H-5 Im), 3.90 (t, J = 7.0 Hz, 4H, CH2N-Acr),
3.59 (s, 4H, CH2Im), 2.84 (t, J = 7.0 Hz, 2H, CH2N), 1.58 (s, 9H, CMe3), 1.39 (s, 9H,
CMe3). 13C NMR (CDCl3): δ 154.12, 152.40 (CO) 149.55 (C-4a, C-10a Acr), 144.97 (C-
3, C-6 Acr), 142.42 (Cipso Ph), 138.35 (C-2, C-4 Im), 135.01 (C-9 Acr), 129.64 (C-8 Acr
and Ph), 127.88 (Ph), 127.80 (Ph and C-1 Acr), 126.57 (C-2 Acr), 123.78 (C-8a Acr),
123.25 (C-9a, C-4a Acr), 120.42 (C-5 Im), 119.78 (C-7 Acr), 113.70 (C-5 Acr), 81.12,
80.60 (CMe3), 75.01 (CPh3), 51.78 (CH2N), 50.94 (CH2Im), 48.42 (CH2N-Acr), 28.32
(CMe3). MS (FAB): m/z 1097 [M+H]+ (Calcd for C71H68N8O4 1096). Anal. Calcd for
C71H68N8O4: C, 77.71; H, 6.25; N, 10.21. Found: C, 77.51; H, 6.34; N, 10.47.
N,N’-Bis[2-[bis(1H-imidazol-4-ylmethyl)amino]ethyl]-3,6-acridinediamine
(7). A suspension of 5 (591 mg, 0.33 mmol) in 2 N HCl (20 mL) was heated at 50-60 ˚C
for 3.5 h. The resulting precipitate of triphenylmethanol was filtered off and the filtrate
basified to pH 8-9 with 2 N NaOH. The precipitate thus obtained was filtered, washed
with cold water, and dried in a vacuum dessicator to give 177 mg (87%) of pure product;
Mp: 146-148 ˚C. IR (KBr): 3118, 2923, 2834, 2834, 1642, 1610, 1450, 1375, 1279, 1168,
1105 cm-1. 1H NMR (CD3OD): δ 8.30 (s, 1H, H-9 Acr), 7.62-7.58 (m, 6H, H-1, H-8 Acr
and H-2 Im), 6.97 (d, 4H, J = 0.7 Hz, 4H, H-5 Im), 6.90 (dd, J = 9.2, 2.2 Hz, 2H, H-2, H-
7 Acr), 6.58 (d, J = 2.2 Hz, 2H, H-4, H-5 Acr), 3.69 (s, 8H, CH2Im), 3.28 (t, J = 5.9 Hz,
4H, CH2N-Acr), 2.76 (t, J = 5.9 Hz, 4H, CH2N). 13C NMR (CD3OD): δ 153.13 (C-4a, C-

72
10a Acr), 150.36 (C-3, C-6 Acr), 138.54 (C-9 Acr), 136.49 (C-2 Im), 134.90 (C-4 Im),
130.64 (C-1, C-8 Acr), 120.65 (C-5 Im), 120.10 (C-8a, C-9a Acr), 119.22 (C-2, C-7 Acr),
97.91 (C-4, C-5 Acr), 52.13 (CH2N), 50.74 (CH2Im), 41.72 (CH2N-Acr). MS (FAB) m/z
616 [M + H]+ (Calcd for C33H37N13 615). Anal. Calcd for C33H37N13: C, 64.37; H, 6.06; N,
29.57. Found: C, 64.24; H, 6.11; N, 29.71.
(6-Amino-3-acridinyl)carbamic Acid 1,1-Dimethylethyl Ester (8). To a
solution of di-tert-butyldicarbonate (4.4 mL, 19.12 mmol) in dry acetone (150 mL) was
added 3,6-acridinediamine (2 g, 9.56 mmol). The reaction mixture was heated at reflux
for 8 h and then concentrated to dryness. The crude product thus obtained was purified by
flash column chromatography using silica gel as adsorbent. With hexane-ethyl acetate
(1:1) as eluent, 3,6-acridinediylbiscarbamic acid bis(1,1-dimethylethyl) ester (4) (746 mg,
25%) was obtained. Continued elution with ethyl acetate and then ethyl acetate-acetone-
triethylamine (5:5:1) afforded 2.3 g (59%) of the (6-amino-3-acridinyl)carbamic acid 1,1-
dimethylethyl ester (8); Mp: > 280 ˚C. IR (KBr): 3363, 2976, 1709, 1624, 1572 cm-1. 1H
NMR (DMSO-d6): δ 9.69 (s, 1H, N-H), 8.50 (s, 1H, H-9), 8.05 (d, J = 2.1 Hz, 1H, H-4),
7.81 (d, J = 9.1 Hz, 1H, H-1), 7.73 (d, J = 9.1 Hz, 1H, H-8), 7.43 (dd, J = 9.1, 2.1 Hz, 1H,
H-2), 6.99 (dd, J = 9.1, 2.1 Hz, 1H, H-7), 6.85 (d, J = 2.1 Hz, 1H, H-5), 6.04 (s, 2H,
NH2), 1.51 (s, 9H, CMe3). 13C NMR (DMSO-d6): δ 152.93 (CO), 151.49 (C-10a), 151.06
(C-6), 49.75 (C-4a), 140.93 (C-3), 134.96 (C-9), 129.61 (C-8), 129.12 (C-1), 120.54 (C-
9a), 120.11 (C-8a), 120.00 (C-7), 117.68 (C-2), 112.16 (C-4), 102.93 (C-5), 79.68
(CMe3), 28.32 (CMe3). MS (EI): m/z 309 (M+, 8%), 253 (33), 235 (23), 209 (100), 182
(31), 181 (25), 127 (5), 104 (7), 57 (10). Anal. Calcd for C18H19N3O2: C, 69.88; H, 6.19;
N, 13.58. Found: C, 69.61; H, 6.13; N, 13.84.
73
(6-Amino-3-acridinyl)-[2-[bis[[1-(triphenylmethyl)-1H-imidazol-4-
yl]methyl]amino]ethyl]carbamic Acid 1,1-Dimethylethyl Ester (9). To a mixture of 6-
amino-3-acridinyl)carbamic acid 1,1-dimethylethyl ester (8) (156 mg, 0.51 mmol) and
cesium carbonate (900 mg, 2.76 mmol) in dry DMF (40 mL) was added N-(2-
chloroethyl)-N-[1-(triphenylmethyl)-1H-imidazol-4-ylmethyl]-1-(triphenylmethyl)-1H-
imidazole-4-methanamine (3) (400 mg, 0.55 mmol). The reaction mixture was stirred at
room temperature under argon. After 24 and 48 h, an additional amount (100 mg, 0.14
mmol) of 3 was added. Finally, the reaction was stirred for another 24 h and then poured
onto crushed ice. The precipitate was filtered and washed with cold water. The solid thus
obtained was purified by column chromatography on silica gel (0.1% Ca enriched) using
ethyl acetate-triethylamine (10:1) and acetone-ethyl acetate-triethylamine (5:5:1) as
eluents, yielding pure 9 (428 mg, 85 %); Mp: 115-117 ˚C. IR (KBr): 3353, 3058, 2925,
1694, 1641, 1612, 1492, 1463, 1445 cm-1. 1H NMR (CD3OD): δ 8.46 (s, 1H, H-9 Acr),
7.77 (d, J = 9.0, 1H, H-8 Acr), 7.71 (d, J = 2.0, 1H, H-4 Acr), 7.61 (d, J = 9.0 Hz, 1H, H-
1 Acr), 7.29 (d, J = 1.5 Hz, 2H, H-2 Im), 7.21-7.18 (m, 19H, H-2 Acr and Ph), 7.12 (dd, J
= 9.0, 2.0 Hz, 1H, H-7 Acr), 7.01-6.96 (m, 13H, H-5 Acr and Ph), 6.55 (d, J = 1.5 Hz, 2H,
H-5 Im), 3.82 (t, J = 7.0 Hz, 2H, CH2N-Acr), 3.52 (s, 4H, CH2Im), 2.74 (t, J = 7.0 Hz,
2H, CH2N), 1.36 (s, 9H, CMe3). 13C NMR (CD3OD): δ 155.52 (CO), 153.43 (C-10a Acr),
151.69 (C-4a Acr), 148.94 (C-6 Acr), 146.14 (C-3 Acr), 143.28 (Cipso Ph), 139.01, 138.88
(C-2, C-4 Im), 137.84 (C-9 Acr), 130.89 (C-8 Acr), 130.49 (Ph), 129.62 (C-1 Acr),
129.02 (Ph), 125.31 (C-2 Acr), 123.35, 122.89, (C-8a, C-9a Acr), 122.28 (C-4 Acr),
121.89, 121.82 (C-5 Im, C-7 Acr), 102.54 (C-5 Acr), 82.00 (CMe3), 76.64 (CPh3), 54.79
(CH2N), 52.72 (CH2Im), 52.18 (CH2N-Acr), 28.71 (CMe3). MS (FAB): m/z 997 [M + H]+
74
(Calcd for C66H60N8O2 996). Anal. Calcd for C66H60N8O2: C, 79.49; H, 6.06; N, 11.24.
Found: C, 79.63; H, 6.21; N, 10.96.
N-[2-[Bis(1H-imidazol-4-ylmethyl)amino]ethyl]-3,6-acridinediamine (10). A
suspension of 9 (377 mg, 0.38 mmol) in 2 N HCl (20 mL) was heated at 50-60 ˚C for 3.5
h. The resulting white precipitate of triphenylmethanol was filtered off and the filtrate
basified to pH 8-9 with 2 N NaOH. The precipitate thus obtained was filtered and dried in
a vacuum dessicator, affording 109 mg (70%) of pure product that decomposed above
198 ˚C. IR (KBr): 3328, 3115, 2827, 1610, 1521, 1464, 1418, 1390, 1274, 1223, 1159,
1104 cm-1. 1H NMR (CD3OD): δ 8.36 (s, 1H, H-9 Acr), 7.67-7.60 (m, 2H, H-1, H-8
Acr), 7.63 (s, 2H, H-2 Im), 7.25 (s, 1H, NH-Acr), 6.97 (s, 2H, H-5 Im), 6.91 (m, 2H, H-2,
H-7 Acr), 6.85 (br s, 1H, H-5 Acr), 6.58 (br s, 1H, H-4 Acr), 3.68 (s, 4H, CH2Im), 3.27 (t,
J = 6.0 Hz, 2H, CH2N-Acr), 2.74 (t, J = 6.0 Hz, 2H, CH2N). 13C NMR (CD3OD):
δ 153.80, 153.33, (C-4a, C-10a Acr), 150.24, 149.76, (C-3, C-6 Acr), 139.02 (C-9 Acr),
136.49 (C-2 Im), 134.99 (C-4 Im), 131.30, 130.78, (C-1, C-8 Acr), 120.60 (C-5 Im),
120.11, 119.94, (C-8a, C-9a Acr), 119.44, 118.87 (C-2, C-7 Acr), 101.50 (C-5 Acr),
97.46 (C-4 Acr), 52.09 (CH2N), 50.74 (CH2Im), 41.69 (CH2N-Acr). MS (FAB): m/z 413
[M+H]+ (Calcd for C23H24N8 412). Anal. Calcd for C23H24N8: C, 66.97; H, 5.86; N, 27.16.
Found: C, 66.84; H, 5.61; N, 27.56.
Photocleavage Experiments. In a total volume of 20 µL, individual reactions
contained 38 µM bp pUC19 plasmid DNA in (i) 20 mM buffer or in (ii) 20 mM buffer,
50 µM 7 and/or 25 µM of one of the following metal salts: CaCl2•2H2O, CdCl2,
(CH3)2SnCl2, CoCl2•H2O, CrCl3•6H2O, CuCl2•2H2O, FeCl3•6H2O, HgCl2, MgCl2•6H2O,
MnCl2•4H2O, Na3VO4, NiCl2•6H2O, PbCl2, Sc(CF3SO3)3, ZnCl2, or ZrCl4. The buffer

75
systems employed were: 20 mM sodium cacodylate pH 5.0, 6.0, and 7.0; 20 mM sodium
phosphate pH 5.0, 6.0, 7.0, and 8.0; and sodium borate pH 8.0, and 9.0. Reactions were
kept in the dark or were irradiated for 50 min at 22 °C in 1.7 mL microcentrifuge tubes
with a broad-spectrum 4 W T4T5/D fluorescent lamp (EIKO Ltd.) located 6 cm above
the opened tubes. Aerobic ventilation was achieved by placing a table fan directly
adjacent to the lamp. Cleavage products were then electrophoresed on a 1.0 % non-
denaturing agarose gel stained with ethidium bromide (0.5 µg/mL), visualized on a
transilluminator set at 302 nm, photographed, and scanned. Amounts of supercoiled,
nicked and linear plasmid DNA were then quantitated using ImageQuant Mac v.1.2
software (Amersham Biosciences). In calculating photocleavage yields, the density of the
supercoiled DNA band was multiplied by a correction factor of 1.22 to compensate for
the relatively low ethidium bromide staining efficiency of supercoiled DNA compared to
nicked and linear plasmid.
Thermal Melting Studies. Individual 3 mL solutions containing 12.5 mM bp calf
thymus DNA in (i) 20 mM sodium phosphate buffer pH 7.0 or in (ii) 20 mM sodium
phosphate buffer pH 7.0, 8 µM 7 and/or 4 µM of each of the 16 metal salts were placed
in 3 mL (1 cm) quartz cuvettes (Starna). For V(V) and Pb(II), 20 mM sodium cacodylate
buffer was used to substitute for the sodium phosphate buffer. While absorbance was
monitored at 260 nm, DNA was denatured by using a Peltier heat block to increase the
temperature from 25 ºC to 100 ºC at a rate of 0.5 °C min-1. KaleidaGraph™ Version 3.5
was then utilized to approximate the first derivative of ΔA260/ΔT vs temperature, where
the Tm value at the inflection point of each sigmoidal melting transition was marked by
the maximum of its corresponding first derivative plot.
76
Scavenger Experiments. Individual 20 µL reactions containing 20 mM sodium
phosphate buffer pH 7.0, 38 µM bp pUC19 plasmid DNA, 50 µM 7, and 25 µM of the
metals salts CdCl2, FeCl3•6H2O, HgCl2, Na3VO4, PbCl2, and ZnCl2 were irradiated with a
broad-spectrum 4 W T4T5/D fluorescent lamp (EIKO Ltd.) in the presence of either 100
mM sodium azide, 100 mM sodium benzoate, 50 U superoxide dismutase, 50 U catalase,
or 100 mM EDTA (50 min at 22 °C). For V(V) and Pb(II), 20 mM sodium cacodylate
buffer was used to substitute for the sodium phosphate buffer. Reaction products were
then resolved on a 1.0% non-denaturing agarose gel and quantitated as described above.
The percent inhibition of DNA photocleavage was calculated based on cleavage yields
obtained in parallel reactions run without scavenger: [((% cleavage in the presence of 7
and metal) – (% cleavage in the presence of scavenger, 7, and metal))/(% cleavage in the
presence of 7 and metal)] x 100.
Quantum Yield Measurements. Emission spectra were recorded from 440 to
630 nm at 25 °C in 1 cm quartz cuvettes (Starna) using an Olis SLM-8000
spectrofluorimeter equipped with Olis Spectral Works v. 3.0.12 software. A 2 µM
solution of proflavin in 50 µM potassium acetate buffer pH 4.0 (Φ = 0.27, 38 λmax = 444
nm, ε = 30 800 M-1 cm-1) was used as the reference to calculate the quantum yields of 5
µM 7 in 20 mM sodium phosphate buffer pH 7.0 (λmax = 459 nm, ε = 20 000 M-1 cm-1)
and in 20 mM sodium cacodylate buffer pH 7.0. Compound 7, calf thymus DNA, and
metal salt were adjusted to the following concentrations in order to give an absorbance of
~0.04 at the 430 nm excitation wavelength: 4-7 µM 7 and 2-3.5 µM metal salt in
solutions containing compound 7 and metals salt; 7-10 µM 7, 3.5-5 µM and 10.9-15.6
µM bp DNA in solutions containing compound 7, metal salt, and calf thymus DNA.

77
Additional emission spectra were then recorded 20 mM sodium phosphate buffer pH 7.0
and in 20 mM sodium cacodylate buffer pH 7.0 after which emission quantum yields
were relative to 7 in the appropriate buffer. The excitation and emission monochromator
slit widths of the spectrofluorimeter were set at 1 nm and 8 nm, receptively. An excitation
polarizer set at 0° and an emission polarizer set at the “magic angle” (54.7°) were used in
order to eliminate possible effects from non-isotropic fluorescence. Lamp spectral
intensity output was monitored by recording the Raman peak of water (λex = 350 nm, λem
397 nm) and the emission of 7 (λex = 430 nm, λem 500 nm). The emission spectra were
corrected for wavelength-dependent response of the spectrofluorimeter, converted to
quanta units, and integrated. Relative emission quantum yields were then calculated by
the comparative method.39 All data were averaged over three trials with errors reported as
standard deviation.
Colorimetric Detection of Fe(II).21 A series of 500 µL reactions was prepared
containing 20 mM sodium phosphate buffer pH 7.0 and two or more of the following
reagents: 50 µM 7, 25 µM FeCl3•6H2O, and 400 µM 1,10-phenanthroline monohydrate.
The samples were irradiated with the 4W F4T5/D fluorescent lamp, while a parallel set of
reactions was kept in the dark. After 50 min, the solutions were visually examined for
color change, placed in 500 µL quartz cuvettes, and monitored between 250 nm and 650
nm for evidence of Fe(II)–1,10-phenanthroline complex formation. To dissociate the 510
nm complex, an irradiated reaction sample containing 50 µM 7, 25 µM FeCl3•6H2O, and
400 µM 1,10-phenanthroline was equilibrated in 100 mM EDTA for 6 h in the dark.
Colorimetric Detection of V(IV).22 In order to detect V(IV), the following
modifications were made to the colorimetric assay described above: (i) 20 mM sodium
78
cacodylate buffer pH 7.0 and 25 µM Na3VO4 were used during photolysis to substitute
for 20 mM sodium phosphate buffer and 25 µM FeCl3•6H2O; (ii) after 50 min of
irradiation, 12.5 µL of 1 mM FeCl3•6H2O were added to the reactions containing 7,
V(V), 1,10-phenanthroline, and V(V), 1,10-phenanthroline. The solutions were
equilibrated in the dark for 45 min, visually examined for color change, and monitored
between 200 nm and 650 nm for evidence of Fe(II)–1,10-phenanthroline complex
formation.
Acknowledgment. We thank Professors Thomas L. Netzel and Marcus W.
Germann (Georgia State University) for assistance with emission quantum yield
measurements and thermal melting studies, respectively. We also thank Professor
Christoph J. Fahrni (Georgia Institute of Technology) and Professor Jerry C. Smith
(Georgia State University) for helpful discussions. Support of this research by the CICYT
(Project BQU 2002-02576; A.L.), the National Science Foundation (CHE-9984772;
K.B.G.), the American Chemical Society Petroleum Research Fund (32897-G3; K.B.G.),
and the Consejería de Educación de la Comunidad de Madrid (L.G.) is gratefully
acknowledged.
Note Added after ASAP Pbublication. The heading of column 9 in Table 4 was
corrected and other minor changes in the text were made to the version posted ASAP
August 11, 2005; the corrected version was posted August 12, 2005.

79
References
(1) (a) Dolmans, D. E. J. G. J.; Fukumura, D.; Jain, R. K. Nat. Rev. Cancer 2003, 3,
380-387. (b) Stapleton, M.; Rhodes, L. E. J. Dermatolog. Treat. 2003, 2, 107-112.
(c) Vrouenraets, M. B.; Visser, G. W. M.; Snow, G. B.; van Dongen, G. A. M. S.
Anticancer Res. 2003, 23, 505-522. (d) Zeitouni, N. C.; Oseroff, A. R.; Shieh, S.
Mol. Immunol. 2003, 39, 1133-1136. (e) Dougherty, T. J. J. Clin. Laser. Med.
Surg. 2002, 20, 3-7. (f) Fong, D. S. Ophthalmology 2000, 107, 2314-2317.
(2) (a) Ashkenazi, H.; Nitzan, Y.; Gál, D. Photochem. Photobiol. 2003, 77, 186-191.
(b) Wainwright, M. Int. J. Antimicro. Agents 2003, 21, 510-520. (c) Ramaiah, D.;
Eckert, I.; Arun, K. T.; Weidenfeller, L.; Epe, B. Photochem. Photobiol. 2002, 76,
672-677. (d) Wagner, S. J.; Skripchenko, A.; Thompson-Montgomery, D.
Photochem. Photobiol. 2002, 76, 514-517. (e) Smetana, Z.; Ben-Hur, E.;
Mendelson, E.; Salzberg, S.; Wagner, P.; Malik, Z. J. Photochem. Photobiol. B:
Biol. 1998, 44, 77-83.
(3) Bonnet, R. In Chemical Aspects of Photodynamic Therapy; Phillips, D., Ed.,
Gordon and Breach Science: The Netherlands, 2000; Vol. I, pp 70-87.
(4) (a) Konan, Y. N.; Gurny, R.; Allémann, E. J. Photochem. Photobiol. B: Biol.
2002, 66, 89-106. (b) Zovinka, E. P.; Sunseri, D.R. J. Chem. Ed. 2002, 79, 1331-
1335. (c) Schuitmaker, J. J.; Baas, P.; van Leegoed, H. L. L. M.; van der Meulen,
F. W.; Star, W. M.; van Zandwijk, N. J. Photochem. Photobiol. B: Biol. 1996, 34,
3-12.
80
(5) (a) Quédraogo, G. D.; Redmond, R. W. Photochem. Photobiol. 2003, 77, 192-
203. (b) Choi Kim, H. R.; Luo, Y.; Li, G.; Kessel, D. Cancer Res. 1999, 59, 3429-
3432. (c) Ochsner, M. J. Photochem. Photobiol. B: Biol. 1997, 39, 1-18.
(6) (a) Gollnick, S. O.; Evans, S. S.; Baumann, H.; Owczarczak, B.; Maier, P.;
Vaughan, L.; Wang, W. C.; Unger, E.; Henderson, B. W. Br. J. Cancer 2003, 88,
1772-1779. (b) Korbelik, M.; Dougherty, G. J. Cancer Res. 1996, 59, 1941-1946.
(7) (a) Bowler, B. E.; Hollis, S.; Lippard, S. J. J. Am. Chem. Soc. 1984, 106, 6102-
6104. (b) Piette, J.; Lopez, M.; Calberg-Bacq, C. M.; Van de Vorst, A. Int. J.
Radiat. Biol. 1981, 40, 427-433. (c) Piette, J.; Calberg-Bacq, C.M.; Van de Vorst,
A. Photochem. Photobiol. 1979, 30, 369-378. (d) Freifelder, D.; Davison, P. F.;
Geiduschek, E. P. Biophys. J. 1961, 1, 389-400.
(8) (a) Kusuzaki, K.; Aomori, K.; Suginoshita, T.; Minami, G.; Takeshita, H.;
Murata, H.; Hashiguchi, S.; Ashihara, T.; Hirasawa, Y. Oncology 2000, 59, 174-
180. (b) Kusuzaki, K.; Suginoshita, T.; Minami, G.; Aomori, K.; Takeshita, H.;
Murata, H.; Hashiguchi, S.; Ashihara, T.; Hirasawa, Y. Anticancer Res. 2000, 20,
3019-3024. (c) Tatsuta, M.; Iishi, H.; Yamamura, H.; Yamamoto, R.; Okuda, S.
Oncology 1988, 45, 35-40. (d) Tatsuta, M.; Yamamura, H.; Yamamoto, R.; Ichii,
M.; Noguchi, S.; Iishi, H.; Mishima, H.; Hattori, T.; Okuda, S. Eur. J. Cancer
Clin. Oncol. 1984, 20, 543-552. (e) Tomson, S. H.; Emmett, E. A.; Fox, S. H.
Cancer Res. 1974, 34, 3124-3127.
(9) (a) Malinina, L.; Soler-López, M.; Aymamí, J.; Subirana, J. A. Biochemistry
2002, 41, 9341-9348. (b) Mazerska, Z.; Dziegielewski, J.; Konopa, J. Biochem.
81
Pharmacol. 2001, 61, 685-694. (c) Giménez-Arnau, E.; Missailidis, S.; Stevens,
M. F. G. Anti-Cancer Drug Des. 1998, 13, 431-451.
(10) Bregadze, V.; Khutsishvili, I.; Chkhaberidze, J.; Sologhashvili, K. Inorg. Chim.
Acta 2002, 339, 145-159.
(11) Kurz, T.; Leake, A.; von Zglinicki, T.; Brunk, U. T. Ann. N.Y. Acad. Sci. 2004,
1019, 285-288.
(12) Lorente, A.; Espinosa, J. F.; Fernández-Saiz, M.; Lehn, J.-M.; Wilson, W. D.;
Zhong, Y. Y. Tetrahedron Lett. 1996, 37, 4417-4420.
(13) Optimal levels of DNA photocleavage were produced at a metal-to-ligand ratio of
1:2 for Hg(II), Cd(II), Zn(II), and Pb(II), and at a metal-to-ligand ratio of 2:1 for
Fe(III) and V(V) (38 µM bp pUC19 plasmid DNA, 50 µM 7). To facilitate
comparison of the 16 metals, the experiments described in this paper were
conducted using the 1:2 metal-to-ligand ratio.
(14) (a) Kubota, Y.; Steiner, R. F. Biophys. Chem. 1977, 6, 279-289. (b) Schreiber, J.
P.; Daune, M. P. J. Mol. Biol. 1974, 83, 487-501.
(15) (a) van de Vorst, A.; Lion, Y. Z. Naturforsch. 1976, 31, 203-204. (b) van de
Vorst, A.; Lion, Y.; Saucin, M. Biochim. Biophys. Acta 1976, 430, 467-477.
(16) (a) Prusik, T.; Kolubayev, T.; Morelli, M. J.; Brenner, H. C. Photochem.
Photobiol. 1980, 31, 315-321. (b) Kemlo, J. A.; Shepherd, T. M. Chem. Phys.
Lett. 1977, 47, 158-62. (c) Varnes, A. W.; Dodson, R. B.; Wehry, E. L. J. Am.
Chem. Soc. 1972, 94, 946-950. (d) Lower, S. K.; El-Sayed, M. A. Chem. Rev.
1966, 66, 199-241. (e) McClure, D. S. J. Chem. Phys. 1952, 20, 682-686.
82
(17) Bregadze, V. G.; Chkhaberidze, J. G.; Khutsishvili, I. G. Met. Ions Biol. Syst.
1996, 33, 253-267.
(18) (a) Kellmann, A. Photochem. Photobiol. 1974, 20, 103-108. (b) Oster, G. K.;
Oster, G. J. Am. Chem. Soc. 1959 81, 5543-5545.
(19) Shinohara, N.; Nakamura, Y. Bull. Chem. Soc. Jpn. 1989, 62, 734-737.
(20) (a) Bandwar, R. P.; Rao, C. P. J. Inorg. Biochem. 1997, 68, 1-6. (b) Sakurai, H.;
Tamura, H.; Okatani, K. Biochem. Biophys. Res. Commun. 1995, 206, 133-137.
(c) Stohs, S. J.; Bagchi, D. Free Radical Biol. Med. 1995, 18, 321-336. (d) Shi,
X.; Dalal, N. S. Arch. Biochem. Biophys. 1993, 307, 336-341. (e) Tullius, T. D.;
Dombroski, B. A. Proc. Natl. Acad. Sci. U.S.A. 1986, 83, 5469-5473. (f)
Halliwell, B; Gutteridge, J. M. C. Biochem. J. 1984, 219, 1-14. (g) Fenton, H. J. H
J. Chem. Soc. Trans. 1894, 65, 899-905.
(21) Bhat, R.; Hadi, S. M. Mutagenesis 1992, 7, 119-124.
(22) (a) Rao, G. N.; Prakash, R. Curr. Sci. 1974, 43, 279. (b) Vinkovetskaya, S. Y.
Nauchno. Tr. Nauchno.-Issled. Proekt. Inst. Redkometall. Prom. 1973, 42, 202-
204.
(23) Rehm, D.; Weller, A. Ber. Bunsenges. Phys. Chem. 1969, 73, 834-839.
(24) Kittler, L.; Loeber, G.; Gollmick, F. A.; Berg, H. Bioelectrochem. Bioenerg.
1980, 7, 503-511.
(25) Chambers, R. W.; Kearns, D. R. Photochem. Photobiol. 1969, 10, 215-219.
(26) Isreal, Y.; Meites, L. In Standard Potentials in Aqueous Solution; Bard, A.J.;
Parsons, R.; Jordan, J., Eds., Marcel Dekker, Inc.: New York, 1985; pp 507-525.
(27) Sawada, Y.; Iyanagi,T.; Yamazaki, I. Biochemistry 1975, 14, 3761-3764.

83
(28) Pierre, J. L.; Fontecave, M.; Crichton, R. R. BioMetals 2002, 15, 341-346.
(29) Martin J. P.; Logsdon, N. Photochem. Photobiol. 1987, 46, 45-53.
(30) (a) Persson, H. L.; Yu, Z.; Tirosh, O.; Eaton, J. W.; Brunk, U. T. Free Radical
Biol. Med. 2003, 34, 1295-1305. (b) Yu, Z.; Persson, H. L.; Eaton, J. W.; Brunk,
U. T. Free Radical Biol. Med. 2003, 34, 1243-1252. (c) Antunes, F.; Cadenas, E.;
Brunk, U. T. Biochem. J. 2001, 356, 549-555. (d) Petrat, F.; De Groot, H.; Rauen,
U. Biochem. J. 2001, 356, 61-69.
(31) (a) Kusuzaki, K.; Minami, G.; Takeshita, H.; Murata, H.; Hashiguchi, S.; Nozaki,
T.; Ashihara, T.; Hirasawa, Y. Jpn. J. Cancer Res. 2000, 91, 439-445. (b) Brunk,
U. T.; Dalen, H.; Roberg, K.; Hellquist, H. B. Free Radical Biol. Med. 1997, 23,
616-626.
(32) Hellquist, H. B.; Svensson, I.; Brunk, U. T. Redox Rep. 1997, 3, 65-70.
(33) (a) Zdolsek, J. M.; Olsson, G. M.; Brunk, U. T. Photochem. Photobiol. 1990, 51,
67-76. (b) Williams, D. S.; Slater, T. F. Biochem. Soc. Trans. 1973, 1, 200-202.
(34) Minami, G. Kyoto-furitsu Ika Daigaku Zasshi 1999, 108, 587-602.
(35) Totter, J. R.; Darby, W. J. Org. Synth. Coll. Vol. III, 1955, 460-462.
(36) Turner, R. A.; Huebner, C. F; Scholz, C. R. J. Am. Chem. Soc. 1949, 71, 2801-
2803.
(37) Sambrook, J.; Fritsch, E. F.; Maniatis, T. In Molecular Cloning A Laboratory
Manual, 2nd ed.; Cold Spring Harbor Press: New York, 1989.
(38) Melhuish, W. H. J. Opt. Soc. Am. 1964, 54, 183-186.

84
(39) (a) Fery-Forgues, S.; Lavabre, D. J. Chem. Ed. 1999, 76, 1260-1264. (b) Demas,
J. N.; Crosby, G. A. J. Phys. Chem. 1971, 75, 991-1024. (c) Parker, C. A.; Rees,
W. T. Analyst 1960, 85, 587-600.
Figure 2.7. Synopsis Graphic. The synthesis and DNA photocleaving properties of a 3,6-acridinediamine chromophore centrally attached to four metal coordinating imidazoles are reported. Nicking assays of pUC19 plasmid DNA reacted with this acridine-imidazole conjugate reveal that the presence of either Hg(II), Fe(III), Cd(II), Zn(II), V(V), or Pb(II) serves to markedly enhance DNA cleavage produced by irradiation with low intensity, visible light. Moreover, photocleavage efficiency can be regulated by modifying buffer type and pH.

85
Supporting Information
Figure 2.S1. The 3,6-acridinediamines 7, 10, acridine orange, and proflavin.
proflavin
NN N
CH3
CH3
CH3
H3C
acridine orange
NN
H
N
HNN
N
HNN
H
N
NHN
N
NHNN
H
HN
H
N
NHN
N
NH
NN N
H
H
H
H
7 10

86
CHAPTER III
Copper-Activated DNA Photocleavage by a Pyridine-Linked
Bis-Acridine Intercalator
(This chapter is verbatim as it will appear in Fernández, M.-J.; Wilson, B.; Palacios, M.; Rodrigo, M.-M.; Grant, K. B.; Lorente, A. Bioconjugate Chemistry. The synthesis of compound 4 was conducted by Ms. Palacios and Dr. Fernández. Additionally, competition dialysis experiments and electrospray spectrometry were conducted by Dr. Fernández. The original manuscript was written by Drs. Fernández, Lorente, and Grant. The contributions to the project by the author of this dissertation were as follows: thermal denaturation and DNA photocleavage experiments, viscometric titrations, colorimetric assays and minor revisions to the manuscript. The final manuscript was extensively revised by Dr. Grant.)
Abstract
We report the synthesis of new photonuclease 4 consisting of two acridine rings
joined by a pyridine-based copper binding linker. We have shown that photocleavage of
plasmid DNA is markedly enhanced when this ligand is irradiated in the presence of
copper(II) (419 nm, 22 °C, pH 7.0). Viscometric data indicate that 4 binds to DNA by
monofunctional intercalation, and equilibrium dialysis provides an estimated binding
constant of 1.13 x 10⁵ M-1 for its association with calf thymus DNA. In competition
dialysis experiments, 4 exhibits preferential binding to GC-rich DNA sequences. When
Cu(II) is added at a ligand to metal ratio of 1:1, electrospray ionization mass
spectrometry demonstrates that compound 4 undergoes complex formation, while thermal
melting studies show a 10 °C increase in the Tm of calf thymus DNA. Groove binding and
intercalation are suggested by viscometric data. Finally, colorimetric and scavenger
experiments indicate that the generation of Cu(I), H2O2, and superoxide contributes to the
production of DNA frank strand breaks by the Cu(II) complex of 4. Whereas the strand
breaks are distributed in a relatively uniform fashion over the four DNA bases,

87
subsequent piperidine treatment of the photolysis reactions shows that alkaline labile
lesions occur predominantly at guanine.
Introduction
The design and synthesis of small molecules that bind to and cleave nucleic acids
are still major challenges. These artificial nucleases have important applications as tools
in molecular biology and as potential therapeutic agents for the treatment of cancer and
viral diseases. DNA cleavage is often associated with redox active or photoactivated
transition metal complexes (1-3). To date, a number of metal complexes capable of
inducing double-stranded DNA lesions have been developed (4-7).
Photosensitization of intercalating units can promote DNA damage by three main
mechanisms: a) electron transfer from DNA nucleobases, specially guanine, to a
photochemically excited state of the intercalator, b) photogeneration of hydroxyl radicals,
an intermediate reactive species which can abstract hydrogen atoms from the DNA sugar
backbone, and c) preferential oxidation of guanines by singlet molecular oxygen
generated through energy transfer from an electronically excited photosensitizer (8-11).
In some cases, photoreduction of metal complexes is an important step in DNA cleavage
reactions (12-16).
Photochemical DNA-cleaving molecules can be used as photonucleases, as photo-
footprinting agents, and as drugs in photodynamic therapy. Copper exists at micromolar
levels in serum and other biological fluids (17), and is closely associated with nucleic
acids and chromosomes (18-20), where it is thought to play a role in regulating gene
expression (21, 22). Taking this into account, photonucleases which bind to copper may
be of greater utility at the cellular level in comparison to photonucleases containing other

88
transition metals or to chemical nucleases which require an external reducing agent.
Accordingly, a number of references on copper binding complexes with photolytic
activity have appeared in the literature (14-15, 23-35). While in vivo levels of free copper
are tightly controlled by proteins (36-38), the kinetically labile nature of this metal allows
ion exchange between small ligands and proteins to take place (38, 39).
Herein we present the synthesis, characterization, and DNA photocleaving
properties of a pyridine-linked bis-acridine intercalator (4). We have found that 4 is a
good DNA photocleaver, but that cleavage efficiency is markedly enhanced in the
presence of Cu(II), converting pUC19 plasmid DNA into its nicked and linear forms
upon exposure to visible light (419 nm, pH 7.0, 22 °C). Use of the colorimetric reagent
bathocuproinedisulfonic acid disodium salt hydrate (BCS) indicates that the DNA
photocleavage reaction involves acridine sensitized photoreduction of Cu(II) to Cu(I).
Materials and Methods
General Procedures. Merck silica gel 60 (230-400 ASTM mesh) was employed
for flash column chromatography. TLC was performed on precoated aluminum silica gel
plates (Merck or Macherey-Nagel 60F254 0.25 mm). Melting points were determined in
an Electrothermal digital IA9100 apparatus. Infrared spectra were taken on an FT-IR
Perkin-Elmer 1725X spectrophotometer. All 1H and 13C NMR spectra were recorded at
300 and 75 MHz, respectively, on a Varian Mercury-VX-300 spectrometer. Chemical
shifts are reported in ppm using the residual peaks of either chloroform (δ 7.26 and 77.0
ppm) or methanol (δ 3.30 and 49.0 ppm) as an internal reference. Carbon and proton
assignments were based on HSQC and HMBC experiments. CI mass spectra were
generated on a Hewlett-Packard HP-5988a spectrometer at 70 eV. An Automass Multi

89
GC/API/MS Finnigan spectrometer was used for ESI mass spectra. Elemental analyses
were performed with a Heraeus CHN analyzer. A Cary Bio100 UV-visible
spectrophotometer (Varian) was used to plot thermal melting curves, while all other UV-
visible spectra were recorded with a Shimadzu UV-1601 or a Lambda 18 Perkin-Elmer
spectrophotometer. DNA photolysis reactions were run in an aerobically ventilated
Rayonet Photochemical Reactor fitted with eight RPR–4190 Å lamps (The Southern New
England Ultraviolet Company).
Reagents were of the highest available purity and were used without further
purification. L-ascorbic acid, catalase, copper(II) chloride dihydrate, sodium phosphate
monobasic and dibasic salts, and superoxide dismutase were purchased from Sigma.
Glycogen and G-50 Sephadex columns were from Roche Applied Science. Sequenase™
Version 2.0, Sequenase™ Stop Solution, and [35S]dATPaS were supplied by Amersham
Biosciences. EcoRI and FspI restriction endonucleases were from New England Biolabs.
All other chemicals including bathocuproinedisulfonic acid disodium salt hydrate,
dimethyl sulfoxide, ethanol, ethidium bromide, D-mannitol, piperidine, and sodium azide
were obtained from the Aldrich Chemical Company. Both 2,6-bis[(2-
hydroxyethyl)methylaminomethyl]pyridine (1) (40) and (6-amino-3-acridinyl)carbamic
acid methyl ester (3) (41) were prepared according to reported procedures.
Transformation of E. coli competent cells (Stratagene, XL-1 blue) with pUC19
plasmid DNA (Sigma) and growth of bacterial cultures were performed according to
established methods (42). Purification of the plasmid DNA was accomplished using a
Qiagen Plasmid Mega Kit. All enzymes were used according to manufacturer's
instructions in the buffers supplied.

90
2,6-Bis[(2-chloroethyl)methylaminomethyl]pyridine (2). Thionyl chloride (10
mL) was added to 348 mg (1.32 mmol) of 2,6-bis[(2
hydroxyethyl)methylaminomethyl]pyridine (1). The reaction mixture was stirred at room
temperature for 24 h and then was concentrated at reduced pressure affording a syrup
characterized as 2 • 3HCl. IR (film): υ 3393, 2968, 2666, 1598, 1463, 1407, 1217, 1160,
756 cm-1. 1H-NMR (CD3OD): δ 8.04 (t, J = 7.7 Hz, H4), 7.56 (d, J = 7.7 Hz, 2H, H3, H5),
4.62 and 4.80 (AB, 4H, J = 14 Hz, CH2-pyr), 4.12 (t, J = 6.4 Hz, 4H, CH2Cl), 3.69 (m,
4H, CH2N), 3.01 (s, 6H, CH3). 13C-NMR (CD3OD): δ 151.44 (C2, C6), 140.92 (C4),
125.41 (C3, C5), 60.54 (CH2-pyr), 58.33 (CH2N), 42.21 (CH3), 38.04 (CH2Cl). To a
solution of 1.23 g (3.08 mmol) of 2 • 3HCl in methanol (20 mL), 1.14 g (10.78 mmol) of
Na2CO3 were added. The mixture was stirred for 3 h and then concentrated to dryness.
The residue was treated with dichloromethane (25 mL) and the mixture was washed three
times with water (10 mL). The organic layer was dried over MgSO4, filtered and
concentrated at reduced pressure to yield 2 as a brown oil (580 mg, 65%). IR (film): υ
2950, 2795, 1591, 1577, 1455, 1353, 1305, 1262, 1118, 1062, 739 cm-1. 1H-NMR
(CDCl3): δ 7.65 (t, J = 7.7 Hz, 1H, H4), 7.35 (d, J = 7.7 Hz, 2H, H3, H5), 3.73 (s, 4H,
CH2-pyr), 3.59 (t, J = 6.9 Hz, 4H, CH2Cl), 2.81 (t, J = 6.9 Hz, 4H, CH2N), 2.35 (s, 6H,
CH3). 13C-NMR (CDCl3): δ 158.23 (C2, C6), 136.93 (C4), 121.31 (C3, C5), 63.59 (CH2-
pyr), 58.69 (CH2N), 42.59 (CH3), 41.56 (CH2Cl). MS (CI) m/z 290 ([M+H] +, 39%), 254
(100) (calcd C13H21Cl2N3 289.1). Anal. Calcd for C13H21Cl2N3: C, 53.80; H, 7.29; N,
14.48, Cl 24.43. Found: C, 53.94; H, 7.09; N, 14.77.
2,6-Bis{[((6-amino-acridin-3-yl)methoxycarbonylamino)-
ethyl]methylaminomethyl} pyridine (4). To a solution of (6-amino-3-

91
acridinyl)carbamic acid methyl ester (3) (184 mg, 0.69 mmol) in dry DMF (5 mL), 80%
NaH (41 mg, 1.38 mmol) was added. The reaction mixture was stirred under an argon
atmosphere for 20 min and then a solution of 2,6-bis[(2-
chloroethyl)methylaminomethyl]pyridine (2) (100 mg, 0.345 mmol) in dry DMF (6 mL)
was added. The reaction mixture was heated at 50 °C for 20 h and then concentrated at
reduced pressure. The crude product thus obtained was purified by flash column
chromatography on silica gel using ethyl acetate/acetone/triethylamine (5:3:1), affording
unreacted carbamate 3. Continued elution with ethyl acetate/methanol/triethylamine
(10:2:1) afforded the desired product as an oil. The product was then dissolved in
chloroform and precipitated with diethyl ether affording 81 mg (31%) of an orange solid.
Mp: 128-130 °C. IR (KBr): υ 3414, 1702, 1638, 1612, 1459, 1383, 1158 cm-1. 1H-NMR
(CDCl3): δ 8.49 (s, 2H, H9), 7.85 (d, J = 2.2 Hz, 2H, H4), 7.80 (d, J = 9.0 Hz, 2H, H1),
7.77 (d, J = 9.0 Hz, 2H, H8), 7.35 (t, J = 7.7 Hz, 1H, H4 pyr), 7.30 (dd, J = 9.0, 2.2 Hz,
2H, H2), 7.19 (d, J = 2.2 Hz, 2H, H5), 7.09 (d, J = 7.7 Hz, 2H, H3, H5 pyr), 7.00 (dd, J =
9.0, 2.2 Hz, 2H, H7), 3.95 (t, J = 6.9 Hz, 4H, CH2N-acridine), 3.68 (s, 6H, OCH3), 3.55
(s, 4H, CH2-pyr), 2.63 (t, J = 6.9 Hz, 4H, CH2NMe), 2.17 (s, 6H, NCH3). 13C-NMR
(CDCl3): δ 158.40 (C2, C6 pyr), 155.86 (CO), 151.16 (C10a), 149.51 (C4a), 148.65 (C6),
143.57 (C3), 136.57 (C4 pyr), 135.42 (C9), 129.72 (C8), 128.57 (C1), 124.63 (C2),
124.06 (C4), 123.20 (C9a), 121.94 (C8a), 120.82 (C3, C5 pyr), 120.15 (C7), 106.00 (C5),
63.77 (CH2-pyr), 55.46 (CH2NMe), 52.96 (OCH3), 48.31 (CH2N-acridine), 42.52 (NCH3).
MS (ESI) m/z 752 [M+H] + (calcd for C43H45N9O4 751.36). Anal. Calcd for C43H45N9O4:
C, 68.69; H, 6.03; N, 16.77. Found: C, 68.81; H, 6.13; N, 16.49. A stock solution of 4
was prepared in dimethyl sulfoxide (purity ≥ 99.9%) and was stored at –20 °C until use.
92
Viscometric Titrations. UltraPure™ Calf Thymus DNA (Invitrogen Catalog
Number 15633-019, average size ≤ 2000 bp, 10 mg/mL in ddH2O) was used without
further purification. Viscosity experiments were conducted in a Cannon-Ubbelohde size
75 capillary viscometer immersed in a thermostated, circulating water bath maintained at
25 ± 0.2 ºC. Compound 4 was titrated in a Buffer A: 6 mM Na2HPO4, 2 mM NaH2PO4, 1
mM Na2EDTA, and 15 mM NaCl (pH 7.0). Alternatively, Cu(II) and Cu(II):4 (ligand to
metal ratio of 1:1) were titrated in Buffer B: 20 mM sodium phosphate (pH 7.0). In three
separate titrations, a total of five 10 µL aliquots of each of the following three stock
solutions were sequentially added to 1000 µL of the appropriate buffer in the viscometer
containing 200 µM bp calf thymus (CT) DNA: (i) 4 (400 µM in Buffer A); (ii) Cu(II):4
(400 µM each, in Buffer B), and Cu(II) (400 µM in Buffer B). After each sequential
addition, the resulting solution was allowed to equilibrate for 15 min before the flow time
was recorded with a stopwatch. (The final concentrations of 4, Cu(II):4, and Cu(II)
ranged from 4 to 20 µM in each of the three titrations.) The flow times of the buffer and
then of the DNA in buffer were also recorded. All measurements were averaged over four
trials to an accuracy of + 0.2 s. After subtracting the averaged flow time of the buffer,
DNA (η0) and dye-DNA (η) averaged flow times were plotted as (η/ηo)1/3 versus the
molar ratio r of dye to DNA bp (43). Slopes were generated by conducting linear least
square fits to these data (KaleidaGraph version 3.6.4 software).
Competition Dialysis Assay. Calf thymus (CT), Clostridium perfringens (CP),
and Micrococcus lysodeikticus (ML) DNAs and the synthetic polynucleotides poly(dA)-
poly(dT), [poly(dGdC)]2 and [poly(dAdT)]2 were purchased from Sigma and were used
without further purification. A buffer containing 6 mM Na2HPO4, 2 mM NaH2PO4, 1 mM
93
Na2EDTA, and 185 mM NaCl (pH 7.0) was utilized in the preparation of all nucleic acid
stock solutions. The concentrations of the nucleic acid solutions were determined by UV-
visible spectrophotometry using the λmax values and extinction coefficients listed in Table
3.S1 (Supporting Information). In a buffer consisting of 6 mM Na2HPO4, 2 mM
NaH2PO4, 1 mM Na2EDTA, and 15 mM NaCl (pH 7.0), competition dialysis experiments
were performed as described by Chaires (44, 45). For each dialysis assay, a 0.5 mL
volume of DNA (75 µM bp DNA in buffer; Table 3.S1) was pipetted into one of 6
individual Spectra/Por DispoDialyzer units (S135062, Spectrum Laboratories, Inc.). The
6 dialysis units were then placed in a beaker containing 225 mL of a 1.5 µM solution of 4
in buffer. The beaker was covered with Parafilm and wrapped in foil, and its contents
were allowed to equilibrate with continuous stirring for 24 h at room temperature (20-22
ºC). At the end of the equilibration period, the DNA solutions inside the dialysis units
were carefully transferred to microcentrifuge tubes and a 10.0% (w/v) stock solution of
sodium dodecyl sulfate (SDS) was added to give a final concentration of 1.0% (w/v). The
DNA-SDS solutions were allowed to equilibrate for 2 h, after which the total
concentration of ligand 4 (Ct) was determined by UV-visible absorbance measurements
using the extinction coefficient for free ligand 4 in the presence of 1.0% SDS (ε451 =
22,716 M-1 cm-1). An appropriate correction for the slight dilution of the sample resulting
from the addition of SDS stock solution was made. The concentration of free ligand 4
(Cf; ε451= 12,500 M-1 cm-1) was also determined spectrophotometrically using an aliquot
of the dialysate solution. The amount of DNA-bound 4 (Cb) was calculated by difference
(Cb = Ct - Cf).

94
Thermal Melting Studies. Individual 3 mL solutions containing 15 µM bp of
calf thymus DNA (Invitrogen Cat. #15633-019) in 20 mM sodium phosphate buffer pH
7.0 or in 20 mM sodium phosphate buffer pH 7.0, 10 µM 4 and/or 10 µM CuCl2 were
placed in 3 mL (1 cm) quartz cuvettes (Starna). The DNA was then denatured by
increasing the temperature from 25 °C to 100 °C at a rate of 0.5 °C min-1 while
absorbance was monitored at 260 nm. KaleidaGraph™ Version 3.5 software was used to
approximate the first derivative of ΔA260/ΔT vs temperature, where the Tm value for each
melting transition was marked by the maximum of the first derivative plot.
Photocleavage of Supercoiled Plasmid DNA. Concentration profile reactions
were conducted in a volume of 20 µL as follows. A total of 38 µM bp of pUC19 plasmid
DNA in 20 mM sodium phosphate buffer pH 7.0 or in 20 mM sodium phosphate buffer
pH 7.0, 50 µM, 30 µM, 20 µM, 10 µM, 5 µM, or 2 mM of CuCl2 and/or one mol equiv
(50 µM, 30 µM, 20 µM, 10 µM, 5 µM, or 2 µM) of 4 was irradiated for 50 min at 419
nm and 22 °C. A parallel control reaction consisting of 20 mM sodium phosphate buffer
pH 7.0, 38 µM bp of pUC19, 50 µM of CuCl2, and 50 µM of 4 was kept in the dark for 50
min.
Individual time course reactions were conducted in a volume of 20 µL. A total of
38 µM bp of pUC19 plasmid DNA in 20 mM sodium phosphate buffer pH 7.0 or in 20
mM sodium phosphate buffer pH 7.0, 50 µM CuCl2 and/or 50 µM 4 was irradiated at 419
nm and 22 °C. The 20 µL reactions were removed from the Rayonet Photochemical
Reactor at 10, 20, 30, 40 or 50 min time intervals. Parallel controls consisting of 20 mM
sodium phosphate buffer pH 7.0, 38 µM bp of pUC19 plasmid, 50 µM of CuCl2, and/or
50 µM of 4 were kept in the dark for 50 min. After the addition of 3 µL of electrophoresis
95
loading buffer to the photocleavage reactions (15.0% (w/v) Ficoll, 0.025% (w/v)
bromophenol blue), cleavage products were separated on a 1.0% non-denaturing agarose
gel stained with ethidium bromide (0.5 µg/mL). To determine the percent conversion of
supercoiled plasmid DNA to nicked and linear forms, the gel was visualized on a
transilluminator set at 302 nm, photographed, and then quantitated using ImageQuant v.
5.2 software (Amersham Biosciences).
Colorimetric Detection of Copper(I). A series of 500 µL reactions was prepared
in which each contained 20 mM sodium phosphate buffer pH 7.0 and one or more of the
following reagents: 50 µM of 4, 50 µM of CuCl2, and 38 µM bp of pUC19 plasmid DNA.
The samples were irradiated at 419 nm in the absence and presence of 100 µM of
bathocuproinedisulfonic acid disodium salt hydrate, while a parallel set of reactions was
kept in the dark. After 50 min, the solutions were visually examined for color change,
placed in 500 µL quartz cuvettes, and monitored between 200 nm and 600 nm for
evidence of Cu(I)–bathocuproine complex formation. As a positive control, 500 µL
samples containing 20 mM sodium phosphate buffer pH 7.0 and 100 µM
bathocuproinedisulfonic acid disodium salt hydrate in the presence of 50 µM CuCl2 or 50
µM CuCl2 and 50 µM L-ascorbic acid were reacted at 22 °C for 1 min, after which UV-
visible spectra were recorded.
Inhibition of DNA Photocleavage. Twenty µL reactions containing 20 mM
sodium phosphate buffer pH 7.0, 38 µM bp pUC19 plasmid DNA, 50 µM of 4, and 50
µM of CuCl2 were irradiated at 419 nm for 50 min in the presence of either 100 mM
sodium azide, 100 mM D-mannitol, 100 U superoxide dismutase, 100 U catalase, or 100
µM bathocuproinedisulfonic acid disodium salt hydrate. Reaction products were then
96
resolved on a 1.0% non-denaturing agarose gel and quantitated as described above. The
percent inhibition of DNA photocleavage was calculated based on a comparison to
parallel reactions run in the absence of scavenger or chelator.
DNA Photocleavage at Nucleotide Resolution. EcoRI linearized pUC19
plasmid was 3'-end-labeled using Sequenase™ Version 2.0 and [35S]dATPαS according
to an established laboratory protocol (46). Unincorporated nucleotides were removed
with a G-50 Sephadex spun column. The DNA was then digested with FspI to produce a
restriction fragment 138 bp in length, and resolved on a 2.0% agarose gel. The fragment
was excised and DNA was isolated using a QIAquick Gel Extraction Kit purchased from
Qiagen. The purified DNA was stored in a total volume of 400 µL of deionized, distilled
water at -78 °C.
Typical photocleavage reactions contained 15 µM bp of the 138 bp DNA
fragment in 20 mM sodium phosphate buffer pH 7.0 or in 20 mM sodium phosphate
buffer pH 7.0, 5 µM 4 and 5 µM CuCl2 (50 µL total volume). The samples were
irradiated for 2 h at 419 nm, after which DNA was precipitated with 40 µg glycogen/2.5
volumes EtOH, and washed with 70.0% EtOH. A duplicate set of reactions was
precipitated, dissolved in 100 mL of 1.0% piperidine, heated at 90 °C for 30 min, and
then lyophilized to dryness. Cleavage products without and with piperidine treatment
were dissolved in 4 µL of Sequenase™ Stop Solution (95.0% (v/v) deionized formamide,
10 mM EDTA, 0.1% (w/v) xylene cyanol and 0.1% (w/v) bromophenol blue), denatured
for 3 min at 95 °C, and resolved on a 10.0% denaturing polyacrylamide gel adjacent to G,
G+A, and T chemical sequencing reactions. To determine yields, the gel was scanned
with a FujiFilm Image Reader v. 2.01 Gel Imaging System. The resulting storage-

97
phosphor autoradiogram was quantitated using FujiFilm ImageGauge v. 3.41 software.
The DNA sequencing reactions were performed as previously described (46).
Results and Discussion
Our approach to the design of ligand 4 combines a 2,6-bis(aminomethyl)pyridine-
based copper binding moiety and two photochemically active 3,6-acridinediamine groups
as DNA recognition elements. The ligand 2,6-bis(aminomethyl)pyridine and its amino-N-
substituted analogs form stable 1:1 complexes with Cu(II) (logQCu(II) = 15.2-15.7,
equilibrium quotient Q = [ML]/[M][L]; 47, 48). Alternatively, acridine orange, proflavin,
and other 3,6-acridinediamines intercalate into DNA and, upon irradiation with visible
light, efficiently effect DNA photocleavage (16, 49-51). Therefore, the acridine rings of 4
were intended to increase DNA binding and to initiate DNA photocleavage. We also took
into account that cleavage levels might be enhanced by acridine sensitized
photoreduction of pyridine-bound copper(II).
Synthesis of Ligand 4. Compound 4 was obtained from 2,6-bis[(2-
hydroxyethyl)methylaminomethyl]pyridine (1) (40), which upon treatment with thionyl
chloride at room temperature for 24 h, followed by basification with sodium carbonate
afforded 2,6-bis[(2-chloroethyl)methylaminomethyl]pyridine (2) as a brown oil in 65%
yield. Compound 2 was reacted with (6-amino-3-acridinyl)carbamic acid methyl ester (3)
(41) in anhydrous DMF with 80% NaH as base at 50 °C for 20 h (Scheme 3.1).
Purification of the crude product afforded 4 in 31% yield.

98
Scheme 3.1. Synthesis of Ligand 4
Viscometric Analysis. In order to test for the intercalating ability of 4 and to
further examine its behaviour as a groove binder or as a mono- or bis-intercalator, DNA
viscosity measurements were conducted. In the process of intercalation, helical DNA
unwinds to accommodate planar aromatic ring systems that become inserted in between
DNA base pairs. This process is accompanied by an effective increase in contour length
that adds to the intrinsic viscosity of the DNA polymer. Because groove binding
compounds do not markedly lengthen helical DNA, there is no significant change in
viscosity (52). Consequently, viscometric titrations represent a highly reliable method for
establishing the binding modes of DNA interacting ligands (52).
The viscometry data for compound 4 and copper(II) are presented as plots of
(η/ηo)1/3 (the relative increase in DNA contour length) versus r (the molar ratio of added
compound to DNA base pairs). The contour lengths in the presence (η) and absence (ηo)
N
N
OH
N
OH
H3C
H3C
N
N
Cl
N
Cl
H3C
H3C
N NH2NH
H3CO2C
N NH2
N
N
N
N
H3C
H3C
N NH2N
H3CO2C
H3CO2C
4
3
1 2
a,b
c
a SOCl2/ RT/ 24 h
b Na2CO3/ MeOH
c 80% NaH/ DMF/ 50 °C/ 20 h
Scheme 1. Synthesis of Ligand 4
1
2
4 5
7
89
99
of these reagents were calculated by the method of Cohen and Eisenberg (43). Figure 3.1
shows that compound 4 increases the relative contour length of calf thymus DNA as a
function of increasing r and that the slope (0.82) obtained from the (η/ηo)1/3 versus r plot
falls within the range expected for monofunctional intercalators (53). It is conceivable
that the lowest energy conformation of 4 is incompatible with the neighbor exclusion
principle and therefore permits the intercalation of only one acridine ring. In contrast, the
viscometric data of copper(II) with CT DNA yield slopes of -0.12 and 0.41 in the absence
and presence of one mol equiv of 4, respectively. The observed reduction in slope from
0.82 to 0.41 may indicate that interaction of the compound’s 2,6-
bis(aminomethyl)pyridine linker with copper(II) induces a conformational change that
introduces a competing, non-intercalative DNA binding mode, most likely groove
binding. Notwithstanding, the increase in the apparent DNA contour length by the
copper(II) complex of 4 is still substantial, suggesting some degree of intercalative
binding (54).
Electrospray Ionization Mass Spectrometry. Our next goal was to obtain direct
evidence of copper(II) complex formation. Ligand 4 was reacted with CuCl2 in HPLC
grade methanol at a ligand to metal ratio of 1:1 (90 min, 22 °C), after which a positive-
ion electrospray (ESI) mass spectrum was recorded (Figure 3.S1 in Supporting
Information). Isotopic distributions of molecular ions corresponding to the following 1:1
metallic complexes were observed: (i) [4HCuCl]2+ between 425 and 428 m/z (calcd for
[C43H46N9O4CuCl]2+ 425.13); (ii) [4CuCl]1+ between 849 and 855 m/z (calcd for
[C43H45N9O4CuCl]1+ 849.26); and (iii) [4HCuCl2]1+ between 885 and 892 m/z (calcd for
[C43H46N9O4CuCl2]1+ 885.24).
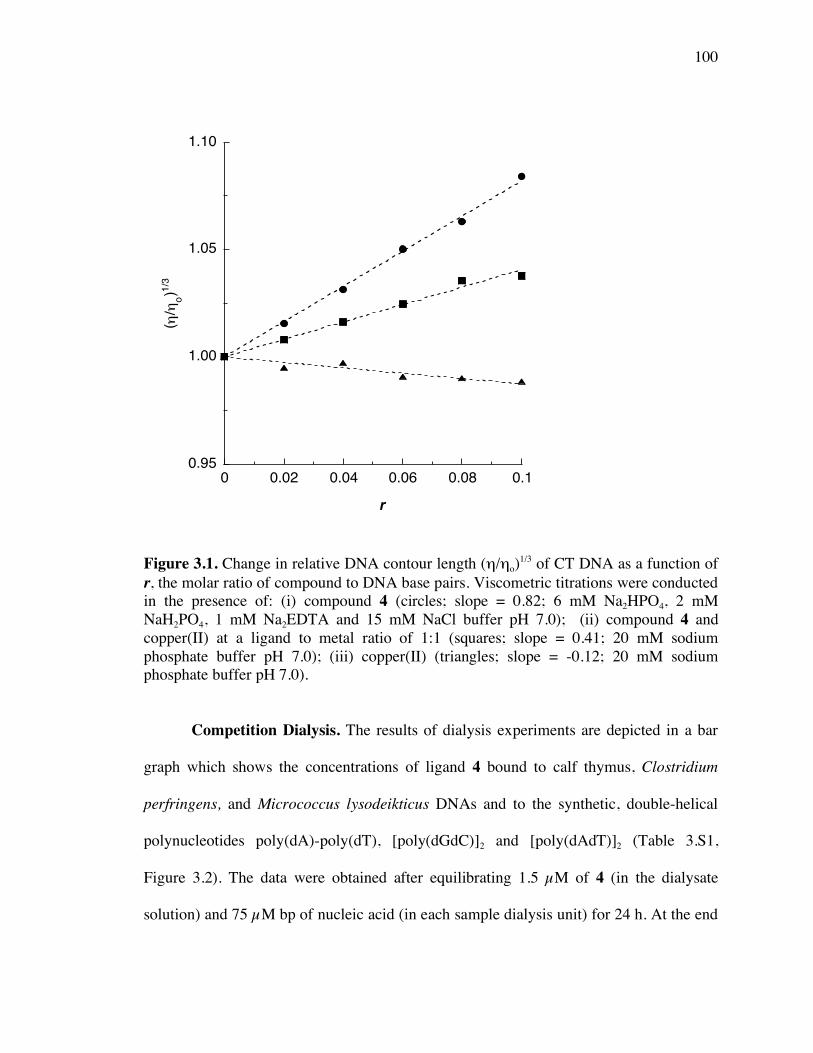
100
Figure 3.1. Change in relative DNA contour length (η/ηo)1/3 of CT DNA as a function of r, the molar ratio of compound to DNA base pairs. Viscometric titrations were conducted in the presence of: (i) compound 4 (circles; slope = 0.82; 6 mM Na2HPO4, 2 mM NaH2PO4, 1 mM Na2EDTA and 15 mM NaCl buffer pH 7.0); (ii) compound 4 and copper(II) at a ligand to metal ratio of 1:1 (squares; slope = 0.41; 20 mM sodium phosphate buffer pH 7.0); (iii) copper(II) (triangles; slope = -0.12; 20 mM sodium phosphate buffer pH 7.0).
Competition Dialysis. The results of dialysis experiments are depicted in a bar
graph which shows the concentrations of ligand 4 bound to calf thymus, Clostridium
perfringens, and Micrococcus lysodeikticus DNAs and to the synthetic, double-helical
polynucleotides poly(dA)-poly(dT), [poly(dGdC)]2 and [poly(dAdT)]2 (Table 3.S1,
Figure 3.2). The data were obtained after equilibrating 1.5 µM of 4 (in the dialysate
solution) and 75 µM bp of nucleic acid (in each sample dialysis unit) for 24 h. At the end
0.95
1.00
1.05
1.10
0 0.02 0.04 0.06 0.08 0.1
r
( !/!o)1/3
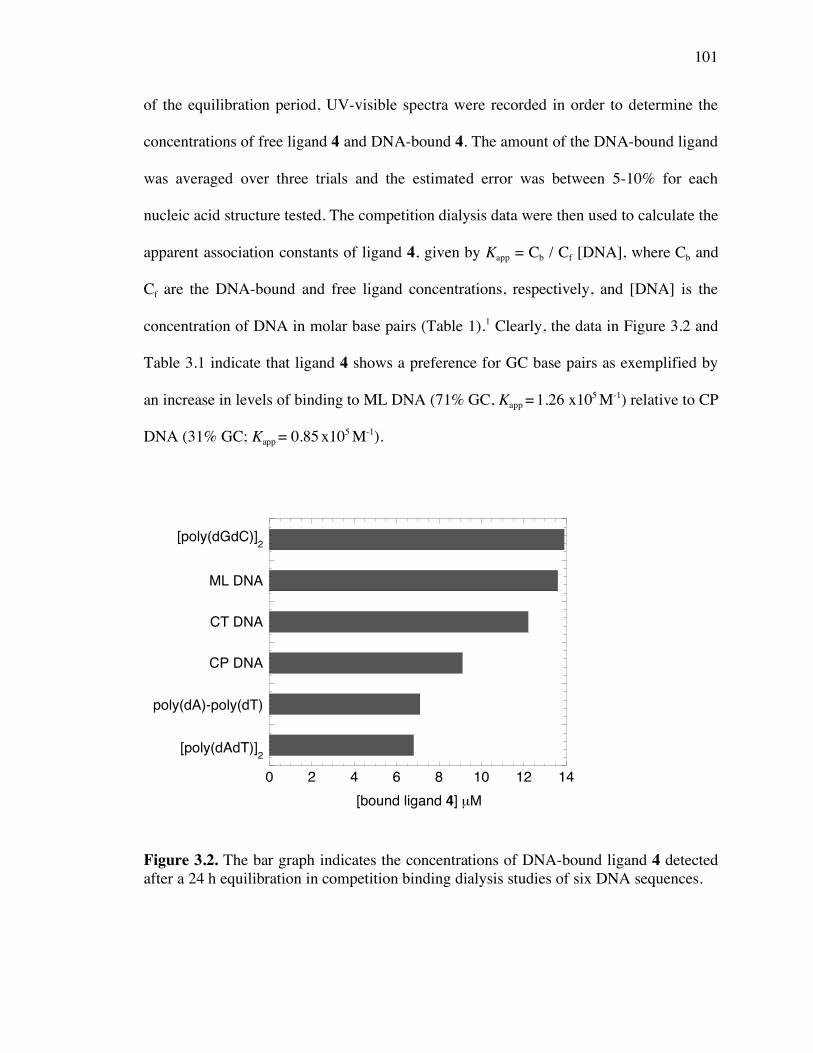
101
of the equilibration period, UV-visible spectra were recorded in order to determine the
concentrations of free ligand 4 and DNA-bound 4. The amount of the DNA-bound ligand
was averaged over three trials and the estimated error was between 5-10% for each
nucleic acid structure tested. The competition dialysis data were then used to calculate the
apparent association constants of ligand 4, given by Kapp = Cb / Cf [DNA], where Cb and
Cf are the DNA-bound and free ligand concentrations, respectively, and [DNA] is the
concentration of DNA in molar base pairs (Table 1).1 Clearly, the data in Figure 3.2 and
Table 3.1 indicate that ligand 4 shows a preference for GC base pairs as exemplified by
an increase in levels of binding to ML DNA (71% GC, Kapp = 1.26 x10⁵ M-1) relative to CP
DNA (31% GC; Kapp = 0.85 x10⁵ M-1).
Figure 3.2. The bar graph indicates the concentrations of DNA-bound ligand 4 detected after a 24 h equilibration in competition binding dialysis studies of six DNA sequences.
0 2 4 6 8 10 12 14
[bound ligand 4] µM
[poly(dGdC)]2
[poly(dAdT)]2
ML DNA
CT DNA
CP DNA
poly(dA)-poly(dT)

102
Table 3.1. Apparent Association Constants Obtained by Competition Dialysisa Deoxyribo Nucleic Acid Kapp x105 M-1 [poly(dGdC)]2 (100% GC) 1.30
ML DNA (72% GC) 1.26
CT DNA (42% GC) 1.13
CP DNA (31% GC) 0.85
poly(dA)-poly(dT) (0% GC) 0.66
[poly(dAdT)]2 (0% GC) 0.63
a The abbreviations ML DNA, CT DNA, and CP DNA correspond to Micrococcus lysodeikticus, Calf thymus, and Clostridium perfringens DNAs, respectively.
Thermal Melting Studies. The majority of DNA intercalators bind to double-
helical DNA through a combination of π-π stacking and electrostatic interactions. As a
consequence, double-helical DNA is stabilized, and the melting temperature (Tm) of the
duplex is increased as a function of the increasing binding affinity of the intercalator (55).
Melting temperature (Tm) values of 15 µM bp calf thymus DNA in 20 mM sodium
phosphate buffer pH 7.0 were derived from thermal melting curves recorded at 260 nm
(Figure 3.3). While 10 µM of Cu(II) had no effect in the absence of the ligand, 10 µM of
4 increased the Tm of calf thymus DNA by 4 °C and 10 °C in the absence and presence of
10 µM concentrations of Cu(II), respectively. Taken together, these data indicate that 4
binds to double-helical DNA, thereby increasing its stability. Duplex stability is then
further enhanced by the interaction of 4 with copper(II). In light of the above viscometric
data, this result would appear to suggest that groove binding and intercalation of 4 in the
presence of Cu(II) might stabilize duplex DNA to a greater degree than simple
monointercalation. It is conceivable that complex formation with positively copper might

103
enhance electrostatic interactions between 4 and the negatively charged phosphate
backbone of the DNA duplex. Notwithstanding, the increase in Tm observed when Cu(II)
is added to 4 indicates that the apparent DNA association constant Kapp of the Cu(II)
complex of 4 is higher than the Kapp of the free ligand 4.1 The small increases in low
temperature absorbance produced by compound 4 and its Cu(II) complex probably arise
from thermally induced changes in the ratio of DNA-bound ligand to free ligand (Figure
3.3; 56).
Figure 3.3. Thermal melting curves and Tm values of 15 µM bp calf thymus DNA in the absence and presence of 10 µM 4 and/or 10 µM CuCl2 (20 mM sodium phosphate buffer pH 7.0).
Photocleavage of Supercoiled Plasmid DNA. To detect the formation of DNA
frank strand breaks,2 a preliminary concentration profile was conducted in which
individual samples containing 38 µM bp of pUC19 plasmid DNA in 20 mM sodium
0
0 . 2
0 . 4
0 . 6
0 . 8
1
3 0 4 0 5 0 6 0 7 0 8 0 9 0 1 0 0
-DNA, Tm = 75
oC
-DNA + Cu(II), Tm = 75
oC
-DNA + 4, Tm = 79
oC
-DNA + 4 + Cu(II), Tm = 85
oC
No
rmalized
Ab
so
rban
ce (
260 n
m)
Temperature (oC)

104
phosphate buffer pH 7.0 were equilibrated with 50 µM to 2 µM of 4 in the absence and
presence of one mol equiv of CuCl2. The samples were irradiated for 50 min at 419 nm
and 22 °C in an aerobically ventilated Rayonet Photochemical Reactor, after which DNA
photocleavage products were resolved on a 1.0% non-denaturing agarose gel. The results
of the profile showed that one mol equiv of Cu(II) enhanced DNA photocleavage
produced by 50 to 20 µM concentrations of compound 4 in a concentration-dependent
fashion, with maximum levels of photocleavage occurring in the 50 µM reaction (Figure
3.S2 in Supporting Information).
DNA photocleavage as a function of time was studied next. Reactions consisting
of 20 mM sodium phosphate buffer pH 7.0 with 38 µM bp pUC19 plasmid DNA, 50 µM
of compound 4, and 50 µM of CuCl2 were irradiated as described above, except that the
reactions were removed at 10 to 50 min time points prior to agarose gel electrophoresis.
While 50 µM of intercalator 4 clearly demonstrated time-dependent DNA photocleavage
(Figure 3.4, Lanes 1 to 5), reaction yields were markedly enhanced at all time points upon
the addition of equivalent concentrations of CuCl2 (Figure 3.4, Lanes 6 to 10). (Virtually
no cleavage was observed in parallel control reactions run in the dark; Figure 3.4, Lanes
C3 and C4.) Notably, after 50 min of irradiation, supercoiled plasmid was converted into
28% nicked DNA in the presence of Cu(II)/buffer, 55% nicked in 4/buffer, and 75%
nicked plus 18% linear when 4/Cu(II)/buffer were present in combination (Figure 3.4,
Lanes C2, 5, and 10, respectively). Taking into consideration that 15% of photonicked
DNA was produced in buffer alone, it is evident that ligand 4 and Cu(II) interact in a
synergistic rather than additive fashion. Because photoreduction of Fe(III) is readily
effected with visible light by means of electron transfer from the photochemically excited

105
triplet states of acridine orange and other 3,6-diaminoacridines (57, 58), we hypothesized
that a potential source of synergism might involve acridine sensitized photoreduction of
pyridine-bound Cu(II). Subsequent reaction of Cu(I) with O2 would be expected to
generate DNA cleaving, reactive oxygen species (59-61).
Figure 3.4. A photograph of a 1.0% non-denaturing agarose gel showing photocleavage of pUC19 plasmid DNA in the presence of 50 µM of 4 without and with 50 µM of CuCl2 (22 °C, pH 7.0). C1 and C2 correspond to DNA irradiated at 419 nm, without and with CuCl2, respectively (no 4). C3 and C4 correspond to DNA treated for 50 min with 4, without and with CuCl2, respectively (no hν). Lanes 1-10 correspond to DNA irradiated at 419 nm for 10, 20, 30, 40, and 50 min in the presence of 4, without and with CuCl2. The above yields corresponding to C1, C2, Lane 5, and Lane 10 were averaged over three trials with standard deviations of ± 3%, ± 5%, ± 3%, and ± 2%, respectively. S, L, and N designate supercoiled, linear, and nicked forms of pUC19 plasmid DNA.
Colorimetric Detection of Copper(I). Our next goal was to obtain experimental
evidence that would substantiate photoreduction of Cu(II) by ligand 4. We utilized a
colorimetric assay based on bathocuproinedisulfonic acid disodium salt hydrate (BCS),
50 50 10 20 30 40 50 10 20 30 40 50 0 0Irr. (min)
15 28 21 26 46 55 61 70 78 7537 65 11 12% N
0 0 0 0 0 0 0 9 12 180 3 0 0% L
85 72 79 74 54 45 39 21 10 863 32 89 88% S
4 - - + + + + + + + + ++ + +
CuCl2 - + - - - - - + + + ++ - +
C1 C2 1 2 3 4 5 6 7 8 9 10 C4C3
N
L
S
Lane:

106
which forms a 2:1 stable, brightly colored orange complex with Cu(I) (λmax = 480 nm; ε =
13,500 M-1 cm-1; 62). Photolysis reactions in 20 mM sodium phosphate buffer pH 7.0
were irradiated at 419 nm and 22 °C for 50 min in the presence of one or more of the
following reagents: 50 µM 4, 50 µM CuCl2, 38 µM bp pUC19 plasmid DNA, 100 µM
BCS, after which UV-visible spectra were immediately recorded (Figure 3.5). Parallel
reactions run in the dark were used as negative controls (Figure 3.5 B, D). As a control
for BCS-Cu(I) complex formation, 100 µM BCS was reacted with 50 µM CuCl2 in the
absence and presence of 50 µM of the reducing agent L-ascorbic acid (Figure 3.5 F).
As expected, the addition of BCS to Cu(II) produced a bright orange color and
signature 480 nm absorption in the L-ascorbic acid control reaction (Figure 3.5 F), but
not in any of the dark DNA reactions (even those containing 4 and/or Cu(II); Figure 3.5
B, D), and not in any reactions in which BCS was omitted (Figure 3.5 A, B). However,
the DNA reaction irradiated in the presence of ligand 4, Cu(II), and BCS produced a
significant orange color change. In addition, a strong hyperchromic absorption band
indicative of the formation of a BCS-Cu(I) complex was observed at 472 nm (Figure 3.5
C: DNA + 4 + Cu(II) + BCS). (Spectral overlap with 4 and/or one of its photoproducts
most likely accounts for the 8 nm blue shift relative to 480 nm: Figure 3.5 C compared to
Figure 3.5 E, F.) Importantly, there was no evidence of BCS-Cu(I) complex formation
when 4 was omitted from the photocleavage reaction (Figure 3.5C: DNA + Cu(II) +
BCS). When DNA was left out, significant absorption and color were still produced
(Figure 3.5 E: 4 + Cu(II) + BCS). Therefore, the BCS data collectively indicate that bis-
acridine ligand 4 sensitizes photoreduction of Cu(II) to Cu(I) and that DNA is not
required for photoreduction.
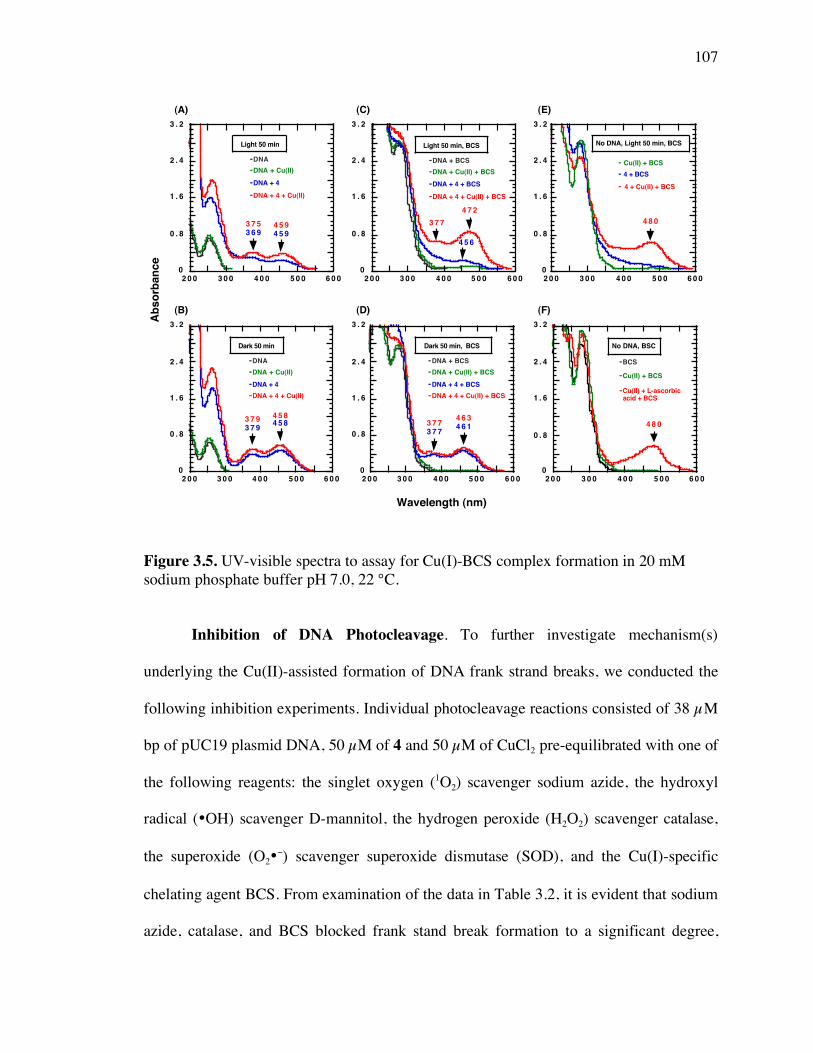
107
Figure 3.5. UV-visible spectra to assay for Cu(I)-BCS complex formation in 20 mM sodium phosphate buffer pH 7.0, 22 °C.
Inhibition of DNA Photocleavage. To further investigate mechanism(s)
underlying the Cu(II)-assisted formation of DNA frank strand breaks, we conducted the
following inhibition experiments. Individual photocleavage reactions consisted of 38 µM
bp of pUC19 plasmid DNA, 50 µM of 4 and 50 µM of CuCl2 pre-equilibrated with one of
the following reagents: the singlet oxygen (1O2) scavenger sodium azide, the hydroxyl
radical (•OH) scavenger D-mannitol, the hydrogen peroxide (H2O2) scavenger catalase,
the superoxide (O2•−) scavenger superoxide dismutase (SOD), and the Cu(I)-specific
chelating agent BCS. From examination of the data in Table 3.2, it is evident that sodium
azide, catalase, and BCS blocked frank stand break formation to a significant degree,
Ab
so
rba
nc
e
Wavelength (nm)
(A) (C) (E)
(B) (D) (F)
0
0 . 8
1 . 6
2 . 4
3 . 2
2 0 0 3 0 0 4 0 0 5 0 0 6 0 0
4 5 94 5 9
3 7 53 6 9
Light 50 min
-DNA
-DNA + Cu(II)
-DNA + 4
-DNA + 4 + Cu(II)
0
0 . 8
1 . 6
2 . 4
3 . 2
2 0 0 3 0 0 4 0 0 5 0 0 6 0 0
4 5 84 5 8
3 7 93 7 9
Dark 50 min
-DNA
-DNA + Cu(II)
-DNA + 4
-DNA + 4 + Cu(II)
0
0 . 8
1 . 6
2 . 4
3 . 2
2 0 0 3 0 0 4 0 0 5 0 0 6 0 0
4 6 34 6 13 7 7
3 7 7
Dark 50 min, BCS
-DNA + BCS
-DNA + Cu(II) + BCS
-DNA + 4 + BCS
-DNA + 4 + Cu(II) + BCS
0
0 . 8
1 . 6
2 . 4
3 . 2
2 0 0 3 0 0 4 0 0 5 0 0 6 0 0
- Cu(II) + BCS
- 4 + BCS
- 4 + Cu(II) + BCS
No DNA, Light 50 min, BCS
4 8 0
0
0 . 8
1 . 6
2 . 4
3 . 2
2 0 0 3 0 0 4 0 0 5 0 0 6 0 0
-BCS
-Cu(II) + BCS
-Cu(II) + L-ascorbic acid + BCS
No DNA, BSC
4 8 0
0
0 . 8
1 . 6
2 . 4
3 . 2
2 0 0 3 0 0 4 0 0 5 0 0 6 0 0
4 7 2
4 5 6
-DNA + BCS
-DNA + Cu(II) + BCS
-DNA + 4 + BCS
-DNA + 4 + Cu(II) + BCS
Light 50 min, BCS
3 7 7

108
while D-mannitol was almost completely ineffective. Intermediate levels of inhibition
were produced by SOD, indicating that superoxide contributes to photocleavage. (SOD
produces H2O2, which can itself play a part in cleavage and thereby lower inhibition by
this enzyme.) Although the piperidine labile lesion 8-hydroxyguanosine is the primary
form of DNA damaged produced by singlet oxygen, the relative efficiency of sodium
azide implies that singlet oxygen may play a major role: singlet oxygen is capable of
cleaving DNA directly by producing frank strand breaks at guanine bases (63). However,
because frank strand breaks account for no more than 5% of total DNA damage produced
by 1O2 (64), it is conceivable that cleavage inhibition by sodium azide involves a copper-
peroxide type complex (60) of ligand 4. The relatively strongly inhibitory effects of
catalase and of the Cu(I)-specific chelating agent BCS clearly indicate that hydrogen
peroxide and Cu(I) participate in DNA photocleavage. Alternatively, the ineffectiveness
of the hydroxyl radical scavenger D-mannitol suggests that freely diffusible hydroxyl
radicals do not make a significant contribution. This latter result is consistent with the
majority of literature reports in which copper-peroxide type complexes rather than
hydroxyl radicals were found to be the principal reactive species involved in DNA
cleavage by Cu(II)/Cu(I) redox cycling systems (59-61, 65). A mechanism consistent
with the above photocleavage inhibition data is shown in Figure 3.6 (61). It is
conceivable that Cu(II) bound to the pyridine linker of ligand 4 is photoreduced to Cu(I),
which in turn reacts with hydrogen peroxide to produce a DNA damaging Cu(I)-peroxide
complex. Because the colorimetric BCS assay detected Cu(I) only when 4 was present, it
can also be inferred that DNA photocleavage involves acridine-sensitized photoreduction
of Cu(II) to Cu(I).

109
Table 3.2. Average % Inhibition of DNA Photocleavage by Scavengers and BCSa Scavenger/chelator Species Targeted Percent Inhibition D-mannitol (100 mM) •OH 5+1
superoxide dismutase (100 U) O2•− 29+1
BCS (100 mM) Cu(I) 51+2 b
catalase (100 U) H2O2 56+2
sodium azide (100 mM) 1O2 61+3
a Individual reactions consisting of 38 µM bp of pUC19 plasmid DNA equilibrated with 50 µM of 4, 50 µM of CuCl2, and one of the above reagents were irradiated under aerobic conditions at 419 nm for 50 min at 22 °C. Percent inhibition was averaged over three trials with error reported as standard deviation. Final reagent concentrations are in parenthesis. b In control experiments, we observed direct photocleavage of DNA by BCS in the absence of 4 (data not shown). Therefore, the 51% inhibition produced by BCS may be lower than the actual % inhibition value.
Figure 3.6. A proposed model in which superoxide (O2•−), hydrogen peroxide (H2O2),
and Cu(I) contribute to the formation of a Cu(I)-peroxide complex.
DNA Photocleavage at Nucleotide Resolution. In order to map the sequence-
specificity of Cu(II)-assisted DNA photocleavage, pUC19 plasmid was linearized with
EcoRI, 3'-end labeled with [35S]dATPαS, and then cut with FspI to produce a 138 bp
restriction fragment (58). Reactions containing 15 µM bp of the radiolabeled DNA
fragment in the absence and presence of 5 µM 4 and 5 µM CuCl2 were irradiated at 419
nm for 2 h (20 mM sodium phosphate buffer pH 7.0). Half of the reactions were
H HO O H2O21e- 1H
Cu(I) + O2 Cu(II) + O2
Cu (I) + H2O2 Cu(I)OOH + H
O2
110
subsequently treated with 1.0% piperidine (90 °C, 30 min) in order to produce strand
breaks at alkaline labile lesions in the DNA. Products were electrophoresed adjacent to
G, G+A, and T chemical sequencing reactions on a 10.0% denaturing polyacrylamide gel,
after which cleavage patterns were analyzed. Shown in Figure 3.7 are cleavage plots of a
representative 40 bp sequence within the radiolabeled restriction fragment. The top 20
bases producing the highest levels of photocleavage appear in the inset of each plot. In
the absence of piperidine, it is evident that the Cu(II) complex of 4 almost always
produces frank strand breaks without a marked base preference (Figure 3.7A). This result
suggests that photocleavage may involve hydrogen atom abstraction from deoxyribose.
Because sugar residues are present in every nucleotide, reagents which function by
hydrogen atom abstraction are expected to cleave at all nearby DNA sequences
irrespective of base composition (11). Singlet oxygen and direct electron transfer from
DNA nucleobases produce DNA damage predominately at guanine bases (11, 63), and
are therefore unlikely to have made overriding contributions to the formation of frank
strand breaks. Alternatively, the cleavage pattern was changed after the DNA photolysis
reactions were treated with piperidine, showing preferential damage at guanine. This
result indicates that alkaline labile lesions were formed at guanine bases, either through
the production of singlet oxygen and/or by direct electron transfer from DNA (Figure
3.7B).

111
Figure 3.7. Cleavage plots of a representative 40 bp DNA sequence. Photocleavage intensities as a function of DNA base were calculated by quantitating a storage-phosphor autoradiogram of DNA photocleavage products resolved on a 10.0% denaturing polyacrylamide gel (Figure 3.S3 in Supporting Information). A total of 15 µM bp of 35S 3'-end labeled 138 bp restriction fragment was irradiated at 419 nm in the presence of 5 µM 4 and 5 µM CuCl2 without (A) and with (B) subsequent piperidine treatment. The ordinate is in units of fa – fc, where fa is the fractional cleavage intensity produced in the photocleavage reaction and fc is fractional cleavage intensity in a parallel control reaction in which DNA was irradiated in the absence of the Cu(II) complex of compound 4, without (A) and with (B) the piperidine treatment. A horizontal line has been drawn through each plot in order to identify the top 20 DNA bases (inset) producing the highest levels of cleavage.
Ph
oto
cle
avag
e In
ten
sit
y
0
100
200
300
G
GG
G
G
G
G
A
G
GGC
AC T
TTA
A
T
341 380nucleotide number and sequence
A G T T G G G T A A C G C C A G G G T T T T C C C A G T C A C G A C G T T G TA5!- - 3!
(B) 4 +Cu(II) + h! " piperidine
(A) 4 +Cu(II)+ h!
0
100
200
300
A T
TG C
G
T
G
AACCA
GT
C C
G AG
A A G T T G G G T A A C G C C A G G G T T T T C C C A G T C A C G A C G T T G T5!- - 3!
341 380nucleotide number and sequence
Top 20 bases:p
G = 10; T = 4 A = 4; C = 2
Top 20 bases:p
G = 6; T = 4 A = 5; C = 5
(A) 4 +Cu(II)+ h!

112
Conclusion
In summary, our data indicate that Cu(II) markedly enhances DNA photocleavage
by ligand 4 under near physiological conditions of temperature and pH. Although the
precise cleavage mechanism is unknown, at this time we believe that the formation of
frank strand breaks may involve acridine sensitized photoreduction of Cu(II) to Cu(I)
followed by reaction of 4/Cu(I) with hydrogen peroxide to form a copper-peroxide
complex. Considering the bioavailability of copper at the cellular level, copper-based
photonucleases are advantageous in comparison to complexes based on other metals or to
chemical nucleases which require an external reducing agent for their activity. To the best
of our knowledge, bis-acridine 4 is only the third example of a photonuclease that has
been shown to cleave DNA by a process that involves direct photochemical reduction of
copper (14, 15). Our future work will focus on mechanistic studies and on synthetic
endeavors to develop new copper-based photonucleases for use in chemical and medical
applications.
Footnotes
1 Competition dialysis experiments were conducted at room temperature in
sodium phosphate buffer pH 7.0. Under these conditions, the UV-visible spectra of the
Cu(II) complex of 4 and of ligand 4 were found to be nearly super imposable. Therefore,
the Kapp of the Cu(II) complex of 4 could not be accurately determined by competition
dialysis because the concentration of the Cu(II) complex of 4 versus that of 4 could not
be ascertained.

113
2 DNA frank strand breaks are defined as single- or double-stranded DNA breaks
directly induced by the effects of a cleaving reagent alone, in the absence of subsequent
treatment with alkaline or with a secondary amine such as piperidine.
Acknowledgment
We thank Timothy C. Laeger, Prof. Marcus W. Germann, and Prof. W. David
Wilson for their assistance (Georgia State University). Support of this research by the
CAM-UAH (2005-012; A.L.), the CAM (GR-MAT 2004-0810; M.-M.R.), the National
Science Foundation (CHE-9984772; K.B.G.), and the American Chemical Society
Petroleum Research Fund (32897-G3; K.B.G.) is gratefully acknowledged.
114
Literature Cited
(1) Barton, J. K. (1986) Metals and DNA: molecular left-handed complements.
Science 233, 727-734.
(2) Pyle, A. M., and Barton, J. K. (1990) Probing nucleic acids with transition metal
complexes. Prog. Inorg. Chem. 38, 413-475.
(3) Erkkila, K. E., Odom, D. T., and Barton J. K. (1999) Recognition and reaction of
metallointercalators with DNA. Chem. Rev. 99, 2777-2795.
(4) Huber, P. W. (1993) Chemical nucleases: their use in studying RNA structure and
RNA-protein interactions. FASEB J. 7, 1367-1375.
(5) Pratviel, G., Bernadou, J., and Meunier, B. (1995) Carbon-hydrogen bond of
DNA sugar units as targets for chemical nucleases and drugs. Angew. Chem. Int.
Ed. Engl. 34, 746-769.
(6) Burrows, C. J., and Muller, J. G. (1998) Oxidative nucleobase modifications
leading to strand scission. Chem. Rev. 98, 1109-1151.
(7) Pratviel, G., Bernadou, J., and Meunier, B. (1998) DNA and RNA cleavage by
metal complexes. Adv. Inorg. Chem. 45, 251-312.
(8) Cadet, J., and Vigny, P. (1990) The Photochemistry of Nucleic Acids. Bioorganic
Photochemistry (H. Morrison, Ed.) Vol. 1 pp 1-272, Wiley, New York.
(9) Kochevar, I. E., and Dunn, D. A. (1990) Photosensitized Reactions of DNA:
Cleavage and Addition. Bioorganic Photochemistry (H. Morrison, Ed.) Vol. 1 pp
273-315, Wiley, New York.
(10) Saito, I., and Nakatani, K. (1996) Design of DNA-cleaving agents. Bull. Chem.
Soc. Jpn. 69, 3007-3019.

115
(11) Armitage, B. (1998) Photocleavage of nucleic acids. Chem. Rev. 98, 1171-1200.
(12) Barton, J. K., and Raphael, A. L. (1984) Photoactivated stereospecific cleavage of
double-helical DNA by cobalt(III) complexes. J. Am. Chem. Soc. 106, 2466-2468.
(13) Subramanian, R., and Meares, C. F. (1986) Photosensitization of cobalt
bleomycin. J. Am. Chem. Soc. 108, 6427-6429.
(14) Kuwahara, J., Suzuki, T., Funakoshi, K., and Sugiura, Y. (1986) Photosensitive
DNA cleavage and phage inactivation by copper(II)-camptothecin. Biochemistry
25, 1216-1221.
(15) Gude, L., Fernández, M. J., Grant, K. B., and Lorente, A. (2005) Syntheses and
copper(II)-dependent DNA photocleavage by acridine and anthracene 1,10-
phenanthroline conjugate systems. Org. Biomol. Chem. 3, 1856-1862.
(16) Wilson, B., Gude, L., Fernández, M.-J., Lorente, A., and Grant, K. B. (2005)
Tunable DNA photocleavage by an imidazole-acridine conjugate. Inorg. Chem.
44, 6159-6173.
(17) Spector, W. S. (1956) Handbook of Biological Data p 52, W.B. Saunders
Company, Philadelphia.
(18) Wacker, W. E. C., and Vallee, B. L. (1959) Nucleic acids and metals. I.
Chromium, manganese, nickel, iron, and other metals in ribonucleic acid from
diverse biological sources. J. Biol. Chem. 234, 3257-3262.
(19) Cantor, K. P., and Hearst, J. E. (1966) Isolation and partial characterization of
metaphase chromosomes of a mouse ascites tumor. Proc. Natl. Acad. Sci. USA 55,
642–649.

116
(20) Bryan, S. E., Vizard, D. L., Beary, D. A., LaBiche, R. A., and Hardy, K. J. (1981)
Partitioning of zinc and copper within subnuclear nucleoprotein particles. Nucleic
Acids Res. 9, 5811-5823.
(21) Fürst, P., and Hamer, D. (1989) Cooperative activation of a eukaryotic
transcription factor: interaction between Cu(I) and yeast ACE1 protein. Proc.
Natl. Acad. Sci. USA 86, 5267–5271.
(22) Thiele, D. J. (1992) Metal-regulated transcription in eukaryotes. Nucleic Acids
Res. 20, 1183–1191.
(23) Mc Millin, D. R., and Mc Nett, K. M. (1998) Photoprocesses of copper complexes
that bind to DNA. Chem. Rev. 98, 1201-1219.
(24) Eppley, H. J., Lato, S. M., Ellington, A. D., and Zaleski, J. M. (1999) Transition
metal kinamycin model as a DNA photocleaver for hypoxic environments: bis(9-
diazo-4,5-diazafluorene)copper(II) nitrate. Chem. Comm. 2405-2406.
(25) Benites, P. J., Holmberg, R. C., Rawat, D. S., Kraft, B. J., Klein, L. J. Peters, D.
G., Thorp, H. H., and Zaleski, J. M. (2003) Metal-ligand charge-transfer-
promoted photoelectronic Bergman cyclization of copper metalloenediynes:
photochemical DNA cleavage via C-4' H-atom abstraction. J. Am. Chem. Soc.
125, 6434-6446.
(26) Dhar, S., and Chakravarty, A. R. (2003) Efficient visible light induced nuclease
activity of a ternary mono-1,10-phenanthroline copper(II) complex containing 2-
(methylthio)ethylsalicylaldimine. Inorg. Chem. 42, 2483-2485.
(27) Dhar, S., Senapati, D, Das, P. K., Chattopadhyay, P., Nethaji, M., and
Chakravarty, A. R. (2003) Ternary copper complexes for photocleavage of DNA

117
by red light: direct evidence for sulfur-to-copper charge transfer and d-d band
involvement. J. Am. Chem. Soc. 125, 12118-12124.
(28) Dhar, S., Senapati, D., Reddy, P. A., Das, P. K., and Chakravarty, A. R. (2003)
Metal-assisted red light-induced efficient DNA cleavage by dipyridoquinoxaline-
copper(II) complex. Chem. Comm. 2452-2453.
(29) Vaidyanathan, V. G., and Nair, B. N. (2003) Oxidative cleavage of DNA by
tridentate copper (II) complex. J. Inorg. Biochem. 93, 271-276.
(30) Gupta, T., Dhar, S., Nethaji, M., and Chakravarty, A. R. (2004)
Bis(dipyridophenazine)copper(II) complex as major groove directing synthetic
hydrolase. Dalton Trans. 1896-1900.
(31) Reddy, P. A., Santra, B. K., Nethaji, M., and Chakravarty, A. R. (2004) Metal-
assisted light-induced DNA cleavage activity of 2-
(methylthio)phenylsalicylaldimine Schiff base copper(II) complexes having
planar heterocyclic bases. J. Inorg. Biochem. 98, 377-386.
(32) Dhar, S, and Chakravarty, A. R. (2005) Photosensitizer in a molecular bowl:
steric protection enhancing the photonuclease activity of copper(II) scorpionates.
Inorg. Chem. 44, 2582-2584.
(33) Dhar, S., Nethaji, M., and Chakravarty, A. R. (2005) Effect of charge transfer
bands on the photo-induced DNA cleavage activity of [1-(2-thiazolylazo)-2-
naphtholato]copper(II) complexes. J. Inorg. Biochem. 99, 805-812.
(34) Patra, A. K., Dhar, S., Nethaji, M., and Chakravarty, A. R. (2005) Metal-assisted
red light-induced DNA cleavage by ternary L-methionine copper(II) complexes of
planar heterocyclic bases. Dalton Trans. 896-902.
118
(35) Patra, A. K., Nethaji, M., and Chakravarty, A. R. (2005) Red-light
photosensitized cleavage of DNA by (L-lysine)(phenanthroline base)copper(II)
complexes. Dalton Trans. 2798-2804.
(36) Halliwell, B., and Gutteridge, J. M. C. (1984) Oxygen toxicity, oxygen radicals,
transition metals and disease. Biochem. J. 219, 1-14.
(37) Linder, M. C. (1991) Biochemistry of Copper, Plenium Press, New York.
(38) Peña, M. M., Lee, J., and Thiele, D. J. (1999) A delicate balance: homeostatic
control of copper uptake and distribution. J. Nutr. 129, 1251-1260.
(39) Chevion, M. (1988) A site-specific mechanism for free radical induced biological
damage: the essential role of redox-active transition metals. Free Radical Bio.
Med. 5, 27-37.
(40) Kady, I. O., and Tan, B. (1995) Metal-catalyzed intramolecular hydrolysis of
phosphate esters. Tetrahedron Lett. 36, 4031-4034.
(41) Lorente, A., Fernández-Saiz, M., Espinosa, J.-F., Jaime, C., Lehn, J.-M., and
Vigneron, J.-P. (1995) Cyclo-bis-intercalands with acridine subunits linked by
rigid spacers. Tetrahedron Lett. 36, 5261-5264.
(42) Sambrook, J., Fritsch, E. F., and Maniatis, T. (1989) Molecular Cloning: A
Laboratory Manual 2nd ed., Cold Spring Harbor Laboratory, Cold Spring Harbor,
NY.
(43) Cohen, G., and Eisenberg, H. (1966) Conformation studies on the sodium and
cesium salts of calf thymus deoxyribonucleic acid (DNA). Biopolymers 4, 429-
440.

119
(44) Ren, J., and Chaires, J. B. (2001) Rapid screening of structurally selective ligand
binding to nucleic acids. Methods Enzymol. 340, 99-108.
(45) Chaires, J. B. (2002) A competition dialysis assay for the study of structure-
selective ligand binding to nucleic acids. Current Protocols in Nucleic Acid
Chemistry, John Wiley & Sons, New York, p 8.8.1-8.3.8.
(46) Yang, X., and Grant, K. B. (2002) Chemical sequencing of restriction fragments
3'-end-labeled with [35S]dATPαS. J. Biochem. Biophys. Methods 50, 123-128.
(47) Couturier, Y., and Petitfaux, C. (1978) Composition and stability of copper
complexes and pyridine amine-copper complexes. XI. Comparison of
monopyridine mono- and diamines. Bull. Soc. Chim. France 11-12, Pt. 1, 435-
441.
(48) Garcia Basallote, M., and Martell, A. E. (1988) New multidentate ligands. 29.
Stabilities of metal complexes of the binucleating macrocyclic ligand BISBAMP
and dioxygen affinity of its dinuclear cobalt(II) complex. Inorg. Chem. 27, 4219-
4224.
(49) Freifelder, D., Davison, P. F., and Geiduschek, E. P. (1961) Damage by visible
light to the acridine orange--DNA complex. Biophys. J. 1, 389-400.
(50) Piette, J., López, M., Calberg-Bacq, C. M., and Van de Vorst, A. (1981)
Mechanism for strand-break induction in DNA-proflavine complexes exposed to
visible light. Int. J. Radiat. Biol. 40, 427-433.
(51) Espinosa, J.-F., Fernández, M.-J., Grant, K. B., Gude, L., Rodrigo, M.-M., and
Lorente, A. (2004) Synthesis, DNA intercalation and europium(III)-triggered

120
DNA photocleavage by a bis-proflavine succinamide conjugate. Tetrahedron Lett.
45, 4017-4020.
(52) Suh, D. and Chaires, J. B. (1995) Criteria for the mode of binding of DNA
binding agents. Bioorg. Med. Chem. 3, 723-728.
(53) Chaires, J. B., Leng, F., Przewloka, T., Fokt, I., Ling, Y-H., Pérez-Soler, R., and
Priebe, W. (1997) Structure-based design of a new bisintercalating anthracycline
antibiotic. J. Med. Chem. 40, 261-266.
(54) Pilch, D. S., Kirolos, M. A., Liu, X., Plum, G. E., and Breslauer, K. J. (1995)
Berenil [1,3-bis(4'-amidinophenyl)triazene] binding to DNA duplexes and to a
RNA duplex: evidence for both intercalative and minor groove binding properties.
Biochemistry 34, 9962-9976.
(55) Wilson, W. D., Tanious, F. A., and Fernández-Saiz, M. (1997) Evaluation of
Drug-Nucleic Acid Interactions by Thermal Melting Curves. in Drug-DNA
Interaction Protocols (K. R. Fox, Ed.) Humana Press, New Jersey.
(56) Satyanarayana, S., Dabrowiak, J. C., and Chaires, J. B. (1993)
Tris(phenanthroline)ruthenium(II) enantiomer interactions with DNA: mode and
specificity of binding. Biochemistry 32, 2573-2584.
(57) Oster, G. K., and Oster, G. (1959) Photoreduction of metal ions by visible light. J.
Am. Chem. Soc. 81, 5543-5545.
(58) Kellmann, A. (1974) Primary photochemical processes of cationic acridine orange
in aqueous solution studied by flash photolysis. Photochem. Photobiol. 20, 103-
108.

121
(59) Yamamoto, K., and Kawanishi. S. (1989) Hydroxyl free radical is not the main
active species in site-specific DNA damage induce by copper(II) ion and
hydrogen peroxide. J. Biol. Chem. 264, 15435-15440.
(60) Li, Y., and Trush, M. A. (1993) DNA damage resulting from the oxidation of
hydroquinone by copper: role for a Cu(II)/Cu(I) redox cycle and reactive oxygen
generation. Carcinogenesis 1303-1311.
(61) Oikawa, S., and Kawanishi, S. (1998) Distinct mechanisms of site-specific DNA
damage induced by endogenous reductants in the presence of iron(III) and
copper(II). Biochim. Biophys. Acta 1399, 19-30.
(62) Wong, A., Huang, H.-C., and Crooke, S. T. (1984) Mechanism of
deoxyribonucleic acid breakage induced by 4'-(9-acridinylamino)methanesulfon-
m-anisidide and copper: role for cuprous ion and oxygen free radicals.
Biochemistry 23, 2946-2952.
(63) Devasagayam, T. P., Steenken, S., Obendorf, M. S., Schulz, W. A., and Sies, H.
(1991) Formation of 8-hydroxy(deoxy)guanosine and generation of strand breaks
at guanine residues in DNA by singlet oxygen. Biochemistry 30, 6283-6289.
(64) Di Mascio, P., Wefers, H., Do-Thi, H. P., Lafleur, M. V., and Sies, H. (1989)
Singlet molecular oxygen causes loss of biological activity in plasmid and
bacteriophage DNA and induces single-strand breaks. Biochim. Biophys. Acta.
1007, 151-157.
(65) Masarwa, M., Cohen, H., Meyerstein, D., Hickman, D. L., Bakac, A., and
Espenson, J. H. (1988) Reactions of low-valent transition-metal complexes with

122
hydrogen peroxide. Are they “Fenton-like” or not? 1. The case of Cu+ aq and Cr2+
aq. J. Am. Chem. Soc. 110, 4293-4297.
Supporting Information
Table 3.S1. Nucleic Acid Samples Used in Competition Dialysis Experimentsa
Deoxyribo Nucleic Acid λ (nm) ε (M-1(bp) cm-1)
[poly(dGdC)]2 (100% GC) 254 16,800
ML DNA (72% GC) 260 13,846
CT DNA (42% GC) 260 12,824
CP DNA (31% GC) 260 12,476
poly(dA)-poly(dT) (0%GC) 260 12,000
[poly(dAdT)]2 (0% GC) 262 13,200
a ε is the molar extinction coefficient at the wavelength l, expressed in terms of DNA base pairs.

123
Figure 3.S1. (A) Positive ion ESI mass spectrum showing complexes formed between ligand 4 and CuCl2 in HPLC grade methanol at a ligand to metal ratio of 1:1. Isotopic distributions of molecular ions corresponding to the following 1:1 metallic complexes are observed: (i) [4HCuCl]2+ between 425 and 428 m/z (calcd for [C43H46N9O4CuCl]2+ 425.13); (ii) [4CuCl]1+ between 849 and 855 m/z (calcd for [C43H45N9O4CuCl]1+ 849.26); (iii) [4HCuCl2]1+ between 885 and 892 m/z (calcd for [C43H46N9O4CuCl2]1+ 885.24). (B) Positive ion ESI mass spectrum of ligand 4 in HPLC grade methanol (no CuCl2). The following isotopic distributions of molecular ions corresponding to ligand 4 are observed: (i) [4H2]2+ between 377 and 378 m/z (calcd for [C43H47N9O4]2+ 376.69); (ii) [4H]1+ between 752 and 755 m/z (calcd for [C43H46N9O4]1+ 752.37). A comparison of the spectra shows that there is no evidence of free ligand 4 in (A). The asterisk identifies peaks in common to both spectra.
* *
**
376.81, [4H2]2+
752.25, [4H]1+
849.00, [4CuCl]1+
425.81, [4HCuCl]2+
887.00, [4HCuCl2]1+ *
*
**
Mass (m/z)
Inte
nsity

124
Figure 3.S2. Concentration profile: percent photocleavage of pUC19 plasmid DNA. Reactions contained 20 mM sodium phosphate buffer pH 7.0 and 38 µM bp DNA without and with 50 µM to 2 µM concentrations of CuCl2 and/or compound 4. The samples were aerobically irradiated at 419 nm for 50 min at 22 ºC. The results showed that nicked DNA was the exclusive cleavage product, with the exception of the reaction irradiated in the presence of 50 µM of CuCl2 and 50 µM of compound 4. (In this reaction, nicked and linear DNA forms were produced in 87% and 8% yield, respectively.)

125
Figure 3.S3. A storage-phosphor autoradiogram of DNA photocleavage products resolved on a 10.0% denaturing polyacrylamide gel. Shown in the gel is a representative 40 bp sequence within an 35S 3'-end labeled 138 bp restriction fragment from pUC19. Lanes 1, 2: 15 µM bp the restriction fragment irradiated at 419 nm, in the presence of 5 µM 4 and 5 µM CuCl2, without and with subsequent piperidine treatment. Lanes 3, 4: 15 µM bp of the restriction fragment irradiated in the presence of 10 µM 4 and 10 µM CuCl2, without and with subsequent piperidine treatment. Lanes 5, 6: 15 µM bp of the restriction fragment irradiated without and with subsequent piperidine treatment (no 4, no CuCl2). DNA bases are identified to the right and left of the gel. To produce the cleavage plot shown in Figure 7A of the accompanying manuscript, Lane 5 (fc) was subtracted from Lane 1 (fa). To produce the cleavage plot shown in Figure 7B of the accompanying manuscript, Lane 6 (fc) was subtracted from Lane 2 (fa).
1 2 3 4Lane: 5 6
Pip. - + - -+
4 (µM) 5 5
10 10
-
CuCl2 (µM) 5 5
10 10
-
-
-
+
A
A
G
T
T
G
G
G
T
A
A
C
G
C
C
A
G
G
G
T
T
T
T
C
C
C
A
G
T
C
A
C
G
A
C
G
T
T
G
T
- 3!
AA
G
T
T
G
G
G
T
A
A
C
G
C
C
A
G
G
G
T
T
T
T
C
C
C
A
G
T
C
A
C
G
A
C
G
T
T
G
T

126
CHAPTER IV
Synthesis and DNA Interactions of a Bis-Phenothiazinium Photosensitizer
(The content of this chapter will be submitted by Wilson, B.; Fernández, M.-J.; Lorente, A.; Grant, K. B. an American Chemical Society journal. The contributions to this project by the author of this dissertation were as follows: design and synthesis of the photosensitizer 3; conception and execution of all biological, biophysical, and photochemical experiments; and authorship of the original manuscript. Drs. Fernández and Lorente were instrumental in directing the strategies developed for the synthesis of compound 3 as well as made minor revisions to the manuscript. Dr. Grant made extensive revisions to the final manuscript.)
Abstract
We report the synthesis and characterization of N,N'-bis[(7-
dimethylamino)phenothiazin-5-ium-3-yl]-4,4'-ethylenedipiperidine diiodide (3),
consisting of two photosensitizing phenothiazinium rings attached to a central
ethylenedipiperidine linker. At all time points (10, 30, 60 min) and all wavelengths (676,
700, 710 nm) tested, photocleavage of pUC19 plasmid DNA (22 °C and pH 7.0) was
markedly enhanced by 1 µM of 3 in comparison to 1 µM of the parent phenothiazine
methylene blue (MB). In addition, the photocleavage levels produced by 5 to 0.5 µM
concentrations of compound 3 were consistently higher than the cleavage levels produced
using approximately twice as much MB (10 to 1.0 µM). (As an example, 710 nm
irradiation of 5 µM of 3 and 10 µM of MB cleaved the plasmid DNA in 93% and 71%
yields, respectively). Scavenger assays provided evidence for the involvement of DNA
damaging singlet oxygen and hydroxyl radicals, whereas analysis of photocleavage
products at nucleotide resolution revealed that DNA damage (i.e., frank strand breaks and
alkaline-labile lesions) occurred predominantly at guanine bases. While compound 3 and
MB both appeared to increase duplex stability, the Tm values of calf thymus (CT) and C.

127
perfringens DNAs were increased by 13 ºC and 18 ºC in the presence of compound 3, in
comparison to only 4 ºC and 6 ºC in the presence of MB. Finally, viscometric data
indicated that CT DNA can interact with compound 3 and MB by a combination of
groove binding and monofunctional intercalation, and with compound 3 by a third,
bisintercalative binding mode.
Introduction
In photodynamic therapy (PDT), photosensitizing drugs are employed to
effectively treat a variety of malignant tumors and non-cancerous diseases.1 PDT offers
the advantage of selective localization and light activation of the photosensitizer in
diseased tissue, thereby minimizing damage to healthy cells. Notwithstanding, only a few
drugs, mostly first and second generation porphyrin derivatives, have been approved
clinically.1a,b There is now a great interest in the development of alternative
photosensitizing agents for use in PDT. An important requirement of PDT is strong
absorption of light within a therapeutic window of 600 - 800 nm.1b These longer
wavelengths reduce light scattering and are more readily transmitted by biological
constituents, thereby providing maximal light penetration.
The phenothiazine dye methylene blue (MB; Scheme 1) strongly absorbs light at
664 nm (ε = 6.40 x 10⁴ M-1 cm-1 in H2O). With regards to PDT, MB has demonstrated
efficient photodynamic activity in several malignant cell lines,2 murine tumor models,3
and in the palliation of human esophageal cancer.4 Additionally, MB has exhibited
photoinactivation of nosocomial bacterial pathogens5 and is utilized as a
photodecontamining agent in donated blood products.6b Specifically, MB has been shown
to photoinactivate the human immunodeficiency virus in culture media6a and in human
128
plasma.6b Recent, preliminary studies have indicated that cell cultures phototreated in the
presence of MB significantly reduce the infectivity of West Nile virus.6b
Methylene blue meets a second important criterion of PDT: low levels of
cytotoxicity in the absence of irradiation.1d Due to its low toxicity in human cells, MB has
been employed in histopathology as a tumor delineating agent7a and as a radioactive
diagnostic tracer for breast cancer.7b Low toxicity levels have permitted other non-PDT
clinical applications, which include the administration of MB as an antidote for nitrate
poisoning and as effective treatments for methemoglobinemia and for ifosfamide-induced
encephalopathy.8
While methylene blue has been reported to accumulate in mitochondria and
lysosomes,9 Rück and co-workers have demonstrated that irradiation triggers the re-
localization of MB from lysosomes to the cell nucleus.9a MB is positively charged at
physiological pH (pKa = 12.0),10 rendering DNA an attractive biological target. In fact, it
has been well established that MB can non-covalently bind to DNA (Ka = 7-10 x 105 M-
1), by exhibiting one of two different binding modes (intercalation or groove binding), as
a function of DNA sequence.11 Its close association with DNA is the basis for effective
oxidative photodamage by MB.12
In spite of the many advantages of MB, the use of phenothiazine-based
chromophores in PDT has remained relatively unexplored. Herein we report the synthesis
and characterization of photosensitizer 3 in which two phenothiazine intercalating units
are attached by an electron donating ethylenedipiperidine linker. Our goal was to design a
reagent capable of photocleaving DNA more efficiently and at longer wavelengths than
MB.
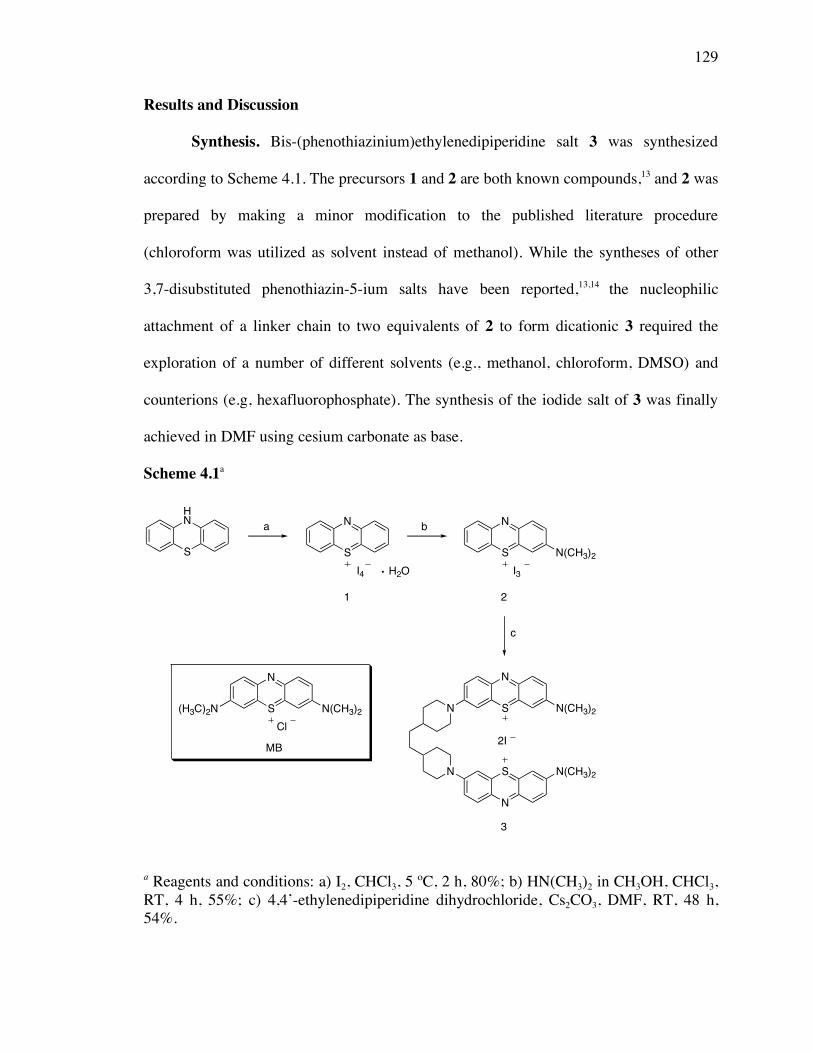
129
Results and Discussion
Synthesis. Bis-(phenothiazinium)ethylenedipiperidine salt 3 was synthesized
according to Scheme 4.1. The precursors 1 and 2 are both known compounds,13 and 2 was
prepared by making a minor modification to the published literature procedure
(chloroform was utilized as solvent instead of methanol). While the syntheses of other
3,7-disubstituted phenothiazin-5-ium salts have been reported,13,14 the nucleophilic
attachment of a linker chain to two equivalents of 2 to form dicationic 3 required the
exploration of a number of different solvents (e.g., methanol, chloroform, DMSO) and
counterions (e.g, hexafluorophosphate). The synthesis of the iodide salt of 3 was finally
achieved in DMF using cesium carbonate as base.
Scheme 4.1a
a Reagents and conditions: a) I2, CHCl3, 5 ºC, 2 h, 80%; b) HN(CH3)2 in CH3OH, CHCl3, RT, 4 h, 55%; c) 4,4’-ethylenedipiperidine dihydrochloride, Cs2CO3, DMF, RT, 48 h, 54%.
S
HN
S
N
I4 H2O
S
N
I3
N(CH3)2
a b
c
1 2
MB
3
S
N
N N(CH3)2
N
N
S N(CH3)2
2I
S
N
Cl
N(CH3)2(H3C)2N

130
UV-Visible Spectrophotometry. In our first set of experiments, we recorded
UV/vis absorption spectra of compound 3 and MB in the presence and absence of calf
thymus (CT) DNA (10 µM phenothiazine, 380 µM bp CT DNA, 10 mM sodium
phosphate buffer pH 7.0; Figure 4.1, Table 4.1). The negatively charged surfactant
sodium dodecyl sulfate (SDS) was added to samples with no DNA in order to disrupt
intermolecular aggregation of 3 and MB. Under our experimental conditions, compound
3 exhibited maxima at 676 nm (ε = 1.45 x 10⁵ M-1 cm-1) and 680 nm (ε = 7.78 x 10⁴ M-1
(bp) cm-1) in the presence of 1% SDS and DNA, respectively. Alternatively, λmax values
for MB were 661 nm (ε = 7.84 x 10⁴ M-1 cm-1) in the presence of 1% SDS and 674 nm (ε
= 5.80 x 10⁴ M-1 (bp) cm-1) in the presence of DNA. It is evident that DNA-bound
compound 3 absorbs light more strongly and at longer wavelengths in comparison to MB
(Figure 4.1, Table 4.S1 in Supporting Infromation).
Figure 4.1. UV-visible spectra recorded at 22 ºC in 10 mM sodium phosphate buffer pH 7.0 of A) 10 µM compound 3 (red) or of B) 10 µM MB (blue) in the presence of 380 µM bp calf thymus DNA (green) or 1% sodium dodecyl sulfate (w/v) (black). C) 1 µM compound 3 (solid green line) or 1 µM MB (dashed green line) with 38 µM bp calf thymus DNA in 10 mM sodium phosphate buffer pH 7.0. The samples containing DNA were pre-equilibrated for 12 h in the dark at 22 ºC.
wavelength (nm)
absorb
ance
0.00
0.50
1.00
1.50
540 600 660 720 780
A)
0.00
0.50
1.00
1.50
540 600 660 720 780
B)
0.00
0.02
0.04
0.06
0.08
0.10
540 600 660 720 780
C)
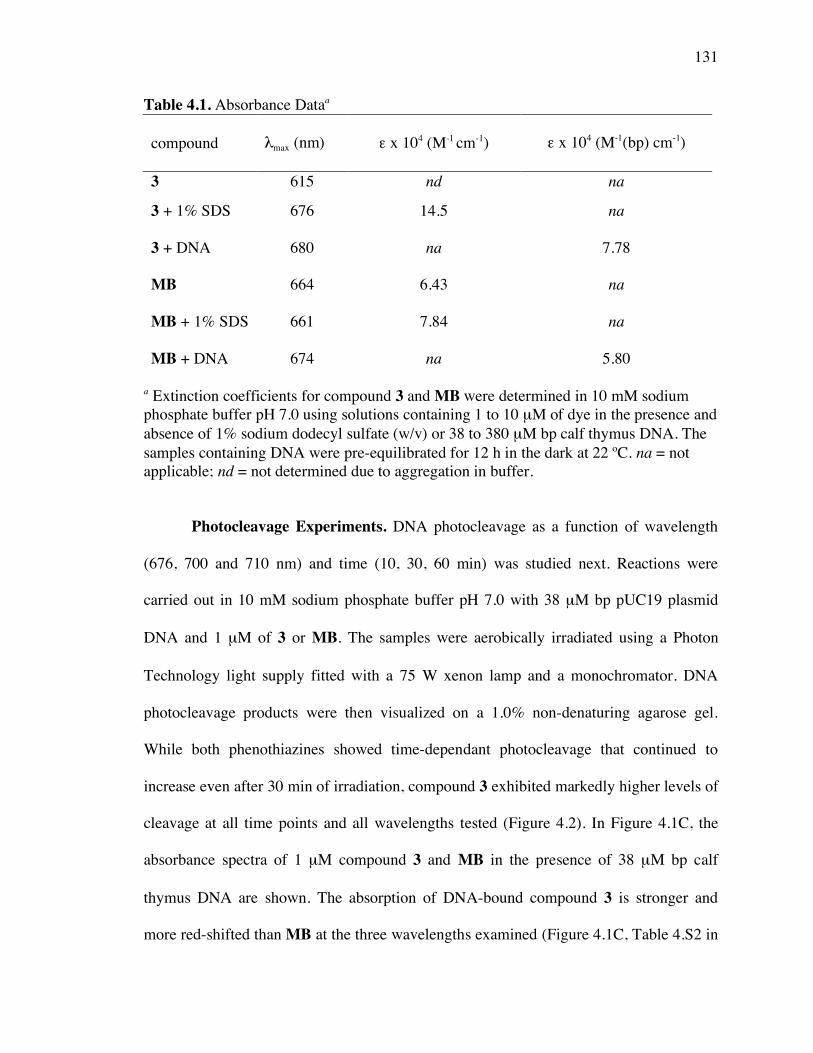
131
Table 4.1. Absorbance Dataa
compound λmax (nm)
ε x 104 (M-1 cm-1)
ε x 104 (M-1(bp) cm-1)
3 615
615
nd na
6.43 3 + 1% SDS 676 14.5 na
3 + DNA 680 na 7.78
MB 664 6.43 na
MB + 1% SDS 661 7.84 na
MB + DNA 674 na 5.80
a Extinction coefficients for compound 3 and MB were determined in 10 mM sodium phosphate buffer pH 7.0 using solutions containing 1 to 10 µM of dye in the presence and absence of 1% sodium dodecyl sulfate (w/v) or 38 to 380 µM bp calf thymus DNA. The samples containing DNA were pre-equilibrated for 12 h in the dark at 22 ºC. na = not applicable; nd = not determined due to aggregation in buffer.
Photocleavage Experiments. DNA photocleavage as a function of wavelength
(676, 700 and 710 nm) and time (10, 30, 60 min) was studied next. Reactions were
carried out in 10 mM sodium phosphate buffer pH 7.0 with 38 µM bp pUC19 plasmid
DNA and 1 µM of 3 or MB. The samples were aerobically irradiated using a Photon
Technology light supply fitted with a 75 W xenon lamp and a monochromator. DNA
photocleavage products were then visualized on a 1.0% non-denaturing agarose gel.
While both phenothiazines showed time-dependant photocleavage that continued to
increase even after 30 min of irradiation, compound 3 exhibited markedly higher levels of
cleavage at all time points and all wavelengths tested (Figure 4.2). In Figure 4.1C, the
absorbance spectra of 1 µM compound 3 and MB in the presence of 38 µM bp calf
thymus DNA are shown. The absorption of DNA-bound compound 3 is stronger and
more red-shifted than MB at the three wavelengths examined (Figure 4.1C, Table 4.S2 in

132
Supporting Information). The absorbance data (Table 4.S2) are in agreement with the
higher levels of photocleavage produced by 1 µM compound 3 in comparison to MB. We
then used the longest wavelength to compare DNA photocleavage as function of dye
concentration. Reactions consisting of 38 µM bp pUC19 plasmid DNA and 10 to 0.25
µM of compound 3 or MB were irradiated at 710 nm for 60 min. Compound 3
consistently generated higher levels of DNA photocleavage at all of the six
concentrations (Figure 4.3). Notably, irradiation of only 5 µM of dye at 710 nm produced
cleavage yields of 93% and 59% for 3 and MB, respectively. In addition, the cleavage
levels produced by 5 to 0.5 µM concentrations of compound 3 were consistently higher
than the cleavage produced using approximately twice the amount of MB (10 to 1.0 µM).
Figure 4.2. DNA photocleavage % of 38 µM bp pUC19 plasmid DNA in the presence of 1 µM compound 3 (gray bars) or 1 µM MB (white bars) in 10 mM sodium phosphate buffer pH 7.0 at 22 ºC. The samples were irradiated at: 676, 700, or 710 nm with a 75 W xenon lamp connected to a monochromator. The black bars represent DNA that was irradiated for 60 min in 10 mM sodium phosphate buffer pH 7.0 in the absence of dye. In the inset are dark controls in which 1 µM of 3 and 1 µM of MB were reacted with 38 µM bp pUC19 plasmid for 60 min (22 ºC, no hν). DNA cleavage % (% nicked + % linear DNA) was averaged over three trials with error bars representing standard deviation.
0
20
40
60
80
100
10 30 60
% D
NA
cle
ava
ge
676 nm
10 30 60
irradiation time (min)
700 nm
10 30 60
710 nm
0
5
10
15
20
10%
13%

133
Figure 4.3. Photograph of a 1% nondenaturing agarose gel showing photocleavage of pUC19 plasmid DNA. Samples contained 10 mM sodium phosphate buffer pH 7.0 and 38 µM bp DNA in presence and absence of dye. After being equilibrated for 12 h in the dark at 22 ºC, the samples were aerobically irradiated at 710 nm for 60 min at 22 ºC. Lanes 1 and 9: DNA controls (no dye). Lanes 3 to 8: 10 to 0.25 µM compound 3. Lanes 11 to 16: 10 to 0.25 µM MB. Lanes 2 and 10: 10 µM 3 and 10 µM MB (no hν). Abbreviations: N = nicked; S = supercoiled. It is evident that DNA photocleavage yields increase as a function of increasing dye concentration with one exception, we attribute the slight decrease in photocleavage observed in the presence of 10 µM of compound 3 to DNA precipitation.
Inhibition of DNA Photocleavage. DNA photodamage by MB proceeds through
Type I (electron transfer) and Type II (energy transfer) pathways.12 We therefore
conducted scavenger experiments to test for DNA damaging Type I hydroxyl radicals
(•OH) and DNA damaging Type II singlet oxygen (1O2). A total of 50 mM of the •OH
scavenger D-mannitol or of the 1O2 scavenger sodium azide was added to photolysis
reactions containing 1 µM compound 3 or 1 µM MB and 38 µM bp plasmid DNA (10
mM sodium phosphate pH 7.0). DNA photocleavage yields in the presence of D-mannitol
and sodium azide were reduced by approximately 20% and 48% in reactions containing
compound 3 and by 20% and 40% in reactions with MB (Table 4.2). These data confirm
that Type I and Type II photochemical pathways contribute to phenothiazine-induced
DNA photocleavage.

134
Table 4.2. Percent Inhibition of DNA Photocleavage by Compound 3 and MBa
compound D-mannitol sodium azide
3 20 ± 1 48 ± 2
MB 20 ± 7 40 ± 1
a Individual reactions consisted of 38 µM bp pUC19 plasmid DNA, 1 µM compound 3 or 1 µM MB, and 50 mM of each of the above reagents in 10 mM sodium phosphate buffer pH 7.0 were aerobically irradiated at 710 nm for 60 min, 22 ºC. Percent inhibition was averaged over three trials with errors reported as standard deviation.
DNA Photocleavage at Nucleotide Resolution. To further investigate
mechanism(s) underlying photocleavage, pUC19 plasmid DNA was linearized with
EcoRI, 3'-end labeled with [35S]dATPαS, and then cut with FspI to generate a 138 bp
restriction fragment. Duplicate sets of reactions containing 15 µM bp of the radiolabeled
DNA in 10 mM sodium phosphate buffer pH 7.0 without and with 5 µM of 3 and 5 µM
of MB were irradiated for 60 min in a ventilated Rayonet Photochemical Reactor fitted
with twelve 575 nm lamps (spectral output 400-650 nm). In order to produce DNA strand
breaks at alkaline labile lesions, half of the reactions were treated with 1.0% piperidine
(90 °C, 30 min) immediately after the 60 min irradiation period. Products were resolved
adjacent to G, G+A, and T chemical sequencing reactions on a 10.0% denaturing
polyacrylamide gel. Shown in Figure 4.4 are photocleavage plots generated from a
representative 40 bp sequence within the 138 bp radiolabeled DNA fragment. In the
absence of piperidine, it is evident that the majority of pronounced frank strand breaks
produced by compound 3 and MB are at guanine bases (Figure 4.4A). This result points
to a photocleavage mechanism that involves either singlet oxygen and/or direct electron
transfer from DNA nucleobases, as both produce preferential DNA damage at
135
guanines.15,16 Figure 4.4A also indicates that hydroxyl radicals are less likely to have
made a major contribution to the formation of frank strand breaks. These reactive oxygen
species cleave DNA by abstracting hydrogen atoms from deoxyribose. Because sugar
residues are present at every nucleotide position, hydroxyl radicals and other reagents
which function by hydrogen atom abstraction tend to cleave at all nearby DNA sequences
irrespective of the base.15 (It is interesting to note that the cleavage patterns produced by
compound 3 and MB are in agreement with the results scavenger experiments
summarized in Table 4.2: the higher levels of cleavage inhibition exhibited by sodium
azide in comparison to D-mannitol indicate that singlet oxygen, rather than hydroxyl
radicals, makes the more significant contribution to the formation of DNA frank strand
breaks.) Figure 4.4B shows that levels of damage at guanine bases are dramatically
increased after the DNA photolysis reactions are treated with piperidine. This result
indicates that 3 and MB formed alkaline labile lesions at guanine bases, either through
the production of singlet oxygen and/or by direct electron transfer from DNA.

136
Figure 4.4. Cleavage plots of a representative 40 bp DNA sequence. Photocleavage intensities as a function of DNA base were calculated by quantitating a storage-phosphor autoradiogram of DNA cleavage products resolved on a 10.0% denaturing polyacrylamide gel. A total of 15 µM bp of 35S 3'-end labeled 138 bp restriction fragment was irradiated at 575 nm in the presence of 5 µM 3 and 5 µM MB without (A) and with (B) post-irradiation piperidine treatment.

137
Thermal Denaturation Studies. Thermal melting studies offer a reliable method
for ranking the relative binding affinities of ligands that stabilize duplex DNA. In the
process of intercalation and/or groove binding, free energy contributions from π-π, van
der Waals, electrostatic and hydrogen bonding interactions stabilize helical DNA. As a
result, these forces increase the DNA binding affinity, thereby increasing the melting
temperature of the DNA-ligand complex. The melting curves shown in Figure 4.5A were
generated at dye to DNA bp molar ratios (r = [dye]/[DNA bp]) of 0.0 and 0.3. Under
these conditions, the melting temperature (Tm) obtained for 12.5 µM bp CT DNA was 65
ºC, while the addition of compound 3 or MB produced Tm values of 78 ºC (ΔTm = 13 ºC)
and 69 ºC (ΔTm = 4 ºC), respectively. We then recorded thermal melting curves at r
values ranging from 0.05 to 0.6 (Figure 4.5B). At r > 0.3, the ΔTm values produced by
compound 3 (Figure 4.5B) did not change. In the case of MB, a plateau in ΔTm values
was not observed by raising the r value from 0.3 to 0.6 (Figure 4.5B). The corresponding
Tm for MB was 69 ºC (ΔTm = 4 ºC), which is still significantly lower than the Tm of 78 ºC
(ΔTm = 13 ºC), recorded for compound 3 at r = 0.3. These data show that compound 3
saturates the DNA binding sites at a lower concentration in comparison to MB. Even at
the lowest ratio tested (r = 0.05), the addition of 3 raised the Tm of CT DNA from 65 ºC to
70 ºC compared to only 66 ºC for MB.
In order to further examine the relative DNA binding affinities of compound 3
and MB, parallel melting isotherms were generated employing C. perfringens DNA (CP)
DNA. In comparison to CT DNA (58% AT), CP DNA possesses a slightly higher AT
content (69% AT). As shown in Figure 4.6, the Tm of 12.5 µM bp CP DNA is 60 ºC while
the addition of 3 or MB (r = 0.3) raises the Tm by 78 ºC (ΔTm = 18 ºC) and 66 ºC (ΔTm = 6

138
ºC), respectively. Collectively, the melting data indicate that compound 3 effects a 3-fold
higher level of duplex stabilization than MB with either CT DNA (Figure 4.5A) or CP
DNA (Figure 4.6). These results show that higher DNA binding affinity in addition to
stronger light absorption exhibited by compound 3 may account for its more efficient
DNA photocleaving ability as compared to MB.
Figure 4.5. Melting curves of: (A) 12.5 µM bp CT DNA (Δ, Tm = 65 ºC); 12.5 µM bp CT DNA with 3.75 µM of MB (� , Tm = 69 ºC) or with 3.75 µM of 3 (, Tm = 78 ºC) in 10 mM sodium phosphate buffer pH 7.0 and (B) ΔTm of 12.5 µM bp calf thymus DNA as a function of increasing dye concentration. : [compound 3] = 0.625, 1.25, 3.75, or 7.50 µM. � : [MB] = 0.625, 1.25, 3.75, or 7.50 µM.
0.0
0.2
0.4
0.6
0.8
1.0
30 40 50 60 70 80 90
norm
aliz
ed a
bsorb
ance 2
60 n
m
temperature (ºC)
A
0
2
4
6
8
10
12
14
0 0.1 0.2 0.3 0.4 0.5 0.6 0.7
!T
m (
ºC)
B
r = [dye]/[DNA bp]

139
Figure 4.6. Melting curves of: 12.5 µM bp C. perfringens (CP) DNA (Δ, Tm = 60 ºC); 12.5 µM bp CP DNA with 3.75 µM of MB (� , Tm = 66 ºC) or with 3.75 µM of 3 (, Tm = 78 ºC) in 10 mM sodium phosphate buffer pH 7.0.
Viscosity Assays. When an intercalator binds to duplex DNA, the helix unwinds
and lengthens to accommodate the ligand in between base pairs. This increase in length
results in an increase in DNA viscosity. (Groove binding compounds do not lengthen
helical DNA and viscosity is not significantly changed.17) In the case of classical
monointercalators, the slopes observed from plots of the cubed root of the relative
viscosity ((η/ηo)1/3) versus r (molar ratio of bound ligand to DNA bp) range from 0.80 to
1.50.18 Alternatively, for bisintercalators typical slopes are from 1.3 to 2.3.18c,19 Figure 4.7
shows that viscometric data of MB with CT DNA (42% GC) yields a slope of 0.962 ±
0.002, clearly consistent with monofunctional intercalation, while the slope for
compound 3 is 1.50 ± 0.13 and is within the ranges expected for both mono- and
bisintercalators. Notwithstanding, 3 increases the viscosity of CT DNA to a significantly
greater extent than MB (Figure 4.7), leading us to hypothesize that the association of
0.0
0.2
0.4
0.6
0.8
1.0
30 40 50 60 70 80 90
norm
aliz
ed a
bsorb
ance 2
60 n
m
temperature (ºC)

140
compound 3 with DNA might involve the existence of multiple binding modes (e.g.,
concomitant monointercalation, bisintercalation, and/or groove binding). In fact,
combinations of these modes are thought to account for DNA viscosity enhancements
produced by a number of bifunctional agents with non-ideal slopes (usually lower than
twice the slope of the corresponding monointercalator).20
To test our hypothesis, we performed viscometric measurements of 3 and MB in
the presence of additional double-helical sequences. Plots of (η/ηo)1/3 versus r for
poly(dA)•poly(dT) and alternating poly[(dA-dT)]2 DNAs yielded slopes of 0.22 and 1.18
for compound 3, and 0.17 and 1.11 for MB, respectively (Figure 4.S4 in the Supporting
Information). These data indicate the existence of different binding modes as a function
of DNA sequence: groove binding for poly(dA)•poly(dT) and monointercalation for
poly[(dA-dT)]2. However, taking into consideration the minimal effect of compound 3 on
poly(dA)•poly(dT) viscosity, we recorded the circular dichroism (CD) spectra shown in
Figure 4.8. The strong, positive induced CD signal at 690 nm confirms the formation of a
complex in which 3 associates with the duplex via DNA groove binding.
Our viscosity data are also consistent with a published CD study in which MB
was shown to bind to poly(dA)•poly(dT) and alternating poly[(dA-dT)]2 via groove
binding and intercalation, respectively.21 We next attempted to measure the viscosity of
poly(dG)•poly(dC) and M. lysodeikticus (28% AT) DNA, but were unsuccessful due to
DNA precipitation in the presence of high concentrations of 3. Notwithstanding, when
the poly(dA)•poly(dT), alternating poly[(dA-dT)]2, and CT DNA (58% AT) slopes are
compared side by side, it can be inferred that CT DNA interacts with MB

141
monofunctional intercalation, and with compound 3 by a combination of three modes:
groove binding, and mono- and bisintercalation.
Figure 4.7. Viscometric measurements of CT DNA in the presence of compound 3 (, slope = 1.50 ± 0.130, R = 0.997) and MB (, slope = 0.962 ± 0.002, R = 0.987). The values were averaged at least over three trials. Error bars represent standard deviation.
0.95
1.00
1.05
1.10
1.15
0.00 0.01 0.02 0.03 0.04 0.05 0.06 0.07
(!/!
o)1
/3
r = [dye]/[DNA bp]

142
Figure 4.8. CD spectra recorded at 22 ºC of 10 mM sodium phosphate buffer pH 7.0 in the presence and absence of 50 µM bp poly(dA)•poly(dT) DNA or 12 µM of compound 3. Red dashed line: compound 3. Red solid line: poly(dA)•poly(dT) DNA. Black Solid line: compound 3 + poly(dA)•poly(dT) DNA.
Conclusion
In summary, we have synthesized a new DNA photocleaving agent (3) in which
two phenothiazine units are attached by an ethylenedipiperidine linker. In comparison to
the phenothiazine methylene blue, this compound absorbs light more strongly at longer
wavelengths, exhibits higher levels of photocleavage under near physiological conditions
of temperature and pH, and, as indicated by Tm data, associates more strongly with
double-helical DNA. Finally, to the best of our knowledge, compound 3 represents the
first example of a phenothiazine that binds to DNA through bisintercalation. Our future
research efforts will focus on obtaining high-resolution structural data that will aid in the
design of new and effective DNA intercalators. We envisage that phenothiazine-based
-60
-40
-20
0
20
40
60
240 320 400 480 560 640 720 800
wavelength (nm)
[!] x 1
0-4
(deg c
m2
dm
ol-1
)

143
compounds will represent attractive alternatives to porphyrins for use in phototherapeutic
applications.
Experimental Section
General Methods. Melting points were determined in a Stuart Scientific model
SMP10 apparatus. Infrared spectra were taken on an FT-IR Perkin Elmer Spectrum One
spectrophotometer. 1H and 13C NMR spectra were recorded at 300 and 75 MHz,
respectively, on a Varian Unity One instrument. Carbon and proton assignments for
compound 3 were based on HMQC experiments. Tetramethyl silane was utilized as an
internal reference. Elemental analyses (CHNS) were conducted on a Leco CHNS-932
automatic analyzer while iodine composition was performed by oxygen flask combustion
and by ion chromatography (Atlantic Microlabs, Inc. Norcross, GA). Electrospray
ionization (ESI) mass spectra were generated on a Micromass Q-Tof hybrid mass
spectrometer. Merck silica gel 60 (230-400 ASTM mesh) was employed for flash column
chromatography. UV-visible and CD spectra were recorded with a UV-1601 Shimadzu
spectrophotometer and a JASCO J-810 spectropolarimeter, respectively. Thermal melting
curves were generated using a Cary Bio 300 UV-Vis spectrophotometer .
Distilled, deionized water was utilized in the preparation of all buffers and
aqueous reactions. Chemicals were of the highest available purity and were used without
further purification. Methylene blue chloride (99.99% purity) was purchased from Fluka.
Allyl alcohol, Cesium carbonate, chloroform, dimethylamine (2 M solution in methanol),
DMF, dimethyl sulfate, ethidium bromide, 4,4’-ethylenedipiperidine dihydrochloride,
formic acid, iodine, 10H-phenothiazine, piperidine, potassium permanganate, sodium
azide, D-mannitol, sodium phosphate dibasic, and sodium phosphate monobasic were

144
obtained from the Aldrich Chemical Co. Transformation of Escherichia coli competent
cells (Stratagene, XL-blue) with pUC19 plasmid (Sigma) and growth of bacterial cultures
in Lauria-Bertani broth were performed according to standard laboratory procedures.22
The plasmid DNA was purified with a Qiagen Plasmid Mega Kit. The restriction
enzymes EcoRI and FspI were purchased from New England BioLabs. Ultra PureTM calf
thymus (Invitrogen Lot No. 15633-019, 10 mg/mL, average size ≤ 2000 bp) and C.
perfringens DNA (Sigma, Lot No. 024K4065, purity ratio A260/A280 = 1.9) were used
without purification. The DNA polymers poly(dA)•poly(dT) (average size ~6000 bp, Lot
No. GD0276), and poly[(dA-dT)]2 (average size ~5183 bp, Lot No. GF0106) were
obtained as lyophilized powders from Amersham Biosciences. They were dissolved in 10
mM sodium phosphate pH 7.0 and were used without further purification. The
concentrations of all DNA solutions were determined by UV-Vis spectrophotometry
using the following extinction coefficients in units of M-1 (bp) cm-1: calf thymus DNA,
ε260 = 12,824; C. perfringens DNA, ε260 = 12,476; poly(dA)•poly(dT), ε260 = 12,000; and
poly[(dA-dT)]2, ε262 = 13,200.
Phenothiazin-5-ium tetraiodide hydrate (1). A solution of 10H-phenothiazine
(0.566 g, 2.84 mmol) in 20 mL of chloroform was stirred at 5 ºC and iodine (2.16 g, 8.51
mmol) dissolved in 50 mL of chloroform was added drop-wise over 1 h. The reaction
mixture was stirred at 5 ºC for an additional h and the progress was monitored by silica
gel TLC using chloroform as the solvent. The precipitate from the reaction was then
filtered, washed with a copious amount of chloroform and was dried under high vacuum
overnight to afford 1.63 g (80% yield) of dark-blue solid 1; Rf = 0.09 (chloroform); M.p.
170 ºC (decomp.); 1H NMR (300 MHz, Acetone-d6): δ = 8.01 (m, 2H), 7.92 (m, 2H), 7.64

145
ppm (m, 4H); 13C NMR (75 MHz, Acetone-d6): δ = 153.58, 130.67, 129.47, 128.64,
125.50, 123.52 ppm; IR (film): n = 2967, 1558, 1467, 1440, 1311, 1233, 1131, 1067,
1023, 841, 705 cm-1. LRMS (ESI): calcd for C12H8NS [M+]: 198.0; found: 199.0 [M+H+]+.
3-(Dimethylamino)phenothiazin-5-ium triiodide (2). To a solution of
phenothiazin-5-ium tetraiodide hydrate (0.400 g, 0.553 mmol) in 20 mL of chloroform
was added a 2 M solution of dimethylamine in methanol (0.553 mL, 1.106 mmol) drop-
wise over 4 h. The reaction progress was monitored by silica gel TLC (3:7 10% aqueous
ammonium acetate/methanol, v/v). The resultant precipitate was filtered, washed with
chloroform and allowed to air dry. Product 2 (189 mg, 55% yield) was obtained as a
dark-blue solid; Rf = 0.28 (3:7 10% aqueous ammonium acetate/methanol, v/v); M.p. 144
– 145 ºC; 1H NMR (300 MHz, DMSO-d6): δ = 8.22 (dd, J = 8.0 Hz, J = 1.6 Hz, 1H, H-9),
8.17 (dd, J = 8.0 Hz, J = 1.6 Hz, 1H, H-6), 8.10 (d, J = 10 Hz, 1H, H-1), 8.04 (dd, J = 10
Hz, 1H, H-2), 8.00 (d, J = 2.4 Hz, 1H, H-4), 7.85 (m, 2H, H-7 and H-8), 3.64 and 3.60
ppm (2s, 6H, N(CH3)2); 13C NMR (75 MHz, DMSO-d6): δ = 156.09, 144.13, 139.81,
139.56, 138.03, 134.55, 133.22, 129.81, 126.27, 126.06, 125.84, 109.66, 43.35, 42.88
ppm; IR (film): ν = 2800, 1617, 1559, 1489, 1429, 1411, 1252, 1118, 1411, 1078, 887,
835, 772 cm-1; LRMS (ESI): calcd for C14H13N2S [M+]: 241; found: 241. Anal. Calcd for
C14H13N2SI3: C, 27.03; H, 2.11; N, 4.50; S, 5.15; I, 61.20. Found: C, 27.12; H, 1.97; N,
4.46; S, 5.23; I, 60.94.
N,N'-Bis[(7-dimethylamino)phenothiazin-5-ium-3-yl]-4,4'-
ethylenedipiperidine diiodide (3). To a solution of 2 (0.200 g, 0.322 mmol) in 20 mL of
DMF were added 4,4’-ethylenedipiperidine dihydrochloride (0.044 g, 0.161mmol) and
cesium carbonate (0.629 g, 1.931 mmol). The reaction was vigorously stirred at RT for
146
48 h and then concentrated under reduced pressure. The progress of the reaction was
monitored by silica gel TLC (9.5:0.5 dichloromethane/methanol, v/v). The resultant solid
was purified by flash column chromatography (3 cm column, 39 g silica gel) using
(9.5:0.5 dichloromethane/methanol, v/v) as the eluent. Then, two successive
recrystallizations from methanol afforded 81 mg (54% yield) of dark-blue solid 3; Rf =
0.2 (9.5:0.5 dichloromethane/methanol, v/v); M.p. > 300 ºC; 1H NMR (300 MHz,
CDCl3:CD3OD): δ = 7.95 (d, J = 9.6 Hz , 2H, H-1), 7.94 (d, J = 9.6 Hz , 2H, H-9), 7.48
(m, 4H, H-6 and H-8), 7.33 (dd, J = 9.6, 2.7 Hz, 2H, H-2), 7.26 (d, J = 2.7 Hz, 2H, H-4),
4.42 (d, J = 13.5 Hz, 4H, CH2-α), 3.43 (s, 12H, NCH3), 3.38 (m, overlap with CH3OH,
4H, CH2-α), 2.06 (d, J = 11.7 Hz, 4H, CH2-β), 1.81 (broad, 2H, CH), 1.37 ppm (m, 8H,
CH2-CH2 and CH2-β); 13C NMR (75 MHz, CDCl3:CD3OD): δ = 154.26 and 153.35 (C-3,
C-7), 139.16 and 138.66 (C-1, C-9), 136.41, 135.90, 135.79, and 134.78 (C4a, C5a, C9a
and C10a), 119.32 and 118.61 (C-2, C-8), 107.12 and 106.39 (C-4, C-6), 49.25 (C-α),
41.61 (NCH3), 35.82 (CH), 33.02 and 32.85 ppm (C-β, CH2-CH2); IR (film): ν = 2907,
1592, 1487, 1389, 1330, 1232, 1133, 1038, 969, 883, 825, 779 cm-1; HRMS (ESI): m/z
calcd for C40H46N6S2 [M+]: 674.3225; found: 337.1612 [M+/2].
UV-Visible Spectrophotometry. Extinction coefficients for compound 3 and
MB were determined using 500 µL solutions containing 1 to 10 µM of dye in the
presence and absence of 38 to 380 µM bp calf thymus DNA in 10 mM sodium phosphate
buffer pH 7.0. The solutions were pre-equilibrated for 12 h in the dark, after which
spectra were recorded in 1 cm quartz cuvettes at 22 ºC. The absorbance was then plotted
as a function of concentration and linear least square fits to these data yielded slopes
(KaleidaGraph version 3.6.4 software) that were averaged over three trials. Using the

147
procedure described above, extinction coefficients in the absence of calf thymus DNA
were also recorded in the presence of a final concentration of 1% sodium dodecyl sulfate
(w/v).
Photocleavage Experiments. Individual samples consisted of 38 µM bp pUC19
plasmid DNA and 1 µM of compound 3 or MB in 10 mM sodium phosphate buffer pH
7.0 (total volume 20 µL). The samples were pre-equilibrated in the dark for 12 h at 22 ºC,
after which they were kept in the dark or aerobically irradiated at 676, 700 or 710 nm for
10, 30, or 60 min at 22 ºC using a Photon Technology Inc. Model A1010 light supply
fitted with a 75 W xenon lamp and a monochromator with a grating (blazed at 500 nm,
1200 lines/mm, 20 nm slit width). After irradiation, cleavage products were
electrophoresed on a 1% nondenaturing agarose gel stained with ethidium bromide (0.5
µg/mL), visualized on a transilluminator set at 302 nm, photographed and scanned. The
amounts of supercoiled, nicked, and linear plasmid DNA were quantitated by
densitometry using ImageQuant version 5.2 software (Amersham Biosciences). In DNA
photocleavage as a function of concentration, reactions consisted of 10 to 0.0 µM
compound 3 or MB with 38 µM bp pUC19 plasmid DNA in 10 mM sodium phosphate
buffer pH 7.0 (total volume 20 µL). The samples were pre-equilibrated in the dark for 12
h at 22 ºC, after which they were kept in the dark or aerobically irradiated at 710 nm for
60 min. Photocleavage yields were calculated using the formula [(nicked DNA + linear
DNA)/total DNA] x 100. The density of supercoiled DNA was multiplied by a correction
factor of 1.22 to account for the decreased binding affinity of ethidium bromide to
supercoiled DNA as compared to the nicked and linear forms.

148
Inhibition of DNA Photocleavage. Immediately prior to irradiation, a final
concentration of 50 mM of sodium azide or of D-mannitol was added to individual 20 µL
reactions. Each consisted of 38 µM bp pUC19 plasmid DNA pre-equilibrated with 1 µM
of compound 3 or MB in 10 mM sodium phosphate buffer pH 7.0 in the dark for 12 h at
22 ºC. Control reactions containing 1 µM of compound 3 or MB, 38 µM bp pUC19
plasmid, and 10 mM sodium phosphate buffer pH 7.0 were run in the absence of
scavenger. The samples were then aerobically irradiated at 710 nm using a Photon
Technology Inc. light supply (Model A1010) fitted with a 75 W xenon lamp and
monochromator with a grating (blazed at 500 nm, 1200 lines/mm, 20 nm slit width) for
60 min at 22 ºC. Reaction products were resolved on a 1.0% nondenaturing agarose gel
and quantitated as described above. The percent inhibition of DNA photocleavage was
calculated as follows: [((% cleavage without scavenger) - (% cleavage with
scavenger))/(% cleavage without scavenger)] x 100.
DNA Photocleavage at Nucleotide Resolution. EcoRI linearized pUC19
plasmid was 3'-end-labeled using Sequenase™ Version 2.0 (USB Scientific) and
[35S]dATPαS (GE Healthcare) according to an established laboratory protocol.23
Unincorporated nucleotides were removed with a G-50 Sephadex spun column (Roche
Diagnostics). The DNA was then digested with FspI to produce a restriction fragment
138 bp in length, and resolved on a 2% agarose gel. The fragment was excised and DNA
was isolated using a QIAquick Gel Extraction Kit purchased from Qiagen. The purified
DNA was stored in a total volume of 400 µL of deionized, distilled water at -78 °C.
Typical photocleavage reactions contained 15 µM bp of the 138 bp DNA
fragment in 10 mM sodium phosphate buffer pH 7.0 or in 10 mM sodium phosphate

149
buffer pH 7.0, 5 µM 3 and MB (50 µL total volume). The reaction samples were pre-
equilibrated in the dark, 22 ºC for 2 hours and then were aerobically irradiated in a
ventilated Rayonet Photochemical Reactor (Southern New England Ultraviolet Co.) fitted
with twelve 575 nm lamps (spectral output 400-650 nm) for 60 min. The photolyzed
DNA was precipitated with 40 µg glycogen/2.5 volumes neat EtOH, and washed with
70% EtOH. A duplicate set of reactions was precipitated, dissolved in 100 µL of 1.0%
piperidine, heated at 90 °C for 30 min, and then lyophilized to dryness. Cleavage
products without and with piperidine treatment were dissolved in 4 µL of Sequenase™
Stop Solution (95% (v/v) deionized formamide, 10 mM EDTA, 0.1% (w/v) xylene
cyanol and 0.1% (w/v) bromophenol blue), denatured for 3 min at 95 °C, and resolved on
a 10.0% denaturing polyacrylamide gel adjacent to G, G+A, and T chemical sequencing
reactions. To determine yields, the gel was scanned with a Storm 860 PhosphoImager
(Molecular Dynamics). The resulting storage-phosphor autoradiogram was quantitated
using ImageQuant 5.2 software (Molecular Dynamics). The DNA sequencing reactions
were performed as previously described.23
Thermal Denaturation Studies. Individual 3 mL solutions containing 10 mM
sodium phosphate buffer pH 7.0 and 12.5 µM bp calf thymus DNA in the presence and
absence of 0.625 to 7.50 µM of compound 3 or MB in were placed in 3 mL (1 cm) quartz
cuvettes (Starna). Similarly, 12.5 µM bp C. perfringes DNA was utilized in the absence
and presence of 3.75 µM compound 3 or 3.75 µM MB. After the samples were
equilibrated in the dark for 12 h and 22 ºC, absorbance was monitored at 260 nm while
the DNA was denatured using a Peltier heat block programmed to increase the
temperature from 25 to 95 ºC at a rate of 0.5 ºC min-1. KaleidaGraph version 3.6.4
150
software was then used to approximate the first derivative of ΔA260/ΔT versus
temperature, where the Tm value corresponded to the maximum of each first derivative
plot.
Viscosity Assays. In a total volume of 1 mL, individual solutions containing 10
mM sodium phosphate buffer pH 7.0 and 200 µM bp of calf thymus DNA (average
length ≤ 2000 bp) in the absence and presence of 2 to 12 µM of compound 3 or MB were
pre-equilibrated for 12 h in the dark at 22 ºC. DNA viscosity was then measured in a
Cannon-Ubbelohde size 75 capillary viscometer immersed in a thermostated water bath
maintained at 25 ± 0.1 ºC. The flow times of the buffer, DNA in buffer, and dye-DNA in
buffer were measured with a stopwatch. The measurements were averaged over four
trials to an accuracy of + 0.2 s. After subtracting the averaged flow time of the buffer,
DNA (η0) and dye-DNA (η) averaged flow times were plotted as (η/ηo)1/3 versus the
molar ratio of dye to DNA bp.24 Slopes were generated by conducting linear least square
fits to these data (KaleidaGraph version 3.6.4 software). The viscosity measurements
containing poly(dA)•poly(dT) (average length ~6000 bp) and poly[(dA-dT)]2 (average
length ~5183 bp) were conducted exactly as described for calf thymus DNA except that
DNA concentrations were decreased to account for the longer average lengths of these
polymers as compared to calf thymus DNA. Accordingly, measurements were conducted
with 50 µM bp of each polymer and 0.5 to 3 µM of compound 3 or MB such that dye to
DNA bp molar ratios were consistent with the calf thymus DNA measurements. While
the conventional method for performing viscosity assays involves titration of the ligand
into a DNA solution inside the viscometer, here we report an alternative and efficient
technique that may be particularly useful for 3 as well as for other phenothiazines (e.g.,

151
1,9-dimethyl methylene blue and methylene blue) where pre-equilibration with DNA is
required to reduce ligand stacking associations in solution.25
Circular Dichroism Analysis. Samples consisted of 10 mM sodium phosphate
buffer pH 7.0 and 12 µM of compound 3 in the presence and absence of 50 µM bp
poly(dA)•poly(dT) DNA in a total volume of 500 µL. After equilibration in the dark for
12 h at 22 ºC, spectra were recorded from 800 to 200 nm at 22 ºC in a 0.5 cm quartz
cuvette using a scan rate of 100 nm/min and a time constant of 1 s. The spectra were
averaged over 4 acquisitions and were baseline-corrected to remove signals generated by
the buffer.
152
References
(1) (a) Dolmans, D. E. J. G. J.; Fukumura, D.; Jain, R. K. Nat. Rev. Cancer 2003, 3,
380-387; (b) Vrouenraets, M. B.; Visser, G. W. M.; Snow, G. B.; van Dongen, G.
A. M. S. Anticancer Res. 2003, 23, 505-522; (c) Huang, Z. Technol. Cancer Res.
Treat. 2005, 4, 283-293; (d) Nowis, D.; Makowski, M.; Stoklosa, T.; Legat, M.;
Issat, T.; Golab, J. Acta Biochim. Pol. 2005, 52, 339-352.
(2) (a) Boehncke, W-H.; Rück, A.; Naumann, J.; Sterry, W.; Kaufmann, R. Laser.
Surg. Med. 1996, 19, 451-457; (b) Stockert, J. C.; Juarranz, A.; Villanueva, A.;
Cañete, M. Cancer Chemother. Pharmacol. 1996, 39, 167-169; (c) Wainwright,
M.; Phoenix, D. A.; Burrow, S. M.; Waring, J. J. Chemother. 1999, 11, 61-68; (d)
Rice, L.; Wainwright, M.; Phoenix, D. A. J. Chemther. 2000, 12, 94-104.
(3) (a) Orth, K.; Russ, D.; Beck, G.; Rück, A.; Beger, H. G. Langenbeck. Arch. Surg.
1998, 383, 276-281; (b) Orth, K.; Beck, G.; Genze, F.; Rück, A. J. Photochem.
Photobiol. B. 2000, 57, 186-192.
(4) Orth, K.; Rück, A.; Stanescu, A.; Beger, H. G. Lancet 1995, 345, 519-520.
(5) (a) Wainwright, M.; Phoenix, D. A.; Laycock, S. L.; Wareing, D. R. A.; Wright,
P. A. FEMS Microbiol. Lett. 1998, 160, 177-181; (b) Wainwright, M.; Phoenix,
D. A.; Gaskell, M.; Marshall, B. J. Antimicrob. Chemother. 1999, 44, 823-825.
(6) (a) Owada, T.; Yamada, Y.; Abe, H.; Hirayama, J.; Ikeda, H.; Sekguchi, S.;
Ikebushi, K. J. Med. Virol. 2000, 62, 421-425; (b) Floyd, R. A.; Schneider, J. E.
Jr.; Dittmer, D. P. Antiviral Res. 2004, 61, 141-151.
(7) (a) Fukui, Y.; Yamakawa, T.; Taniki, T.; Numoto, S.; Miki, H.; Monden, Y.
Cancer 2001, 92, 2868-2874; (b) Eldrageely, K.; Vargas, M. P.; Khalkhali, I.;

153
Venegas, R.; Burla, M.; Gonzalez, K. D.; Vargas, H. I. Am. Surg. 2004, 70, 872-
875.
(8) Harris, F.; Chatfield, L. K.; Phoenix, D. A. Curr. Drug Targets 2005, 6, 615-627.
(9) (a) Rück, A.; Köllner, T.; Dietrich, W. S.; Schneckenburger, H. J. Photochem.
Photobiol. B. 1992, 12, 403-412; (b) Noodt, B. B.; Rodal, G. H.; Wainwright, M.;
Peng, Q.; Horobin, R.; Nesland, J. M.; Berg, K. Int. J. Cancer 1998, 75, 941-948.
(10) Harris, R. G.; Wells, J. D.; Johnson, B. B. Colloids Surf. A Physiochem. Eng. Asp.
2001, 180, 131-140.
(11) Tuite, E. M.; Kelly, J. M. Biopolymers 1995, 35, 419-433.
(12) Tuite, E. M.; Kelly, J. M. J. Photochem. Photobiol. B. 1993, 21, 103-124.
(13) Strekowski, L.; Hou, D-F.; Wydra, R. L. J. Heterocyclic Chem. 1993, 30, 1693-
1695.
(14) (a) Leventis, N.; Chen, M.; Sotiriou-Leventis, C. Tetrahedron 1997, 53, 10083-
10092; (b) Mellish, K. J.; Cox, R. D.; Vernon, D. I.; Griffiths, J.; Brown, S. B.
Photochem. Photobiol. 2002, 75, 392-397.
(15) Armitage, B. Chem. Rev. 1998, 98, 1171-1200.
(16) Devasagayam, T. P.; Steenken, S.; Obendorf, M. S.; Schulz, W. A.; Sies, H.
Biochemistry 1991, 30, 6283-6289.
(17) Suh, D.; Chaires, J. B. Bioorg. Med. Chem. 1995, 3, 723-728.
(18) (a) Drummond, D. S.; Pritchard, N. J.; Simpson-Gildemeister, V. F. W.;
Peacocke, A. R. Biopolymers 1966, 4, 971-987; (b) Kubota, Y.; Hashimoto, K.;
Fujita, K.; Wakita, M.; Miyanohana, E.; Fujisaki, Y. Biochim. Biophys. Acta
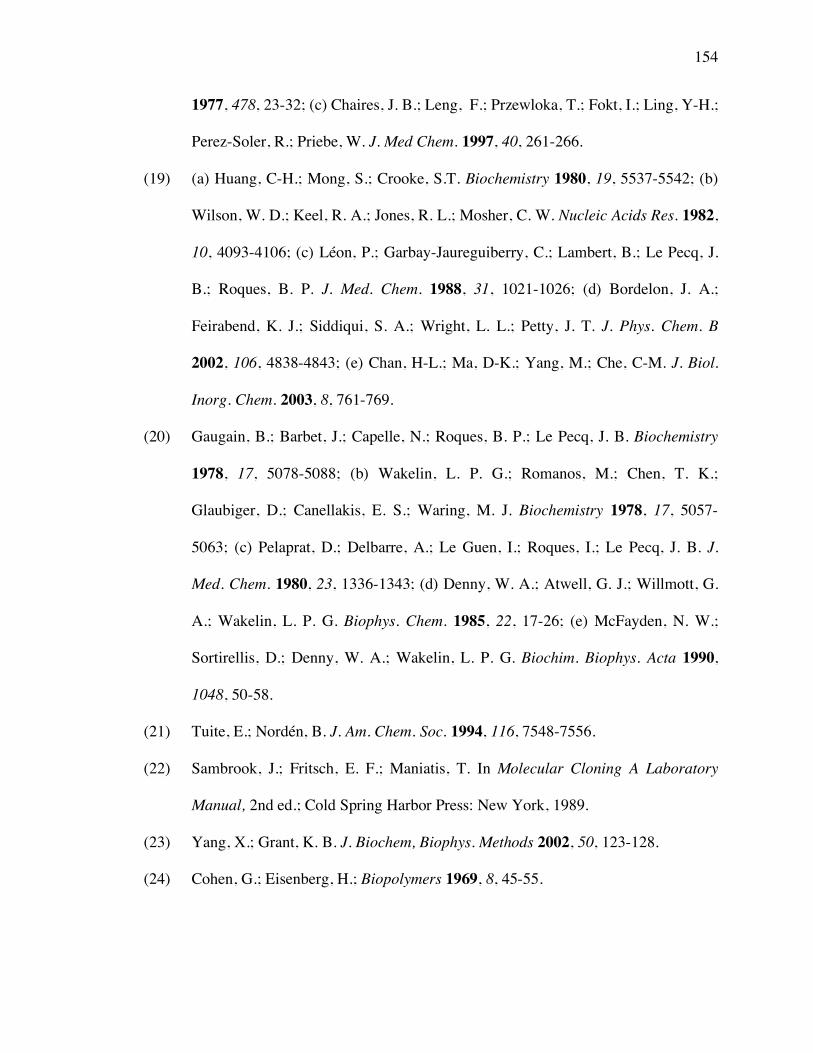
154
1977, 478, 23-32; (c) Chaires, J. B.; Leng, F.; Przewloka, T.; Fokt, I.; Ling, Y-H.;
Perez-Soler, R.; Priebe, W. J. Med Chem. 1997, 40, 261-266.
(19) (a) Huang, C-H.; Mong, S.; Crooke, S.T. Biochemistry 1980, 19, 5537-5542; (b)
Wilson, W. D.; Keel, R. A.; Jones, R. L.; Mosher, C. W. Nucleic Acids Res. 1982,
10, 4093-4106; (c) Léon, P.; Garbay-Jaureguiberry, C.; Lambert, B.; Le Pecq, J.
B.; Roques, B. P. J. Med. Chem. 1988, 31, 1021-1026; (d) Bordelon, J. A.;
Feirabend, K. J.; Siddiqui, S. A.; Wright, L. L.; Petty, J. T. J. Phys. Chem. B
2002, 106, 4838-4843; (e) Chan, H-L.; Ma, D-K.; Yang, M.; Che, C-M. J. Biol.
Inorg. Chem. 2003, 8, 761-769.
(20) Gaugain, B.; Barbet, J.; Capelle, N.; Roques, B. P.; Le Pecq, J. B. Biochemistry
1978, 17, 5078-5088; (b) Wakelin, L. P. G.; Romanos, M.; Chen, T. K.;
Glaubiger, D.; Canellakis, E. S.; Waring, M. J. Biochemistry 1978, 17, 5057-
5063; (c) Pelaprat, D.; Delbarre, A.; Le Guen, I.; Roques, I.; Le Pecq, J. B. J.
Med. Chem. 1980, 23, 1336-1343; (d) Denny, W. A.; Atwell, G. J.; Willmott, G.
A.; Wakelin, L. P. G. Biophys. Chem. 1985, 22, 17-26; (e) McFayden, N. W.;
Sortirellis, D.; Denny, W. A.; Wakelin, L. P. G. Biochim. Biophys. Acta 1990,
1048, 50-58.
(21) Tuite, E.; Nordén, B. J. Am. Chem. Soc. 1994, 116, 7548-7556.
(22) Sambrook, J.; Fritsch, E. F.; Maniatis, T. In Molecular Cloning A Laboratory
Manual, 2nd ed.; Cold Spring Harbor Press: New York, 1989.
(23) Yang, X.; Grant, K. B. J. Biochem, Biophys. Methods 2002, 50, 123-128.
(24) Cohen, G.; Eisenberg, H.; Biopolymers 1969, 8, 45-55.
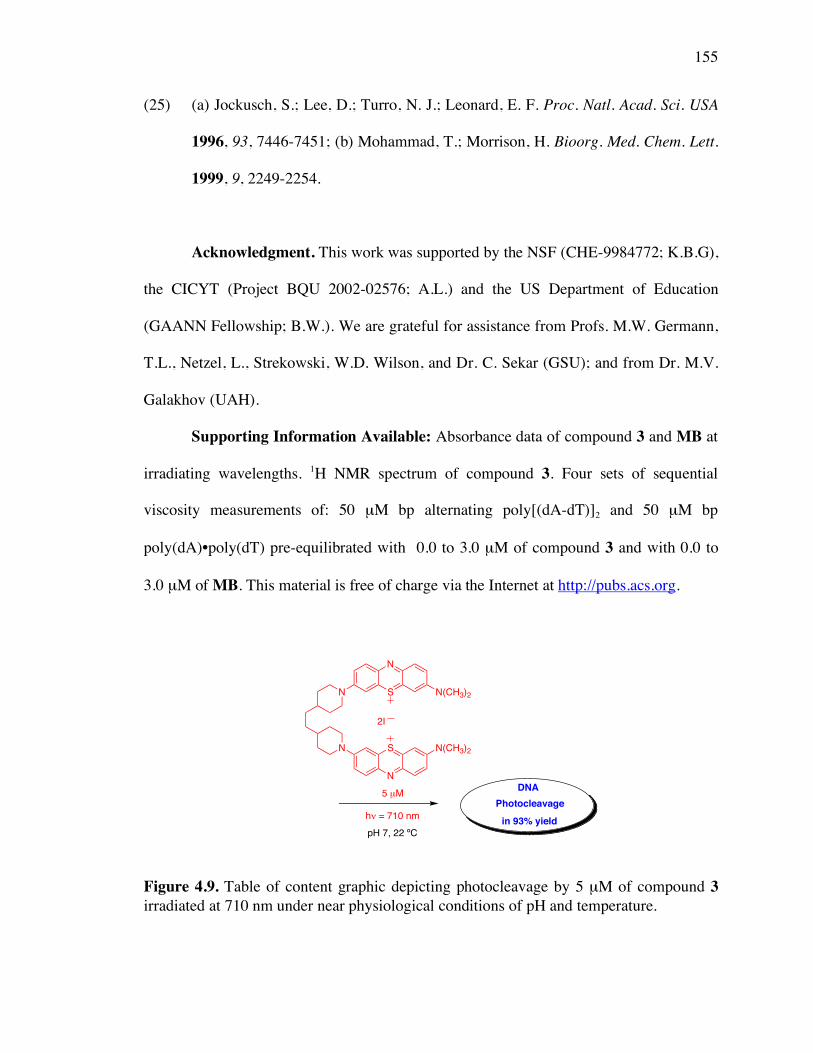
155
(25) (a) Jockusch, S.; Lee, D.; Turro, N. J.; Leonard, E. F. Proc. Natl. Acad. Sci. USA
1996, 93, 7446-7451; (b) Mohammad, T.; Morrison, H. Bioorg. Med. Chem. Lett.
1999, 9, 2249-2254.
Acknowledgment. This work was supported by the NSF (CHE-9984772; K.B.G),
the CICYT (Project BQU 2002-02576; A.L.) and the US Department of Education
(GAANN Fellowship; B.W.). We are grateful for assistance from Profs. M.W. Germann,
T.L., Netzel, L., Strekowski, W.D. Wilson, and Dr. C. Sekar (GSU); and from Dr. M.V.
Galakhov (UAH).
Supporting Information Available: Absorbance data of compound 3 and MB at
irradiating wavelengths. 1H NMR spectrum of compound 3. Four sets of sequential
viscosity measurements of: 50 µM bp alternating poly[(dA-dT)]2 and 50 µM bp
poly(dA)•poly(dT) pre-equilibrated with 0.0 to 3.0 µM of compound 3 and with 0.0 to
3.0 µM of MB. This material is free of charge via the Internet at http://pubs.acs.org.
Figure 4.9. Table of content graphic depicting photocleavage by 5 µM of compound 3 irradiated at 710 nm under near physiological conditions of pH and temperature.
5 µM
h! = 710 nm
Photocleavage
pH 7, 22 ºC
in 93% yield
DNA
S
N
N N(CH3)2
N
N
S N(CH3)2
2I

156
Supporting Information
Table 4.S1. Absorbance Data at 10 µM of Dyea
compound 3
MB
Ratio
λ max (nm)
680
674
NA
Abs 676 nm
0.8131
0.5091
1.6
Abs 700 nm
0.5182
0.1490
3.5
Abs 710 nm
0.2498
0.0515
5.0
a UV-visible absorbance of 10 µM of dye pre-equilibrated with 380 µM bp of calf thymus DNA in 10 mM sodium phosphate buffer pH 7.0 for 12 h at 22 ºC. Ratio = Abs 3/Abs MB. NA = not applicable.
Table 4.S2. Absorbance Data at 1 µM of Dyea
compound 3
MB
Ratio
λ max (nm)
680
672
NA
Abs 676 nm
0.0806
0.0522
1.5
Abs 700 nm
0.0472
0.0144
3.3
Abs 710 nm
0.0232
0.0046
5.0
a UV-visible absorbance data of 1 µM of dye pre-equilibrated with 38 µM bp of calf thymus DNA in 10 mM sodium phosphate buffer pH 7.0 for 12 h at 22 ºC. Ratio = Abs 3/Abs MB. NA = not applicable.

157
Figure 4.S1. Proton NMR of compound 3, (300 MHz, CDCl3:CD3OD): δ = 7.95 (d, J = 9.6 Hz , 2H, H-1), 7.94 (d, J = 9.6 Hz , 2H, H-9), 7.48 (m, 4H, H-6 and H-8), 7.33 (dd, J = 9.6, 2.7 Hz, 2H, H-2), 7.26 (d, J = 2.7 Hz, 2H, H-4), 4.42 (d, J = 13.5 Hz, 4H, CH2-α), 3.43 (s, 12H, NCH3), 3.38 (m, overlap with CH3OH, 4H, CH2-α), 2.06 (d, J = 11.7 Hz, 4H, CH2-β), 1.81 (broad, 2H, CH), 1.37 ppm (m, 8H, CH2-CH2 and CH2-β).
3
S
N
N N(CH3)2
N
N
S N(CH3)2
2I
αβ
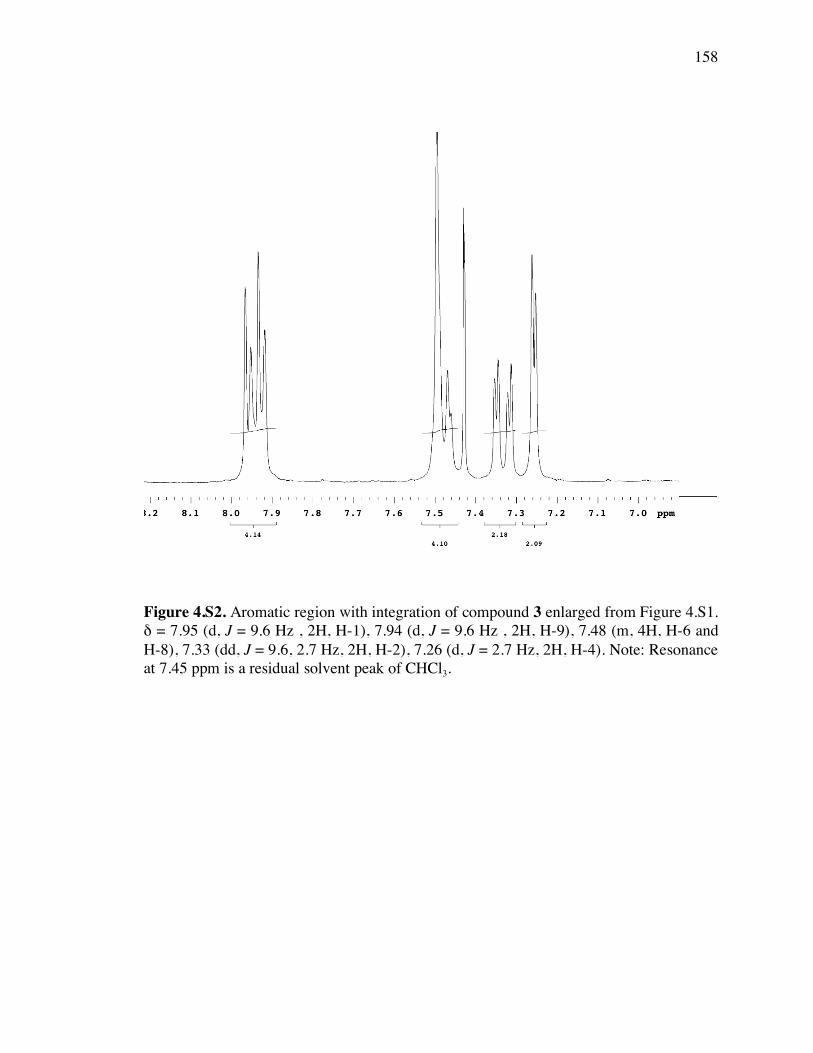
158
Figure 4.S2. Aromatic region with integration of compound 3 enlarged from Figure 4.S1. δ = 7.95 (d, J = 9.6 Hz , 2H, H-1), 7.94 (d, J = 9.6 Hz , 2H, H-9), 7.48 (m, 4H, H-6 and H-8), 7.33 (dd, J = 9.6, 2.7 Hz, 2H, H-2), 7.26 (d, J = 2.7 Hz, 2H, H-4). Note: Resonance at 7.45 ppm is a residual solvent peak of CHCl3.
159
Figure 4.S3. Aliphatic region with integration of compound 3 enlarged from Figure 4.S1. Note: there is overlap with CH3OH resonances and CH2-α at 3.38 ppm. δ = 4.42 (d, J = 13.5 Hz, 4H, CH2-α), 3.43 (s, 12H, NCH3), 3.38 (m, overlap with CH3OH, 4H, CH2-α), 2.06 (d, J = 11.7 Hz, 4H, CH2-β), 1.81 (broad, 2H, CH), 1.37 ppm (m, 8H, CH2-CH2 and CH2-β).
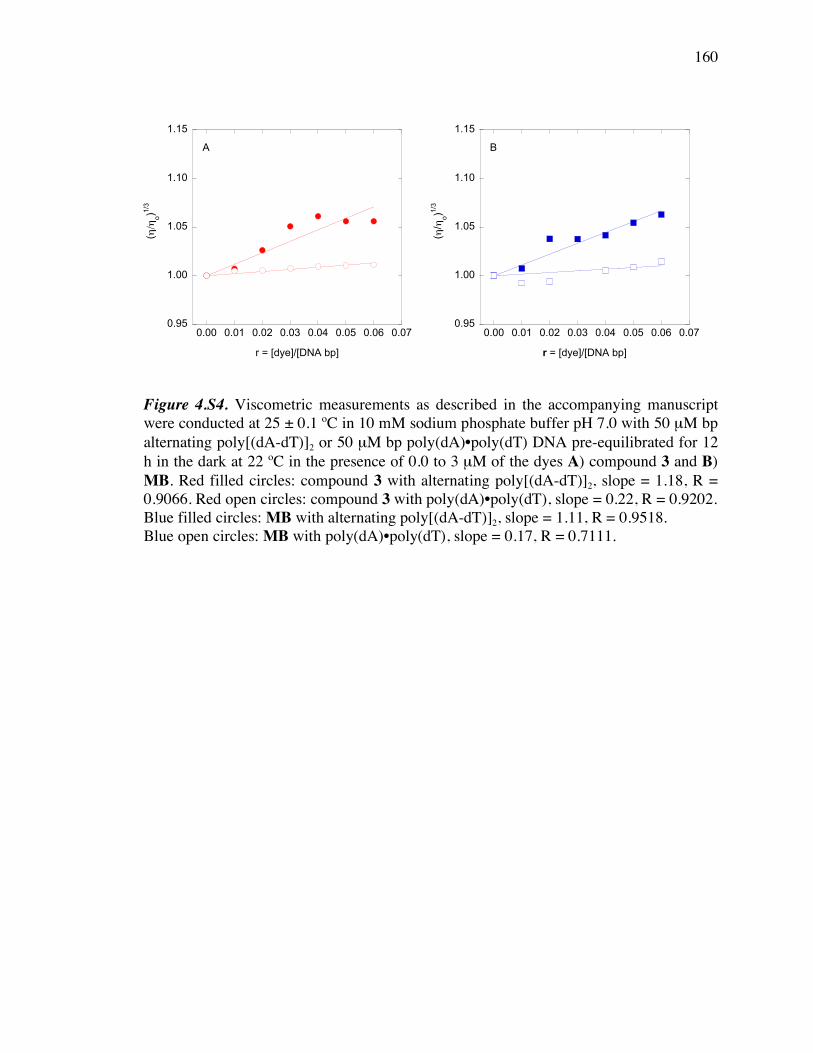
160
Figure 4.S4. Viscometric measurements as described in the accompanying manuscript were conducted at 25 ± 0.1 ºC in 10 mM sodium phosphate buffer pH 7.0 with 50 µM bp alternating poly[(dA-dT)]2 or 50 µM bp poly(dA)•poly(dT) DNA pre-equilibrated for 12 h in the dark at 22 ºC in the presence of 0.0 to 3 µM of the dyes A) compound 3 and B) MB. Red filled circles: compound 3 with alternating poly[(dA-dT)]2, slope = 1.18, R = 0.9066. Red open circles: compound 3 with poly(dA)•poly(dT), slope = 0.22, R = 0.9202. Blue filled circles: MB with alternating poly[(dA-dT)]2, slope = 1.11, R = 0.9518. Blue open circles: MB with poly(dA)•poly(dT), slope = 0.17, R = 0.7111.
0.95
1.00
1.05
1.10
1.15
0.00 0.01 0.02 0.03 0.04 0.05 0.06 0.07
(!/!
o)1
/3A
r = [dye]/[DNA bp]
0.95
1.00
1.05
1.10
1.15
0.00 0.01 0.02 0.03 0.04 0.05 0.06 0.07
(!/!
o)1
/3
B
r = [dye]/[DNA bp]
161
CHAPTER V
Syntheses and DNA Photocleavage by Phenothiazinium-Piperazinexylene
Intercalators
(The data presented in this chapter will be submitted by Wilson, B.; Fernández, M.-J.; Lorente, A.; Grant, K. B. to a peer-reviewed chemistry journal. The contributions to this project by the author of this dissertation were as follows: design and synthesis of photonucleases 5 and 6; conception and execution of all biological, biophysical, and photochemical experiments; and authorship of the original manuscript. Drs. Fernández and Lorente were instrumental in directing the strategies developed for the synthesis of compounds 5 and 6.)
Abstract
Two photonucleases incorporating one phenothiazinium ring with a bis-
piperazinexylene substituent (compound 5) or the same bis-piperazinexylene as a linker
centrally attached to two phenothiazinium rings (compound 6) were designed,
synthesized and evaluated as DNA photocleaving agents. In reactions employing 10 µM
to 0.25 µM of compound 5 or 6, irradiation with visible light (400-650 nm) produced
enhanced cleavage yields of plasmid DNA in a concentration dependent manner under
near physiological conditions of pH and temperature (pH 7.0, 22 ºC). Thermal melting
assays showed that compounds 5 and 6 increased the Tm of calf thymus DNA by 17 ºC
and 19 ºC, respectively. Viscosity measurements revealed that both compounds were
bound to DNA as monofunctional intercalators.
Introduction
Phenothiazines are basic dyes that possess redox properties and have been
investigated as both potential electrophore probes in supramolecular assemblies1 and as
components in photogalvanic systems for potential solar energy conversion.2 In

162
biological systems, this chromophore has been shown to interact with DNA primarily
through intercalation. Additionally, phenothiazines are involved in photosensitization
reactions and have demonstrated efficient photooxidative damage to DNA as well as to
other biomolecules.3 In this regard, the phenothiazines have been attracting considerable
attention as potential photodynamic therapy agents due to their absorption of light within
the therapeutic window for PDT (600-800 nm)4a and to the low toxicity of the
chromophore in human cells.4b,c Accordingly, 1,9-dimethyl methylene blue (λmax = 648
nm, methanol)5b and 2,8-dimethyl methylene blue (λmax = 630 nm, methanol)5b have
demonstrated efficient photoactivity against several tumor cell lines.4b, 5 Moreover,
phenothiazines have also exhibited the in vitro photoinactivation of nosocomial bacterial6
and viral7 pathogens.
In the present study, we describe the syntheses and characterization of 7-
dimethylamino-3-(1,1’-[1,4-phenylenebis(methylene)bispiperazine])phenothiazin-5-ium
iodide (5) and N,N’-bis[(7-dimethylamino)phenothiazin-5-ium-3-yl]-1,1’-[1,4-
phenylenebis(methylene)bispiperazine] diiodide (6). Additionally, we evaluate the DNA
photocleavage efficiencies, access the DNA binding affinity, and determine the DNA
binding modes of the two compounds.
We exploited several design elements in the development of compounds 5 and 6.
The phenothiazine chromophore was selected due to its intercalative DNA binding
association and absorption of light at longer wavelengths (> 600 nm). We reasoned that
by incorporating this chromophore, DNA photocleavage might be effectively enhanced at
longer wavelengths. In addition, bis-piperazinexylene (4) was employed as a substituent
or as a linker to effect light absorption properties (electron-donating species) and to

163
potentially enhance DNA binding and duplex stability. DNA intercalating chromophores
that possess xylene motifs and/or six member rings (e.g., piperidines, sugars) have been
shown to impart additional duplex stability through van der Waals contacts within the
grooves and hydrogen bonding.8 Furthermore, the structural composition (one
intercalating ring and a potential groove binding substituent versus two intercalating
molecules) was intentionally included in the design rationale to evaluate DNA
photocleavage and binding affinity as function of binding mode.
Results and Discussion
Synthesis. Precursor phenothiazin-5-ium tetraiodide hydrate (1) and 3-
(dimethylamino)phenothiazin-5-ium triodide (2) salts (Scheme 5.1) were prepared
according to a published literature protocol.9 In the case of compound 2, chloroform was
employed as the solvent in the reaction instead of methanol. Then, compound 3 was
prepared as described by McConnaghie et al. (Scheme 5.2).10 Although compound 3 was
previously hydrolyzed under acidic conditions to afford 4,10 we found that bis-
piperazinexylene 4 was obtained more efficiently under basic conditions (Scheme 5.2).
Under acidic conditions, we obtained mixtures of starting material and product even after
employing longer refluxing times (48 h).
After preparing the precursor chromophore 2 and bis-piperazinexylene 4, our first
goal was to synthesize compound 6. We envisioned that this transformation might require
more effort, since two aromatic nucleophilic additions (compound 6) versus one aromatic
nucleophilic addition (compound 5) would be needed. Moreover, several syntheses of
3,7-disubstituted phenothiazin-5-ium salts have appeared in the literature,9, 11 while to the
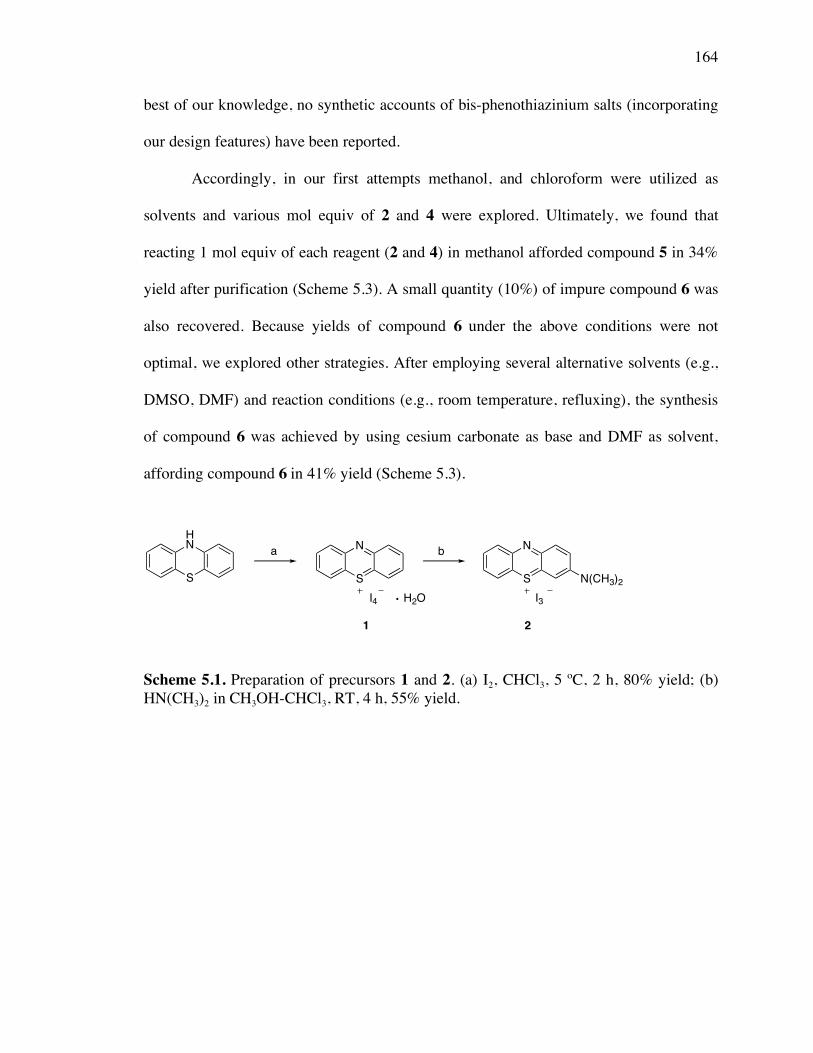
164
best of our knowledge, no synthetic accounts of bis-phenothiazinium salts (incorporating
our design features) have been reported.
Accordingly, in our first attempts methanol, and chloroform were utilized as
solvents and various mol equiv of 2 and 4 were explored. Ultimately, we found that
reacting 1 mol equiv of each reagent (2 and 4) in methanol afforded compound 5 in 34%
yield after purification (Scheme 5.3). A small quantity (10%) of impure compound 6 was
also recovered. Because yields of compound 6 under the above conditions were not
optimal, we explored other strategies. After employing several alternative solvents (e.g.,
DMSO, DMF) and reaction conditions (e.g., room temperature, refluxing), the synthesis
of compound 6 was achieved by using cesium carbonate as base and DMF as solvent,
affording compound 6 in 41% yield (Scheme 5.3).
Scheme 5.1. Preparation of precursors 1 and 2. (a) I2, CHCl3, 5 ºC, 2 h, 80% yield; (b) HN(CH3)2 in CH3OH-CHCl3, RT, 4 h, 55% yield.
S
HN
S
N
I4 H2O
S
N
I3
N(CH3)2
a b
1 2

165
Scheme 5.2. Preparation of 3 and 4. (a) K2CO3, CH3OH, reflux, 24 h, 75% yield; (b) KOH, EtOH, H2O, reflux, 24 h, 78% yield.
Scheme 5.3. Synthesis of new compounds 5 and 6. (a) CH3OH, RT, 72 h, 34% yield; (b) Cs2CO3, DMF, RT, 48 h, 41% yield.
2 4
N
N
N
N
S
N
N(CH3)2
2 l
N
N
N
N
S
N
N
S
N(CH3)2
N(CH3)2
l
a b
5 6
H
1
46
89
2
N
N
N
N
N
N
N
N
N
N
Br
Br
a b
3 4
H
O
H
O
H
O
H
H
H
166
UV-Visible Spectrophotometry. The absorption spectra of 10 µM compound 5
and 6 (Fig. 5.1) were recorded in 10 mM sodium phosphate buffer pH 7.0 at 22 ºC. Under
these conditions, the λmax observed for 5 and 6 were 662 nm and 580 nm, respectively.
Because phenothiazines are known to self-associate in aqueous solutions,12 the spectra of
5 and 6 were recorded after the addition of 1.0% (w/v) sodium dodecyl sulfate (SDS) as
well as after the addition of 380 µM bp calf thymus DNA (10 mM sodium phosphate
buffer pH 7.0 at 22 ºC). In the case of DNA, the solutions were allowed to pre-equilibrate
for 12 h in the dark at 22 ºC prior to the measurements.
The absorbance spectra of compounds 5 and 6 in the presence of SDS and calf
thymus DNA are shown in Figure 5.1. In the presence of 1.0% SDS, the maximal
absorbances for 10 µM 5 and 6 are 660 nm (ε = 5.81 x 10⁴ M-1 cm-1) and 662 nm (ε =
1.46 x 10⁵ M-1 cm-1), respectively. Upon the addition of calf thymus DNA, the respective
λmax values for compounds 5 and 6 are 665 nm (ε = 3.66 x 10⁴ M-1 (bp) cm-1) and 665 nm
(7.80 x 10⁴ M-1 (bp) cm-1). It is evident from the data that compound 5 exhibits
bathochromicity and hypochromicity in the presence of DNA. In the case of compound 6,
we observe significant disruption of intramolecular self-association upon the addition of
DNA as well as bathochromicity. These observations indicate that both compounds
interact with DNA. Additionally, the DNA-bound phenothiazines exhibit maximal
absorbances greater than 600 nm.

167
Figure 5.1. UV-visible spectra of A) compound 5 and B) compound 6 recorded at 22 ºC in 10 mM sodium phosphate buffer pH 7.0 with 10 µΜ compound 5 (line with squares) or with 6 (line with filled circles) and in the presence of 380 µΜ bp calf thymus DNA (solid line) or 1.0% sodium dodecyl sulfate (w/v) (dashed line). The samples containing DNA were pre-equilibrated for 12 h in the dark at 22 ºC. ND = not determined due to aggregation in buffer.
Table 5.1. Absorbance Dataa
compound λmax (nm)
ε x 104 (M-1 cm-1)
ε x 104 (M-1(bp) cm-1)
5 662
615
4.56 na
6.43 5 + 1% SDS 660 5.81 na
5 + DNA 665 na 3.66
6 580 nd na
6 + 1% SDS 662 14.6 na
6 + DNA 665 na 7.80
a Extinction coefficients for compound 5 and 6 were determined in 10 mM sodium phosphate buffer pH 7.0 using solutions containing 1 to 10 µM of dye in the presence and absence of 1% sodium dodecyl sulfate (w/v) or 38 to 380 µM bp calf thymus DNA. The samples containing DNA were pre-equilibrated for 12 h in the dark at 22 ºC. na = not applicable; nd = not determined due to aggregation in buffer.
0.00
0.25
0.50
0.75
1.00
1.25
1.50
400 450 500 550 600 650 700 750 800
Ab
s
Wavelength (nm)
A) compound 5A) compound 5
0.00
0.25
0.50
0.75
1.00
1.25
1.50
400 450 500 550 600 650 700 750 800
Ab
s
Wavelength (nm)
B) compound 6
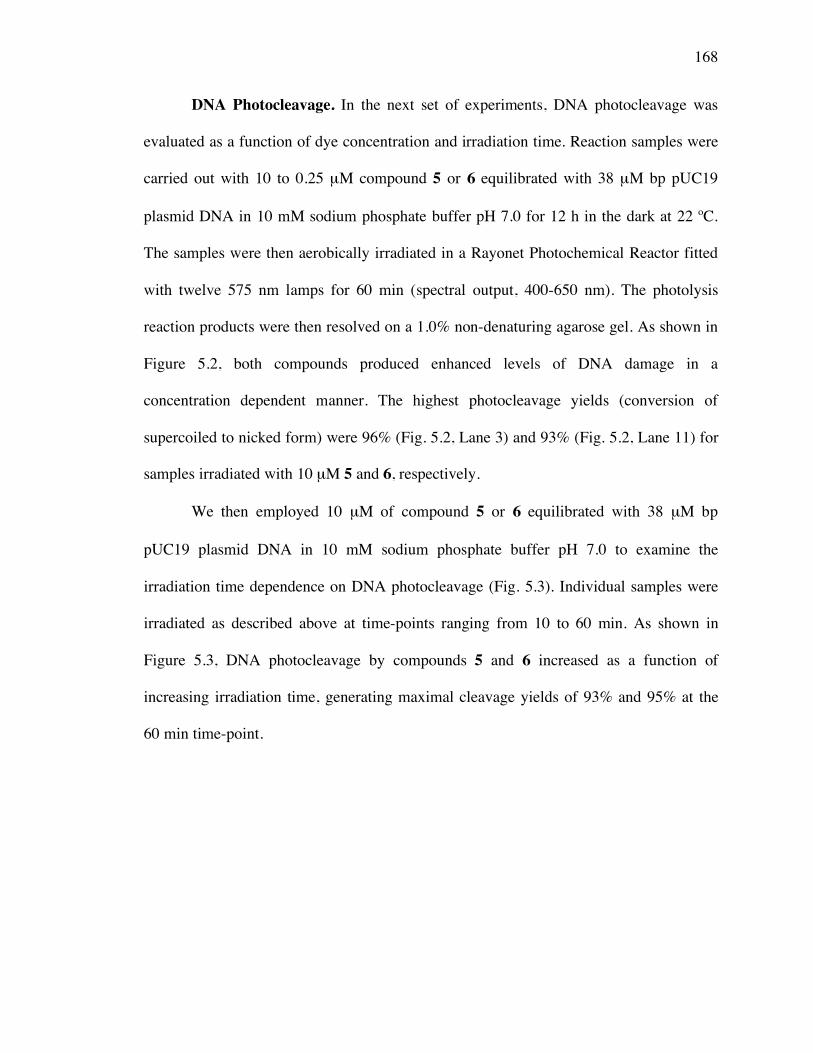
168
DNA Photocleavage. In the next set of experiments, DNA photocleavage was
evaluated as a function of dye concentration and irradiation time. Reaction samples were
carried out with 10 to 0.25 µM compound 5 or 6 equilibrated with 38 µM bp pUC19
plasmid DNA in 10 mM sodium phosphate buffer pH 7.0 for 12 h in the dark at 22 ºC.
The samples were then aerobically irradiated in a Rayonet Photochemical Reactor fitted
with twelve 575 nm lamps for 60 min (spectral output, 400-650 nm). The photolysis
reaction products were then resolved on a 1.0% non-denaturing agarose gel. As shown in
Figure 5.2, both compounds produced enhanced levels of DNA damage in a
concentration dependent manner. The highest photocleavage yields (conversion of
supercoiled to nicked form) were 96% (Fig. 5.2, Lane 3) and 93% (Fig. 5.2, Lane 11) for
samples irradiated with 10 µM 5 and 6, respectively.
We then employed 10 µM of compound 5 or 6 equilibrated with 38 µM bp
pUC19 plasmid DNA in 10 mM sodium phosphate buffer pH 7.0 to examine the
irradiation time dependence on DNA photocleavage (Fig. 5.3). Individual samples were
irradiated as described above at time-points ranging from 10 to 60 min. As shown in
Figure 5.3, DNA photocleavage by compounds 5 and 6 increased as a function of
increasing irradiation time, generating maximal cleavage yields of 93% and 95% at the
60 min time-point.

169
Figure 5.2. Photograph of a 1.0% non-denaturing agarose gel showing photocleavage of pUC19 plasmid DNA. Samples contained 10 mM sodium phosphate buffer pH 7.0 and 38 µM bp DNA in the presence and absence of dye. A) compound 5 and B) compound 6. After pre-equilibrated for 12 h in the dark at 22 ºC, the samples were aerobically irradiated in a Rayonet Photochemical reactor fitted with twelve 575 nm lamps for 60 min at 22 ºC. Lanes 1 and 9: DNA controls (no dye). Lanes 3 to 8: 10 to 0.25 µM compound 5. Lanes 11 to 16: 10 to 0.25 µM compound 6. Lanes 2 and 10: 10 µM 5 and 10 µM 6 (no hν). Abbreviations: N = nicked; S = supercoiled.
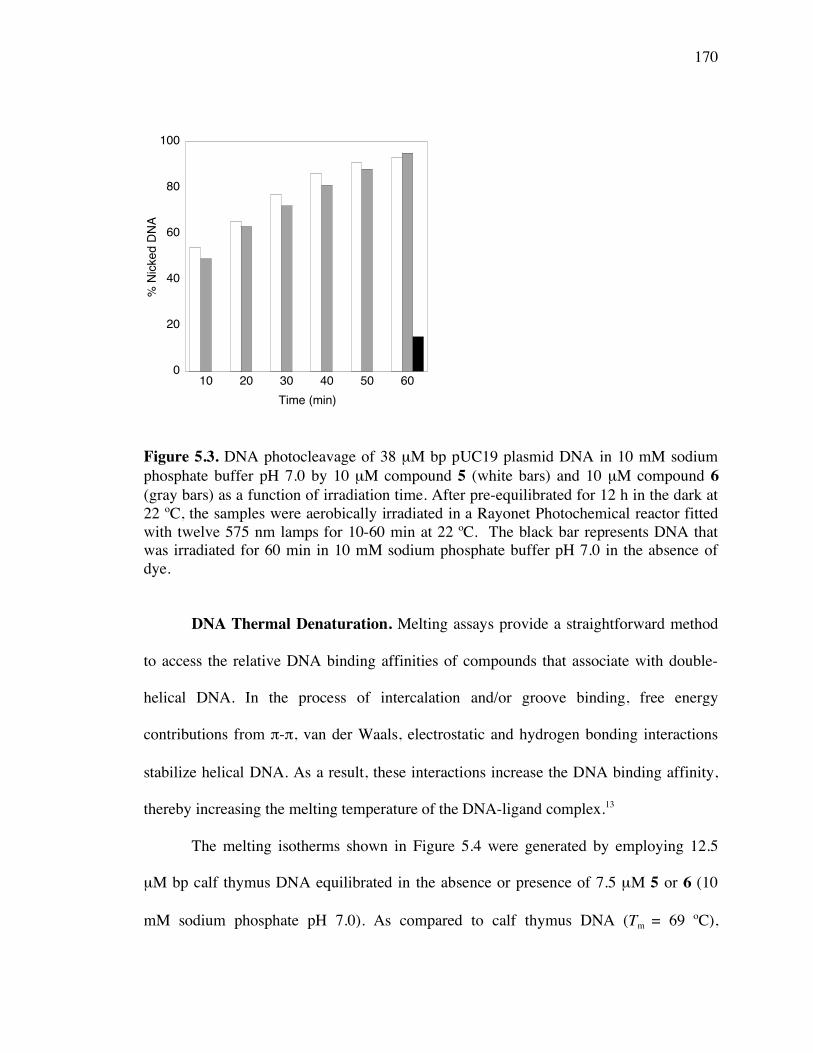
170
Figure 5.3. DNA photocleavage of 38 µM bp pUC19 plasmid DNA in 10 mM sodium phosphate buffer pH 7.0 by 10 µM compound 5 (white bars) and 10 µM compound 6 (gray bars) as a function of irradiation time. After pre-equilibrated for 12 h in the dark at 22 ºC, the samples were aerobically irradiated in a Rayonet Photochemical reactor fitted with twelve 575 nm lamps for 10-60 min at 22 ºC. The black bar represents DNA that was irradiated for 60 min in 10 mM sodium phosphate buffer pH 7.0 in the absence of dye.
DNA Thermal Denaturation. Melting assays provide a straightforward method
to access the relative DNA binding affinities of compounds that associate with double-
helical DNA. In the process of intercalation and/or groove binding, free energy
contributions from π-π, van der Waals, electrostatic and hydrogen bonding interactions
stabilize helical DNA. As a result, these interactions increase the DNA binding affinity,
thereby increasing the melting temperature of the DNA-ligand complex.13
The melting isotherms shown in Figure 5.4 were generated by employing 12.5
µM bp calf thymus DNA equilibrated in the absence or presence of 7.5 µM 5 or 6 (10
mM sodium phosphate pH 7.0). As compared to calf thymus DNA (Tm = 69 ºC),
0
20
40
60
80
100
10 20 30 40 50 60
% N
icke
d D
NA
Time (min)
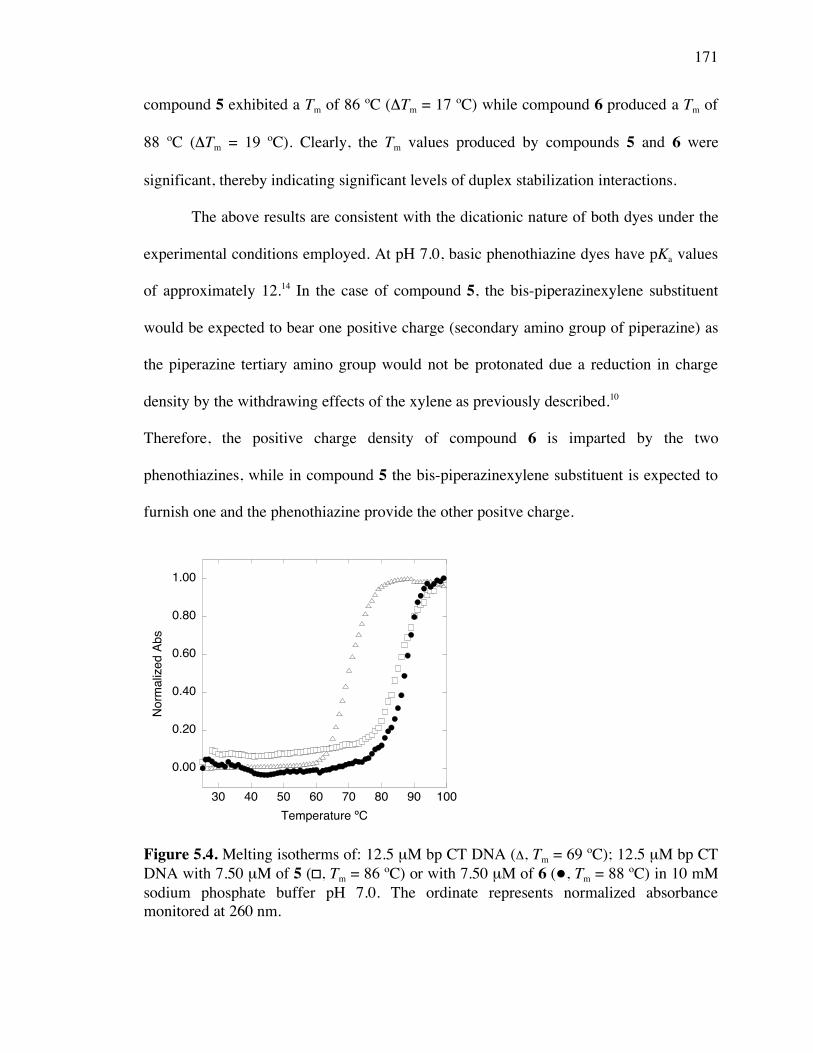
171
compound 5 exhibited a Tm of 86 ºC (ΔTm = 17 ºC) while compound 6 produced a Tm of
88 ºC (ΔTm = 19 ºC). Clearly, the Tm values produced by compounds 5 and 6 were
significant, thereby indicating significant levels of duplex stabilization interactions.
The above results are consistent with the dicationic nature of both dyes under the
experimental conditions employed. At pH 7.0, basic phenothiazine dyes have pKa values
of approximately 12.14 In the case of compound 5, the bis-piperazinexylene substituent
would be expected to bear one positive charge (secondary amino group of piperazine) as
the piperazine tertiary amino group would not be protonated due a reduction in charge
density by the withdrawing effects of the xylene as previously described.10
Therefore, the positive charge density of compound 6 is imparted by the two
phenothiazines, while in compound 5 the bis-piperazinexylene substituent is expected to
furnish one and the phenothiazine provide the other positve charge.
Figure 5.4. Melting isotherms of: 12.5 µM bp CT DNA (Δ, Tm = 69 ºC); 12.5 µM bp CT DNA with 7.50 µM of 5 (� , Tm = 86 ºC) or with 7.50 µM of 6 (, Tm = 88 ºC) in 10 mM sodium phosphate buffer pH 7.0. The ordinate represents normalized absorbance monitored at 260 nm.
0.00
0.20
0.40
0.60
0.80
1.00
30 40 50 60 70 80 90 100
No
rma
lize
d A
bs
Temperature ºC
172
Viscosity Measurements. In order for intercalation to occur, the DNA base pairs
separate to form a cavity for the incoming chromophore through localized unwinding of
the duplex. Consequently, the contour length of DNA is increased. Because groove
binding agents do not unwind helical DNA, hydrodynamic assays (e.g., viscosity)
sensitive to the change in DNA length can be employed to distinguish between binding
modes.15 According to the theory of Cohen and Eisenberg, plots of the cubed root of the
relative viscosity (η/ηo)1/3 versus r the molar ratio of bound ligand to DNA bp (r) should
result in a slope close to 1.0 for a monointercalator.16. The slope of a bisintercalator is
then expected to be twice that observed for the monointercalative binding.
Our next goal was to determine the DNA binding mode of compounds 5 and 6.
Viscosity measurements were carried out with individual solutions equilibrated with 10
mM sodium phosphate buffer pH 7.0 and 200 µM bp of calf thymus DNA in the presence
(η) and absence (ηo) of dye. The viscosity data (Fig. 5.5) was plotted as (η/ηo)1/3 versus
dye to DNA bp molar ratios (r) ranging from 0.01 to 0.06. The slopes obtained from
these plots were 0.99 and 1.2 for compounds 5 and 6, respectively. Clearly, both
compounds interacted with calf thymus DNA as monofunctional intercalators.
In order to prevent violation of the nearest-neighbor exclusion theory,
bisintercalators should possess a linker ≥10 Å in length.17 While compound 6 meets this
requirement,18 it is conceivable that conformation constraints lower the free energy of
binding19 or that self-association of the dye in the buffer solution prevent the insertion of
the second ring.
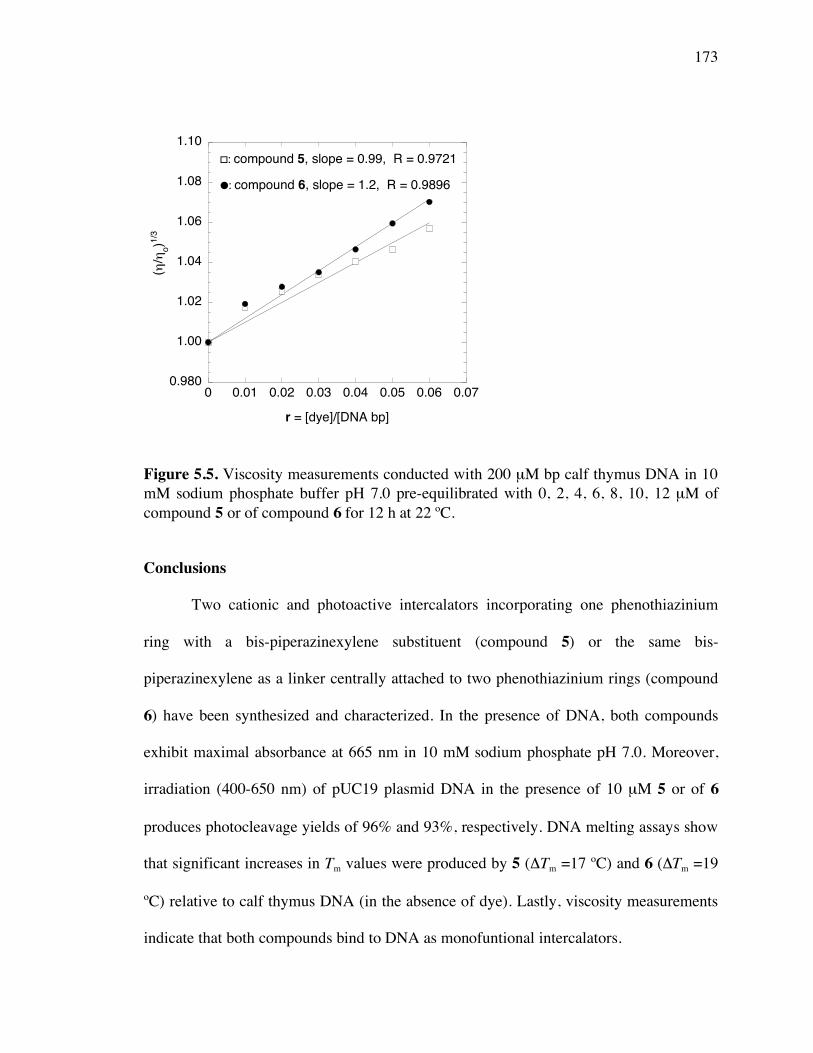
173
Figure 5.5. Viscosity measurements conducted with 200 µM bp calf thymus DNA in 10 mM sodium phosphate buffer pH 7.0 pre-equilibrated with 0, 2, 4, 6, 8, 10, 12 µM of compound 5 or of compound 6 for 12 h at 22 ºC.
Conclusions
Two cationic and photoactive intercalators incorporating one phenothiazinium
ring with a bis-piperazinexylene substituent (compound 5) or the same bis-
piperazinexylene as a linker centrally attached to two phenothiazinium rings (compound
6) have been synthesized and characterized. In the presence of DNA, both compounds
exhibit maximal absorbance at 665 nm in 10 mM sodium phosphate pH 7.0. Moreover,
irradiation (400-650 nm) of pUC19 plasmid DNA in the presence of 10 µM 5 or of 6
produces photocleavage yields of 96% and 93%, respectively. DNA melting assays show
that significant increases in Tm values were produced by 5 (ΔTm =17 ºC) and 6 (ΔTm =19
ºC) relative to calf thymus DNA (in the absence of dye). Lastly, viscosity measurements
indicate that both compounds bind to DNA as monofuntional intercalators.
0.980
1.00
1.02
1.04
1.06
1.08
1.10
0 0.01 0.02 0.03 0.04 0.05 0.06 0.07
(!/ !
o)1
/3
r = [dye]/[DNA bp]
� : compound 5, slope = 0.99, R = 0.9721
!: compound 6, slope = 1.2, R = 0.9896
174
Considering the great interest in developing non-porphyrin based
phototherapeutics that strongly absorb light at wavelengths greater than 600 nm and
possess low toxicity in human cells, our future research efforts will involve the synthesis
of second-generation bis-phenothiazine dyes with improved intercalating abilities.
Experimental
General Methods. Melting points were determined in a Stuart Scientific model
SMP10 apparatus. Infrared spectra were taken on an FT-IR Perkin Elmer Spectrum One
spectrophotometer. 1H and 13C NMR spectra were recorded at 300 MHz and 75 MHz,
respectively, in either Varian Unity One or Varian Mercury-VX-300 spectrometers.
Elemental analyses (CHNS) were conducted on a Leco CHNS-932 automatic analyzer
while iodine composition was performed by oxygen flask combustion and by ion
chromatography (Atlantic Microlabs, Inc. Norcross, GA). Electrospray ionization (ESI)
mass spectra were generated on a Micromass Q-Tof hybrid mass spectrometer. Merck
silica gel 60 (230-400 ASTM mesh) was employed for flash column chromatography.
UV-visible and CD spectra were recorded with a UV-1601 Shimadzu spectrophotometer,
while thermal melting curves were generated using a Cary Bio 100 UV-Vis
spectrophotometer.
Distilled, deionized water was utilized in the preparation of all buffers and
aqueous reactions. Chemicals were of the highest available purity and were used without
further purification. Anhydrous magnesium sulfate, cesium carbonate, chloroform, α,α’-
dibromo-p-xylene, dichloromethane, dimethylamine (2 M solution in methanol),
dimethylformamide, ethidium bromide, iodine, methanol, 10H-phenothiazine, 1-
piperazinecarboxaldehyde, potassium hydroxide, potassium carbonate, sodium phosphate

175
dibasic, and sodium phosphate monobasic were obtained from the Aldrich Chemical Co.
Transformation of Escherichia coli competent cells (Stratagene, XL-blue) with pUC19
plasmid (Sigma) and growth of bacterial cultures in Lauria-Bertani broth were performed
according to standard laboratory procedures.20 The plasmid DNA was purified with a
Qiagen Plasmid Mega Kit. Ultra PureTM calf thymus DNA (Invitrogen Lot No. 15633-
019, 10 mg/mL, average size ≤ 2000 bp) was used without purification. The
concentration of calf thymus DNA solutions were determined by UV-visible
spectrophotometry using the following extinction coefficient in units of M-1 (bp) cm-1: ε260
= 12,824.
Phenothiazin-5-ium tetraiodide hydrate (1). A solution of 10H-phenothiazine
(0.566 g, 2.84 mmol) in 20 mL of chloroform was stirred at 5 ºC and iodine (2.16 g, 8.51
mmol) dissolved in 50 mL of chloroform was added drop-wise over 1 h. The reaction
mixture was stirred at 5 ºC for an additional h, while the progress was monitored by silica
gel TLC using chloroform as the solvent. The precipitate from the reaction was then
filtered, washed with a copious amount of chloroform and was dried under high vacuum
overnight to afford 1.63 g (80% yield) of dark-blue solid 1; Rf = 0.09 (chloroform); M.p.
170 ºC (decomp.); 1H NMR (300 MHz, Acetone-d6): δ = 8.01 (m, 2H), 7.92 (m, 2H), 7.64
ppm (m, 4H); 13C NMR (75 MHz, Acetone-d6): δ = 153.58, 130.67, 129.47, 128.64,
125.50, 123.52 ppm; IR (film): ν = 2967, 1558, 1467, 1440, 1311, 1233, 1131, 1067,
1023, 841, 705 cm-1. LRMS (ESI): calcd for C12H8NS [M+]: 198.0; found: 199.0 [M+H+]+.
3-(Dimethylamino)phenothiazin-5-ium triiodide (2). To a solution of
phenothiazin-5-ium tetraiodide hydrate (0.400 g, 0.553 mmol) in 20 mL of chloroform
was added dimethylamine in methanol (0.553 mL, 1.11 mmol) drop-wise over 4 h. The
176
reaction was monitored by silica gel TLC (3:7 10% aqueous ammonium
acetate/methanol, v/v). The resultant precipitate was filtered, washed with chloroform
and allowed to air dry. Product 2 (189 mg, 55% yield) was obtained as a dark-blue solid;
Rf = 0.28 (3:7 10% aqueous ammonium acetate/methanol, v/v); M.p. 144-145 ºC; 1H
NMR (300 MHz, DMSO-d6): δ = 8.22 (dd, J = 8.0 Hz, J = 1.6 Hz, 1H, H-9), 8.17 (dd, J =
8.0 Hz, J = 1.6 Hz, 1H, H-6), 8.10 (d, J = 10 Hz, 1H, H-1), 8.04 (dd, J = 10 Hz, 1H, H-2),
8.00 (d, J = 2.4 Hz, 1H, H-4), 7.85 (m, 2H, H-7 and H-8), 3.64 and 3.60 ppm (2s, 6H,
N(CH3)2); 13C NMR (75 MHz, DMSO-d6): δ = 156.09, 144.13, 139.81, 139.56, 138.03,
134.55, 133.22, 129.81, 126.27, 126.06, 125.84, 109.66, 43.35, 42.88 ppm; IR (film): ν =
2800, 1617, 1559, 1489, 1429, 1411, 1252, 1118, 1411, 1078, 887, 835, 772 cm-1; LRMS
(ESI): calcd for C14H13N2S [M+]: 241; found: 241. Anal. Calcd for C14H13N2SI3: C, 27.03;
H, 2.11; N, 4.50; S, 5.15; I, 61.20. Found: C, 27.12; H, 1.97; N, 4.46; S, 5.23; I, 60.94.
1,1’-[1,4-Phenylenebis(methylene)]bis(4-piperazinecarboxaldehyde) (3). A
solution containing α, α’-dibromo-p-xylene (2.60 g, 0.010 mol), 1-piperazine
carboxaldehyde (2.30 mL, 0.022 mol) and potassium carbonate (1.40 g, 0.010 mol) in 40
mL of methanol was refluxed under an open atmosphere for 24 h. Reaction progress was
monitored by silica gel TLC (44:8:1 chloroform-methanol-ammonium hydroxide, v/v/v).
After the starting materials were consumed, the reaction was concentrated to dryness
under reduced pressure. The resulting solid was then dissolved in 25 mL of water and
extracted with dichloromethane (50 mL) three times. The organic layer was dried over
anhydrous magnesium sulfate, filtered and concentrated under reduced pressure to yield
2.47 g (75%) of white solid 3; Rf = 0.69 (44:8:1 chloroform-methanol-ammonium
hydroxide, v/v/v); M.p. 140 – 142 ºC; 1H NMR (300 MHz, DMSO-d6): δ 2.29 and 2.35 (t,
177
J = 4.8 Hz, 4H, CH2-NCH2Ph), 3.35 and 3.37 (tt, J = 4.8 and 5.2 Hz, 8H, CH2-NCHO),
3.48 (s, 4H, CH2-Ph), 7.27 (s, 4H, Ph-H), 7.99 ppm (s, 2H, NCOH); 13C NMR (75 MHz,
DMSO-d6): δ 39.11 and 44.77 (CH2-NCHO), 51.89 and 53.11 (CH2- NCH2Ph), 61.62
(CH2-Ph), 128.73 (Ph-H), 136.55 (Cipso Ph) 160.68 ppm (CHO); IR (film): ν = 770, 821,
841, 998, 1017, 1125, 1226, 1400, 1431, 1489, 1514, 1668, 2805, 2870 cm-1; LRMS
(ESI): calcd for C18H26N4O2 [M+] 330; found: 331 [M+H+]+.
1,1’-[1,4-Phenylenebis(methylene)]bispiperazine (4). A solution of 3 (0.500 g,
1.50 mmol) in 3 mL of ethanol and 2 mL of water was treated with potassium hydroxide
(0.421 g, 7.50 mmol) and refluxed under an open atmosphere for 24 h. Reaction progress
was monitored by silica gel TLC (44:8:1 chloroform-methanol-ammonium hydroxide,
v/v/v). After the starting material was consumed, the reaction mixture was allowed to
cool and was then extracted with dichloromethane (10 mL) three times. The organic layer
was dried over anhydrous magnesium sulfate, filtered and concentrated under reduced
pressure to yield 0.321 g (78%) of white solid 4; Rf = 0.45 (44:8:1 chloroform-methanol-
ammonium hydroxide, v/v/v); M.p. 146 – 148 ºC; 1H NMR (300 MHz, DMSO-d6): δ 2.23
(t, J = 4.6 Hz, 8H, CH2-NCH2Ph), 2.64 (t, J = 4.6 Hz, 8H, CH2-NH), 3.36 (s, 4H, CH2-
Ph), 7.19 ppm (s, 4H, Ph-H); 13C NMR (75 MHz, DMSO-d6): δ 45.55 (CH2-NH), 54.07
(CH2- NCH2Ph), 62.62 (CH2-Ph), 128.5 (Ph-H), 136.7 (Cipso Ph); IR (film): ν = 765, 830,
858, 1008, 1134, 1249, 1335, 1360, 1453, 1514, 2804, 2880, 3244 cm-1; LRMS (ESI):
calcd for C16H26N4 [M+]: 274; found: 275 [M+H+]+, 138 [M+H+]+2.
7-Dimethylamino-3-(1,1’-[1,4-phenylenebis(methylene)bispiperazine])
phenothiazin-5-ium iodide (5). A solution of 2 (0.507 g, 0.815 mmol) and 4 (0.224 g,
0.815 mmol) in 25 mL of methanol was vigorously stirred for 72 h. The progress of the

178
reaction was monitored by silica gel TLC (9.5:0.5 dichloromethane-methanol, v/v). The
reaction was concentrated under reduced pressure and the resultant solid was purified by
flash column chromatography (4 cm column, 70 g silica gel) using 9.5:0.5
dichloromethane-methanol, v/v as the eluent to afford 170 mg (34%) of dark-blue solid 5;
Rf = 0.2 (9.5:0.5 dichloromethane-methanol, v/v); M.p. > 300 ºC; 1H NMR (300 MHz,
DMSO-d6): δ 2.55 (b, 8H,CH2-β, β’) 3.09 (t, J = 5 Hz, 4H, CH2-α’), 3.37 (s, 6H, NCH3),
3.54 (s, 4H, CH2-Ph) 3.85 (s, broad, 4H, CH2-α), 7.30 (m, 4H, Ph-H), 7.51-7.68 (m, 4H,
H-2, H-4, H-6 and H-8) 7.90 ppm (m, 2H, H-1 and H-9); 13C NMR (75 MHz, DMSO-d6):
δ 40.66 (NCH3), 42.48 (C-α’), 46.74 (C-α), 48.38 (C-β), 51.65 (C-β’), 60.36 and 60.53
(CH2-Ph), 106.41 and 106.52 (C-4 or C-6), 118.22 and 119.01 (C-2 or C-8), 128.27 (C-
Ph), 133.04 and 133.36 (C-9a or C-10), 134.33 (Cipso-Ph), 135.10 and 135.94 (C4a or C-
5a), 137.25 and 137.39 (C-1 or C-9), 152.25 (C-7) and 153.45 ppm (C-3); IR (film): ν =
779, 825, 882 , 990, 1042, 1136, 1229, 1352, 1386, 1487, 1593, 1743 cm-1; HRMS (ESI):
calcd for C30H37N6S 513.2800, found 513.2815 [M+] and 257.1462 [M+/2].
N,N’-Bis[(7-dimethylamino)phenothiazin-5-ium-3-yl]-
1,1’-[1,4-phenylenebis(methylene)bispiperazine] diiodide (6). To a solution of 2
(0.200 g, 0.322 mmol) in 20 mL of dimethylformamide were added 4 (0.044 g, 0.160
mmol) and cesium carbonate (0.156 g, 0.480 mmol). The reaction was vigorously stirred
at RT for 48 h and then concentrated under reduced pressure. The progress of the reaction
was monitored by TLC (9.5:0.5 dichloromethane-methanol, v/v). The resultant solid was
purified via flash column chromatography (3 cm column, 39 g silica gel) using 9.5:0.5
dichloromethane-methanol, v/v as the eluent to afford 66 mg (41%) of dark-blue solid 6;
Rf = 0.3 (9.5:0.5 dichloromethane-methanol, v/v) M.p. > 300 ºC; 1H NMR (300 MHz,

179
DMSO-d6): δ 2.55 (s, 8H,CH2-β), 3.38 (s, 12H, NCH3), 3.55 (s, 4H, CH2-Ph) 3.85 (s,
broad, 8H, CH2-α) 7.31 (s, 4H, Ph-H), 7.55-7.69 (m, 8H, H-2, H-4, H-6 and H-8) 7.93
ppm (m, 4H, H-1 and H-9); 13C NMR (75 MHz, DMSO-d6): δ 41.91 (NCH3), 47.99 (C-
α), 53.01 (C-β), 61.76 (CH2-Ph), 107.77 (C-4, C-6), 119.53 and 120.39 (C-2, C-8),
129.59 (C-Ph), 137.16 and 138.75 (C-1, C-9), 153.45 ppm (C-3 or C-7); IR (film): ν =
778, 830, 881, 1001, 1035, 1140, 1228, 1347, 1385, 1488, 1590, 2834, 2884, 2954 cm-1;
HRMS (ESI): calcd for C44H48N8S2 752.3443, found 376.1725 [M+/2].
UV-Visible Spectrophotometry. Extinction coefficients for compound 5 and 6
were determined using 500 µL solutions containing 1 to 10 µM of dye in the presence
and absence of 38 to 380 µM bp calf thymus DNA in 10 mM sodium phosphate buffer
pH 7.0. After a 12 h pre-equilibration period in the dark, UV-visible spectra were
recorded in 1 cm quartz cuvettes at 22 ºC. The absorbance was then plotted as a function
of concentration and linear least square fits to these data yielded slopes (KaleidaGraph
version 3.6.4 software) that were averaged over three trials. Using the procedure
described above, extinction coefficients in the absence of calf thymus DNA were also
recorded in the presence of a final concentration of 1% sodium dodecyl sulfate (w/v).
DNA Photocleavage. Individual samples consisted of 38 µM bp pUC19 plasmid
DNA and 10 to 0.0 µM of compound 5 or 6 in 10 mM sodium phosphate buffer pH 7.0
(total volume 20 µL). The samples were pre-equilibrated in the dark for 12 h at 22 ºC,
after which they were kept in the dark or were aerobically irradiated in a Rayonet
Photochemical reactor fitted with twelve 575 nm lamps (Southern New England
Ultraviolet Co.) for 60 min. In time course experiments, individual 20 µL reactions
contained 10 µM 5 or 6 and 38 µM bp pUC19 plasmid DNA in 10 mM sodium

180
phosphate buffer pH 7.0. The samples were pre-equilibrated in the dark for 12 h at 22 ºC,
after which they aerobically irradiated as described above for 10 to 60 min. The resulting
cleavage products were electrophoresed on a 1% nondenaturing agarose gel stained with
ethidium bromide (0.5 µg/mL), visualized on a transilluminator set at 302 nm,
photographed and scanned. The amounts of supercoiled and nicked plasmid DNA were
quantitated by densitometry using ImageQuant version 5.2 software (Amersham
Biosciences). Photocleavage yields were calculated using the formula [(nicked
DNA)/total DNA] x 100. The density of supercoiled DNA was multiplied by a correction
factor of 1.22 to account for the decreased binding affinity of ethidium bromide to
supercoiled DNA as compared to the nicked and linear forms.
Thermal Melting Studies. Individual 3 mL solutions containing 10 mM sodium
phosphate buffer pH 7.0 and 12.5 µM bp calf thymus DNA in the presence and absence
of 7.50 µM of compound 5 or 6 in were placed in 3 mL (1 cm) quartz cuvettes (Starna).
After the samples were equilibrated in the dark for 12 h and 22 ºC, absorbance was
monitored at 260 nm while the DNA was denatured using a Peltier heat block
programmed to increase the temperature from 25 to 100 ºC at a rate of 0.5 ºC min-1.
KaleidaGraph version 3.6.4 software was then used to approximate the first derivative of
ΔA260/ΔT versus temperature, where the Tm value corresponded to the maximum of each
first derivative plot.
Viscosity Measurements. In a total volume of 1000 µL, individual solutions
containing 10 mM sodium phosphate buffer pH 7.0 and 200 µM bp of calf thymus DNA
(average length ≤ 2000 bp) in the absence and presence of 2 to 12 µM of compound 5 or
6 were pre-equilibrated for 12 h in the dark at 22 ºC. DNA viscosity was then measured

181
in a Cannon-Ubbelohde size 75 capillary viscometer immersed in a thermostated water
bath maintained at 25 ± 0.2 ºC. The flow times of the buffer, DNA in buffer, and dye-
DNA in buffer were measured with a stopwatch. The measurements were averaged over
four trials to an accuracy of + 0.2 s. After subtracting the averaged flow time of the
buffer, DNA (η0) and dye-DNA (η) averaged flow times were plotted as (η/ηo)1/3 versus
the molar ratio of dye to DNA bp. Slopes were generated by conducting linear least
square fits to these data (KaleidaGraph version 3.6.4 software). While the conventional
method for performing viscosity assays involves titration of the ligand into a DNA
solution inside the viscometer, here we report an alternative and efficient technique that
may be particularly useful for 5 and 6 as well as for other phenothiazines (e.g., 1,9-
dimethyl methylene blue and methylene blue), where pre-equilibration with DNA is
required to reduce ligand stacking associations in solution.12
Acknowlegments. This work was supported by the NSF (CHE-9984772; K.B.G),
the CICYT (Project BQU 2002-02576; A.L.) and the US Department of Education
(GAANN Fellowship; B.W.). We are grateful for assistance from Profs. M.W. Germann,
T.L., Netzel, L., Strekowski, W.D. Wilson (GSU) and from Dr. M.V. Galakhov (UAH).

182
References
1. Müller, T. J. J. Tetrahedron Lett. 1999, 40, 6563.
2. Genwa, K. R.; Chouhan, A. J. Chem. Sci. 2004, 116, 339.
3. Tuite, E. M.; Kelly, J. M. J. Photochem. Photobiol. B: Biol. 1993, 21, 103.
4. (a) Detty, M. R.; Gibson, S. L.; Wagner, S. J. J. Med. Chem. 2004, 47, 3897.
(b) Harris, F.; Sayed, Z.; Hussain, S.; Phoenix, D. A. Photodiag. Photodyn. Ther.
2004, 1, 231. (c) Harris, F.; Chatfield, L.K.; Phoenix, D. A. Curr. Drug Targets
2005, 6, 615.
5. (a) Wainwrigth, M.; Phoenix, D. A.; Rice, L.; Burrow, S. M.; Waring, J. J.
Photochem. Photobiol. B. 1997, 40, 233. (b) Rice, L.; Wainwright, M.; Phoenix,
D. A. J. Chemother. 2000, 12, 94.
6. (a) Wainwright, M.; Phoenix, D. A.; Laycock, S. L.; Wareing, D. R. A.; Wright,
P. A. FEMS Microbiol. Letts. 1998, 160, 177. (b) Wainwright, M.; Phoenix, D.
A.; Gaskell, M.; Marshall, B. J. Antimicrob. Chemother. 1999, 44, 823.
7. (a) Owada, T.; Yamada, Y.; Abe, H.; Hirayama, J. Ikeda, H. Sekguchi, S.;
Ikebushi, K. J. Med. Virol. 2000, 62, 421. (b) Floyd, R. A.; Schneider, J. E. Jr.;
Dittmer, D. P. Antiviral Res. 2004, 61, 141.
8. (a) Gao, Q.; Williams, L. D.; Egli, M.; Rabinovich, D.; Chen, S-L.; Quigley, G. J.;
Rich, A. Proc. Natl. Acad. Sci. USA 1991, 88, 2422. (b) Krugh, T. R. Curr. Opin.
Struct. Biol. 1994, 4, 351. (c) Chaires, J. B. Curr. Opin. Struct. Biol. 1998, 8, 314.
9. Strekowski, L.; Hou, D-F.; Wydra, R. L. J. Heterocyclic Chem. 1993, 30, 1693.
10. McConnaughie, A. W.; Spychala, J.; Zhao, M.; Boykin, D.; Wilson, W. D. J.
Med. Chem. 1994, 37, 1063.

183
11. (a) Leventis, N.; Chen, M.; Sotiriou-Leventis, C. Tetrahedron 1997, 53, 10083.
(b) Mellish, K. J.; R. D.; Cox, Vernon, D. I.; Griffiths, J.; Brown, S. B.
Photochem. Photobiol. 2002, 75, 392.
12. (a) Jockusch, S.; Lee, D.; Turro, N. J.; Leonard, E. F. Proc. Natl. Acad. Sci. USA
1996, 93, 7446. (b) Mohammad, T.; Morrison, H. Bioorg. Med. Chem. Lett. 1999,
9, 2249.
13. Wilson, W. D.; Tanious, F. A.; Fernández-Saiz, M. In Drug-DNA Interaction
Protocols; Fox, K. R., Ed.; Humana Press: New Jersey, 1997; pp 219-240.
14. Harris, R. G.; Wells, J. D.; Johnson, B. B. Colloids Surf. A Physiochem. Eng. Asp.
2001, 180, 131.
15. Suh, D.; Chaires, J. B. Bioorg. Med. Chem. 1995, 3, 723.
16. Cohen, G.; Eisenberg, H.; Biopolymers 1969, 8, 45.
17. Wilson, W. D. In Nucleic Acids in Chemistry and Biology; Blackburn, G. M.;
Gait, M. J., Eds.; Oxford University Press: New York, 1996; pp 331-370.
18. The linker length (11 Å) of compound 6 was determined by measuring the bond
distances in between the two phenothiazines rings of a three-dimensional structure
produced by CambridgeSoft Corporation Chem 3D Pro software version 5.0 (the
energy was not minimized).
19. Wilson, W. D. Compr. Nat. Prod. Chem. 1999, 7, 427.
20. Sambrook, J.; Fritsch, E. F.; Maniatis, T. In Molecular Cloning A Laboratory
Manual; 2nd ed.; Cold Spring Harbor Press: New York, 1989.
184
CHAPTER VI
Allele-Specific PCR-Based Genotyping of a Normal Variation in Human Color Vision
(This chapter is verbatim as it appears in Wilson, B.; Lubin, I. M.; Grant, K. B. Journal of Chemical Education 2003, 80, 1289-1291. The contributions to the project from the author of this dissertation were as follows: collection and extraction of DNA from volunteer subjects, allele-specific amplification of the DNA, and authorship of the original manuscript. Dr. Lubin’s contribution was the conception of designing a laboratory exercise based on the extraction of DNA from buccal cells. Additionally, Dr. Lubin made helpful suggestions regarding the content of the manuscript. Dr. Grant’s contributions were conception of amplifying the SNP involved in human color vision, PCR primer design, minor revisions to the manuscript as well as revisions to the supplemental material section.
Abstract
This laboratory exercise offers undergraduate biochemistry students the
opportunity to gain experience in a variety of techniques employed in modern molecular
biology and biochemistry laboratories. Students utilize microcentrifugation and silica-gel
column chromatography to extract DNA from their own buccal (cheek) epithelial cells.
The polymerase chain reaction (PCR) and agarose gel electrophoresis are then employed
to identify a single nucleotide polymorphism (SNP) that is responsible for a commonly
encountered variation in human red color vision.
Introduction
The tremendous impact of the Human Genome Project on the life sciences, both
in basic research and in education, has given rise to a need for new laboratory
experiments in undergraduate biochemistry. Two main goals of the Human Genome
Project are to sequence the entire 3.2 billion base pair human genome and to identify an
estimated 100,000 human genes by the year 2003 (1). Although 99% of human DNA
185
sequences are identical across populations, most genetic variation can be traced to single
nucleotide polymorphisms (SNPs) (1, 2). An SNP is a base substitution found at a single
nucleotide position (3). Approximately 1.4 million SNPs have been mapped within the
human genome (2). Chakravarti and others anticipate that SNP analyses will lead to the
development of new therapeutic drugs by uncovering genetic differences that influence
human disease susceptibility (1-4). SNP analysis also makes important contributions
towards the study of normal human physiology by providing clues that elucidate gene
function and evolutionary development (3). Nevertheless, there are few if any
undergraduate laboratory experiments that provide students with training in this
important area of human genetics research. We have therefore designed a new exercise
with the aim of providing direct “hands-on” experience and knowledge beyond what is
obtained through routine laboratory instruction.
The following experiment entails the identification of a single nucleotide
polymorphism responsible for a normal variation in human red color vision. In the course
of this exercise, students will extract their own DNA from buccal (cheek) epithelial cells
using a safe and non-invasive procedure. An allele-specific polymerase chain reaction
(PCR) will then be employed to amplify a fragment of the gene encoding human red cone
opsin. Finally, visualization of the amplified DNA by agarose gel electrophoresis will
serve to identify the SNP.
Molecular Basis for Human Color Vision. Human color vision is mediated by
red, blue, and green membrane bound proteins (opsins) each residing in different cone
cells within the retina. Although the three cone opsins contain the same chromophore,
11-cis retinal, their absorption maxima vary greatly, from 426 nm for human blue cone

186
opsin to 557 nm for human red cone opsin (5, 6). Within the human red cone opsin gene,
a thymine to guanine single nucleotide polymorphism results in a serine to alanine amino
acid substitution at position 180 of the red opsin (7, 8). The wavelength of maximal
absorbance (λmax) is shifted from 557 nm for the serine wild type opsin to 552 nm for the
alanine variant (6). This difference is due to the close proximity of amino acid position
180 to the 11-cis retinal chromophore. Because the red cone opsin gene is located on the
long arm of the X chromosome (9), males can be homozygous for either the serine or
alanine allele, while females are either homozygous or heterozygous. In any case,
individuals with one or more serine alleles of the opsin have a greater sensitivity to red
light (6 - 8). Although this difference in perception is only slight, it is significant in
practical terms. If an individual were to coordinate a shirt with a tie, someone else with
the alternate allele might say that the colors were a bad match.
DNA Extraction from Buccal Cells. Several traditional methods of DNA
extraction for PCR analysis, such as fractionation of white cells from whole blood, yield
large quantities of quality DNA. However, these methods are often impractical in
classroom, diagnostic, and research settings due to the inconvenience of drawing blood,
risk of exposure to blood-borne pathogens, and/or complicated extraction procedures
(10). DNA isolation from buccal cells has been successfully employed in PCR-based
human genetics research (10, 11). The procedure is safe, non-invasive, reproducible, fast,
and inexpensive. Herein, undergraduate biochemistry students remove a small sample of
their own buccal cells by performing a brief oral swab with a soft-bristled, sterile
cytobrush. (Because the cytobrush is similar in texture to a toothbrush, there is no
discomfort associated with this procedure, no loss of blood, and no risk of infection.) The
187
students then extract approximately 2 to 5 µg of genomic DNA from the buccal cells
using a commercially available QIAampTM DNA Mini Kit in which cell lysates are
microcentrifuged through a silica-gel membrane spin column.
Allele Specific PCR. Allele-specific PCR (AS-PCR) is a well-established method
affording facile detection of single nucleotide polymorphisms in genomic DNA (12). AS-
PCR provides reliable SNP detection, requires no post-PCR processing, and avoids
radioactive or fluorescent labeling of primers, thereby reducing cost and labor time (13).
In this approach, two separate PCR reactions are conducted for each genomic DNA
sample. In the first PCR reaction, the 3'-base of one PCR primer will anneal to only one
out of two alleles, while the opposing PCR primer hybridizes to both alleles. The second
PCR reaction is carried out using the opposing primer and a primer with a 3’-base that is
specific for the second allele. The two PCR reactions are then resolved on a
nondenaturing agarose gel, upon which the presence or absence of a band in each of two
adjacent gel lanes indicates the genotype.
Shown in Figure 6.1 is a schematic of the allele-specific PCR strategy employed
in our laboratory exercise. The primer pair FT/R amplifies the serine allele of the human
red cone opsin gene, while the primer pair FG/R amplifies the alanine allele.
Experimental Procedure
A biochemistry laboratory equipped with standard pipetters, a PCR thermal
cycler, an electrophoresis gel box and power supply, a microcentrifuge, vortexers, and a
UV transilluminator will be required to conduct this laboratory experiment. In large
classroom settings, students may work in teams designated by one buccal cell donor per
team. Two cytobrushes are collected per donor (one from each cheek).
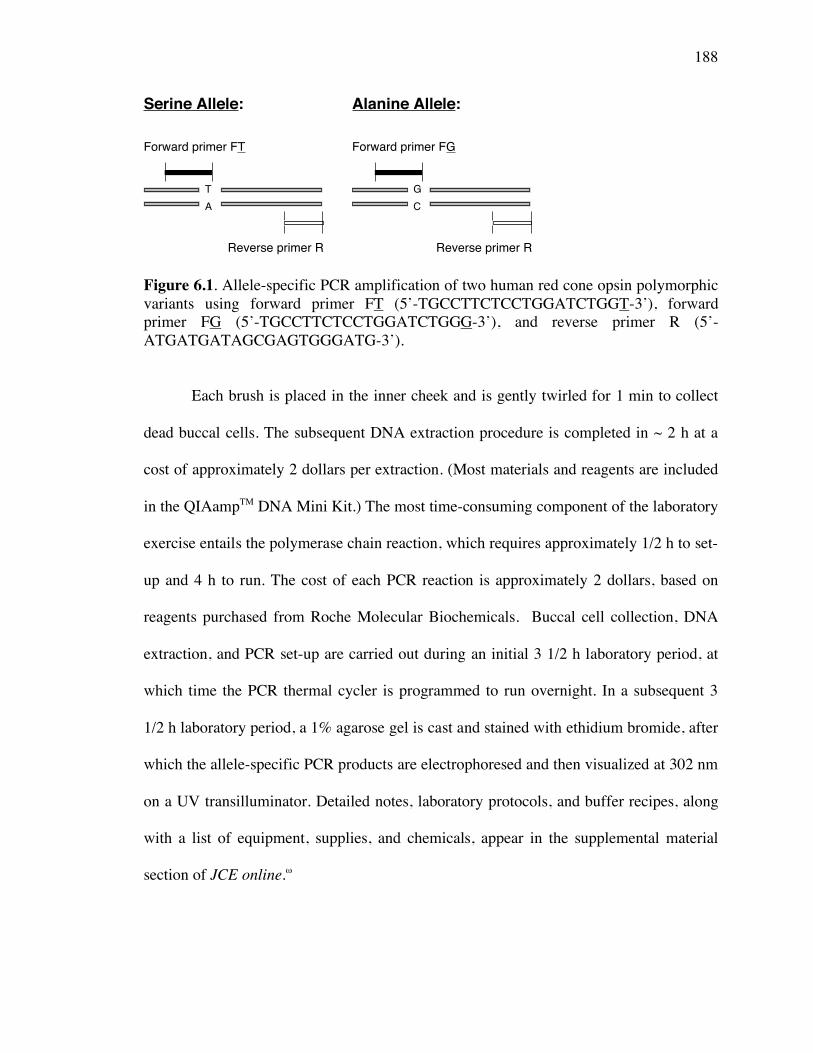
188
T
A
Forward primer FT
Reverse primer R
Serine Allele:
G
C
Forward primer FG
Reverse primer R
Alanine Allele:
Figure 6.1. Allele-specific PCR amplification of two human red cone opsin polymorphic variants using forward primer FT (5’-TGCCTTCTCCTGGATCTGGT-3’), forward primer FG (5’-TGCCTTCTCCTGGATCTGGG-3’), and reverse primer R (5’- ATGATGATAGCGAGTGGGATG-3’).
Each brush is placed in the inner cheek and is gently twirled for 1 min to collect
dead buccal cells. The subsequent DNA extraction procedure is completed in ~ 2 h at a
cost of approximately 2 dollars per extraction. (Most materials and reagents are included
in the QIAampTM DNA Mini Kit.) The most time-consuming component of the laboratory
exercise entails the polymerase chain reaction, which requires approximately 1/2 h to set-
up and 4 h to run. The cost of each PCR reaction is approximately 2 dollars, based on
reagents purchased from Roche Molecular Biochemicals. Buccal cell collection, DNA
extraction, and PCR set-up are carried out during an initial 3 1/2 h laboratory period, at
which time the PCR thermal cycler is programmed to run overnight. In a subsequent 3
1/2 h laboratory period, a 1% agarose gel is cast and stained with ethidium bromide, after
which the allele-specific PCR products are electrophoresed and then visualized at 302 nm
on a UV transilluminator. Detailed notes, laboratory protocols, and buffer recipes, along
with a list of equipment, supplies, and chemicals, appear in the supplemental material
section of JCE online.ω

189
Hazards. Students should wear splash proof goggles and latex gloves at all times.
Ethidium bromide is a known mutagen and should therefore be reacted with bleach prior
to disposal. Spent cytobrushes, pipette tips, collection tubes, and spin columns should be
washed with EtOH and buccal waste solutions should be reacted with bleach.
Results and Discussion
Buccal DNA samples were isolated from 7 female and 7 male Caucasian
volunteers and were screened for the red cone opsin SNP. Shown in Figure 6.2 are the
corresponding allele-specific PCR reactions resolved on two 1% agarose gels. It is
evident that 3 of the 7 females (43%) are heterozygous for the serine (thymine) and
alanine (guanine) alleles, while the remaining four females (57%) are homozygous for
serine. Of the 7 male volunteers, six (86%) are homozygous for serine and one (14%) is
homozygous for the alanine allele.
In a population distribution study, Windericks et al. screened 50 Caucasian males
for the red cone polymorphism and found that 62% carried the serine allele while 38%
were homozygous for alanine (8). In a recent survey of 9 females by Neitz et al., 56%
were found to be heterozygous, while 33% and 11% were homozygous for serine and
alanine respectively (14). Together with our results, the above data indicate that serine is
the predominant allele associated with the red cone opsin SNP.
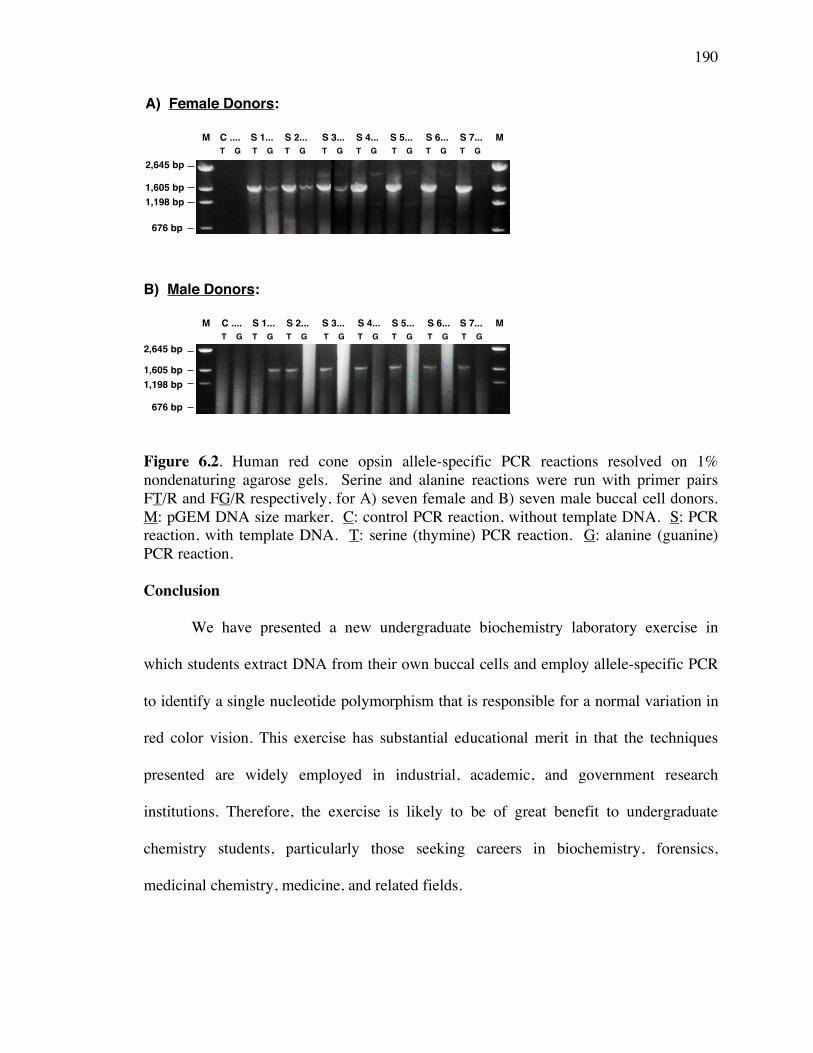
190
2,645 bp
1,605 bp1,198 bp
676 bp
C ....T G
S 1...T G
S 2...T G
S 7...T G
S 3...T G
S 4...T G
S 5...T G
S 6...T G
M M
A) Female Donors:
2,645 bp
1,198 bp1,605 bp
676 bp
C ....T G
S 1...T G
S 2...T G
S 7...T G
S 3...T G
S 4...T G
S 5...T G
S 6...T G
M M
B) Male Donors:
Figure 6.2. Human red cone opsin allele-specific PCR reactions resolved on 1% nondenaturing agarose gels. Serine and alanine reactions were run with primer pairs FT/R and FG/R respectively, for A) seven female and B) seven male buccal cell donors. M: pGEM DNA size marker. C: control PCR reaction, without template DNA. S: PCR reaction, with template DNA. T: serine (thymine) PCR reaction. G: alanine (guanine) PCR reaction. Conclusion
We have presented a new undergraduate biochemistry laboratory exercise in
which students extract DNA from their own buccal cells and employ allele-specific PCR
to identify a single nucleotide polymorphism that is responsible for a normal variation in
red color vision. This exercise has substantial educational merit in that the techniques
presented are widely employed in industrial, academic, and government research
institutions. Therefore, the exercise is likely to be of great benefit to undergraduate
chemistry students, particularly those seeking careers in biochemistry, forensics,
medicinal chemistry, medicine, and related fields.
191
Acknowledgments
We thank Xia Yang and Miki Kassai for assistance and the National Science
Foundation for financial support under grant DUE-0089417 (Professor Jerry C. Smith,
Georgia State University).
Supplemental Material
Detailed information for students and instructors is available in this issue of JCE
Online.
Notes
1. Dr. Lubin's participation in this work was undertaken in his private capacity. No
official support or endorsement by the Centers for Disease Control and Prevention
is intended or should be inferred.
2. The sequence variation determined in this exercise should not be construed to
indicate the presence or absence of any medical condition including those related
to color vision. This exercise was developed to teach principles of PCR and its
application in molecular genetics. Pipetting and other experimental errors can
occur that result in absence of PCR products or incorrect determination of the
sequence variation. Since it is not feasible to access or critically control for all
such errors in the context of this exercise, results should not be taken as definitive
assignment of sequence variations to specific individuals.

192
Literature Cited
(1) Human Genome Program, U.S. Department of Energy, Genomics and Its Impact
on Medicine and Society: A 2001 Primer 2001.
(2) The International SNP Map Working Group. Nature 2001, 409, 928-933.
(3) Stoneking, M. Nature 2001, 409, 821-822.
(4) Chakravarti, A. Nature 2001, 409, 822-823.
(5) Oprian, D. D.; Asenjo, A. B.; Lee, N.; Pelletier, S. L. Biochemistry 1991, 30,
11367-11372.
(6) Merbs S. L.; Nathans J. Nature 1992, 356, 433-435.
(7) Neitz, M.; Neitz, J.; Jacobs, G. H. Science 1991, 252, 971-974.
(8) Winderickx, J.; Lindsey, D. T.; Sanocki, E.; Teller, D.Y.; Motulsky, A. G.; Deeb,
S. S. Nature 1992, 356, 431-433.
(9) Nathans, J.; Thomas, D.; Hogness D. S. Science 1986, 232, 193-202.
(10) Richards, B.; Skoletsky, J.; Shuber, A. P.; Balfour, R.; Stern, R. C.; Dorkin, H. L.;
Parad, R. B.; Witt, D.; Klinger, K. W. Hum. Mol. Genet. 1993, 2, 159-163.
(11) Crawford, D. C.; Meadows, K. L.; Newman, J. L.; Taft, L. F.; Pettay, D. L.; Gold,
L. B.; Hersey, S. J.; Hinkle, E. F.; Stanfield, M. L.; Holmgreen, P.; Yeargin-
Allsopp, M.; Boyle, C.; Sherman, S. L. Am. J. Hum. Genet. 1999, 64, 495-507.
(12) Thompson, M. W.; McInnes, R. R.; Willard, H. F. Genetic in Medicine, 5th
ed; W. B. Saunders Company: Philadelphia, 1991; p.108.
(13) Wilson, R. C.; Wei, J. Q.; Cheng, K. C.; Mercado, A. B.; New, M. I. J. Clin.
Endocrinol. Metab. 1995, 80, 1635-1640.
(14) Neitz, M.; Kraft, T. W.; Neitz, J. Vision Res. 1998, 38, 3221-3225.

193
Supplemental Material
Part 1: DNA Extraction from Buccal Cell Samples using a QIAampTM DNA Mini
Kit
Experimental Procedure
1. Two cytobrushes will be used, one brush for each of your cheeks (left and right).
2. Place a sterile cytobrush in between your gums and cheek. Gently twirl each brush
both in the upper and bottom cheeks, 1 min per brush.
3. Place each brush into a separate 1.7 mL microcentrifuge tube and clip off the brush
handle with a pair of scissors.
4. Add 500 µL of phosphate buffered saline (PBS) to each of the two tubes. Vortex
the tubes vigorously for 1 min. Scrape the bristles against the walls of the tube.
Remove the brushes with a pair of forceps and discard into a solid waste container
containing 70% ethanol.
5. Decant the contents of one tube into the other to obtain a total volume of 1000 µL.
(After decanting, transfer any residual liquid with a pipette tip. Discard the used
pipette tip into the solid waste container.)
6. Centrifuge at 8,000 RPM for 5 min. Decant the supernatant into a liquid waste
container containing a 5% bleach solution.
7. Add 200 µL of PBS to the microfuge tube and resuspend the cell pellet by
vortexing vigorously for 1 min.
8. Add 20 µL of Proteinase K and mix by pulse-vortexing for 15 s. (Use of the
QIAamp Kit begins here.)
9. Add 200 µL of lysis Buffer AL to the sample and mix by pulse-vortexing for 15 s.
194
10. Incubate at 56 °C for 10 min, then centrifuge at 8,000 RPM for 15 s.
11. Add 200 µL of 100% ethanol to the sample and mix by pulse-vortexing for 15 s.
Centrifuge for 2 - 3 s.
12. Transfer 500 µL of the total solution (~ 700 µL) from step 11 to the QIAamp spin
column (placed in a 2 mL collection tube) without wetting the rim of the column.
Centrifuge at 8,000 RPM for 2 min and decant the filtrate into the liquid waste
container.
13. Repeat step 12 once more with the remaining solution from step 11.
14. Discard the used collection tube into the solid waste container. Place the QIAamp
column into a clean 2 mL collection tube.
15. Add 500 µL of Buffer AW1, centrifuge at 8,000 RPM for 1 min, and decant the
filtrate into the liquid waste container.
16. Add 500 µL of Buffer AW2 and centrifuge at 14,000 RPM for 3 min.
17. Examine the column to ensure that there is no residual liquid adhering to the silica-
gel membrane. If found, continue to centrifuge until all of the liquid has been
transferred to the collection tube.
18. Decant the filtrate into the liquid waste container. Discard the used collection tube
into the solid waste container.
19. Place the QIAamp spin column into a clean 1.7 mL microcentrifuge tube and add
100 µL of ddH2O to the column. Close the column’s cap, leaving the cap of the
outer 1.7 mL centrifuge tube open. Incubate at room temperature for 5 min. To elute
DNA, centrifuge at 8,000 RPM for 2 min.
195
20. Discard the spin column into the solid waste container. Close the cap on the 1.7 mL
centrifuge tube containing the DNA. The approximate yield of DNA will be 10 - 40
ng/µL.
Commentary
In this section of the laboratory, you will perform an oral swab with a soft-
bristled, sterile cytobrush (Fisher Scientific). This procedure will remove a small quantity
of your buccal (cheek) cells, which are dislodged from the brush by vortexing in PBS.
You will then use a QIAampTM DNA Mini Kit to isolate a sample of your own genomic
DNA from the resulting cell suspension. DNA purification using the QIAampTM Kit is
based on a simple bind-wash-elute procedure. Nucleic acids are adsorbed onto a silica-gel
membrane in the presence of high concentrations of chaotropic salts, which remove water
from hydrated molecules in solution. Polysaccharides and proteins do not adsorb onto the
silica and are removed. After two wash steps, pure nucleic acids are eluted under low-salt
conditions in small volumes.
Isolation Procedure. The precise chemical compositions, concentrations, and pH
values of the buffers contained in the QIAampTM DNA Mini Kit are proprietary and are
not described by the manufacturer. The buccal cell pellet is resuspended in PBS to which
Proteinase K and Buffer AL are added. Lysis Buffer AL contains a chaotropic,
guanidinium-based salt that degrades cell membrane and denatures proteins, while
Proteinase K enzymatically hydrolyzes accessible peptide amide bonds. The lysate is
then applied to the QIAamp spin column containing an unmodified silica-gel membrane
which retains the DNA. (It has been determined empirically that nucleic acids bind to
silica at pH ≤7.5, in the presence of ethanol and high concentrations of salt (1). The

196
precise mechanism through which DNA is adsorbed onto the silica is unknown.) After
brief centrifugation, proteins and cellular debris are eluted in the filtrate. The first wash
Buffer AW1 contains a different chaotropic salt which serves to further denature proteins
and elute residual protein contamination from the membrane. The ethanol-based wash
Buffer AW2 is then utilized to remove any residual salts. Finally, ddH2O is used to elute
the purified DNA from the membrane.
Instructor’s Notes
All procedures in Parts 1 and 2 of this exercise can be conducted in a single 3 1/2
h laboratory period.
All buffer solutions, proteinase K, spin columns, and collection tubes are included
in the QIAampTM DNA Mini Kit (with the exception of PBS and 100% ethanol).
Although the QIAamp Kit contains an eluting buffer (Buffer AE), its use is not
recommended for applications that involve subsequent PCR amplification of genomic
DNA, as Buffer AE contains salts that may interfere with PCR. Also note that the
QIAamp Kit includes a Handbook with step by step instructions for the extraction of
DNA from many different types of tissue. The buccal extraction protocol described here
was adapted from the “Blood and Body Fluid Spin Protocol” on pp. 22-24 of the January
1999 QIAamp Handbook. Before beginning this laboratory exercise, you should read the
Handbook included in your particular Kit to determine if any instructions have been
updated or changed.
Literature Cited
1. Vogelstein, B; Gillespie, D. Proc. Natl. Acad. Sci. USA 1979, 76, 615-619.

197
Part 2: PCR Protocol, Genotyping a Serine/Alanine Polymorphism of the Long-
Wavelength Cone Opsin in Normal Human Color Vision
Experimental Procedure
1. You will prepare two separate PCR reactions which will be used to identify wild
type and polymorphic alleles of the human red cone opsin gene. The first reaction
will utilize primer pair FT/R while the second will utilize primer pair FG/R.
FT: Forward Primer 5’-ATTGCCTTCTCCTGGATCTGGT-3’
FG: Forward Primer 5’-ATTGCCTTCTCCTGGATCTGGG-3’
R: Reverse Primer 5’- AGCATGATGATAGCGAGTGGGA-3’
2. Add 10 µL of genomic DNA (10 - 40 ng/µL, in ddH20) to each of two pre-labeled
PCR tubes (one for primer pair FT/R and one for primer pair FG/R).
3. To each tube, add 40 µL of a PCR cocktail mix* prepared by the Laboratory
Instructor. The resulting 50 µL PCR reaction will contain:
1X Final Concentration
DNA Template (10 - 40 ng/µL) 10.0 µL (2.0 – 8.0 ng/µL)
dNTP’s (10 mM each nucleotide) 1.0 µL * 200 µM
10X PCR buffer w/Mg++ 5.0 µL * 1X
Forward primer (10 µM) 5.0 µL * 1 µM
Reverse primer (10 µM) 5.0 µL * 1 µM
Taq polymerase (5 Units /µL) 0.5 µL * 0.05 Units/µL
Deionized water 23.5 µL*
Total Volume 50 µL
198
4. Vortex and centrifuge each tube briefly.
5. Add three drops of mineral oil to each tube with a Pasteur pipette. This will prevent
the mixture from evaporating during PCR amplification.
6. Centrifuge briefly.
7. Load the samples into a Perkin-Elmer Model 480 Thermal Cycler programmed
with the following cycling parameters:
94 °C 5 min 1 cycle Initial Denaturation
94 °C 50 s 45 cycles Denaturation
64 °C 1 min 45 cycles Annealing
72 °C 2 min 45 cycles Elongation
72 °C 10 min 1 cycle Final Extension
Note: because PCR is an extremely sensitive technique, the Instructor will prepare
and run two additional reactions (one for primer pair FT/R and a second for primer
pair FG/R) containing all reagents with the exception of template DNA, which will
be substituted by equivalent volumes of water. These two reactions will serve as
negative controls to rule out the presence of trace levels of contaminating DNA in
buffer, primers, dNTP’s, enzyme, and in any other reagents you utilized to prepare
your PCR reactions.

199
Commentary
T
A
Forward primer FT
Reverse primer R
Thymine (Serine) Allele:
G
C
Forward primer FG
Reverse primer R
Guanine (Alanine) Allele:
“Allele-specific PCR amplification of two human red cone opsin variants.”
In this section of the laboratory, you will utilize the polymerase chain reaction
(PCR) to screen your genomic DNA sample. The purpose of this exercise will be to
identify a common genetic polymorphism that accounts for a normal variation in human
color vision. This polymorphism involves a thymine to guanine base substitution in the
gene encoding human red cone opsin. Shown above, the primer pair FT/R will amplify
the thymine allele of the opsin, while the primer pair FG/R will amplify the guanine
allele.
As light enters the eye, it hits the retina, where cone cells containing blue, green,
and red opsins mediate color vision. The opsins bind tightly to the chromophore 11-cis
retinal. This chromophore absorbs light differently, depending upon how it is held by the
opsin. The above thymine to guanine base substitution produces a corresponding serine to
alanine amino acid substitution at position 180 of human red cone opsin. Because
position 180 is near 11-cis retinal, the wavelength of maximal absorbance (λmax) of the
red cone opsin is shifted from 557 nm (for the serine variant) to 552 nm (for the alanine
variant; 1,2). As a result, individuals with serine alleles of the opsin have a greater

200
sensitivity to red light. Although the difference between the two types of color vision is
only slight, it is significant in practical terms: if an individual were to buy a shirt and tie
that he or she believed to be a good color match, someone else with the alternate allele
might say that they are not.
Because the human red cone opsin gene is X-linked, males will be homozygous for
either the serine or the alanine allele, while females will be either homozygous or
heterozygous (serine and alanine alleles, each on separate X chromosomes).
Instructor’s Notes
All procedures in Parts 1 and 2 of this laboratory exercise can be conducted in a
single 3 1/2 h laboratory period. At this time, the PCR reactions should be set-up to run
overnight. (The PCR reactions will require approximately 1/2 h to set-up and 5 h to run.)
As a time-saving measure, you should prepare a PCR “cocktail” mix which the
students will use to set-up their PCR reactions. For multiple reactions, use of a cocktail
minimizes pipetting errors. As described in the experimental procedure, this cocktail
includes all asterisked PCR reagents minus template DNA. To make the cocktail, simply
multiply each 1X volume times the total number of PCR reactions plus one. Remember
to prepare separate cocktails for each primer pair and to keep all PCR reagents on ice.
(The 10X PCR buffer w/Mg++ is provided with Taq polymerase purchased from Roche
Molecular Biochemicals under catalog # 1146165.)
You should also utilize the procedures in Part 2 to prepare two negative control
PCR reactions (one for primer pair FT/R and a second for primer pair FG/R) in which
template DNA is substituted by equivalent volumes of water. Prior to running the PCR

201
reactions, add ~ 2 drops of mineral oil to each well of the thermal cycler heating block.
This will ensure uniform heating and cooling of all PCR reaction tubes.
PCR Troubleshooting. In this laboratory exercise, we have designed PCR primers
and have optimized cycling parameters, reagent concentrations, and other experimental
variables to avoid errors commonly encountered in PCR experiments. These errors can
result in the absence of PCR product, nonspecific priming, primer-dimer formation,
and/or the production of faint or smeared PCR bands. Although we have advised the use
of a PCR cocktail, inaccurate pipetting may still be a problem in the context of an
undergraduate laboratory setting.
We suggest that you perform the FT/R and FG/R PCR reactions in advance of the
laboratory exercise in order to verify the integrity of the PCR reagents that you have
purchased. We would also like to point out that the PCR cycling parameters described
here have been optimized for a Perkin-Elmer Model 480 DNA thermal cycler. Thermal
cyclers from other manufactures should work well, but the cycling parameters may need
to be adjusted in advance to optimize sensitivity and specificity of the PCR reactions. It is
also advisable to set aside approximately 10 min of the initial laboratory period in order
to allow students to become familiar with laboratory equipment and to practice pipetting
water into microcentrifuge tubes. Finally, there are several excellent literature references
that provide additional information on PCR optimization and troubleshooting strategies
(3-5).
Literature Cited
1. Winderickx, J.; Lindsey, D. T.; Sanocki, E.; Teller, D.Y.; Motulsky, A. G.; Deeb, S.
S. Nature 1992, 356, 431-433.
202
1. Merbs S. L.; Nathans J. Nature 1992, 356, 433-435.
2. Sambrook, J.; Fritsch, E.F.; Maniatis, T. Molecular Cloning: A Laboratory Manual;
Cold Spring Harbor Laboratory Press: Cold Spring Harbor, New York, 1989.
3. Ausubel, F.M.; Brent, R.; Kingston, R.E.; Moore, D.D.; Seidman, J.G.; Smith, J.A.;
Struhl, K. Current Protocols in Molecular Biology; John Wiley & Sons, Inc.: New
York, 1998.
4. McPherson, M.J.; Moller, S.G. PCR: the Basics from Background to Bench;
Springer-Verlag New York Inc.: New York, 2000.
Part 3: Agarose Gel Electrophoresis, Genotyping A Serine/Alanine Polymorphism
of the Long-Wavelength Cone Opsin in Normal Human Color Vision
Experimental Procedure: Gel Pouring Demonstration (to be conducted by the
Laboratory Instructor)
1. The ends of a 10 x 15 cm agarose gel casting tray are sealed with tape to form a
mold. Electrophoresis combs are placed in the tray.
2. A 2% agarose gel is cast as follows:
BioRad Mini Sub Gel apparatus: A total of 105 mL of 1X Tris-acetate EDTA
Buffer (TAE) is transferred to a 250 mL Erlenmeyer flask and 2.1 g of agarose are
added. The neck of the flask is loosely sealed with saran wrap, and a magic marker
is used to annotate the fluid level on the side of the flask. The agarose mixture is
then boiled for ~3 min using a microwave oven set at high power. An oven mitt is
utilized to swirl the contents of the flask intermittently. The solution should be
visually inspected to ensure that all agarose has completely dissolved. If any buffer

203
has evaporated, the flask should be filled to the mark with ddH2O and its contents
swirled.
3. The agarose solution is cooled to ~60 °C. A total of 10.5 µL of ethidium bromide
(5 mg/mL) is added and the flask is swirled to mix.
4. To cast the gel, the agarose solution is poured into the gel tray. Air bubbles are
aspirated from the poured gel using a Pasteur pipette. The gel is then allowed to
solidify undisturbed (~40 min at room temperature).
5. A few mL of 1X TAE are poured onto the tray. The tape is gently removed and the
gel tray is transferred to an electrophoresis tank.
6. Approximately 700 mL of 1X TAE are added to the tank. The gel combs are gently
removed and a total of 70 µL of ethidium bromide (5 mg/mL) is added to the 1X
TAE.
Experimental Procedure: Loading and Running the Gel Demonstration (to be
conducted by the Instructor and Students)
1. In order to separate the PCR products from the mineral oil layer, insert a pipette tip
through the mineral oil and transfer 20 µL of the FT/R PCR reaction from the
lower (aqueous) layer to a new 1.7 mL microfuge tube. In a similar fashion, transfer
20 µL of the FG/R reaction into a second 1.7 mL microfuge tube. Add 3 µL of 6X
loading buffer to each, briefly spin the microfuge tubes, vortex, and spin again.
2. The Instructor will add 3 µL of 6X loading buffer to 20 µL of a 1:20 dilution of
pGEM DNA size marker. He or she will load the resulting solution into two
outside wells of the 2% agarose gel (11 µL per well). The Instructor will also load

204
two control PCR reactions in which the template DNA has been substituted by
equivalent volumes of water.
3. Load 20 µL of the FT/R PCR reaction followed by 20 µL of the FG/R reaction into
interior wells of the gel, from left to right, in the order indicated below.
M = pGEM DNA size marker (2645 bp - 36 bp).
Control = PCR reactions, without template DNA.
Sample = PCR reactions, with template DNA.
T = FT/R PCR reaction.
G = FG/R PCR reaction.
Loading
M M
Control ...... Sample 1..... Sample 2..... Sample 3.....
Wells ......
T G T G T G T G
Sample 4.....
T G
“Agarose gel loading scheme.”
4. The Instructor will close the lid of the gel tank and will attach the leads so that the
DNA will migrate towards the anode (red lead).
5. The Instructor will apply a voltage of 1-5 V/cm (measured as the distance between
electrodes). If the leads have been attached correctly, the bromophenol blue in the
loading buffer will migrate from the wells into the body of the gel (towards the
anode). He or she will run the gel (~1 h) until the bromophenol blue has migrated
an appropriate distance.
6. After turning off the electric current and removing the leads and the lid from the gel
tank, the Instructor will (i) transfer the gel tray from the tank to a UV
transilluminator set at 302 nm, (ii) remove the tray, (iii) and photograph the gel
(optional).

205
7. Draw a sketch of the gel in your laboratory notebook. Discard all unused genomic
DNA and PCR amplified DNA into the liquid waste container containing 5%
bleach solution.
Commentary
In the final section of this laboratory, you will run your individual PCR reactions
on a 2% agarose gel adjacent to a pGEM DNA size marker (Promega). The pGEM
marker is comprised of DNA fragments that are 2645, 1605, 1198, 676, 517, 460, 396,
350, 222, 179, 126, 75, 65, 51, and 36 bp in size. The relative mobilities of these
fragments will enable you to identify your PCR products as follows. The primer pairs
FT/R and FG/R will each produce a DNA fragment 1661 bp in size in the case of
heterozygous females (both serine-T and alanine-G alleles are present, each on a separate
X chromosome). For homozygous males and females carrying the serine allele, only the
FT/R primer pair will produce a 1661 bp PCR product. Alternatively, only the FG/R
primer pair will produce a 1661 bp fragment in males and females that are homozygous
for the alanine allele.
Agarose Gel Electrophoresis. Agarose gel electrophoresis is a routinely used
method for the separation and identification DNA fragments ranging from 200 bp to 50
kbp in length (1,2). Agarose, which is extracted from seaweed, in a linear polysaccharide
consisting of repeating D-galactose and 3,6-anhydro L-galactose subunits. When voltage
is applied across an agarose gel, negatively charged DNA will migrate through the
agarose pores towards the positively charged anode. The rate of migration is (i) inversely
proportional to the log10 of the number of base pairs in the DNA fragment and is (ii)
unaffected by base composition. The locations of bands containing as little as 1 ng – 10

206
ng DNA can be determined by treating the agarose gel with the fluorescent intercalating
dye ethidium bromide. (Ethidium bromide is a mutagen and should be handled with
extreme care.) Finally, the size of the DNA fragments which can be accurately resolved
is a function of the amount of agarose used to pour the gel (% [w/v]).
Instructor’s Notes
All procedures in Part 3 of this laboratory exercise should be conducted in a
second 3 1/2 h laboratory period. As part of a gel pouring demonstration, you should cast
and then run the 2% agarose gel that the students will use to resolve their PCR reactions.
In this way, it will only be necessary to use a single gel electrophoresis apparatus and
power supply to conduct this laboratory exercise. In addition, you should prepare and
load the pGEM DNA size marker and the negative PCR control reactions into appropriate
wells of the 2% agarose gel.
It may be necessary to optimize the volume of molten agarose used to cast the gel,
if an alternative to the recommended gel apparatus is employed. It is also important to
note that the robustness of the PCR reactions will depend on the yields of DNA obtained
in the extraction step of this laboratory exercise. Relatively low yields of genomic DNA
may produce faint PCR bands on the agarose gel. Finally, you should stress to your
students that their PCR data should not be taken as a definitive assignment of sequence
variation as it is not feasible to rule out the possibility of pipetting and other experimental
errors in the context of the laboratory exercise.

207
Literature Cited
1. Sambrook, J.; Fritsch, E.F.; Maniatis, T. Molecular Cloning: A Laboratory Manual;
Cold Spring Harbor Laboratory Press: Cold Spring Harbor, New York, 1989.
2. Ausubel, F.M.; Brent, R.; Kingston, R.E.; Moore, D.D.; Seidman, J.G.; Smith, J.A.;
Struhl, K. Current Protocols in Molecular Biology; John Wiley & Sons, Inc.: New
York, 1998.
Hazards
Students should wear splash proof goggles and latex gloves at all times. Ethidium
bromide is a known mutagen and should therefore be reacted with bleach prior to
disposal. Spent cytobrushes, pipette tips, collection tubes, and spin columns should be
washed with 70 % EtOH and buccal waste solutions should be reacted with bleach prior
to disposal.

208
Product Information
Chemicals, Supplies, and Equipment
Product Manufacturer Catalog # CAS#
Agarose Invitrogen 15510019 -
Bromophenol blue Aldrich 114405 [62625-28-9]
Cyto-Soft cytobrushes Fisher 2226357 -
DNA thermal cycler Perkin-Elmer Model 480 -
dNTP mix (10 mM each) Roche 1581295 -
EDTA Aldrich 106321 [85715-60-2]
Electrophoresis power supply Invitrogen Model 250 -
Ethanol (100%) Aldrich 245119 [64-17-5]
Ethidium bromide tablets Sigma E2515 [1239-45-8]
Ficoll (20% aqueous solution) Sigma F5415 [26873-85-8]
Gel electrophoresis
apparatus (large) Owl Scientific Model A1 -
Gel electrophoresis
apparatus (small) Bio-Rad Wide Mini Sub -
Glacial acetic acid Aldrich 338826 [64-19-7]
KCl Aldrich 208000 [7442-40-7]
KH2PO4 Sigma P5379 [7778-77-0]
Microcentrifuge tubes (1.7 mL) VWR 20170-650 -
Mineral Oil Fisher O121-1 -
Na2HPO4 Sigma S9390 [7782-85-6]
209
NaCl Aldrich 223514 [7647-14-5]
PCR primers BioSource Custom Order -
PCR reaction tubes (0.6 mL) Costar 29442-340 -
pGEM DNA size marker Promega G1741 -
Polaroid camera* Fisher FBPDC34 -
Polaroid B&W film 3000 ISO* Fisher 617538 -
QIAamp DNA Mini Kit Qiagen 51304 -
Taq polymerase Kit Roche 1146165 -
Tris base Aldrich 154563 [77-86-1]
UV Transilluminator VWR 21475-464 -
Vortexer VWR 58816-121 -
* These items are optional. They are not required to conduct this laboratory exercise.
Manufacturers Aldrich 1-800-558 9160
Bio-Rad Laboratories 1-800-424-6723
BioSource International 1-800-788-4362
Fisher Scientific 1-800-766-7000
Invitrogen Life Technologies 1-800-828-6686
Owl Scientific Inc. 1-800-242-5560
Perkin-Elmer Biosystems 1-800-327-3002
Promega Corporation 1-800-356-9526
Qiagen 1-800-426-8157
Roche Molecular Biochemicals 1-800-262-1640
Sigma 1-800-325-3010

210
VWR Scientific Products 1-800-932-5000
Buffer Preparation
Ethidium Bromide (5 mg/ml):
Dissolve one 100 mg ethidium bromide tablet (Sigma) in 20 mL of ddH2O.
Protect the solution from light in an amber bottle or with aluminum foil. Store at
room temperature.
PBS:
Dissolve 8 g of NaCl, 0.2 g of KCl, 1.44 g of Na2HPO4 and 0.24 g of KH2PO4 in
800 mL of ddH2O. Adjust pH to 7.4 with HCl, add ddH2O to 1000 mL. Sterilize
by autoclaving. Store at room temperature.
6X Loading Buffer (0.25% Bromophenol Blue, 15% Ficoll):
Dissolve 2.5 mg of bromophenol blue in 25 mL of ddH2O. Add 75 mL of 20%
Ficoll. Store at room temperature.
50X TAE Buffer:
Dissolve 242 g of Tris base in 600 mL of ddH2O, add 57.1 mL of glacial acetic
acid and 100 mL of 0.5M EDTA (pH 8.0). Adjust final volume to 1 liter with
ddH2O. (1X TAE is made from this stock solution by diluting with ddH2O.) Store
at room temperature.
211
SUMMARY
In Chapter II the syntheses of two acridine chromophores incorporating two or
four metal binding imidazole rings were described. DNA photocleavage assays were
conducted with compound 7 (four imidazole rings) and compound 10 (two imidazole
rings) in the absence and presence of 16 metals salts in sodium phosphate buffer pH 7.0.
Irradiation of pUC19 plasmid DNA employing a low-intensity broad spectrum
fluorescent lamp for 50 min (under aerobic conditions) revealed that photocleavage
yields by compound 7 were significantly enhanced in the presence of Hg(II), Fe(III),
Cd(II), Zn(II), V(V), and Pb(II). Moreover, compound 7 consistently produced higher
levels of metal-assisted DNA photocleavage in comparison to compound 10. DNA
cleavage yields by compound 7 irradiated without metal or run in the dark exhibited low
levels of cleavage.
To further examine DNA photocleavage and to gain insight on the factors
effecting metal-assisted photodamage, nicking assays were conducted by employing
different buffers and by varying the pH. These experiments indicated that at pH 5.0
compound 7 demonstrated efficient levels of DNA photocleavage. However, as the pH
was increased cleavage levels were dramatically reduced. At pH values ranging from 6.0-
8.0 and in the presence of Hg(II), Fe(III), Cd(II), Zn(II), V(V), and Pb(II), DNA
photocleavage yields were markedly enhanced. DNA thermal denaturation studies were
then conducted with calf thymus DNA in the presence of compound 7 and ZnCl2 as a
function of pH. At pH 5.0, the Tm value produced by compound 7 (no metal) was 96 ºC
while the value at pH 7.0 was 84 ºC. Upon the addition of ZnCl2, the Tm exhibited by
compound 7 at pH 7.0 was 90 ºC. Collectively, these studies indicated that both buffer

212
and pH could be utilized to effect metal-assisted DNA photocleavage. Moreover, the
metals might be compensating for the loss in positive charge density in compound 7 as
the pH was increased thereby increasing duplex stabilization and consequently enhancing
DNA photocleavage yields.
Scavenger assays with the six photoactive metal ions were employed to provide
insights into the photosensitization mechanism(s) underlying DNA damage. In the case of
Fe(III), metal-assisted photocleavage predominantly proceeded through a type I
(hydroxyl radical) mechanism. Metal-assisted DNA photocleavage by Hg(II), Cd(II),
Zn(II), V(V), and Pb(II) proceeded via type I and type II mechanisms. Additionally,
DNA photocleavage yields were dramatically reduced in photolysis reactions containing
the metal chelator EDTA, further establishing the necessary requirement for the presence
of Hg(II), Fe(III), Cd(II), Zn(II), V(V), and Pb(II) in DNA photodamage mediated by
compound 7.
The next studies explored the photochemical (absorbance and emission)
properties and DNA binding affinity (Tm) of compound 7 in the presence of the 16 metals
salts and calf thymus DNA. Based on the Hard-Soft Acid-Base theory, imidazole is a
borderline base which would be expected to form stable complexes with borderline and
soft acid metals. In the case of the borderline or soft acids, two trends emerged. First, the
photocleavage enhancing metals Zn(II), Cd(II), Hg(II), and Pb(II) exhibited high Tm
values and relatively low levels of fluorescence quenching in the presence of DNA.
Alternatively, the DNA photocleavage inactive metals Ni(II), Co(II), and Cu(II) produced
increased Tm values and the highest levels of fluorescence quenching with DNA. While
its conceivable that these three borderline metals interacted with compound 7 and

213
increased the Tm values of calf thymus DNA, their inability to enhance DNA
photocleavage might be attributed to the high levels of fluorescence quenching produced
in the presence of these metal ions and DNA. The hard acid metals Sn(IV), Sc(III),
Zr(IV), Cr(III), Ca(II), Mg(II), and Mn(II) produced low cleavage, while Fe(III) and
V(V) exhibited high levels of DNA photocleavage, respectively. Additionally, these 9
hard acid metals did not significantly effect fluorescence quantum yields or the Tm of calf
thymus DNA. In order to test for the one-electron photoreduction of Fe(III) and V(V) by
the excited state triplet of compound 7, a colorimetric assay using 1,10-phenanthroline
was developed. Accordingly, the assay revealed the involvement of Fe(II) and V(IV)
thereby suggesting that DNA photodamage in the presence of these two metal ions might
proceed via a Fenton mechanism generating cytotoxic diffusible hydroxyl radicals.
In Chapter III, the synthesis and characterization of a bisacridine incorporating a
copper(II) binding pyridine linker (compound 4) was reported. In the absence of metal,
ligand 4 displayed higher apparent binding constants and preferential binding to GC-rich
DNA sequences as determined by employing a competitive equilibrium dialysis
experiment. DNA photocleavage studies employing pUC19 plasmid DNA irradiated at
419 nm under aerobic conditions equilibrated with compound 4 and CuCl2 in sodium
phosphate buffer pH 7.0 were conducted. These studies indicated that while irradiated
ligand 4 exhibited direct single strand breaks, in the presence of copper(II) DNA
photodamage produced additional double strand scission thereby markedly enhancing
cleavage yields.
To gain insight into the DNA binding affinity of compound 4 in the presence of
Cu(II) ions, DNA thermal denaturation experiments with calf thymus DNA were

214
conducted. DNA equilibrated with only CuCl2 did not exhibit any changes in the Tm
values (Tm values for DNA = 75 ºC and with Cu(II) = 75 ºC), while the addition of
compound 4 (no metal) produced a Tm value of 79 ºC. In the presence of 4 and Cu(II)
ions, the ΔTm was increased by 6 ºC in comparison to the value obtained for ligand 4
without metal.
With regards to the DNA photosensitization mechanism(s) involved in
photodamage, scavenger assays indicated the involvement of a singlet oxygen, hydrogen
peroxide and Cu(I). Because photoreduction of Fe(III) and V(V) by the excited state
acridine was observed in the previous study, a colorimetric assay employing the Cu(I)-
specific chelating agent bathocuproinedisulfonic acid disodium salt was employed. This
experiment provided evidence for the one-electron photoreduction of Cu(II) by the
excited state acridine chromophore and thus its involvement in mediating efficient DNA
photodamage via a Cu(I)-peroxide radical center. Furthermore, analysis of DNA
photocleavage at nucleotide resolution assays utilizing a 35S radiolabeled 138 bp from
pUC19 plasmid DNA fragment revealed direct DNA strand breaks without any base
specificity, thereby suggesting the participation of radicals in hydrogen atom abstraction
from deoxyribose at every nucleotide position. In contrast, post-irradiation addition of
piperidine base to the reactions containing ligand 4 and CuCl2 ions revealed alkali-labile
damage predominantly at guanine bases, most likely produced by singlet oxygen.
Taken together, these studies indicate that incorporating metal binding domains to
DNA photosensitizing acridine conjugates, can significantly increase the photoactivity of
these agents in the presence of metals. In the case of compound 7, efficient DNA
photodamage is achieved by employing a low-intensity light and can be modulated by

215
buffer and pH. Additionally, compound 7 demonstrates fluorescence emission tunability
in the presence of metals and may serve as a chemical tool to further probe nucleic acid-
ligand interactions. With regards to compound 4, the fact that non-specific DNA damage
was observed at every nucleotide position, make it conceivable that this ligand has
potential applications as a photofootprinting reagent. Finally, considering that Zn(II),
Fe(III) and Cu(II) are biologically important metal ions, photosensitizers that form
complexes with or can be effected by these metals may offer enhanced in vivo reactivity.
Chapter IV described the syntheses, characterization, and evaluation of a new
photosensitizer incorporating two phenothiazine rings (compound 3) and an electron
donating 4,4’-ethylenedipiperidine linker. The phenothiazine chromophore and linker
were introduced to potentially effect DNA photosensitization at longer wavelengths and
to provide additional DNA stability.
In the presence of DNA, compound 3 exhibited stronger absorption of light at a
longer wavelength (ε680 = 7.78 x 10⁴ M-1 (bp) cm-1) in comparison to the archetypal
phenothiazine MB (ε674 = 5.80 x 10⁴ M-1 (bp) cm-1). DNA photocleavage experiments
demonstrated that utilizing only 1 µM of compound 3 effected higher cleavage levels at
all wavelengths (676, 700, 710 nm) and time-points (10, 30, 60 min) tested as compared
to 1 µM MB. Irradiation of DNA at the longest wavelength (710 nm) as a function of
concentration also revealed that compound 3 possessed higher DNA cleaving activity.
Notably, 5 µM of compound 3 and 5 µM MB produced photocleavage yields of 93% and
59%, respectively.
DNA photocleavage inhibition of compound 3 was observed in the presence of
sodium azide (type II mechanism, singlet oxygen) and to a lesser extent with D-mannitol
216
(type I mechanism, hydroxyl radicals). Additionally, the analysis of DNA photodamage
at nucleotide resolution indicated the formation of both direct strand breaks and alkali-
labile lesions predominantly at guanine bases, pointing to the involvement of singlet
oxygen and/or electron transfer from guanine.
In order to investigate binding affinity, DNA melting experiments in the absence
and presence of compound 3 or MB with calf thymus and C. perfringens DNAs were
conducted. In each case, the ΔTm values produced by compound 3 pre-equilibrated with
calf thymus or C. perfringens DNAs were approximately 3-fold higher than the values
exhibited by MB under the identical experimental conditions. Furthermore, evaluation of
ΔTm as a function of the molar ratio of dye to calf thymus DNA bp (r) demonstrated that
the ΔTm values were consistently higher for compound 3 than MB at all the r values
tested (r = 0.05–0.6). Moreover, a plateau in the ΔTm produced by 3 at a r value ≥ 0.3
was observed thereby suggesting the saturation of DNA binding sites. This was not case
for MB: the ΔTm values continued to increase as a function of increasing dye
concentration (r > 0.3). Effectively, compound 3 demonstrated enhanced levels of duplex
stabilization compared to MB, thereby indicating a stronger association with DNA.
Viscometric measurements were conducted to ascertain the DNA binding mode(s)
of compound 3 in comparison to MB. The viscosity enhancement of CT DNA (slope =
0.962) produced by MB was consistent with monointercalation. However, the viscosity
enhancement of CT DNA (slope = 1.50) exhibited by compound 3 indicated the
possibility of multiple binding modes. To test this hypothesis, viscometric measurements
with poly(dA)•poly(dT) and alternating poly[(dA-dT)]2 DNAs yielded slopes of 0.22 and
1.18 for compound 3, and 0.17 and 1.11 for MB, respectively. Collectively, these assays
217
revealed that compound 3 is likely to associate with heterogeneous DNA through a
combination of binding modes including monointercalation, bisintercalation, and/or
groove binding.
The syntheses, characterization, and evaluation of two new photonucleases
incorporating one phenothiazinium ring with a bis-piperazinexylene substituent
(compound 5) or the same bis-piperazinexylene as a linker centrally attached to two
phenothiazinium rings (compound 6) were described in Chapter V. In the presence of
DNA, both compounds exhibited maximal absorbance at 665 nm in 10 mM sodium
phosphate pH 7.0. Moreover, 400-650 nm irradiation of pUC19 plasmid in the presence
of 10 µM 5 or 6 produced efficient photocleavage. DNA melting assays showed
significant changes in the ΔTm values produced by 5 (17 ºC) and 6 (19 ºC) relative to calf
thymus DNA (in the absence of dye). Lastly, viscosity measurements indicated that both
compounds bind to DNA as monointercalators.
The impetus for designing the three new phenothiazine-based photosensitizers
was to synthesize putative bisintercalators incorporating a chromophore that might
effectively mediate DNA photodamage at longer wavelength within the therapeutic
window for photodynamic therapy (600-800 nm). Towards this end, all three compounds
exhibited maximal absorption of light in the presence of DNA at wavelengths greater
than 650 nm and mediated efficient levels of DNA photocleavage. Moreover, cooperative
and stronger associations with DNA as demonstrated by thermal melting studies was
indicated for compounds 3, 5, and 6 in comparison to the MB parent. In the case of
compound 3, irradiation of pUC19 plasmid DNA at 710 nm produced approximately a
two-fold increase in cleavage yield in comparison to MB. Additionally, viscosity data

218
indicated that compound 3 associates with DNA through multiple modes including
bisintercalation.
Finally, the DNA isolation and amplification procedures presented in Chapter VI
constitute a laboratory workshop which provided participants with pratical experience in
commonly utilized methods in molecular biology. Moreover, the methods were modified
to be appropriate for the use in an undergraduate laboratory setting. While the goal was to
examine a single nucleotide polymorphism involved in a normal variation in human color
vision, the protocols offer experimental flexibility and can be utilized to investigate other
interesting single nucleotide polymorphisms.
With regards to the acridine and phenothiazine photosensitizers, the author of this
dissertation and her co-workers hope that the project findings described herein will
stimulate a growing interest in the design of new intercalating photosensitizers for the use
in non-porphyrin based phototherapeutics.