synthesis and evaluation of expancel® microspheres662295/fulltext01.pdf · degree project in...
TRANSCRIPT
Synthesis and Evaluation of Expancel® Microspheres
Replacement of a Chemical of Environmental Concern
Tomas Gardfors
Degree Project in Engineering Chemistry, 30 hp
Report passed: sep 2013
Supervisors:
Carina Eriksson, Expancel
Tomas Hedlund, Umeå University

I
Abstract
Expancel produces thermally expandable microspheres which can be used in a wide variety of applications, e.g. shoe soles, wine stoppers, printing inks and leathers. The thermally expandable microsphere consists of a plastic shell encapsulating a gas (blowing agent). When heated, the microsphere expands to about 40 times its original volume. When the particle cools it also retains its shape. The sphere is produced by suspension polymerization. An organic phase, consisting of monomers, blowing agent, initiator and a cross-linker, is mixed with a water phase consisting of water, colloid and surfactant. Through vigorous agitation, small monomer droplets form in the water phase forming an emulsion. The polymerization reaction is then initiated by heating, transforming the monomer droplets into thermally expandable microspheres. The droplets are stabilized by the colloid, either flocculated silica or Mg(OH)2, and the surfactant. The goal of this degree project is to change the initiator suspension, from Suspension A to Suspension B, in two microsphere grades, namely 053-40 and FG-52. This exchange needs to be made because of environmental reasons. The nitrogen emission is also to be reduced by exchanging the nitrogen containing magnesium salt used to prepare the colloid to another magnesium salt. Furthermore, the post-polymerization chemical currently used in 053-40 is to be exchanged to sodium bisulfite to further decrease the nitrogen emissions and also simplify the production process. For the first Expancel grade, 053-40, a small scale (50ml) screening was conducted. This screening was set up using MODDE 9.0 and consisted of 11 samples including three center points. The initiator suspension was altered between Suspension A and Suspension B. Four magnesium salts were also used. This showed that Suspension B worked best along with Salt 2. This was then tested in 1-litre scale with positive results. The conversion when using sodium bisulfite was also tested in a time series experiment. Scale-up to 20-litre resulted, with a bit of tweaking, in spheres with the right properties. The change to Salt 2 and sodium bisulfite drastically reduced the nitrogen emission at the cost of increased COD. Since FG-52 has the same polymer shell as 053-40, no small scale screening was conducted. In 1-litre scale Salt 4 and Salt 2 were tested as alternative salts. Unfortunately, the recipe with Salt 4 did not work so well, but with some optimization it might be possible to produce microspheres with this Salt 4. The Suspension B/Salt 2 combination turned out well after a bit of modification of the original recipe. A wash test was conducted and current amount of wash water in production is sufficient to wash away residual counter-ions from the microspheres to below reporting limit. The spheres have expansion properties that meet the product specification, but is just outside of specification for a specific customer.

II
III
List of abbreviations WU Wet, unexpanded microspheres
DU Dry, unexpanded microspheres
SL Slurry, microspheres dispersed in water
MB Masterbatch, microspheres mixed with carrier
WE Wet, expanded microspheres
DE Dry, expanded microspheres
Tg Glass transition temperature
LALLS Low angle laser light scattering
Dv(0.5) Median diameter of volume distribution
Dn(0.5) Median diameter of number distribution
Span Particle size distribution
TMA Thermomechanical analysis
Tstart Temperature where microspheres start to expand
Tmax Temperature where maximum expansion is reached
TMA-dens Density at Tmax
TGA Thermogravimetric analysis
GC Gas chromatography
SEM Scanning electron microscopy
DOE Design of experiments
TC Tiny clave
COD Chemical oxygen demand
NaPS Sodium persulfate

IV
V
Table of contents
1. Introduction ................................................................................................................ 1
1.1 Aim of Degree Project ......................................................................................... 1 2. Theory ........................................................................................................................ 2
2.1 Polymers and Production of Microspheres .......................................................... 2 2.1.1 Polymers ....................................................................................................... 2 2.1.2 Polymerization .............................................................................................. 3
2.1.3 Microspheres ................................................................................................. 4 2.1.4 Production of Thermally Expandable Microspheres .................................... 5
2.2 Characterization and evaluation of microspheres ................................................ 6 2.2.1 Particle size analysis ..................................................................................... 6 2.2.2 Thermomechanical analysis (TMA) ............................................................. 6
2.2.3 Thermogravimetric analysis (TGA) .............................................................. 7
2.2.4 Gas chromatography (GC) ............................................................................ 7 2.2.5 Scanning electron microscopy (SEM) .......................................................... 7
2.2.6 Suppressed-ion anion chromatography ......................................................... 8 2.3 Design of Experiments (DOE) ............................................................................. 8
3. Method ....................................................................................................................... 9
3.1 053-40 .................................................................................................................. 9 3.1.1 Tiny Clave (TC) ............................................................................................ 9 3.1.2 1-litre scale .................................................................................................. 10
3.1.2 20-litre scale ................................................................................................ 11 3.2 FG-52 (520-80) .................................................................................................. 11
3.2.1 1-litre scale .................................................................................................. 11 3.2.2 Determination of counter-ion 2 concentration ............................................ 12
3.4 Analysis of Microspheres .................................................................................. 12
4. Results and discussion ............................................................................................. 13 4.1 053-40 ................................................................................................................ 13
4.1.1 TC-scale ...................................................................................................... 13 4.1.2 1-litre scale .................................................................................................. 15 4.1.3 20-litre scale. ............................................................................................... 19
4.2 FG-52 (520-80) .................................................................................................. 21 4.2.1 Exchange of initiator suspension and magnesium salt ............................... 21
4.2.2 Washing of microspheres ............................................................................ 22 4.2.3 Problems with Tmax ..................................................................................... 22
5. Conclusions and future work ................................................................................... 24
6. Acknowledgements .................................................................................................. 24 7. Bibliography ............................................................................................................ 25 Appendix A: Raw data for 053-40 and Fg-52

VI
1
1. Introduction
In the year 1980, researchers discovered plastic microspheres that can expand, thus Expancel® was born. Today the company Expancel is part of AkzoNobel and is one of the largest manufacturers of expandable microspheres and also provides various solutions for product application. The head office, sales, research, development and the major part of the production is located at the AkzoNobel site in Stockvik, Sundsvall. Sales offices can be found in Germany, the Netherlands, Russia, Poland, Italy, China, US and Brazil. There are also smaller production units in China and USA. Microspheres are very small spherical particles consisting of a polymer shell encapsulating a gas. When heated, the shell softens and the pressure of the gas increases, thus causing an expansion of the particle. When cooled, the particle retains its shape and the volume is now up to 40 times larger. There are several valuable properties of the expanded particle – lightweight, compressibility, light reflecting and insulating properties to name a few. Expanded microspheres can therefore be used to add bulk at a low cost e.g. in paints. Due to the unexpanded spheres ability to expand in a production step involving heat it can be used for surface modification e.g. to create a relief structure in printing inks. Expancel® is used in a wide range of commercial applications. Microspheres can be used in thermoplastics to make shoe soles, wine stoppers and cables. Another application is thermosets and examples include cultured marble, putties and model making board. Expancel® is also used in coatings such as paints, inks and leather. Other applications are board, adhesives, sealants and underbody coatings, technical textiles and non-wovens, frost resistant concrete and toy clay. Expancel® is made in a number of different grades and can be delivered as WU (wet, unexpanded), DU (dry, unexpanded), SL (slurry), MB (masterbatch), WE (wet, expanded) or DE (dry, expanded) depending on the application. AkzoNobel strives to be sustainable and has several certificates as proof. Research and development units within the company are currently working on exchanging environmentally harmful substances used in different processes with the aim to reduce the environmental footprint of the products of AkzoNobel [1].
1.1 Aim of Degree Project The main goal of this degree project is to exchange an initiator suspension in two Expancel® grades. The reason is that the current initiator suspension contains an emulsifying agent which is to be phased out because of environmental reasons. This exchange is not straight-forward since the impact of the emulsifying chemical on the formation of the microsphere emulsion and the following polymerization is not fully investigated or understood. However previous work performed at Expancel indicates that the exchange is possible without any drastic change of the properties of the microspheres [2]. At the same time, to reduce the nitrogen emissions, a nitrogen containing magnesium salt used to create the stabilization system for the microspheres is also to be exchanged to another magnesium salt. Furthermore, the post-polymerisation step, where the residual monomer content of the microspheres is reduced, is to be changed. Not only to spare the environment, but also to simplify the production process. All these modifications have to be made without changing the properties of the investigated microsphere grades. To secure that the properties remain the same the following factors are monitored: size (Dv), span, fraction of volume median and number median (Dv/Dn), temperature for start of expansion (Tstart), temperature of maximum expansion (Tmax), thermomechanial density (TMA-

2
dens), amount of residual monomers, volatile content, ash residue and cooling need, i.e difference between reactor temperature and cooling water, at maximum heat production of the polymerization (∆T).
2. Theory
2.1 Polymers and Production of Microspheres
2.1.1 Polymers
Polymers are macromolecules, i.e. large molecules. The name originates from the Greek poly, meaning “many” and mer, meaning “part”. The word polymer was first used by Jacob Berzelius in 1833. Polymers are synthesized from small and simple molecules called monomers (“single part”). Synthetic polymers can have molecular weights in the range of several thousand up to several million atomic mass units. However there are also natural polymers such as polysaccharides, proteins and nucleic acids. Polymers can be found all around us in our everyday life and at various, if not all, workplaces. In the beginning of polymer industry, modified natural polymers were marketed and sold. One of the first was nitrated cellulose, also known as gun cotton. Later the polymerization of styrene was discovered and during the 1860’s the synthesis of poly(ethylene glycol) and poly(ethylene succinate) was published. The first true synthetic polymer saw the light of day in the early twentieth century by the hands of Leo Baekeland. He managed to successfully synthesize a phenol-formaldehyde resin, better known as Bakelite [3]. The properties of the polymers depend upon the properties of the constituting monomers but also on the conformation of the polymer chains. High crystallinity is achieved when chains are ordered side-by-side and for this to happen the chains must not be coiled hence no bulky side-groups can be present. It is highly unlikely to achieve a completely crystalline structure of a polymer. Usually, a polymer is partly crystalline with some regions being amorphous i.e. the chains are coiled and unordered. A melted, amorphous polymer material that is cooled doesn’t solidify instantly. It rather goes through a number of phases from viscous liquid to the point when the material has lost all thermal motion and becomes a solid. This point is called the glass transition temperature (Tg). Above the Tg, a material can be malleable but transits to hard and brittle when the temperature drops under Tg. Polymer materials are held together by van der Waal’s forces or hydrogen bonds. This is called molecular cohesion and is expressed as the average force between repeating units of a polymer chain and adjacent chains. Hydrogen bonds have the greatest contribution, dipole-dipole forces contribute less and London dispersion forces the least. The strength of the interactions diminishes rapidly and therefore amorphous materials have low cohesion, whereas crystalline materials have high cohesion. Another way to describe a polymer material’s property is modulus, a material’s stiffness. High modulus means high stiffness and low modulus means low stiffness. There are five main ways to use polymers, namely: as elastomers, plastics, fibers, surface coatings and adhesives. Elastomers (rubbers) have low modulus and usually high elasticity. They have low molecular cohesion; otherwise it would be difficult to stretch them. Polymers or resins that have been shaped by some process, e.g. casting, extrusion are called plastics. Properties of plastics vary depending on application. Fibers are often knitted or woven, and therefore they need high modulus and high molecular cohesion so that a single thread doesn’t pull apart. It is difficult to
3
generalize about surface coatings and adhesives since the properties vary in different applications [4].
2.1.2 Polymerization
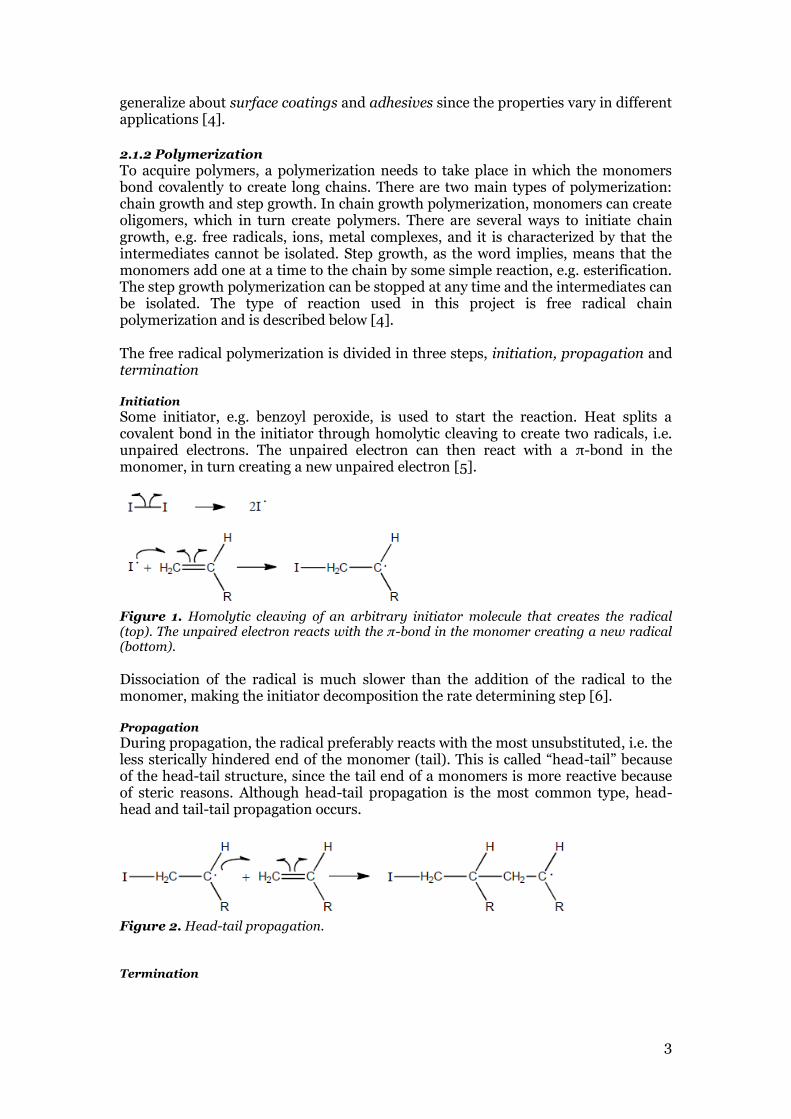
To acquire polymers, a polymerization needs to take place in which the monomers bond covalently to create long chains. There are two main types of polymerization: chain growth and step growth. In chain growth polymerization, monomers can create oligomers, which in turn create polymers. There are several ways to initiate chain growth, e.g. free radicals, ions, metal complexes, and it is characterized by that the intermediates cannot be isolated. Step growth, as the word implies, means that the monomers add one at a time to the chain by some simple reaction, e.g. esterification. The step growth polymerization can be stopped at any time and the intermediates can be isolated. The type of reaction used in this project is free radical chain polymerization and is described below [4]. The free radical polymerization is divided in three steps, initiation, propagation and termination Initiation Some initiator, e.g. benzoyl peroxide, is used to start the reaction. Heat splits a covalent bond in the initiator through homolytic cleaving to create two radicals, i.e. unpaired electrons. The unpaired electron can then react with a π-bond in the monomer, in turn creating a new unpaired electron [5].
Figure 1. Homolytic cleaving of an arbitrary initiator molecule that creates the radical (top). The unpaired electron reacts with the π-bond in the monomer creating a new radical (bottom).
Dissociation of the radical is much slower than the addition of the radical to the monomer, making the initiator decomposition the rate determining step [6]. Propagation During propagation, the radical preferably reacts with the most unsubstituted, i.e. the less sterically hindered end of the monomer (tail). This is called “head-tail” because of the head-tail structure, since the tail end of a monomers is more reactive because of steric reasons. Although head-tail propagation is the most common type, head-head and tail-tail propagation occurs.
Figure 2. Head-tail propagation.
Termination
4
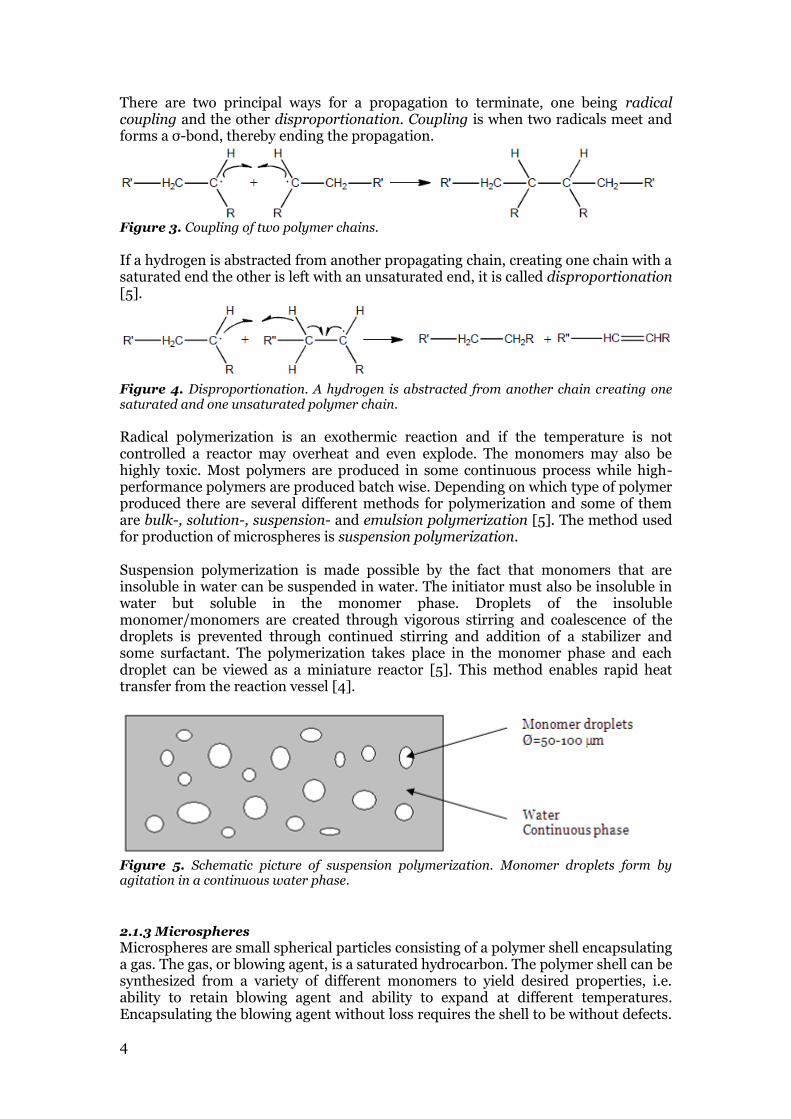
There are two principal ways for a propagation to terminate, one being radical coupling and the other disproportionation. Coupling is when two radicals meet and forms a σ-bond, thereby ending the propagation.
Figure 3. Coupling of two polymer chains.
If a hydrogen is abstracted from another propagating chain, creating one chain with a saturated end the other is left with an unsaturated end, it is called disproportionation [5].
Figure 4. Disproportionation. A hydrogen is abstracted from another chain creating one saturated and one unsaturated polymer chain.
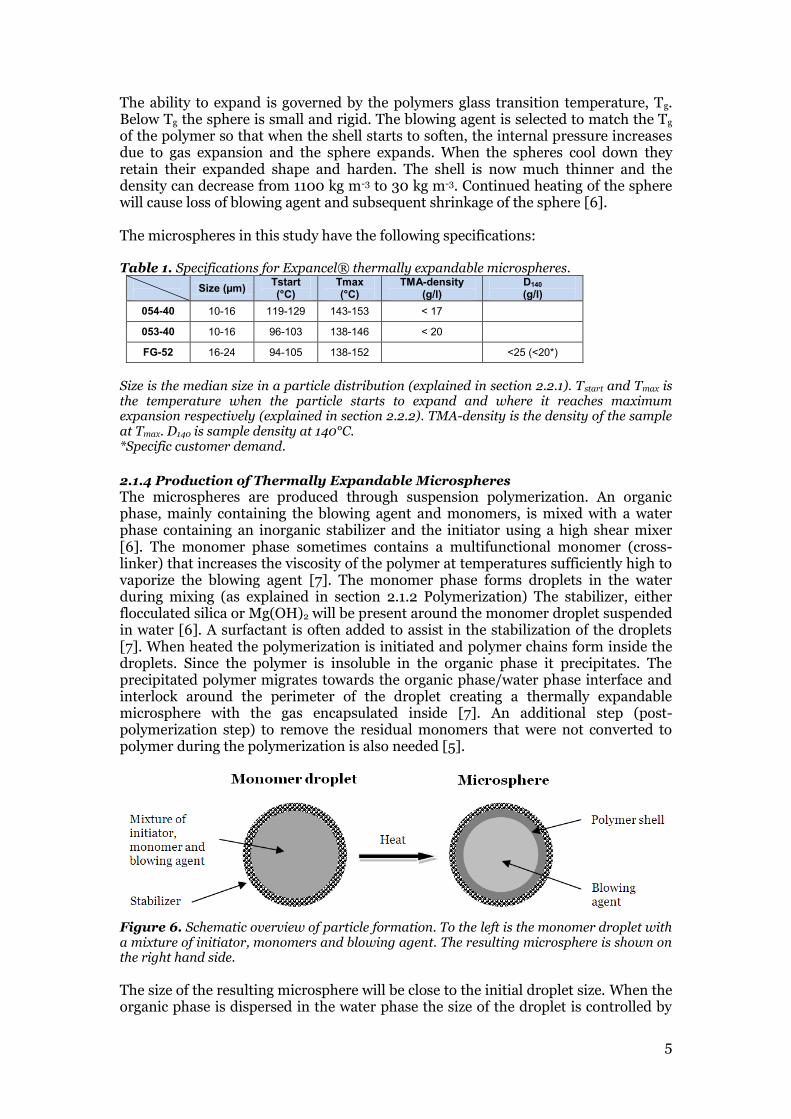
Radical polymerization is an exothermic reaction and if the temperature is not controlled a reactor may overheat and even explode. The monomers may also be highly toxic. Most polymers are produced in some continuous process while high-performance polymers are produced batch wise. Depending on which type of polymer produced there are several different methods for polymerization and some of them are bulk-, solution-, suspension- and emulsion polymerization [5]. The method used for production of microspheres is suspension polymerization. Suspension polymerization is made possible by the fact that monomers that are insoluble in water can be suspended in water. The initiator must also be insoluble in water but soluble in the monomer phase. Droplets of the insoluble monomer/monomers are created through vigorous stirring and coalescence of the droplets is prevented through continued stirring and addition of a stabilizer and some surfactant. The polymerization takes place in the monomer phase and each droplet can be viewed as a miniature reactor [5]. This method enables rapid heat transfer from the reaction vessel [4].
Figure 5. Schematic picture of suspension polymerization. Monomer droplets form by agitation in a continuous water phase.
2.1.3 Microspheres
Microspheres are small spherical particles consisting of a polymer shell encapsulating a gas. The gas, or blowing agent, is a saturated hydrocarbon. The polymer shell can be synthesized from a variety of different monomers to yield desired properties, i.e. ability to retain blowing agent and ability to expand at different temperatures. Encapsulating the blowing agent without loss requires the shell to be without defects.
5
The ability to expand is governed by the polymers glass transition temperature, Tg. Below Tg the sphere is small and rigid. The blowing agent is selected to match the Tg of the polymer so that when the shell starts to soften, the internal pressure increases due to gas expansion and the sphere expands. When the spheres cool down they retain their expanded shape and harden. The shell is now much thinner and the density can decrease from 1100 kg m-3 to 30 kg m-3. Continued heating of the sphere will cause loss of blowing agent and subsequent shrinkage of the sphere [6]. The microspheres in this study have the following specifications: Table 1. Specifications for Expancel® thermally expandable microspheres.
Size (µm) Tstart (°C)
Tmax (°C)
TMA-density (g/l)
D140 (g/l)
054-40 10-16 119-129 143-153 < 17
053-40 10-16 96-103 138-146 < 20
FG-52 16-24 94-105 138-152
<25 (<20*)
Size is the median size in a particle distribution (explained in section 2.2.1). Tstart and Tmax is the temperature when the particle starts to expand and where it reaches maximum expansion respectively (explained in section 2.2.2). TMA-density is the density of the sample at Tmax. D140 is sample density at 140°C. *Specific customer demand.
2.1.4 Production of Thermally Expandable Microspheres
The microspheres are produced through suspension polymerization. An organic phase, mainly containing the blowing agent and monomers, is mixed with a water phase containing an inorganic stabilizer and the initiator using a high shear mixer [6]. The monomer phase sometimes contains a multifunctional monomer (cross-linker) that increases the viscosity of the polymer at temperatures sufficiently high to vaporize the blowing agent [7]. The monomer phase forms droplets in the water during mixing (as explained in section 2.1.2 Polymerization) The stabilizer, either flocculated silica or Mg(OH)2 will be present around the monomer droplet suspended in water [6]. A surfactant is often added to assist in the stabilization of the droplets [7]. When heated the polymerization is initiated and polymer chains form inside the droplets. Since the polymer is insoluble in the organic phase it precipitates. The precipitated polymer migrates towards the organic phase/water phase interface and interlock around the perimeter of the droplet creating a thermally expandable microsphere with the gas encapsulated inside [7]. An additional step (post-polymerization step) to remove the residual monomers that were not converted to polymer during the polymerization is also needed [5].
Figure 6. Schematic overview of particle formation. To the left is the monomer droplet with a mixture of initiator, monomers and blowing agent. The resulting microsphere is shown on the right hand side.
The size of the resulting microsphere will be close to the initial droplet size. When the organic phase is dispersed in the water phase the size of the droplet is controlled by
6
the equilibrium between the break up and coalescence of the monomer droplets. Coalescence is prevented through the presence of the stabilizer [6].
2.2 Characterization and evaluation of microspheres
2.2.1 Particle size analysis
The particle size is measured using laser diffraction or more accurately Low Angle Laser Light Scattering (LALLS). Many industries use this method as their standard for characterization and quality control and the method has a range of 0.1 to 3000 µm. The method is absolute, i.e. there is no need to calibrate the instrument against a standard. Laser light, commonly a He-Ne gas laser, is passed through a sample dispersed in water using a recirculation cell. The light scatters at an angle inversely proportional to the particle size, i.e. small particles scatters at large angles and large particles scatters at small angles. By measuring the angular variation with a detector, usually a slice of photosensitive silicon, the size, reported in equivalent sphere diameter (as described below), can be calculated from the angular scattering intensity by using the Mie theory of light scattering. Since the Mie theory estimates the volume of the particle the refractive indices of the material and medium, e.g. microspheres and water respectively, need to be known. The refractive index of the absorption part also needs to be known or estimated. It can often be hard to describe the shape and size of a particle with one number since all things in nature are 3-dimensional. This problem is solved by reporting the particle size as an equivalent sphere. For example a particle of known volume can be expressed as the diameter of a sphere with the same volume. By using this technique an entire sample can be measured, yielding a volume distribution [8]. For the purpose of this study the median value of the volume distribution, Dv(0.5) is used to characterize microsphere size. Dn(0.5) is derived from the volume distribution and represents the number median which is then used to get the ratio Dv(0.5)/Dn(0.5). Span represents the particle size distribution which is defined as:
( ) ( )
( ) ( )
2.2.2 Thermomechanical analysis (TMA)
By using a flat, sensitive probe, TMA can be used to detect thermal transitions in a polymer. This is done by heating a sample and then the probe detects changes in volume (dilatometry) during heating [3]. TMA is used to measure Tstart, Tmax and TMA-density of Expancel® thermally expandable microspheres. Tstart is the temperature when the microsphere starts to expand and Tmax when it reaches maximum volume before it starts to decompose. TMA-density is the density of the sample at Tmax.

7
Figure 7. TMA-curve. Tstart is where the slope starts and Tmax is the peak.
2.2.3 Thermogravimetric analysis (TGA)
TGA is used to determine the thermal stability of a polymer. The most common is nonisothermal TGA. A sample is placed on a sensitive balance. The temperature is then increased in an inert atmosphere. The weight of the sample is recorded as temperature increases. The change in weight is due to vaporization of volatiles, moisture and polymer decomposition [3].
Figure 8. TGA-curve from a microsphere. The first slope is where the blowing agent vaporizes. The second slope (at 15-20 min) is where the polymer decomposes. The third slope shows the combustion of the polymer leaving the ash residue.
2.2.4 Gas chromatography (GC)
In gas chromatography, a sample is injected trough a septum into a heated port where the volatile compounds in the sample vaporizes. The volatiles are then transported by an inert carrier gas, e.g. helium or nitrogen, through a column. The column can be of different types. Common are open tubular (capillary) and packed columns with either a liquid or a solid stationary phase. Choice of column affects separation of analytes, analysis time, sensitivity and sample capacity. The analytes eventually arrives at a detector connected to a computer [9]. Gas chromatography is used to detect type and quantity of residual monomers in the microspheres.
2.2.5 Scanning electron microscopy (SEM)
SEM is mainly used to study surface topology. A very fine electron beam is scanned across a sample surface and the electrons scatters of the scanned sample. The
0.00
500.00
1000.00
1500.00
75 100 125 150 175 200
Heig
ht
[µm
]
Temperature [°C]
TMA
8
scattered electrons are used to create an image with great depth of field, resolution (about 10 nm) and an almost three-dimensional appearance [3].
2.2.6 Suppressed-ion anion chromatography
The critical component is a separator, a column which separates anions by ion exchange. A KOH eluent is used which creates a sodium species for the anion analyzed, e.g. K2SO4. The anions are detected by electrical conductivity. A problem with KOH eluent is that its high conductivity obscures the anions. This is solved by the suppressor. The suppressor replaces K+ with H+ thus replacing KOH with H2O, which has low conductivity thus not obscuring the analytes [9].
2.3 Design of Experiments (DOE) Design of experiments (DOE) is a technique used to gain knowledge, increase understanding and estimate good operational conditions for a process, a system or a product. It can be used to develop new products, optimize an already existing process and screening of important factors to name a few applications. Traditionally experiments have been conducted by changing one separate factor (COST) at a time and by doing so the true optimum is not found. Varying one factor at a time does not only lead to a tremendous amount of experiments but one does not see interaction effects. If DOE is used instead a prepared set of experiments can be created where relevant factors are varied simultaneously. By doing this the interaction effects can be investigated, information that is otherwise lost by using a COST approach. The experimental region can also be mapped to create a contour plot of the experimental region. Furthermore DOE can detect systematic and nonsystematic variability, i.e. separate real effects from noise. This can be a problem when using the COST approach since noise can be interpreted as a real effect and vice versa. When a design is selected a number of relevant responses must be chosen. The responses may for example be yield, taste or size, all depending on what is investigated. For each response a model is fitted. The model is characterized by R2, Q2, Model validity and Reproducibility. R2 is the “goodness of fit”, e.g. how well current runs can be reproduced. The R2 value ranges from 0 to 1 where 1 indicates a perfect fit. Q2 is the “goodness of prediction” and indicates how well new experiments can be predicted by the model. Q2 varies from -∞ to 1. Q2 > 0,5 indicates a good model and over 0,9 is considered an excellent model. Q2 is usually used as a compass in determining which interactions and factors are important. Model validity is a measure on how good the model is and a value above 0,25 is sought. The reproducibility assesses variation between replicates [10].

9
3. Method
The method part is divided with regard to Expancel® microsphere grade and experimental scale of the experiments. Experiments were conducted in 50 ml (TC), 1-litre and 20-litre scale. TC and 1 liter scale experiments were conducted by the author and the 20-litre scale runs by the staff in the pilot lab at Expancel. All 1-liter scale runs were conducted in reactor Delta. The only exception was TG-17, which was conducted in reactor Gamma. In total 26 runs were performed, called TG-2 to TG-30. TG-2 and TG-3 were the TC-scale experiments resulted in six samples from each run.
3.1 053-40
3.1.1 Tiny Clave (TC)
Since the goal was to change initiator suspension from Suspension A to Suspension B and also change the magnesium salt, screening trials were conducted in TC scale. Four magnesium salts were chosen for the screening. Salt 1 is currently used. In an attempt to see interaction effects between the chosen initiator suspension and different magnesium salts, the MODDE 9.0 software was used to set up the experimental space, as seen in Table 2. Table 2. Experimental setup for the TC-screening.
Experiment Susp. A Susp. B Salt 1 Salt 4 Salt 3 Salt 2
1 x
x
2
x x
3 x
x
4
x
x
5 x
x
6
x
x
7 x
x
8
x
x
9 x
x 10 x
x
11 x
x
The experiments were supposed to be conducted at random, but for practical reasons concerning the preparation of the colloid/stabilizer this was not possible. Each TC-run consisted of six 50 ml glass micro reactors from Büchi. The organic phase consisting of monomers, blowing agent and cross-linker were weighed and divided into six parts. Due to practical reasons, the recipe contained isopentane (bp = 28°C) instead of isobutane (bp = -11°C). The change of blowing agent creates microspheres of the grade 054-40 instead of 053-40. This alteration was made because it is very difficult to add isobutane at room temperature to the open the TC-reactor. The initiator suspension was then added according to Table 2 to six 50 ml homogenization flasks. Different colloid suspensions were prepared by mixing the different magnesium salts and sodium hydroxide. The suspensions were then stirred to allow the Mg(OH)2 to flocculate. After stirring, a part of the colloid suspension was poured into a new beaker to prepare colloid 1. The surfactant, Surfactant 1, was added to colloid 1. Colloid 1 was then poured into the homogenization flasks according to the experimental table. The organic phase was added to the homogenization flask and
10
the solution was homogenized using a Silverson SL2T mixer to create the emulsion described in section 2.1.2 Polymerization. The emulsion was then transferred to a TC-reactor, the remaining part of the colloid was added and finally the TC-reactor was sealed. This procedure was repeated for each clave. The TC-reactors were placed in a water bath at x°C for y hours after which the temperature was increased to w°C for z hours. The polymerization was quenched by cooling to room temperature. The resulting slurry was sieved to remove agglomerates and large particles. Samples were prepared for analysis as described in section 3.4 Analysis of Microspheres.
3.1.2 1-litre scale
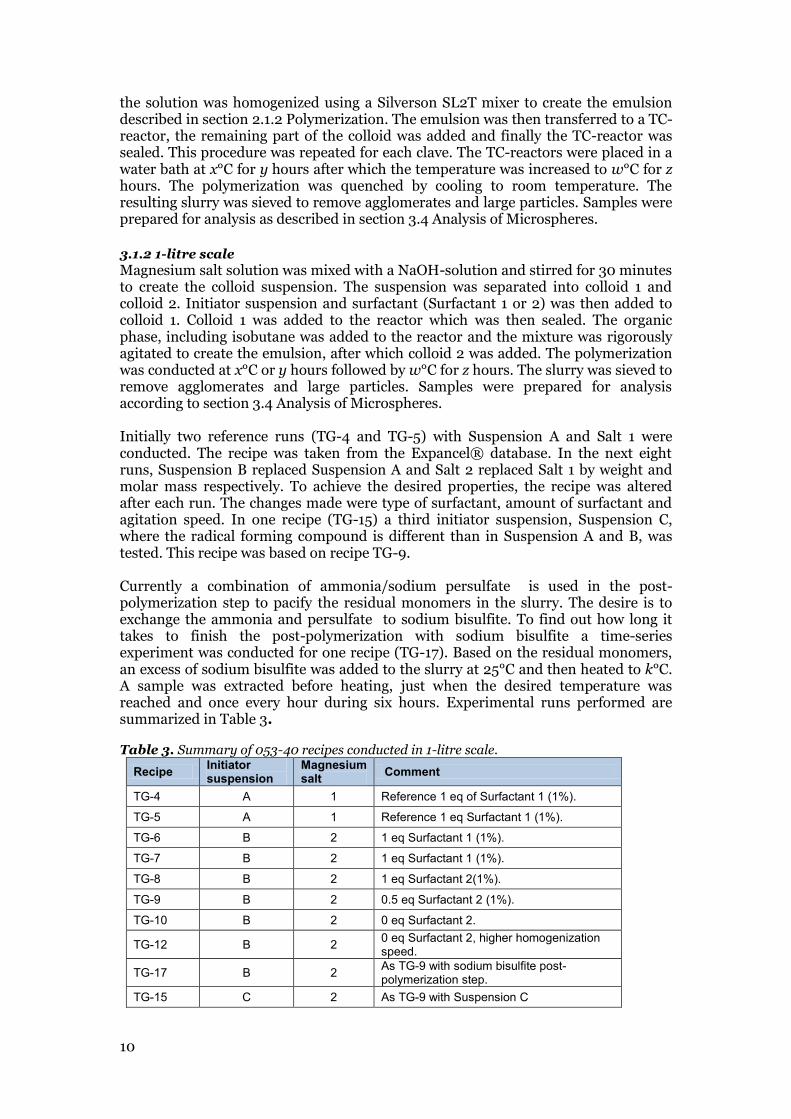
Magnesium salt solution was mixed with a NaOH-solution and stirred for 30 minutes to create the colloid suspension. The suspension was separated into colloid 1 and colloid 2. Initiator suspension and surfactant (Surfactant 1 or 2) was then added to colloid 1. Colloid 1 was added to the reactor which was then sealed. The organic phase, including isobutane was added to the reactor and the mixture was rigorously agitated to create the emulsion, after which colloid 2 was added. The polymerization was conducted at x°C or y hours followed by w°C for z hours. The slurry was sieved to remove agglomerates and large particles. Samples were prepared for analysis according to section 3.4 Analysis of Microspheres. Initially two reference runs (TG-4 and TG-5) with Suspension A and Salt 1 were conducted. The recipe was taken from the Expancel® database. In the next eight runs, Suspension B replaced Suspension A and Salt 2 replaced Salt 1 by weight and molar mass respectively. To achieve the desired properties, the recipe was altered after each run. The changes made were type of surfactant, amount of surfactant and agitation speed. In one recipe (TG-15) a third initiator suspension, Suspension C, where the radical forming compound is different than in Suspension A and B, was tested. This recipe was based on recipe TG-9. Currently a combination of ammonia/sodium persulfate is used in the post-polymerization step to pacify the residual monomers in the slurry. The desire is to exchange the ammonia and persulfate to sodium bisulfite. To find out how long it takes to finish the post-polymerization with sodium bisulfite a time-series experiment was conducted for one recipe (TG-17). Based on the residual monomers, an excess of sodium bisulfite was added to the slurry at 25°C and then heated to k°C. A sample was extracted before heating, just when the desired temperature was reached and once every hour during six hours. Experimental runs performed are summarized in Table 3. Table 3. Summary of 053-40 recipes conducted in 1-litre scale.
Recipe Initiator suspension
Magnesium salt
Comment
TG-4 A 1 Reference 1 eq of Surfactant 1 (1%).
TG-5 A 1 Reference 1 eq Surfactant 1 (1%).
TG-6 B 2 1 eq Surfactant 1 (1%).
TG-7 B 2 1 eq Surfactant 1 (1%).
TG-8 B 2 1 eq Surfactant 2(1%).
TG-9 B 2 0.5 eq Surfactant 2 (1%).
TG-10 B 2 0 eq Surfactant 2.
TG-12 B 2 0 eq Surfactant 2, higher homogenization speed.
TG-17 B 2 As TG-9 with sodium bisulfite post-polymerization step.
TG-15 C 2 As TG-9 with Suspension C
11
The idea of using Surfactant 2 instead of Surfactant 1 was based on previous work done at Expancel [2].
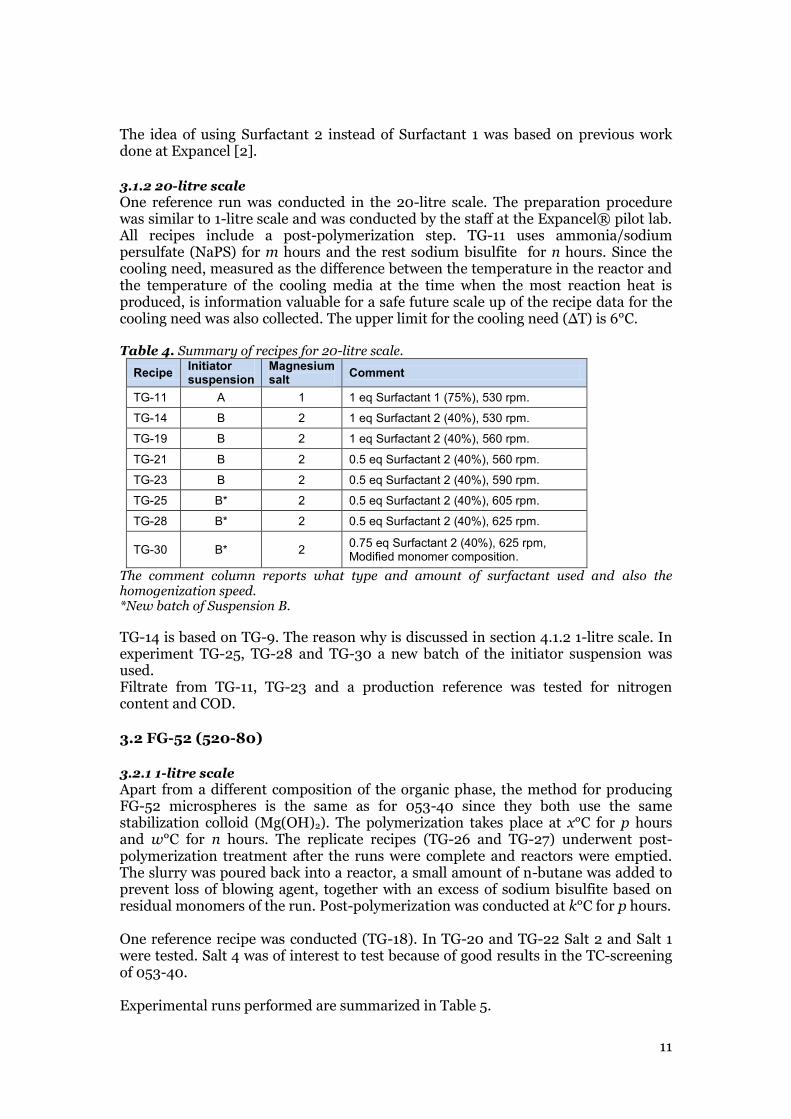
3.1.2 20-litre scale
One reference run was conducted in the 20-litre scale. The preparation procedure was similar to 1-litre scale and was conducted by the staff at the Expancel® pilot lab. All recipes include a post-polymerization step. TG-11 uses ammonia/sodium persulfate (NaPS) for m hours and the rest sodium bisulfite for n hours. Since the cooling need, measured as the difference between the temperature in the reactor and the temperature of the cooling media at the time when the most reaction heat is produced, is information valuable for a safe future scale up of the recipe data for the cooling need was also collected. The upper limit for the cooling need (∆T) is 6°C. Table 4. Summary of recipes for 20-litre scale.
Recipe Initiator suspension
Magnesium salt
Comment
TG-11 A 1 1 eq Surfactant 1 (75%), 530 rpm.
TG-14 B 2 1 eq Surfactant 2 (40%), 530 rpm.
TG-19 B 2 1 eq Surfactant 2 (40%), 560 rpm.
TG-21 B 2 0.5 eq Surfactant 2 (40%), 560 rpm.
TG-23 B 2 0.5 eq Surfactant 2 (40%), 590 rpm.
TG-25 B* 2 0.5 eq Surfactant 2 (40%), 605 rpm.
TG-28 B* 2 0.5 eq Surfactant 2 (40%), 625 rpm.
TG-30 B* 2 0.75 eq Surfactant 2 (40%), 625 rpm, Modified monomer composition.
The comment column reports what type and amount of surfactant used and also the homogenization speed. *New batch of Suspension B.
TG-14 is based on TG-9. The reason why is discussed in section 4.1.2 1-litre scale. In experiment TG-25, TG-28 and TG-30 a new batch of the initiator suspension was used. Filtrate from TG-11, TG-23 and a production reference was tested for nitrogen content and COD.
3.2 FG-52 (520-80)
3.2.1 1-litre scale
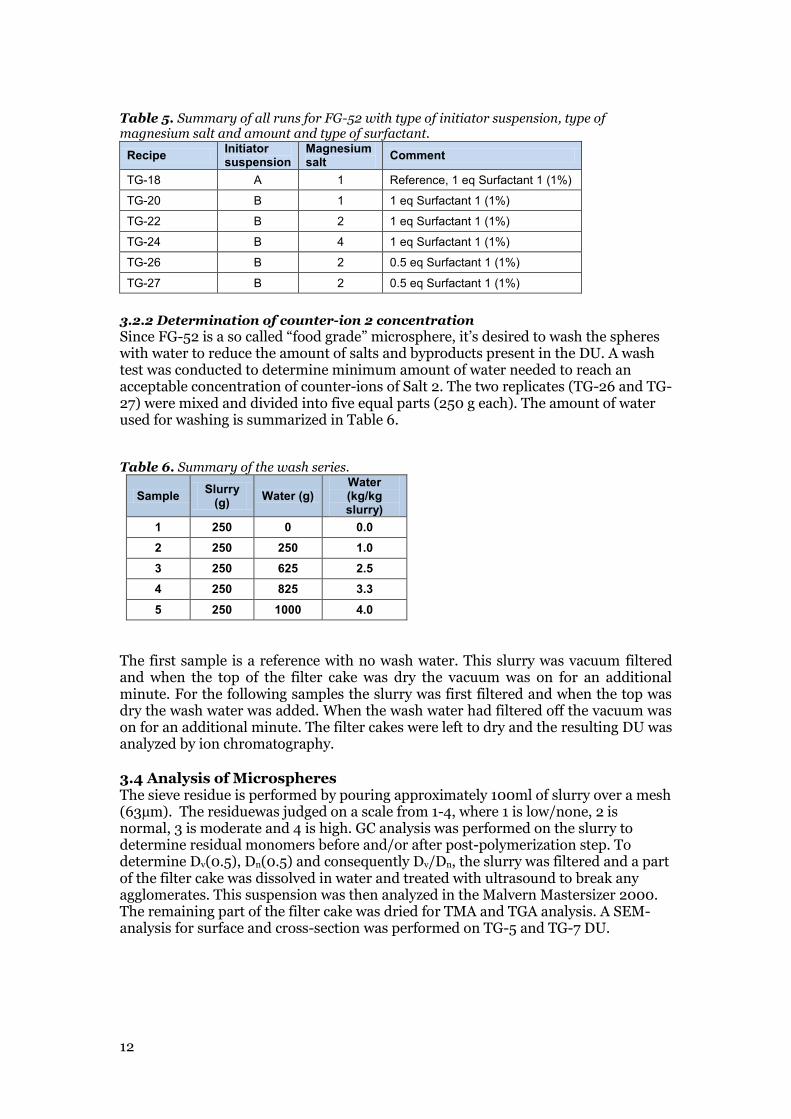
Apart from a different composition of the organic phase, the method for producing FG-52 microspheres is the same as for 053-40 since they both use the same stabilization colloid (Mg(OH)2). The polymerization takes place at x°C for p hours and w°C for n hours. The replicate recipes (TG-26 and TG-27) underwent post-polymerization treatment after the runs were complete and reactors were emptied. The slurry was poured back into a reactor, a small amount of n-butane was added to prevent loss of blowing agent, together with an excess of sodium bisulfite based on residual monomers of the run. Post-polymerization was conducted at k°C for p hours. One reference recipe was conducted (TG-18). In TG-20 and TG-22 Salt 2 and Salt 1 were tested. Salt 4 was of interest to test because of good results in the TC-screening of 053-40. Experimental runs performed are summarized in Table 5.
12
Table 5. Summary of all runs for FG-52 with type of initiator suspension, type of magnesium salt and amount and type of surfactant.
Recipe Initiator suspension
Magnesium salt
Comment
TG-18 A 1 Reference, 1 eq Surfactant 1 (1%)
TG-20 B 1 1 eq Surfactant 1 (1%)
TG-22 B 2 1 eq Surfactant 1 (1%)
TG-24 B 4 1 eq Surfactant 1 (1%)
TG-26 B 2 0.5 eq Surfactant 1 (1%)
TG-27 B 2 0.5 eq Surfactant 1 (1%)
3.2.2 Determination of counter-ion 2 concentration
Since FG-52 is a so called “food grade” microsphere, it’s desired to wash the spheres with water to reduce the amount of salts and byproducts present in the DU. A wash test was conducted to determine minimum amount of water needed to reach an acceptable concentration of counter-ions of Salt 2. The two replicates (TG-26 and TG-27) were mixed and divided into five equal parts (250 g each). The amount of water used for washing is summarized in Table 6. Table 6. Summary of the wash series.
Sample Slurry
(g) Water (g)
Water (kg/kg slurry)
1 250 0 0.0
2 250 250 1.0
3 250 625 2.5
4 250 825 3.3
5 250 1000 4.0
The first sample is a reference with no wash water. This slurry was vacuum filtered and when the top of the filter cake was dry the vacuum was on for an additional minute. For the following samples the slurry was first filtered and when the top was dry the wash water was added. When the wash water had filtered off the vacuum was on for an additional minute. The filter cakes were left to dry and the resulting DU was analyzed by ion chromatography.
3.4 Analysis of Microspheres The sieve residue is performed by pouring approximately 100ml of slurry over a mesh (63µm). The residuewas judged on a scale from 1-4, where 1 is low/none, 2 is normal, 3 is moderate and 4 is high. GC analysis was performed on the slurry to determine residual monomers before and/or after post-polymerization step. To determine Dv(0.5), Dn(0.5) and consequently Dv/Dn, the slurry was filtered and a part of the filter cake was dissolved in water and treated with ultrasound to break any agglomerates. This suspension was then analyzed in the Malvern Mastersizer 2000. The remaining part of the filter cake was dried for TMA and TGA analysis. A SEM-analysis for surface and cross-section was performed on TG-5 and TG-7 DU.

13
4. Results and discussion
All particle size measurements refer to a particle size distribution and the size is the median of this distribution. For simplicity, all sizes will be referred as particle size and not median of particle size distribution.
4.1 053-40
4.1.1 TC-scale
Unfortunately, the MODDE setup, which used type of initiator suspension and type of salt as qualitative factors at two and four levels respectively, did not produce a valid model. MODDE probably failed to produce a model because of the use of qualitative factors. This wasn’t investigated further since the results were conclusive enough to proceed to 1-litre scale. Raw data for the TC-runs is presented in Table 7. Table 7. Data overview for the initial TC-screening trial. Grey cells are excluded from the series.
Sample Initator susp.
Mg- salt
Sieve res.
Dv (µm)
Span Dv/Dn Tstart (°C)
Tmax (°C)
TMA-dens. (g/l)
1 A 1 2 12.4 1.21 2.4 130.5 153.0 13.7
2 B 1 2 10.7 1.28 2.3 128.5 149.7 12.9
3 A 4 2 19.6 1.61 8.6 128.5 155.8 10.2
4 B 4 3 13.3 1.05 1.6 131.0 151.7 12.9
5 A 3
6 B 3
7 A 2 4 32.0 1.77 7.8 121.5 157.9 12.7
8 B 2 2 13.5 1.22 1.8 133.0 150.7 14.1
9 A 1 2 12.6 1.10 1.7 164.5 224.9 8.6
10 A 1 2 11.6 1.28 2.6 129.0 151.6 13.0
11 A 1 2 11.8 1.31 2.8 126.0 151.2 6.8
The series showed that the type of initiator suspension and choice of magnesium salt had a large influence on the microsphere properties. Suspension A/Salt 1 is the combination used in production today and those experiments are therefore the reference samples. Sample 9 deviates heavily from the other reference experiments with regard to Tstart, Tmax and TMA-density. This is likely because of a mix up of samples during the procedure of analysis. The analysis of this sample was not repeated instead it was excluded from the series because there are several other reference samples with the correct properties. Both experiments (Sample 5 and 6), using Salt 3 failed. Counter-ion 3 apparently does not allow a stable emulsion to form resulting in a polymer “icicle” in the glass reactor.
14
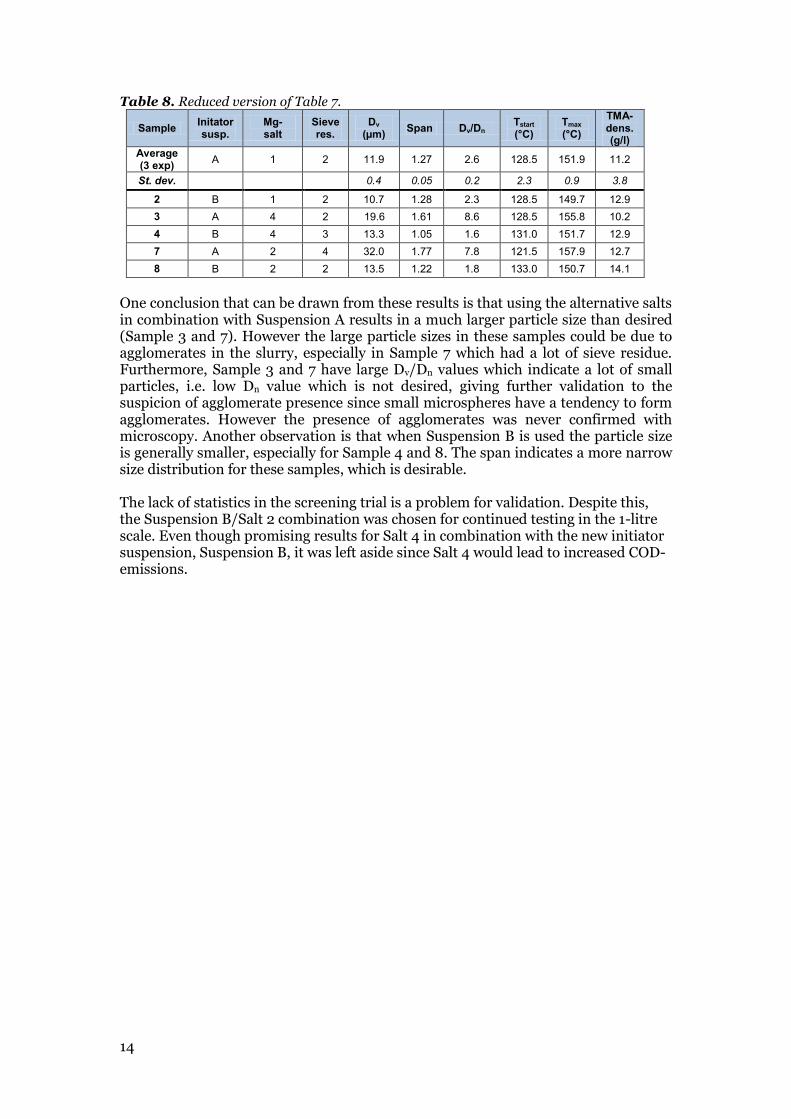
Table 8. Reduced version of Table 7.
Sample Initator susp.
Mg- salt
Sieve res.
Dv (µm)
Span Dv/Dn Tstart (°C)
Tmax (°C)
TMA-dens. (g/l)
Average (3 exp)
A 1 2 11.9 1.27 2.6 128.5 151.9 11.2
St. dev.
0.4 0.05 0.2 2.3 0.9 3.8
2 B 1 2 10.7 1.28 2.3 128.5 149.7 12.9
3 A 4 2 19.6 1.61 8.6 128.5 155.8 10.2
4 B 4 3 13.3 1.05 1.6 131.0 151.7 12.9
7 A 2 4 32.0 1.77 7.8 121.5 157.9 12.7
8 B 2 2 13.5 1.22 1.8 133.0 150.7 14.1
One conclusion that can be drawn from these results is that using the alternative salts in combination with Suspension A results in a much larger particle size than desired (Sample 3 and 7). However the large particle sizes in these samples could be due to agglomerates in the slurry, especially in Sample 7 which had a lot of sieve residue. Furthermore, Sample 3 and 7 have large Dv/Dn values which indicate a lot of small particles, i.e. low Dn value which is not desired, giving further validation to the suspicion of agglomerate presence since small microspheres have a tendency to form agglomerates. However the presence of agglomerates was never confirmed with microscopy. Another observation is that when Suspension B is used the particle size is generally smaller, especially for Sample 4 and 8. The span indicates a more narrow size distribution for these samples, which is desirable. The lack of statistics in the screening trial is a problem for validation. Despite this, the Suspension B/Salt 2 combination was chosen for continued testing in the 1-litre scale. Even though promising results for Salt 4 in combination with the new initiator suspension, Suspension B, it was left aside since Salt 4 would lead to increased COD-emissions.
15
4.1.2 1-litre scale
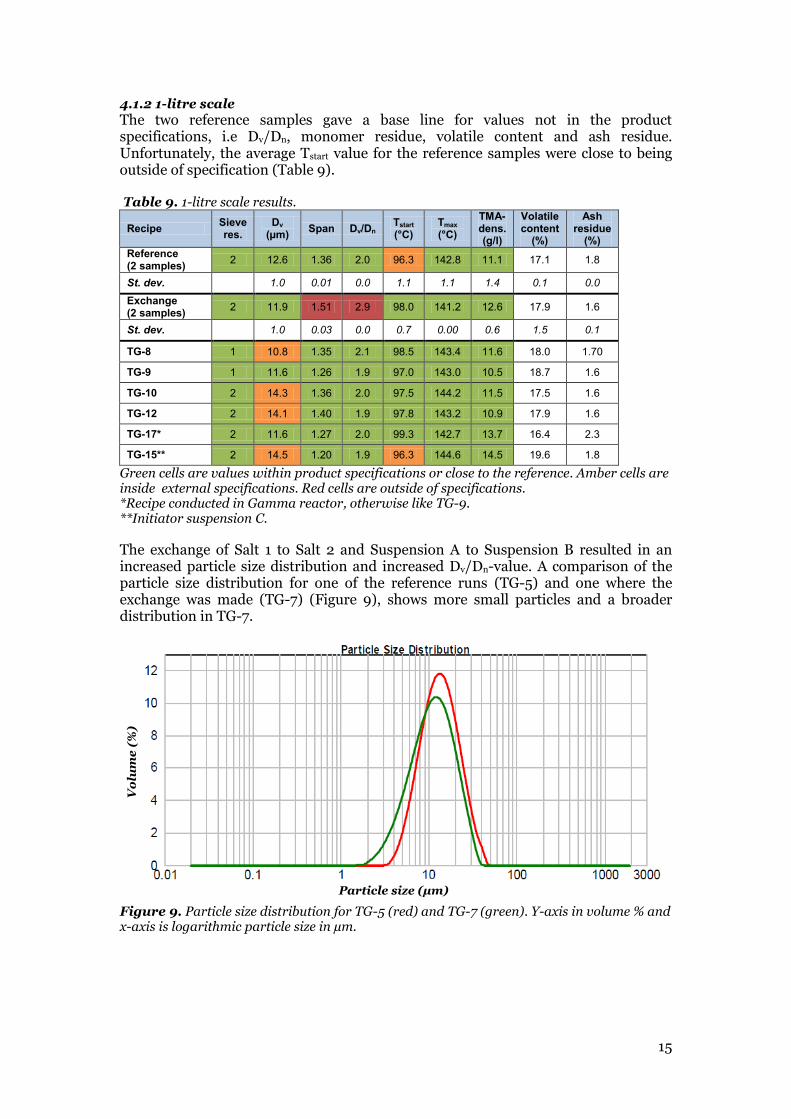
The two reference samples gave a base line for values not in the product specifications, i.e Dv/Dn, monomer residue, volatile content and ash residue. Unfortunately, the average Tstart value for the reference samples were close to being outside of specification (Table 9). Table 9. 1-litre scale results.
Recipe Sieve res.
Dv (µm)
Span Dv/Dn Tstart (°C)
Tmax (°C)
TMA-dens. (g/l)
Volatile content
(%)
Ash residue
(%)
Reference (2 samples)
2 12.6 1.36 2.0 96.3 142.8 11.1 17.1 1.8
St. dev.
1.0 0.01 0.0 1.1 1.1 1.4 0.1 0.0
Exchange (2 samples)
2 11.9 1.51 2.9 98.0 141.2 12.6 17.9 1.6
St. dev.
1.0 0.03 0.0 0.7 0.00 0.6 1.5 0.1
TG-8 1 10.8 1.35 2.1 98.5 143.4 11.6 18.0 1.70
TG-9 1 11.6 1.26 1.9 97.0 143.0 10.5 18.7 1.6
TG-10 2 14.3 1.36 2.0 97.5 144.2 11.5 17.5 1.6
TG-12 2 14.1 1.40 1.9 97.8 143.2 10.9 17.9 1.6
TG-17* 2 11.6 1.27 2.0 99.3 142.7 13.7 16.4 2.3
TG-15** 2 14.5 1.20 1.9 96.3 144.6 14.5 19.6 1.8
Green cells are values within product specifications or close to the reference. Amber cells are inside external specifications. Red cells are outside of specifications. *Recipe conducted in Gamma reactor, otherwise like TG-9. **Initiator suspension C.
The exchange of Salt 1 to Salt 2 and Suspension A to Suspension B resulted in an increased particle size distribution and increased Dv/Dn-value. A comparison of the particle size distribution for one of the reference runs (TG-5) and one where the exchange was made (TG-7) (Figure 9), shows more small particles and a broader distribution in TG-7.
Figure 9. Particle size distribution for TG-5 (red) and TG-7 (green). Y-axis in volume % and x-axis is logarithmic particle size in µm.
Particle size (µm)
Vo
lum
e (
%)
16
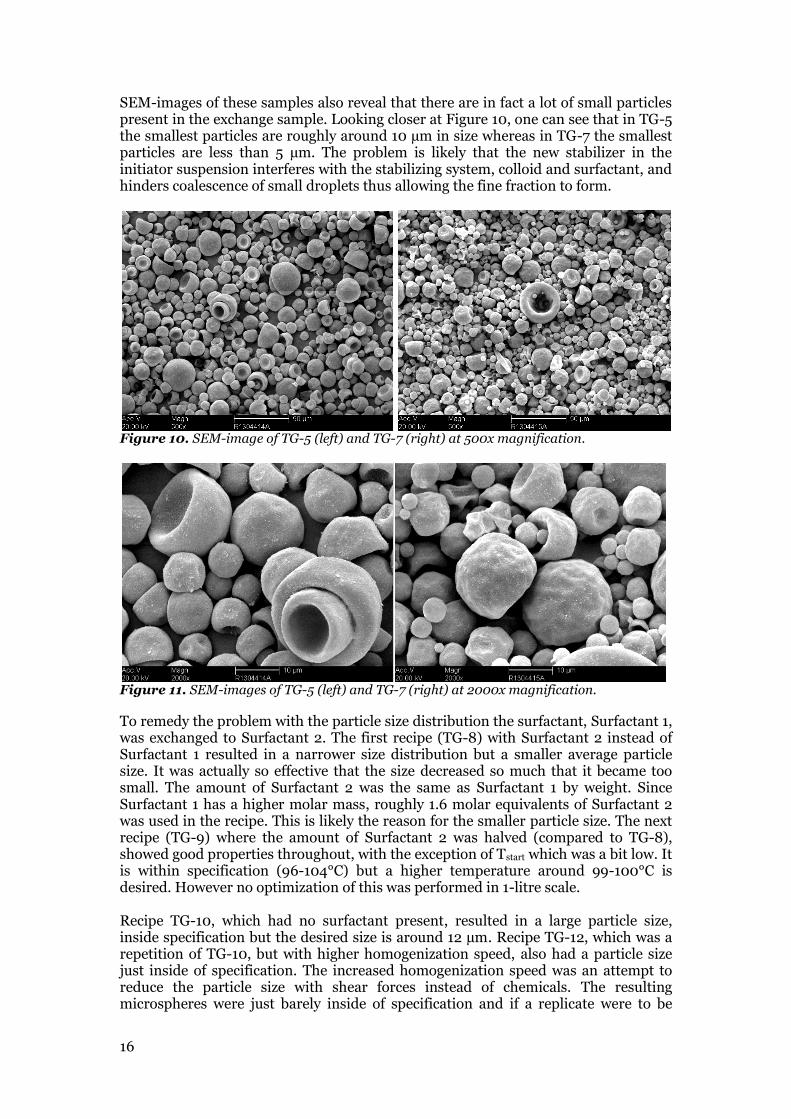
SEM-images of these samples also reveal that there are in fact a lot of small particles present in the exchange sample. Looking closer at Figure 10, one can see that in TG-5 the smallest particles are roughly around 10 µm in size whereas in TG-7 the smallest particles are less than 5 µm. The problem is likely that the new stabilizer in the initiator suspension interferes with the stabilizing system, colloid and surfactant, and hinders coalescence of small droplets thus allowing the fine fraction to form.
Figure 10. SEM-image of TG-5 (left) and TG-7 (right) at 500x magnification.
Figure 11. SEM-images of TG-5 (left) and TG-7 (right) at 2000x magnification.
To remedy the problem with the particle size distribution the surfactant, Surfactant 1, was exchanged to Surfactant 2. The first recipe (TG-8) with Surfactant 2 instead of Surfactant 1 resulted in a narrower size distribution but a smaller average particle size. It was actually so effective that the size decreased so much that it became too small. The amount of Surfactant 2 was the same as Surfactant 1 by weight. Since Surfactant 1 has a higher molar mass, roughly 1.6 molar equivalents of Surfactant 2 was used in the recipe. This is likely the reason for the smaller particle size. The next recipe (TG-9) where the amount of Surfactant 2 was halved (compared to TG-8), showed good properties throughout, with the exception of Tstart which was a bit low. It is within specification (96-104°C) but a higher temperature around 99-100°C is desired. However no optimization of this was performed in 1-litre scale. Recipe TG-10, which had no surfactant present, resulted in a large particle size, inside specification but the desired size is around 12 µm. Recipe TG-12, which was a repetition of TG-10, but with higher homogenization speed, also had a particle size just inside of specification. The increased homogenization speed was an attempt to reduce the particle size with shear forces instead of chemicals. The resulting microspheres were just barely inside of specification and if a replicate were to be
17
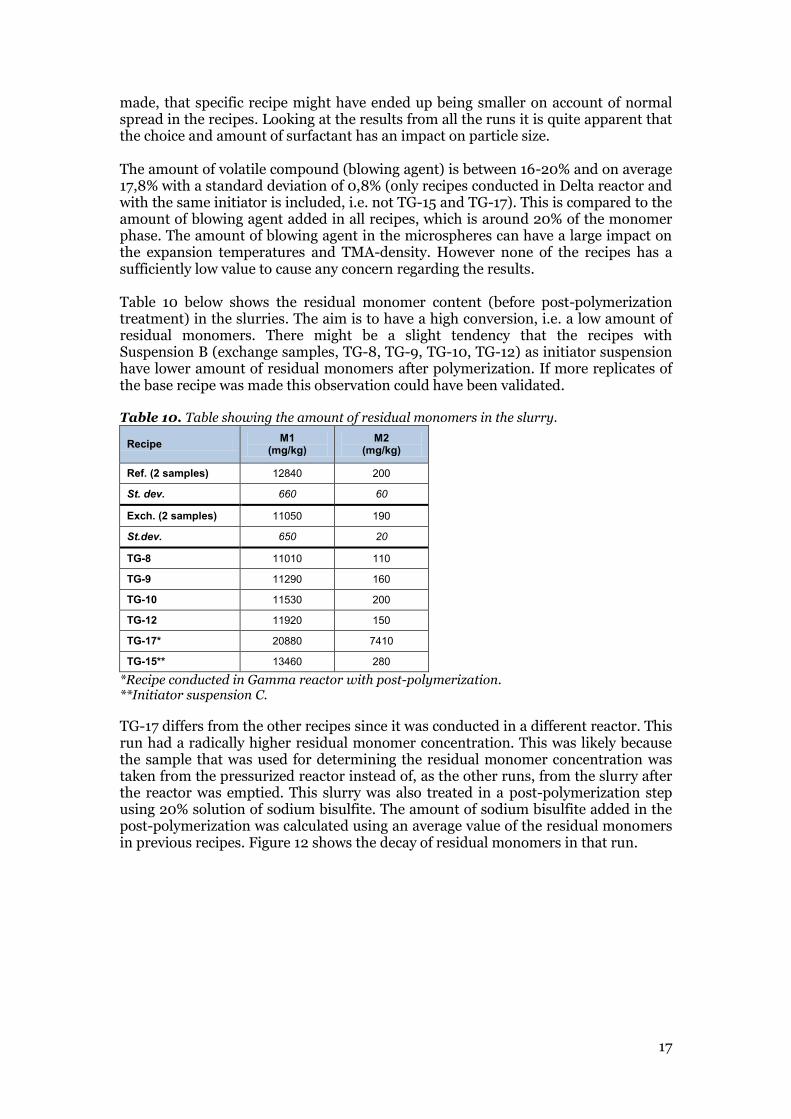
made, that specific recipe might have ended up being smaller on account of normal spread in the recipes. Looking at the results from all the runs it is quite apparent that the choice and amount of surfactant has an impact on particle size. The amount of volatile compound (blowing agent) is between 16-20% and on average 17,8% with a standard deviation of 0,8% (only recipes conducted in Delta reactor and with the same initiator is included, i.e. not TG-15 and TG-17). This is compared to the amount of blowing agent added in all recipes, which is around 20% of the monomer phase. The amount of blowing agent in the microspheres can have a large impact on the expansion temperatures and TMA-density. However none of the recipes has a sufficiently low value to cause any concern regarding the results. Table 10 below shows the residual monomer content (before post-polymerization treatment) in the slurries. The aim is to have a high conversion, i.e. a low amount of residual monomers. There might be a slight tendency that the recipes with Suspension B (exchange samples, TG-8, TG-9, TG-10, TG-12) as initiator suspension have lower amount of residual monomers after polymerization. If more replicates of the base recipe was made this observation could have been validated. Table 10. Table showing the amount of residual monomers in the slurry.
Recipe M1
(mg/kg) M2
(mg/kg)
Ref. (2 samples) 12840 200
St. dev. 660 60
Exch. (2 samples) 11050 190
St.dev. 650 20
TG-8 11010 110
TG-9 11290 160
TG-10 11530 200
TG-12 11920 150
TG-17* 20880 7410
TG-15** 13460 280
*Recipe conducted in Gamma reactor with post-polymerization. **Initiator suspension C.
TG-17 differs from the other recipes since it was conducted in a different reactor. This run had a radically higher residual monomer concentration. This was likely because the sample that was used for determining the residual monomer concentration was taken from the pressurized reactor instead of, as the other runs, from the slurry after the reactor was emptied. This slurry was also treated in a post-polymerization step using 20% solution of sodium bisulfite. The amount of sodium bisulfite added in the post-polymerization was calculated using an average value of the residual monomers in previous recipes. Figure 12 shows the decay of residual monomers in that run.
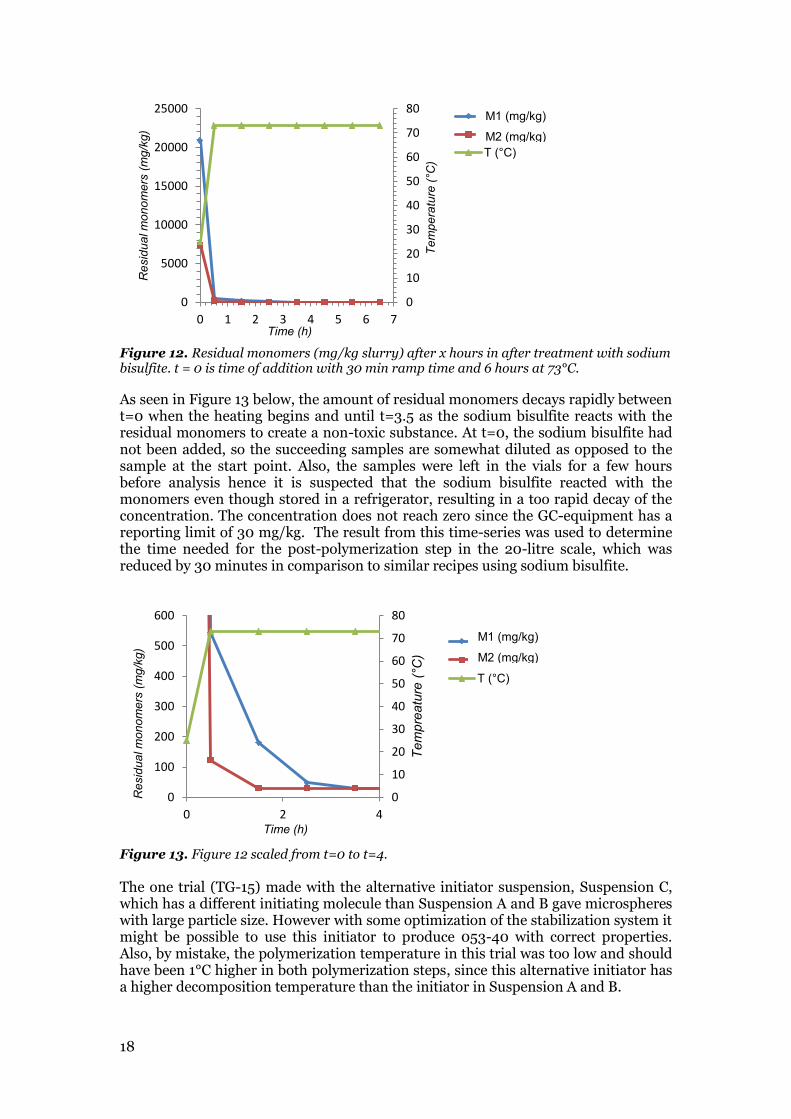
18
Figure 12. Residual monomers (mg/kg slurry) after x hours in after treatment with sodium bisulfite. t = 0 is time of addition with 30 min ramp time and 6 hours at 73°C.
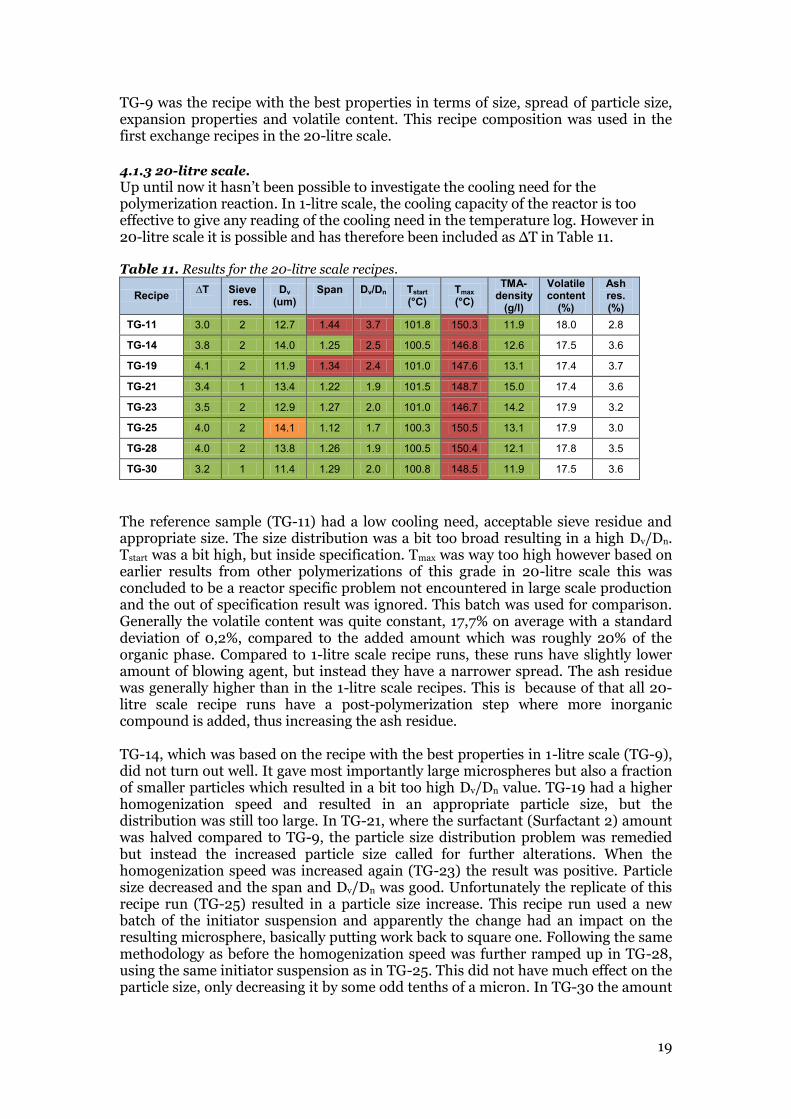
As seen in Figure 13 below, the amount of residual monomers decays rapidly between t=0 when the heating begins and until t=3.5 as the sodium bisulfite reacts with the residual monomers to create a non-toxic substance. At t=0, the sodium bisulfite had not been added, so the succeeding samples are somewhat diluted as opposed to the sample at the start point. Also, the samples were left in the vials for a few hours before analysis hence it is suspected that the sodium bisulfite reacted with the monomers even though stored in a refrigerator, resulting in a too rapid decay of the concentration. The concentration does not reach zero since the GC-equipment has a reporting limit of 30 mg/kg. The result from this time-series was used to determine the time needed for the post-polymerization step in the 20-litre scale, which was reduced by 30 minutes in comparison to similar recipes using sodium bisulfite.
Figure 13. Figure 12 scaled from t=0 to t=4.
The one trial (TG-15) made with the alternative initiator suspension, Suspension C, which has a different initiating molecule than Suspension A and B gave microspheres with large particle size. However with some optimization of the stabilization system it might be possible to use this initiator to produce 053-40 with correct properties. Also, by mistake, the polymerization temperature in this trial was too low and should have been 1°C higher in both polymerization steps, since this alternative initiator has a higher decomposition temperature than the initiator in Suspension A and B.
0
10
20
30
40
50
60
70
80
0
5000
10000
15000
20000
25000
0 1 2 3 4 5 6 7
Te
mp
era
ture
(°C
)
Re
sid
ua
l m
on
om
ers
(m
g/k
g)
Time (h)
ACN (mg/kg)
MMA (mg/kg)
T (°C)
0
10
20
30
40
50
60
70
80
0
100
200
300
400
500
600
0 2 4
Tem
pre
atu
re (°C
)
Resid
ua
l m
on
om
ers
(m
g/k
g)
Time (h)
ACN (mg/kg)
MMA (mg/kg)
T (°C)
M1 (mg/kg)
M2 (mg/kg)
M1 (mg/kg)
M2 (mg/kg)
19
TG-9 was the recipe with the best properties in terms of size, spread of particle size, expansion properties and volatile content. This recipe composition was used in the first exchange recipes in the 20-litre scale.
4.1.3 20-litre scale.
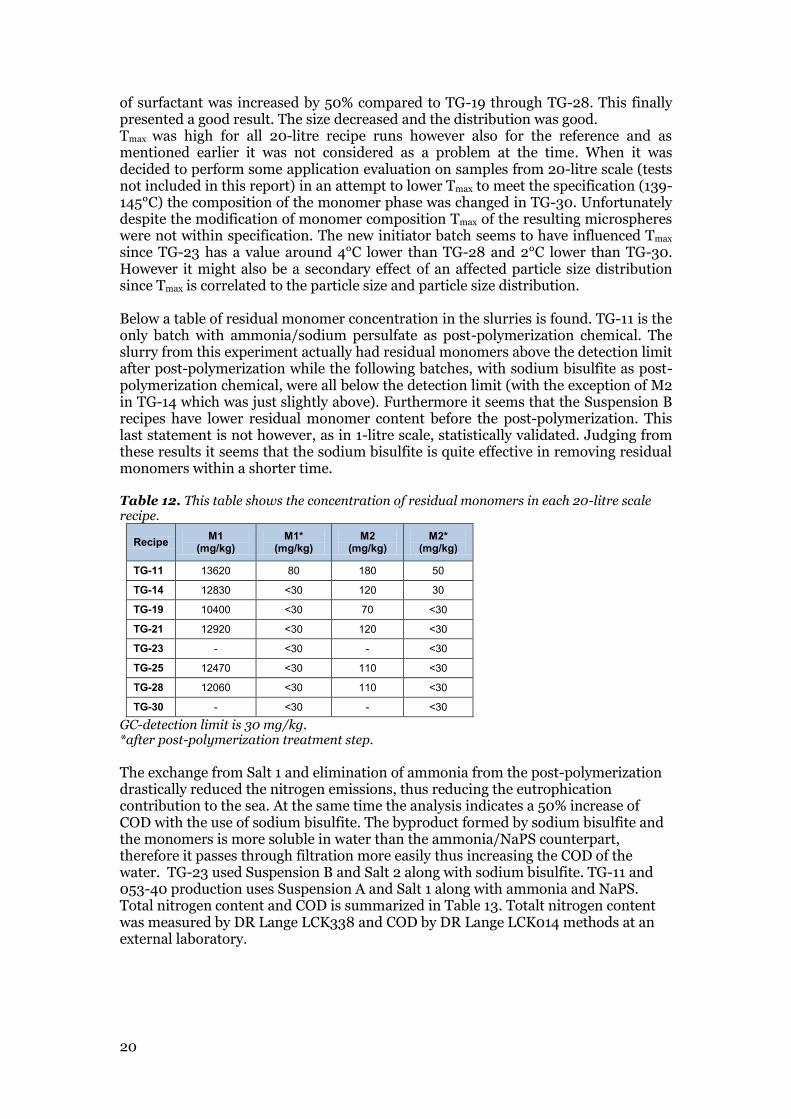
Up until now it hasn’t been possible to investigate the cooling need for the polymerization reaction. In 1-litre scale, the cooling capacity of the reactor is too effective to give any reading of the cooling need in the temperature log. However in 20-litre scale it is possible and has therefore been included as ΔT in Table 11. Table 11. Results for the 20-litre scale recipes.
Recipe ∆T
Sieve res.
Dv
(um) Span
Dv/Dn
Tstart
(°C) Tmax
(°C)
TMA-density
(g/l)
Volatile content
(%)
Ash res. (%)
TG-11 3.0 2 12.7 1.44 3.7 101.8 150.3 11.9 18.0 2.8
TG-14 3.8 2 14.0 1.25 2.5 100.5 146.8 12.6 17.5 3.6
TG-19 4.1 2 11.9 1.34 2.4 101.0 147.6 13.1 17.4 3.7
TG-21 3.4 1 13.4 1.22 1.9 101.5 148.7 15.0 17.4 3.6
TG-23 3.5 2 12.9 1.27 2.0 101.0 146.7 14.2 17.9 3.2
TG-25 4.0 2 14.1 1.12 1.7 100.3 150.5 13.1 17.9 3.0
TG-28 4.0 2 13.8 1.26 1.9 100.5 150.4 12.1 17.8 3.5
TG-30 3.2 1 11.4 1.29 2.0 100.8 148.5 11.9 17.5 3.6
The reference sample (TG-11) had a low cooling need, acceptable sieve residue and appropriate size. The size distribution was a bit too broad resulting in a high Dv/Dn. Tstart was a bit high, but inside specification. Tmax was way too high however based on earlier results from other polymerizations of this grade in 20-litre scale this was concluded to be a reactor specific problem not encountered in large scale production and the out of specification result was ignored. This batch was used for comparison. Generally the volatile content was quite constant, 17,7% on average with a standard deviation of 0,2%, compared to the added amount which was roughly 20% of the organic phase. Compared to 1-litre scale recipe runs, these runs have slightly lower amount of blowing agent, but instead they have a narrower spread. The ash residue was generally higher than in the 1-litre scale recipes. This is because of that all 20-litre scale recipe runs have a post-polymerization step where more inorganic compound is added, thus increasing the ash residue. TG-14, which was based on the recipe with the best properties in 1-litre scale (TG-9), did not turn out well. It gave most importantly large microspheres but also a fraction of smaller particles which resulted in a bit too high Dv/Dn value. TG-19 had a higher homogenization speed and resulted in an appropriate particle size, but the distribution was still too large. In TG-21, where the surfactant (Surfactant 2) amount was halved compared to TG-9, the particle size distribution problem was remedied but instead the increased particle size called for further alterations. When the homogenization speed was increased again (TG-23) the result was positive. Particle size decreased and the span and Dv/Dn was good. Unfortunately the replicate of this recipe run (TG-25) resulted in a particle size increase. This recipe run used a new batch of the initiator suspension and apparently the change had an impact on the resulting microsphere, basically putting work back to square one. Following the same methodology as before the homogenization speed was further ramped up in TG-28, using the same initiator suspension as in TG-25. This did not have much effect on the particle size, only decreasing it by some odd tenths of a micron. In TG-30 the amount
20
of surfactant was increased by 50% compared to TG-19 through TG-28. This finally presented a good result. The size decreased and the distribution was good. Tmax was high for all 20-litre recipe runs however also for the reference and as mentioned earlier it was not considered as a problem at the time. When it was decided to perform some application evaluation on samples from 20-litre scale (tests not included in this report) in an attempt to lower Tmax to meet the specification (139-145°C) the composition of the monomer phase was changed in TG-30. Unfortunately despite the modification of monomer composition Tmax of the resulting microspheres were not within specification. The new initiator batch seems to have influenced Tmax since TG-23 has a value around 4°C lower than TG-28 and 2°C lower than TG-30. However it might also be a secondary effect of an affected particle size distribution since Tmax is correlated to the particle size and particle size distribution. Below a table of residual monomer concentration in the slurries is found. TG-11 is the only batch with ammonia/sodium persulfate as post-polymerization chemical. The slurry from this experiment actually had residual monomers above the detection limit after post-polymerization while the following batches, with sodium bisulfite as post-polymerization chemical, were all below the detection limit (with the exception of M2 in TG-14 which was just slightly above). Furthermore it seems that the Suspension B recipes have lower residual monomer content before the post-polymerization. This last statement is not however, as in 1-litre scale, statistically validated. Judging from these results it seems that the sodium bisulfite is quite effective in removing residual monomers within a shorter time. Table 12. This table shows the concentration of residual monomers in each 20-litre scale recipe.
Recipe M1
(mg/kg) M1*
(mg/kg) M2
(mg/kg) M2*
(mg/kg)
TG-11 13620 80 180 50
TG-14 12830 <30 120 30
TG-19 10400 <30 70 <30
TG-21 12920 <30 120 <30
TG-23 - <30 - <30
TG-25 12470 <30 110 <30
TG-28 12060 <30 110 <30
TG-30 - <30 - <30
GC-detection limit is 30 mg/kg. *after post-polymerization treatment step.
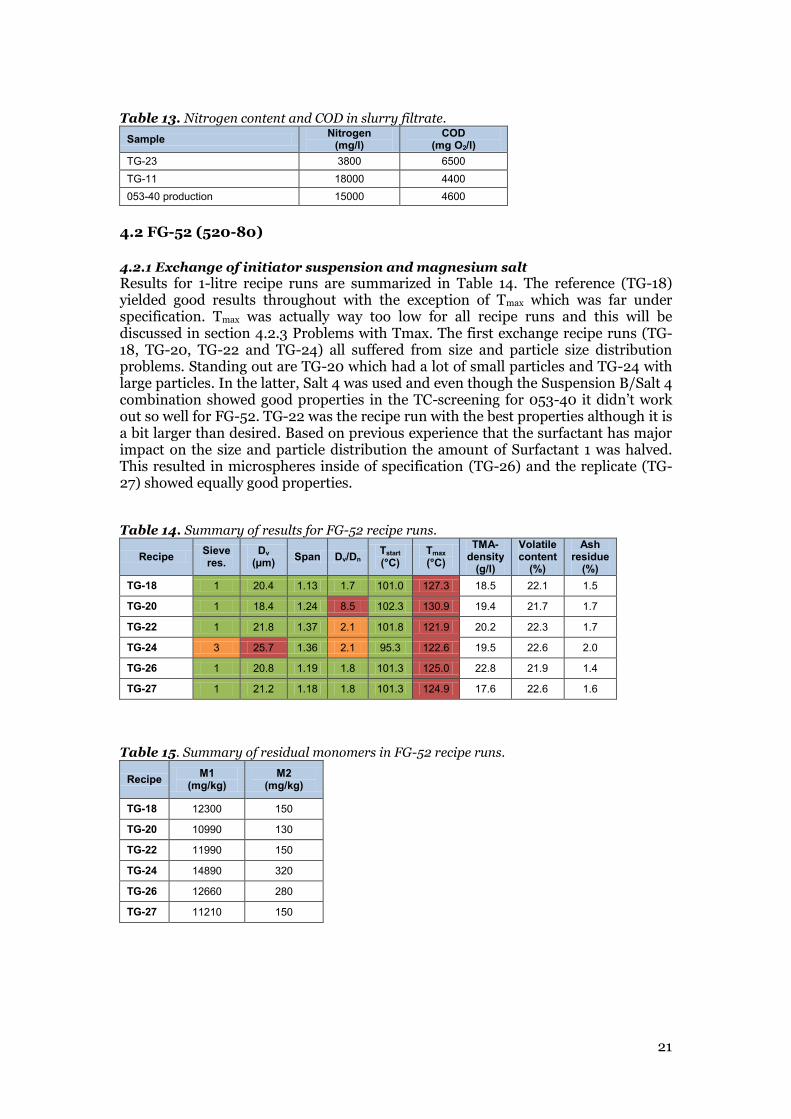
The exchange from Salt 1 and elimination of ammonia from the post-polymerization drastically reduced the nitrogen emissions, thus reducing the eutrophication contribution to the sea. At the same time the analysis indicates a 50% increase of COD with the use of sodium bisulfite. The byproduct formed by sodium bisulfite and the monomers is more soluble in water than the ammonia/NaPS counterpart, therefore it passes through filtration more easily thus increasing the COD of the water. TG-23 used Suspension B and Salt 2 along with sodium bisulfite. TG-11 and 053-40 production uses Suspension A and Salt 1 along with ammonia and NaPS. Total nitrogen content and COD is summarized in Table 13. Totalt nitrogen content was measured by DR Lange LCK338 and COD by DR Lange LCK014 methods at an external laboratory.
21
Table 13. Nitrogen content and COD in slurry filtrate.
Sample Nitrogen
(mg/l) COD
(mg O2/l)
TG-23 3800 6500
TG-11 18000 4400
053-40 production 15000 4600
4.2 FG-52 (520-80)
4.2.1 Exchange of initiator suspension and magnesium salt
Results for 1-litre recipe runs are summarized in Table 14. The reference (TG-18) yielded good results throughout with the exception of Tmax which was far under specification. Tmax was actually way too low for all recipe runs and this will be discussed in section 4.2.3 Problems with Tmax. The first exchange recipe runs (TG-18, TG-20, TG-22 and TG-24) all suffered from size and particle size distribution problems. Standing out are TG-20 which had a lot of small particles and TG-24 with large particles. In the latter, Salt 4 was used and even though the Suspension B/Salt 4 combination showed good properties in the TC-screening for 053-40 it didn’t work out so well for FG-52. TG-22 was the recipe run with the best properties although it is a bit larger than desired. Based on previous experience that the surfactant has major impact on the size and particle distribution the amount of Surfactant 1 was halved. This resulted in microspheres inside of specification (TG-26) and the replicate (TG-27) showed equally good properties. Table 14. Summary of results for FG-52 recipe runs.
Recipe Sieve res.
Dv (µm)
Span Dv/Dn Tstart (°C)
Tmax (°C)
TMA-density
(g/l)
Volatile content
(%)
Ash residue
(%)
TG-18 1 20.4 1.13 1.7 101.0 127.3 18.5 22.1 1.5
TG-20 1 18.4 1.24 8.5 102.3 130.9 19.4 21.7 1.7
TG-22 1 21.8 1.37 2.1 101.8 121.9 20.2 22.3 1.7
TG-24 3 25.7 1.36 2.1 95.3 122.6 19.5 22.6 2.0
TG-26 1 20.8 1.19 1.8 101.3 125.0 22.8 21.9 1.4
TG-27 1 21.2 1.18 1.8 101.3 124.9 17.6 22.6 1.6
Table 15. Summary of residual monomers in FG-52 recipe runs.
Recipe M1
(mg/kg) M2
(mg/kg)
TG-18 12300 150
TG-20 10990 130
TG-22 11990 150
TG-24 14890 320
TG-26 12660 280
TG-27 11210 150
22
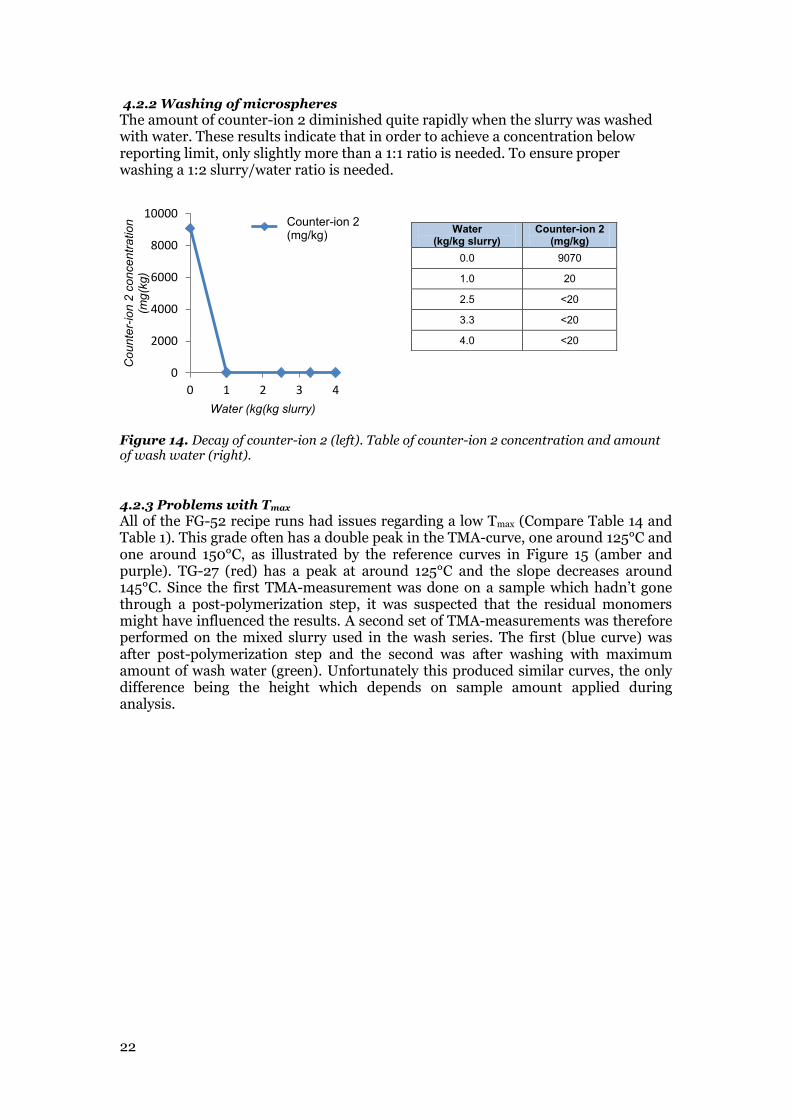
4.2.2 Washing of microspheres
The amount of counter-ion 2 diminished quite rapidly when the slurry was washed with water. These results indicate that in order to achieve a concentration below reporting limit, only slightly more than a 1:1 ratio is needed. To ensure proper washing a 1:2 slurry/water ratio is needed.
Figure 14. Decay of counter-ion 2 (left). Table of counter-ion 2 concentration and amount of wash water (right).
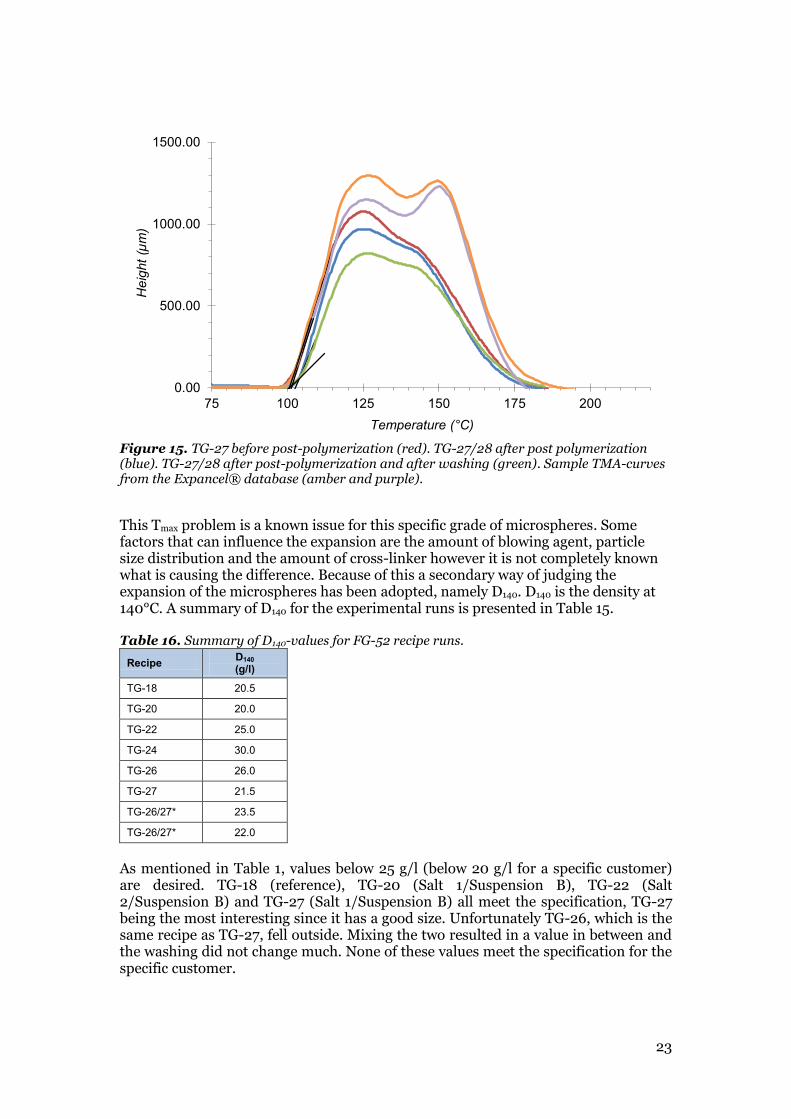
4.2.3 Problems with Tmax
All of the FG-52 recipe runs had issues regarding a low Tmax (Compare Table 14 and Table 1). This grade often has a double peak in the TMA-curve, one around 125°C and one around 150°C, as illustrated by the reference curves in Figure 15 (amber and purple). TG-27 (red) has a peak at around 125°C and the slope decreases around 145°C. Since the first TMA-measurement was done on a sample which hadn’t gone through a post-polymerization step, it was suspected that the residual monomers might have influenced the results. A second set of TMA-measurements was therefore performed on the mixed slurry used in the wash series. The first (blue curve) was after post-polymerization step and the second was after washing with maximum amount of wash water (green). Unfortunately this produced similar curves, the only difference being the height which depends on sample amount applied during analysis.
0
2000
4000
6000
8000
10000
0 1 2 3 4
Co
un
ter-
ion
2 c
on
ce
ntr
atio
n
(mg
(kg
)
Water (kg(kg slurry)
Chloride Water (kg/kg slurry)
Counter-ion 2 (mg/kg)
0.0 9070
1.0 20
2.5 <20
3.3 <20
4.0 <20
Counter-ion 2 (mg/kg)
23
Figure 15. TG-27 before post-polymerization (red). TG-27/28 after post polymerization (blue). TG-27/28 after post-polymerization and after washing (green). Sample TMA-curves from the Expancel® database (amber and purple).
This Tmax problem is a known issue for this specific grade of microspheres. Some factors that can influence the expansion are the amount of blowing agent, particle size distribution and the amount of cross-linker however it is not completely known what is causing the difference. Because of this a secondary way of judging the expansion of the microspheres has been adopted, namely D140. D140 is the density at 140°C. A summary of D140 for the experimental runs is presented in Table 15. Table 16. Summary of D140-values for FG-52 recipe runs.
Recipe D140 (g/l)
TG-18 20.5
TG-20 20.0
TG-22 25.0
TG-24 30.0
TG-26 26.0
TG-27 21.5
TG-26/27* 23.5
TG-26/27* 22.0
As mentioned in Table 1, values below 25 g/l (below 20 g/l for a specific customer) are desired. TG-18 (reference), TG-20 (Salt 1/Suspension B), TG-22 (Salt 2/Suspension B) and TG-27 (Salt 1/Suspension B) all meet the specification, TG-27 being the most interesting since it has a good size. Unfortunately TG-26, which is the same recipe as TG-27, fell outside. Mixing the two resulted in a value in between and the washing did not change much. None of these values meet the specification for the specific customer.
0.00
500.00
1000.00
1500.00
75 100 125 150 175 200
Heig
ht
(µm
)
Temperature (°C)
24
5. Conclusions and future work
This study has shown that it is quite possible to produce the Expancel® thermally expandable microsphere grade 053-40 with Salt 2 and Suspension B as initiator suspension. The use of Salt 2 results in a slightly larger particle size, but this is counteracted when Suspension B is used. Apparently the batches of Suspension B differ from one another as seen in the late 20-litre scale recipe runs. Also the amount and choice of surfactant plays a major role in size and size distribution of the particles. By exchanging Surfactant 1 to Surfactant 2 the size and particle distribution issues were resolved. All 053 recipe runs gave microspheres with high Tmax, but this is probably not connected to the exchange of chemicals since all 053-40 recipe runs have this problem (including the reference and several previous runs not included in this report). Production scale runs needs to be performed to see if the problem remains. Sodium bisulfite as a post-polymerization chemical worked out just fine with no apparent effect on the microspheres. Post-polymerization time could also be reduced. By removing ammonia and nitrogen containing compounds from the recipe, the nitrogen content in the slurry filtrate seem to be drastically reduced at the cost of higher COD. Future work for this grade includes stability testing of the recipe and trial runs in production scale. Before production scale tests, application testing also needs to be done to ensure that the modified microspheres have the same properties in a matrix as the current recipe. Initiator suspension C also showed promising results so further runs with higher polymerization temperature needs to be tested. The work to produce the FG-52 grade with alternative initiator suspension and magnesium salt was guided by the experience from 053-40. Salt 4, which would have been interesting for this grade, did not work so well and also that salt increases COD-emission. Reducing the amount of surfactant (Surfactant 1 in this case) resolved the size issue from the initial run. Ion-chromatography revealed that residual ions was easily washed away to below reporting limit with just more than a 1:1 ratio of water to the slurry. Issues that need more attention are Tmax and D140. Tmax should be significantly higher and D140 needs to be a bit lower to meet the demand of the specific customer. A modification of the monomer composition might resolve this issue. The recipe needs to be scaled to 20-litre. 053-40 1-litre scale recipe compositions that showed good properties did not work so well in 20-litre scale, so just because the FG-52 1-litre scale recipes were good there is no guarantee that it’s stable. Applications testing are also required.
6. Acknowledgements
I would first of all like to thank Carina Eriksson for stepping in as supervisor at the last minute, helping and supporting my work. Evelina Waltersson also deserves special credit for all the hours spent teaching me the lab methods. The staff at the pilot lab also deserves many thanks for all the help they’ve provided and putting up with all my questions and shenanigans. A shout out to the RD&I department is also in order and a thanks for support and many interesting discussions ranging from snooker to ice hockey and a good time. Olof Sandin, Jonas Vestin and Mattias Brodin deserve special thanks for making this a most enjoyable time and making me feel at home both in Sundsvall and at Expancel. Also I want to thank Tomas Hedlund for being my supervisor at Umeå University and also for being a great program coordinator during my time in Umeå. Last but not least I’d like to thank Anna Larsson Kron for giving me the opportunity to do my degree project at Expancel RD&I.
25
7. Bibliography
[1] Akzo Nobel (2012). Expancel Microspheres. www.akzonobel.com/expancel. [Cited: January 28, 2013.] http://www.akzonobel.com/expancel/. [2] Internal document Expancel, MS-rapport. [3] Stevens, Malcolm P (1999). Polymer Chemistry - an introduction. 3rd Edition. Oxford, Oxford University Press, Inc. [4] Wittcoff, Harold A, Reuben, Bryan G and Plotkin, Jeffrey S (2004). Industrial Organic Chemicals. 2nd Edition. Hoboken, John Wiley & Sons, Inc. [5] Albertsson, Ann-Christine, Karlsson, Sigbritt and Malmström, Eva. Introduktion till polymerteknologi. Stockholm, Institutionen för Polymerteknologi, KTH. [6] Jonsson, Magnus (2010). Thermally Expandable Microspheres via Suspension Polymerization - Synthesis, Characterization and Application. Stockholm, Doctoral Thesis in Polymer Technology. [7] The Dow Chemical Company (1971) Expansible thermoplastic polymer particles containing volatile fluid foaming agent and method of foaming the same. US3615972. [8] Rawle A. Basic principles of particle analysis. Malvern Instruments, Worcestershire. [9] Harris, Daniel C (2010). Quantative Chemical Analysis, 8th edition. New York, W.H. Freeman & Company. [10] Eriksson, L., Johansson, E., Kettaneh-Wold, N., Wikström, C., Wold, S (2008). Design of Experiments, Principles and Applications, third revised and enlarged edition. Umetrics AB, Umeå.

26
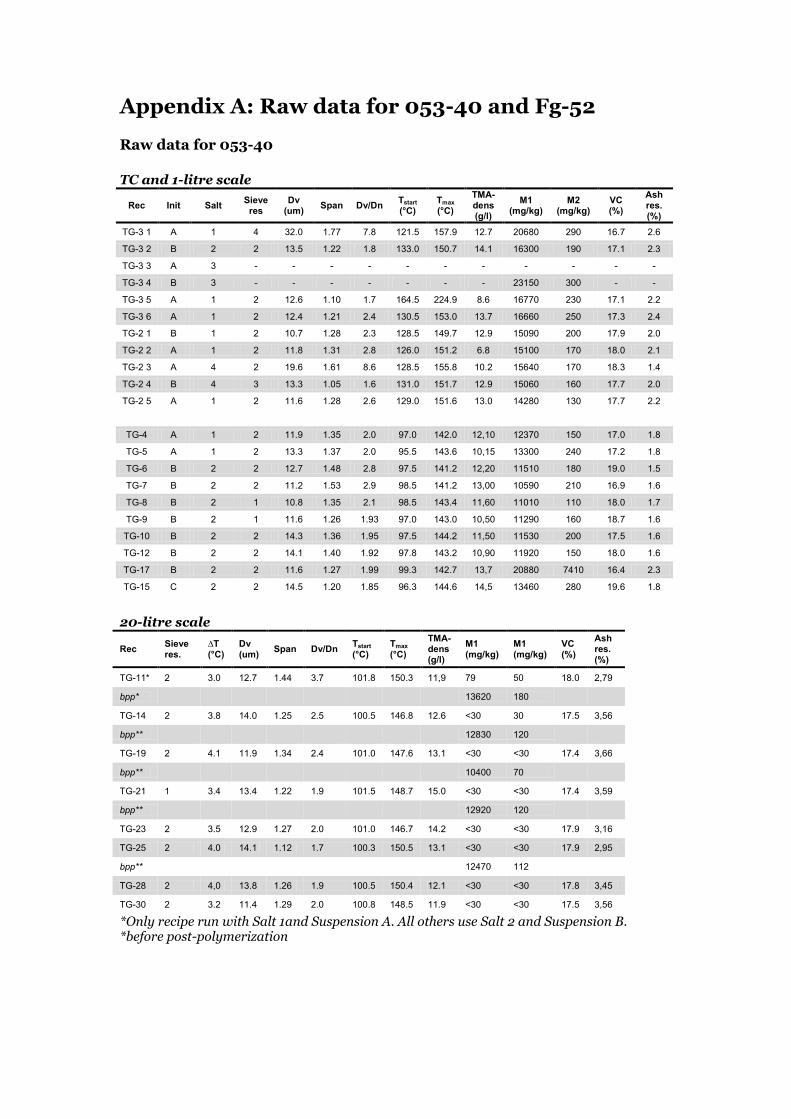
Appendix A: Raw data for 053-40 and Fg-52
Raw data for 053-40
TC and 1-litre scale
Rec Init Salt Sieve res
Dv (um)
Span Dv/Dn Tstart
(°C) Tmax (°C)
TMA-dens (g/l)
M1 (mg/kg)
M2 (mg/kg)
VC (%)
Ash res. (%)
TG-3 1 A 1 4 32.0 1.77 7.8 121.5 157.9 12.7 20680 290 16.7 2.6
TG-3 2 B 2 2 13.5 1.22 1.8 133.0 150.7 14.1 16300 190 17.1 2.3
TG-3 3 A 3 - - - - - - - - - - -
TG-3 4 B 3 - - - - - - - 23150 300 - -
TG-3 5 A 1 2 12.6 1.10 1.7 164.5 224.9 8.6 16770 230 17.1 2.2
TG-3 6 A 1 2 12.4 1.21 2.4 130.5 153.0 13.7 16660 250 17.3 2.4
TG-2 1 B 1 2 10.7 1.28 2.3 128.5 149.7 12.9 15090 200 17.9 2.0
TG-2 2 A 1 2 11.8 1.31 2.8 126.0 151.2 6.8 15100 170 18.0 2.1
TG-2 3 A 4 2 19.6 1.61 8.6 128.5 155.8 10.2 15640 170 18.3 1.4
TG-2 4 B 4 3 13.3 1.05 1.6 131.0 151.7 12.9 15060 160 17.7 2.0
TG-2 5 A 1 2 11.6 1.28 2.6 129.0 151.6 13.0 14280 130 17.7 2.2
TG-4 A 1 2 11.9 1.35 2.0 97.0 142.0 12,10 12370 150 17.0 1.8
TG-5 A 1 2 13.3 1.37 2.0 95.5 143.6 10,15 13300 240 17.2 1.8
TG-6 B 2 2 12.7 1.48 2.8 97.5 141.2 12,20 11510 180 19.0 1.5
TG-7 B 2 2 11.2 1.53 2.9 98.5 141.2 13,00 10590 210 16.9 1.6
TG-8 B 2 1 10.8 1.35 2.1 98.5 143.4 11,60 11010 110 18.0 1.7
TG-9 B 2 1 11.6 1.26 1.93 97.0 143.0 10,50 11290 160 18.7 1.6
TG-10 B 2 2 14.3 1.36 1.95 97.5 144.2 11,50 11530 200 17.5 1.6
TG-12 B 2 2 14.1 1.40 1.92 97.8 143.2 10,90 11920 150 18.0 1.6
TG-17 B 2 2 11.6 1.27 1.99 99.3 142.7 13,7 20880 7410 16.4 2.3
TG-15 C 2 2 14.5 1.20 1.85 96.3 144.6 14,5 13460 280 19.6 1.8
20-litre scale
Rec Sieve res.
∆T (°C)
Dv (um)
Span Dv/Dn Tstart (°C)
Tmax (°C)
TMA- dens (g/l)
M1 (mg/kg)
M1 (mg/kg)
VC (%)
Ash res. (%)
TG-11* 2 3.0 12.7 1.44 3.7 101.8 150.3 11,9 79 50 18.0 2,79
bpp*
13620 180
TG-14 2 3.8 14.0 1.25 2.5 100.5 146.8 12.6 <30 30 17.5 3,56
bpp**
12830 120
TG-19 2 4.1 11.9 1.34 2.4 101.0 147.6 13.1 <30 <30 17.4 3,66
bpp**
10400 70
TG-21 1 3.4 13.4 1.22 1.9 101.5 148.7 15.0 <30 <30 17.4 3,59
bpp**
12920 120
TG-23 2 3.5 12.9 1.27 2.0 101.0 146.7 14.2 <30 <30 17.9 3,16
TG-25 2 4.0 14.1 1.12 1.7 100.3 150.5 13.1 <30 <30 17.9 2,95
bpp**
12470 112
TG-28 2 4,0 13.8 1.26 1.9 100.5 150.4 12.1 <30 <30 17.8 3,45
TG-30 2 3.2 11.4 1.29 2.0 100.8 148.5 11.9 <30 <30 17.5 3,56
*Only recipe run with Salt 1and Suspension A. All others use Salt 2 and Suspension B. *before post-polymerization

ii
Raw data for FG-52
Rec Init Salt Sieve res
Dv (µm)
Span Dv/Dn Tstart
(°C) Tmax (°C)
TMA-dens (g/l)
M1 (mg/kg)
M2 (mg/kg)
VC (%)
Ash res. (%)
TG-18 A 1 1 20.4 1.13 1.7 101.0 127.3 18.5 12300 150 22.1 1.5
TG-20 B 1 1 18.4 1.24 8.5 102.3 130.9 19.4 10990 130 21.7 1.7
TG-22 B 2 1 21.8 1.37 2.1 101.8 121.9 20.2 11990 150 22.3 1.7
TG-24 B 4 3 25.7 1.36 2.1 95.3 122.6 19.5 14890 320 22.6 2.0
TG-26 B 2 1 20.8 1.19 1.8 101.3 125.0 22.8 12660 280 21.9 1.4
TG-27 B 2 1 21.2 1.18 1.8 101.3 124.9 17.6 11210 150 22.6 1.6


iv
Department of Chemistry
S-901 87 Umeå, Sweden
Telephone +46 90 786 50 00
Text telephone +46 90 786 59 00
www.umu.se