synthesis and luminescence properties of rare earth activated
TRANSCRIPT

UC San DiegoUC San Diego Electronic Theses and Dissertations
TitleSynthesis and luminescence properties of rare earth activated phosphors for near UV-emitting LEDs for efficacious generation of white light
Permalinkhttps://escholarship.org/uc/item/03t467f7
AuthorHan, Jinkyu
Publication Date2013-01-01 Peer reviewed|Thesis/dissertation
eScholarship.org Powered by the California Digital LibraryUniversity of California

UNIVERSITY OF CALIFORNIA, SAN DIEGO
Synthesis and Luminescence Properties of Rare Earth Activated Phosphors for near UV-
Emitting LEDs for Efficacious Generation of White Light
A dissertation submitted in partial satisfaction of the
requirements for the degree Doctor of Philosophy
in
Materials Science and Engineering
by
Jinkyu Han
Committee in charge:
Professor Joanna McKittrick, Chair
Professor Renkun Chen
Professor Sungho Jin
Professor Jan B. Talbot
Professor Deli Wang
2013

Copyright
Jinkyu Han, 2013
All rights reserved.

iii
The dissertation of Jinkyu Han is approved, and it is acceptable in quality and form for
publication on microfilm and electronically:
Chair
University of California, San Diego
2013

iv
DEDICATION
To Sooyoung and my mother.
v
TABLE OF CONTENTS
Signature page……………………………………………………………………………..….. iii
Dedication……………………………………………………………………………..………. iv
Table of Contents……………………………………………………………………………... v
List of Figures……………………………………………………………………………….... viii
List of Tables……………………………………………………………………..………….… xiii
Acknowledgements…………………………………………………………………….……… xiv
Vita……………………………………………………………………..…………………….... xvii
Glossary…………………………………………………………………………………….…...xxi
Abstract……………………………………………………………………..……………….…xxii
Chapter 1. Introduction……………………………………………………………………….... 1
Chapter 2. Background and motivation…………………………………………….................. 8
2.1. Electromagnetic spectrum and phenomenon of luminescence………………………………. 8
2.2. Solid state lighting ...………………………………………………………………………….… 11
2.3. White light generation in LED……...…………………………………………………….…… 15
2.3.1. Basic photometric quantities.……………………………….………….…..............15
2.3.2. Quantification of color and color mixing….…………………….………………. .18
2.4. Strategies to produce white light generation……………………………...………………… .23
2.4.1. Advantages and the need for near UV LED solid state lighting………………. 26
2.5. Luminescence in phosphors……………………………………………………...……………. 31
2.5.1. Characteristic luminescence…………..……...………………………..………… . 31
2.5.1.1. Influence of crystal field……………………………………….................. .31
2.5.1.2. Effect of activator concentration……………………………….. …….….. 36
2.5.1.3. Configuration-Coordination model...………………………................... 38
2.5.2. Mechanism of light emission in rare earth activated phosphors……………... 41
2.5.2.1. 4f-4f transitions………………………...……….……..….…..…………….. 41
2.5.2.2. 4f-5d transitions…………………………...…...………...……..…….......... 44
2.6. Requirement of ideal phosphors for near UV LEDs………………………....……............. 46
2.7. Exploration of novel phosphors for near UV LEDs via empirical investigation………...47
2.8. Nanophosphors for solid state lighting application………………………………………….55
Chapter 3. Experimental procedure…………………………………………………………...57
3.1. Synthetic methods…………………………………………………………………….......57

vi
3.1.1. Solid state reaction method………………………………………………........60
3.1.2. Sol-gel/Pechini method………………………………………………………...60
3.1.3. Co-precipitation method……………………………………………….............61
3.1.4. Hydrothermal method…………………………………………………………….…...62
3.1.5. Combustion method……………………………………………………………….…..62
3.1.6. Spray-pyrolysis method……………………….………………………………………63
3.2. Characterization of luminescent materials…………………………………………………….66
Chapter 4. Sol-gel synthesis of single phase, high quantum efficiency LiCaPO4:Eu2+
phosphors (blue emitting phosphors)………………………………..………….70
4.1. Abstract………………………………………………………………………………….…………70
4.2. Introduction…………………………………………………………………………….…………70
4.3. Experimental…………………………………………………………………………….………. 72
4.4. Results and discussion……………………………………………..………………….………...73
4.5. Conclusions…………………………………………………………………………….………... 84
4.6. Acknowledgements..………………………………………………………………….…. ………84
Chapter 5. Nano- and submicron sized europium activated silicate phosphors prepared by a
modified co-precipitation method (green-yellow emitting phosphors)..……..85
5.1. Abstract…………………………………………………………………………………….………85
5.2. Introduction……………………………………………………………………………….………85
5.3. Experimental……………………………………………………………………………….……..87
5.4. Results and discussion…………………………………………………………………….…….88
5.5. Conclusions………………………………………………………………………………….……98
5.6. Acknowledgements…..…………………………………………………………………….…….98
Chapter 6. Europium activated KSrPO4-(Ba,Sr)2SiO4 solid solutions as color tunable
phosphors for near-UV light emitting diode applications……………………99
6.1. Abstract……………………………………………………………………………………………99
6.2. Introduction………………………………………………………………………………………99
6.3. Experimental……………………………………………………………………………………102
6.4. Results and discussion…………………………………………………………………………103
6.5. Conclusions……………………………………………………………………………………..107
6.6. Acknowledgements..……………………………………………………………………………117
Chapter. 7. Synthesis and luminescence properties of (Ba, Ca, Sr)3MgSi2O8:Eu2+
, Mn2+
(red
emitting phosphors) ………………………………………...............................118
7.1. Introduction……………………………………………………………………………………..118
7.2. Experimental……………………………………………………………………………………119
7.3. Results and discussion………………………………………………………………………...120
7.4. Conclusions……………………………………………………………………………………..129
vii
7.5. Acknowledgements..……………………………………………………………………………129
Chapter 8. Dependence of phosphor properties on synthetic method…………………….130
8.1. Structural dependent luminescence characterization of green-yellow emitting
Sr2SiO4:Eu2+
phosphors for near UV LEDs…………………………………………….……130
8.1.1. Abstract………………………………………………………………………….……130
8.1.2. Introduction…………………………………………………………………….……131
8.1.3. Experimental…………………………………………………………………….…..132
8.1.4. Results and discussion………………………………………………………….….134
8.1.5. Conclusions……………………………………………………………………….…141
8.1.6. Acknowledgements..………………………………………………………………..141
8.2. Morphology and particle size dependent luminescence properties of
Y2O3:Eu3+
…………………………………………………………………………………………142
Chapter 9. Luminescence properties and stability improvements of nano and micron sized
phosphors by SiO2 coatings…………………………………………………….146
9.1. Luminescence enhancement of Y2O3:Eu3+
and Y2SiO5:Ce3+
,Tb3+
core particles with SiO2
shells……………………………………………………………………………………………….146
9.1.1. Abstract……………………………………………………………………………….146
9.1.2. Introduction…………………………………………………………………………146
9.1.3. Experimental………………………………………………………………………..148
9.1.4. Results and discussion…………………………………………………………….150
9.1.5. Conclusions…………………………………………………………………………164
9.1.6. Acknowldements..…………………………………………………………………..164
9.2. Synthesis and luminescence characterization of white emitting X1-and X2
Y2SiO5:Ce3+
,Tb3+
core/SiO2 shell nanophosphors……………………………………...…….165
9.2.1. Introduction……………………………………………………………………………165
9.2.2. Experimental………………………………………………………………………….165
9.2.3. Results and discussion………………………………………………………………167
9.2.4. Conclusions…………………………………………………………………………..173
9.3. (Ba,Sr)2SiO4:Eu2+
nanophosphors……………………………………………………………..174
9.4. Moisture and chemical stability improvement on various phosphors for near UV LEDs
application………………………………………………………………………........................176
Chapter 10. Conclusions and recommendations for future work………….……………….179
References……………………………………………………………………………................184

viii
LIST OF FIGURES
Figure 1.1 Annual energy consumption broken down by sectors and lighting technology
[1]……………………………………………………… ………………………..2
Figure 1.2 Total efficiency of phosphor converted LED. QE = quantum
efficiency………………………………………………………………..……….5
Figure 2.1 The electromagnetic spectrum [12]……………………………………………..10
Figure 2.2 Schematics of p-n junction for light emitting diodes [17]………………………13
Figure 2.3 LED design and the phosphor package in white LED. (a) Typical LED lamp
package. (b) Uniform phosphor distribution directly in reflector cup (c) Remote
phosphor distribution in the package [18]………………………………………14
Figure 2.4 The response of a typical human eye to light, as standardized by the CIE in 1924.
The horizontal axis is wavelength in nm [20].…………………………………..16
Figure 2.5 The 1931 chromaticity diagram [28]. Triangle represents primary colors used in
CRT color monitors. …………………………………………............................20
Figure 2.6 Color temperature comparison of common electric lamps [29]………………...21
Figure 2.7 Three approaches for white light generation from (a) Blue-, green-, red-emitting
LED chips, (b) blue-emitting LED chips and yellow emitting phosphors, and (c)
near UV emitting LED and blue-, green-, red-emitting phosphors …….………24
Figure 2.8 External quantum efficiency versus dominant emission wavelength for a
selection of InGaN LEDs in identical packages. Each LED was driven with a
current density of 35 A/cm2 [9]………………………………………………….28
Figure 2.9 External quantum efficiency versus current density for four different nUV chips
and two blue chips [9]……………………………………..................................29
Figure 2.10 Ratio of emitted optical power for nUV (405 nm) and blue LED (450 nm)
packages as a function of electrical current, based on instant-on measurements
[9]………………………………………………………………………………..30
Figure 2.11 Diagram of an activator ion (A) in host lattice………………………………….32
Figure 2.12 Schematic representation of the five 3d orbitals [35]…………………………...34
Figure 2.13 Energy splitting of the five d orbitals for octahedral crystal field and the orbits of
the free ion. [36]…………………………………………………………………36
Figure 2.14 Emission intensity of Y2O3:Eu3+
as a function of activator (Eu3+
) concentration
[37]………………………………………………………………………………37

ix
Figure 2.15 The configuration coordinate diagram illustrating absorption and emission
between a ground state and an excited state and non-radiative process…….….40
Figure 2.16 Excitation and emission spectra of Y2O3:Eu3+
[42]…………………………….42
Figure 2.17 Energy levels of trivalent lanthanide ions [41]…………………………………43
Figure 2.18 The schematics of effect of crystal field on 4f-5d energy level in Eu2+
[10] …..45
Figure 3.1 Schematic diagram of solution based synthesis (a) sol-gel, (b) co-precipitation,
(c) hydrothermal, and (d) combustion synthesis. PPT agent = precipitating agent
………………………………………………….................................................59
Figure 3.2 Schematic diagram of (a) conventional and (b) flame spray-pyrolysis. Taken
from [126]………………………………………………………………………65
Figure 3.3 The schematic of measurement for quantum efficiency followed by DeMello
method [128]……………………………………………………………………68
Figure 3.4 Exication and emission monochromator and sample chamber for temperature
dependent lifetime measurement……………………………………………….69
Figure 4.1 Unit cell representation of the crystal structure of LiCaPO4 along the [001]
direction. Blue, green, purple, and red spheres represent Li, Ca, P, and O ions,
respectively. The polyhedral geometry of LiO4 and PO4 are depicted by blue and
purple polyhedral, respectively…………………………………………………74
Figure 4.2 XRD patterns of (a) Li(Ca1-xEux)PO4 (x = 0.005, 0.01, 0.03) phosphors and (b)
Li(Ca1-xEux)PO4 (x = 0.01) at various post-synthesis annealing
temperatures…………………………………………………………………….77
Figure 4.3 SEM micrographs of Li(Ca0.99Eu0.01)PO4 annealed at (a) 800°C, (b) 1000°C, and
(c) 1150°C………………………………………………....................................79
Figure 4.4 (a) PL excitation spectra of Li(Ca0.99Eu0.01)PO4, (b) PL emission spectra of
Li(Ca1-xEux)PO4 (x = 0.005, 0.01, 0.03) under 380 nm excitation, (c) PL
excitation spectra of Li(Ca0.99Eu0.01)PO4 at various annealing
temperatures…………………………………………………………………….81
Figure 4.5 XRD patterns of Li(Ca0.99Eu0.01)PO4 annealed at 1150°C and re-annealed at
800°C…………………………………………………………….......................82
Figure 4.6 PL emission spectra of Li(Ca0.99Eu0.01)PO4 annealed at 1150°C and re-annealed at
800°C under 380 nm excitation…………………………………………………83
Figure 5.1 XRD patterns of Ba2SiO4:3%Eu2+
phosphors after post-synthesis annealing at
various temperatures. …………………………………………………………...90
Figure 5.2 SEM micrographs of Ba2SiO4:3%Eu2+
annealed at (a) 800°C, (b) 900°C, (c)
1100°C and (d) 1150°C.and (d) 1150°C………………………………………...91
x
Figure 5.3 Histograms of the particle diameters of Ba2SiO4:3%Eu2+
annealed at (a) 800°C,
(b) 900°C, (c) 1100°C and (d) 1150°C…………………………………………92
Figure 5.4 (a) PL emission spectra of Ba2SiO4:3%Eu2+
at various annealing temperatures
under 380 nm excitation and (b) normalized emission intensity as a function of
annealing temperature. I = the emission intensity, Io=the maximum emission
intensity, which are from the powders annealed at 1150°C. The inset in (b) shows
the quantum efficiency as a function of annealing temperature. QE annealed at
1200°C is the sample prepared by sol-gel method,……………………………..95
Figure 5.5 SEM micrographs of (Ba1-xSrxEu0.03)2SiO4 for (a) x = 0, (b) x = 0.25, (c) x = 0.75,
and (d) x = 1. All samples were annealed at 1100°C for 1h................................96
Figure 5.6 Normalized PL (a) excitation and (b) emission spectra of (Ba1-xSrxEu0.03)2SiO4 (x
= 0, 0.25, 0.75, 1)……………………………………………………………….97
Figure 6.1 Unit cell representation of the crystal structure of (a) KSrPO4 along the [100]
direction, (b) Ba2SiO4 along the [100] direction, (c) Sr2SiO4 along the [001]
direction (The white/green and white/red spheres indicate the occupancy of the
ions is 0.5), and (d) KSrPO4-(Ba,Sr)2SiO4 solid solution along the [100] direction.
The polyhedral geometry of PO4 in (a) and SiO4 in (b) and (c) is depicted by red
polyhedral……………………………………………………………………...104
Figure 6.2 XRD patterns of Eu2+
-activated (a) (KSrPO4)1-x•(Ba2SiO4)x, (b) (KSrPO4)1-
x•(Sr2SiO4)x, and (c) (Ba1-xSrx)2SiO4 at for 0 x 1……..................................106
Figure 6.3 Lattice parameters of Eu2+
-activated (a) (KSrPO4)1-x•(Ba2SiO4)x and (b)
(KSrPO4)1-x•(Sr2SiO4)x as a function of x as obtained from Rietveld
refinement……………………………………………………………………...109
Figure 6.4 Photoluminescence emission spectra of Eu2+
-activated (a) (KSrPO4)1-x•(Ba2SiO4)x
and (b) (KSrPO4)1-x•(Sr2SiO4)x at various x under 380 nm excitation. The insets
are photos showing colors of the corresponding samples, which were taken with
a 380 nm emitting UV-LED…………………………………………………...110
Figure 6.5 Photoluminescence emission peaks of Eu activated (KSrPO4)1-x•(Ba2SiO4)x
(KBPSO) and (KSrPO4)1-x•(Sr2SiO4)x (KSPSO) as a function of x. The shorter
and longer wavelengths are in the range 430-475 nm and 514-570 nm,
respectively…………………………………………………………………….113
Figure 6.6 Photoluminescence excitation spectra of Eu activated (KSrPO4)1-x•(Ba2SiO4)x at
(a) shorter wavelength emission and (b) longer wavelength emission and Eu
activated (KSrPO4)1-x•(Sr2SiO4)x at (c) shorter wavelength emission and (d)
longer wavelength emission at various x……………………………………………114
Figure 6.7 Photoluminescence emission spectra of Eu2+
-activated (KSrPO4)1-x•(Ba2SiO4)x
(KBPSO) and (KSrPO4)1-x•(Sr2SiO4)x (KSPSO) at x = 0.1. LiCaPO4:Eu2+
taken
from [54]……………………………………………………………………….115

xi
Figure 6.8 CIE chromatic coordinates of Eu2+
-activated (a) (KSrPO4)1-x•(Ba2SiO4)x and (b)
(KSrPO4)1-x(•(Sr2SiO4)x at various x…………………………………………...116
Figure 7.1 XRD patterns of (Ba0.97Eu0.03)3(Mg0.95Mn0.05)Si2O8 and
(Ba0.735Sr0.235Eu0.03)3(Mg0.95Mn0.05)Si2O8............................................................121
Figure 7.2 PL emission and excitation spectra of (Ba0.97Eu0.03)3(Mg0.95Mn0.05)Si2O8 and
(Ba0.735Sr0.235Eu0.03)3(Mg0.95Mn0.05)Si2O8. ...........................................................123
Figure 7.3 SEM micrographs of (a) (Ba0.97Eu0.03)3(Mg0.95Mn0.05)Si2O8 and (b)
(Ca0.97Eu0.03)3(Mg1-0.95Mn0.05)Si2O8.....................................................................125
Figure 7.4 (a) PL emission spectra of (Ba1-xEux)3(Mg1-yMny)Si2O8 for x, y = 0, 0.05; 0.03, 0;
0.03, 0.01 and 0.03, 0.05. (b) PL emission and excitation spectra of
(Ca0.97Eu0.03)3(Mg1-yMny)Si2O8 for y = 0. 0.01 and 0.05. …………………..…126
Figure 7.5 Lifetime of (a) blue and (b) red emission of (Ba0.97Eu0.03)3(Mg0.95Mn0.05)Si2O8 as a
function of temperature under 380 nm excitation..…………………………….128
Figure 8.1 XRD patterns of (Sr0.97Eu0.03)2SiO4 phosphors prepared by the sol-gel/Pechini
(SG/P), co-precipitation method (CP), combustion method (CS), which is taken
from [53] and solid-state reaction method (SS)..................................................135
Figure 8.2 SEM micrographs of (Sr0.97Eu0.03)2SiO4 phosphors prepared by (a) co-
precipitation method (CP), which is predominant α-phase, (b) sol-gel/Pecini
method (SG/P), which is the mixture of α +β phase and (c) combustion method
(CS), which is predominant α-phase and (d) solid state reaction method (SS),
which is predominant β-phase…………………………………………………138
Figure 8.3 (a) Photoluminescence emission spectra of (Sr0.97Eu0.03)2SiO4 prepared by sol-
gel/Pechni (SG/P) and co-precipitation (CP) method under 380 nm excitation.
The excitation spectra (b) under green-yellow band emission identified in
(a)……………………………………………………………………………....139
Figure 8.4 Effect of synthesis method on the luminescence properties of (Sr0.97Eu0.03)SiO4;
CS = combustion synthesis, CP = co-precipitation, SG/P = sol gel/Pechini, SS =
solid state, λmax = the maximum emission wavelength, I = the emission intensity,
Io = the maximum emission intensity, which is from the solid state synthesized
powders, QE = quantum efficiency, and fα = the fraction of the -phase……..140
Figure 8.5 SEM images of nanosized Y2O3:Eu3+
prepared by various synthesis methods.
Scale bar is 200 nm……………………………………….................................144
Figure 8.6 PL spectra of Y2O3:Eu3+
prepared by various synthetic methods (SG = sol-gel,
CS = combustion, CP = co-precipitation, HT = hydrothermal, SP = spray-
pyrolysis)………………………………………………………………………145
Figure 9.1 XRD patterns of (Y0.95Eu0.05)2O3 core particles………………………………..152

xii
Figure 9.2 SEM micrographs of (a) (Y0.95Eu0.05)2O3 core and core/SiO2 shell particles for (b)
1h coating time and (c) 2h coating time and (d) 5h coating time.……... ……..153
Figure 9.3 TEM micrographs of (a) (Y0.95Eu0.05)2O3 core and core/SiO2 shell particles for (b)
1h coating time and (c) 2h coating time and (d) 5h coating time……………...154
Figure 9.4 Histograms of the particle diameter of (a) (Y0.95Eu0.05)2O3 core and
(Y0.95Eu0.05)2O3 core/shell particles for (b) 1h coating time and (c) 2h coating time
and (d) 5h coating time………………………………………………………...155
Figure 9.5 Effect of Eu3+
concentration on the photoluminescence intensity……………..157
Figure 9.6 Photoluminescence emission spectra of (Y0.95Eu0.05)2O3 core and (Y0.95Eu0.05)2O3
core / SiO2 shell particles. The inset shows normalized integrated intensity as a
function of shell thickness …………………………………………………….158
Figure 9.7 SEM micrographs of Y2SiO5:Ce3+
,Tb3+
core / SiO2 shell particles with different
concentration of reagents to deposit SiO2 shells. (a) 0.5 ml H2O, 0.5 ml NH4OH
and 0.05 ml TEOS and (b) 1 ml H2O and 1ml NH4OH and 0.05 ml TEOS in 50
ml 1-propanol solution……………………........................................................162
Figure 9.8 Photoluminescence emission spectra of Y2SiO5:Ce3+
,Tb3+
core and
Y2SiO5:Ce3+
,Tb3+
core / SiO2 shell particles. The inset shows normalized
integrated intensity as a function of shell thickness……...................................163
Figure 9.9 XRD patterns of (a) X1- and (b) X2- (Y0.9625Ce0.0075Tb0.03)2SiO5 core
particles………………………………………………………………………...168
Figure 9.10 SEM micrographs of (a) X1-(Y0.9625Ce0.0075Tb0.03)2SiO5 core and core/SiO2 shell
particles for (b) 0.5h coating time and (c) 1h coating time…………….………169
Figure 9.11 SEM micrographs of (a) X2-(Y0.9625Ce0.0075Tb0.03)2SiO5 core and core/SiO2 shell
particles for (b) 2h coating time……………………..........................................171
Figure 9.12 Photoluminescence emission spectra of (a) X1-(Y0.9625Ce0.0075Tb0.03)2SiO5 core,
and X1-Y2SiO5:Ce3+
,Tb3+
core / SiO2 shell particles and (b) X2-
(Y0.9625Ce0.0075Tb0.03)2SiO5 core and core/shell particles. The insets shows the
enlargement of PL emission spectra around 545 nm…………………………..172
Figure 9.13 (a) SEM micrograph of (Ba,Sr)2SiO4:Eu2+
core/SiO2 shell particles. The bright
cores surrounded by the darker shells. Scale bar = 200 nm. (b) Emission spectra
of bare core and core/shell particles…………………………………………...175
Figure 9.14 The comparison of PL spectra of (a) fresh Ca3SiO4Cl2:Eu2+
and after soaking in
water for 24 h (b) fresh Ca2PO4Cl:Eu2+
phosphors and after soaking in water for
24 h…………………………………………….................................................177
Figure 9.15 The PL spectra of fresh Ca3SiO4Cl2:Eu2+
and Ca3SiO4Cl2:Eu2+
/SiO2 phosphors
(b) fresh Ca2PO4Cl:Eu2+
and Ca2PO4Cl:Eu2+
/SiO2 phosphors. The core/shell
phosphors are measured after soaking in water for 24 h ……………………...178

xiii
LIST OF TABLES
Table 1.1 Comparison of energy efficiency, luminous efficacy (lumen/Watt), lifetime, heat
and presence of Mercury of commonly available light sources [4,
5]………………………………………………………………………………….3
Table 2.1 Color rendering index of some light sources [22]……………………................18
Table 2.2 Color temperature of some artificial and natural light sources………………….22
Table 2.3 Preliminary list of hosts for Ce3+
based on available values of D(A) in cm-1
…...49
Table 2.4 Luminescence properties of candidate blue emitting phosphors for near UV-
LEDs application………………………………………………………………..52
Table 2.5 Luminescence properties of candidate green-yellow emitting phosphors for near
UV-LEDs application…………………………………………………………...53
Table 2.6 Luminescence properties of candidate orange-red emitting phosphors based on
Eu-Mn energy transfer for near UV-LED application………………………….54
Table 3.1 Summary of synthesis methods in terms of the particle sizes, morphology control,
chemical homogeneity, cost, time, suitable phosphors and limitations…………58
xiv
ACKNOWLEDGEMENTS
First of all, I would like to express my gratitude to my advisor, Professor Joanna
McKittrick, for providing me with the opportunity to do this research and for her continuous
support, and good advice throughout the project. I was also honored to meet and work for her. I
shall never forget her endless advice and help. Thanks are given to my co-advisor, Professor Jan
Talbot, for her enthusiasm, character and for good advice during my ph.D. I am grateful to the
other members of my Ph.D. committee: Prof. Sungho Jin, Prof. Deli Wang, Prof. Renkun Chen
for serving as members of my committee. Professor Sungho Jin deserves special recognition for
his helpful suggestion.
Also, I would like to express my special thanks to the members at OSRAM SYLVANIA
Central research, Dr. Kailash Mishra, Mark Hannah, Alan Piquette, and Maria Anc for their
invaluable help throughout the project.
Additional thanks are extended to Professor. Gustaf Arrhenius and for the assistance and
insightful discussion regarding X-ray diffraction, as well as and Ryan Anderson for the assistance
on Scanning Electron Microscopy.
I would like to thank Dr. Brian Dodson, the program manager, for helpful input and the
group member and undergraduate research assistants who helped me during this project,
particularly Jaeik Choi, John Lee, Youngjin Kim, and Juliette Micone.
Chapter 4, in full, is a reprint of the material as it appears in the Electrochemical Society
Journal of Solid State Science and Technology, Jinkyu Han, Mark. E. Hannah, Alan Piquette, Jan
B. Talbot, Kailash C. Mishra, Joanna McKittrick, Vol. 1, pp. R37-R40 (2012). The dissertation
author was the primary author of this paper. All sample synthesis and characterization were
performed by the primary author, except the quantum efficiency measurements, which was
measured by Dr. Mark. E. Hannah at Osram Sylvania.
xv
Chapter 5, in full, is a reprint of the material as it appears in the Electrochemical Society
Journal of Solid State Science and Technology, Jinkyu Han, Mark. E. Hannah, Alan Piquette, Jan
B. Talbot, Kailash C. Mishra, Joanna McKittrick, Vol. 1, pp. R98-R104 (2012). The dissertation
author was the primary author of this paper. All sample synthesis and characterization were
performed by the primary author, except the quantum efficiency measurements, which was
measured by Dr. Mark. E. Hannah at Osram Sylvania.
Chapter 6, in full, is a reprint of the material as it appears in the Journal of American
Ceramic Soceity (accepted 2013), Jinkyu Han, Mark. E. Hannah, Alan Piquette, Jan B. Talbot,
Kailash C. Mishra, Joanna McKittrick, in 2013. The dissertation author was the primary author of
this paper. All sample synthesis and characterization were performed by the primary author,
except the quantum efficiency measurements, which was measured by Dr. Mark. E. Hannah at
Osram Sylvania.
Chapter 8.1 includes the material as it will appear in the Journal of Luminescence, Jinkyu
Han, Mark. E. Hannah, Alan Piquette, Gustavo Hirata, Jan B. Talbot, Kailash C. Mishra, Joanna
McKittrick, Vol 132, pp106-109 in 2012. The dissertation author was the primary author of this
paper. All sample synthesis and characterization were performed by the primary author, except
the quantum efficiency measurements, which was measured by Dr. Mark. E. Hannah at Osram
Sylvania.
Chapter 9.1, in full, includes the material as it appeared in the Material Science
Engineering B, Jinkyu Han, Gustavo Hirata, Jan B. Talbot, Joanna McKittrick, Vol 176, pp436-
431 in 2011. The dissertation author was the primary author of this paper. All sample synthesis
and characterization were performed by the primary author.
The financial support of this work by the U.S. Department of Energy of Grant DE-
EE0002003 is greatly appreciated.

xvi
Finally, I am able to reach this stage in my career purely because of the never-ending
encouragement, support, and belief in me of my parents, for which I cannot thank them enough.
And of course, I specially thank my wife, Sooyoung for her untiring support during the final stage
of my Ph.D. work.
xvii
VITA
2006 Bachelor of Science. Korea University, Seoul, South Korea.
2008 Master of Science, Korea University, Seoul, South Korea.
2009 Master of Science, Stanford University, Stanford, USA
2013 Doctor of Philosophy, University of California, San Diego, USA
Publications
J.K. Han, K.H. Shin, S.H. Lim, ―Thermal stability of a nanostructured trilayer synthetic
antiferromagnet,‖ J. Appl. Phys. 101 09F506 (2007).
J.K. Han, K.H. Shin, S.H. Lim, ―Thermal stability of trilayer synthetic antiferromagnets,‖ J.
Magn. Magn. Mater. 310 2339-2341 (2007).
J.K. Han, J.H. NamKoong, S.H. Lim, ―A new analytical/numerical combined method for the
calculation of the magnetic energy barrier in a nanostructured synthetic antiferromagnet,‖ J. Phys.
D: Appl. Phys., 41 232005-232009 (2008).
C.W. Han, J.K. Han, S.H. Lim, ―Calculation of magnetic energy barrier in nanostructured cells of
synthetic ferrimagnets,‖ J. Appl. Phys., 106 094508 (2009).
C.W. Han, J.K. Han, S.H. Lim, ―Thermal stability of nanostructured synthetic ferrimagnets under
applied magnetic field in the 45° direction,‖ J. Magnetics. 15 116-122 (2010).
J.K. Han, J.B. Talbot, J. McKittrick, ―Synthesis and photoluminescence properties of
Y2O3:Eu3+
/SiO2 nano phosphor core/shell particles,‖ ECS Trans., 28 183 (2010).
J.K. Han, G. Hirata, J.B. Talbot, J. McKittrick, ―Luminescence enhancement of Y2O3:Eu3+,
Y2SiO5:Ce3+
, Tb3+
core particles with SiO2 shells,‖ Mater. Sci. Eng. B. 176, 436-441 (2011).
J.K. Han, M.E. Hannah, A.Piquette, J. Talbot, K. C. Mishra, J. McKittrick, ―Sol-gel synthesis of
single phase, high quantum efficiency LiCaPO4:Eu2+
phosphors,‖ ECS. J. Solid. State. Sci.
Technol. 1, R37-R40 (2012).
J.K. Han, M. Hannah, A. Piquette, J.B. Talbot, K.C. Mishra, and J. McKittrick, ―Nano- and
submicron sized europium activated silicate phosphors prepared by a modified co-precipitation
method,‖ ECS. J. Solid. State. Sci. Technol. 1, R98 (2012).
J.K. Han, M. Hannah, A. Piquette, G.A. Hirata, J.B. Talbot, K.C. Mishra, and J. McKittrick,
―Structure dependent luminescence characterization of green-yellow emitting Sr2SiO4:Eu2+
phosphors for near UV LEDs,‖ J. Lumin. 132 106-109 (2012).
J. McKittrick, J.K. Han, J.I. Choi, J.B. Talbot, ―Effect of powder synthesis and processing on

xviii
luminescence properties,‖ TMS, 1 497-504 (2012). .
M.J. Oviedo, J.K. Han, O. Contreras, Z.S. Macedo, G.A. Hirata, J. McKittrick,
―Photoluminescence of bismuth germanate phosphors with a silica shell structure,‖ Phys.
Procedia, 29 91-96 (2012).
M.E. Hannah, A. Piquette, M. Anc, J. McKittrick, J. Talbot, J.K. Han, and K. Mishra, A study of
blue emitting phosphors, ABPO4:Eu2+
(A=K, Li, Na; B=Ca, Sr, Ba) for UV LEDs,‖ ECS Trans.
41 19-25 (2012).
J.K. Han, M. Hannah, A. Piquette, G.A. Hirata, J.B. Talbot, K.C. Mishra, and J. McKittrick,
―Europium-activated barium/strontium silicates for near-UV light emitting diode applications,‖ J.
Lumin. 133 184-187 (2013).
J. McKittrick, M.E. Hannah, A. Piquette, J.K. Han, J.I. Choi, M. Anc, M. Galvez, H. Lüger, J.B.
Talbot, K.C. Mishra, ―Phosphor selection for near UV LED solid state lighting,‖ ECS J. Solid.
State. Sci. Technol, 2. R3119-R3131 (2013)
J.K. Han, M.E. Hannah, A. Piquette, J.I. Choi, M. Anc, M. Galvez, H. Lüger, J.B. Talbot, K.C.
Mishra, J. McKittrick, ―Phosphor development and application for near UV LED solid state
lighting,‖ ECS. J. Solid State. Sci. Technol. 2. R3138-R3147 (2013).
J.K. Han, M.E. Hannah, A.Piquette, J. Talbot, K. C. Mishra, J. McKittrick, ―Eu-activated
KSrPO4-(Ba,Sr)2SiO4 solid solutions as efficient and color tunable phosphors for near-UV light
emitting diode applications,‖ J. Amer. Ceram. Soc, (accepted)
J.K. Han, M. Hannah, A. Piquette, G.A. Hirata, J.B. Talbot, K.C. Mishra, and J. McKittrick,
―Synthesis and luminescence properties of (Ba, Ca, Sr)3MgSi2O8:Eu2+
, Mn2+
phosphors,‖ (in
preparation)
S.H. Lee, J.K. Han, J.B. Talbot, J. McKittrick, ―Morphology and particle size dependent
luminescence properties of Y2O3:Eu3+
phosphors prepared by various synthetic methods,‖ (in
preparation).
J.K. Han, M.E. Hannah, A.Piquette, J. Talbot, K. C. Mishra, J. McKittrick, ―Luminescence
properties and stability improvement by SiO2 shells on various phosphors,‖ (in preparation)
xix
Presentation and posters
J.K. Han, J.B. Talbot and J. McKittrick, ―Synthesis of nano core/shell phosphor particles with
cores of the luminescent material,‖ Materials Research Society Spring Meeting, April 7, 2010,
San Francisco, CA. (Poster)
J.K. Han, J.B. Talbot and J. McKittrick, ―Synthesis and photoluminescence properties of
Y2O3:Eu3+
/SiO2, Y2SiO5:Ce, Tb/SiO2 nanophosphor core/shell particles,‖ The 217th
Electrochemical Society Meeting, April 25-29, 2010, Vancouver, BC, Canada. (Oral)
J.K, Han, M. Hannah, G.A. Hirata, J.B. Talbot, K.C. Mishra and J. McKittrick, ―Preparation and
luminescence characterization of green/yellow-emitting Sr2SiO4:Eu2+
for near UV-LEDs,‖ 1st
International Conference on New Trends in Luminescence and Phosphor Materials, Oct. 4-8,
2010, Hermosillo, MX (Oral)
J.K, Han, M. Hannah, G.A. Hirata, J.B. Talbot, K.C. Mishra and J. McKittrick, ―Core/shell
phosphors for excitation by near UV radiation,‖ 1st International Conference on New Trends in
Luminescence and Phosphor Materials, Oct. 4-8, 2010, Hermosillo, Mexico (Poster)
J. McKittrick, J.H. Tao, J.K. Han, J.B. Talbot, and K.C. Mishra, ―Luminescence properties of
Ga1-xAlxN and Ga1-x-yAlxDyyN powders,‖ 1st International Conference on New Trends in
Luminescence and Phosphor Materials, Oct. 4-8, 2010, Hermosillo, Mexico. (Poster)
J.K. Han, M. Hannah, A. Piquette, J. Micone, G. A. Hirata, J. B. Talbot, K. C. Mishra, and J.
McKittrick, ―Europium activated barium/strontium silicates for near-UV light emitting diode
applications,‖ 16th International Conference on Luminescence, June 26-July.1, 2011, Ann Arbor,
MI (Oral)
M. J. Oviedo, J.K. Han, S. Castro, O. Contreras, Z.S. Macedo, G. A. Hirata and J. McKittrick,
―Photoluminescence of bismuth germanate phosphors with silica-shell structure,‖ 16th
International Conference on Luminescence, June 26-July.1, 2011, Ann Arbor, MI (Poster).
M. Aburto, J. K. Han, G. A. Hirata and J. McKittrick, ―Synthesis and characterization of (Lu1-x-
yYxCey)Si2iO5 and (Lu1-m-nYmPrn)2SiO5 powders with fast decay time,‖ 16th International
Conference on Luminescence, June 26-July.1, 2011, Ann Arbor, MI (Poster).
J.K. Han, M. Hannah, J.B. Talbot, K.C. Mishra, and J. McKittrick, ―High quantum efficiency of
(Ba1-xEux)2SiO4 sub-micron sized green emitting phosphors for near UV-emitting LEDs,‖ 220th
Electrochemical Society Meeting, Oct.10-14, 2011, Boston, MA (Oral)
J.K. Han, M. Hannah, J.B. Talbot, K.C. Mishra, and J. McKittrick, ―Synthesis and luminenscence
properties of full-color (Ba, Ca, Sr)3MgSi2O8:Eu2+
, Mn2+
phosphors for near UV-emitting LEDs,‖
220th Electrochemical Society Meeting, Oct.10-14, 2011, Boston, MA (Poster)
J.K. Han, M.E. Hannah, A.Piquette, J. Talbot, K. C. Mishra, J. McKittrick, ―Luminescence
properties and stability improvement by SiO2 shells on various phosphors,‖ IEEE photonics, Sep
9-14, 2012, San Francisco, CA (Oral).
J.K. Han, M.E. Hannah, A.Piquette, J. Talbot, K. C. Mishra, J. McKittrick, ―Single phase, highly

xx
efficient Li(Ca0.99-xSrxEu0.01)PO4 blue emitting phosphors for near UV-emitting LEDs,‖ 222th
Electrochemical Society Meeting, Oct.7-12, 2012, Honolulu, HI (Oral).
J.K. Han, M.E. Hannah, A.Piquette, J. Talbot, K. C. Mishra, J. McKittrick, ―Luminescence
properties and stability improvement by SiO2 shells on various phosphors,‖ 222th
Electrochemical Society Meeting, Oct.7-12, 2012, Honolulu, HI (Poster).

xxi
GLOSSARY
CCT Correlated Colour Temperature
CFL Compact Fluorescent Lamps
CIE Commission Internationale de l‘Eclairage
CL Cathodoluminescence
CRI Color Rendering Index
CRT Cathod e Ray Tube
DOE the U.S. Department of energy
EQE External Quantum Efficiency
HID High Density Discharge Lamps
LCD Liquid Crystal Display
LED Light Emitting Diode
lm Luminous flux
lm/W Luminous Efficacy (lumen/watt)
nUV Near ultraviolet (380-410 nm)
OLED Organic light emitting diode
pcLED Phosphor Converted Light Emitting Diode
PL Photoluminescence
PLED Polymer light emitting diode
QE Quantum Efficiency
RE Rare Earth Elements
RGB Red, green, and blue color
RT Room Temperature
SEM Scanning electron microscopy
SSL Solid state lighting
TEM Transmission electron microscopy
UV Ultraviolet
XRD X-ray Diffraction
YAG:Ce Y3Al5O12:Ce3+
xxii
ABSTRACT OF THE DISSERTATION
Synthesis and Luminescence Properties of Rare Earth Activated Phosphors for near UV-
Emitting LEDs for Efficacious Generation of White Light
by
Jinkyu Han
Doctor of Philosophy in Materials Science and Engineering
University of California, San Diego, 2013
Professor Joanna McKittrick, Chair
Solid state white-emitting lighting devices based on LEDs outperform conventional light
sources in terms of lifetime, durability, and luminous efficiency. Near UV-LEDs in combination
with blue-, green-, and red-emitting phosphors show superior luminescence properties over the
commercialized blue-emitting LED with yellow-emitting phosphors. However, phosphor
development for near UV LEDs is a challenging problem and a vibrant area of research. In
addition, using the proper synthesis technique is an important consideration in the development of
phosphors. In this research, efficient blue-, green-yellow, red-emitting, and color tunable
phosphors for near UV LEDs based white light are identified and prepared by various synthetic
methods such as solid state reaction, sol-gel/Pechini, co-precipitation, hydrothermal, combustion
and spray-pyrolysis. Blue-emittingLiCaPO4:Eu2+
, Green/yellow-emitting (Ba,Sr)2SiO4:Eu2+
, color
tunable solid solutions of KSrPO4-(Ba,Ca)2SiO4:Eu2+
, and red-emitting
(Ba,Sr,Ca)3MgSi2O8:Eu2+
,Mn2+
show excellent excitation profile in the near UV region, high
quantum efficiency, and good thermal stability for use in solid state lighting applications. In

xxiii
addition, different synthesis methods are analyzed and compared, with the goal of obtaining ideal
phosphors, which should have not only have high luminous output but also optimal particle size
(~150 - 400 nm) and spherical morphology. For Sr2SiO4:Eu2+
, the sol-gel method appears to be
the best method. For Ba2SiO4:Eu2+
, the co-precipitation method is be the best. Lastly, the
fabrication of core/SiO2 shell particles alleviate surface defects and improve luminescence output
and moisture stability of nano and micron sized phosphors. For nano-sized Y2O3:Eu3+
,
Y2SiO5:Ce3+
,Tb3+
, and (Ba,Sr)2SiO4, the luminescence emission intensity of the core/shell
particles were significantly higher than that of bare cores. Additionally, the moisture stability is
also improved by SiO2 shells, the luminescence output of SiO2 coated green emitting
Ca3SiO4Cl2:Eu2+
and blue emitting Ca2PO4Cl:Eu2+
phosphors is comparable to that of fresh
phosphors although bare phosphors shows significant luminescence quenching after water
exposure.

1
Chapter 1. Introduction
Lighting accounts for 22% of the total US electrical energy use and 7% of the global
primary energy expenditure. Data compiled in 2011, the latest available from the U. S.
Department of Energy (DOE), showed that more than 70 % of electricity used for total lighting
with 85 % of residential lighting using incandescent lights and fluorescent lamps, as shown in
Figure 1.1 [1]. Since most of the energy used for the incandescent lamp is wasted as infrared
radiation and mercury in the fluorescent lamps can cause environmental problems, there have
long been efforts to improve the efficacy of the technology, as well as developing a more energy
efficient light and environmental source to replace incandescent and fluorescent lighting [2].
With the potential for much longer lifetimes and lower energy consumption as compared
to current lighting technologies, the use of light emitting diodes (LEDs), an area of research
known as solid-state lighting (SSL), has become a disruptive technology in the lighting industry.
SSL refers to a type of lighting that uses semiconductor LEDs, organic light-emitting diodes
(OLED) or polymer light-emitting diodes (PLED) as sources of illumination of white light rather
than electrical filaments, plasma or gas [1]. U.S. consumers can save ~$42 billion by the year
2025 if new technologies can be adapted that improve energy efficiency of 50% (relative to the 5%
efficiency of the incandescent light bulb). This also translates to saving 70 gigawatts of power,
which is equivalent to the power generated by 70 one-GW nuclear power plants [1]. A report
issued in 2011 by DOE lists major categories of lighting (incandescent, halogen, fluorescent
lights, high intensity discharge lamps (HID), demonstrated that white-emitting LEDs will surpass
the conventional lighting technologies (including incandescent and fluorescent light sources) in
energy efficiency, lifetime, and environmental issues as shown in Table 1.1 [3]. Luminous
efficacy is the ratio of luminous flux (lm) to that of radiant flux (watt), which will be discussed in
section 2.3.1.

2
Figure 1.1. Annual energy consumption broken down by sectors and lighting technology [1]

3
Table 1.1. Comparison of energy efficiency, luminous efficacy (lumen/Watt), lifetime, heat and presence
of mercury of commonly available light sources [4, 5].
Incandescent Halogen Compact
fluorescent
High
intensity
discharge
LED
Energy
efficiency Very low Low High High Very High
Luminous
efficacy
(Lumen/Watt)
14 24 60-100 65-110 80-140
Lifetime
(hours) 1000 2000-3000 6000-10000 20000 50000
Heat Yes++ Yes++ Yes Yes No
Mercury No No Yes Yes No
For these reasons, white-emitting LEDs have recently been receiving attention due to
their application as a general illumination light source [6]. Inorganic LEDs are based on wide
band gap semiconductors, the active layer of an LED releases photons corresponding to the band
gap energy. Similar to emission from gas atoms in a fluorescent lamp, emissions lines from LEDs
are also narrow and discrete. GaAlAs is used as red emitters, GaP is used as green, and SiC and
InGaN are used as blue emitters [7] (discussed more in detail in section 2.1).
Recently, using LED dies capable of emitting in the blue (450 nm) or ultraviolet (380-
400 nm) region combined with luminescent material known as phosphors have provided a
promising, alternative way of generating white light for general lighting application. The
phosphor absorbs some or all of the light from the excitation LED and, in turn, emits light of
another color to produce white light.
Phosphors are high-purity inorganic materials that emit light when exposed to various
excitation sources such as photons, electrons, or an electric field. In general, phosphors consist of
two components: a host and an activator. The host is typically an insulator (oxide, sulfide and
nitride) or semiconductor. The host lattice contains small (at. % range) and controlled levels of
impurity ions (activators), which produce luminescence output. The activators are typically

4
transition metal or rare earth elements. The standard written notation used for all phosphor system
is the following, host: activator. An example of a yellow-emitting phosphor is Y3Al5O12:Ce3+
(YAG), where Y3Al5O12 is the host lattice and Ce3+
is the activator (discussed more in detail in
section 2.5). Colors ranging from the blue to red can be achieved depending on the host:activator
combination.
Several lighting companies have chosen this approach in preference to color blending of
red, green and blue LEDs. These light sources are still lagging behind the ubiquitous
fluorescence lighting in color quality and efficacy. In order to build white light sources that
exceeds above fluorescent lighting in energy performance and color quality, revolutionary
improvements are necessary both in the performance of LED dies to convert electrical energy to
visible energy and of phosphors to efficaciously generate visible light with the flexibility to blend
these phosphors to generate light sources with the desired luminescence properties.
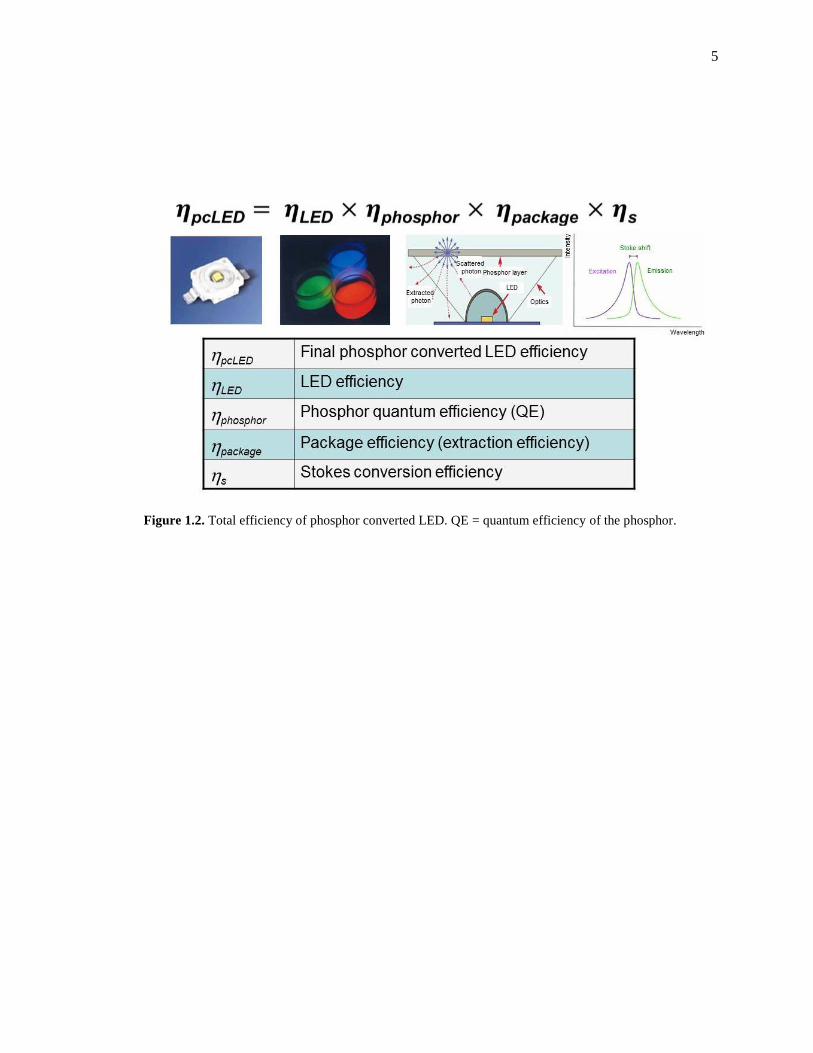
The total efficiency of phosphor converted LED (pc LED) depend on the several factors
as shown in Figure 1.2. ηpcLED is the total pcLED efficiency and is dependent upon the efficiency
of the particular LED source, ηLED; the Stokes conversion efficiency, ηs, which is the ratio of the
average emission wavelengths of the LED and the phosphor; the phosphor quantum efficiency,
ηphosphor, which indicates the ratio of the photons out to photons when the phosphors are excited
from external sources in; and the package efficiency, ηpackage [8], which is the efficiency of light
extraction of LED- and phosphor-emitted photons from the LED device package. All of these
must be optimized to produce the highest efficiency.
5
Figure 1.2. Total efficiency of phosphor converted LED. QE = quantum efficiency of the phosphor.

6
There are two alternative SSL designs that utilize phosphors for white light generation, a
blue emitting InGaN chip with yellow emitting phosphor or a nUV chip with tri- or quadru-blend
phosphors. However, blue-emitting LEDs have significant binning problems (lamp to lamp
variation for the LED package) and light output increases linearly with increasing driving current,
which causes a change in white emission quality. Additionally, the most critical problem for
using blue emitting LEDs is the significant current droop at high current, which decreases the
IQE.
Near-UV excitation sources will exclusively rely on phosphor blending for generating
white light for the desired luminescence properties. With a suitable blend of phosphors, this
device would lead to a light source with better control over luminescence properties, and with
additional flexibility to design lamps for topical applications. Additionally, the nUV sources have
less of a binning problem and current droop problems [9]. Thus, the latter feature would permit
designing high brightness white light sources with suitable phosphor systems.
The goal of this research is to develop and optimize promising nano and submicron sized
blue-, green-yellow, and red-emitting phosphors with high quantum efficiency, (exceeding 90
%) in response to excitation in the spectral region of 380-410 nm. These phosphors will be
optimized for strong absorption in the 380-410 nm range, the excitation wavelength for UV-
emitting diodes, with negligible visible absorption and low scattering coefficient both in the
visible and UV region. Homogenous and uniform inert shell coatings on these phosphors for the
improvement of luminescence properties is also evaluated.
The dissertation is organized as follows: Chapter 2 reviews solid state lighting technology,
the lighting terminology, the current methods to generate white light in LEDs and advantages of
nUV LED for white light generation. In addition, it gives a background on luminescence in
phosphors and requirements and exploration of promising phosphors for nUV LEDs. Finally, it
also reviews advantages and issues of nanophosphors for SSL application. Chapter 3 illustrates

7
how to prepare nano- and submicron sized phosphors with various synthetic methods and
luminescent and structural characterization for these phosphors. Chapter 4-9 contains material
that has already been published or is in preparation. Chapter 4-6 details structure and
luminescence properties of the efficient blue, green-yellow, and red- emitting phosphors,
specifically LiCaPO4:Eu2+
for blue, (Ba,Sr)2SiO4:Eu2+
for green-yellow, KSrPO4-
(Ba,Sr)2SiO4:Eu2+
for blue-yellow, Ba3MgSi2O8:Eu2+
, Mn2+
for red emission. Chapter 8 discusses
the luminescence properties of phosphors depending on the synthetic methods. Chapter 9 details
the luminescent output improvement of nano or micron sized phosphors by SiO2 coatings and
Chapter 10 discusses moisture and chemical stability improvement of phosphors by SiO2 coatings.
Conclusions and recommendations for future work are presented in Chapter 11.
8
Chapter 2. Background and motivation
2.1 Electromagetic spectrum and phenomenon of luminescence
Luminescence is defined as the emission of electromagnetic radiation in excess of
thermal radiation [10], which is different from incandescence processes by which solids emit light
due to their high temperature. Generally, electromagnetic spectrum is classified by wavelength
into γ-ray, X-ray, ultraviolet (UV), visible region, infra-red, microwave, and radio waves. The
types of radiation can be described by frequency ν (in Hz), wavelength λ (in m, etc.), photon
energy E (in eV), or wavenumbers n (in cm-1
) as shown in Figure 2.1. The energy of a photon is
related to ν and λ by [11,12]:
hcE hv hcn
(1)
where h is Plank‘s constant (6.626 ×10⁻³⁴
m2kg / s) and c is the speed of light (3.0 × 10
8 m/s).
Visible light are typically in the region of 400 to 700 nm wavelength. In terms of frequency, this
corresponds to a band in the vicinity of 400–790 THz with wavenumbers of 25,000 and 14,300
cm-1
. Wavelengths from ~200 nm to 400 nm are termed ultraviolet. Wavelengths above 700 nm
and below 10,000 nm are termed infrared.
There are many different types of luminescence, each depending on the excitation
sources that produces the light.
Photoluminescence (PL): light emission resulting from excitation by photons (e.g.
ultraviolet and visible light)
Cathodoluminescence: light emission excited by electron bombardment. Prior to the
discovery of the electron, an electron beam was known as a cathode ray, hence the term
cathodoluminescence.

9
Electroluminescence: the emission of light produced by excitation of a phosphor with an
electric field (~106 V/cm). Examples are LEDs.
Bioluminescence: the observation resulting in biochemical reaction in living organism
(e.g. fireflies, glow warms).
Chemiluminescence: the results when a molecule has a lower potential energy than its
constituent atoms, causing an exothermic reaction that produces luminescent radiation.
Photoluminescence is the only type of luminescence that will be presented in this
dissertation.

10
Figure 2.1 The electromagnetic spectrum [12]

11
2.2. Solid state lighting
LED technology has advanced tremendously since the first demonstration of a practical
visible spectrum LED almost 50 years ago by Holonyak and Bevacqua [13]. Subsequent LEDs
initially used in simple displays (e.g., calculators, watches) and indicator lamps (e.g., clock
radios, compact disc players) have been replaced by more powerful, and more sophisticated,
devices that produce not only red and green emissions, but also blue and, most important, white.
The latter were enabled by the development of the InGaN material system, which was made
possible after key breakthroughs in materials technology were prepared by Amano in the late
1980s [14]. In 1993, Shuji Nakmura at Nichia Chemical led the development of the first
commercial blue LEDs and in combination with a well-known yellow-emitting phosphor
YAG:Ce, these devices realized for the first time the potential for white-emitting SSL products
[7].
The basic construction of an LED is a semiconductor p-n junction as shown in Figure 2.2.
The n-type layer uses electron as the majority charge carrier, whereas the p-type layer uses holes
as the majority charge carrier. Like a conventional diode under forward bias, the anode of the
LED is connected to a positive terminal and the cathode is connected to a negative terminal [15].
As a result, electrons in the n-type layer will be repelled toward the depletion zone of the p-n
junction, and tunnel through to the p-type layer. Similarly, holes in the p-type layer will also be
repelled toward the depletion zone and tunnel through to the n-type layer. The movement of these
charge carriers under forward bias in the p-n junction then produces current flow and voltage
drop, providing the necessary power to operate an LED. Typical operating range for an LED is
around 10 – 30 mA and 1.5 – 3 V [16]. As the electrons cross the p-n junction and recombine
with holes in the p-type layer, they fall into a lower energy state and releases photons, or light,
corresponding to the energy difference (or band gap) between the p-type and n-type
semiconductor

12
The white-emitting LED product, which includes the LED chip, phosphors and the
reflector cup for the improvement of ηexc and electrical contacts, is typically encased in an epoxy
resin designed for the specific application as shown in Figure 2.3 (a). The chip is soldered to a
lead wire serving as the cathode at the bottom of a reflector cup, and the top metal contact is
connected to another lead wire serving as the anode. The placement and arrangement of
phosphors are crucial for the ηexc of white-emitting LEDs. Phosphor arrangements in white-
emitting LEDs are illustrated in Figure 2.3 (b) and (c). Figure 2.3 (b) shows a uniform
distribution of phosphor within the reflector cup. The uniform distribution of phosphor limits the
ηexc since a large portion of light emitted by the phosphors directly impinges on the LED chip
where it can be re-absorbed. If the phosphor is placed at a sufficiently large distance from the
LED chip (remote phosphor configuration as shown in Figure 2.3 (c)), the probability of a light
ray emanating from the phosphor and directly hitting the low reflectivity LED chip is small,
improving the light extraction efficiency. Another advantage of this remote phosphor
configuration is that it can reduce the operating temperature of the phosphor. The quantum
efficiency of the phosphor decreases with increasing operating temperature.

13
Figure 2.2 Schematics of p-n junction for light emitting diode [17].

14
Figure 2.3. LED design and the phosphor package in white LED. (a) Typical LED lamp package. (b)
Uniform phosphor distribution directly in reflector cup (c) Remote phosphor distribution in the package
[18].
15
2.3. White light generation
2.3.1. Basic photometric quantities.
Luminous flux (lm): The luminous flux is the photometric equivalent of the radiant flux in
radiometry. It describes the total ―light energy‖ emitted by a light source per unit time as
perceived by the human eye. The units for the luminous flux are lumen (lm).
Luminous efficacy (lm/W): The luminous efficacy of radiation describes how well a given
quantity of electromagnetic radiation from a source produces visible light: the ratio of luminous
flux (lm) to radiant flux (W) and is also determined by the eye sensitivity over the spectral
distribution of light having units of lm/W [19]. This indicates the overall luminous efficacy of a
source is the product of how well it converts energy to electromagnetic radiation, and how well
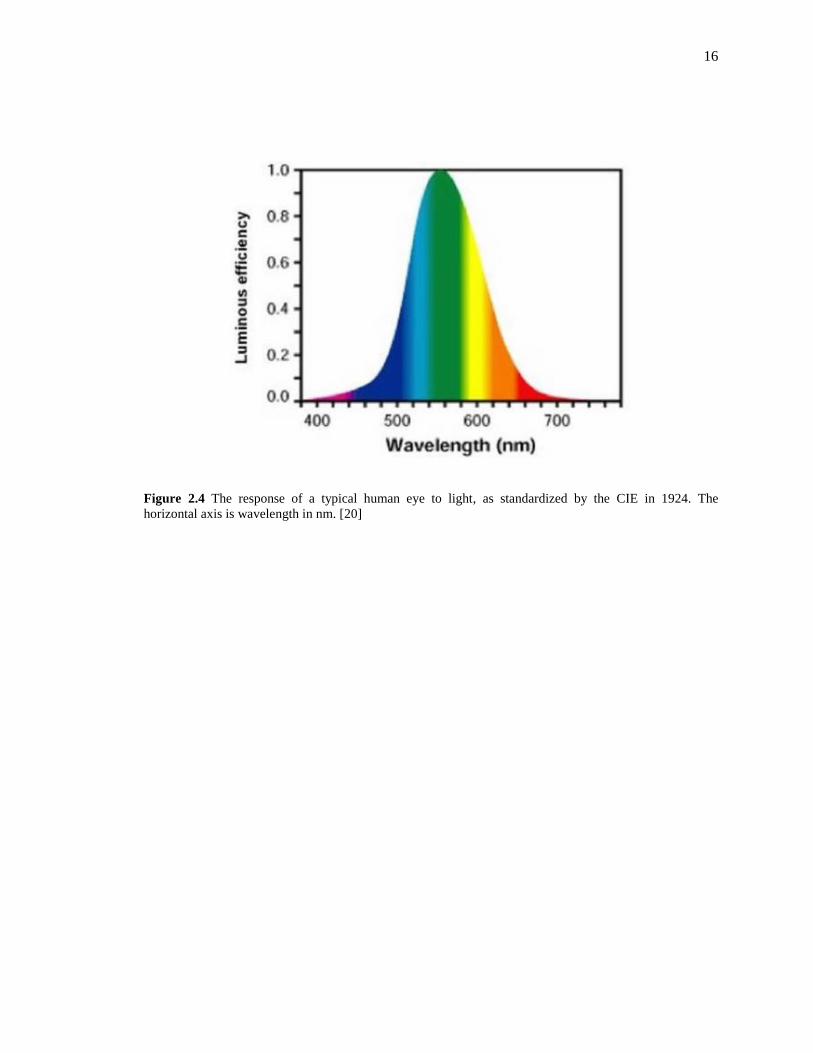
the emitted radiation is detected by the human eye. The light sensitivity (response) of the human
eye is a function of wavelength of the light and in a lighted environment the human eye's peak
perception is at 555 nm as shown in Figure 2.4. From the Figure 2.4, the luminous efficacy at 650
nm is 11% of that at 550 nm in same radiant power because the eye is less sensitive at 650 nm
(red light) than 555 nm (green light).
Luminous efficiency (%): the luminous flux has the same units as radiant flux. The
luminous efficacy of radiation is then dimensionless. In this case, it is often instead called the
luminous efficiency, and may be expressed as a percentage. A common choice is to choose units
such that the maximum possible efficacy corresponds to an efficiency of 100%. The distinction
between efficacy and efficiency is not always carefully maintained in published sources, so it is
not uncommon to see "efficiencies" expressed in lumens per watt, or "efficacies" expressed as a
percentage [19].
16
Figure 2.4 The response of a typical human eye to light, as standardized by the CIE in 1924. The
horizontal axis is wavelength in nm. [20]
17
Color rendering index: The color rendering index (CRI) is a quantitative measure of the
ability of a light source to reproduce the colors of various objects faithfully in comparison with an
ideal or natural light source and has been in wide use in the lighting industry for many years. In
this method, Ri defined as the special color rendering index for each color sample is calculated
using
100 4.6i iR E (2)
The Ri value is an indication of color rendering index for each particular color and Ei
value is the color difference between these color samples and fourteen reference samples of
various colors by Munsell [21]. The general color rendering index Ra, is given as the average of Ri
for the first eight color samples that have medium color saturation. With the maximum value of
100, Ra gives a scale that matches well with the visual impression of color rendering of
illuminated scenes. In general, incandescent lamp and daylight is used as the base reference of
100 CRI. Compact fluorescent lamps are graded at 82-86 CRI, which is considered high quality.
CRI is a more important consideration for retail lighting design than it is for office lighting. Any
CRI rating of 80 or above is considered high and indicates that the source has good color
properties. CRI of some conventional light sources are listed in Table 2.1.

18
Table 2.1. Color rendering index of some light sources [22]
Ra
Daylight 100
Incandescent/halogen bulb 100
Cool White fluorescent 57
Warm White fluorescent 51
Cool White Deluxe 89
Warm White Deluxe 73
Metal Halide 85
Clear Mercury Vapor 18
Coated Mercury Vapor 49
High Pressure Sodium 24
2.3.2. Quantification of color and color mixing.
Within the region of visible light, the colors can be further specified via the 1931
chromaticity diagram, or the CIE x, y diagram [23], shown in Figure 2.5. In the study of color
perception, one of the first mathematically defined color spaces is the International Commission
on Illumination (CIE) 1931 XYZ color space, created by the CIE in 1931 [24,25]. The CIE color
space was derived from a series of experiments done in the late 1920s by William David Wright
[26] and John Guild [27]. Their experimental results were combined into the specification of the
CIE red, green and blue (RGB) color space, from which the CIE XYZ color space was derived. A
color space is a three dimensional space; that is, a color is specified by a set of three numbers (the
CIE coordinates X, Y, and Z, for example, or other values such as hue, colorfulness, and
luminance) which specify the color and brightness of a particular homogeneous visual stimulus.
A chromaticity is a color projected into a two dimensional space that ignores brightness. For
example, the standard CIE XYZ color space projects directly to the corresponding chromaticity
space specified by the two chromaticity coordinates known as x and y, creating the familiar
chromaticity diagram shown in the Figure 2.5.

19
All colors visible to the average human eye are contained inside diagram. Area of the
white triangle in Figure 2.5 represents the gamut of color that can be matched by various
combinations of red, green, and blue used in color monitors. In color theory, the gamut of a
device or process is that portion of the color space that can be represented, or reproduced. The
corners of the triangle are the primary colors for this gamut and the primary colors depend on the
colors of the phosphors of the monitor. Generally, BaMgAl10O17:Eu2+
for blue emitting,
ZnSiO4:Mn2+
for green emitting, and Y2O3:Eu3+
are widely used in color monitor phosphors and
corresponds to point F, G, and H in Figure 2.5, respectively. Using these primary colors (F,G, and
H points), all colors inside the triangle including white light can be achieved.
In addition to using chromaticity to define color, for incandescent black bodies it is also
possible to use the color temperature to define its color. As seen in Figure 2.5, the black body
curve is in the sequence of black, red, orange, yellow, white, and blue-white, which corresponds
to the increasing temperature of an incandescent object as it radiates thermally. When an object is
heated to emit light that correspond to the black body curve, its temperature is defined as the
color temperature. Therefore, the color temperature of an incandescent light source is the
temperature of a body on the black body curve that has the same color, or chromaticity on the
diagram, as the light source. The correlated color temperature (CCT) of a light source, then, is
defined as the temperature of the body that is not on the black body curve with a color that is
closest to the light source.

20
Figure 2.5. The 1931 chromaticity diagram [28]. Triangle represents primary colors used in CRT color
monitors.

21
Figure 2.6. Color temperature comparison of common electric lamps [29]

22
Typical CCT of the white region in the diagram range between 2500 and 10000 K and
Lamps with a CCT rating below 3200 K are considered ‗warm‘ sources, while those with a CCT
above 4000 K are considered ‗cool‘ in appearance as shown in Figure 2.6 [29]. A warmer light is
often used in public areas to promote relaxation, which cooler light is used to enhance
concentration in office. Desired CCT for warm white-emitting LEDs is between 3500-4000 K and
for cool white-emitting LED is near 6000-6500K [30]. CCT of some light sources are listed in
Table 2.2.
Table 2.2. Color temperature of some artificial and natural light sources [30]
Temperature Source
1,700 K Match flame
1,850 K Candle flame, sunset/sunrise
2,700–3,300 K Incandescent lamps
3,000 K Soft White compact fluorescent lamps
3,200 K Studio lamps, photofloods,
4,100–4,150 K Moonlight, Xenon arc lamp
5,000 K Horizon daylight
5,000 K Tubular fluorescent lamps or Cool White/Daylight compact fluorescent lamps (CFL)
5,500–6,000 K Vertical daylight, electronic flash
6,500 K Daylight, overcast
5,500–10,500 K Liquid crystal display (LCD) screen
15,000–27,000 K Clear blue poleward sky
23
2.4. Strategies to produce white light LED
For LEDs to be used for white light generation, excellent color rendering and efficacy
must be taken into account. However, there is a trade-off between the two critical criteria for
white light since color rendering is best achieved by a broadband spectra distributed throughout
the visible region, while the efficacy is best achieved by a monochromatic radiation at 555 nm
(green) the wavelength where the human eye response reaches its maximum [31]. White light
LEDs suitable for high quality lighting application can be generated in a variety of ways with
some examples presented here. Figure 2.7 shows the schematics of three kinds of approaches for
white light generation.

24
Figure 2.7. Three approaches for white light generation from (a) Blue-, green-, red-emitting LED chips, (b)
blue-emitting LED chips and yellow emitting phosphors, and (c) near UV emitting LED and blue-, green-,
red-emitting phosphors
25
White light generation from blue-, green-, and red-emitting LED chips: White light can
be formed by mixing differently colored lights; the most common method is to use red, green, and
blue (RGB) as shown in Figure 2.7 (a). With this approach for white light generation using
currently available LEDs, the generation of white-light can have luminous efficacies of around
120 lm/W but very low color rendering capability [31]. Despite of great advantages of this
strategy such as excellent versatility and larger efficacies, there are potential problems with this
approach: first, the light intensity of LEDs and driving voltages are very likely to vary from diode
to diode (binning problem), and the task of color-tuning individual diodes is likely to be difficult.
Second, these LEDs are subject to significant changes in color and intensity with variations in
temperature which are detrimental effects on the quality of white light. In addition, variation in
operating life of different color LEDs. For example, the light output level of AlGaAs-based LEDs
(red emitting) is found to decrease by about 50% after 15,000 to 40,000 hours of operation [20].
This effect represents a serious challenge for this approach where the white-light color rendering
is critically dependent on the relative intensities of the separate red, green, and blue colors.
Finally, these white-light sources are also relatively expensive since multiple LED chips are
required to produce a single source of white light.
White light generation from blue-emitting LED chips and yellow-emitting phosphors: An
alternative and currently commercialized method for white-light generation involves the use of a
blue LED and yellow emitting phosphors. Commercially available white LEDs consist of a blue
InGaN LED overcoated with YAG:Ce inorganic phosphor. The InGaN LED generates blue light
at a peak wavelength of about 460 nm (Point I in Figure 2.5), which excites the YAG:Ce3+
phosphor to emit yellow light (Point J in Figure 2.5). The combination of the blue light from the
LED and the yellow light from the YAG:Ce3+
results in white light. However, there are still
several significant problems with this design. First, the light output is not uniform as blue light
‗escapes‘ and is observed at the edges of the diode. Secondly, the CRI value is still low. As
26
shown in Figure 2.7 (b), there is a significant ‗gap‘ between 450-550 nm where emission intensity
is significantly lower than that in other spectral region. Third, the manufacturing steps are
complicated. Uniformity of the powder mixture is difficult to achieve in the epoxy. However,
there are many companies producing white-emitting LEDs (blue-emitting chips and yellow
emitting phosphor), the major ones being OSRAM-Sylvania (Germany/USA), CREE (USA),
Nichia (Japan), General Electric (USA), and Philips Lumileds (USA). These LEDs are packaged
and used for a variety of applications, e.g. household lighting, warehouse and factory floor
lighting, street lighting, backlights for laptops and cell phones, and automotive lighting.
2.4. 1. Advantages and the need for near UV LED solid state lighting.
Another approach is the use of a near-UV (nUV) LED source, which depends entirely on
the phosphor blend to generate white light. Before getting into the details of phosphors for nUV
LEDs, it is worthwhile to consider the benefits of this and the blue-emitting LED and yellow-
emitting phosphors.
If the LEDs and phosphors in both systems perform with comparable efficiencies, there is
an intrinsic advantage of about 12.5% for the blue LED approach (estimated by taking the ratio of
450 nm to 400 nm). Then, the question is why should we consider the nUV systems at all? The
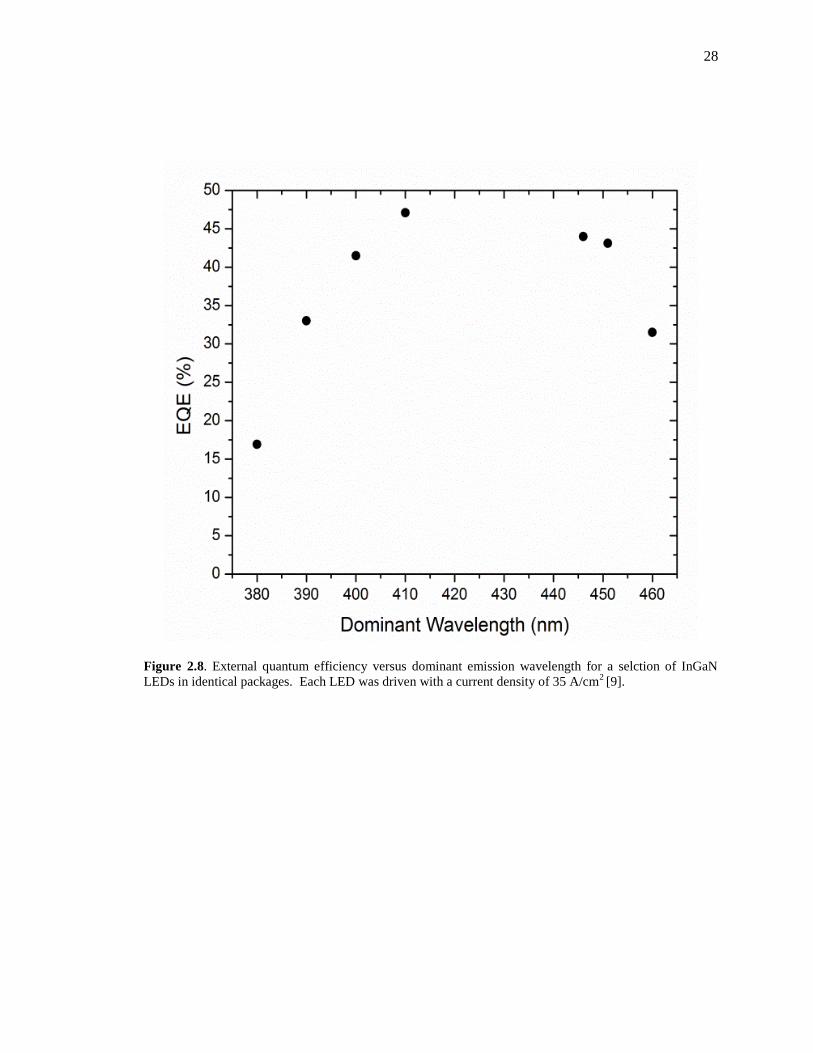
answer to this question lies partly on the performance of nUV chips. Both blue and nUV LEDs
are based on solid solutions of InN and GaN. As the InN content increases, the external quantum
efficiency (EQE) of the LED chip increases accompanied by a red shift of the emitted radiation
(Figure. 2.8) [9]. The specific functional dependence of EQE on wavelength could be due to
many factors including processing conditions and no universal behavior is implied. At
wavelengths longer than 450 nm, the EQE decreases rapidly toward the green part of the
spectrum, a phenomenon referred to as the ―green gap‖ in the SSL technology.

27
At 400-410 nm, the InGaN chips perform as well as the blue chips at low current
densities [9]. However, the real advantages of the nUV LEDs lie in less current drooping (Figure.
2.9) and significantly less binning as discussed in section 1. In Figure 2.10, a comparison of
same generation blue and nUV LEDs, this crossover occurs at a current density of 35A/cm2. This
improved efficiency allows the nUV LEDs to produce a greater photon density at higher currents
than the blue LEDs helping to compensate for the increased Stokes loss.
There is more flexibility in the design when the blue portion of the spectrum is generated
with phosphors instead of LEDs. Both phosphors and LEDs have tunable peak locations, but
phosphors allow more variation in the peak width, which is important for color rendering
purposes and lumen equivalence. Also since the phosphors needed for nUV LEDs do not have to
absorb blue light, it is possible to have a white-bodied phosphor blend instead of the typical
yellow-orange color of blue LED phosphor blends
28
Figure 2.8. External quantum efficiency versus dominant emission wavelength for a selction of InGaN
LEDs in identical packages. Each LED was driven with a current density of 35 A/cm2 [9].
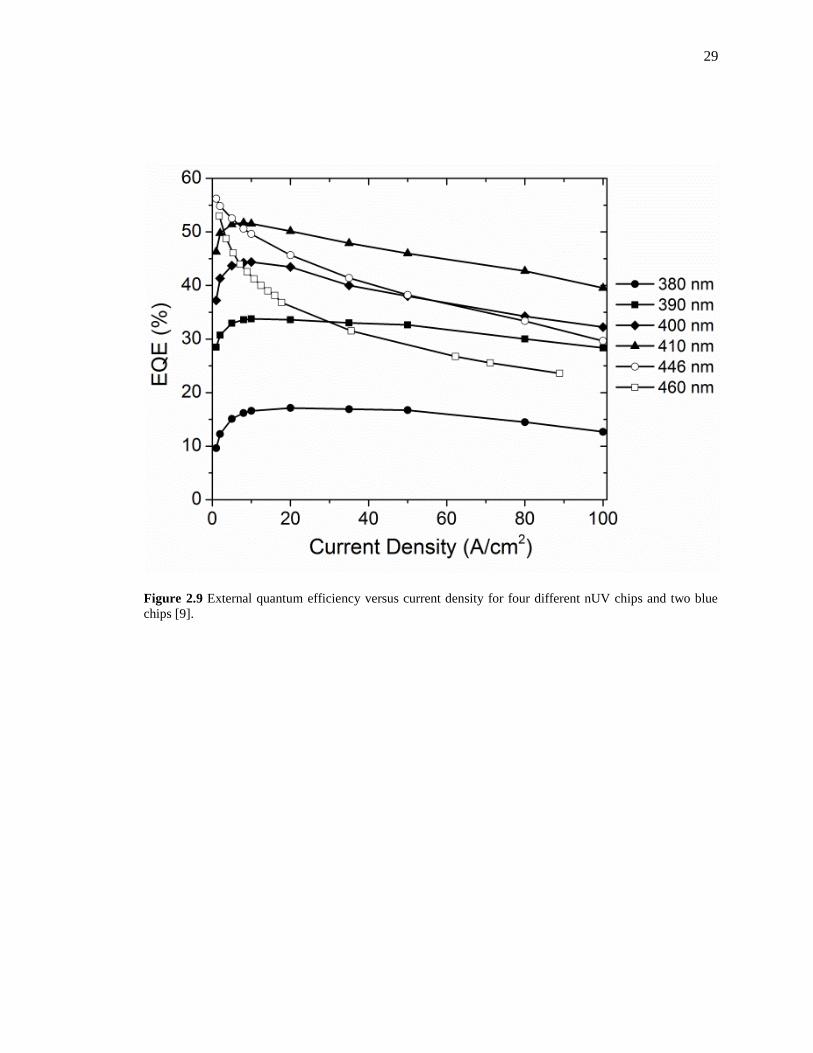
29
Figure 2.9 External quantum efficiency versus current density for four different nUV chips and two blue
chips [9].

30
Figure 2.10. Ratio of emitted optical power for nUV (405 nm) and blue LED (450 nm) packages as a
function of electrical current, based on instant-on measurements [9].

31
2.5. Luminescence in phosphors
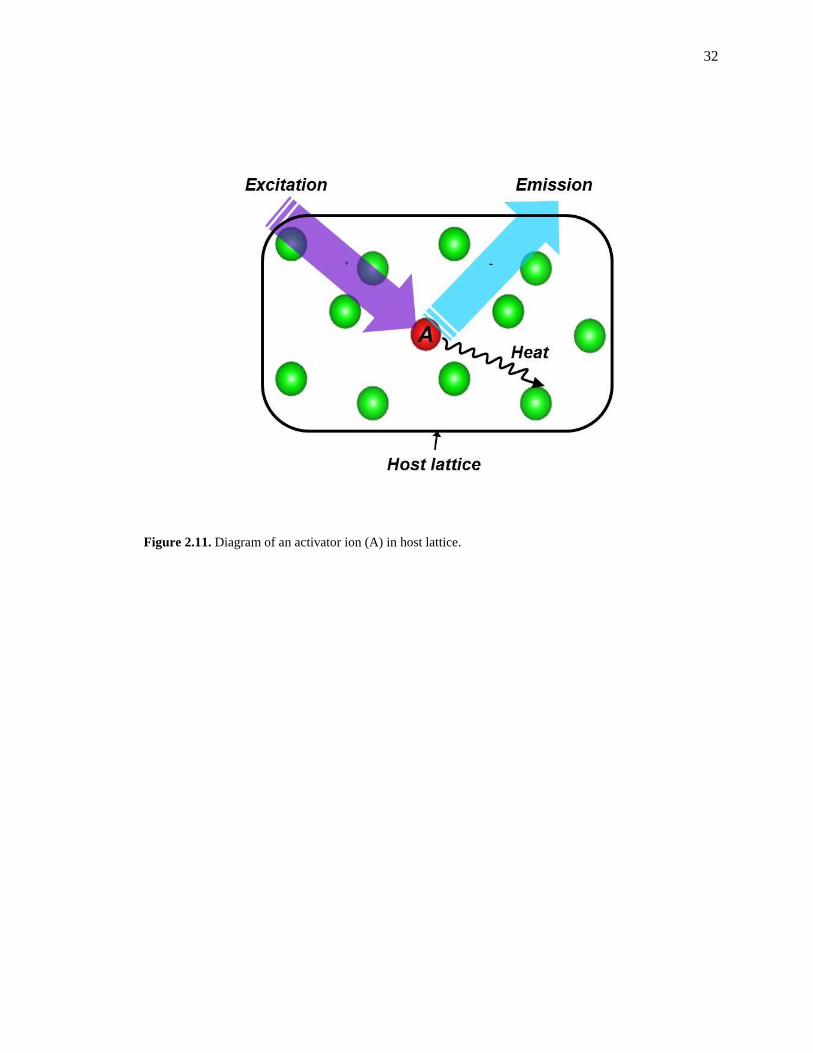
Figure 2.11 shows general schematics of the luminescence in phosphors. When the
external photon sources are used for excitation of the phosphor, a phosphorescence process (light
absorption, excitation, relaxation, and emission) takes places in the phosphor materials. To
understand the origin of luminescence in phosphor materials, it is essential to have knowledge of
the underlying absorption and emission transitions, non-radiative transitions, which are discussed
in the following sections.
2.5. 1. Characteristic luminescence
2.5.1.1. Influence of crystal field
The luminescence of phosphors is determined by the local environment that surrounds the
activator ions. The atoms or molecules that surround a central atom or ion are known as ligands.
Crystal field theory can be viewed as a special case of ligand field theory. The crystal field is
defined as the electric field at the site of a particular ion under consideration due to the
surroundings [32]. As a result, the resultant orbital states of d electrons (5d for rare ions and 3d
for transition ions) will be split. Luminescence properties of phosphors are sensitive to this crystal
field. The most clear example of this is found in the transition metal such as Cr3+
and Mn2+
and
some of rare earth metals showing 4f-5d transition such as Ce3+
and Eu2+
(discussed in 2.5.3).
Crystal field splitting depends on the several factors:
(1) number of electrons in d orbitals
(2) oxidation state of the crystal
(3) the arrangement of the ligands around the crystal
(4) the nature of the ligands
32
Figure 2.11. Diagram of an activator ion (A) in host lattice.

33
The most common type of complex is the octahedral. In this case, six ligands form an
octahedral field around the metal ion and the ligands point out directly into d-orbitals and cause
high energy splitting. Cr3+
, Mn2+
, and Mn4+
always prefer an octahedral coordination [33,
34] .The electronic configuration of Cr3+
ion is 3d3 indicating there are 3 unpaired electrons in the
five 3d degenerated orbits. The five 3d orbitals (dx2-y2, dxy, dz2, dxz, and dyz) are shown in Figure
2.12. When the Cr3+
ion is placed in an octahedral field such as on an Al3+
sites in Al2O3, the
electron of octahedral field will strongly interact with the Cr3+
ions lying x, y, z axes (the dz2, and
dx2-y2 orbitals) [34]. These orbitals are called eg orbitals and will be raised in energy by the
presence of an octahedral crystal field. On the other hand, dxy, dxz, dyz orbitals called t2g orbitals
will be repelled by the electrons and the energy will be lowered than the energy without crystal
field. This energy splitting between eg and t2g orbitals is shown in Figure 2.13. Depending on the
strength crystal field and surroundings on the activator ions, the emission color can be changed.
For example, Al2O3:Cr3+
shows red emission under visible light. However, Cr2O3, which is same
crystal structure as Al2O3, shows green emission under visible light due to different crystal field
(Al2O3:Cr3+
shows stronger crystal field than Cr2O3 because Cr3+
ions (0.065 nm) in Al2O3 occupy
smaller Al3+
(0.051 nm) sites.

34
Figure 2.12. Schematic representation of the five 3d orbitals [35].

35
Figure 2.13. Energy splitting of the five d orbitals for octahedral crystal field and the orbits of the free ion.
[36]

36
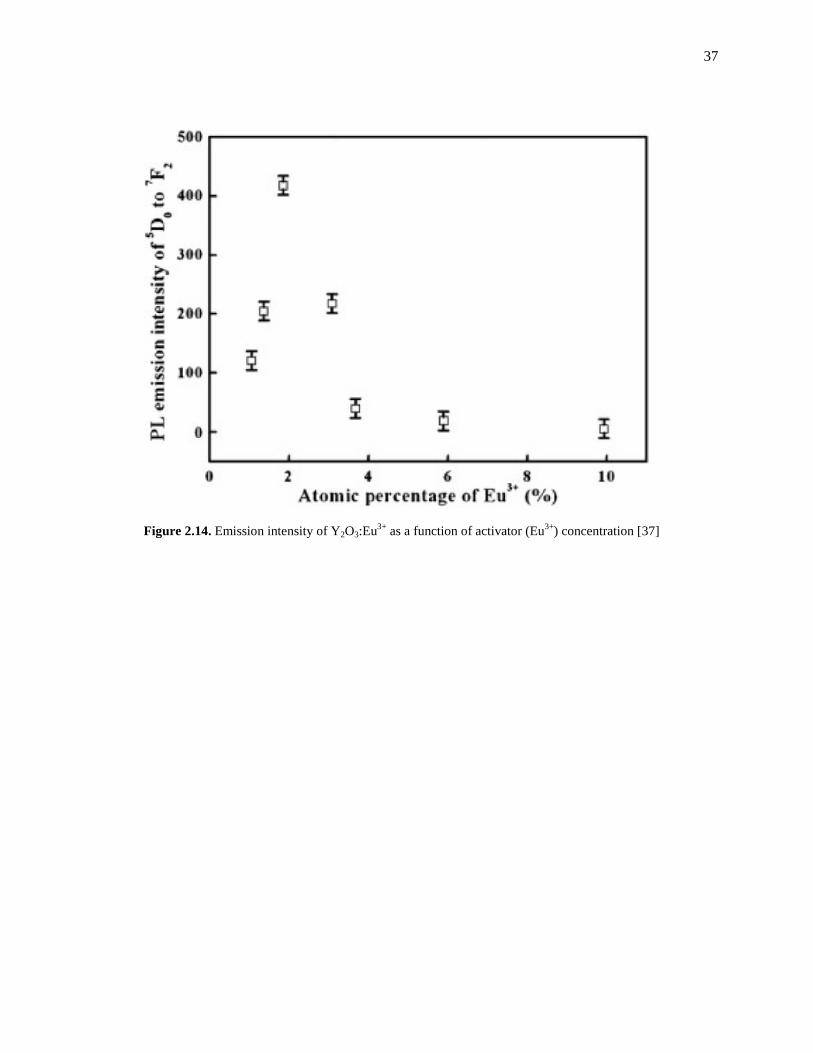
2.5.1.2. Effect of activator concentration
The activators are added to the host lattice in concentration typically ranging from 0.1 –
10% for efficient phosphors. Each phosphor composition has an optimum activator concentration
for obtaining maximum luminescence output. This effect is called as ‗concentration quenching‘
and the origin of this effect is thought to be following: Excitation energy is lost from the emitting
state due to cross-relaxation, which called non-radiative energy transfer (described latter),
between activators. The optimal activator concentration for a particular phosphor is generally
determined empirically. Figure 2.14 shows the emission intensity as a function of activator ions
for Y2O3:Eu3+
and ideal activator concentration of the phosphor is 2 at.%.
37
Figure 2.14. Emission intensity of Y2O3:Eu3+
as a function of activator (Eu3+
) concentration [37]

38
2.5.1.3. Configuration-coordinate model
The configurational coordinate model (Figure 2.15) typically explains optical properties,
such as the shapes of the absorption and emission bands and lattice vibrations [10]. This diagram
describes the effect of crystal relaxation after an optical transition. The y axis represents the
potential energy for the ground and excited states and the x-axis is the deviation from the ion
equilibrium distance (i.e. the configurational coordinate). The Franck-Condon principle
dominates the absorption and emission processes [38]. The basis for this principle is that the
electronic state transition time is much shorter (10-16
s) than the vibrational period of neighboring
nuclei (10-13
s). Thus, electronic transitions are said to occur in static surroundings causing
absorption and emission transitions to be vertical [10]. This model can explain several factors.
They include [10]:
1. Stoke‘s Law: the absorption energy is greater than that of emission. (Stoke‘s shift: the
difference between the two energies)
2. Absorption and emission band widths, shapes and their temperature dependence.
Figure 2.15 shows the configuration coordinate diagram illustrating absorption and
emission between a ground state and an excited state (radiative process) and non-radiative
process. The two parabolas indicated in the configuration-coordinate diagram represent a
combination of the electronic energy of activator embedded within a phosphor host and also the
lattice vibrational energy associated with the phosphor host–activator system. In an absorption
process, such as shown by A → B in Figure. 2.15, the electron is initially in its equilibrium
ground state (lowest 4f state) and is excited vertically at a constant configuration coordinate to a
non-equilibrium excited state. Subsequently, on a longer time scale than that of the optical
transition, the non-equilibrium excited state electron thermalizes to the equilibrium excited state
configuration coordinate, thereby dissipating relaxation energy into the lattice as heat. Emission C
→ D is a converse process involving initial equilibrium excited state vertical decay into a non-

39
equilibrium ground state, and subsequent relaxation back to the equilibrium ground state
configuration.
Thermal quenching can be explained by this diagram. Thermal quenching refers to a
decrease of luminescence efficiency of a center due to the local heating by energetic electrons or
photons. It occurs at high temperatures when thermal vibrations of atoms surrounding
luminescent center transfer energy away from center resulting in a non-radiative recombination,
and a subsequent depletion of the excess energy as phonons in the lattice [10]. The thermal
quenching process is described in terms of configurational coordinate model of non-radiative
relaxation processes in Figure 2.15. In non-radiative process, the relaxed excited state can reach
the crossing of the parabolas (E) after absorption in phosphors (B) if the temperature is high
enough or the energy between equilibrium excited state and crossing point of the parabolas (ε) is
small. Via the crossing, it is possible for electrons to return to equilibrium ground state in a non-
radiative manner. The energy is given up as heat to lattice during process.
These radiative and non-raditiave processes are crucial to affect luminescent properties of
phosphors such as quantum efficiency, emission intensity and thermal stability of the phosphor,
which will be discussed in section 2.6.

40
Figure 2.15. The configuration coordinate diagram illustrating absorption and emission between a ground
state and an excited state and non-radiative process.

41
2.5.2. Mechanism of light emission in rare earth activated phosphor
2.5.2.1. 4f-4f transitions
In the 4f -4f transitions, electrons are transferred between different energy levels of the
4f orbital of the same RE3+
ion. These transitions are actually forbidden by the parity selection
rule, which states that electronic transitions between energy levels with the same parity cannot
occur [39]. Since energy levels within the 4f orbital have same parity, the 4f -4f electronic
transitions are forbidden. In reality, this transition can occur because the parity rule is relaxed due
to perturbation such as electron vibration coupling and uneven crystal field term from host lattice
[40]. However, the 4f electrons of lanthanide ions in the 3+ state (Ln3+
) are shielded from external
fields by the 5s and 5p electrons and hence the crystal field effect from host lattice is very small.
Therefore, each Ln3+
is uniquely characterized by its energy levels, relatively independent of the
host material, and their f-f absorption/emission bands are narrow (Figure 2.16). In this figure, it
can be seen that the excitation spectrum of Y2O3:Eu3+
phosphors consists of a broadband with a
maximum at 260 nm due to the charge-transfer band between O2−
and Eu3+
and multiple 4f–4f
transition lines of Eu3+
. In addition, the typical emission spectrum of the 5D0→
7FJ (J = 0, 1, 2, 3, 4)
transition lines of Eu3+
, with the 5D0→
7F2 transition (610 nm) being the most prominent peak. The
identification of these trivalent rare earth transitions have been done by Dieke and co-workers in
1960s [41], and the Dieke diagram (Figure 2.17) can be used to quickly identify transitions based
on their energies.
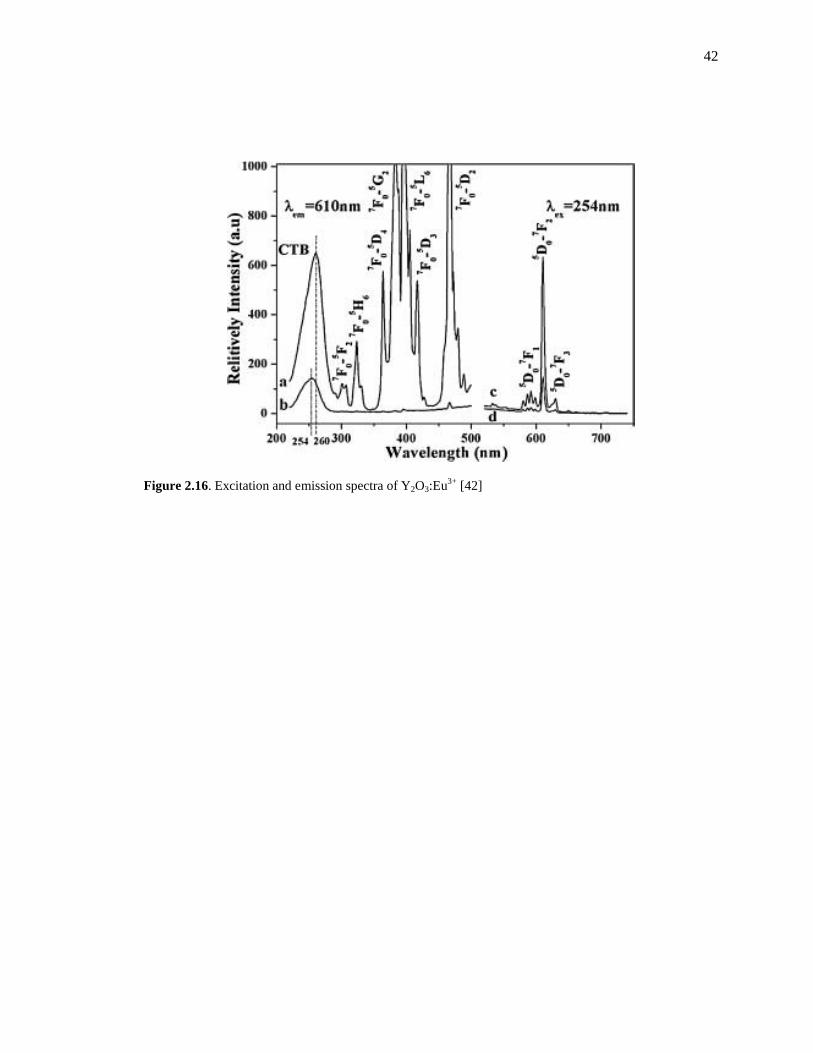
42
Figure 2.16. Excitation and emission spectra of Y2O3:Eu3+
[42]
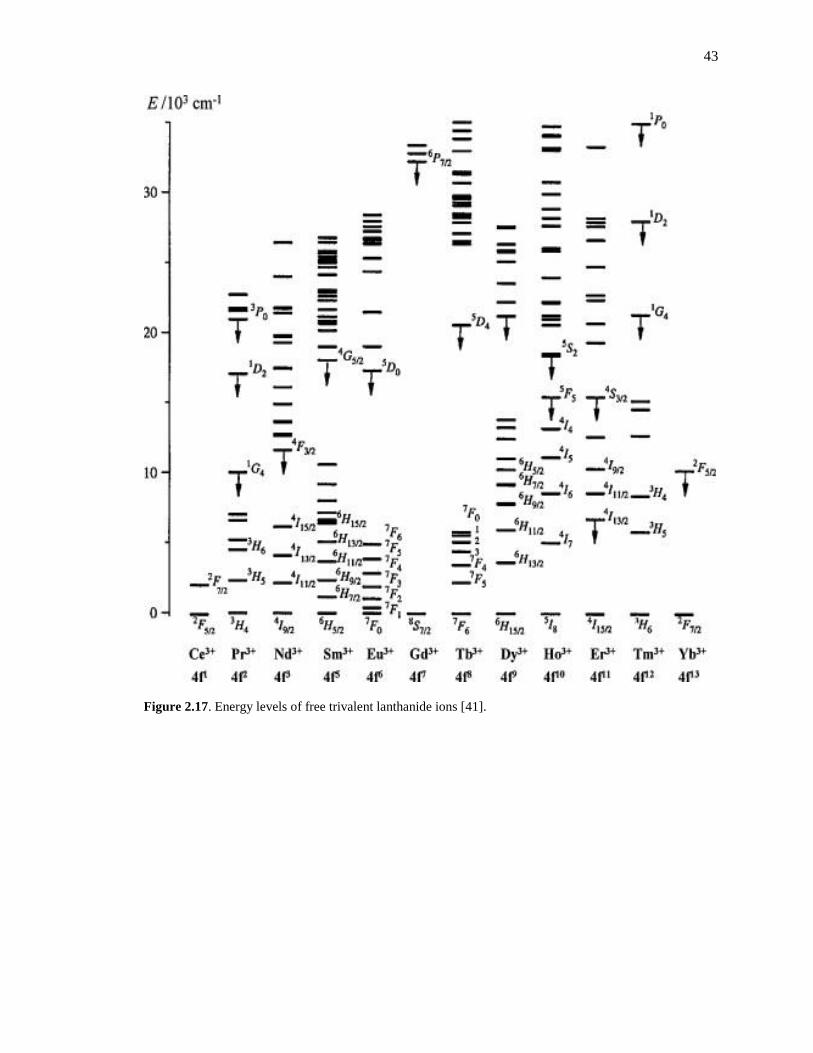
43
Figure 2.17. Energy levels of free trivalent lanthanide ions [41].

44
2.5.2.2. 4f-5d transitions
There are a number of rare earth ions such as Ce3+
, Pr3+
, Tb3+
, Er3+
and Eu2+
that can be
excited directly from a state in the 4fn configuration to an excited state in the 4f
n-1d
1
configuration and emit either through an intraband 4f 4f transition or a 5d-to-4f transition.
Unlike the transitions via multiplet states of a 4fn configuration that are strictly forbidden by the
selection rule [43], the 4f-to-5d transitions are dipole allowed. However, unlike the 4f-state, the
5d states are diffuse and overlap with ligand orbitals. It is for this reason that the 4f-to-5d
transitions are strongly dependent on the host, and vary over the spectral range from the deep UV
to far-infrared region. Figure 2.18 shows the schematics of the effect of host crystal field on the
4f7 and 4f
65d
1 energy level in Eu
2+ [10]. The emission will change from line emission in the UV
to band emission in the visible region with the increasing host crystal field.
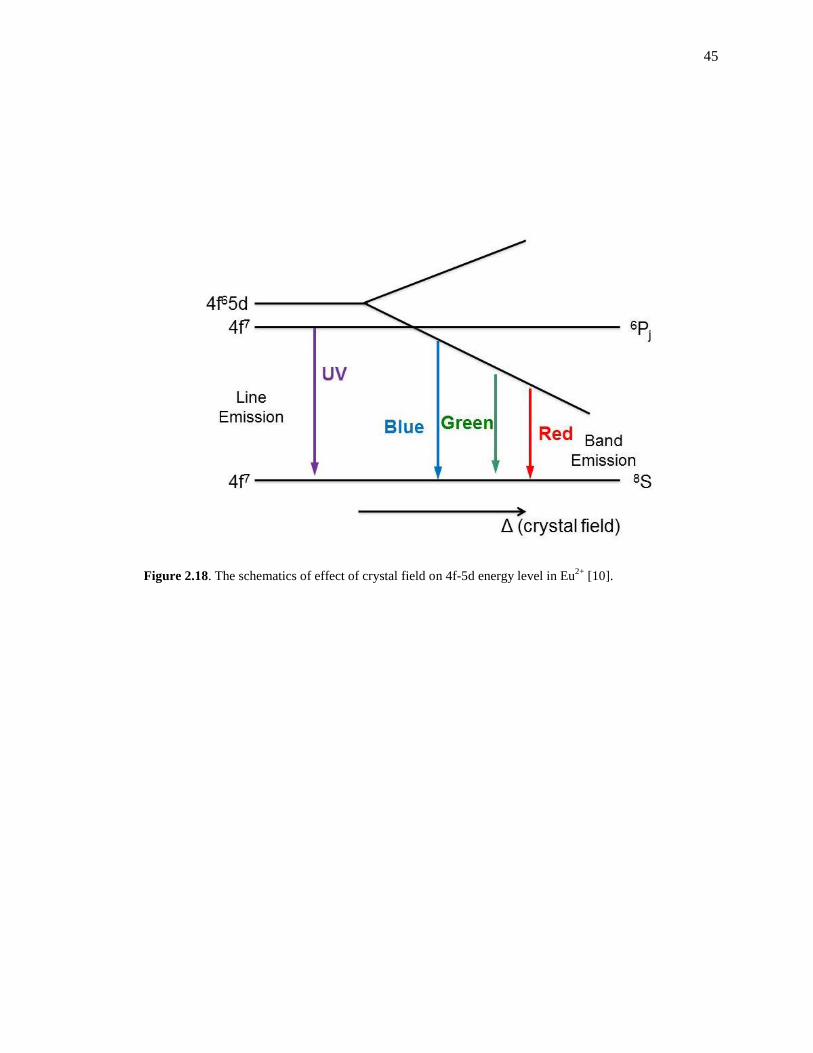
45
Figure 2.18. The schematics of effect of crystal field on 4f-5d energy level in Eu2+
[10].

46
It is therefore very likely that one could find a host in which the 4f-to-5d transitions could
lead to absorption bands near UV or blue region and the corresponding emission bands in the
visible. The candidates for such transitions are Ce3+
and Eu2+
ions. It is not surprising that most
of the phosphors for LED application are based on Eu2+
and Ce3+
ions.
The electronic configuration of Ce3+
is the simplest with one electron in the 4f-shell.
This ion absorbs and emits through 4f-to-5d transitions. Since the excited state levels of 4f7
configurations are higher in energy than those from the 4f65d
1 configuration, Eu
2+ ion absorbs and
emits in a similar manner. On the other hand for ions such as Pr3+
, the energy gap between the
ground state of 4fn configuration and the lowest energy level of 4f
n-15d
1 configuration is filled
with excited states arising from 4fn configuration. Thus, upon excitation to a 4f
n-15d
1 level, the ion
does not normally relax to the ground state via 5d-to-4f transitions, but through energy levels
associated with multiplet states of 4fn configuration. Such an ion will exhibit either the line
spectra associated with radiative transitions characteristic of 4fn states or a mixture of transition
originating from the 4fn-1
5d1 and 4f
n configurations. For example, a Tb
3+ ion, upon excitation to a
4fn5d
1 state, returns to the ground state via transitions originating from the
5D4 and
5D3 levels
associated with 4fn configuration, with predominantly green emission near 545 nm [10].
2.6. Requirement of ideal phosphors for near UV LEDs
There are several basic properties that an ideal nUV phosphor should simultaneously
possess. The quantum efficiency (QE) should be as high as possible and the excitation maximum
should fall in the range where nUV LED emission is most efficient (380 to 410 nm). It may not
be possible to find a blue emitting phosphor that is excitable at wavelengths longer than 410 nm
because of the Stokes shift requirements. However, a high QE and the location of the excitation
maximum alone are not sufficient; the phosphor must have a high absorption rate in the LED
emission range as well. This essentially limits phosphors utilizing transitions forbidden by

47
Laporte‘s rule, such as transitions within the 4f- and 3d- manifolds. This severely restricts
utilizing line emissions from the trivalent lanthanide ions, which are extensively used in the
fluorescent lighting industry. The candidate phosphors are limited to those that are excited
through the allowed 4f→5d, np→nd, ns→np transitions, and host or molecular group transitions.
It is no surprise that most of the phosphors identified for nUV LEDs so far are based on Ce3+
and
Eu2+
ions. In order to utilize the narrowband emissions from trivalent lanthanide ions such as
Eu3+
or Tb3+
, it is necessary to explore hosts whose charge transfer transition bands are located
near 400 nm (there are not many), or to use appropriate energy transfer schemes. Because of
higher photon flux from LEDs, compared to fluorescent lamps, and from Stokes losses, the
phosphor layers are expected to operate at elevated temperatures, which require the phosphors to
have greater reduced thermal quenching. The phosphor must not degrade chemically or thermally
and be free from photo-bleaching. The radiative lifetime of the activator ions should be short (ns-
range) in order to reduce saturation effects and nonlinear, non-radiative recombinations due to
depletion of the ground state and excited state interactions. Finally, it must be possible to
manufacture the phosphor on a large scale in an economical manner. The phosphor should be
non-toxic, and the fabrication, use, and disposal of the phosphor should be as environmentally
benign as possible.
2.7. Exploration of novel phosphors for near UV LEDs via empirical investigation
For use in nUV LEDs, the main issue is to identify the activators and hosts that will have
4f→5d excitation energy in the 380-410 nm range with emission in the visible region.
During the last few years, Dorenbos [44-52] empirically studied this problem and
observed that energy, Ea(RE3+
,A) (RE = rare earth element) required to excite a 4f electron to the
lowest 5d level split by the crystalline field depends on the free ion energy, EF(RE3+
) and crystal
field depression in host, A given by D(A) is:
48
3 3( ) ( ) ( )a FE RE E RE D A (3)
This interesting relationship shows that excitation energies depend on two parameters:
one depending on the rare earth ion and other depending on the host lattice A. This equation
provides a theoretical framework to explore 4f-to 5d transitions for a rare earth ion in a given
host, if the 5d-to-4f transition energy is available for one rare earth ion in that host. The emission
energies, Ee(RE3+
,A) also satisfy a similar relationship:
3 3( ) ( ) ( ) ( )e FE RE E RE D A S A (4)
S(A) describes the Stokes shift in host A and is independent of the rare earth ions.
Similar relations have been found to be valid for divalent ions. The validity of these expressions
have been established both empirically and by a priori calculations for rare earth ions in solids
[44, 45]
Both Equation.3 and 4 have been found to be valid within ±500 cm-1
. Values of EF(RE3+
)
are available for most ions [46]. An extensive list of D(A) has been tabulated by Dorenbos for
trivalent rare earth ions and a somewhat smaller list for divalent ions. For Ce3+
, Ea(Ce3+
,A) can
be shown to be:
3 1( ) 49340 ( )aE Ce cm D A (5)
Thus, for excitation in the spectral range of 380-400 nm, hosts with D(A) ranging from
23025-24340 cm-1
are needed. These are rather high values of D(A) and can be obtained in
iodides, some oxides, oxy-halides, sulfides and oxy-nitrides. A quick inspection of the data

49
reported by Dorenbos [47, 48] reveals about twenty-four host lattices (see Table 2.3), some of
which are employed as hosts for phosphors for UV LEDs. For some of them, S(A) is also
available which can be used to predict the 5d-to-4f emission energies. A thorough search of
literature together with some exploratory studies of Ce3+
ions in yet to be considered novel hosts
based on crystal structure data (for example the Inorganic Crystal Structure Database, ICSD)
could add potential candidates for Ce3+
activation.
Table 2.3 Preliminary list of hosts for Ce3+
based on available values of D(A) in cm-1
Host D(A)
(cm-1
) Hosts
D(A)
(cm-1
) Hosts
D(A)
(cm-1
) Hosts
D(A)
(cm-1
)
Cs3Gd2O9 23830 Mg3F3BO3 24716 LuOCl 24716 LaOI 23748
NaYGeO4 23284 LiYGeO4 24477 Gd2SiO5 23298 Y2SiO5 23093
SrLaAlO4 24332 Y4Al2O9 22974 Y3AlGa4O12 24480 GdTaO4 24038
SrY2O4 24529 Ce3(SiS4)2Cl 23567 Ce3(SiS4)2F 23366 BaSi2S5 24462
BaAl2S4 23366 BaGa2S4 23230 SrAl2S4 24151 CaAl2S4 24088
YOI 24815 SrAl12O19 23816 Ba2SiS4 23292 Y4Si2O7N2 23699
All other trivalent rare earth ions have 4f-to-5d transition energies larger than Ce3+
, and
thus would require hosts with larger values of D(A) in order to be excited via 4f-to-5d transitions
at 380-400 nm. Only two other ions, Pr3+
and Tb3+
appear to be candidate ions [51]. The free ion
energies for Pr3+
and Tb3+
are higher than Ce3+
by 12240 cm-1
and 13200 cm-1
, respectively. For
Tb3+
ions, one would need a host with 37540 cm-1
. It is very unlikely that a host could be found
that would lead to a crystal depression energy large enough for Tb3+
to be excited directly through
a 4f-to-5d transition. The same is true for other trivalent rare earth ions.
For Eu2+
, the 4f-to-5d transition energies are given by [47]:
2 1( ) 34000 ( )eE Eu cm D A (6)
50
In order to be excited in the spectral range of 380 nm to 400 nm, D(A) varying 7685 cm-1
to 9000 cm-1
will be necessary and S(A) ranging from 2700 cm-1
to 8300 cm-1
for the 5d-to-4f
transitions to occur in the range of 450 nm to 600 nm. Data compiled by Dorenbos [47] for Eu2+
show a large number of hosts for which these conditions could be easily met. It is not surprising
that most of the phosphors emitting in the green and red utilize Eu2+
as the activator ion.
In order to develop broadband phosphors capable of emitting in the visible region, the
present proposal will extensively use the empirical approach based on Eqs. (3)-(6) for selecting
candidate hosts with Eu2+
or Ce3+
as the activator ions. Since these equations are based on
observed transitions, the host-activator ion combinations chosen by this approach will lead to
discovery of new phosphors in a reliable manner. However, this approach does not tell us in
which host the quantum efficiency will be high enough to meet higher luminous efficacy over
140 lm/w. For this purpose, we need relatively various synthesis methods (to be discussed)
compared to the solid state reaction approach that would allow us to survey D(A)s in a large
compositional array for further exploration.
The available data on many blue (λem ≈ 400 to 490 nm), green-yellow (λem ≈ 490 to 580
nm), and red emitting phosphors (λem ≈ 580 to 650 nm) including my previous works based on the
4f→5d transitions of Eu2+
and Ce3+
activator ions in Table 2.4, 2.5, and 2.6 respectively. With
only a 10% decrease in their room temperature emission at 100°C, most of these phosphors show
acceptable thermal quenching. The most promising blue emitting phosphors are Eu2+
activated
phosphate, halo-phosphate and silicate based compounds as shown in Table 2.4. Borates are
good for low temperature synthesis but suffer from poor thermal stability. The nitrides have
excellent chemical and thermal stability but lower quantum efficiency in the nUV excitation
regime for blue emitting phosphors. The aluminates also suffer from poor quantum efficiency in
this regime. Table 2.5 shows the available data on green-emitting phosphors (λem ≈ 490 to 570
nm) based on the 4f→5d transitions of Eu2+
and Ce3+
activator ions for use in nUV LED light
51
sources. The most promising phosphors are Eu2+
activated halo-silicates and silicates, and Ce3+
activated oxynitrides and halo-aluminates.
There has been extensive research to develop orange-red emitting phosphors for use in
nUV LEDs. However, there are relatively few orange- and especially red-emitting phosphors
based on the 4f-5d transitions of Eu2+
or Ce3+
. Dorenbos [47] tabulated Eu2+
phosphors with
proposed anomalous transitions, many which emit in the 585-650 nm range. However, the most
promising materials are several red-emitting nitride phosphors. Eu2+
→Mn2+
energy transfer offers
another approach for producing orange-red emitting phosphors. Although the direct absorption of
Mn2+
is weak due to its forbidden d-d nature, this can be overcome by adding Eu2+
as a sensitizer.
For efficient transfer between Eu2+
and Mn2+
, spectral overlap between the emission band of Eu2+
and the excitation band of Mn2+
must be significant. Since efficient Mn2+
absorption generally
occurs in the blue spectral region, there has been extensive research on co-doping blue-emitting
Eu2+
phosphors with Mn2+
. Table 2.6 summarizes the luminescence properties of orange and red
phosphors that make use of Eu2+
→Mn2+
energy transfer.

52
Table 2.4. Luminescence properties of candidate blue emitting phosphors for near UV-LEDs application.
Group Family Activator Composition Excitation
peak (nm)
Excitation at 380-400
nm (%)*
Emission
peak (nm)
QE at
400 nm Ref.
Phosphate
ABPO4 Eu2+
LiCaPO4 400 100 475 88 53. 54
LiSrPO4 350 75 450 35 54. 55
LiBaPO4 350 80 480 63 54. 56
NaBaPO4 280 75 442 27 54. 57
KCaPO4 292 80 473 25 54. 58
KSrPO4 325 80 425 55 54. 59
KBaPO4 320 80 435 57 54. 60
AB2(PO4)2 Eu2+ SrMg2(PO4)2 375 90 420 - 61. 62
SrZn2(PO4)2 365 85 416 - 63
A3B3(PO4)4 Eu2+ Ca3Mg3(PO4)4 300 70 450 - 64
A2P2O7 Eu2+ Ca2P2O7 330 70 416 - 65
Sr2P2O7 300 75 420 - 66
A9B(PO4)7 Eu2+ (Ca,Mg,Sr)9Y(PO4)7 280-360 65-85 435-490 - 67
Halo-
phosphate
and
silicate
A2PO4Cl Eu2+ Ca2PO4Cl 360 85 454 61 68, 69
A5(PO4)3Cl Eu2+
Sr5(PO4)3Cl 345 90 445 90 at 370
nm 70
Ca4.47Mg0.7(PO4)3Cl9 - - 453 80 71
Ca5(PO4)3Cl 375 90 459 >80 at
254 nm 72
A3AlO4F Ce3+(<0.5%) (Sr,Ba)3AlO4F 400 100 472 82 73
A5SiO4Cl6 Eu2+ Ba5SiO4Cl6 380 100 440 - 74
Silicate
A3MgSi2O8 Eu2+
Ba3MgSi2O8 330 70 440 70 75
Sr3MgSi2O8 330 55 465 48 75
Ca3MgSi2O8 375 95 475 42 75
A2MgSi2O7 Eu2+ Sr2MgSi2O7 365 65 476 - 76
AMgSi2O6 Eu2+ CaMgSi2O6 365 75 450 - 77
A2BSiO4 Eu2+ Li2CaSiO4 380 100 480 - 78
Li2BaSiO4 350 60 490 - 79
AB2Si3O10 Ce3+ BaY2Si3O10 334 30 404 55 at 334
nm 80
Nitride and oxynitride
Eu2+ BaSi3Al3O4N5 300 85 470 56 81
Ce3+ LaSi3N5 355 60 465 34 at 380
nm 82
Ce3+ LaAl(Si5Al)(N9O) 350 60 470 35 83
* Approximate estimate of the percentage of excitation intensity at 380-400 nm compared to their
excitation peaks.
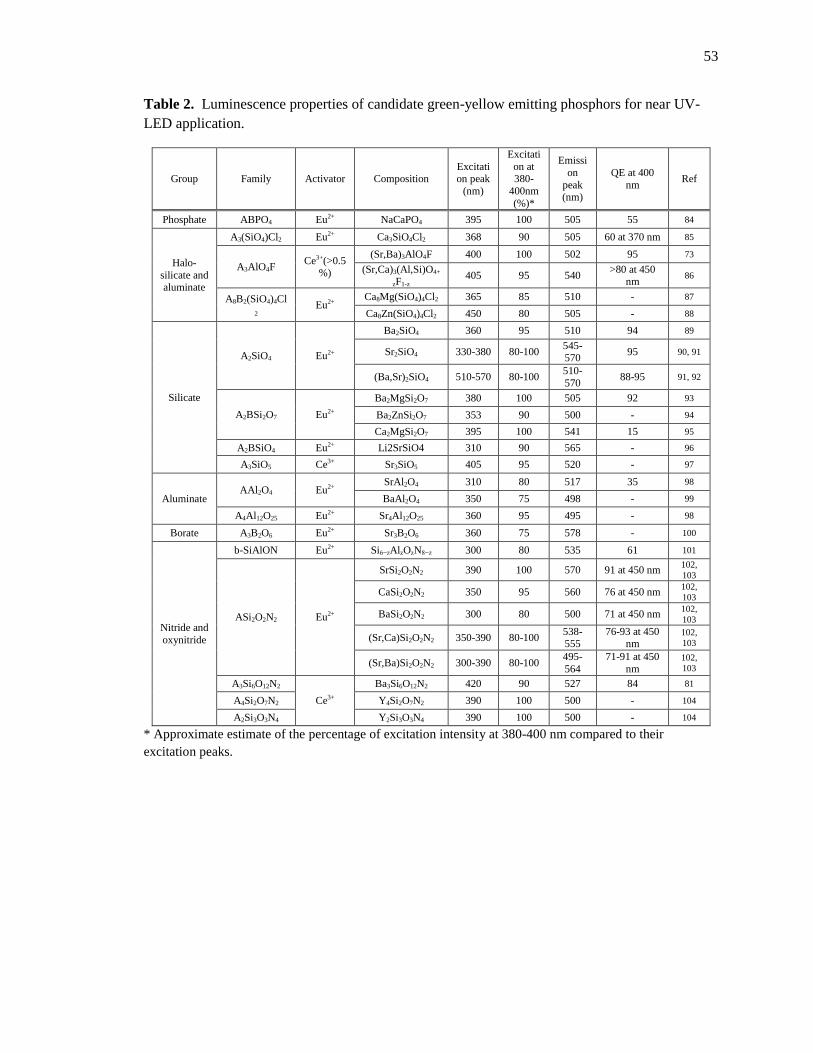
53
Table 2. Luminescence properties of candidate green-yellow emitting phosphors for near UV-
LED application.
Group Family Activator Composition Excitation peak
(nm)
Excitati
on at 380-
400nm
(%)*
Emissi
on
peak (nm)
QE at 400
nm Ref
Phosphate ABPO4 Eu2+ NaCaPO4 395 100 505 55 84
Halo-
silicate and aluminate
A3(SiO4)Cl2 Eu2+ Ca3SiO4Cl2 368 90 505 60 at 370 nm 85
A3AlO4F Ce3+(>0.5
%)
(Sr,Ba)3AlO4F 400 100 502 95 73
(Sr,Ca)3(Al,Si)O4+
zF1-z 405 95 540
>80 at 450 nm
86
A8B2(SiO4)4Cl
2 Eu2+
Ca8Mg(SiO4)4Cl2 365 85 510 - 87
Ca8Zn(SiO4)4Cl2 450 80 505 - 88
Silicate
A2SiO4 Eu2+
Ba2SiO4 360 95 510 94 89
Sr2SiO4 330-380 80-100 545-570
95 90, 91
(Ba,Sr)2SiO4 510-570 80-100 510-
570 88-95 91, 92
A2BSi2O7 Eu2+
Ba2MgSi2O7 380 100 505 92 93
Ba2ZnSi2O7 353 90 500 - 94
Ca2MgSi2O7 395 100 541 15 95
A2BSiO4 Eu2+ Li2SrSiO4 310 90 565 - 96
A3SiO5 Ce3+ Sr3SiO5 405 95 520 - 97
Aluminate AAl2O4 Eu2+
SrAl2O4 310 80 517 35 98
BaAl2O4 350 75 498 - 99
A4Al12O25 Eu2+ Sr4Al12O25 360 95 495 - 98
Borate A3B2O6 Eu2+ Sr3B2O6 360 75 578 - 100
Nitride and
oxynitride
b-SiAlON Eu2+ Si6−zAlzOzN8−z 300 80 535 61 101
ASi2O2N2 Eu2+
SrSi2O2N2 390 100 570 91 at 450 nm 102,
103
CaSi2O2N2 350 95 560 76 at 450 nm 102,
103
BaSi2O2N2 300 80 500 71 at 450 nm 102,
103
(Sr,Ca)Si2O2N2 350-390 80-100 538-555
76-93 at 450 nm
102,
103
(Sr,Ba)Si2O2N2 300-390 80-100 495-
564
71-91 at 450
nm 102,
103
A3Si6O12N2
Ce3+
Ba3Si6O12N2 420 90 527 84 81
A4Si2O7N2 Y4Si2O7N2 390 100 500 - 104
A2Si3O3N4 Y2Si3O3N4 390 100 500 - 104
* Approximate estimate of the percentage of excitation intensity at 380-400 nm compared to their
excitation peaks.

54
Table 2.6. Luminescence properties of candidate orange-red emitting phosphors based on Eu-Mn
energy transfer for near UV-LED application.
Group Family Activator Composition Excitation
peak (nm)
Excitation
at 380-400 nm (%)
Emission
peak (nm)
QE at
400 nm Ref
Phosphate
AB2(PO4)2 Eu2+-Mn2+
SrMg2(PO4)2 375 90 675 - 61
SrZn2(PO4)2 365 85 613 - 63
A3B3(PO4)4 Eu2+-Mn2+
Ca3Mg3(PO4)4 300 70 625 - 64
A2P2O7 Eu2+-Mn2+
Ca2P2O7 330 70 600 - 65
Sr2P2O7 300 75 585 - 66
A9B(PO4)7 Eu2+-
Mn2+
(Ca,Mg,Sr)9Y(PO4)7 280-360 65-85 632 - 67
Ca9La(PO4)7 340 80 635 - 105
Ca9Lu(PO4)7 290 50 645 - 106
Halo-
phosphate A5(PO4)3Cl
Eu2+-
Mn2+ Ca5(PO4)3Cl 375 90 585 - 72
Silicate
A3MgSi2O8 Eu2+-Mn2+
Ba3MgSi2O8 330 70 620 54 75
Sr3MgSi2O8 330 55 685 - 75
AMgSi2O6 Eu2+-Mn2+
CaMgSi2O6 365 75 580, 680 - 77
* Approximate estimate of the percentage of excitation intensity at 380-400 nm compared to their
excitation peaks.
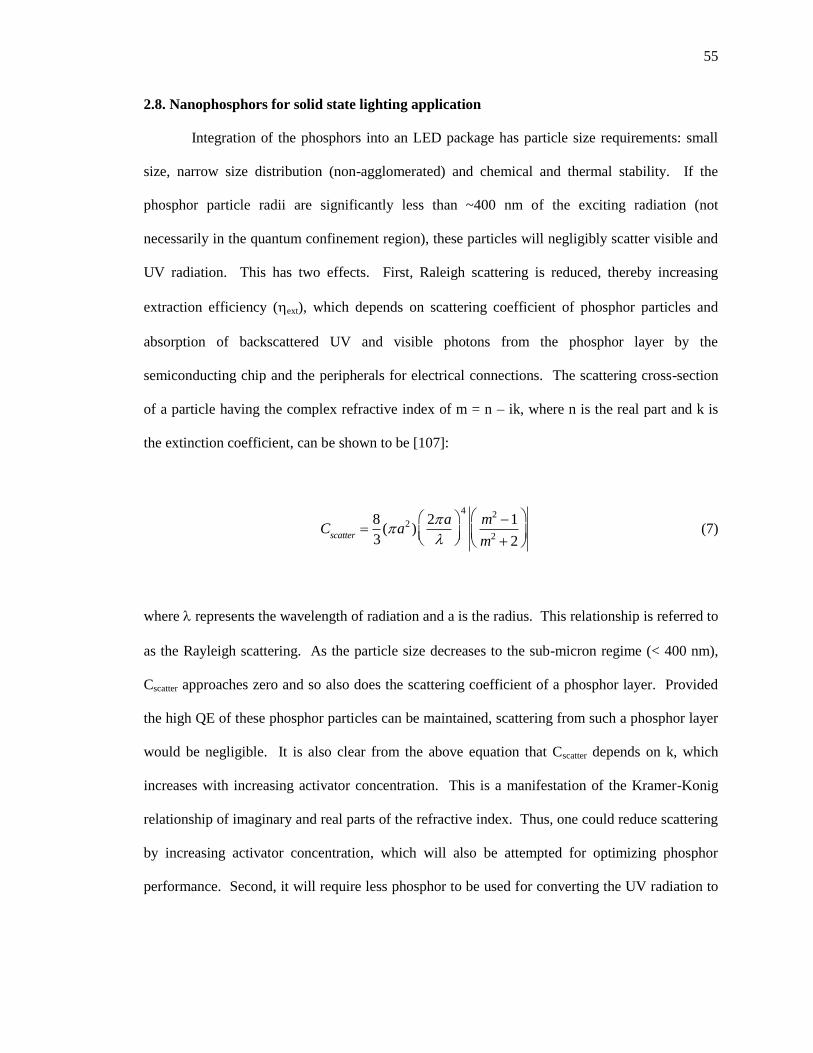
55
2.8. Nanophosphors for solid state lighting application
Integration of the phosphors into an LED package has particle size requirements: small
size, narrow size distribution (non-agglomerated) and chemical and thermal stability. If the
phosphor particle radii are significantly less than ~400 nm of the exciting radiation (not
necessarily in the quantum confinement region), these particles will negligibly scatter visible and
UV radiation. This has two effects. First, Raleigh scattering is reduced, thereby increasing
extraction efficiency (ext), which depends on scattering coefficient of phosphor particles and
absorption of backscattered UV and visible photons from the phosphor layer by the
semiconducting chip and the peripherals for electrical connections. The scattering cross-section
of a particle having the complex refractive index of m = n – ik, where n is the real part and k is
the extinction coefficient, can be shown to be [107]:
Cscatter
8
3(a2 )
2a
4m2 1
m2 2
(7)
where represents the wavelength of radiation and a is the radius. This relationship is referred to
as the Rayleigh scattering. As the particle size decreases to the sub-micron regime (< 400 nm),
Cscatter approaches zero and so also does the scattering coefficient of a phosphor layer. Provided
the high QE of these phosphor particles can be maintained, scattering from such a phosphor layer
would be negligible. It is also clear from the above equation that Cscatter depends on k, which
increases with increasing activator concentration. This is a manifestation of the Kramer-Konig
relationship of imaginary and real parts of the refractive index. Thus, one could reduce scattering
by increasing activator concentration, which will also be attempted for optimizing phosphor
performance. Second, it will require less phosphor to be used for converting the UV radiation to
56
visible since the effective path length of the UV photons in the phosphor layer will be reduced,
thereby preserving our natural resources (rare earth elements).
However, phosphors in the nano-size regime have poor QE compared to phosphors in the
micron-sized range [53, 108]. The reasons behind this have not investigated in a systematic say.
A high concentration of surface atoms and defects at the surfaces is regarded as one of the
fundamental properties of nanophosphors. They create surface charge-carrier trapping centers,
which are analogous to bulk centers, but have a different energy depth. The translational
symmetry breakdown and limitation of the free path of electrons by the nanoparticle size alter the
selection rules, bring about new optical transitions, increase the oscillator power, and change the
luminescence decay time [109]. If the nanoparticle size becomes comparable with the de Broglie
wavelength or the Bohr exciton size, quantum confinement effects come into play, changing the
forbidden gap width and leading to appearance of new energy levels. The interior could also
have a non-uniform distribution of activators across the particle, distorted lattice planes and
activators that are not located in the correct environment.
Given the complex formulations of phosphors, the activator ion can be located in
different crystallographic environments (point symmetries) and different crystalline lattices can
be formed, depending on the synthesis conditions and chemical formula. For example, in
nanophosphors of solid solutions of Ba2SiO4:Eu2+
and Sr2SiO4:Eu2+
, two different Eu2+
emissions
were observed from the two different Ba or Sr site symmetries [53, 89, 90, 92]. In Sr2SiO4:Eu2+
,
two crystallographic phases can co-exist, with different emissive properties. Using first-
principles band structure calculations we suggested the longer wavelength emission from site
Ba(1) of Sr(1) (coordination number = 10) was attributed to the typical 4d-5f transition of Eu2+
and the shorter wavelength emission is from site Ba(2) or Sr(2) (coordination number = 9), which
was from anomalous transition of Eu2+
[110]. Thus, the synthesis and post-synthesis processing
methods must be chosen carefully to prepare powders with the desired characteristics.

57
Chapter 3. Experimental procedure
3.1 Synthetic methods
There are many different methods to synthesize inorganic phosphors. The most popular
method is solid state synthesis, but the sol-gel/Pechini, co-precipitation, hydrothermal, spray
pyrolysis and combustion synthesis methods are often used. Less popular but still used methods
include oxidation of metal particles, laser-driven reactions, high energy mechanical milling, self
assembly and the deposition of combinational libraries, which are not covered in this paper. Most
phosphor compositions have greater than four elements, which make fabrication of uniform,
single phase powders difficult. The selection of a synthesis method depends on the requirements
of the end use. Table 3.1 provides a list of popular synthetic methods. If low cost and large
volume production is desired, solid state reactions are favored. However, due to the use of
multiple precursors, several sintering and grinding steps may be required for a full reaction. If
small, dispersed, uniformly shaped with a narrow particle size distribution is the goal, then liquid
or gaseous methods should be employed. The drawbacks to these methods are high cost,
complicated chemical procedures, and small production volume. If evaluation of a large number
of compositions is the goal, then combinatorial synthesis or combustion reactions are preferred
[111, 112]. Figure. 3.1 (a)-(d) shows the procedures of solution-based methods: sol-gel, co-
precipitation, hydrothermal, and combustion methods, respectively. Outlined below are
descriptions of the common synthesis methods.
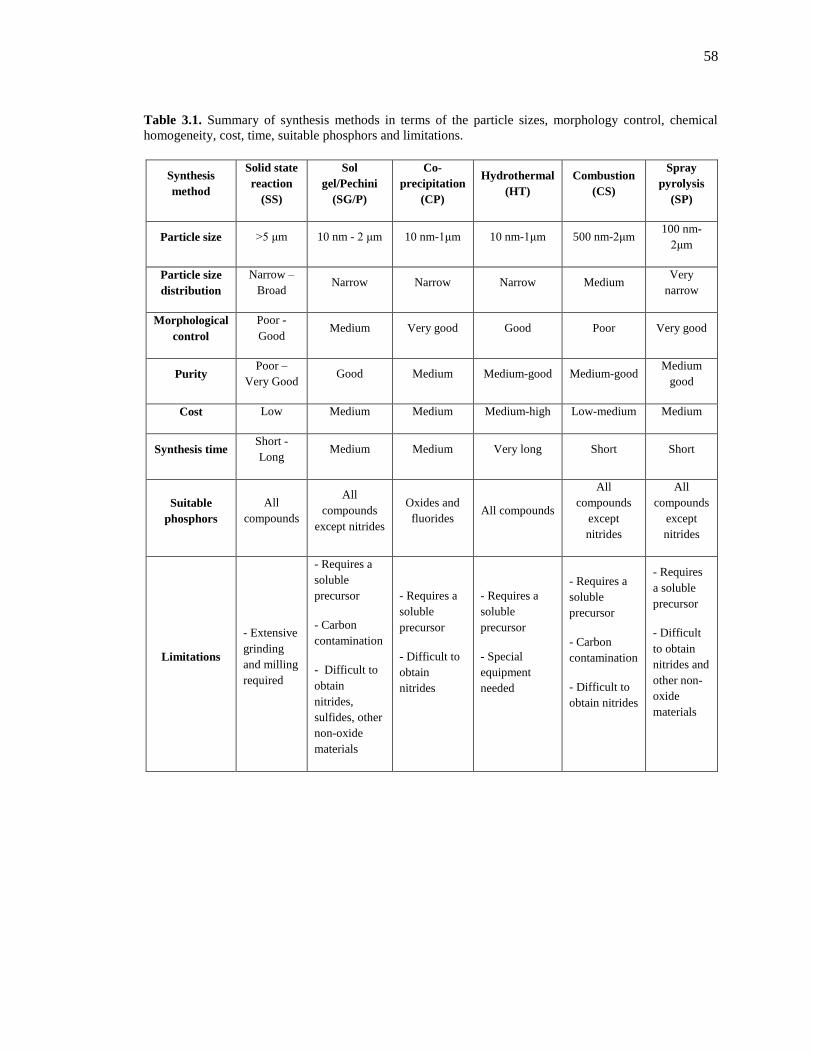
58
Table 3.1. Summary of synthesis methods in terms of the particle sizes, morphology control, chemical
homogeneity, cost, time, suitable phosphors and limitations.
Synthesis
method
Solid state
reaction
(SS)
Sol
gel/Pechini
(SG/P)
Co-
precipitation
(CP)
Hydrothermal
(HT)
Combustion
(CS)
Spray
pyrolysis
(SP)
Particle size >5 μm 10 nm - 2 μm 10 nm-1μm 10 nm-1μm 500 nm-2μm 100 nm-
2μm
Particle size
distribution
Narrow –
Broad Narrow Narrow Narrow Medium
Very
narrow
Morphological
control
Poor -
Good Medium Very good Good Poor Very good
Purity Poor –
Very Good Good Medium Medium-good Medium-good
Medium
good
Cost Low Medium Medium Medium-high Low-medium Medium
Synthesis time Short -
Long Medium Medium Very long Short Short
Suitable
phosphors
All
compounds
All
compounds
except nitrides
Oxides and
fluorides All compounds
All
compounds
except
nitrides
All
compounds
except
nitrides
Limitations
- Extensive
grinding
and milling
required
- Requires a
soluble
precursor
- Carbon
contamination
- Difficult to
obtain
nitrides,
sulfides, other
non-oxide
materials
- Requires a
soluble
precursor
- Difficult to
obtain
nitrides
- Requires a
soluble
precursor
- Special
equipment
needed
- Requires a
soluble
precursor
- Carbon
contamination
- Difficult to
obtain nitrides
- Requires
a soluble
precursor
- Difficult
to obtain
nitrides and
other non-
oxide
materials

59
Figure 3.1. Schematic diagram of solution based synthesis (a) sol-gel, (b) co-precipitation, (c)
hydrothermal, and (d) combustion synthesis. PPT agent = precipitating agent.
60
3.1.1. Solid state reaction (SS)
The solid state synthesis method is the most extensively used technique to prepare
phosphors [104, 112]. Oxides, (oxy)fluorides, (oxy)chlorides and (oxy)nitrides are prepared by
this method, which is straightforward and suitable for mass production. The precursors are
usually single cation ceramic powders, which are mixed together and heated to high temperatures
to promote interdiffusion and the eventual development of a single phase. This method is known
to introduce impurity phases (such as unreacted intermediates between the end members in the
phase diagram), which can reduce the luminous efficacy. To eliminate these intermediate phases,
repeated grinding, milling and high temperature treatments are required [113]. Due to the high
temperatures used during production, nonstoichiometric amounts of precursor materials maybe
required to compensate for losses arising from differences in volatility. This is especially true for
the manufacture of (oxy)fluorides, (oxy)chlorides, compounds containing barium or lithium and
certain nitride phosphors. Furthermore, the average particle size of the phosphors prepared by
this method is often larger than 5 µm, making light scattering an issue for integration with a near
UV (nUV) chip.
3.1.2. Sol-gel/Pechini method (SG)
There has been an intense level of research activity on the development of luminescent
materials by the sol–gel method [114, 115]. Figure. 3.1(a) presents the basic production cycle for
sol-gel synthesis. Metal oxides, in the appropriate molar ratios, are dissolved in a nitric acid
solution (which is less costly than buying metal nitrate powders). Citric acid, a chelating agent is
then added along with ethylene glycol and polyethylene glycol (cross-linking agents). The
solution is stirred at temperatures, usually below 100˚C, which produces a transparent gel. The
gel is calcined at low temperature (~350˚C) to remove organics and residual water, resulting in a
nanocrystalline powder. The particle size and morphology can be controlled by adjusting the

61
solvent and heating conditions, or by changing the precursors. A variety of stoichiometric, single
phase materials can be simply prepared by this method, without the need for extensive grinding
and milling. However, the phosphors can become contaminated with carbon due to the use of
organic reagents and thus a pre-annealing step in air may be needed. Also, a reducing atmosphere
may be required to obtain Eu2+
and Ce3+
activated phosphors.
3.1.3. Co-precipitation method (CP)
This method is widely used to prepare oxide- and (oxy)fluoride-based phosphors [116,
117]. Figure. 3.1(b) shows the synthetic steps of this method. Precursors (e.g. metal nitrates,
acetates or chlorides) are first dissolved in a solvent (e.g. water, N-N-dimethylformamide (DMF)
or cyclohexane). Precipitating agents are then added and the cations form hydroxide, carbonate
or fluoride compounds. Since the precursors should dissolve and the precipitate should not
dissolve in the solvent, the solubility of both the precipitates and precursors in the solvent should
be confirmed before starting the procedure. The precipitates are separated by filtering or
centrifuging and then heat-treated to decompose the resulting hydroxide or carbonate. The
powder is then annealed at high temperature to crystallize the powders. Because the use of
expensive, high-purity rare-earth fluorides as starting materials are not required (as for SS
reaction), this is the preferred method for producing complex fluorides. Smaller particle sizes,
and a homogeneous distribution of the activator ions can be achieved using this technique [116].
In addition, the particles prepared by this method have a uniform, narrow size distribution, as
opposed to powders prepared by solid-state reaction synthesis. The particle size and morphology
are dependent on the pH, precursor and solvent choice, precipitating agent, stirring rate and the
order of addition of the compounds. The main drawbacks of this method are the difficulty in
preparing chloride-based phosphors, due to the dissolution of precipitates (metal chlorides) in the
solvent, and the additional high temperature annealing step required for the production of oxides.

62
3.1.4. Hydrothermal method (HT)
The hydrothermal method is a process that uses high temperature and pressure to
precipitate materials directly from solution. A schematic representation of this method is shown
in Figure. 3.1(c). This method makes use of the increased solubility of almost all inorganic
substances in water at elevated temperatures and pressures and subsequent crystallization of the
dissolved material from the solution [118]. By controlling the selection of the molecular precursor
and other reaction parameters (time and temperature), high purity and homogeneously dispersed
nanoparticles with a very narrow size distribution can be obtained. The main advantage of the
technique is that despite the low synthetic temperatures, crystalline powders are obtained without
the need for further heat-treatment. By changing the pH, precursor selection, and the reaction
temperature, the size, phase, and morphology of the powders can be modified [118]. However,
this method is generally applicable only for producing molybdates, borates and
chloro(fluoro)phosphates, which can be obtained at a relatively low synthetic temperature
(<800°C) [119]. In addition, special sealed vessels, which can be operated at very high
temperature and pressure (usually around 500°C and 340 atm) are required [120]. Furthermore,
due to the small volume of the reaction vessels, mass production of phosphors is difficult.
3.1.5. Combustion method (CS)
Combustion synthesis is a popular method to rapidly produce multiconstituent oxides
[121-123]. The products are generally chemically homogeneous, have fewer impurities, and have
higher surface areas compared to solid state synthesized powders. The method involves igniting
an aqueous solution of dissolved metal nitrates and a fuel (e.g. urea, carbohydrazide, glycine) at a
low temperature (< 500˚C) and allowing the highly exothermic, oxidative reaction to occur,
usually with an accompanying flame as shown in Figure. 3.1(d). This produces reaction
temperatures of more than 1200˚C and the reaction time is usually less than 10 min [121]. Due to

63
the short duration at high temperatures, nanocrystalline powders are produced. However they are
agglomerated into hard, sub-micron sized powders that are not easily separated. In order to
improve purity, homogeneity and crystallinity of complex oxide powders, Garcia et al. [124]
developed a new method using hydrazine as a fuel in a high-pressure reaction vessel. This method
is superior because of: 1) increased personal safety due to the protection by the vessel; 2) total
recuperation of the product; 3) more precise control of reaction parameters as it is possible to
measure the temperature, pressure, and gas flow rates; and 4) a controlled atmosphere (reactive or
inert). By this method, a variety of luminescent materials such as silicates, phosphates, borates,
oxyflurorides, oxychlorides, and aluminates have been simply and expeditiously prepared.
3.1.6. Spray pyrolysis method (SP)
Spray pyrolysis is a technique used to synthesize a wide variety of high-purity,
homogeneous ceramic powders with very uniform size and spherical morphology. The basic
procedure is as follows as shown in Figure. 3.2(a). An aqueous solution with metal nitrate
precursors is atomized into a series of tube furnaces. The aerosol droplets undergo evaporation
and solute condensation within the droplet. They are dried then thermolysis of the precipitate
particle occurs at higher temperatures to form microporous particles. Finally, each microporous
particle is sintered to form a dense particle. The particle size and morphology of the particles can
be controlled by precursor selection, concentration, droplet size, and the residence time in the
furnace [125]. However, this method possesses problems as hollow and porous particles often
result, which will decrease the luminous intensity. To overcome this problem, a high temperature
diffusion flame can be used. This new process is named flame spray pyrolysis. [126, 127]. Figure.
3.2(b) shows a schematic drawing of the flame spray pyrolysis technique. Compared to
conventional spray pyrolysis, flame spray pyrolysis has: 1) a higher operating temperature, 2)
faster heating and cooling rates, and 3) easier introduction of the precursor into the hot reaction

64
zone (flame). Higher operating temperatures can potentially solve the problem of the production
of microporous or hollow particles. By operating at a temperature higher than the melting point
of the material, solid particles can be produced and particle homogeneity is improved. However,
it is not always straightforward to produce multicomponent materials with a homogeneous
chemical composition because the vapor pressure (related to reactant concentration), the thermal
decomposition (chemical reaction) rate, the nucleation, and the particle-growing rate are different
in the flame.

65
Figure 3.2. Schematic diagram of (a) conventional and (b) flame spray-pyrolysis. Taken from [126].
66
3.2. Characterization of luminescent materials
The crystallinity and phase identification of phosphors are analyzed by using powder X-
ray diffraction (XRD). The morphology and particle size of nanophosphors were examined using
field emission-scanning electron microscopy (FE-SEM) and transmission electron microscopy
(TEM). Photoluminescence (PL) measurements were taken using a Jobin-Yvon Triax 180
monochromator and Spectrum. One charge-coupled device detection system, using a 450 W Xe
lamp as the excitation source.
The quantum efficiency of the phosphors was measured next. The DeMello method [128]
was used to determine the individual quantum efficiencies as shown in Figure 3.3. A 400 nm laser
diode is used as the excitation source, and is aimed through a 10 mm hole drilled in the side of a
12‖ sphere. The sample powders were dispersed in silicone in an approximately 3 weight percent,
usually about 0.015 grams of powder to 0.5 grams of silicone. A small, 5 mm by 10 mm,
rectangle was cut from the large piece and suspended in the center of the sphere. Three
measurements are taken: one without the sample in the sphere, one with the sample in the sphere
but with indirect excitation from the laser, and finally with the sample directly excited by the
laser. The emission profiles from the powders are recorded, and the curves are corrected for the
response of the system in photons. The curves generated by the phosphors are separated into the
excitation region, encompassing the laser emission, and the emission region, containing the
emission from the phosphor. These curves are then integrated and the quantum efficiency
calculated using the method described in [128].
A Janis cryostat (VPF-100) was fit into the sample chamber of the Fluorolog-3 system,
and a pulsed Nano-LED was used as the excitation source (Figure 3.4). The LED was centered at
365 nm, the excitation monochromator was set to 380 nm, and the slits were opened to a 10 nm
band pass. The time range was set at 3.2 μs and the pulse rate was set at 250k Hz. The emission
monochromator was set at 450 nm to correspond to the peak emission, and the slits were opened

67
to 8nm band pass. The scan was set to stop once the peak counts reached 5000. The sample was
cooled down to 80K with liquid nitrogen, and the first scan was started. Once the peak height was
reached, the sample temperature was raised to 100K and the second scan was started. After 100K
the sample was then raised in 25 K increments to a final temperature of 500K.
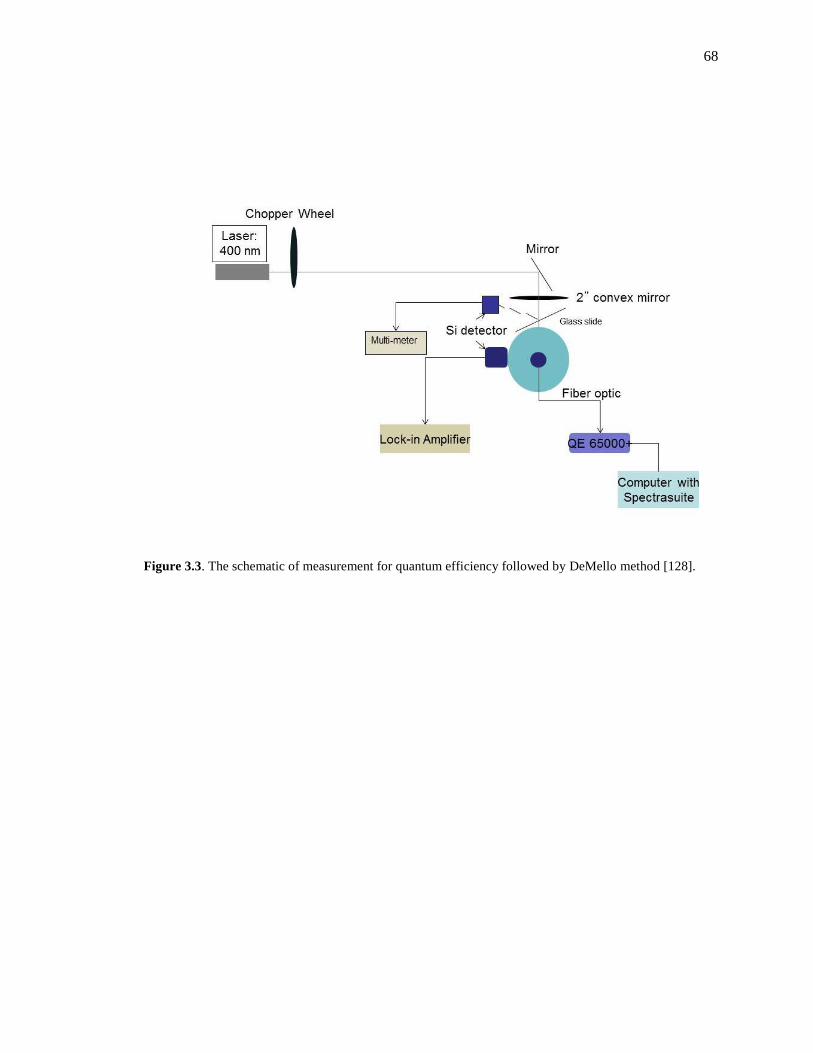
68
Figure 3.3. The schematic of measurement for quantum efficiency followed by DeMello method [128].

69
Figure 3.4. Exication and emission monochromator and sample chamber for temperature dependent
lifetime measurement.

70
Chapter 4. Sol-gel synthesis of single phase, high quantum efficiency LiCaPO4:Eu2+
phosphors (blue emitting phosphors)
4.1. Abstract
This paper reports the synthesis and luminescence properties of blue emitting Li(Ca1-
xEux)PO4 (x = 0.005, 0.01, 0.03) phosphors. These phosphors were prepared by a modified sol-
gel/Pechini method. The particle size ranged from 1 to 1.5 m with a narrow size distribution. X-
ray diffraction analysis shows that the phases present are dependent on the post-synthesis
annealing temperature and x. A single phase of this phosphor is obtained at x 0.01 and an
annealing temperature of 800°C. These phosphors are excited efficiently in the range 280-410
nm and the photoluminescence emission spectra consist of a strong broad blue band centered at
~470 nm. Furthermore, the quantum efficiencies range from 58% to 73% depending on the
annealing conditions.
4.2. Introduction
The common approach for producing white-emitting LEDs has been to use a blue-
emitting InGaN LED with the yellow-emitting phosphor Y3Al5O12:Ce3+
(YAG:Ce) and a red
emitting phosphor for color correction [129]. Recently, white LEDs in which a near UV-LED is
combined with blue, green, and red phosphors have been investigated due to less current droop
and improved binning of the UV-LEDs, and a better control over color rendering index and
color temperature through manipulation of phosphor blends. [60, 130, 131]. These phosphors
require strong absorption in the near-UV range, which can be obtained from dipole-allowed 4f-
5d transition in rare earth activated ions such as Ce3+
and Eu2+
in a suitable host [10, 50]. The
most promising phosphors examined for this approach have been (Sr,Ba)2SiO4:Eu2+
[60, 91, 114]
β-SiAlON:Eu2+
[101], Ba2MgSi2O7:Eu2+
[93] for the green–emitting component,
71
Sr3SiO5:Eu2+
[132], CaAlSiN3:Ce3+
[133] for the yellow/orange-emitting component and
(Sr,Ca)2Si5N8:Eu2+
[134] for the red-emitting component.
In my previous report, LiCaPO4:Eu2+
phosphors were found to have superior
luminescence properties for UV-LED application among ABPO4:Eu2+
(A=Li, Na, K, B = Ca, Sr,
Ba) families because of their high quantum efficiency and acceptable thermal stability [54].
Investigations of these phosphors date back to the 1960‘s, first reported by Wanmaker et
al [135]. They were activated by Cu and had strong excitation bands in the deep UV range.
Wanmaker et al reported X-ray diffraction powder patterns of LiCaPO4, currently indexed as
JCPDS 14-0203. However, Lightfoot et al. [136] argued that the Wanmaker's powder pattern is
not correct because of the presence of a second phase of Ca3(PO4)2 due to the loss of Li under the
high temperature reaction. Lightfoot reported a single phase LiCaPO4 produced by solid-state
reaction, and the corresponding diffraction pattern is indexed as JCPDS 79-1396. The LiCaPO4
has a hexagonal structure with space group P31c and lattice parameters: a = 0.752 nm and c =
0.996 nm. The Ca2+
ions have six short contacts (0.231-0.254 nm) to oxygen and two longer
contacts (0.276 and 0.290 nm), completing an irregular eight coordinated geometry [136].
However, most reports on LiCaPO4:Eu2+
show mixtures of LiCaPO4 with appreciable
amounts of secondary phases, such as Li3PO4 and Ca3(PO4)2 [137]. Recently, More et al. [138]
reported the pure LiCaPO4:Eu2+
prepared by solid state reaction with CaH(PO4) as a precursor,
prepared by the same method used by Lightfoot et al. [136]. To our knowledge, it is the only
reported method that yields a single phase LiCaPO4:Eu2+
. However, the synthesis is not
straightforward and the process takes a long time (over 3 days) with repeated grinding or
extensive ball milling. In this work, we report on the synthesis of Li(Ca1-xEux)PO4 (x = 0.005,
0.01, 0.03) phosphors with no secondary phases using a sol-gel/Pechini method and its
luminescence properties. The effect of annealing temperature on the particle size and
morphology is also examined.

72
4.3. Experimental
First, LiNO3 (99%, Alfa Aesar), Ca(NO3)2·4H2O (99.99%, Mallinckrodt Chemicals) and
Eu2O3 (99.999%, Alfa Aesar) in the desired molar ratios were dissolved in a dilute nitric acid
solution. Next, (NH4)2HPO4 (EMD chemicals) as the reagent for PO43-
was added to the mixture.
Before adding (NH4)2HPO4, the mixtures of pH should be < 2 to prevent the precipitation with
LiNO3 Ca(NO3)2·4H2O. After the solution became transparent, 1.1 g of citric acid (CA)
(C6H8O7·H2O, EMD chemicals), which acted as a chelating agent for the metal ions, and 1.12 ml
ethylene glycol (EG) (C2H6OH, Fischer Scientific), was added (molar ratio of metal: CA: EG =
1:0.5:2). Then, 1.0 g polyethylene glycol (PEG, (C2H4O)nH2O, molecular weight = 20,000, Sigma
Aldrich), used as a cross-linking agent, was added to the aqueous solution. The mixture was
stirred well to achieve uniformity and was then placed in a water-bath at 80°C so that the solution
would hydrolyze into a sol and then into a gel. The gel was heated to 800˚C for 1h in air to
remove the carbon and organic material. Next, the gel was annealed at 800-1150°C in a slightly
reducing atmosphere (a mixture of 5% H2 and 95% N2).
The particle morphology and size were measured using a field emission scanning electron
microscope (FESEM, XL30, Philips). The crystalline phases of the annealed powders were
identified by X-ray diffraction (XRD) and the peak and percentage of the phases were identified
by an XRD analysis program (JADE, Materials Data Inc.). Photoluminescence (PL)
measurements were taken using a Jobin-Yvon Triax 180 monochromator and SpectrumOne
charge-coupled device detection system, using a 450 W Xe lamp as the excitation source.
Quantum efficiency (QE) measurements were made using a 400 nm laser diode as the excitation
source. Powdered phosphor samples were dispersed in a silicone gel and cured. The samples
were then placed in a 30.5 cm sphere and three measurements, of which the average is reported,
were taken following the method outlined in [128].
73
4.4. Results and discussion
The structure of LiCaPO4 consists of a three dimensional framework of a vertex-sharing
LiO4 and PO4 tetrahedra, which encloses large five-sided channels parallel to the [001] direction
occupied by Ca2+
ions as shown in Figure 4.1. Figure 4.1 was drawn with the visualization
program VESTA [139]. The five-sided channels observed in the structures are unusual, and
contrast with the more commonly observed six-sided channels in other tetrahedral framework
structures, such as the SiO2 polymorphs, quartz, cristobalite and tridymite [54]. Figure 4.2 (a)
shows the XRD patterns of Li(Ca1-xEux)PO4 as a function of x. All samples showed the main peak
of LiCaPO4, at 2θ = 32.82°; the synthesized compound is a single hexagonal phase and matches
well with JCPDS 79-1396 for x = 0.005 and 0.01. However, higher concentrations of Eu2+
(x =
0.03) slightly distorts the hexagonal structure with Li3PO4 and Ca3(PO4)2 as the dominant phases
with an increase of the main peaks of 2θ = 33.89° for Li3PO4 and 2θ = 31.01° for Ca3(PO4)2. The
amounts of LiCaPO4, Ca3(PO4)2 and Li3PO4 are estimated to be approximately 80%, 15% and 5%,
respectively, as determined by the XRD program (JADE).

74
Figure 4.1. Unit cell representation of the crystal structure of LiCaPO4 along the [001] direction. Blue,
green, purple, and red spheres represent Li, Ca, P, and O ions, respectively. The polyhedral geometry of
LiO4 and PO4 are depicted by blue and purple polyhedral, respectively.

75
Figure 4.2 (b) shows the XRD patterns of Li(Ca0.99Eu0.01)PO4 at various annealing
temperatures. At 800°C, as mentioned previously, single phase of LiCaPO4 is obtained. However,
the peak intensities for Li3PO4 and Ca3(PO4)2 increase with increasing annealing temperature and
the amounts of LiCaPO4, Ca3(PO4)2 and Li3PO4 are estimated to be approximately ~75%, ~15%
and ~10% at 1000°C and ~60%, ~20% and ~20% at 1150°C. Thus, 800°C is the optimal
annealing temperature to obtain a single phase of LiCaPO4 for x ≤ 0.01 and agrees well with
Lightfoot‘s results [136]. Moreover, the sol-gel/Pechini approach is superior to solid-state
reaction to obtain a single phase of LiCaPO4 in terms of a reduced synthesis time and simplicity
due to the elimination of repeated grinding and ball-milling of the product. Lightfoot [136]
suggested the significant amount of impurity phase, Ca3(PO4)2, was mainly due to loss of Li at
higher annealing temperatures. However, we find another impurity phase, Li3PO4, also forms at
higher annealing temperatures, as shown in Figure 4.2 (b). A theoretical explanation of the
presence of these impurity phases at higher annealing temperature (>800°C) is currently under
investigation.
SEM micrographs of Li(Ca0.99Eu0.01)PO4 at various annealing temperatures are shown in
Figure 4.3 (a)-(c). The particles for samples annealed at 800°C are round with diameters 1~1.5
m and have a narrow size distribution as shown in Figure 4.3 (a). The diameter and the width of
size distribution increases with increasing annealing temperature and the morphology changes
from spherical to an irregular shape at 900 and 1150°C as shown in Figure 4.3 (b)-(c). The
irregular shape of the particles is most likely due to the presence of impurity phases such as
Ca3(PO4)2 and Li3PO4 caused by higher annealing temperature.
Figure 4.4 (a) shows the PL excitation spectra of Li(Ca0.99Eu0.01)PO4. The broad
excitation spectrum covers the wavelength range from UV to the visible region and the phosphors
excited efficiently in the region from 280 to 410 nm. Figure 4.4 (b) presents PL emission spectra
of Li(Ca1-xEux)PO4 for various values of x under 380 nm excitation. The PL spectra consist of a

76
strong broad blue band centered around 470 nm and is attributed to the allowed 4f65d→4f
7
transition of Eu2+
[10, 50]. The emission peak is slightly red-shifted from 470 to 473 nm at higher
Eu2+
concentrations. The emission intensity increases with increasing x and shows a maximum at
x = 0.01 and then decreases at x = 0.03. The decrease in the emission intensity at x = 0.03 is
mainly due to the presence of impurity phases in the powders as shown in Figure 4.2 (a). Figure
4.3(c) shows the PL emission spectra of Li(Ca0.99Eu0.01)PO4 at several annealing temperatures.
The emission intensity of the samples annealed at 1000°C is lower than those annealed at 800°C
because of material impurity phases, but the intensity of the 1150°C samples is higher than those
annealed at 800°C despite having impurity phases. This can be explained by the increased
crystallinity of LiCaPO4 as the annealing temperature increased. The quantum efficiencies of the
samples annealed at 800°C and 1150°C are 58% and 62%, respectively, under 400 nm excitation.
These numbers are lower than our previous samples prepared by solid-state reaction annealed at
1300°C (QE = 88%), most likely because of the larger particle size (>5 m) and increased
crystallinity of the higher annealing temperature.

77
Figure 4.2. XRD patterns of (a) Li(Ca1-xEux)PO4 (x = 0.005, 0.01, 0.03) phosphors and (b) Li(Ca1-xEux)PO4
(x = 0.01) at various post-synthesis annealing temperatures.

78
Figure 4.4 (a) shows the PL excitation spectra of Li(Ca0.99Eu0.01)PO4. The broad
excitation spectrum covers the wavelength range from UV to the visible region and the phosphors
excited efficiently in the region from 280 to 410 nm. Figure 4.4 (b) presents PL emission spectra
of Li(Ca1-xEux)PO4 for various values of x under 380 nm excitation. The PL spectra consist of a
strong broad blue band centered around 470 nm and is attributed to the allowed 4f65d→4f
7
transition of Eu2+
[10, 50]. The emission peak is slightly red-shifted from 470 to 473 nm at higher
Eu2+
concentrations. The emission intensity increases with increasing x and shows a maximum at
x = 0.01 and then decreases at x = 0.03. The decrease in the emission intensity at x = 0.03 is
mainly due to the presence of impurity phases in the powders as shown in Figure 1 (a). Figure 3(c)
shows the PL emission spectra of Li(Ca0.99Eu0.01)PO4 at several annealing temperatures. The
emission intensity of the samples annealed at 1000°C is lower than those annealed at 800°C
because of material impurity phases, but the intensity of the 1150°C samples is higher than those
annealed at 800°C despite having impurity phases. This can be explained by the increased
crystallinity of LiCaPO4 as the annealing temperature increased. The quantum efficiencies of the
samples annealed at 800°C and 1150°C are 58% and 62%, respectively, under 400 nm excitation.
These numbers are lower than our previous samples prepared by solid-state reaction annealed at
1300°C (QE = 88%), most likely because of the larger particle size (>5 m) and increased
crystallinity of the higher annealing temperature.

79
Figure 4.3. SEM micrographs of Li(Ca0.99Eu0.01)PO4 annealed at (a) 800°C, (b) 1000°C, and (c) 1150°C.

80
In order to increase the emission intensity and crystallinity of the powders, higher
annealing temperature is required, but the impurity phases form above 800°C as shown in Figure
2 (b). Thus, in attempt to obtain high crystallinity and single phase LiCaPO4, the powders
annealed at higher temperatures were then re-annealed at 800°C. Figure 4.5 shows the XRD
diffraction of Li(Ca0.99Eu0.01)PO4 annealed at 1150°C for 1h and the powders re-annealed at
800°C for 12h. The powders annealed at 1150°C are mixtures of LiCaPO4, Li3PO4, Ca3(PO4)2
with weight percentages of ~60%, ~20% and ~20%, respectively. However, the powders re-
annealed at 800°C are nearly single phase LiCaPO4 with only a small amount of Ca3(PO4)2 (<5%).
This suggests that the impurity phases react to form LiCaPO4 during the re-annealing process at
800°C.
The PL emission spectra of both samples excited at 380 nm is shown in Figure 4.6. The
emission intensity of the re-annealed powder is higher than that of powder annealed at 1150°C.
The quantum efficiency of re-annealed powder increased from 62% to 73%. It is obvious that
phase purity of Li(Ca1-xEux)PO4 plays a crucial role in improving its luminescence properties.
However, the high quantum efficiency values indicate that single phase Li(Ca1-xEux)PO4 is a
promising blue-emitters for applications in white-emitting UV-LEDs.
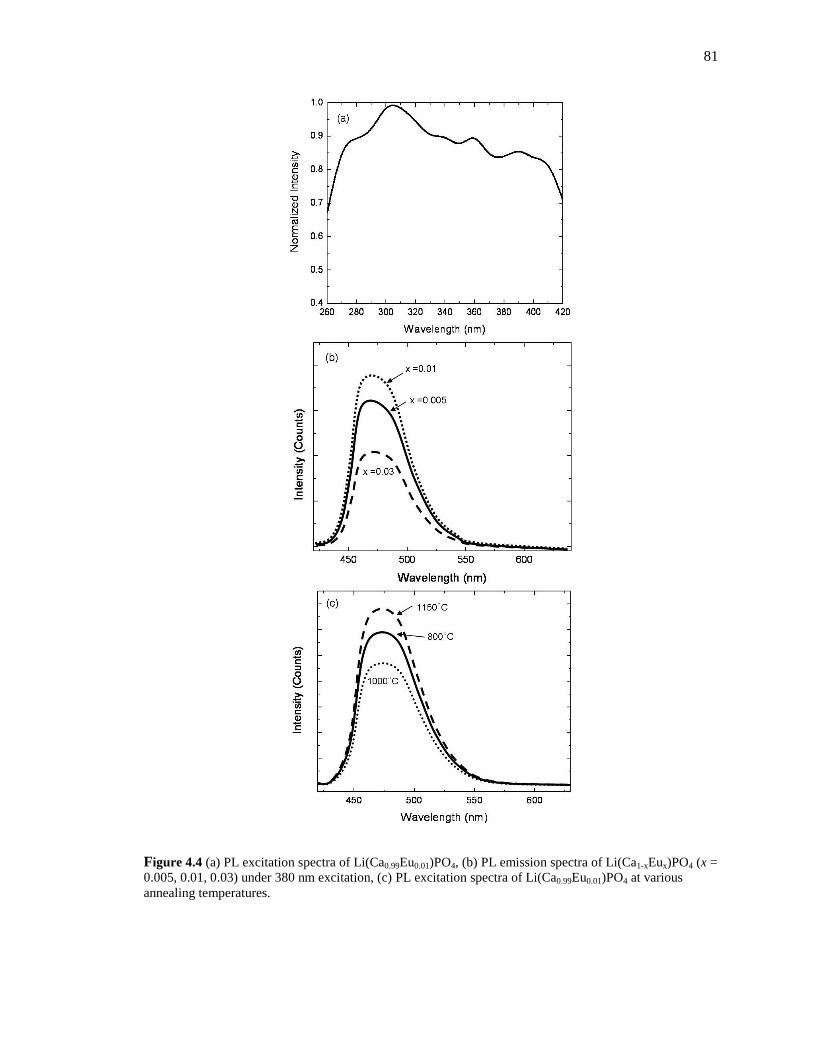
81
Figure 4.4 (a) PL excitation spectra of Li(Ca0.99Eu0.01)PO4, (b) PL emission spectra of Li(Ca1-xEux)PO4 (x =
0.005, 0.01, 0.03) under 380 nm excitation, (c) PL excitation spectra of Li(Ca0.99Eu0.01)PO4 at various
annealing temperatures.

82
Figure 4.5. XRD patterns of Li(Ca0.99Eu0.01)PO4 annealed at 1150°C and re-annealed at 800°C
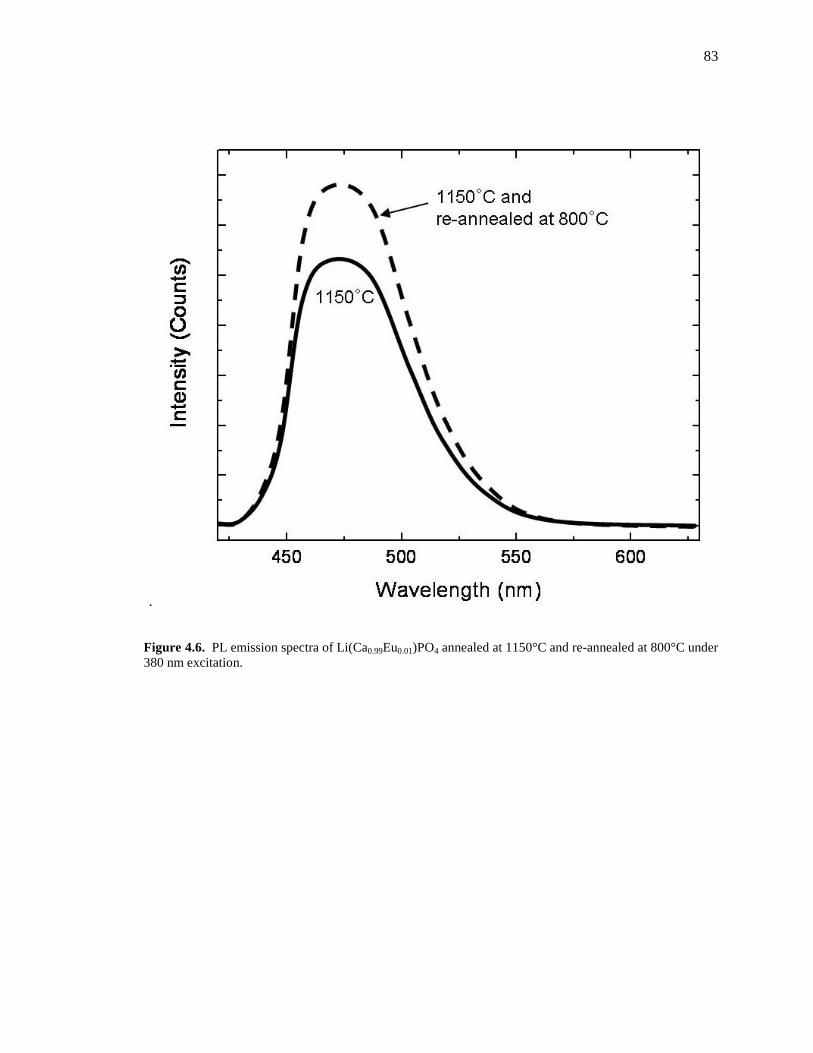
83
.
Figure 4.6. PL emission spectra of Li(Ca0.99Eu0.01)PO4 annealed at 1150°C and re-annealed at 800°C under
380 nm excitation.
84
4.5. Conclusions
Single phase blue-emitting phosphor powders, Li(Ca1-xEux)PO4, (x = 0.005, 0.01, 0.03)
were prepared by a sol-gel/Pechini method. This synthesis method is both simple and fast for the
production of a single phase powder compared to solid state reaction. The phase purity of Li(Ca1-
xEux)PO4 is dependent on x and annealing temperature. The phase pure powders with diameters
of 1-1.5 m and a narrow size distribution are obtained at x =0.005 and 0.01 annealed at 800°C.
Impurity phases are present at higher annealing temperatures (> 800°C) and the spherical
morphology transforms to irregular shapes. These phosphors are efficiently excited by both in the
deep UV and near UV region (370-410 nm), and show a strong blue emission band centered near
470 nm. By re-annealing the powders originally annealed at high temperatures (having significant
amounts of impurity phases) at 800°C, a single phase powder with higher emission intensity was
obtained. The quantum efficiency of the single phase Li(Ca1-xEux)PO4 phosphors increases from
58% to 73% by increasing higher annealing temperature and re-annealing at 800°C. Therefore,
Li(Ca1-xEux)PO4 blue phosphors is a potential candidate for application in white-emitting UV-
LEDs.
4.6. Acknowledgements
This work is supported by the U.S Department of Energy of Grant DE-EE0002003.
This chapter, in full, is a reprint of the material as it appears in the Electrochemical
Society Journal of Solid State Science and Technology, Jinkyu Han, Mark. E. Hannah, Alan
Piquette, Jan B. Talbot, Kailash C. Mishra, Joanna McKittrick, Vol. 1, pp. R37-R40 (2012). The
dissertation author was the primary author of this paper. All sample synthesis and characterization
were performed by the primary author, except the quantum efficiency measurements, which was
measured by Dr. Mark. E. Hannah at Osram Sylvania.

`
85
Chapter 5. Nano- and submicron sized europium activated silicate phosphors
prepared by a modified co-precipitation method (green-yellow emitting phosphors)
5.1. Abstract
This paper reports on the synthesis of nano- and submicron sized (Ba1-xSrx)2SiO4:Eu2+
(0
x 1) green-yellow emitting phosphors prepared by the co-precipitation method. Instead of
using water, N,N-dimethylformamide is used as a solvent. X-ray diffraction analysis shows single
phase products after post-synthesis annealing at temperatures > 900°C for x = 0. The particles are
nearly spherical with a narrow size distribution (100 nm-500 nm) depending on the annealing
conditions. The photoluminescence emission spectra consist of a strong broad green band
centered between 512 nm - 570 nm depending on x. The shift in the peak wavelength is attributed
to crystal field effects. The emission intensity was found to increase as the annealing temperature
increases most likely due to increased crystallinity. The quantum efficiencies of the phosphors
annealed at 1100°C (~290 nm particle size) and 1150°C (~460 nm particle size) are 82 and 84%,
respectively. Thus, these phosphors have excellent applicability as the green- and/ or yellow-
emitting component in phosphor blends for white-emitting UV-LEDs.
5.2. Introduction
White light sources based on light-emitting diodes (LEDs) are considered to be the next
generation in lighting because of their high efficiency, longer life and reliability, and low
operating temperature [7, 139, 140]. Recently, white LEDs in which a near-UV LED is combined
with blue, green, and red phosphors have been investigated due to less current droop of the UV-
LED compared with the blue-emitting LED and better control over color rendering index and
color temperature through manipulation of phosphor blends. [60, 130, 131].

86
(Ba,Sr)2SiO4:Eu2+
phosphors are one of the promising green-yellow emitting phosphors
particularly suitable for near-UV LED application, because of their broad excitation band near
380 nm, as well as the broad emission band centered at ~510 nm –570 nm as shown in Table 5.1.
The quantum efficiencies of our micron-sized powders are near 95% [53] and show good thermal
stability up to 150°C.
The energy efficiency of phosphor converted LEDs (pc-LEDs) depends on the LED
efficiency itself, the phosphor quantum efficiency and the Stokes loss, and the package
(extraction) efficiency. The nano-phosphors with comparable quantum efficiency could be
superior to phosphors with a larger particle sizes due to a lower scattering loss, thereby improving
the light extraction [141]. Furthermore, small and spherical phosphor particles with a small,
narrow size distribution, yield higher packing densities than the micron –sized and irregularly
shaped powders prepared by high temperature, solid state reactions. Furthermore, by reducing the
size of the particles, a higher activator concentration may be achieved since the resonant energy
transfer from one luminescent center to another, possible mechanisms of activator concentration
quenching, is inhibited by numerous particle boundaries of nanoparticles. This has been
demonstrated in many phosphor compounds such as Y2SiO5:Eu3+
[142] and Sr4Al14O25:Eu2+
[143].
In general, these phosphors are prepared by high-temperature, solid state method, which
produces larger particle sizes [144-146]. Recently, the synthesis methods of nanosized phosphors
by sol-gel [147], combustion [148] and spray pyrolysis [124] have been investigated. However,
despite these efforts, the particles are usually micron-sized with an irregular morphology and are
extremely agglomerated.
In this work, a novel co-precipitation method using a non-aqueous solvent N,N-
dimethylformamide (DMF) has been developed to produce (Ba1-xSrx)2SiO4:Eu2+
phosphors with
near-spherical, nano/submicron size particles with a narrow size distribution and high quantum
efficiency. DMF is the most suitable solvent for our purpose because of its low vapor pressure

87
(~3.7 mmHg at 25°C) and high boiling temperature (~153°C at 1 atm) compared to water (vapor
pressure ~24.1 mmHg at 25°C) [149, 150]. Moreover, it was found to be effective in synthesizing
the best quality (high transparency, low density) silica aerogels from tetraethoxysilane (TEOS),
which is employed in this work as the precursor source of Si [151]. Also universal metal
precursors, such as nitrates and chlorides, are easily dissolved in DMF whereas they are not
dissolved in most organic solvents (e.g. ethylene glycol, benzene, cyclohexane, etc). This means
we do not need to use speicalized metal precursors which can be very expensive, and are very
limited in their applications. Finally, DMF was shown to reduce the polymerization reaction, as
with other organic solvents, and slows down the reaction rate during the precipitation process,
which helps to prevent agglomeration of the particles [151]. A 3 at.% Eu2+
concentration was
selected because has the highest emission intensity and quantum efficiency [53].
5.3. Experimental
First, tetra-ethoxysilane (TEOS, 99.9%, Sigma Aldrich) (1 ml) was added to ethanol (10
ml) with a few of drops of nitric acid (68 – 70%, EM Science). The resultant solution was stirred
for 30 min. Next, Sr(NO3)2 (99.9%, Sigma Aldrich), Ba(NO3)2 (99.999%, Alfa Aesar) and Eu2O3
(99.999%, Alfa Aesar) in a 2 ml dilute nitric acid solution of the desired molar ratios was
dissolved in a 100 ml DMF solution (99.9% EM Science). Note that Ba(NO3)2 of high purity
(above 99.99%) was required for complete dissolution in DMF, and it took 3h-5h at 90°C for this
to occur. After the solution became transparent, it was cooled to 25°C. Then the required amount
of silica sol was added very slowly (~2 ml/min) to the mixture while stirring. Next, a NaOH
solution (0.8 g NaOH in 8 ml water and 40 ml ethanol), used as a precipitating agent, was added
slowly (~1 ml/min) to the mixture (molar ratio of Ba/Si/NaOH=2:1:4.6) while stirring. After
continuous stirring for another 10 min, the resulting precipitate was filtered and washed 3 times
with ethanol. It was then dried at 80°C for 4h. Finally, the powders were heated to 800° C-1150°
88
C for 1h in a slightly reducing atmosphere (a mixture of 5% H2 and 95% N2) at a rate of 5°C /min
and then cooled at a rate of 15°C /min.
The particle morphology and size were measured using a field emission scanning electron
microscope (FESEM, XL30, Philips). The crystalline phases of the annealed powders were
identified by X-ray diffraction (XRD) and the peak and phase analysis were determined by an
XRD analysis program (JADE, Materials Data Inc.). Particle size distributions were measured at
25°C using a Zeta Plus Particle Analyzer (Brookhaven Instruments Corp., Holtsville, NY) which
uses a dynamic light scattering method. Photoluminescence (PL) measurements were taken using
a Jobin-Yvon Triax 180 monochromator and SpectrumOne charge-coupled device detection
system, using a 450 W Xe lamp as the excitation source. Quantum efficiency (QE)
measurements were made using a 400 nm laser diode as the excitation source. Powdered
phosphor samples were dispersed in a silicone gel and cured. The samples were then placed in a
30.5 cm sphere and three measurements were taken following the method outlined in [128]
5.4. Results and discussion
The XRD patterns of the Ba2SiO4:Eu2+
powders after annealing at various temperatures
are shown in Figure 5.1. At 800°C, there are peaks for Ba2SiO4 (JCPDS 39-1256) with residual
SiO2 and BaSiO3. The XRD patterns show that the synthesized compound is of a single
orthorhombic phase with space group Pmcm and lattice constants a = 0.5818 nm, b = 1.0231 nm , c
= 0.7519 nm, agreeing well with JCPDS 26-1403 above 900 °C as shown in Figure 5.1. It was
reported that the Ba2SiO4 phase can be obtained at a temperature above 1200 °C by conventional
solid-state reaction [146]. However, single phase powders of Ba2SiO4 were produced by this
precipitation method with an annealing temperature of 900°C, much lower than by solid-state
reaction as shown in Figure 5.1. Moreover, further annealing at higher temperatures leads to a
reduction in the full-width at half-maximum due to an increase of the crystallite size.

89
SEM micrographs of Ba2SiO4:Eu2+
powders at various annealing temperatures are shown
in Figure 5.2 (a)-(d). The particle size is ~80 nm for samples annealed at 800°C and increases
with increasing annealing temperature: ~120 nm at 900°C, ~300 nm at 1100°C and ~500 nm at
1150°C. Significantly, the morphology of the particles is such that the surface-to-volume ratio is
low and their size is uniformly distributed, even after annealing at 1150°C. It is clear that the
particles prepared by co-precipitation with DMF as a solvent are much smaller, more spherical,
and more uniformly distributed than powders made by other methods, such as solid state reaction,
sol-gel, combustion and spray-pyrolysis. Histograms of particle diameters after annealing at
800°C, 900°C, 1100°C and 1150°C are shown in Figure 5.3(a)-(d). Although the particle size
distribution is slightly different from the SEM micrographs (due to measurement of the
agglomerates along with the individual particles) the size distribution of all samples are in good
agreement with the SEM micrographs. The average particle size is 98 ± 25, 113 ± 30, 285 ± 45
and 460 ± 110 nm for the 800°C, 900°C, 1100°C and 1150°C annealing temperature, respectively.
The width of the distribution increases with increasing annealing temperature due to a higher
degree of agglomeration ;25 ± 5, 27 ± 5, 46 ±10, 110 ± 20 nm for the 800°C, 900°C, 1100°C and
1150°C , respectively.

90
Figure 5.1. XRD patterns of Ba2SiO4:3%Eu2+
phosphors after post-synthesis annealing at various
temperatures.
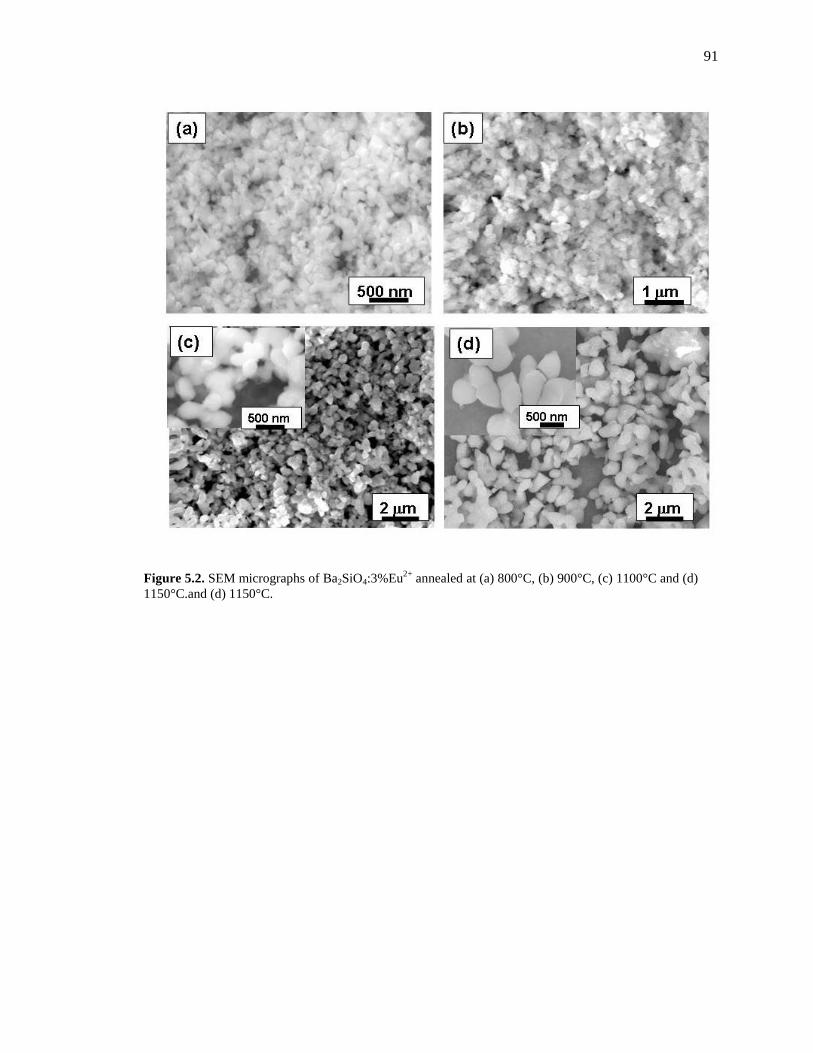
91
Figure 5.2. SEM micrographs of Ba2SiO4:3%Eu2+
annealed at (a) 800°C, (b) 900°C, (c) 1100°C and (d)
1150°C.and (d) 1150°C.
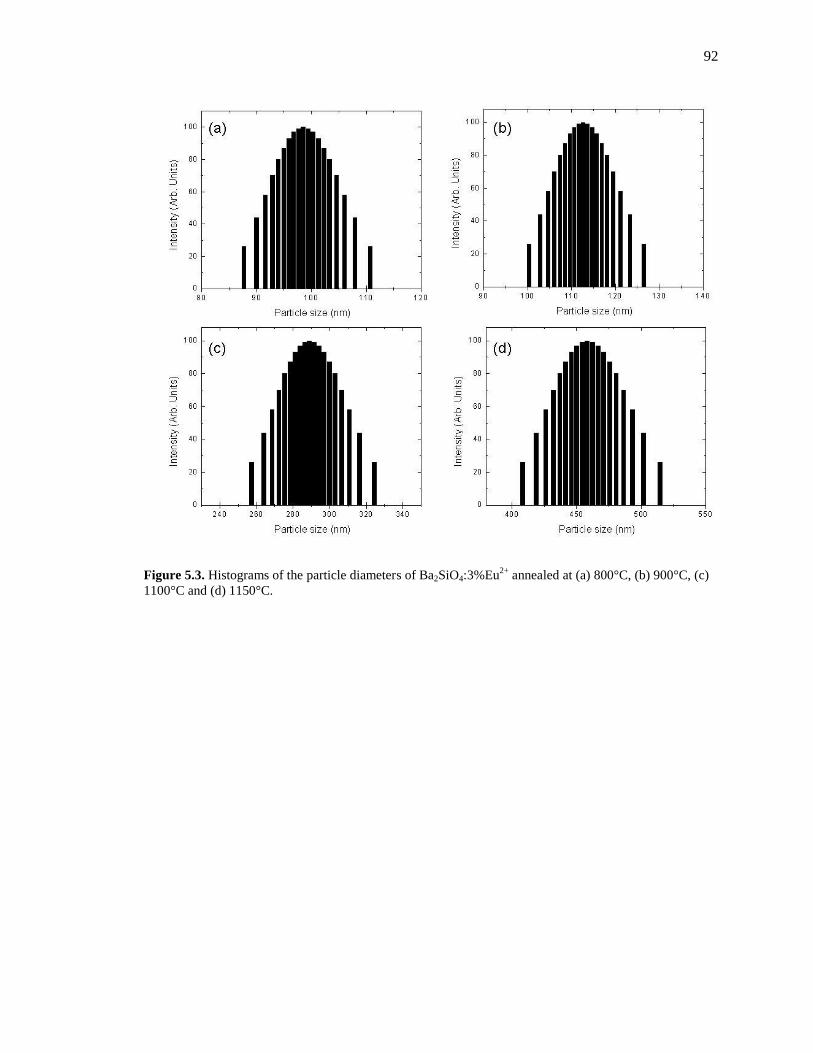
92
Figure 5.3. Histograms of the particle diameters of Ba2SiO4:3%Eu2+
annealed at (a) 800°C, (b) 900°C, (c)
1100°C and (d) 1150°C.

93
The concentration of reagents, pH, temperature and other conditions of the precipitation
all greatly affect the particle morphology. Interfacial tension of the solvent is also expected to be
one of the crucial factors in affecting particle size and morphology, following the Young-Laplace
equation [152]:
2p
a
(8)
where ∆p is the internal pressure relative to the outside pressure, γ is the interfacial tension and a
is the radius of the droplet or precipitate.
The interfacial tension of the DMF (37.10 mN/m) is significantly lower than that of water
(72.80 mN/m) [152] and thus the radius of a precipitate or a sol in the DMF solvent is expected to
be smaller than that in an aqueous solvent. The effect of surfactants on the morphology of
inorganic particles produced in aqueous systems is an example of the importance of interfacial
tension between the growing particle surface and solvent [153, 154]. Furthermore, Readey et al.
[155] have suggested that the strength of the agglomerates increases with the extent to which
water molecules, hydrogen-bonded to surface hydroxyl group, are able to form bridges between
adjacent particles. Therefore DMF, a non-aqueous solvent with low interfacial tension, is a
promising solvent for the synthesis of non-agglomerated nano- or submicron sized particles.
Figure 5.4 (a) shows the emission spectra (λex = 380 nm) of Ba2SiO4:Eu2+
powders after
annealing at different temperatures. The PL spectrum consists of a green band centered around
512 nm, which is attributed to the allowed 4f65d
1→4f
7 transition [10, 50]. The dependence of
emission intensity on annealing temperature is shown in Figure 5.4 (b). It can be seen that the
emission intensity increases with an increase in annealing temperature, as expected due to the
decrease in the surface to volume ratio. Furthermore, as mentioned previously, the broadening of
the XRD peak decreased with increasing annealing temperature, which also results in an increase
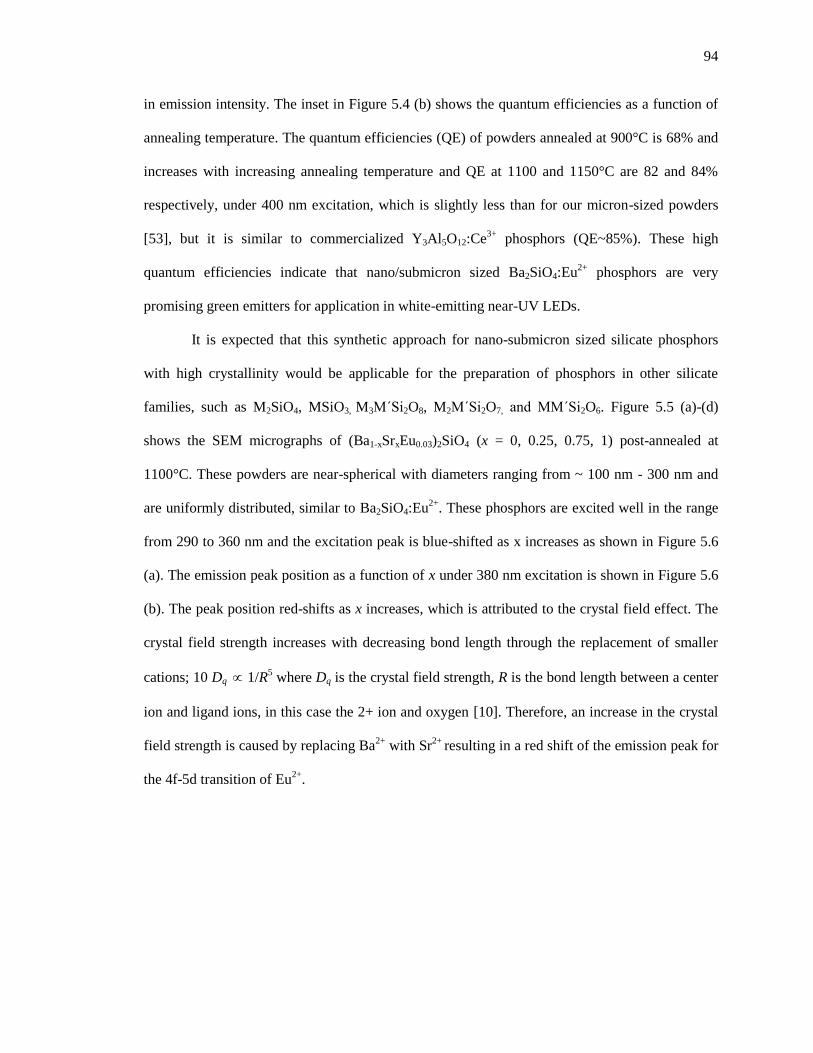
94
in emission intensity. The inset in Figure 5.4 (b) shows the quantum efficiencies as a function of
annealing temperature. The quantum efficiencies (QE) of powders annealed at 900°C is 68% and
increases with increasing annealing temperature and QE at 1100 and 1150°C are 82 and 84%
respectively, under 400 nm excitation, which is slightly less than for our micron-sized powders
[53], but it is similar to commercialized Y3Al5O12:Ce3+
phosphors (QE~85%). These high
quantum efficiencies indicate that nano/submicron sized Ba2SiO4:Eu2+
phosphors are very
promising green emitters for application in white-emitting near-UV LEDs.
It is expected that this synthetic approach for nano-submicron sized silicate phosphors
with high crystallinity would be applicable for the preparation of phosphors in other silicate
families, such as M2SiO4, MSiO3, M3M΄Si2O8, M2M΄Si2O7, and MM΄Si2O6. Figure 5.5 (a)-(d)
shows the SEM micrographs of (Ba1-xSrxEu0.03)2SiO4 (x = 0, 0.25, 0.75, 1) post-annealed at
1100°C. These powders are near-spherical with diameters ranging from ~ 100 nm - 300 nm and
are uniformly distributed, similar to Ba2SiO4:Eu2+
. These phosphors are excited well in the range
from 290 to 360 nm and the excitation peak is blue-shifted as x increases as shown in Figure 5.6
(a). The emission peak position as a function of x under 380 nm excitation is shown in Figure 5.6
(b). The peak position red-shifts as x increases, which is attributed to the crystal field effect. The
crystal field strength increases with decreasing bond length through the replacement of smaller
cations; 10 Dq 1/R5 where Dq is the crystal field strength, R is the bond length between a center
ion and ligand ions, in this case the 2+ ion and oxygen [10]. Therefore, an increase in the crystal
field strength is caused by replacing Ba2+
with Sr2+
resulting in a red shift of the emission peak for
the 4f-5d transition of Eu2+
.

95
Figure 5.4. (a) PL emission spectra of Ba2SiO4:3%Eu2+
at various annealing temperatures under 380 nm
excitation and (b) normalized emission intensity as a function of annealing temperature. I = the emission
intensity, Io=the maximum emission intensity, which are from the powders annealed at 1150°C. The inset
in (b) shows the quantum efficiency as a function of annealing temperature. QE annealed at 1200°C is the
sample prepared by sol-gel method, which is taken from [53].
96
Figure 5.5. SEM micrographs of (Ba1-xSrxEu0.03)2SiO4 for (a) x = 0, (b) x = 0.25, (c) x = 0.75, and (d) x = 1.
All samples were annealed at 1100°C for 1h.

97
Figure 5.6. Normalized PL (a) excitation and (b) emission spectra of (Ba1-xSrxEu0.03)2SiO4 (x = 0, 0.25, 0.75,
1)
(b)
(a)
98
5.5. Conclusions
(Ba1-xSrx)2SiO4:Eu2+
green-yellow emitting phosphor powders were prepared by a new
co-precipitation method using N,N-dimethylformamide (DMF) as a solvent, instead of water. For
x = 0, single phase, nearly spherical Ba2SiO4 powders were obtained after post-synthesis
annealing at temperatures up to 1150˚C. The average particle size ranged from less than 100 nm
to 500 nm and increased with increasing annealing temperature. The photoluminescence emission
spectra consist of a strong broad green band centered at 512 nm and the emission intensity was
found to increase with increasing annealing temperature, due to an increase in particle size. The
quantum efficiencies of the phosphors with ~290 nm particle size and ~460 nm particle size were
82 and 84%, respectively. For x = 0.25, 0.75 and 1, the particle diameters were ~100 nm - 300 nm
after annealing at 1100°C. Therefore, this novel co-precipitation method using DMF as a solvent
is an ideal method for the synthesis of non-agglomerated, spherically shaped, uniformly
distributed, submicron-sized silicate phosphors with high quantum efficiency. We speculate these
powder properties can decrease scattering losses and thus lead to improvement in the total
efficacy of a near-UV LED based white light device.
5.6. Acknowledgements
This work is supported by the U.S Department of Energy of Grant DE-EE0002003. This
chapter, in full, is a reprint of the material as it appears in the Electrochemical Society Journal of
Solid State Science and Technology, Jinkyu Han, Mark. E. Hannah, Alan Piquette, Jan B. Talbot,
Kailash C. Mishra, Joanna McKittrick, Vol. 1, pp. R98-R104 (2012). The dissertation author was
the primary author of this paper. All sample synthesis and characterization were performed by the
primary author, except the quantum efficiency measurements, which was measured by Dr. Mark.
E. Hannah at Osram Sylvania.

99
Chapter 6. Europium activated KSrPO4-(Ba,Sr)2SiO4 solid solutions as color
tunable phosphors for near-UV light emitting diode applications
6.1. Abstract
This paper reports the structural and luminescence characteristics of Eu2+
activated solid
solutions of (KSrPO4)1-x •((Ba,Sr)2SiO4)x for 0 x 1. These phosphors were prepared by a sol-
gel/Pechini method. The lattice parameters of the solid solutions are linearly dependent on x. The
reliability factor from Rietvald analysis is nearly constant and independent of x, indicating
KSrPO4•(Ba,Sr)2SiO4 forms an ideal solid solution. The emission spectra consist of two distinct
broad bands, which depends on x: blue ranging from 430-470 nm and green-yellow ranging from
515-570 nm. Both emission peaks red-shift as x increases due to the crystal field effect and an
anomalous transition. The emission intensity of these solid solutions is also function of x and is
100-132% higher than LiCaPO4:Eu2+
(QE = 81%) at x = 0.1, suggesting these color tunable solid
solutions are promising for applications in solid state white lighting.
6.2. Introduction
White light sources based on light-emitting diodes (LEDs) are considered to be the next
generation in lighting because of their high efficiency, longer life and reliability, and low
operating temperature [7, 139, 140]. The most common approach for producing white-emitting
LEDs has been to use a blue-emitting InGaN LED with the yellow-emitting phosphor
Y3Al5O12:Ce3+
and a red emitting phosphor for color correction [130, 131]. Recently, white LEDs
in which a near UV-LED (nUV-LED) is combined with blue, green, and red phosphors have been
investigated due to less current droop and improved binning of the nUV-LEDs, and a better
control over color rendering index and color temperature through manipulation of phosphor
blends [102, 129, 156]. Nevertheless, the degradation of luminous efficiency due to the strong
100
reabsorption of the blue emission by the green or red-emitting phosphors still remains one of the
problems with this system [157, 158]. For these reasons, there have been reports on double or
triple color emission from single phase phosphors by tuning the phosphors with respect to the
positions of their excitation and emission bands by modifying the host compounds, developing
new hosts, and changing the activator ions [106, 159, 160, 161]. For example, a single-phased bi-
or tri-color emitting phosphors can be achieved by activation with an Eu-Mn energy transfer [106,
159, 160, 161] or by co-activators such as Eu2+
/Eu3+
/Tb3+
and Ce3+
/Tb3+
[161,162]. However, the
quantum efficiency and thermal stability of phosphors using an Eu-Mn energy transfer are
dramatically reduced due to the relatively slow decay time of the forbidden Mn2+
d–d emission
band, which creates additional paths for energy transfer, leading to non-radiative losses under
typical LED operation [72]. In multi-activator phosphors, the efficient excitation band is mostly
in the deep UV region (250-330 nm) resulting in lower quantum efficiency at the nUV;
additionally, the synthesis of efficient Eu2+
/Eu3+
activated phosphors is very difficult as it requires
repeated annealing step in reducing and oxidizing atmospheres [162].
A solid solution phosphor is also a possible way to tune the emission wavelength and
luminescence output. A number of efficient solid solution phosphors have been investigated with
respect to partial changes of the host compound through either cation or anion substitution.
Examples are Eu2+
activated Ba2SiO4-Sr2SiO4-Ca2SiO4, Ba3MgSi2O8-Sr3MgSi2O8-Ca3MgSi2O8,
CaSi2O2N2-SrSi2O2N2 and Sr2Si5N8-Ca2Si5N8-Ba2Si5N8 [75, 91, 134, 163]. Recently, Im et al.
[164] reported the luminescence properties of highly color tunable green-yellow emitting (λem =
474 to 537 nm) phosphors using solid solution of two isotypic compounds: Ce-activated
Sr3AlO4F (blue-green emitter) and Sr3SiO5 (green-yellow emitter) and showed improved moisture
stability and quantum efficiency using a solid solution over the individual phosphors.
In our previous reports, we investigated the luminescence properties of (Ba,Sr)2SiO4:Eu2+
phosphors and their solid solutions [53, 60, 89, 90]. For both Ba2SiO4:Eu2+
and Sr2SiO4:Eu2+
, two

101
different Eu2+
emissions were observed. The shorter and longer emission wavelengths of Sr2SiO4
are 475 and 570 nm, respectively. For Ba2SiO4, the emission spectrum appears to be one single
band near 514 nm, but which may be from two bands at 505 and 520 nm [60]. However, these
two bands cannot be separated since both intensities are not significantly different and there is no
clear dependence on the excitation wavelength [60]. The emission peak of the solid solution
ranges from 514 to 570 nm and the quantum efficiency (QE) ranges from 88-95%, depending on
the composition. In addition, using first-principles band structure calculations we suggested the
longer wavelength emission from site Ba(1) of Sr(1) (CN = 10) was attributed to the typical 4d-5f
transition of Eu2+
and the shorter wavelength emission is from site Ba(2) or Sr(2) (CN = 9), which
was from anomalous transition of Eu2+
[110].
In this study, the structural and optical properties of KSrPO4-(Ba,Sr)2SiO4 activated with
Eu2+
were investigated. The structures of KSrPO4, Ba2SiO4, and Sr2SiO4 are orthorhombic with
space groups Pnma, Pmcm, and Pmnb, respectively. However the space group number of each
compound is the same (# 62), which leads to the hypothesis that these three compounds could
form ideal solid solutions. KSrPO4:Eu2+
show efficient blue emission (λem ~ 430 nm) with
excellent thermal stability [59] and (Ba,Sr)2SiO4 is a promising green-yellow emitter (λem ~ 505 –
570 nm) for nUV based white-emitting LEDs, showing good thermal stability and high QE
(~95%) [53, 60, 89, 110]. Thus, the synthesis and characterization of the solid solution of
KSrPO4-(Ba,Sr)2SiO4 were investigated in order to produce color-tunable phosphors. To the best
of our knowledge, this represents the first report of color tunable phosphors using KSrPO4-
(Ba,Sr)2SiO4 solid solutions.

102
6.3. Experimental
A modified sol-gel method was used to synthesize the phosphor powders. First, tetra-
ethoxysilane (TEOS, 99.9%, Sigma Aldrich) was added to ethanol with a few of drops of nitric
acid (68 – 70%, EM Science). The resultant solution was stirred for 30 min. Next, KNO3 (99.9%
EMD Chemical), Sr(NO3)2 (99.9%, Sigma Aldrich), Ba(NO3)2 (99.999%, Alfa Aesar) and Eu2O3
(99.999%, Alfa Aesar) in a 2 ml dilute nitric acid solution of the desired molar ratios were
dissolved in water. Note that Ba(NO3)2 of high purity (above 99.99%) was required for complete
dissolution in water. Then, (NH4)2HPO4 (EMD Chemicals) as the reagent for PO43−
was added to
the mixture and the required amount of silica sol was added to the mixture under stirring. Note
that before adding (NH4)2HPO4, the pH of the cation mixture was < 2 to prevent precipitation.
Subsequently, 4.2 g citric acid (C6H8O7·H2O, EMD), which acted as a chelating agent for the
metal ions, and 2.23 ml ethylene glycol (C2H6OH, Fischer Scientific) were introduced (molar
ratio = 1:1:2). Then, 2.5 g polyethylene glycol (PEG, (C2H4O)nH2O, molecular weight = 20,000,
Sigma Aldrich), used as a cross-linking agent, was added to the aqueous solution. The mixture
was well stirred to achieve uniformity and was then placed in a water-bath at 80°C to warm
overnight so that the solution would hydrolyze into a sol and then into a gel. The gel was heated
to 1000°C for 1 h in air to remove carbon and organic material. Finally, the gel was calcined at
1150°C for 6 h in a slightly reducing atmosphere (a mixture of 5% H2 and 95% N2). All samples
have a Eu concentration of 3 at.%, which was previously determined to produce the highest
luminescence emission intensity [53].
The crystalline phases of the annealed powders were identified by X-ray diffraction
(XRD). The lattice parameters were obtained by the LeBail pattern-matching method, as
implemented in the General Structure Analysis System (GSAS) program [165].
Photoluminescence (PL) measurements were taken using a Jobin-Yvon Triax 180
103
monochromator and SpectrumOne charge-coupled device detection system, using a 450 W Xe
lamp as the excitation source.
6.4. Results and Discussion
The compounds KSrPO4, Ba2SiO4, and Sr2SiO4 are isostructural with orthorhombic -
K2SO4 and have space group of Pnma (#62). The only difference between these three compounds
is the order of lattice parameter in the crystal structure: (a, b, c) for Pnma for KSrPO4, (b, c, a) for
Pmcn (Ba2SiO4) and (b, a, -c) for Pmnb (Sr2SiO4). Although these compounds have different lattice
parameter settings, they may form an ideal solid solution as observed in the Ba2SiO4-Sr2SiO4
system [91]. Figure 6.1 shows the crystal structures of KSrPO4, Ba2SiO4, and Sr2SiO4 as drawn
with the visualization program VESTA [166]. In Sr2SiO4, the occupancy of Sr and O ions is 0.5
and it is represented by half-white sphere as shown in Figure 6.1 (c). The frameworks of KSrPO4
and (Ba,Sr)2SiO4 are identical, where there are successive arrays of K ions and PO4 tetrahedra for
KSrPO4 and Ba(1) or Sr(1) ions and SiO4 tetrahedra for (Ba,Sr)2SiO4 reside at the same heights
and all alkali ions are surrounded by PO4 or SiO4 polyhedra in a compact arrangement [167-169].
As shown in Figure 6.1 (b) and (c), there are two different Ba sites in Ba2SiO4 and Sr sites in
Sr2SiO4, both occurring in equal amounts in the structures. One of these sites, Ba(1) or Sr(1), has
a coordination number of ten and the other site Ba(2) or Sr(2) is surrounded by nine oxygen ions.
Figure 6.1 (d) shows the unit cell structure of KSrPO4-(Ba,Sr)2SiO4 solid solution and Ba(1) (or
Sr(1)) and Ba(2) (or Sr(2)) in Ba2SiO4 (or Sr2SiO4) corresponds to K and Sr site in KSrPO4 and Si
site in (Ba,Sr)2SiO4 corresponds to P site in KSrPO4.

104
Figure 6.1. Unit cell representation of the crystal structure of (a) KSrPO4 along the [100] direction, (b)
Ba2SiO4 along the [100] direction, (c) Sr2SiO4 along the [001] direction (The white/green and white/red
spheres indicate the occupancy of the ions is 0.5), and (d) KSrPO4-(Ba,Sr)2SiO4 solid solution along the
[100] direction. The polyhedral geometry of PO4 in (a) and SiO4 in (b) and (c) is depicted by red polyhedral.

105
Figure 6.2 (a) and (b) show the XRD patterns of Eu2+
activated solid solution of
(KSrPO4)1-x•(Ba2SiO4)x (abbreviated as KBPSO) and (KSrPO4)1-x•(Sr2SiO4)x (abbreviated as
KSPSO) for 0 x 1, respectively. As shown in Figure 2 (a), all samples of KBPSO are single
phase. The main peaks of end member KSrPO4 (2θ ~ 30.5 and 32.5) progressively and
smoothly shift to a lower scattering angle as x increases as the lattice parameters of KSrPO4 are
smaller than those for Ba2SiO4. The lattice parameters, a, b and c all increase as x increases. The
KSPSO samples are nearly single phase as shown in Figure 6.2 (b), however there are small
amounts of impurities: (Sr3(PO4)2 for x < 0.4 and -Sr2SiO4 at x 0.4). As x increases, one of the
two main peaks of KSrPO4 at 2θ ~ 32.5 for the (002) plane shifts to a lower scattering angle, but
the other at 2θ ~ 30.5 for the (220) plane shifts to a higher scattering angle. Thus, the lattice
parameters b and c increase but a decreases with increasing x. In addition, the crystallite size of
KBPSO is 42.5, 42.2, 27.9, 17.2, 17.2, 21.0, and 37.6 nm for x = 0, 0.1, 0.25, 0.4, 0.6, 0.85 and 1,
respectively and that of KSPSO is 42.5, 42.7, 42.0, 25.2, 28.8, 36.8 and 34.6 nm for x = 0, 0.1,
0.2, 0.4, 0.6, 0.9 and 1, respectively, according to Scherrer equation. The crystallite size for these
solid solution is comparable to other oxide compounds prepared by sol-gel method with high
annealing temperature (>1000°C) but that for intermediate x is smaller than for the end-members,
which is likely due to compositional disordering of K/Ba2+
(Sr2+
) and P5+
/Si4+
in the host
compound.The XRD patterns of solid solutions of (Ba1-xSrx)2SiO4:Eu2+
are shown in Figure 6.2
(c). All samples are single phase and the peaks shifts to higher angle as x increases due to smaller
lattice parameters of Sr2SiO4. The lattice parameters, a, b and c decrease as x increases. From
these XRD patterns of KBPSO, KSPSO and (Ba1-xSrx)2SiO4 solid solution, it is unambiguous that
these three compounds are ideal solid solutions.

106
Figure 6.2. XRD patterns of Eu2+
-activated (a) (KSrPO4)1-x•(Ba2SiO4)x, (b) (KSrPO4)1-x•(Sr2SiO4)x, and (c)
(Ba1-xSrx)2SiO4 at for 0 x 1.
107
The lattice parameters were refined by the Rietveld method. Figure 6.3 (a) and (b) show
the lattice parameters obtained from GSAS analysis as a function of x for KBPSO and KSPSO.
The refinement confirmed the single phase nature of KBPSO and single phase structure of
KSPSO (containing a small amount secondary phase, < 5%). The final values of the reliability
factor, Rwp,, were in the range 6.0-7.5%. The Rwp indicates the difference between observed and
calculated data of the XRD patterns. Generally, the values are not over 10% for higher quality
refinement [170]. The lattice constants for KBPSO and KSPSO either linearly increase or
decrease with increasing x, indicating Vegard‘s law is followed [171].
Figure 6.4 (a) and (b) show the emission spectra of KBPSO and KSPSO, respectively, at
various x excited at 380 nm. For KSrPO4:Eu2+
, the emission spectrum consists of one strong band
near 430 nm and a very small tail near 475 nm, which is in agreement with those reported by
Waite [172] and Poort et al. [60]. The tail is attributed to a degree of disorder between K and Sr
ions [60]. For KBPSO, the emission spectra consist of two broad bands between 430-460 nm and
between 480-520 nm and for KSPSO between 430-475 nm and between 490-570 nm, which are
dependent on x. The ratio of emission intensity of shorter wavelength to that of longer wavelength
decreases with increasing x. The dominant emission peak of KSrPO4:Eu2+
is the shorter
wavelength ~ 430 nm from the Sr (2) site, whereas for Ba2SiO4:Eu2+
and Sr2SiO4:Eu2+
it is at the
longer wavelength ~ 520 and 570 nm from the Ba(1) and Sr(1) sites, respectively. As x increases,
the K(1) sites (weak longer wavelength emission ~ 490 nm) are replaced by Sr(1) or Ba(1) sites
in (Ba,Sr)2SiO4 (strong longer wavelength emission 510-570 nm), and Sr(2) sites (strong shorter
wavelength emission near 430 nm) are replaced by Ba(2) or Sr(2) sites (weak shorter wavelength
emission 470-510 nm) in (Ba,Sr)2SiO4. This results in a decrease of the ratio of emission
intensities of shorter to longer wavelengths. The emission intensities of both KBPSO and KSPSO
are highest at x = 0.1 and lowest at intermediate values (x = 0.4 and 0.6). The XRD spectra at
these intermediate x values have broad FWHM peaks, indicating small crystallite size and

108
significant disorder. The lower emission intensities may be improved by increasing the annealing
temperature and/or time.
Figure 6.5 shows the emission peaks of shorter and longer wavelength of KBPSO and
KSPSO as a function of x. Both peaks are red-shifted as x increases. The K site in KSrPO4
corresponds to the Ba(1) or Sr(1) site in (Ba,Sr)2SiO4. The red-shift of the longer wavelength
emission can be explained by the crystal field effect, which arises from the typical 4d-5f
transitions in Eu2+
. The crystal field strength increases with decreasing bond length and a larger
crystal field increases the Stokes shift. The average bond length of K(1)-O in KSrPO4 is 0.3005
nm and between Ba(1)-O and Sr(1)-O in (Ba,Sr)2SiO4 is 0.2982 nm and 0.2855 nm, respectively
[167-169]. Thus, the crystal field strength of Ba(1) and Sr(1) sites in (Ba,Sr)2SiO4 is larger than
that of K(1)-O in KSrPO4, resulting in a red-shift of the emission band as x increases. In addition,
the crystal field strength of the Sr(1) sites in Sr2SiO4 is larger than that of Ba(1) sites in Ba2SiO4
and thus the red-shift of emission peak is more significant in KSPSO than in KBPSO as x
increases.

109
Figure 6.3. Lattice parameters of Eu2+
-activated (a) (KSrPO4)1-x•(Ba2SiO4)x and (b) (KSrPO4)1-x•(Sr2SiO4)x
as a function of x as obtained from Rietveld refinement.

110
Figure 6.4. Photoluminescence emission spectra of Eu2+
-activated (a) (KSrPO4)1-x•(Ba2SiO4)x and (b)
(KSrPO4)1-x•(Sr2SiO4)x at various x under 380 nm excitation. The insets are photos showing colors of the
corresponding samples, which were taken with a 380 nm emitting UV-LED.

111
The red-shift of the shorter wavelength emission cannot be explained by crystal field
theory, but by the anomalous transition in Eu2+
. The Sr site in KSrPO4 corresponds to the Ba(2) or
Sr(2) sites in (Ba,Sr)2SiO4. Using first-principles band structure calculations, the 5d-like spin-up
states of Eu2+
in Ba(2) or Sr(2) appeared at almost the same location or near the bottom of the
conduction band [173], which is the condition required for anomalous emission from Eu2+
. The
anomalous emission is more likely to be red-shifted for Eu2+
on the larger cation sites than for
smaller ones [50]. The size of the Ba(2) sites in Ba2SiO4 and Sr(2) sites in Sr2SiO4 are larger than
that of the Sr(2) sites in KSrPO4 since the bond lengths of Ba(2)-O in Ba2SiO4, Sr(2)-O in Sr2SiO4
and KSrPO4 are 0.2824, 0.2709 and ~ 0.26 nm, respectively [167-169]. This indicates that the
shorter wavelength emission should increase with increasing x. However, the reason for slight
blue-shift and the significant drop of emission intensity in KBPSO for x = 0.6 is not obvious.
This may be due to the change of local structure and larger degree of disorder between Ba, K and
Sr ions since the disorder is larger in KBPSO than KSPSO, based on differences in ionic radii
[174]. Theoretical explanation of these phenomena is currently under investigation.
Figure 6.6 (a) and (b) show the excitation spectra of KBPSO at shorter and longer
wavelength emission, respectively, and Figure 6.6 (c) and (d) shows that of KSPSO at shorter and
longer wavelength for various x. The excitation peak at the shorter wavelength emission in both is
near 320 nm at x = 0 and is red-shifted as x increases. The broad excitation spectrum covers the
wavelength range from UV to the visible region and the phosphors are excited efficiently in the
region from 320 to 360 nm for shorter wavelength emission and 320 to 400 nm for longer
wavelength emission.
Figure 6.7 represents the emission spectra (λex = 380 nm) of KBPSO and KSPSO at x =
0.1, which showed the highest emission intensity, with a comparison to the highly efficient blue-
emitting LiCaPO4:Eu2+
phosphor (QE ~ 80%) [53, 54]. The intensity of KBPSO is 132% higher
than that of LiCaPO4:Eu2+
and that of KSPSO is comparable to that of LiCaPO4:Eu2+
. In addition,

112
as seen in the chromaticity diagrams at various x in Figure 6.8 (a) and (b), the chromaticity
coordinates for KBPSO are in the range x = 0.150- 0.227 and y = 0.022 - 0.691 and those for
KSPSO are in the range x = 0.167 - 0.461 and y = 0.227 – 0.507, indicating the emitting color is
highly tunable from blue to yellow region. Thus, solid solutions of KBPSO and KSPSO have
high color tunability and luminescence efficiency and are suitable for applications in solid state
white lighting.

113
Figure 6.5. Photoluminescence emission peaks of Eu activated (KSrPO4)1-x•(Ba2SiO4)x (KBPSO) and
(KSrPO4)1-x•(Sr2SiO4)x (KSPSO) as a function of x. The shorter and longer wavelengths are in the range
430-475 nm and 514-570 nm, respectively.
\
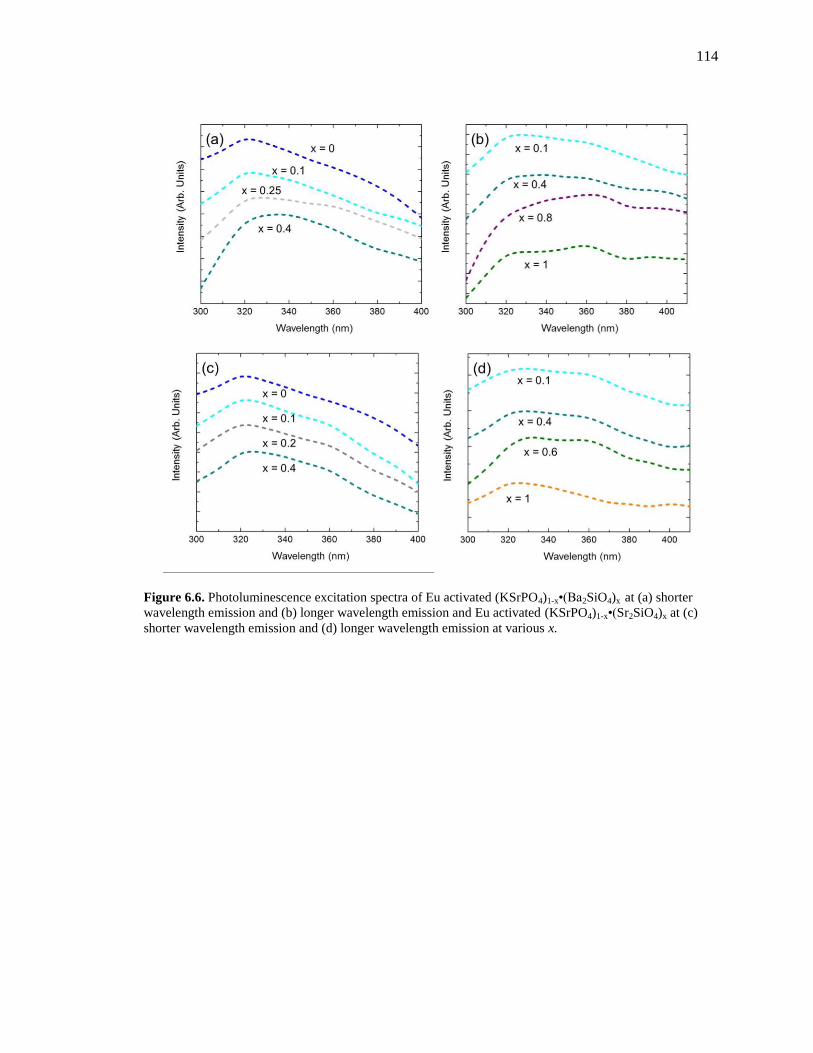
114
Figure 6.6. Photoluminescence excitation spectra of Eu activated (KSrPO4)1-x•(Ba2SiO4)x at (a) shorter
wavelength emission and (b) longer wavelength emission and Eu activated (KSrPO4)1-x•(Sr2SiO4)x at (c)
shorter wavelength emission and (d) longer wavelength emission at various x.

115
Figure 6.7. Photoluminescence emission spectra of Eu2+
-activated (KSrPO4)1-x•(Ba2SiO4)x (KBPSO) and
(KSrPO4)1-x•(Sr2SiO4)x (KSPSO) at x = 0.1. LiCaPO4:Eu2+
taken from [54].
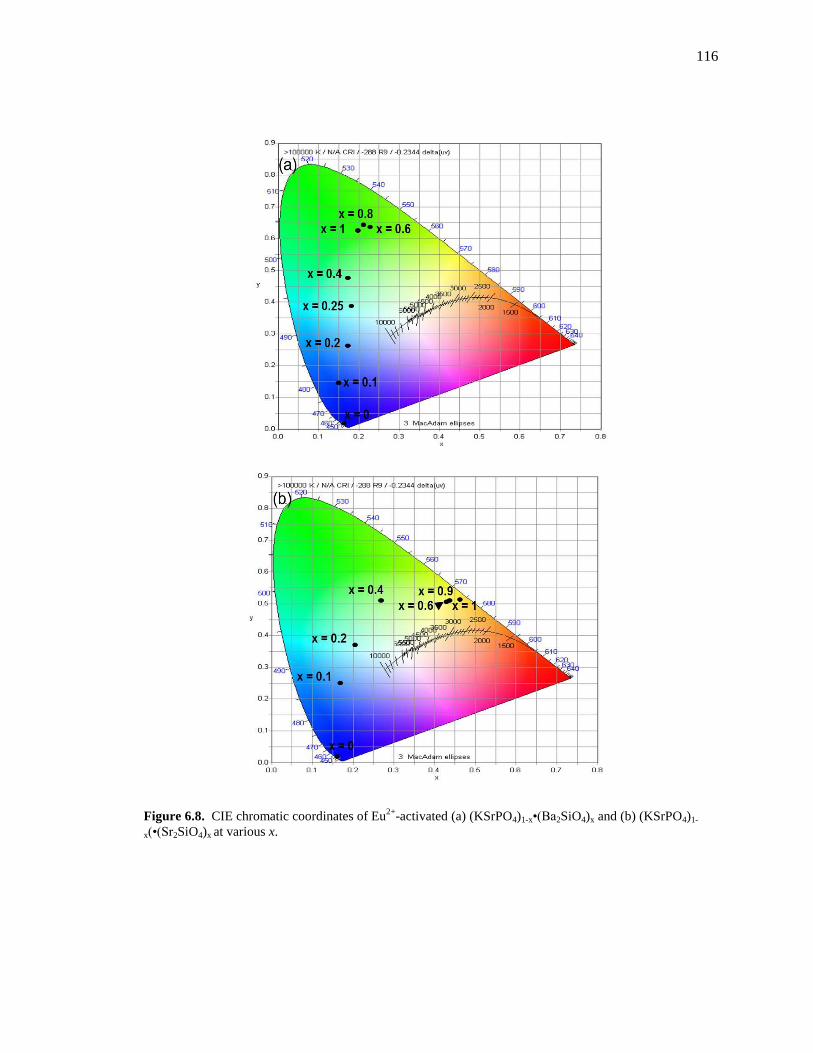
116
Figure 6.8. CIE chromatic coordinates of Eu2+
-activated (a) (KSrPO4)1-x•(Ba2SiO4)x and (b) (KSrPO4)1-
x(•(Sr2SiO4)x at various x.
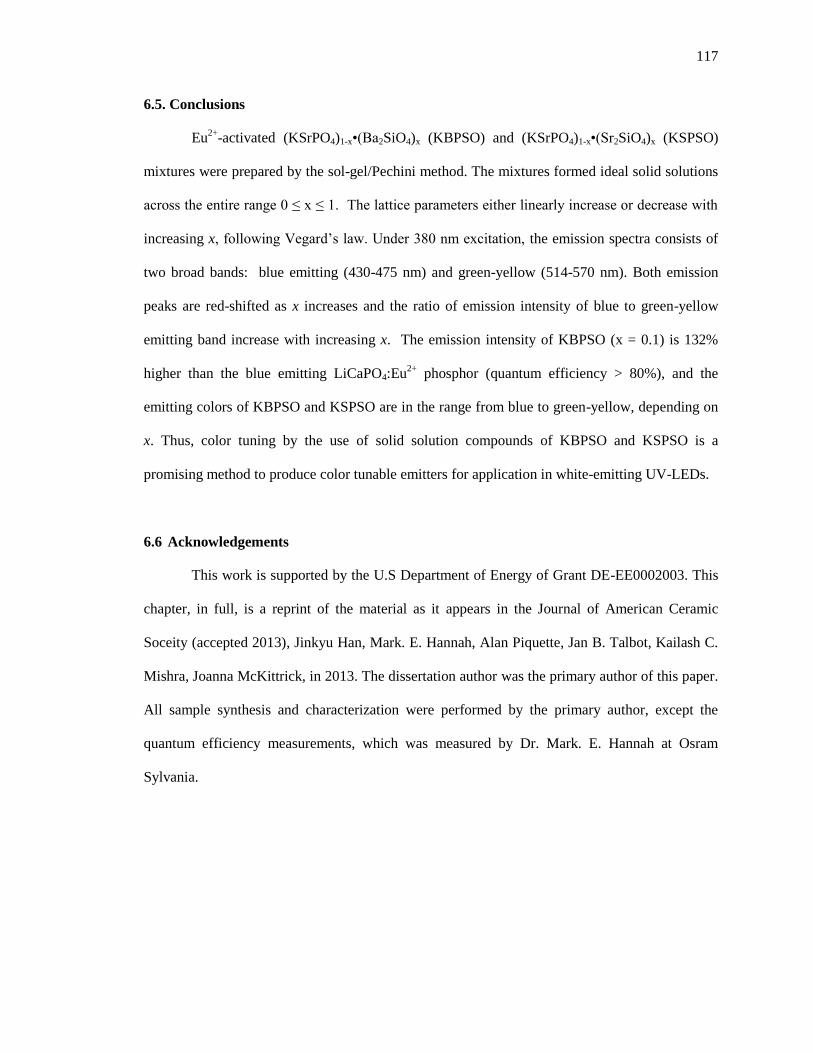
117
6.5. Conclusions
Eu2+
-activated (KSrPO4)1-x•(Ba2SiO4)x (KBPSO) and (KSrPO4)1-x•(Sr2SiO4)x (KSPSO)
mixtures were prepared by the sol-gel/Pechini method. The mixtures formed ideal solid solutions
across the entire range 0 ≤ x ≤ 1. The lattice parameters either linearly increase or decrease with
increasing x, following Vegard‘s law. Under 380 nm excitation, the emission spectra consists of
two broad bands: blue emitting (430-475 nm) and green-yellow (514-570 nm). Both emission
peaks are red-shifted as x increases and the ratio of emission intensity of blue to green-yellow
emitting band increase with increasing x. The emission intensity of KBPSO (x = 0.1) is 132%
higher than the blue emitting LiCaPO4:Eu2+
phosphor (quantum efficiency > 80%), and the
emitting colors of KBPSO and KSPSO are in the range from blue to green-yellow, depending on
x. Thus, color tuning by the use of solid solution compounds of KBPSO and KSPSO is a
promising method to produce color tunable emitters for application in white-emitting UV-LEDs.
6.6 Acknowledgements
This work is supported by the U.S Department of Energy of Grant DE-EE0002003. This
chapter, in full, is a reprint of the material as it appears in the Journal of American Ceramic
Soceity (accepted 2013), Jinkyu Han, Mark. E. Hannah, Alan Piquette, Jan B. Talbot, Kailash C.
Mishra, Joanna McKittrick, in 2013. The dissertation author was the primary author of this paper.
All sample synthesis and characterization were performed by the primary author, except the
quantum efficiency measurements, which was measured by Dr. Mark. E. Hannah at Osram
Sylvania.

118
Chapter. 7. Synthesis and luminescence properties of (Ba, Ca, Sr)3MgSi2O8:Eu2+
,
Mn2+
(red emitting phosphors)
7.1. Introduction
M3MgSi2O8:Eu2+
(M: Ba,Sr,Ca) compounds were developed as host materials for blue-
emitting phosphors and M3MgSi2O8:Eu2+
,Mn2+
for red-emitting phosphors for near UV[10, 75].
The Eu2+
-Mn2+
activated promising materials for orange and red-emitting phosphors are listed in
Table 7.1.
Blasse et al. [10] studied the photoluminescence (PL) properties from M3MgSi2O8:Eu2+
,
which showed a systematic emission-color shift from blue to green as the M cation size decreases
Barry [75] reported that (Ba,Sr)3MgSi2O8 and (Sr,Ca)3MgSi2O8 form an ideal solid solution.
Recently, the luminescent properties and energy transfer mechanism of Eu-Mn in
Ba3MgSi2O8:Eu2+
,Mn2+
under near-UV light excitation have been investigated [175-177], but
there is are contradictory reports concerning the green-emission band. Kim et al. [175] reported
that this band was attributed to Eu2+
substitution on the Ba(II,III) sites. In contrast, the green band
was not observed in other works [10.75, 175, 176].
In this work, the luminescence properties of Eu2+
and Mn2+
co-activated
(Ba,Ca,Sr)3MgSi2O8 phosphors prepared by combustion synthesis are presented. The effects of
the different crystalline structures of Ba3MgSi2O8 and the influence of additions of Sr on the
photoluminescence (PL) and thermal stability properties were investigated.

119
7.2. Experimental
Combustion synthesis is advantageous for preparing microcrystalline or sub-
microcrystalline materials at low-cost, high production yield with the ability to produce high-
purity multicomponent complex oxides [121-123]. The reagents were Sr(NO3)2 (99.99%, Alfa
Aesar), Ba(NO3)2 (99.999%, Alfa Aesar) Ca(NO3)2·4H2O (99.9%, Alfa Aesar) and Eu2O3 (99.999%
Alfa Aesar) with carbohydrazide (CH6N4O, Alfa Aesar 97%) used as the fuel. As soon as the
reagents were completely dissolved in diluted nitric acid, carbohydrazide as a fuel was added and
mixed thoroughly with a magnetic stirrer. Note that Ba(NO3)2 of high purity (above 99.99%) is
required for dissolution to be complete in water or nitric acid solutions. The mixtures were then
placed in a muffle furnace at 500°C. The solution boiled and produced a white, viscous mass
which then reacted exothermically to produce a white, porous, crystalline solid. This was lighlty
crushed with a mortar and pestle, placed in 50 ml alumina crucibles, and heat treated for 6h at
1200°C with forming gas (95% N2, 5% H2).
The crystalline phases of the annealed powders were identified by X-ray diffraction
(XRD) and the amount of the phases were determined by an XRD analysis program (JADE,
Materials Data Inc.). The particle morphology and size were determined by using a field emission
scanning electron microscope (FESEM, XL30, Philips). The PL properties were measured using a
Jobin-Yvon Triax 180 monochromator and SpectrumOne charge-coupled device detection system,
which was shared with a PL system that uses a 450 W Xe lamp as the excitation source. The
measurements were preformed on a Jobin-Yvon Fluorolog-2 system with a 450W xenon
excitation lamp. Both the emission and the excitation monochromators are standard double
grating 1680B monochromators. To investigate the temperature dependence of the
photoluminescence spectra, the spectrometer was configured to allow a cryostat to be lowered
into the sample chamber. The cryostat had a refrigerated cold head attached to a cold finger
sample mount. The signal was detected with a cooled R928P photomultiplier tube. Quantum

120
efficiency (QE) measurements were made using a 400 nm laser diode as an excitation source.
Powdered phosphor samples were dispersed in a silicone gel and cured. The samples were then
placed in a 10.2 cm sphere and three measurements (of which the average is reported) were taken
following the method outlined in [128].
7.3. Results and discussion
The XRD patterns of (Ba0.97Eu0.03)3(Mg0.95Mn0.05)Si2O8 and
(Ba0.735Sr0.235Eu0.03)3(Mg0.95Mn0.05)Si2O8 powders are shown in Figure 7.1. In the case of the
(Ba0.97Eu0.03)3(Mg0.95Mn0.05)Si2O8 powders, the major peaks are shifted ~0.1° from JCPDS card
10-0074 (Ba3MgSi2O8), which has an orthorhombic structure. This peak shift is significant even
though the activators Eu and Mn are substituted with Ba and Mg, respectively. This shift is
mainly due to change of lattice parameters of these phosphors. In addition, the weight percentages
of Ba2SiO4 and BaMgSiO4 as secondary phases are approximately 20 and 15%, respectively.
However, by adding Sr, a single phase is obtained, as shown in Figure 7.1. The peak shift is due
to the addition of Sr in the primary structure and and amount of secondary phases are estimated to
be <5 wt.%. The existence of secondary phases can be confirmed by the emission spectra since
Ba2SiO4:Eu2+
shows a bright green band centered at ~510 nm under near UV excitation [60].

121
Figure7 1. XRD patterns of (Ba0.97Eu0.03)3(Mg0.95Mn0.05)Si2O8 and (Ba0.735Sr0.235Eu0.03)3(Mg0.95Mn0.05)Si2O8

122
Figure 7.2 shows the emission and excitation spectra of (Ba0.97Eu0.03)3(Mg0.95Mn0.05)Si2O8
and (Ba0.735Sr0.235Eu0.03)3(Mg0.95Mn0.05)Si2O8. The excitation peaks of both phosphors are near 330
nm and the 446 nm emission bands are attributed to the 4f–5d transitions of Eu2+
. Kim et al. [175]
reported the 510 nm emission band was attributed to Eu2+
located in a Ba2+
(II, III) site. However,
this emission bands of (Ba0.97Eu0.03)3(Mg0.95Mn0.05)Si2O8 are from the secondary phases. The 621
nm emission band originates from the 4T–
6A transition of Mn
2+ ion located at Mg
2+ sites. With
the addition of Sr, both the blue and red emission bands are red-shifted, which is attributed to the
crystal field effect. The crystal field strength decreases with increasing bond length through the
replacement of larger cations; Dq 1/R5 where Dq is the crystal field, R is the bond length
between a center ion and ligand ions [10]. Note that there is no green emission band (~510 nm)
from the powders with Sr. This demonstrates that an addition of Sr to Ba3MgSi2O8 helps to form
the single phase.
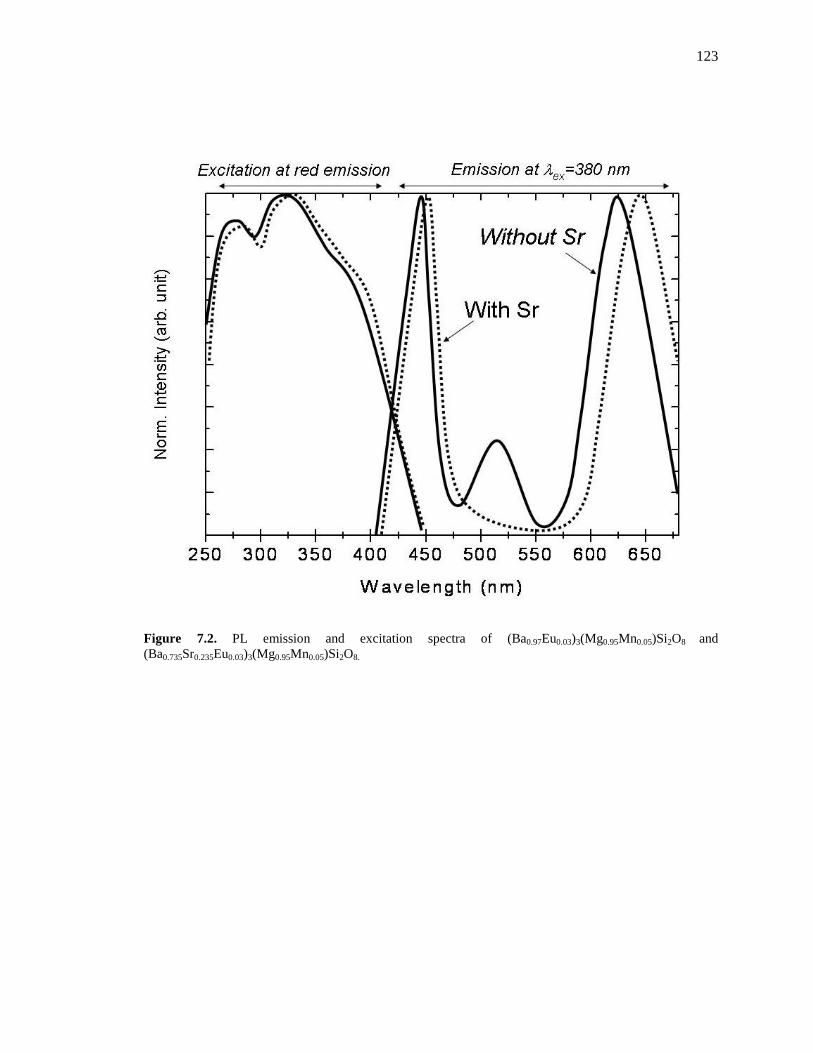
123
Figure 7.2. PL emission and excitation spectra of (Ba0.97Eu0.03)3(Mg0.95Mn0.05)Si2O8 and
(Ba0.735Sr0.235Eu0.03)3(Mg0.95Mn0.05)Si2O8.

124
SEM micrographs of (Ba0.97Eu0.03)3(Mg0.95Mn0.05)Si2O8 and (Ca0.97Eu0.03)3(Mg1-
0.95Mn0.05)Si2O8 powder are shown in Figure 7.3 (a) and (b), respectively. The particle size of
(Ba0.97Eu0.03)3(Mg0.95Mn0.05)Si2O8 is ~1 m and that of (Ca0.97Eu0.03)3(Mg1-0.95Mn0.05)Si2O8 is
smaller than that of Ba one (300 nm – 1 m). However, both particles are severely agglomerated
and thus form to aggregate. It is mainly due to high annealing temperature (1200°C) and long
duration time (6h). Show particles for (Ba0.735Sr0.235Eu0.03)3(Mg0.95Mn0.05)Si2O8
Figure 7.4 (a) shows the emission spectra of (Ba1-xEux)3(Mg1-yMny)Si2O8 a function of
the x and y. At x = 0, there is negligible emission in the visible region. For x = 0.03, as y
increases, the emission intensity of blue band decreases significantly with a sharp increase of the
red band. This is mainly due to the energy transfer between the blue emission and red absorption
bands from the large spectral overlap between the excitation and emission spectra near 400-450
nm, as shown in Figure 7.2 and 7.4(a). The quantum efficiency for x = 0.03, y = 0 is 70% and for
x = 0.03, y = 0.05 is 45% under 400 nm excitation. In the case of green emission, the emission
peak is not significantly dependent on the activator concentration of Eu and Mn. This indicates
that the intensity of green emission is only dependent on the amount of secondary phase of
Ba2SiO4 and BaMgSiO4. Figure 7.4 (b) shows the PL emission and excitation spectra of
(Ca0.97Eu0.03)3(Mg1-yMny)Si2O8 for y = 0. 0.01 and 0.05. The excitation peak is ~300 nm. The 485
nm emission band is attributed to 4f-5d transitions of Eu2+
and 703 nm emission band originates
from the 4T–
6A transition of Mn
2+. The quantum efficiency for x = 0.03, y = 0.05 is 43% under
400 nm excitation. Both emission peaks are red-shifted compared to (Ba1-xEux)3(Mg1-yMny)Si2O8
because of crystal field effect of the larger Ca2+
. At x = 0.03, y = 0.05, the intensity of red-
emission peak of the Ca compound is smaller than that of the barium compound due to the
smaller spectral overlap.
125
Figure 7.3. SEM micrographs of (a) (Ba0.97Eu0.03)3(Mg0.95Mn0.05)Si2O8 and (b) (Ca0.97Eu0.03)3(Mg1-
0.95Mn0.05)Si2O8.
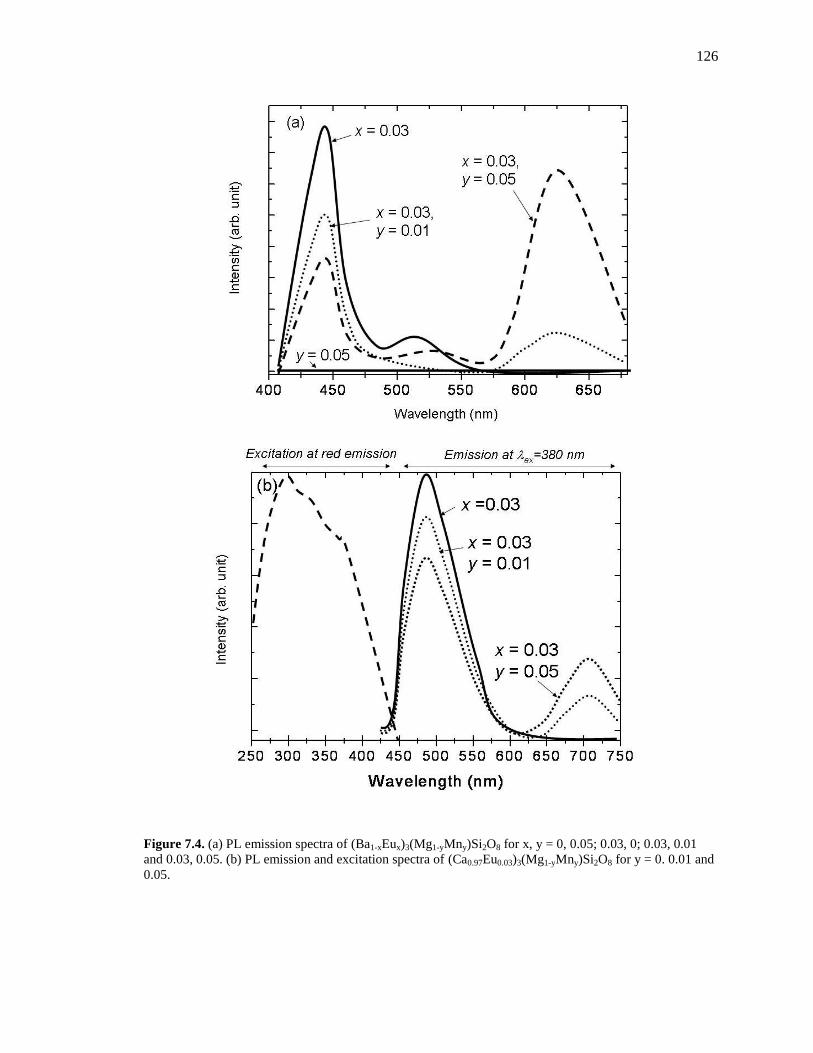
126
Figure 7.4. (a) PL emission spectra of (Ba1-xEux)3(Mg1-yMny)Si2O8 for x, y = 0, 0.05; 0.03, 0; 0.03, 0.01
and 0.03, 0.05. (b) PL emission and excitation spectra of (Ca0.97Eu0.03)3(Mg1-yMny)Si2O8 for y = 0. 0.01 and
0.05.

127
The temperature dependent lifetimes of (Ba0.97Eu0.03)3(Mg0.95Mn0.05)Si2O8 phosphors for
blue and red emission at 380 nm excitation are shown in Figure 7.5 (a) and (b), respectively. In
the case of blue emission, lifetime varies little with temperature. The blue emission lifetime at
400K is 90% of that at 80K. However, the lifetime for red emission decreases drastically with
increasing temperature as shown in Figure7.5 (b). The lifetime for red emission at 400K is 54%
of that at 80K. This can be explained by the lifetime scale of blue and red emission. There are two
paths for the electrons to take to the ground state, a radiative path and a non-radiative path. The
time for the radiative path is always longer than nano-seconds and the non-radiative lifetimes are
all much shorter than a nano-second and near pico-second [10]. The lifetime decreases with
increasing temperature as the non-radiative processes dominate. Also, the decrease in lifetime is
dependent on the lifetime of radiative path. The electrons with longer radiative lifetime are more
likely to return to the ground state through a non-radiative path than that with a shorter radiative
lifetime. As temperature increases, since lifetime for red emission (~ms) is much longer than blue
emission (~ns), the red-emission decreases more significantly with increasing temperature.

128
Figure 7.5. Lifetime of (a) blue and (b) red emission of (Ba0.97Eu0.03)3(Mg0.95Mn0.05)Si2O8 as a function of
temperature under 380 nm excitation.
129
7.4. Conclusions
(Ba,Ca,Sr)3MgSi2O8:Eu2+
,Mn2+
phosphors were prepared by the combustion synthesis
method. The emission spectra consist of broad blue band is centered between 450 to 485 nm and
red band is centered between 620 to 703 nm with quantum efficiencies of 45-70% depending on
the relative concentrations of Ba, Ca and Sr. The emission peak is red-shifted in the order of Ba,
Sr and Ca because of the crystal field effect. The particle size of the phosphor with Ba is larger
than that with Ca and the size is in the range of 300 nm to 1m. The Ba3MgSi2O8:Eu2+
,Mn2+
has
two secondary phases, which show a green emitting band centered at 510 nm. The secondary
phases can be eliminated by additions of Sr. The lifetime of the red-emission decreases
significantly with increasing temperature compared to that of the blue-emission which is 54% at
400K of that at 80K. This phenomenon can be explained by the longer radiative lifetime of Eu-
Mn emission.
7.5. Acknowledgments
This work is supported by the U.S Department of Energy of Grant DE-EE0002003. All
sample synthesis and characterization were performed by the primary author, except the quantum
efficiency and temperature dependent lifetime measurements, which was measured by Dr. Mark.
E. Hannah at Osram Sylvania.

130
Chapter 8. Dependence of phosphors properties on synthetic method
The synthesis method of phosphors play a significant role in determining the
microstructure, luminescence properties, and quantum efficiency of phosphors since the particle
size and morphology are significantly affected by synthetic method. For phosphor applications, it
is desirable to produce uniform, spherical phosphors, thus the selection of a synthesis method is a
crucial step in phosphor development. In this section, the effect of various synthetic methods on
the particle size, morphology and luminescence properties of promising UV-LED phosphors are
discussed: (Ba,Sr)2SiO4:Eu2+
(green-yellow emitter) and Y2O3:Eu3+
(red emitter)
8.1. Structural dependent luminescence characterization of green-yellow emitting
Sr2SiO4:Eu2+
phosphors for near UV LEDs
8.1.1.Abstract
This paper reports on the luminescence properties of mixtures of α- and β -
(Sr0.97Eu0.03)2SiO4 phosphors. These phosphors were prepared by three different synthesis
techniques: a modified sol-gel/Pechini method, a co-precipitation method and a combustion
method. The structural and optical properties of these phosphors were compared to solid state
synthesized powders. The emission spectra consist of a weak broad blue band centered near 460
nm and a strong broad green-yellow band centered between 543 to 573 nm depending on the
crystal structure. The green-yellow emission peak blue-shifts as the amount of β phase increases
and the photoluminescence emission intensity and quantum efficiency of the mixed phase
powders is greater than that of predominant α-phase powders when excited between 370 nm to
410 nm. Thus, the (Sr1-xEux)2SiO4 with larger proportion of the β-phase are more promising
candidates than single α-phase powders for use as a green-yellow emitting phosphor for near UV
LED applications. Finally the phosphors prepared by the sol-gel/Pechini method, which have
131
larger amount of β -phase, have a higher emission intensity and quantum efficiency than those
prepared by co-precipitation or combustion synthesis.
8.1.2. Introduction
During the last two decades, there has been considerable research in the lighting
community in an effort to fabricate white light sources using InGaN based LEDs. It is expected
that these solid state light sources will eventually replace existing lighting technologies because
of higher energy efficiency, longer life and reliability [7, 139]. One popular, almost an
ubiquitous approach, has been to use a blue-emitting InGaN LED with a yellow-emitting
phosphor Y3Al5O12:Ce3+
(YAG:Ce) and another red emitting LED for color correction. Another
less investigated approach is to use a near UV-emitting LED chip (370-410 nm) as the light
source. A white light source can be generated with a blend of multiple phosphors emitting in the
red, green and blue wavelengths. Such a light source should provide better control over the color
rendering index and correlated color temperature through the manipulation of the phosphor blend
[130, 131].
(Sr1-xEux)2SiO4 phosphors are particularly suited to the UV-LED approach because of the
broad excitation band near 380 nm as well as the broad emission band centered around 550-580
nm. This emission is due to the 4f-to-5d transition of the divalent europium ion [176]. This
phosphor has been explored in the past for this purpose [60, 114, 175, 178]; however there are no
detailed reports concerning the crystal phase dependent luminescence properties.
Sr2SiO4 has two crystalline structures: a high temperature α-phase that crystallizes in the
orthorhombic space group, Pmab (Space Group #62) and a low temperature β-phase that
crystallizes in the monoclinic space group P21/c (Space group # 14). The phase transformation
occurs around 85˚C [168, 169, 179] and it is difficult to obtain a pure β-phase [75]. Both the
phases can coexist, as the transition temperature is very low and α-to-β phase transformation is
132
completed through a short-range rearrangement of the coordination structure without breaking
any bonds [168]. However, the emission and excitation spectra depend on the phase or phases
present.
In this work, the luminescence properties of (Sr0.97Eu0.03)2SiO4 were examined. The
phosphors were prepared by two different synthetic methods: sol-gel/Pechini and co-precipitation
and compared to ones prepared by combustion synthesis and solid state reaction. The dependence
of the luminescence properties on the fraction of the α-phase was investigated. This is the first
report on the structural dependence of the luminescence properties of (Sr1-xEux)2SiO4 phosphors
prepared by the sol-gel/Pechini and co-precipitation methods.
8.1.3.Experimental
a) Sol-gel - Pechini method (SG/P)
First, tetra-ethoxysilane (TEOS, 99.9%, Sigma Aldrich) (2.18 ml) was added to ethanol
(20 ml) with several drops of nitric acid (68 – 70%, EM Science) and water. The resultant
solution was stirred for 30 min. Next, Sr(NO3)2 (99.9%, Sigma Aldrich) and Eu2O3 (99.999%,
Alfa Aesar) (molar ratio Eu/Sr = 0.03) were dissolved in a dilute nitric acid solution. After the
aqueous strontium and europium nitrate solution became transparent, the required amount of
silica sol was added to the strontium nitrate solution under stirring. Subsequently, 4.2 g citric acid
(C6H8O7·H2O, EMD), which acted as a chelating agent for metal ions, and 2.23 ml ethylene
glycol (C2H6OH, Fischer Scientific) were introduced (molar ratio = 1:1:2). Subsequently, 2.5 g
polyethylene glycol (PEG, (C2H4O)nH2O, molecular weight = 20,000, Sigma Aldrich), which is
used as a cross-linking agent, was added to the aqueous solution. The mixture was stirred to
achieve an uniformity, while the pH was regulated by NH4OH (28 – 30%, EMD) to maintain a
pH of 4. The mixture was then placed in a water-bath at 80°C to warm overnight so that the
solution would hydrolyze into a sol and then into a gel. The gel was heated to 1000˚C to remove
133
the carbon and organic material for 1h in air. Next the gel was calcined at 1200°C for 2h, and
finally cooled in a slightly reducing atmosphere (a mixture of 5% H2 and 95% N2).
b) Co-precipitation (CP)
TEOS (4.36 ml), in an ethanol solution with several drops of nitric acid, was added to
strontium and europium nitrate solution (molar ratio Eu/Sr = 0.03). After the solution became
transparent, it was slowly added (flow rate of 3 ml/min) to 100 ml of NH4HCO3 (0.24 mol), the
precipitant solution, under magnetic stirring at room temperature. After aging for 30 min, the
solution was filtered and rinsed with water two times. The powder was then dried at 120°C for 1h
and preheated 1000 °C in air for 1h to remove carbon and any impurities and then calcined at
1200 °C for 2h under a reducing atmosphere (a mixture of 5% H2 and 95% N2).
c) Combustion (CS) and solid state reaction (SS)
Powders produced by combustion (CS) and solid state reaction (SS) were used for
comparison to SG/P and CP powders. The CS method is described in detail in [122]. The as-
synthesized powders were annealed at 1200°C for 2h under a reducing atmosphere (a mixture of
5% H2 and 95% N2). For the solid state reaction (SS), the starting materials BaCO3, SiO2, Eu2O3
were mixed with a final molar ratio of 1.94Sr:1Si:0.06Eu. The mixture was milled thoroughly and
transferred into a furnace at 1500 °C for 4 h under a reducing atmosphere.
Characterization
The particle morphology and size were observed using a field emission scanning electron
microscope (FESEM, XL30, Philips). The crystalline phases of the annealed powders were
identified by X-ray diffraction (XRD) and the peak and phase analysis were identified by an XRD
analysis program (JADE, Materials Data Inc.). Photoluminescence (PL) was measured using a
Jobin-Yvon Triax 180 monochromator and SpectrumOne charge-coupled device (CCD) detection
system A 450 W Xe lamp is used as the excitation source. The constant sample size (30 mg) was
employed. Quantum efficiency (QE) measurements were made using a 400 nm laser diode as an

134
excitation source. Powdered phosphor samples were dispersed in a silicone gel and cured. The
samples were then placed in a 10.2 cm sphere and three measurements were taken following the
method outlined in [128].
8.1.4. Results and discussion
The XRD patterns of (Sr0.97Eu0.03)2SiO4 phosphors made by the SG/P and CP method are
shown in Figure 8.1. In both of the samples, the α- and β-phases coexist: the CP sample shows
predominantly α -Sr2SiO4 (JCPDS 39-1256) while the SG/P sample show a mixture of α and β
phases (JCPDS 39-1256 for α and 38-0271 for β phase). The peaks of α and β-phase are very
similar as shown in JCPDS cards in Figure 8.1, but the peaks for β-phase are near 2θ = 27.7° and
32.4°. The amounts of β-phase for CP and SG/P powder are approximately estimated to be 10 and
40%, respectively, as determined by the XRD program (JADE). It is not straightforward to obtain
only α - and especially only β-phase. This is due to the very low transition temperature (~85˚C),
and to the similarity of their crystal structures [168, 169, 179]. However, the proportion of β-
phase in the powders can be increased to over 95% by using solid-state reaction synthesis (SS) at
a high synthetic temperature (1500˚C) as shown in Figure 8.1. Also, the proportion of α -phase
can be increased to over 95% by using combustion method (CS) as shown in Figure 8.1, which is
taken from [53] and by using SG/P with increasing post-synthesis annealing time from 2h to 10h
(this work).

135
Figure 8.1. XRD patterns of (Sr0.97Eu0.03)2SiO4 phosphors prepared by the sol-gel/Pechini (SG/P), co-
precipitation method (CP), combustion method (CS), which is taken from [53] and solid-state reaction
method (SS).
136
SEM micrographs of the powders prepared by CP, SG/P and SS method are shown in
Figure 8.2 (a)-(c), respectively. Figure 8.2 (a) shows the 90% α powder prepared by CP and
Figure 8.2 (b) shows the 60% α powder prepared using SG/P. There is not much difference in
shape between both particles. Although some particles are agglomerated because of high
temperature annealing (1200°C), but the shapes of both structures are primarily needle-like. The
length of the needles ranges from 0.8 - 1.5 μm and the width is between 40-60 nm giving an
average aspect ratio of 15. Figure 8.2 (c) shows powders produced by CS method. The shape of
the powders are also primarily needle-like but the particles are more agglomerated and thus the
size is larger than that produced by CP and SG/P powders due to high flame temperature
(>1500˚C) for a combustion reaction, which ranges from 1.5- 2 μm and the width is ~ 100 nm.
Unlike SG/P and CP powders, particle size produced by solid state reaction (SS) of the
constituent powders is around 5 μm as shown in Figure 8.2 (d).
Figure 8.3 (a) shows the PL emission spectra at 380 nm excitation of (Sr0.97Eu0.03)2SiO4
prepared by SG/P and CP method. The PL spectra consist of a weak broad blue band centered
around 460 nm and a broad green-yellow band centered around 566-573 nm depending on the
predominant phase of the powder. The emission peak and intensity were found to be dependent
on the activator concentration with x = 0.03 having the highest intensity [53, 114]. The 60% α
SG/P powder shows a blue-shifted emission peak with a higher emission intensity when
compared to the 90% α- CP powder. The inset in Figure 8.3 (a) shows an enlargement of the
emission peak of green-yellow band. Theoretical explanation of two emission bands of these
phosphors are currently under investigation. The excitation spectra of the green-yellow emission
of the 60% α and 90 % α powders are shown in Figure 8.3 (b). There are two peaks; the first
around 310 nm and the second around 380 nm. The drop in the excitation intensity between 380-
400 nm is only 6-7% in samples with 60% α compared with 18-20% for the 90% α. Furthermore,
the quantum efficiency (QE) of 60% α (75%) prepared by SG/P is higher than that of the 90% α

137
(44%) prepared by CP at 400 nm excitation. Thus, the luminous efficiency of Sr2SiO4:Eu2+
phosphors increases as the proportion of the β-phase increases under near-UV excitation.
Figure 8.4 shows the luminescence properties (λmax, I/Io, QE and fα) for the four different
synthesis methods. λmax is the maximum emission wavelength, I is the measured emission
intensity, Io is the maximum emission intensity (solid state synthesized powders) and fα is the
fraction of the -phase. The data for the CS powders is taken from [53]. There is a clear
correlation between the λmax and fα and an inverse correlation between I/Io or QE and fα. From this
plot, it is clear that producing more β powders is desirable to maximize emission intensity and
quantum efficiency. Furthermore, the powders prepared by SG/P method have more β powders
compared to that by CP and CS method so that the SG/P method produces luminescence
properties that are significantly better than the CP and CS powder. Although, the powders
prepared by SS method show highest emission intensity, the synthesis temperature is higher than
the other methods (1500°C). This results in larger particle (~5 µm) and crystallite size (~180 nm)
than the powders prepared by other methods, which have 0.8-1.5 µm particle size and ~ 80 nm
crystallite size. To reduce scattering and improve the external quantum efficiency, it is desirable
for UV LED applications for powders to have submicron sizes.

138
Figure 8.2. SEM micrographs of (Sr0.97Eu0.03)2SiO4 phosphors prepared by (a) co-precipitation method
(CP), which is predominant α-phase, (b) sol-gel/Pecini method (SG/P), which is the mixture of α +β phase
and (c) combustion method (CS), which is predominant α-phase and (d) solid state reaction method (SS),
which is predominant β-phase.
1 μm
2 μm 5 μm
(a) (b)
(d)
1 μm
(c)

139
Figure 8.3. (a) Photoluminescence emission spectra of (Sr0.97Eu0.03)2SiO4 prepared by sol-gel/Pechni
(SG/P) and co-precipitation (CP) method under 380 nm excitation. The excitation spectra (b) under green-
yellow band emission identified in (a).

140
Figure 8.4. Effect of synthesis method on the luminescence properties of (Sr0.97Eu0.03)SiO4; CS =
combustion synthesis, CP = co-precipitation, SG/P = sol gel/Pechini, SS = solid state, λmax = the maximum
emission wavelength, I = the emission intensity, Io = the maximum emission intensity, which is from the
solid state synthesized powders, QE = quantum efficiency, and f = the fraction of the -phase.

141
8.1.5. Conclusions
(Sr0.97Eu0.03)2SiO4 phosphors were prepared by two different methods: sol-gel/Pechini and
co-precipitation. There are two different crystal structures of (Sr1-xEux)2SiO4, α and β phase and
both have a needle-like shape ranging from 0.8 - 1.5 μm length and 40-60 nm in width. The
luminescence properties and particle size were compared with solid state reacted and combustion
synthesized powders. The emission spectra of the phosphors consist of weak blue broad band at
460 nm and strong broad band 543-573 nm. The green-yellow emission peaks are blue-shifted as
the β phase increases and the emission intensity with larger amounts of β-phase is higher than that
of mainly α-phase in the range of 370-410 nm excitation. The decrease in excitation intensity in
the range 370-410 nm is smaller with a higher fraction of β phase. Furthermore, the quantum
efficiency of 60% α powders prepared by sol-gel/Pechini is higher (75%) than that of the 90% α
powders (44%) prepared by co-precipitation under near-UV excitation. Thus, the sol-gel/Pechini
method with a larger amount of β-phase appears to be the best method to produce luminous
powders with high quantum efficiency and small particle size compared to co-precipitation,
combustion and solid state reaction methods.
8.1.6. Acknowledgements
This work is supported by the U.S. Department of Energy, Grant DE-EE0002003. This
chapter includes the material as it will appear in the Journal of Luminescence, Jinkyu Han, Mark.
E. Hannah, Alan Piquette, Gustavo Hirata, Jan B. Talbot, Kailash C. Mishra, Joanna McKittrick,
Vol 132, pp106-109 in 2012. The dissertation author was the primary author of this paper. All
sample synthesis and characterization were performed by the primary author, except the quantum
efficiency measurements, which was measured by Dr. Mark. E. Hannah at Osram Sylvania.

142
8.2. Morphology and particle size dependent luminescence properties of Y2O3:Eu3+
Depending on the chemical composition (e.g. oxides, silicates, tungstates), one method is
expected to be better than the others for controlling the particle size and distribution, morphology
and agglomeration. Figure.8.5 shows SEM images of nanophosphors of Y2O3:Eu3+
synthesized
by various methods.
The particle size and morphology are dependent on the synthetic methods. The particles
prepared by CP and SP are spherical and uniformly dispersed and the size is 100-150 nm for CP
and 200-600 nm for SP. In addition, the SG particles are nearly spherical and the size of the
particles is smaller (40-60 nm) than that by CP and SP and relatively dispersed. The particles
prepared by CS are much smaller than these particles (20-40 nm) but the particles are severely
agglomerated. On the other hand, the morphology is significantly different from those particles
when we employed the HT method. Most of the particles are not spherical but needle-like and the
needles are near 500 nm length with 40-50 width.
Different particle size and the morphology can affect the luminescence properties of the
phosphors due to different surface- volume ratio and crystallite size, which is critical for quantum
efficiency of the phosphors [9]. Figure 8.6 shows the PL spectra of those particles. No significant
difference in the position of the peaks between these spectra is observed, but the PL emission
intensity is highly dependent on the synthetic methods. The PL intensity of SG powders is highest
and that of SP powders is lowest. This can be explained by crystallite size of the powders. The
crystallite size of these powders is ~26 nm for SG, CP, and HT, ~18 nm for CS and ~13 nm for
SP. The smaller is crystallite size, the lower quantum efficiency and PL intensity is. Though the
particle size of SP powders is larger than that of SG powders, PL intensity of SG powders is
much higher than that of SP powders because of larger crystallite size of SG powders indicating
the crystallite size is more critical than particle size in terms of PL intensity. In addition, the PL
intensity of HT is smaller than that of SG and CP even though the crystallite size of those

143
powders is same. This indicates powders with spherical particle morphology are better than that
with needlelike morphology in terms of luminescence properties such as quantum efficiency and
PL intensity.
Different particle size and the morphology can affect the luminescence properties of the
phosphors due to different surface- volume ratio and crystallite size, which is critical for quantum
efficiency of the phosphors [Han, review]. Figure 8.6 shows the PL spectra of those particles. No
significant difference in the position of the peaks between these spectra is observed, but the PL
emission intensity is highly dependent on the synthetic methods. The PL intensity of SG powders
is highest and that of SP powders is lowest. This can be explained by crystallite size of the
powders. The crystallite size of these powders is ~26 nm for SG, CP, and HT, ~18 nm for CS and
~13 nm for SP. The smaller is crystallite size, the lower quantum efficiency and PL intensity is.
Though the particle size of SP powders is larger than that of SG powders, PL intensity of SG
powders is much higher than that of SP powders because of larger crystallite size of SG powders
indicating the crystallite size is more critical than particle size in terms of PL intensity. In
addition, the PL intensity of HT is smaller than that of SG and CP even though the crystallite size
of those powders is same. This indicates powders with spherical particle morphology are better
than that with needlelike morphology in terms of luminescence properties such as quantum
efficiency and PL intensity.
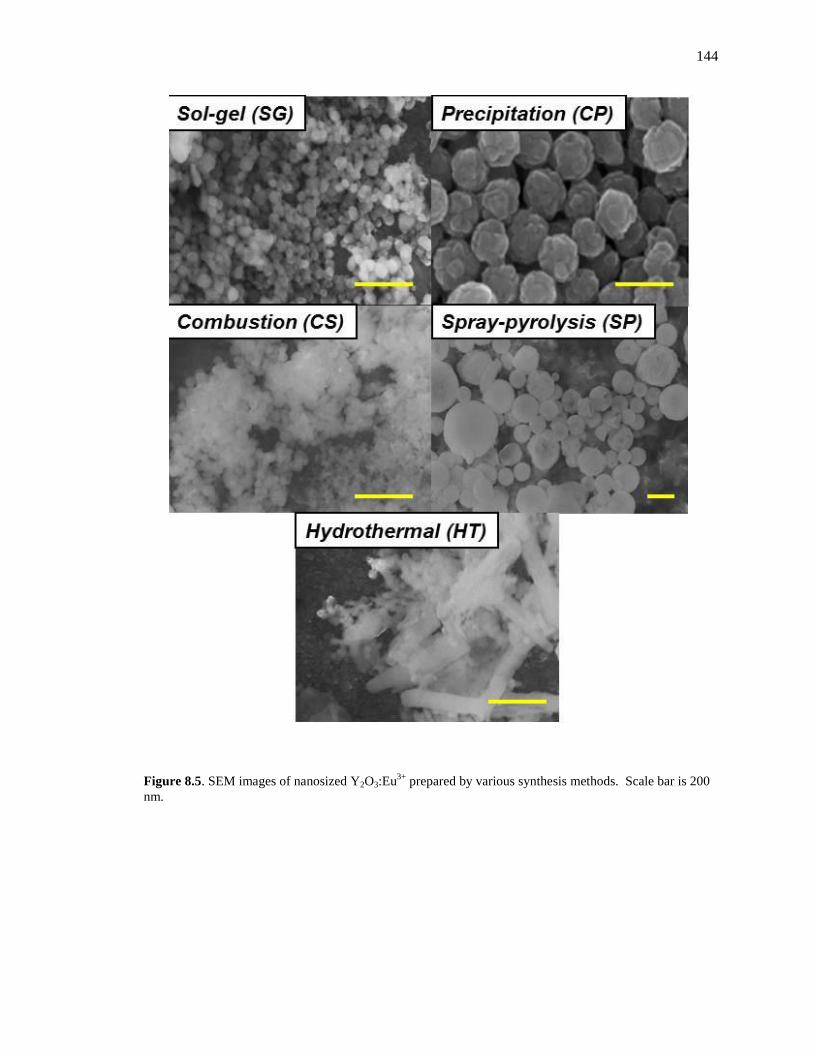
144
Figure 8.5. SEM images of nanosized Y2O3:Eu3+
prepared by various synthesis methods. Scale bar is 200
nm.

145
Figure 8.6. PL spectra of Y2O3:Eu3+
prepared by various synthetic methods (SG = sol-gel, CS =
combustion, CP = co-precipitation, HT = hydrothermal, SP = spray-pyrolysis)
146
Chapter 9. Luminescence output improvements of nano- and micron sized
phosphors by SiO2 coatings
9.1. Luminescence enhancement of Y2O3:Eu3+
and Y2SiO5:Ce3+
,Tb3+
core particles with SiO2
shells
9.1.1. Abstract
This paper reports on the luminescence and microstructural features of oxide nano-
crystalline (Y2O3:Eu3+
) and submicron-sized (Y2SiO5:Ce3+
,Tb3+
) phosphor cores, produced by
two different synthesis techniques, and subsequently coated by an inert shell of SiO2 using a sol-
gel process. As the shells mitigate the detrimental effect of the phosphor particle surfaces on
luminescence, thereby the luminous output was increased by 20-90%, depending on the core
composition and shell thickness. For Y2O3:Eu3+
, uniformly shaped, narrow particle size
distribution core/shell particles were successfully fabricated. The photoluminescence emission
intensity of core nanoparticles increased with increasing Eu3+
activator concentration and the
luminescence emission intensity of the core/shell particles were 20-50% higher than that of the
core particles alone. For Y2SiO5:Ce3+
,Tb3+
, the core/shell particles showed enhancement of the
luminescence emission intensity of 35-90% that of the core particles, depending on the SiO2 shell
thickness.
9.1.2. Introduction
Nanoparticles are a topic of extensive research due to their unique applications in many
areas, especially in the area of luminescence (i.e., nanophosphors) [180-182]. Among the
numerous nanophosphors, europium-doped yttrium oxide (Y2O3:Eu3+
, (Y1-xEux)2O3) has been
widely used as a red- phosphor in fluorescent lamps, high resolution projection devices and
displays, such as cathode ray tubes, plasma display panels and field emission displays [10, 183].
Y2O3:Eu3+
nanophosphors have been prepared by various methods, such as sol–gel techniques

147
[184], homogeneous precipitation [185], spray pyrolysis [186], laser-heated evaporation [187],
microemulsion [188], combustion synthesis [189], and flame spray pyrolysis [125]. The sol-gel
method, especially the Pechini method, is a relatively easy technique that controls the size and
distribution of phosphor particles [190, 191].
The quantum efficiency of nanophosphors decreases mainly due to their larger specific
surface area. Numerous surface defects, such as lattice distortions, adsorbed impurities and
dangling bonds are present, which has been shown to significantly degrade the luminescence
properties of Eu3+
-doped nanoparticles [192]. To alleviate these problems, core-shell structured
nanoparticles have been used to stabilize the surface of the nanoparticles [193]. These processes
could be suppressed if one were able to grow a shell of an inert material around each doped
nanoparticle, that is, a shell made up of a material through which energy cannot be transferred.
The idea of surface modification arose from semiconductor nanocrystal research to improve
quantum efficiency by inhibiting energy transfer loss at the surface [194, 195]. Recently, this
concept has been extended to rare-earth-doped inorganic luminescent materials, such as
CePO4:Tb3+
core particles with a surrounding shells of LaPO4, (Ce, Tb =
20%)PO4·xH2O/LaPO4·xH2O (x = 0.7) and LaPO4:Eu3+
/ LaPO4 core/shell particles [196, 197].
These results indicate that photoluminescence intensity was about two times higher for the
CePO4:Tb3+
core / LaPO4 shell materials than for the bare cores, indicating that this concept could
be extended to other luminescent core/inert shell nanoparticles. Moreover, the preparation of
core/shell particles using SiO2 as the shell by the Stöber method [198] is widely used for metal
and iron oxide nanoparticles [199, 200], since silica can be easily and controllably deposited.
Several groups have fabricated core/shell nanophosphors with a SiO2 core with the nanophosphor
deposited as the shell [201]. Although this method has shown spherically shaped core/shell
particles with a narrow size distribution and no agglomeration, the surface of the phosphor layer
is still a region of atomic disorder and thus, of luminescence quenching.
148
We have previously reported the enhancement of luminescence intensity of Y2O3:Eu3+
nanophosphors coated by SiO2 [202]. This paper focused on the synthesis and characterization of
Y2O3:Eu3+
nanophosphors and SiO2 shells. In the present work, the luminescence properties are
examined in more detail, the morphology of core/SiO2 shell particles are reported and the effect
of the SiO2 shells on the luminescence properties of core particles, nanocrystalline Y2O3:Eu3+
are
investigated.
9.1.3. Experimental
The starting materials were Y(NO3)3·6H2O (99.8%, Sigma Aldrich), Eu2O3 (99.999%,
Alfa Aesar), citric acid (C6H8O7·H2O, EMD), ethylene glycol (C2H6OH, Fischer Scientific),
polyethylene glycol (PEG, (C2H4O)nH2O, molecular weight = 20,000, Sigma Aldrich), nitric acid
(68 – 70%, EM Science), tetra-ethoxysilane (TEOS, 99.9%, Sigma Aldrich) and NH4OH (28 –
70%, EMD).
Preparation of (Y1-xEux)2O3 (x = 0.01, 0.03, 0.05) core particles
Y2O3:Eu3+
particles were prepared by a Pechini sol-gel process: 7.66 g Y(NO3)3·6H2O
and Eu2O3 (molar ratio Eu/Y = 0.01, 0.03, 0.05) were dissolved in a nitric acid solution (volume
ratio of water and nitric acid = 1:1) to form an aqueous solution. Subsequently, 4.2 g citric acid
(CA), which acted as chelating agent for metal ions, and 2.23 ml ethylene glycol (EG) were
introduced (molar ratio of metal: CA: EG = 1:1:2). Subsequently, 5 g polyethylene glycol (PEG)
as a cross-linking agent was added into the aqueous solution. The concentration of PEG was 0.05
g/ml. The solution was then continuously stirred for 10h at 80°C to form a transparent gel. The
gel was preheated at 300°C for 1h, and then annealed at 800°C for 1h in a furnace in air to
remove organic materials and to obtain the nanophosphor powders.
Preparation of Y2SiO5:Ce3+
,Tb3+
core particles

149
Powders of Y2SiO5:Ce3+
0.0075, Tb3+
0.04 were produced via combustion synthesis.
Combustion synthesis involves a highly exothermic reaction between metal nitrates and an
organic fuel. A detailed explanation of the reaction and procedure for producing this phosphor
can be found in Bosze et al.[203]. The as-synthesized powder was annealed at 1350°C for 1 h to
improve the luminescence emission and produce powders with the high temperature X2–Y2SiO5
phase, as determined by X-ray diffraction.
Fabrication of the SiO2 shells
The silica shells were prepared by hydrolysis of TEOS in an alcohol solvent in the
presence of water and ammonia by the Stöber process [198]. First, 1 g of the core particles was
added into 30 ml 1-propanol. The mixture was agitated using ultrasonification for 1.5h to disperse
the core particles. Then 0.5 ml of deionized water and 0.4 ml NH4OH were added into the
solution followed by an addition of 0.1 ml TEOS. The ratio between the concentrations of core
particles and reagents (H2O, NH4OH and TEOS) was chosen to avoid self-nucleation of silica and
thus, the formation of core-free silica spheres. The reaction was allowed to continue in the
ultrasonicator to obtain more dispersed core and uniform SiO2 coating on the core. In order to
prevent heating of the solution and to better disperse the nanoparticles, ice was frequently added
into ultrasonification bath and the bath temperature is fixed at 20°C. The reaction products were
centrifugally separated from the suspension and rinsed with ethanol four times.
Characterization
The particle morphology and size were inspected using a field emission scanning electron
microscope (FESEM, XL30, Philips) and a transmission electron microscope (JEOL-2010)
operated at 200KV accelerating voltage. The crystalline phases were identified by X-ray
diffraction (XRD). The particle size was also measured using a particle size analyzer
(Brookhaven Instrument). Photoluminescence (PL) measurements were taken using a Jobin-Yvon
Triax 180 monochromator and SpectrumOne charge-coupled device detection system, which was
150
shared with the PL system that uses a 450 W Xe lamp as the excitation source. The core and
core/shell particles were stored in the form of suspension in ethanol and each mixture has
identical core particle densities (0.033 g/ml) since the quantity of core particles (1 g) before
depositing the shells is the same as after depositing the shells. After 1h sonification, 2 ml of the
core and core/shell suspensions was removed for PL spectroscopy. Particle sizing measurements
were performed at 25°C using a Zeta Plus Particle Analyzer (Brookhaven Instruments Corp.,
Holtsville, NY)
9.1.4. Results and discussion
Figure 9.1 shows the XRD patterns of (Y0.95Eu0.05)2O3 core particles and they matches
well with JCPDS 41-1105 and confirm our samples as of a cubic structure with Ia3 space group.
No purity assessment can be determined from the XRD analysis in view of the technique‘s
detection limits.
The morphology and size of the (Y0.95Eu0.05)2O3 core and (Y0.95Eu0.05)2O3
core/SiO2 shell
particles with different SiO2 shell thickness are shown in the SEM images in Figure 9.2 (a)-(d).
The deposition of SiO2 shells on Y2O3:Eu3+
core particles involved the base catalyzed hydrolysis
of TEOS and condensation of SiO2 onto the surfaces of the core particles. There are several
parameters, such as the concentrations of ammonia catalyst, water and TEOS, which can be
employed to control the thickness of the SiO2 shell. In this work, we adjusted the shell thickness
by changing deposition time. Figure 9.2(a) shows SEM images of the (Y0.95Eu0.05)2O3 core
particles and Figure 9 2(b)-(d) shell particles with 1h, 2h and 5h deposition time, respectively.
Note that the shell thickness is increasing with increasing the deposition time. To examine the
thickness of SiO2 shells more in detail, TEM micrographs of (Y0.95Eu0.05)2O3 core particles and
core/SiO2 shell particles with 1h, 2h and 5h deposition time are shown in Figure 9.3(a)-(d). The
size of single core particle is ~40 nm as shown in Figure 9.3(a) although the particles are not
151
mono-dispersed but agglomerated. The thickness of silica is approximately 15-20 nm for a 1h
deposition, 25-30 nm for a 2h deposition and 45-50 nm for a 5h deposition as shown in Figure
9.3(b)-(d). The inset in Figure 9.3(b) shows high magnification images of core/SiO2 shell particle
for 1h coating time. The thickness of SiO2 shells obtained by TEM images in Figure 9.3(b)-(d) is
corresponded with that obtained by SEM micrographs as shown in Figure 9.2(b)-(d). The
morphology of the core/shell particles is not perfectly spherical, and multiple core particles
aggregated and then were coated. However as the thickness of the SiO2 shells increased, the
core/shell particles became more monodispersed. (Figure 9.2(d) and 9.3(d)). By decreasing the
concentration of core particle in the mixture and using longer time in the sonicator it may be
possible to prevent agglomeration [199].
Histograms of the particle diameter of (Y0.95Eu0.05)2O3 core and (Y0.95Eu0.05)2O3 core/shell
particles with 1h, 2h and 5h deposition times obtained from a particle size analyzer are shown in
Figure 9.4(a)-(d). Although the particle size distribution of core particle is slightly deviated from
the SEM and TEM micrographs because of the aggregates of single core particles, the size
distribution of core/shell particles are good agreement with the SEM and TEM micrographs.

152
Figure 9.1. XRD patterns of (Y0.95Eu0.05)2O3 core particles

153
Figure 9.2. SEM micrographs of (a) (Y0.95Eu0.05)2O3 core and core/SiO2 shell particles for (b) 1h coating
time and (c) 2h coating time and (d) 5h coating time.
(a) (b)
(c) (d)
100 nm 100 nm
100 nm 100 nm
(a)

154
Figure 9.3. TEM micrographs of (a) (Y0.95Eu0.05)2O3 core and core/SiO2 shell particles for (b) 1h coating
time and (c) 2h coating time and (d) 5h coating time.
(a) (b)
(c) (d)

155
Figure 9.4. Histograms of the particle diameter of (a) (Y0.95Eu0.05)2O3 core and (Y0.95Eu0.05)2O3 core/shell
particles for (b) 1h coating time and (c) 2h coating time and (d) 5h coating time.
40 60 80 100 120 140 160 1800
20
40
60
80
100
Inte
nsity
Particle size (nm)
40 60 80 100 120 140 160 1800
20
40
60
80
100
Inte
nsity
Particle size (nm)
40 60 80 100 120 140 160 1800
20
40
60
80
100
Inte
nsity
Particle size (nm)
40 60 80 100 120 140 160 1800
20
40
60
80
100
In
ten
sity
Particle Size (nm)
(a) (b)
(c) (d)

156
The emission spectra of (Y1-xEux)2O3 core particles with different activator concentrations
are shown in Figure 9.5. The emission spectra are also composed of 5D0-
7Fj (j = 0, 1, 2, 3)
emission lines of Eu3+
, dominated by the strongest red emission 5D0-
7F2 transition of Eu
3+ at 611
nm. The PL intensity increases with higher Eu3+
concentration in the range of 1-5 at%. Higher
Eu3+
concentrations are known to increase the luminescent intensity in a relatively small activator
concentration range of 1-10 at% [204].
The luminescence spectra of (Y0.95Eu0.05)2O3 core particles and core (Y0.95Eu0.05)2O3/ shell
(SiO2) particles with shell thicknesses of 15-20 nm , 25-30 nm 45-50 nm are shown in Figure 9.6
at an excitation wavelength of 254 nm. Inset figure shows normalized integrated PL intensity,
which is divided by intensity of core particle as a function of shell thickness. The PL
measurements of both the core and core/shell particles show strong red emission peaks at 611 nm
(5D0→
7F2) and the crystal field splitting of Eu
3+
5D0-
7F1, 2 transitions can be seen clearly, which
implies that the (Y0.95Eu0.05)2O3 core particles are well crystallized.
No significant difference in the position of the peaks between these spectra is observed,
but the PL emission intensity of core/shell particle is ~20% higher for a shell thickness of 45-50
nm and 50% higher for a shell thickness of 15-20 nm over that of the bare core particles. This
indicates that the inert shells play a significant role in reducing the surface defects, which cause
luminescence quenching in the submicron size, which has been observed with CePO4:Tb3+
/LaPO4
core/shell and LaF3:Ce3+
,Tb3+
/LaF3 nanoparticles [196, 205].

157
540 560 580 600 620 640 660 6800
5000
10000
15000
20000
25000
PL
In
ten
sity (
a.u
)
Wavelength (nm)
Eu at 1%
Eu at 3%
Eu at 5%
Figure 9.5. Effect of Eu3+
concentration on the photoluminescence intensity.
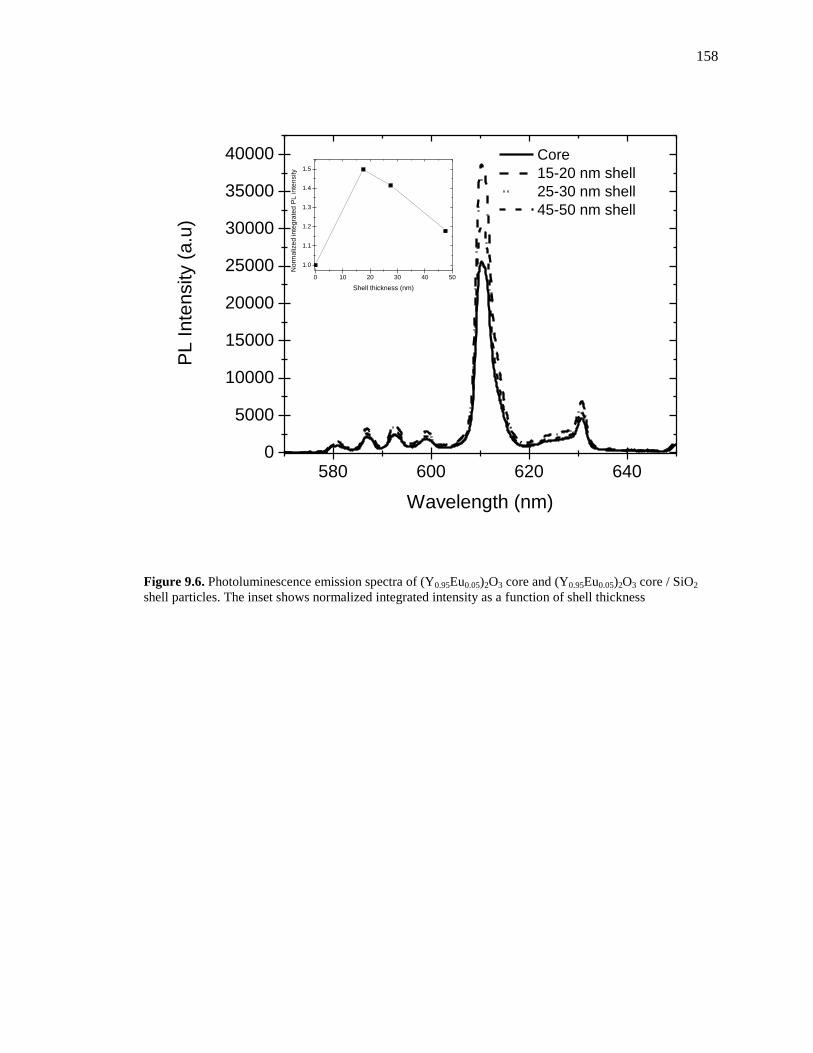
158
580 600 620 6400
5000
10000
15000
20000
25000
30000
35000
40000
PL
In
ten
sity (
a.u
)
Wavelength (nm)
Core
15-20 nm shell
25-30 nm shell
45-50 nm shell
Figure 9.6. Photoluminescence emission spectra of (Y0.95Eu0.05)2O3 core and (Y0.95Eu0.05)2O3 core / SiO2
shell particles. The inset shows normalized integrated intensity as a function of shell thickness
0 10 20 30 40 50
1.0
1.1
1.2
1.3
1.4
1.5
No
rma
lize
d in
teg
rate
d P
L in
ten
sity
Shell thickness (nm)

159
In evaluating the reflectivity of UV light (λex = 254 nm) from a particle surface, the
indices of refraction must be considered: ethanol (suspension medium) (n ≈ 1.367), SiO2 (n ≈
1.505), and Y2O3 (n ≈ 2.162) [206]. Scattering of the excitation light will be reduced when the
index of refraction of the suspension media is near that of the particle, or index of refraction of
the shells is between that of the suspension media and core particle. Using Fresnel‘s equation and
letting the incident and refracted ray angle at the surface = 0,
2
1 2
1 2
n nR
n n
(9)
where R is reflection coefficient, n1 and n2 are refractive indices of each medium [206].
The reflectivity of UV between ethanol and Y2O3:Eu3+
is 5.1% while the total reflectivity of
ethanol-SiO2 and SiO2-Y2O3:Eu3+
is 3.4%. Therefore, more photons are transmitted into the
Y2O3:Eu3+
particles by virtue of the SiO2 coating [207], and thus the PL emission intensity is
increased. Compared to other well-known inert coating such as TiO2 (n = 2.35) [208], the PL
intensity of core/TiO2 shell would be reduced because the total reflectivity of core/shell particles
(7%) is much larger than that of the core particles (5.1%). Therefore, coating SiO2 on the core
particles is an optimal material to increase PL emission intensity. Although our measurements
were performed in ethanol (n ≈ 1.367), the reduction in scattering of incident photons should be
more pronounced if measured in air (n ≈ 1),
The luminescence intensity of core/shell particles decreases with thicker shells. This is
likely due to the absorption of light by SiO2 shells at a higher ratio of thickness of shell to core
particle diameter. By the Beer-Lambert law:
exp( )oI I x (10)
160
where I is the measured intensity of the transmitted light through a layer of material with
thickness x , I0 is incident intensity and α is absorption coefficient), the measured intensity is
inversely proportional to the thickness of the material through which the light is transmitted.
Thus, as the SiO2 shell thickness increases, more photons are absorbed in the SiO2 shell, resulting
in a decrease of luminescence intensity, which would eventually become lower than the bare core
particles if thick enough.
In order to investigate the effect of a SiO2 coating on micron sized phosphors, white-
emitting Y2SiO5:Ce3+
,Tb3+
particles were prepared by combustion synthesis and then coated with
SiO2 by the same method as described above. SEM images of Y2SiO5:Ce3+
,Tb3+
cores with
different silica shell thicknesses are shown in Figure 9.7(a) and (b). In this case, the SiO2
thickness was controlled by the concentration of H2O and NH4OH in the 1-propanol solution,
instead of lengthening the deposition time, because SiO2 self-nucleation is more dependent on the
concentration of reagents (H2O, NH4OH and TEOS) than deposition time. Figure 9.7(a) shows
Y2SiO5:Ce3+
,Tb3+
particles with the SiO2 shell prepared by adding 0.5 ml H2O, 0.5 ml NH4OH
and 0.05 ml TEOS for 1h in a 50 ml 1-propanol solution. The size of the core particles is ~ 1 µm
and the SiO2 shell thickness of ranged from 25-30 nm. Figure 9.7(b) displays core/shell particles
synthesized by adding 1ml H2O, 1ml NH4OH and 0.05 ml TEOS for 1h in a 50 ml 1-propanol
solution to deposit SiO2 shells on the core particles. The SiO2 shell thickness ranged from 80-90
nm, much thicker than that prepared by smaller concentration of H2O and NH4OH.
Luminescence spectra of Y2SiO5:Ce3+
0.0075, Tb3+
0.04 cores and Y2SiO5:Ce3+
0.0075, Tb3+
0.04
core / SiO2 shells at an excitation wavelength of 380 nm are shown in Figure.9.8. The spectra
consist of two emission bands at 440 and 490 nm, which are assigned to the Y2SiO5:Ce3+
transitions from the level 5d to the levels 2Fj (j=5/2, 7/2) and Y2SiO5:Tb
3+ has an intense and well-
defined green emission peak located at 544 nm (5D4 →
7F5). The inset figure shows normalized
integrated PL intensity as a function of shell thickness. No differences in position of the peaks

161
between these spectra are detected, but the PL emission intensity of the Y2SiO5:Ce3+
0.0075, Tb3+
0.04
core particles with 25-30 nm and 80-90 nm SiO2 shell is 90% and 35% higher than that of core
only particles, respectively. This is an unexpected result in that even for micron-sized powders,
the surface effects were mitigated by an inert shell. In the case of the thicker SiO2 shell (80-90
nm), the luminescence intensity of Y2SiO5:Ce3+
0.0075, Tb3+
0.04 core/SiO2 shell particles is lower
than the core/shell particles with a thinner shell thickness (25-30 nm).

162
Figure 9.7. SEM micrographs of Y2SiO5:Ce3+
,Tb3+
core / SiO2 shell particles with different concentration
of reagents to deposit SiO2 shells. (a) 0.5 ml H2O, 0.5 ml NH4OH and 0.05 ml TEOS and (b) 1 ml H2O and
1ml NH4OH and 0.05 ml TEOS in 50 ml 1-propanol solution.
1 μm
1 μm
(a)
(b)

163
450 500 550 600 6500
5000
10000
15000
P
L I
nte
nsity (
a.u
)
Wavelength (nm)
Y2SiO
5:Ce,Tb particles
with 25-30 nm silica shell
with 80-90 nm silica shell
Figure 9 8. Photoluminescence emission spectra of Y2SiO5:Ce3+
,Tb3+
core and Y2SiO5:Ce3+
,Tb3+
core /
SiO2 shell particles. The inset shows normalized integrated intensity as a function of shell thickness.
0 20 40 60 80 100
1.0
1.2
1.4
1.6
1.8
2.0
No
rma
lize
d in
teg
rate
d in
ten
sity
Shell thickness (nm)
164
9.1.5. Conclusions
Y2O3:Eu3+
nanophosphor cores (~40 nm) were prepared by the Pechini method and
subsequently coated with SiO2 shells by the Stöber process. SEM images show that 15-50 nm
shells of SiO2 were homogenously coated onto the nanophosphors, with the thickness controlled
by the deposition time. Core/shell particles show significant enhancement of the luminescence
emission intensity over that of the core only particles. The luminescence intensity with thinner
SiO2 shells (15-20 nm) was greater compared with thicker shells (25-50 nm). Additionally,
coating SiO2 on submicron-sized Y2SiO5:Ce3+
,Tb3+
cores (~1 µm) produced by combustion
synthesis resulted in a photoluminescence intensity that was 90% higher than that of the core only
particles for a shell thickness of 25-30 nm. Thicker shells (80-90 nm) increased the luminescence
intensity to 35% of the core only particles.
9.1.6. Acknowledgements
This work is supported by the U.S. Department of Energy, Grant DE-EE002003 and the
excellent TEM analysis was performed by Francisco Ruiz at CNYN-UNAM. This chapter, in full,
includes the material as it appeared in the Material Science Engineering B, Jinkyu Han, Gustavo
Hirata, Jan B. Talbot, Joanna McKittrick, Vol 176, pp436-431 in 2011. The dissertation author
was the primary author of this paper. All sample synthesis and characterization were performed
by the primary author.

165
9.2. Synthesis and luminescence characterization of white emitting X1-and X2
Y2SiO5:Ce3+
,Tb3+
core/SiO2 shell nanophosphors
9.2.1. Introduction
A well-known blue-emitting phosphor, cerium-activated yttrium silicate, (Y1-xCex)2SiO5,
can be efficiently excited at 358 nm with the main emission occurring around 400 nm, giving a
small Stokes shift [142]. Yttrium silicate is isostructural with the monoclinic rare-earth (RE)
oxyorthosilicates, RE2(SiO4)O, which crystallize into two different structures, denoted X1 and X2.
X1 crystallizes with the space group P21/c. X2 crystallizes with the space group C2/c. X1, the low-
temperature polymorph, forms at temperatures less than 1190˚C while X2, the high-temperature
polymorph, forms at temperatures above 1190˚C [209]. The most efficient and saturated blue
emission comes from the X2-phase, but has a spectral tail extending as far as 600 nm, which
causes the emission to appear as a washed-out blue, or blue–white [203]. White-emission has
been achieved by co-activating with Tb3+
with an optimal white-emitting composition identified
as (Y0.9625Ce0.0075Tb0.03)2SiO5 [210]. Thus, this is a promising phosphor for obtaining white-
emission from UV light emitting diodes.
We have previously reported that the enhancement of luminescence intensity of
Y2O3:Eu3+
nanophosphors coated by SiO2 [202, 211]. Guided by this previous work, we report on
the physical and luminescence properties of Y2SiO5:Ce3+
,Tb3+
core/SiO2 shells particles The
properties of core–shell nanophosphors of the composition have not been reported in the
literature.
9.2.2. Experimental
Preparation of (Y0.9625Ce0.0075Tb0.03)2SiO5 core particles
(Y0.9625Ce0.0075Tb0.03)2SiO5 phosphor samples were prepared by a sol-gel/Pechini process.
First, silica sols were prepared by hydrolysis and condensation reaction of tetraethylorthosilicate

166
(TEOS). TEOS (2.18 ml) was added to ethanol (20 ml) and the resultant solution was stirred for
30 min. A molar equivalent of Y(NO3)3·6H2O with respect to SiO2, 0.032g Ce(NO3)3·6H2O,
0.174g and Tb(NO3)3·5H2O were dissolved in a nitric acid solution (volume ratio of water and
nitric acid = 100:1) to form an aqueous solution. Then the required amount of silica sol was
added to the yttrium nitrate solution under stirring. Subsequently, 4.2 g citric acid (CA), which
acted as chelating agent for metal ions, and 2.23 ml ethylene glycol (EG) were introduced (molar
ratio of Metal, CA and EG= 1:1:2). This was followed by adding 5 g of polyethylene glycol
(PEG) as a cross-linking agent into the aqueous solution. The mixture was stirred to achieve
uniformity, while the pH was regulated by ammonia (pH = 4~6). After warming by a water-bath
to 60°C for 8 h, the solution hydrolyzed to a sol and then to a gel. The gel was preheated to
evaporate the organic materials, alcohol and water at 350°C for 1h, was then was ground to a
powder, and finally calcined at 1100°C (X1-phase) or 1300°C (X2-phase) for 1h in a furnace and
to obtain nanophosphors.
Synthesis of silica shells on the core particles
The silica shells were prepared by hydrolysis of TEOS in an alcohol solvent in the
presence of water and ammonia by the Stöber process [198]. First, 0.025 g of the core particles
were added into a 50 ml 1-propanol. The mixture was agitated using ultrasonification for 1h to
disperse the core particles Then deionized water and NH4OH were added into the solution
followed by an addition of 0.07 ml TEOS. The ratio between the concentrations of core particles
and reagent of H2O, NH4OH and TEOS were chosen to avoid self-nucleation of silica and thus
the formation of core-free silica spheres. The reaction was allowed to continue in an
ultrasonicator to obtain more dispersed cores and a uniform SiO2 coating on the core. In order to
prevent heating of the solution and to better disperse the nanoparticles, ice was frequently added
into ultrasonification bath and the bath temperature is fixed at 20°C. The reaction products were

167
centrifugally separated from the suspension and rinsed with 1-propanol two times and water two
times.
Characterization
The particle morphology and size were inspected using a field emission scanning electron
microscope (FESEM, XL30, Philips). The crystalline phases were identified by X-ray diffraction
(XRD). Photoluminescence (PL) measurements were taken using a Jobin-Yvon Triax 180
monochromator and SpectrumOne charge-coupled device detection system, which was shared
with the PL system that uses a 450 W Xe lamp as the excitation source. The core and core/shell
particles were stored in the form of suspension in ethanol and each mixture has identical core
particle densities (5.0×10⁻⁴
g/ml) since the quantity of core particles (0.025 g) before depositing
the shells is the same as after depositing the shells. After sonification for 0.5h to 2h, 2 ml of the
core and core/shell suspensions was removed for PL spectroscopy.
9.2.3. Results and discussion
XRD spectra in Figure 9.9 (a) show that the Y2SiO5:Ce3+
, Tb3+
annealed at 1100°C for 1h
samples have an X1-type crystal structure, which was confirmed by comparing with the diffraction
data of JCPDS card 21-1456. Figure 9.9 (b) shows that after annealing at 1300°C for 1 h, the X1-
type Y2SiO5:Ce3+
, Tb3+
samples transform to X2-type.
SEM images of X1- and X2-core/ SiO2 shell particles with different SiO2 shell thickness
are shown in Figure. 9.10 (a)-(c). Figure 9.10 (a) shows SEM images of the X1-phase core/shell
particles. The size of core particle is 130 to 150 nm and some of the core particles are aggregates
of two or three single core particles. Figure 9.10 (b)-(c) shows SEM images of the X1-cores/SiO2
shell particles with different coating time. The thickness of silica is about 15-30 nm for 30 min
and 40-60 nm for a 1h coating time. The inset in Figure 9.10(b) shows high magnification images
of core/SiO2 shell particle for 30 min coating time.

168
Figure 9.9. XRD patterns of (a) X1- and (b) X2- (Y0.9625Ce0.0075Tb0.03)2SiO5 core particles

169
Figure 9.10. SEM micrographs of (a) X1-(Y0.9625Ce0.0075Tb0.03)2SiO5 core and core/SiO2 shell particles for
(b) 0.5h coating time and (c) 1h coating time.

170
Figure 9.11 (a) and (b) show the SEM images of X2-cores and X2-core/ SiO2 shell
particles, respectively. The size of core particles are 300-500 nm and the core particles are more
agglomerated than X1-phase. The size of X2 cores are 2~3 times larger than the X1-phase. The
severe agglomeration of X2 cores is mainly due to higher temperature synthesis compared with
the preparation of the X1-cores. In Figure 9.11 (b), the thickness of silica shell is shown to be 70-
90 nm for 2h coating. The morphology of the X1 and X2 core/shell particles is not perfectly
spherical, and multiple core particles aggregated and then were coated. However as the thickness
of the SiO2 shells increased, the core/shell particles became more monodispersed (Figure 9.11
(b)). Note that as the SiO2 thickness increases to 70-90 nm, the core particles become better
dispersed so that the agglomeration aggregates of core particles (~2-3) in core/shell particles are
smaller than those of core-only particles (~4-5), as shown in Figure 9.11 (a) and (b).
The PL emission spectra of X1-core particles in Figure 9.12 (a) consist of a emission band
at 490 nm, which are assigned to the Y2SiO5:Ce3+
transitions from the level 5d to the levels 2Fj
(j=7/2). Y2SiO5:Tb3+
has an intense, well-defined green emission peak located at λem = 544 nm
(5D4 →
7F5) [210]. The spectra of X2-core particles in Figure 9.12 (b) is similar to X1-phase, but
the peak positions of X2-phase are slightly different from that of X1-phase. In X2-phase, the peak
at around 547 nm is more pronounced than that in X1-phase, as shown in the insets in Figure 9.12
(a) and (b), and some of main peaks in the X1-pahse (λem = 490, 590 nm) of the emission spectrum
are split to 486 and 500 nm, 584 and 596 nm, respectively, in the X2-phase. However, there is not
much difference in the emission intensity between both phases.

171
Figure 9.11. SEM micrographs of (a) X2-(Y0.9625Ce0.0075Tb0.03)2SiO5
core and core/SiO2 shell particles for
(b) 2h coating time.

172
Figure 9.12. Photoluminescence emission spectra of (a) X1-(Y0.9625Ce0.0075Tb0.03)2SiO5 core, and X1-
Y2SiO5:Ce3+
,Tb3+
core / SiO2 shell particles and (b) X2-(Y0.9625Ce0.0075Tb0.03)2SiO5 core and core/shell
particles. The insets shows the enlargement of PL emission spectra around 545 nm.
173
No differences in position of the peaks between the cores and core/shell particles for both
phases are detected. However, the PL emission intensity of X1-cores with 15-30 nm and 40-60 nm
SiO2 shell is more than 70% and 25% higher, respectively, than that of core only particles, as
shown in Figure 9.12 (a). Figure 9.12(b) shows X2-core/shell particles with 70-90 nm silica shells
demonstrates enhancement of the luminescence intensity by 20%. This implies that SiO2 inert
shells mitigate luminescence quenching caused by surface defects of nanoparticles. Additionally,
the reflectivity of UV light from the nanophosphor surfaces can be reduced by coating with SiO2.
In evaluating the reflectivity of UV light (λex = 365 nm) from a particle surface, the indices of
refraction must be considered: ethanol (suspension medium) (n ≈ 1.367), SiO2 (n ≈ 1.505), and
Y2SiO5 (n ≈ 1.79) [206]. Scattering of the excitation light will be reduced when the index of
refraction of the suspension media is near that of the particle, or the index of refraction of the
shells is between that of the suspension media and core particle. Using Fresnel‘s equation and
letting the incident and refracted ray angle at the surface = 0 from equation 10, the reflectivity of
UV between ethanol and Y2SiO5:Ce3+
,Tb3+
is 1.8 % while the total reflectivity of ethanol-SiO2
and SiO2-Y2SiO5:Ce3+
,Tb3+
is 0.98 %. Therefore, more photons are transmitted into the
Y2SiO5:Ce3+
,Tb3+
particles by virtue of the SiO2 coating, and thus the PL emission intensity is
increased. Compared to other well-known inert coating such as TiO2 (n = 2.35) and MgO (n
=1.77) [208], the PL intensity of core/TiO2 shell is reduced because the total reflectivity of
core/shell particles (8.8%) is much larger than that of the core particles (1.8%). In the case of
MgO shells, the total reflectivity of core/MgO shells is 1.65%, which is larger than that of
core/SiO2 shells (0.98%). Therefore, coating SiO2 on the core particles is an optimal material to
increase the PL emission intensity.
9.2.4. Conclusions
174
X1- and X2-(Y0.9625Ce0.0075Tb0.03)2SiO5
nanophosphor cores (~150 nm and 400 nm,
respectively) were prepared by the sol-gel/Pechini method and subsequently coated with SiO2
shells by the Stöber process. SEM images show that 15-90 nm shells of SiO2 were homogenously
coated onto the nanophosphors, with the thickness controlled by the deposition time. Core/shell
particles show significant enhancement of the luminescence emission intensity over that of the
core only particles. The luminescence intensity with thinner SiO2 shells (15-30 nm) and thicker
shells (25-50 nm) is 72% and 25% higher than that of bare X1-phase core particles. Additionally,
coating SiO2 on X2-phase cores resulted in a photoluminescence intensity that was 20% higher
than that of the core only particles for a shell thickness of 70-90 nm. Thus, the photoluminescence
properties of nanophosphors of X1- and X2-phases are enhanced by coating thin SiO2 shells and
have potential for UV-LED applications.
9.3. (Ba,Sr)2SiO4:Eu2+
nanophosphors
The core/inert shell approach has been extended to promising phosphors for nUV-LEDs
application. Figure 9.13 (a) shows SEM micrographs of the (Ba,Sr)2SiO4 core/SiO2 shell
phosphors – the bright cores (high atomic number) are surrounded by the darker (low atomic
number) shells [Han review]. The shells are uniformly coated on the core particle (prepared by
CP method with DMF (N,N-Dimethylformamide). The core diameter is ~ 150 nm and the shell
thickness is 20-35 nm. The emission intensity of the (Ba,Sr)2SiO4/SiO2 is 20% higher than the
bare core particles, as shown in Figure. 9.13(b). This indicates that the inert shells play a
significant role in reducing the surface defects that cause luminescence quenching in sub-micron
sized phosphors.

175
Figure 9.13. (a) SEM micrograph of (Ba,Sr)2SiO4:Eu
2+ core/SiO2 shell particles. The bright cores
surrounded by the darker shells. Scale bar = 200 nm. (b) Emission spectra of bare core and core/shell
particles.
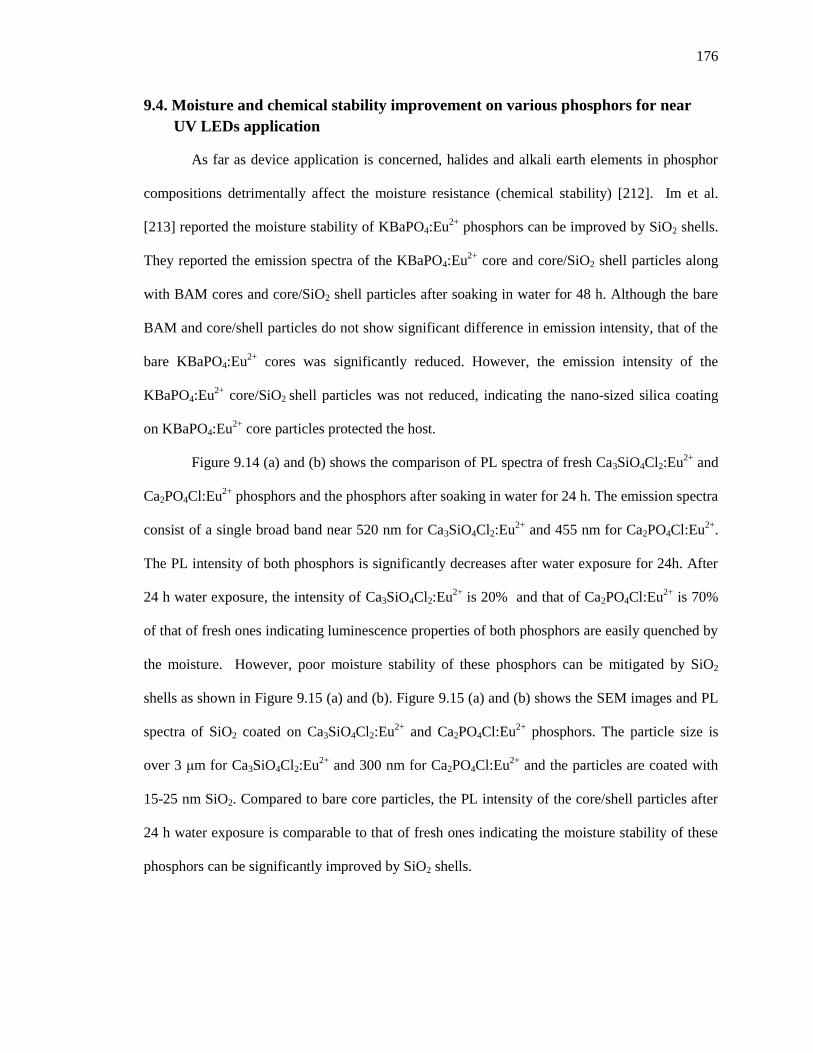
176
9.4. Moisture and chemical stability improvement on various phosphors for near
UV LEDs application
As far as device application is concerned, halides and alkali earth elements in phosphor
compositions detrimentally affect the moisture resistance (chemical stability) [212]. Im et al.
[213] reported the moisture stability of KBaPO4:Eu2+
phosphors can be improved by SiO2 shells.
They reported the emission spectra of the KBaPO4:Eu2+
core and core/SiO2 shell particles along
with BAM cores and core/SiO2 shell particles after soaking in water for 48 h. Although the bare
BAM and core/shell particles do not show significant difference in emission intensity, that of the
bare KBaPO4:Eu2+
cores was significantly reduced. However, the emission intensity of the
KBaPO4:Eu2+
core/SiO2 shell particles was not reduced, indicating the nano-sized silica coating
on KBaPO4:Eu2+
core particles protected the host.
Figure 9.14 (a) and (b) shows the comparison of PL spectra of fresh Ca3SiO4Cl2:Eu2+
and
Ca2PO4Cl:Eu2+
phosphors and the phosphors after soaking in water for 24 h. The emission spectra
consist of a single broad band near 520 nm for Ca3SiO4Cl2:Eu2+
and 455 nm for Ca2PO4Cl:Eu2+
.
The PL intensity of both phosphors is significantly decreases after water exposure for 24h. After
24 h water exposure, the intensity of Ca3SiO4Cl2:Eu2+
is 20% and that of Ca2PO4Cl:Eu2+
is 70%
of that of fresh ones indicating luminescence properties of both phosphors are easily quenched by
the moisture. However, poor moisture stability of these phosphors can be mitigated by SiO2
shells as shown in Figure 9.15 (a) and (b). Figure 9.15 (a) and (b) shows the SEM images and PL
spectra of SiO2 coated on Ca3SiO4Cl2:Eu2+
and Ca2PO4Cl:Eu2+
phosphors. The particle size is
over 3 μm for Ca3SiO4Cl2:Eu2+
and 300 nm for Ca2PO4Cl:Eu2+
and the particles are coated with
15-25 nm SiO2. Compared to bare core particles, the PL intensity of the core/shell particles after
24 h water exposure is comparable to that of fresh ones indicating the moisture stability of these
phosphors can be significantly improved by SiO2 shells.

177
Figure 9.14. The comparison of PL spectra of (a) fresh Ca3SiO4Cl2:Eu2+
and after soaking in water for 24 h
(b) fresh Ca2PO4Cl:Eu2+
phosphors and after soaking in water for 24 h.

178
Figure 9.15. The PL spectra of fresh Ca3SiO4Cl2:Eu2+
and Ca3SiO4Cl2:Eu2+
/SiO2 phosphors (b) fresh
Ca2PO4Cl:Eu2+
and Ca2PO4Cl:Eu2+
/SiO2 phosphors. The core/shell phosphors are measured after soaking in
water for 24 h.
179
Chapter 10. Conclusions and recommendation for future work.
The main objectives of this research focused on development of phosphors for near UV
LED based white light generation. Blue-emitting Li(Ca,Sr)PO4:Eu2+
, green/yellow-emitting
(Ba,Sr)2SiO4:Eu2+
, red-emitting Ba3MgSi2O8:Eu2+
, Mn2+
and color tunable solid solutions of
KSrPO4-(Ba,Sr)2SiO4 are found to be highly efficient phosphors for near UV LED based white
light in terms of strong absorption and good excitation profile in the near UV range, high
quantum efficiency and excellent thermal and moisture stability.
For blue-emitting phosphors, Eu2+
activated LiCaPO4 was prepared by a sol-gel method.
This synthesis method is both simple and fast for the production of a single phase powder
compared to typical solid state reactions. The phase purity of LiCaPO4:Eu2+
is dependent on the
activator concentration and annealing temperature. These phosphors are excited efficiently in the
range 280-410 nm and the photoluminescence emission spectra consist of a strong broad blue
band centered at ~470 nm. Furthermore, the quantum efficiency shows 73-88% depending on the
synthetic method.
For green-yellow-emitting phosphors, Eu2+
activated (Ba,Sr)2SiO4 show excellent
excitation profile in the near UV range and a strong broad green-yellow band centered at 510-580
nm with high quantum efficiency (~85-95%) depending on the ratio of Ba and Sr. The optimal
ratio of Ba/Sr is 3 in Ba2SiO4-Sr2SiO4 solid solution. These phosphors were prepared by four
different methods: sol-gel/Pechini, co-precipitation, solid state reaction and the combustion
method. There are two different crystal structures, α- and β-phases, and both have a needle-like
shape ranging from 0.8 - 1.5 μm length and 40-60 nm in width when sol-gel, co-precipitation
with water solvent and combustion method are employed. The emission spectra of the phosphors
consist of weak broad blue band at 460 nm and strong broad band 543-573 nm. The green-yellow
emission peaks are blue-shifted as the amount of the β-phase increases and the emission intensity

180
with larger amounts of β-phase is higher than that of mainly α-phase. Nano and submicron sized
particles with nearly spherical shape of Ba2SiO4:Eu2+
were prepared by a new co-precipitation
method using N,N Dimethylformamide as a solvent, instead of water. The average particle size
ranged from less than 100 nm to 500 nm and increased with increasing annealing temperature.
These powder properties can decrease scattering losses because of smaller and nearly spherical
particle and thus lead to improvement in the total efficacy of a near-UV LED based white light
device.
Eu2+
activated compositions of (KSrPO4)1-x•((Ba,Sr)2SiO4)x for 0 x 1 prepared by sol-
gel method show an ideal solid solution across the entire range and color tunable emission
properties depending on the x. The emission spectra consists of two distinct broad emission bands:
blue ( 430-470 nm) and green-yellow (515-570 nm). The ratio of emission intensity of blue to
green-yellow emitting bands increase with increasing x. The emission intensity of these solid
solutions are comparable to LiCaPO4:Eu2+
(quantum efficiency, QE = 81%). Thus, use of solid
solution compounds is a promising method to produce color tunable emitters for application in
white-emitting UV-LEDs.
Eu2+
and Mn2+
co-activated (Ba,Ca,Sr)3MgSi2O8 phosphors exhibits a red emission (620-
703 nm) depending on the relative concentrations of Ba, Ca and Sr. These phosphors are
prepared by combustion method with particle size ranging from 300 nm - 1 m, depending on the
metal ion concentration. The quantum efficiency of these phosphors without Mn2+
is over 70%
and that with Mn2+
is near 55% at 400 nm excitation.
The luminescence and structural properties of these phosphors are significantly affected
by synthetic techniques since these synthetic methods significantly influence the structure and
particle size and morphology of phosphors. For Sr2SiO4:Eu2+
, the sol-gel/Pechini method with a
larger amount of β-phase of Sr2SiO4 appears to be the best method to produce luminous powders
with high quantum efficiency (~80%) and small particle size compared to co-precipitation,

181
combustion and solid state reaction methods. For Ba2SiO4:Eu2+
, the co-precipitation method with
DMF as a solvent is be the best method to obtain ideal powders, which shows very uniform and
well-dispersed sub-micron sized (~200 nm) with high quantum efficiency (~90%) compared to
other methods.
The luminescence output and stability of phosphors can be improved by the fabrication of
luminescent core and SiO2 shell particles. 15-50 nm shells of SiO2 are homogenously coated onto
the nano or micron sized phosphors by Stӧber method with the thickness controlled by the
deposition time. The luminescence output of Y2O3:Eu3+
, Y2SiO5:Ce3+
,Tb3+
, (Ba,Sr)2SiO4:Eu2+
nanophosphors and Y2SiO5:Ce3+
,Tb3+
micron-sized phosphors improves by 25-80% with SiO2
coatings, indicating the surface defects and the reflection of incoming lights of these phosphors
are mitigated by SiO2 coatings. In addition, the moisture stability of nano- and micron-sized
phosphors is also improved by SiO2 shells. The luminescence output of SiO2 coated micron-sized
Ca3SiO4Cl2:Eu2+
and nano-sized Ca2PO4Cl:Eu2+
phosphors, which are green- and blue-emitting,
respectively, after water exposure in 24h is comparable to that of fresh phosphors, although bare
phosphors shows significant luminescence quenching after water exposure. Thus, coating SiO2
shells on nanocrystalline or micron-sized phosphors is a potential way to improve luminescence
properties of phosphors for solid state lighting applications.
Future work for this research is following: First, investigating mechanism for
luminescence properties of nanophosphors. Many explanations for the low QE of nanosized
phosphor powders have been proposed: To fully describe the nanophosphors, macroscopic
techniques such as scanning electron microscopy and X-ray diffraction are preferred. However, it
is unambiguously difficult to measure nanoscopic properties such as activator distribution,
concentration profile across particle and local structure surrounding activator ions by these
techniques. Surface and bulk analyses will identify the local environment of the activator and
traps that quench the luminescence.
182
Second, developing red line emitting phosphors could be undertaken as a continuation of
this research. Based primarily on spectral efficiency, but with color rendering also in mind, there
is an interest in the LED lighting industry for narrowband down converters across the visible
spectrum and in particular for red emitters. Since lanthanide line emitters have been so
successfully used in fluorescent lamps and displays, they are being developed as near UV LED
phosphors. Depending on the rare earth ions, emission could cover the visible spectrum
providing appropriate red-, green- and blue-emitting phosphors for higher efficacy and improved
color rendering. However, since there are no line-emitting lanthanide ions except for Tm3+
that
emit preferentially in the blue, and in most hosts, a significant portion of the Tm3+
emission is lost
to the infrared, a line-emitting blue component is not a very practical option. The direct
excitation of the rare earth ions, in spite of the richness of energy levels in the spectral region of
interest, is very weak when compared to 4f→5d transitions. The general strategy has been to
excite rare earth activators through the charge transfer transition or 4f→5d transitions.
Unfortunately, the charge transfer bands of Eu3+
in most oxides are located at energies
significantly higher than the photon energies from near UV LEDs. Therefore, a narrow band
phosphor based on a charge transfer band is very unlikely to be found among oxide hosts. This
indicates that designing a narrow band phosphor would have to rely on energy transfer from Ce3+
or Eu2+
, from functional groups such as molybdates or tungstates, or from direct excitation of the
host material. There are several potential methods for sensitizing rare earth line emitters although
there are no commercial phosphors for nUV or blue. At this point, it remains an interesting
research challenge, and if an efficient and stable line-emitting red phosphor is developed, it could
play a significant role in the lighting and display industries.
Third, improving the synthetic techniques to obtain dispersed nano- and submicron sized
crystalline phosphors with high quantum efficiency. Nano- and submicron sized phosphors are
preferred in terms of increasing light extraction efficiency. However, surface defects and smaller

183
crystallite size have detrimental effects on the luminescence properties. In order to obtain
efficient phosphors, the post-annealing step is required and generally annealing temperature is
between 800-1300˚C for oxide compounds and 1400-1900C for nitride compound resulting in
particle sintering and growth. Thus, there is a tradeoff between obtaining dispersed, uniformly
sized and shaped nanocrystalline phosphors and maximizing the emission intensity and high
quantum efficiency. For commercial applications, emission intensity cannot be sacrificed. It still
remains an open challenge to fabricate various dispersed nano-and submicron sized crystalline
phosphors with high quantum efficiency.

184
References
1. 2010 U.S. Lighting Market Characterization. Prepared by Navigant Consulting, Inc. for
the Department of Energy. Washington D.C. January 2012.
2. J. M. Phillips, Basic Research Needs for Solid-State Lighting: Report of the Basic
Sciences Workshop on Solid-State Lighting, Department of Energy Office of Basic
Energy Sciences (2006).
3. 2012 Solid-state lighting research and development: Multi-Year Program Plan (2012)
4. K. Nassau, ―The Physics and Chemistry of Color: The Fifteen Causes of Color‖, John
Wiley & Sons, Inc. (2001).
5. P. Flesch, ―Light and Light Sources: High-intensity Discharge Lamps‖, Springer- Verlag,
Berlin (2006).
6. E.F. Schubert, ‗‖History of light emitting diodes, in Light emitting diodes‖, Cambridge
University Press, New York (2006).
7. S. Nakamura and G. Fasol, "Applications and Markets for Gallium Nitride Light Emitting
Dioes (LEDs) and Lasers," in The Blue Laser Diode: GaN Based Light Emitters and
Lasers, p. 8, Springer-Verlag, Berlin (1997).
8. Solid-State Lighting Research and Development Portfolio. ―Prepared for: Lighting
Research and Development Building Technologies Program‖, Office of Energy
Efficiency and Renewable Energy, U.S. Department of Energy. Navigant Consulting,
Inc., (2006).
9. J.McKittrick, M.E. Hannah, A.Piquette, J.K. Han, J.I. Chor, M.Anc, M. Galvez, H.
Lugauer, J.B. Talbot, K.C. Mishra, ―Phosphor Selection Considerations for Near-UV
LED Solid State Lighting‖, ECS J. Solid State Sci. Technol. 2 R3119-R3131 (2013)
10. G. Blasse, B.C. Grabmaier, ―Luminescent materials‖, Springer-Verlag (1994)
11. J.G. Solé, L. E. Bausá and D. Jaque, "The Electromagnetic Spectrum, in An Introduction
to the Optical Spectroscopy of Inorganic Solids‖, John Wiley & Sons, Ltd (2005).

185
12. R. E. Hummel, ―Electronic Properties of Materials‖, Springer-Verlag (2001).
13. N. Jr. Holonyak, S.F. Bevaqua, ―Coherent (visible) light emission from GaAs P
junctions‖, Appl. Phys. Lett.:82–83 2956 (1962).
14. H. Amano, N. Sawaki, I. Akasaki, Y. Toyoda. ―Metalorganic vapor phase epitaxial
growth of a high quality GaN film using an AlN buffer layer‖. Appl. Phys. Lett. 48 353–
355 (1986)
15. R. Haitz, F. Kish, J. Tsao, J. Nelson, ―Innovation in Semiconductor Illumination:
Opportunities for National Impact‖ Taylor & Francis Ltd, Hoboken (1999).
16. G. Held, ―Introduction to Light Emitting Diode Technology and Applications, Taylor &
Francis Ltd, Hoboken (2008).
17. http://en.wikipedia.org/wiki/File:PnJunction-LED-E.PNG
18. http://dev.emcelettronica.com/xlamp-lighting-class-leds
19. E. F. Schubert, "High Extraction Efficiency Structures," in Light-emitting Diodes, p. 149,
Cambridge University Press, New York (2006).
20. http://www.brite-led.com/HumanEyeResponse.htm
21. A.H. Munsell ―Atlas of the Munsell Color System‖, Wadsorth -Howland & Company,
Malden, MA (1915)
22. E.D. Jones, ―Light emitting diodes for general illumination‖, OIDA report, 2001
23. K. Nassau, ―The Physics and Chemistry of Color: The Fifteen Causes of Color‖,John
Wiley & Sons, Inc. (2001).
24. CIE. Commission internationale de l'Eclairage proceedings, 1931. Cambridge press,
Cambridge (1932).

186
25. T. Smith, J. Guild, "The C.I.E. colorimetric standards and their use". Transactions of the
Optical Society 33 73–134 (1931)
26. W.D. Wright, ―A re-determination of the trichromatic coefficients of the spectral colours".
Transactions of the Optical Society 30 141–164 (1928)
27. J. Guild, "The colorimetric properties of the spectrum". Philosophical Transactions of the
Royal Society of London (Philosophical Transactions of the Royal Society of London.
Series A, Containing Papers of a Mathematical or Physical Character, 230 149–187
(1931)
28. LEDtronics, C.I.E. 1931 Chromaticity Diagram, Accessed December 21 (2009)
.<http://www.ledtronics.com/html/1931ChromaticityDiagram.htm>
29. http://fishant.com.au/blog/warm-natural-and-cool-white
30. http://en.wikipedia.org/wiki/Color_temperature
31. I. Moreno, U. Contreras. "Color distribution from multicolor LED arrays". Optics
Express 15 3607–3618 (2007).
32. D.F. Shriver, P.W. Akins, C.H. Langford, ―Inorganic chemistry‖, WH. Freeman and
company, New York, N.Y. 1990
33. D.T. Palumbo, J.J. Brown Jr, ―Electronic states of Mn2+
activated phosphors I. Green-
emitting phosphors‖, J. Electrochem. Soc 117 1184-1188 (1970)
34. G. Burns, E.A. Geiss, B.A. Jenkins, N.I. Nathan, ―Cr3+
fluorescence in garnets and other
crystals‖, Phys. Rev. 139 A1687 (1965).
35. http://javierdelucas.es/orbitalescuanticos.htm
36. http://www.dlt.ncssm.edu/tiger/chem8.htm

187
37. L. Wang, L. Shi, N. Liao, H. Jia, X. Yu, P. Du, Z. Xi, D. Jin, ―Electro-deposition of
Y2O3:Eu3+
thin film phosphor and its luminescent properties,‖ Thin Sold Film. 518 4817-
1820 (2010)
38. J. Franck, "Elementary processes of photochemical reactions". Transactions of the
Faraday Society 21: 536–542 (1926)
39. D.C. Harris, M.D. Bertolucci, ―Symmetry and Spectroscopy‖. Oxford University Press
(1978).
40. M.Y. William, S. Shionoya, H. Yamamoto, ―Phosphor handbook‖, 2nd edition, CRC
Press (2007)
41. G.H. Dieke, ―Spectra and Energy Levels of Rare Earth Ions in Crystals,‖ Wiley
Interscience, New York (1968).
42. J. Yang, X. Yang, H. Yang, ―Preparation and properties of multifunctional
Fe@C@Y2O3:Eu3+
nanocomposites‖, J. Alloy. Compd. 512 190-194 (2012)
43. O. Laporte, W.F. Meggers, "Some rules of spectral structure". J. Opt. Soc. Amer 11 459
(1925).
44. P. Dorenbos, ―Predictability of 5d level positions of the triply ionized lanthanides in
halogenides and chalcogenides‖ J. Lumin., 87-89, 970-972 (2000).
45. P. Dorenbos, ―Anomalous luminescence of Eu2+
and Yb2+
in inorganic compounds‖, J.
Phys.: Condens. Matter 15 2645-2665 (2003).
46. P. Dorenbos, ―5d-level energies of Ce3+
and the crystalline environment. III. Oxides
containing ionic complexes‖, Phys. Rev. B, 64, 125117 (12 page) (2001).
47. P. Dorenbos ―Energy of the first 4f7→4f
65d transition of Eu
2+ in inorganic compounds‖,
J. Lumin., 104, 239-260 (2003)
48. P. Dorenbos ―5d-level energies of Ce3+
and the crystalline environment. I. Fluoride
compounds‖ Phys. Rev. B, 62, 15640-15649 (2000).
188
49. P. Dorenbos. ―5d-level energies of Ce3+
and the crystalline environment. II. Chloride,
bromide, and iodide compounds‖ Phys. Rev. B, 62, 15650-15659 (2000).
50. P. Dorenbos ―5d-level energies of Ce3+
and the crystalline environment. IV. Aluminates
and ―simple‖ oxides‖ J. Lumin., 99, 283-299 (2002).
51. P. Dorenbos. ―The 5d level positions of the trivalent lanthanides in inorganic
compounds‖, J. Lumin., 91, 155-176 (2000).
52. P. Dorenbos ―The transitions of trivalent lanthanides in halogenides and chalcogenides‖,
J. Lumin., 91, 91-106 (2000).
53. J.K. Han , M. E. Hannah, A. Piquette, J. B. Talbot, K. C. Mishra, J. McKittrick,
―Phosphor development and integration for near-UV LEDs,‖ ECS. J. Solid. State. Sci.
Tech 2, R3138-R3147 (2013)
54. M.E. Hannah, A. Piquette, M. Anc, J. McKittrick, J. Talbot, J.K. Han, K.C. Mishra, ―A
study of blue emitting phosphors, ABPO4:Eu2+
(A=K, Li, Na; B=Ca, Sr, Ba) for UV
LEDs‖, ECS Trans. 41 19-25 (2012).
55. Z.C. Wu, J.X. Shi, J. Wang, M.L. Gong, Q. Su. ―A novel blue-emitting phosphor
LiSrPO4:Eu2+
for white LED‖ J. Solid. State. Chem., 179, 2356-2360 (2006).
56. S. Zhang, Y. NaKai, T. Tsuboi, Y. Huang, H.J. Seo. ―Luminescence and microstructual
features of Eu-activated LiBaPO4 phosphor‖, Chem. Mater., 23, 1216-1224 (2011)
57. J. Sun, X. Zhang, H. Du. Thermally stable blue NaBaPO4:Eu2+
phosphor synthesized by
combustion method. Adv. Mater. Res., 295-297, 539-542 (2011).
58. D.Y. Kim, I.S. Cho, C.W. Lee, J.H. Noh, K.S. Hong. ―Prepartation and
photoluminescence properties of γ-KCaPO4:Eu2+
phosphors for near uv-based white
LEDs‖, Opt. Mater., 33, 1036-1039 (2011).
59. Y.S. Tang, S.F. Hu, C.C. Lin, N.C. Bagkar, R.S. Liu, ‖Thermally stable luminescence of
KSrPO4:Eu2+
phosphor for white light UV light-emitting diodes‖, Appl. Phys. Lett., 90
151108-151110 (2007).

189
60. S.H.M. Poort, W. Janssen, G. Blasse. ―Optical properties of Eu2+
activated orthosilicates
and orthophosphates‖, J. Alloy. Comp., 260, 93-97(1997).
61. C. Guo, L. Luan, X. Ding, D. Huang. ―Luminescence properties of SrMg2(PO4)2:Eu2+
and
Mn2+
as a potential phosphor for ultraviolet light-emitting diodes‖, Appl. Phys. A, 91,
327 (2008).
62. Z. Wu, J. Liu, M. Gong. ―Thermally stable luminescence of SrMg2(PO4)2:Eu2+
phosphor
for white light NUV light-emitting diodes‖, Chem. Phys. Lett., 466, 88-90 (2008).
63. W.J. Yang, T.M. Chen. ―White-light generation and energy transfer in SrZn2(PO4)2:Eu,
Mn phosphor for ultraviolet light-emitting diodes‖, Appl. Phys. Lett., 88, 101903-101905
(2006).
64. K.H. Kwon, W.B.Im, H.S. Jang, H.S. Yoo, D.Y.Jeon. ―Luminescence properties and
energy transfer for site-sensitive Ca6-x-yMgx-z(PO4)4:Euy2+
, Mnz2+
phosphor and their
application to Near UV-LED based White LEDs‖, Inorg. Chem., 48, 11525 (2009).
65. Z. Hao, J. Zhang, X. Zheng, X. Sun, Y. Luo, S. Lu. ―White light emitting diode by using
a-Ca2P2O7:Eu2+
,Mn2+
‖, App. Phys. Lett., 90, 261113 (2007).
66. S. Ye, Z.S.Liu, J.G. Wang, X.P.Jing. ―Luminescence properties of Sr2P2O7:Eu,Mn
phosphor under near UV excitation‖, Mater. Res. Bull., 43, 1057-1065(2008).
67. C.H. Huang, P.J. Wu, J.F. Lee, T.M. Chen. ―(Ca,Mg,Sr)9Y(PO4)7:Eu2+
, Mn2+
phosphors
for white-light near UV-LEDs through crystal field tuning and energy transfer‖ J. Mater.
Chem., 21, 10489-10495 (2011).
68. A. Meijerink, G. Blasse. ―Photoluminescence and thermoluminesence properties of
Ca2PO4Cl:Eu2+
‖, J. Phys. Condens. Matter, 2, 3169-3173 (1990)
69. Y.C. Chiu, W.R. Liu, C.K. Liao, Y.T. Yeh, S.M. Jang, T. M. Chen. ―Ca2PO4Cl: an
intense near ultraviolet converting blue phosphor for white light emitting diodes.‖ J.
Mater. Chem., 20, 1755-1758 (2010).
70. T. Justel, H. Nikol, C. Ronda. "White emitting diodes" US 6,084,250 (2000).

190
71. W.N. Wang, F. Iskandar, K. Okuyama, Y. Shinomiya. ―Rapid synthesis of Non-
aggregated fine chloroapatite blue phosphor powders with high quantum efficiency‖,
Adv. Mater., 20, 3422-3426 (2008).
72. A.A. Setlur, J.J. Shiang, U. Happek, ‖ Eu2+
-Mn2+
phosphor saturation in 5 mm light
emitting diode lamps‖, Appl. Phys. Lett., 92 081104-081106 (2008).
73. W.B. Im, S. Brinkley, J. Hu, A. Mikhailovsky, S.P. Denbarrs, R. Seshadri. ―Sr2.975-
xBaxCe0.025AlO4F: a highly efficient green-emitting oxyfluoride phosphor for solid state
white lighting‖, Chem. Mater., 22, 2842-2849 (2010).
74. Q. Zeng, H. Tanno, K. Egoshi, N. Tanamichi, S. Zhang. ―Ba5SiO4Cl6:Eu2+
: An intense
blue emission phosphor under vacuum ultraviolet and near ultraviolet excitation‖, Appl.
Phys. Lett., 88, 051906-051908 (2006).
75. T. Barry, ―Equilibria and Eu2+
luminescence of subsolidus phase bounded by
Ba3MgSi2O8, Sr3MgSi2O8, Ca3MgSi2O8‖, J. Electrochem. Soc., 115, 733-738 (1968).
76. Y. Lin, Z. Tang, Z. Zhang, X. Wang, J. Zhang. ―Preparation of a new afterglow blue-
emitting Sr2MgSi2O7 based photoluminescent phosphor‖, J. Mater. Sci. Lett., 20, 1505-
1508 (2001).
77. S.H. Lee, J. H. Park, S. M. Son, J. S. Kim, H. L. Park. ―White-light-emitting phosphor:
CaMgSi2O6:Eu2+
, Mn2+
and its related properties with blending‖, Appl. Phys. Lett., 89,
221916-221918 (2006).
78. J. Liu, J. Sun, C. Chi. ―A new luminescent material: Li2CaSiO4:Eu2+
‖ Mater. Lett., 60,
2830-2834 (2006).
79. S. Yao, D. Chen. ―Combustion synthesis and luminescence properties of a new material
Li2(Ba0.99Eu0.01)SiO4:B3+
for ultraviolet light emitting diodes‖, Opt. Laser. Tech., 40, 466-
471 (2008).
80. W.R. Liu, C.C. Lin, Y.C. Chiu, Y.T. Yeh, S.M. Jang, R.S. Liu, B. M. Cheng. ―Versatile
phosphors BaY2Si3O10:RE(Re=Ce3+
, Tb3+
, Eu3+
) for light emitting diodes‖, Opt. Lett., 20,
18103-18106 (2009).

191
81. J.Y. Tang, J. Chen, L. Hao, X. Xu, W. Xie, Q. Li. ―Green Eu2+
-doped Ba3Si6O12N2
phosphor for white light-emitting diodes: Synthesis, characterization and theoretical
simulation‖, J. Lumin., 131, 1101-1106 (2011).
82. T. Suehiro, N. Hirosaki, R. J. Xie, T. Sato. ―Blue-emitting LaSi3N5:Ce3+
fine powder
phosphor for UV-converting white emitting diodes‖, Appl. Phys. Lett., 95, 051903-
051905 (2009).
83. K.Takahashi K., N. Hirosaki, R.J. Xie, M. Harada, K.I. Yoshimura, Y. Tomomura.
―Luminescence properties of blue La1-xCexAl(Si6-zAlz)(N10-zOz) oxynitride phosphors and
their application in white light-emitting diodes‖, Appl. Phys. Lett., 91, 091923-091925
(2007).
84. C. Qin, Y. Huang, L. Shi, G. Chen, X. Qiao, H.J. Seo. ―Thermal stability of luminescence
of NaCaPO4:Eu2+
phosphors for white-light-emitting diodes‖, J. Phys. D, 42, 185105-
185109 (2009).
85. J. Liu, H. Lian, J. Sun, C.Shi. ―Characterization and Properties of Green Emitting
Ca3SiO4Cl2:Eu2+
Powder Phosphor for white light emitting diodes‖, Chem. Lett., 34,
1340-1344 (2005).
86. A.A. Setlur, E. V. Radkov, C. S. Henderson, J.-H. Her, A. M. Srivastava, N. Karkada, M.
S. Kishore, N. P. Kumar, D. Aesram, A. Deshpande, B. Kolodin, L. S. Grigorov, U.
Happek. ―Energy-efficient, high-color-rendering LED lamps using oxyfluoride and
fluoride phosphors‖, Chem. Mater., 22, 4076-4081 (2010).
87. C. Guo, M. Li, Y. Xu, T. Li, Z. Ren, J. Bai. ―A potential green-emitting phosphor
Ca8Mg(SiO4)4Cl2:Eu2+
for white light emitting diodes prepared by sol–gel method‖.
Appl. Surf. Sci., 257, 8836-8339 (2011).
88. W. Lu, Z. Hao, X. Zhang, Y. Luo, X. Wang, J. Zhang. ―Intense green/yellow emission in
Ca8Zn(SiO4)4Cl2:Eu2+
, Mn2+
through energy transfer for blue-LED lighting‖, J. Lumin.,
131, 2387-2390 (2011).
89. J.K. Han, M. E. Hannah, A. Piquette, J. Micone. G. A. Hirata, J. B. Talbot, K. C. Mishra,
and J. McKittrick, ―Europium-activated barium/strontium silicates for near-UV light
emitting diode applications,‖ J. Lumin. 133. 184-187 (2013).
90. J.K. Han, M. Hannah, A. Piquette, G.A. Hirata, J.B. Talbot, K.C. Mishra, and J.
McKittrick, ―Structure dependent luminescence characterization of green-yellow emitting
192
Sr2SiO4:Eu2+
phosphors for near UV LEDs‖, J. Lumin. 132 106-109 (2012)
91. J.S. Kim, H.E. Kim, H.L. Park, G.C. Kim. ―Emission color variation of M2SiO4:Eu2+
(M=Ba, Sr, Ca) phosphors for light-emitting diode‖, Solid State Comm., 133, 187-191
(2005).
92. J.K. Han, M. E. Hannah, A. Piquette, J. B. Talbot, K. C. Mishra, J. McKittrick, ―Nano-
and submicron sized europium activated silicate phosphors prepared by a modified co-
precipitation method‖, ECS. J. Solid. State. Sci. Technol. 1 R98-R102 (2012).
93. X. Zhang, J. Zhang, R. Wang, M. Gong. ―Photo-physical behaviors of efficient green
phosphor Ba2MgSi2O7:Eu2+
and its application in light-emitting diodes‖, J. Am. Ceram.
Soc., 93, 1368-1371 (2010).
94. S.S. Yao, L.H. Xue, Y.Y. Li, Y. You, Y.W. Yan. ―Concentration quenching of Eu2+
in a
novel blue–green emitting phosphor: Ba2ZnSi2O7:Eu2+‖
, Appl. Phys. B, 96, 39-43 (2009).
95. L. Jiang, C. Chang, D. Mao, C. Feng. ―Concentration quenching of Eu2+
in
Ca2MgSi2O7:Eu2+
phosphor‖, Mater. Sci. Eng. B., 103, 271-275 (2003).
96. M.P. Saradhi, U.V. Varadaraju. ―Photoluminescence studies on Eu2+
activated Li2SrSiO4-
a potential orange-yellow phosphor for solid state lighting‖, Chem. Mater., 18, 5267-
5272 (2006).
97. H.S. Jang, D. Y. Jeon. ―Yellow-emitting Sr3SiO5:Ce3+
,Li+ phosphor for white-light-
emitting diodes and yellow-light-emitting diodes‖, Appl. Phys. Lett., 90, 041906 (2007).
98. A. Nag, T.R.N. Kutty. ―Role of B2O3 on the phase stability and long phosphorescence of
SrAl2O4:Eu,Dy‖, J. Alloy. Comp., 354, 221-225 (2003).
99. M. Peng, G. Hong. ―Reduction from Eu3+
to Eu2+
in BaAl2O4:Eu phosphor prepared in an
oxidizing atmosphere and luminescent properties of BaAl2O4:Eu‖, J. Lumin., 127, 735-
740 (2007).
100. C.K. Chang, T.M. Chen. Sr3B2O6:Ce3+
,Eu2+
―A potential single-phased white-emitting
borate phosphor for ultraviolet light-emitting diode‖, Appl. Phys. Lett., 91, 081902-
081904 (2007).
193
101. N. Hirosaki, R.J. Xie, K. Kimoto, T. Sekiguchi, Y. Yamamoto, T. Suehiro, M. Mitomo.
―Characterization and properties of green-emitting β-SiAlON:Eu2+
powder phosphors for
white light-emitting diodes‖, Appl. Phys. Lett., 86, 211905-211907 (2005).
102. Y.Q. Li, A.C.A. Delsing, G. de With, H. T. Hintzen. ―Luminescence Properties of Eu2+
-
Activated Alkaline-Earth Silicon-Oxynitride MSi2O2-δN2+2/3δ (M= Ca, Sr, Ba): A
Promising Class of Novel LED Conversion Phosphors‖, Chem. Mater., 17, 3242-3248
(2005).
103. V. Bachmann, C. Ronda, O. Oeckler, W. Schnick, A. Meijerink, ―Color point tuning for
(Sr, Ba, Ca)Si2O2N2:Eu2+
for white light LEDs‖, Chem. Mater., 21, 316-320 (2009).
104. J.W.H. Van Krevel, H.T. Hintzen, R. Metselaar, A. Meijerink. ―Long wavelength Ce
emission in Y–Si–O–N materials‖, J. Alloy. Comp., 268, 272-277 (1988).
105. C.H. Huang, T.M. Chen. ―Ca9La(PO4)7:Eu2+
,Mn2+
: an emission-tunable phosphor through
efficient energy transfer for white light-emitting diodes‖, Opt. Express, 18, 5089-5093
(2010).
106. N. Guo, H. You, Y. Song, M. Yang, K. Liu, Y. Zheng, Y. Huang, H. Zhang, ‖ White-
light emission from a single-emitting-component Ca9Gd(PO4)7:Eu2+
,Mn2+
phosphor with
tunable luminescent properties for near-UV light-emitting diodes‖ .J. Mater. Chem 20
9061-9067 (2010).
107. H.C. Van de Hulst, ―Light Scattering by Small Particles‖ John Wiley, New York (1987)
108. K.Y. Jung, C.H. Lee, Y.C. Kang, ―"Effect of surface area and crystallite size on
luminescent intensity of Y2O3:Eu phosphor prepared by spray pyrolysis," Mater. Lett., 59
2451-2456 (2005).
109. I.P. Suzdalev, ―Physics and Chemie of Nanoclusters, Nanostructures and Nanomaterials‖,
Comkniga, Moscow. (2005).
110. K.C. Mishra, M. E. Hannah, A. Piquette, V. Eyert, P. C. Schmidt, K. H. Johnson, ―First-
Principles Investigation of the Luminescence Mechanism of Eu2+
in M2SiO4:Eu2+
(M =
Ba, Sr)‖, ECS. J. Solid. State. Sci. Tech 1. R87-R91 (2012)
194
111. E. Danielson, J.H. Golden, E.W. McFarland, C.M. Reaves, W.H. Weinberg, X.D. Wu,
―A combinatorial approach to the discovery and optimization of luminescent materials‖
Nature, 389, 944-948 (1997).
112. O. Ozuna, G.A. Hirata, J. McKittrick, ―Luminescence enhancement in Eu3+
-doped α- and
γ-Al2O3 produced by pressure-assisted low-temperature combustion synthesis‖, Appl.
Phys. Lett., 84, 1296 (2004).
113. K. Kinsman, J. McKittrick, E. Sluzky, K. Hesse, "Phase development and luminescence
in Chromium-doped yttrium aluminum garnet (YAG:Cr) phosphors, J. Am. Ceram. Soc.
77 (1994) 2866-2872.
114. J.K. Park, M.A. Lim, C.H. Kim, H.D. Park, J.T. Park, S.Y. Choi. ―White light-emitting
diodes of GaN-based Sr2SiO4 :Eu and the luminescent properties‖, Appl. Phys. Lett., 683,
683-685 (2004).
115. S. Yao, Y. Li, L. Xue, Y. Yan, ―A promising blue–green emitting phosphor for white
light-emitting diodes prepared by sol–gel method‖, J. Alloy. Comp. 1-2 264-267 (2010)
116. Q.Y. Zhang, X.Y. Huang, ―Recent progress in quantum cutting phosphors‖ Prog. Mater.
Sci. 55 353-427 (2010b).
117. Y. Zhou, J. Lin, M. Yu, S.Wang, H. Zhang,"Synthesis dependent luminescence properties
of Y3Al5O12:Re3+
(Re=Ce, Sm, Tb) phosphors, Mater.Lett 56 628-636 (2002).
118. X.P. Chen, X.Y. Huang, Q.Y. Zhang, ―Concentration-dependent near-infrared quantum
cutting in NaYF4:Pr3+
, Yb3+
phosphor‖ J. Appl. Phys. 106 063518-063521 (2009).
119. T. Kim, S. Kang, ―Hydrothermal synthesis and photoluminescence properties of nano-
crystalline GdBO3:Eu3+
phosphors‖, Mater. Res. Bull., 40, 1945 (2005c)
120. R.J. Xie, N. Hirosaki, Y. Li, T. Takeda, ―Rare-Earth Activated Nitride Phosphors:
Synthesis, Luminescence and Applications‖, Materials 3 3777-3793 (2010).
121. J. McKittrick, L.E. Shea, C.F. Bacalski, E. J. Bosze, ―The influence of processing
parameters on luminescent oxides produced by combustion synthesis‖, Displays 19 169-
172 (1999).

195
122. L.E. Shea, J. Mckittrick, O. A. Lopez, E. Sluzky, ―Synthesis of Red-Emitting, Small
Particle Size Luminescent Oxides Using an Optimized Combustion Process‖, J. Am.
Ceram. Soc., 79 3257-3265 (1996).
123. E.J. Bosze, J. Mckittrick, G. A. Hirata, ―Investigation of the physical properties of a blue-
emitting phosphor produced using a rapid exothermic reaction‖, Mater. Sci. Eng. B 97
265-274 (2003).
124. R. Garcia, G. A. Hirata, J. Mckittrick, ―New combustion synthesis technique for the
production of (InxGa1−x)2O3 powders: Hydrazine/metal nitrate method‖, J. Mater. Res. 16
1059-1065 (2001).
125. H.S. Kang, Y.C. Kang, K. Y. Jung, S.B. Park, ―Eu-doped barium strontium silicate
phosphor particles prepared from spray solution containing NH4Cl flux by spray
pyrolysis‖, Mater. Sci. Eng. B. 121 81-85 (2005).
126. Y.C. Kang, D.J. Seo, S.B. Park, H.D. Park,‖ Morphological and Optical Characteristics
of Y2O3:Eu Phosphor Particles Prepared by Flame Spray Pyrolysis‖, Jpn. J. Appl. Phys.
40 4083-4085 (2001).
127. D. Dosev, B. Guo, I.M. Kennedy, ―Photoluminescence of Eu3+
:Y2O3 as an indication of
crystal structure and particle size in nanoparticles synthesized by flame spray pyrolysis‖,
J. Aerosol. Sci. 37 402-412 (2006).
128. J.C. DeMello, F. Wittman, and R.H. Friend, "An improved experimental determination of
external photoluminescence quantum efficiency", Adv.Mat., 9, (1997).
129. H.S. Jang, W.B. Im, D.C. Lee, D.Y. Jeon, S.S. Kim, ―Enhancement of red spectral
emission intensity of Y3Al5O12:Ce3+
phosphor via Pr co-doping and Tb substitution for
the application to white LEDs‖ J. Lumin 126 371-377 (2007).
130. J.K. Sheu, S.J. Chang, C.H. Kuo, Y.K. Su, L.W. Wu, Y.C. Lin, W.C. Lai, J.M. Tsai, G.C.
Chi, R.K. Wu, ―White-light emission from near UV InGaN-GaN LED chip precoated
with blue/green/red phosphors‖, IEEE Photonics Technol. Lett.15, 18-20 (2003).
131. S. Neeraj, N. Kijima, and A. K. Cheetham, ―Novel red phosphors for solid-state lighting:
the system NaM(WO4)2−x(MoO4)x:Eu3+
(M= Gd, Y, Bi)‖ Chem. Phys. Lett. 387 2-6
(2004).
196
132. J.K. Park. K.J. Choi, J.H. Yeon, S.J. Lee, C.H. Kim. ―Embodiment of the warm white-
light-emitting diodes by using a Ba2+
codoped Sr3SiO5 :Eu phosphor‖, Appl. Phys. Lett.,
88, 043511-043513 (2006).
133. Y.Q. Li, N. Hirosaki, R. J. Xie, T. Takeda, M. Mitomo, ―Yellow-Orange-Emitting
CaAlSiN3:Ce3+
Phosphor: Structure, Photoluminescence, and Application in White
LEDs, Chem. Mater. 20 6704-6714 (2008).
134. Y.Q. Li, J.E.J. van Steen, J.W.H. van Krevel, G. Botty, A.C.A. Delsing, F.J. DiSalvo, G.
De With, H.T. Hintzen, ‖ Luminescence properties of red-emitting M2Si5N8:Eu2+
(M = Ca, Sr, Ba) LED conversion phosphors‖ J. Alloys. Compd., 417 273-279 (2006).
135. W.L. Wanmaker, H. L. Spier, ―Luminescence of Copper activated Orthophosphates of
the Type ABPO4 ( A = Ca , Sr , or Ba and B = Li , Na , or K )‖, J. Electrochem. Soc,
109 109-114 (1962).
136. P. Lightfoot, M.C. Pienkowski, P.G. Bruce, I. Abrahams. ―Synthesis and structure of
LiCaPO4 by combined X-ray and neutron powder diffraction‖, J. Mater. Chem., 1, 1061-
1063 (1991).
137. S. Zhang, X. Wu, Y. Huang, H.J. Seo, ― Photoluminescence and Thermal Stability of
Eu2+
-Activated LiCaPO4 Phosphors for White Light-Emitting Diodes‖, Inter. J. Appl.
Ceram. Tec. 8 734-740 (2011).
138. S.D. More, M.N. Meshram, S.P. Wankhede, P.L. Muthal, S.M. Dhopte, S.V. Mohari,
―Luminescence LiCaPO4‖, Phys. B: Cond. Mater, 406 1178-1181 (2011).
139. N. Narendran, N. Maliyagoda, A. Bierman, R. Pysar, M. Overington, ―Characterizing
white LEDs for general illumination applications‖, Proc. SPIE, 3938 240-248 (2000).
140. M.G. Craford, ―Commerical, Light Emitting Diode Technology‖, Kluwer Academic
Publishers, Dordrecht, 1996.
141. N. Narendran, ―Improved performance white LED‖, Proc. SPIE. 5941 45-50 (2005).
142. J. Lin, Q. Su, H. Zhang, S. Wang, ―Crystal structure dependence of the luminescence of
rare earth ions (Ce3+
, Tb3+
, Sm3+
) in Y2SiO5‖, Mater. Res. Bull., 31 189-196 (1996).
197
143. D. Jia, ―Sr4Al14O25: Eu2 +
Nanophosphor Synthesized with Salted Sol-Gel Method‖,
Electrochem. Solid-State Lett, 9 H93-H95 (2006).
144. Z. Pan, H. He, R. Fu, S. Agathopoulos, X. Song., ―Influence of Ba2+
-doping on structural
and luminescence properties of Sr2SiO4:Eu2+
phosphors‖, J. Lumin. 129 1105-1108
(2009).
145. C.H. Hsu, R. Jangannathan, C.H. Lu., ―Luminescent enhancement with tunable emission
in Sr2SiO4: Eu2+
phosphors for white LEDs‖, Mater. Sci. Eng. B. 167 137-141 (2010).
146. M. Zhang, J. Wing, Q. Zhang, W. Ding, Q. Su, ―Optical properties of Ba2SiO4:Eu2+
phosphor for green light-emitting diode (LED)‖, Mater. Res. Bull. 42 33-39 (2007).
147. W.H. Hsu, M.H. Sheng, M.S. Tsai, ―Preparation of Eu-activated strontium orthosilicate
(Sr1.95SiO4:Eu0.05) phosphor by a sol–gel method and its luminescent properties‖, J.
Alloys. Comp, 467 491-495 (2009).
148. B. Lei, K.I. Machida, T. Horikawa, H. Hanzawa, ―Facile Combustion Route for Low-
Temperature Preparation of Sr2SiO4:Eu2+
Phosphor and Its Photoluminescence
Properties‖, Jpn. J. Appl. Phys. 49 095001-095005 (2010).
149. T. Adachi, S. Sakka, ―The role of N,N-dimethylformamide, a DCCA, in the formation of
silica gel monoliths by sol-gel method‖, J. Non-Cryst. Solids, 99 118-128 (1998).
150. K. Kikuta, K. Ohta, K. Takagi, ―Synthesis of Transparent Magadiite−Silica Hybrid
Monoliths‖,Chem. Mater, 14 3123-3127 (2002).
151. P. Bajaj, T.V. Sreekumar, K. Sen, ―Effect of reaction medium on radical
copolymerization of acrylonitrile with vinyl acids‖, J. Appl. Polym .Sci, 79 1640-1652
(2000).
152. E. Dickinson, D.J. Wedlock (Ed.), ―Controlled Particle, Droplet and Bubble Formation‖,
Butterworth-Heinemann, Oxford, UK, p. 191 (1994).
153. J. Xu, Q. Pan, Y. Shun, Z. Tian, ―Grain size control and gas sensing properties of ZnO
gas sensor‖,Sensor. Actuat B-Chem. 66 277-279 (2000).
198
154. T. He, D. Chen, X. Jiao, Y. Xu, Y. Gu, ―Surfactant-Assisted Solvothermal Synthesis of
Co3O4 Hollow Spheres with Oriented-Aggregation Nanostructures and Tunable Particle
Size‖, Langmuir, 20 8404-8408 (2004).
155. M. Readey, R. Lee, J. Halloran, A. Heuer, ―Processing and Sintering of Ultrafine MgO-
ZrO2 and (MgO, Y2O3)-ZrO2 Powders‖, J. Am. Ceram. Soc., 73 1504-1509 (1990).
156. L. Vriens, G. Acket, C. Ronda, ―UV/blue LED–phosphor device with efficient
conversion of UV/blues light to visible light‖, US patent 5,813,753 (1998)
157. K. Sakuma, N. Hirosaki, R.J. Xie, ― Red-shift of emission wavelength caused by
reabsorption mechanism of europium activated Ca-α-SiAlON ceramic phosphors‖, J.
Lumin 126 843-852 (2007).
158. X.Q. Piao, T. Horikawa, H. Hanzawa and K. Machida, ―Characterization and
luminescence properties of Sr2Si5N8:Eu2+
phosphor for white light-emitting-diode
illumination‖ Appl. Phys. Lett., 88 161908-161910 (2006).
159. F. Xiao, Y.N. Xue, Y.Y. Ma, Q.Y. Zhang, ―Ba2Ca(B3O6)2:Eu2+
, Mn2+
:A potential tunable
blue- white-red phosphors for white emitting diodes‖, J. Phys.: Condensed. Matter, 405
891-895 (2010).
160. C.H. Huang, T.M. Chen, ―A novel single-composition trichromatic white-light
Ca3Y(GaO)3(BO3)4:Ce3+
,Mn2+
,Tb3+
phosphor for UV-light emitting diodes‖, J. Phys.
Chem. C, 115 2349-2355 (2011).
161. X.Y. Chen, S.P. Bao, Y.C. Wu, ―Controlled synthesis and luminescent properties of
Eu2+
(Eu3+
), Dy3+
-doped Sr3Al2O6 phosphors by hydrothermal treatment and
postannealing approach‖, J. Solid. State.Chem., 183 2004-2011 (2010).
162. M.P. Saradhi, S. Boudin, U.V. Varadaraju, B. Raveau, ―A new BaB2Si2O8:Eu2+
/Eu3+
,
Tb3+
phosphor - Synthesis and photoluminescence properties‖, J. Solid. State. Chem. 183
2496-2500 (2010).
163. R.S. Liu, Y.H. Liu, N.C. Bagkar, S.F. Hu, ―Enhanced luminescence of SrSi2O2N2:Eu2+
phosphors by codoping with Ce3+
, Mn2+
, and Dy3+
ions‖, Appl. Phys. Lett., 91 061119-
061121 (2007).

199
164. W.B. Im, N. George, J. Kurzman, S. Bringkley, A. Mikhailosky, J. Hu, B. F. Chmelka,
N. N. Felows, S.P. DenBaars, R. Seshadri, ―Efficient and color-tunable oxyfluoride solid
solution phosphors for solid-state white lighting‖, Adv. Mater. 23 2300-2306 (2011).
165. A.C. Larson, R. B. Von Dreele, ―GSAS. General structure analysis system‖, Los Alamos
National Laboratory Report LAUR, 86 748-750 (1994).
166. K. Momma, F. Izumi, ―VESTA: a three-dimensional visualization system for electronic
and structural analysis‖, J. Appl. Crystallogr., 41, 653-655 (2008).
167. R. Masse, A. Durif, ―Chemical preparation and crystal structure refinement of KBaPO4
monophosphate‖, J. Solid. State. Chem, 71 574-576 (1987).
168. M. Catti, G. Gazzoni, ―The β <->α ' phase transition of Sr2SiO4. I. Order-disorder in the
structure of the α' form at 383 K‖, Acta Crystallogr. B 39 674-679 (1983).
169. M. Catti, G. Gazzoni, G. Ivaldi, ―The β<->α ' phase transition of Sr2SiO4. II. X-ray and
optical study, and ferroelasticity β of the form‖, Acta Cryst. C 39 29-34 (1983).
170. B.H. Toby, ―R-factors in Rietveld analysis: How good is good enough?". Powder.
Diffraction. 21 67-70 (2006).
171. A.R. Denton, N.W. Ashcroft, ―Vegard‘s law‖, Phys. Rev. A. 43 3161-3164 (1991).
172. M.S. Waite, ―Luminescence of alkali-alkaline earth-phosphates activated with Eu2+
‖ J.
Electrochem. Soc. 121 1122-1123 (1974).
173. C.C.Lin, Z.R. Xiao, G.Y. Guo, T.S. Chan, R.S. Liu, ―Versatile phosphate phosphors
ABPO4 in white light-emitting diodes: Collocated characteristic analysis and theoretical
calculations‖ J. Am. Chem. Soc. 132 3020-3028 (2010).
174. R.D. Shannon,, C.T. Prewitt, ―Structural crystallography and crystal chemistry‖, Acta
Cryst. B 25 925-946 (1969).
175. J.S. Kim, P.E. Jeon, J.C. Choi, H.L. Park, S.I. Mho, G. C. Kim. ―Warm-white-light
emitting diode utilizing a single-phase full-color Ba3MgSi2O8:Eu2+
, Mn2+
phosphor‖,
Appl. Phys. Lett., 84, 2931 (2004b).

200
176. G. Blasse, W.L. Wanmaker, J.W. Vrugt, A. Bril, ―Fluorescence of Eu2+
activated
silicates‖, Philips Res. Rep., 23, 189-200 (1968).
177. Y. Yonesaki, T. Takei, N. Kumada, N. Kinomura, ―Crystal structure of BaCa2MgSi2O8
and the photoluminescent properties activated by Eu2+
‖, J. Lumin., 128, 1507-1514
(2008).
178. X. Sun, J. Zhang, X. Zhang, Y. Luo, X. Wang, ―A green-yellow emitting β-Sr2SiO4:Eu2+
phosphor for near ultraviolet chip white-light-emitting diode‖ J. Rare. Earths. 26 421-424
(2008).
179. B.G. Hyde, J.R. Sellar, L. Stenberg, ―The β<->α ' transition in Sr2SiO4 (and Ca2SiO4,
K2SeO4 etc.), involving a modulated structure‖ Acta Cryst. B 42 423-429 (1986).
180. R.P. Rao, ―Preparation and Characterization of Fine Grain Yttrium Based Phosphors by
Sol Gel Process‖ J. Electrochem. Soc. 143 189-197 (1996).
181. F.F. Kruis, H. Fissan, A. Peled, ―Synthesis of nanoparticles in the gas phase for
electronic, optical and magnetic applications - A review‖, J. Aero. Sci. 29 511-535
(1998).
182. R.N. Bhargava, ―Doped nanocrystalline materials — Physics and applications‖, J. Lumin.
70 85-94 (1996).
183. C.R. Ronda, ―Recent achievements in research on phosphors for lamps and displays‖, J.
Lumin. 72 49-54 (1997).
184. J. Zhang, Z. Zhang, Z. Tang, Y. Lin, Z. Zheng, ―Luminescent properties of Y2O3:Eu
synthesized by sol-gel processing‖, J. Mater. Proc. Tech. 121 265-268 (2002).
185. C. He, Y. Guan, L. Yao, W. Cai, X. Li, Z. Yao, ―Synthesis and photoluminescence of
nano-Y2O3:Eu3+
phosphors‖, Mater. Res. Bull. 38 973-979 (2003).
186. N. Joffin, J. Dexpert-Ghys, M. Verelst, G. Baret, A. Garcia, ―The influence of
microstructure on luminescent properties of Y2O3:Eu prepared by spray pyrolysis‖ J.
Lumin 113 249-257 (2005).
201
187. H. Eilers, B.M Tissue, ―Laser spectroscopy of nanocrystalline Eu2O3 and Eu3+
:Y2O3‖,
Chem. Phys. Lett. 251 74-78 (1996).
188. Q. Pang, J. Shi, Y. Liu, D. Xing, M. Gong, N. Xu, ―A novel approach for preparation of
Y2O3:Eu3+
nanoparticles by microemulsion-microwave heating‖, Mater. Sci. Eng. B. 103
57-61 (2003).
189. Y. Tao, G.W Zhao, W.P Zhang, S.D Xia, ―Combustion synthesis and photoluminescence
of nanocrystalline Y2O3:Eu phosphors‖, Mater. Res. Bull. 32 (1997) 501-506.
190. M.P. Pechini, ―Method of preparing lead and alkaline earth titanates and niobates and
coating method using the same to form a capacitor‖ U.S. Patent 3, 330, 697 (1967).
191. H. Wang, C.K Lin, X.M Liu, J. Lin, M. Yu, ―Monodisperse spherical core-shell-
structured phosphors obtained by functionalization of silica spheres with Y2O3:Eu3+
layers for field emission displays‖, Appl. Phys. Letts. 87 181907-181909 (2005).
192. T. Ye, G.W Zhao, W.P Zhang, S.D Xia, ―Combustion synthesis and photoluminescence
of nanocrystalline Y2O3:Eu phosphors‖, Mater. Res. Bull. 32 501-506 (1997).
193. Y.S. Yi, G.M. Chow, ―Water-soluble NaYF4:Yb,Er(Tm)/NaYF4/polymer core/shell/shell
nanoparticles with significant enhancement of upconversion fluorescence‖, Chem. Mater.
19 341-343 (2007).
194. S. Wang, B.R. Jarrett, S.M. Kauzlarich, A.Y. Louie, ―Core/shell quantum dots with high
relaxivity and photoluminescence for multimodality imaging‖, J. Am. Chem. Soc 129
3848-3856 (2007).
195. J.P. Zimmer, S.W. Kim, S. Ohnishi, E. Tanaka, J.V. Frangioni, M.G. Bawendi, ―Size
series of small indium arsenide-zinc selenide core-shell nanocrystals and their application
to in vivo imaging‖, J. Am. Chem. Soc 128 2526-2527 (2006).
196. K. Kompe, H. Borchert, J. Storz, A. Lobo, S. Adam, T. Moller, M. Haase, ―Green-
Emitting CePO4:Tb/LaPO4 Core-Shell Nanoparticles with 70 % Photoluminescence
Quantum Yield‖, Angew. Chem –Int. Edit. 42 5513-5516 (2003).
197. O. Lehmann, K. Kompe, M. Haase, ―Synthesis of Eu3+
-doped core and core/shell
nanoparticles and direct spectroscopic identification of dopant sites at the surface and in

202
the interior of the particles‖, J. Am. Chem. Soc. 126 (2004) 14935-14942.
198. W. Stöber, A. Fink, E. Bohn, ―Controlled growth of monodisperse silica spheres in the
micron size range‖, J. Colloid. Interface. Sci. 26 (1968) 62-69.
199. Y. Lu, Y. Yin, B.T Mayers, Y. Xia, ―Modifying the Surface Properties of
Superparamagnetic Iron Oxide Nanoparticles through a Sol-Gel Approach‖, Nano. Lett. 2
183-186 (2002).
200. Y. Deng, D. Qi, C. Deng, X. Zhang, D. Zhao, ―Superparamagnetic high-magnetization
microspheres with an Fe3O4@SiO2 core and perpendicularly aligned mesoporous SiO2
shell for removal of microcystins‖, J. Am. Chem. Soc. 130 (2008) 28-29.
201. H. Feng, Y. Chen, F. Tang, J. Ren, ―Synthesis and characterization of monodispersed
SiO2/Y2O3:Eu3+
core-shell submicrospheres‖, Mater. Lett. 60 737-740 (2006).
202. J.K. Han, J.B Talbot, J. McKittrick, ―Synthesis and photoluminescence properties of
Y2O3:Eu3+
/ SiO2 core/shell phosphor nanoparticles‖, ECS Trans. 28 183-190 (2010).
203. E.J. Bosze, G. A. Hirata, L. E. Shea-Rohwer, J. McKittrick, ―Improving the efficiency of
a blue-emitting phosphor by an energy transfer from Gd3+
to Ce3+‖
, J. Luminescence, 104
47-54 (2003).
204. H. Huang, G.Q Xu, W.S Chin, L.M Gan, C.H Chew, ―Synthesis and characterization of
Eu:Y2O3 nanoparticles‖, Nanotechnology 13 318-323 (2002).
205. J.W. Stouwdam, F. Van Veggel, ―Improvement in the luminescence properties and
processability of LaF3/Ln and LaPO4/Ln nanoparticles by surface modification‖,
Langmuir. 20 11763-11771 (2004).
206. E. Hecht, ―Optics‖, 2nd Ed, Addison Wesley (1987).
207. I.Y. Jung, Y. Cho, S.G Lee, S.H Sohn, D.K Kim, D.K Lee, Y.M Kweon, ―Optical
properties of the BaMgAl10O17:Eu2+
phosphor coated with SiO2 for a plasma display
panel‖, Appl. Phys. Lett. 87 191908-191910 (2005).
208. J.S. King, E. Graugnard, C.J Summers, ―TiO2 inverse opals fabricated using low-

203
temperature atomic layer deposition‖, Adv. Mater. 8 1010-1013 (2005).
209. J. Wang, S. Tian, G. Li, F. Liao, X. Jing, ―Preparation and X-ray characterization of low-
temperature phases of R2SiO5 (R = rare earth elements)‖, Mater. Res. Bull. 36 1855-1861
(2001).
210. E.J. Bosze, J. Carver, S. Singson and J. McKittrick, ―Long-Ultraviolet-Excited White-
Light Emission in Rare-Earth-Activated Yttrium-Oxyorthosilicate‖, J. Am. Ceram. Soc.,
99 2484-2488 (2007).
211. J.K. Han, G. Hirata, J.B. Talbot, J. McKittrick, ―Luminescence enhancement of
Y2O3:Eu3+, Y2SiO5:Ce
3+, Tb
3+ core particles with SiO2 shells‖, Mater. Sci. Eng. B. 176,
436-441 (2011).
212. R.C. Ropp, ―Luminescence and the Solid State‖, Elsevier, 1991
213. W.B. Lim, H.S. Yoo, S. Vaidyanathan, K.H.Kwon, H.J. Park, Y.I. Kim, D.Y. Jeon, ―A
novel blue-emitting silica-coated KBaPO4:Eu2+
phosphor under vacuum ultraviolet and
ultraviolet excitation‖, Mater. Chem. Phys. 115 161-164 (2009)