synthesis of novel fluoropolymers - t-space - university
TRANSCRIPT

SYNTHESIS OF NOVEL FLUOROPOLYMERS
Robert Daniel Lousen bcrg
A thesis submitted in conformity with the requirements for the degree of Doctorate of Philosophy
Graduate Department of C hemistry University of Toronto
@ Copyright by Robert Daniel Lousenberg 2000

National Library 1*1 of Canada Bibliothèque nationale du Canada
Acquisitions and Acquisitions et Bibliographie Services services bibliographiques
395 Wellington Street 395. rue WellingtOn OnawaON KlAON4 OttawaON K l A W Canada Canada
The author has granted a non- exclusive licence aliowing the National Library of Canada to reproduce, loan, distribute or sell copies of this thesis in microform, paper or electronic formats.
The author retains ownership of the copyright in this thesis. Neither the thesis nor substantial extracts fiom it may be printed or othenvise reproduced without the author's permission.
L'auteur a accordé une licence non exclusive permettant à la Bibliothèque nationale du Canada de reproduire, prêter, distribuer ou vendre des copies de cette thèse sous la forme de microfiche/nlm, de reproduction sur papier ou sur format électronique.
L'auteur conserve la propriété du droit d'auteur qui protège cette thèse. Ni la thèse ni des extraits substantiels de celle-ci ne doivent être imprimés ou autrement reproduits sans son autorisation.

SYNTHESIS OF NOVEL FLUOROPOLYMERS
Doctorate of Philosophy 2000
Robert Daniel Lousenberg
Graduate Department of C hemistry
University of Toronto
ABSTRACT
Fluoropolymers have high chemical and thermal stabilities, making them desirable for a
number of applications, yet limit their broader applicability. To enhance processability and
solubility in organic solvents, new fluoropolyrners incorporating partial hydrocarbon
fünctionality were synthesized.
In one approach, three new trifluorovinyl ether monomers (TFVEs), having hydrocarbon
pendant groups were polymerized: 1 -[2-(2-ethoxy-ethoxy)-ethoxyl- l,2,2-trifluoroethene (Et-
TFVE), 1 -[2-(2-tert-butoxy-ethoxy)-ethoxyl- 1,2,2-trifluoroethene (teri-Bu-TFVE) and 1 42-
phenoxy-ethoxy)-l,2,2-trifluoroethene (Ph-TFVE). The TFVEs were homo- and copolyrnerized
with ethyl vinyl ether (EVE) and vinyl acetate (VAc) by redox-initiated aqueous emulsion
polyrnerization. Et-TFVE was also homo- and copolymerized with tetrafluoroethylene (TFE) in
carbon dioxide (CO2).
As a result of TFVE structure and low reactivity, relatively low molar mass homopolymers
and TFE copolymen resulted (on the order of 10,000 g mol-'). The polymerization mechanism
was complicated because of p-scission terminationkhain transfer for al1 TFVE homopolymers
and copolymers with TFE. Furthemore, radical hydrogen abstraction chain transfer was
observed in polymers incorporating Et-TFVE and ter[-Bu-TFVE but not poly(Ph-TFVE).

Interestingly, abstraction in poly(TFVE)s was a localized intramolecular process, occurring from
the pendant group adjacent to the propagating macro-radical.
TFVE copolymerization with EVE and VAc resdted in significantly higher molar mass
polymers (typically 2 100,000-g mol-') because of higher rates of TFVE cross-propagation.
However, abstraction fiom the oligo-ether pendant group of Et-TFVE was still evident. The
fiequency of abstraction was more significant for copolymers having a greater fraction of Et-
TFVE in the monomer feed. Reactivity ratios were estimated for a series of bulk
copolymerizations of Ph-TFVE with EVE or VAc and confirmed azeotropic copolymerization.
In a second approach to processable fluoropolyrners, TFE and VAc were copolymerized in
supercritical CO2. High molar mass poly(TFE-CO-VAc)s incorporating up to 71 mol% TFE were
synthesized and were organic solvent soluble. Previous syntheses in aqueous ernulsions resulted
in a branched structure as a result of TFE radical hydrogen abstraction fiom VAc with continued
propagation of the resulting macro-radical. Consequently. at least a 10-fold decrease in molar
m a s was observed following hydrolysis. Only a small decrease in molar mass was observed
afier hydrolysis for poly(TFE-CO-VAc)s synthesized in CO2. This suggested that abstraction was
suppressed in carbon dioxide relative to propagation, thereby yielding predominantly linear
pol ymers.
ACKNOWLEGEMENTS
1 would like to thank the following people for their support and assistance:
My family. Dawn and Cory. for their patience and understanding whik I attendeci graduate
school.
Dr. Paul Dalton. I apprcciated Paul's fricndship and thoughtful commcnts and opinions on lifc
and scienti fic research.
1 would like to thank Drs. Ralf Fink and Eric Bcckman at the University of Pittsburgh. I
apprcciate thsir pcnerous assistance in teaching rnc supercri tical COz tcchniqucs and allowin y
mc to copy aspects of their high-pressure reactor design.
wodd also like to acknowledge rny supcrvisor. Dr. Molly Shoichei, Sir ollowing mc a large
degree of latitude in the planning. execution. and writing of thc research prcscntcd hcrc.
For my parents. Helen and Robert

TABLE OF CONTENTS
........ ......... ABSTRACT ......................................................................................................... I I
............................................................................. LIST OF FIGURES .............................. VI1
................................................................................................................... LIST OF TABLES VI11
.................................................................................................... 1 INTRODUCTION ........... I I
1.1 T rifluorovinyl Ethcr Polymers ............... .......................... ................................. 12
..................... I . I . I Polymers fiom Fluoro- and Perfluorocarbon Trijluorovinyl Erher .ï.... /
................................................... . . i i 2 Po fyrners from Hydrocurbon Triflttorovinyl Erhers 13
1.2 Other Partially Fluorinated Polymcrs ......................................................................... 14
1.2.1 Graji Fluoropolymers front Poly(viny1 ulcohol) ........................................................ 14
1.2.2 Fiuuropolynrers from TFE und YinyI Acetu(e .............................. ... ....................... 15
1.3 Chain Transfcr Rcactions in Fluorocarbon Polymcrizations .................................... 17
1.4 Polymcrization in Carbon Dioxide ................... ................ .................................. 18
1.5 Fluoropolymers as Biomatcrials ................................................................................... 22
1.6 Novel Fluoropoly mcr Syn theses ....... .................................. ................................ 23 1.7 Refcrenccs ...................................................................................................................... 26
2 HOMOPOLYMERIZATION OF HYDROCARBON TRIFLUOROVINYL ETHERS ..............*..... .i ............................ ........................... .............................. 28
2.1 introduction ................... ... .... ........................... ............................................. 28
2.2 Results ................... ............ ........... ................. .............................................. 29
............... 2.2.1 Emulsion Homopolymerization of Et-TFVE. tert-Bu-TFVE and Ph- TFVE 29 ................................................... 2.27 ibfechani~ms of Chain Tranrfcr and Termina fion 33
2.3 Discussion ........................................................................................................................ 37
3 COPOLYMERIZATION OF TRIFLUOROVINYL ETHERS WITH ETHYL VINYL ETHER AND VINYL ACETATE ..................................................................... 1 1
3.1 Introduction ................................................................... .......... 41
3.2.2 M e asuretnent ojCopolyncr Composition ....... ... ................................................ 44
3.2.3 Meusurement of Reactivity Rar ios cf Bulk Synrhesized Polyrncrs ............................. 47
3 . 2 . Hydrolysis of Poly (TF VE-CO- K-1 c*) .......................................................................... 50
3.3 Discussion ................... ,. ................................................................................................ 55
................... ............................................................................................. 3.4 Refcrences ....... 60
4 HOMOPOLYMERIZATION OF ET-TFVE IN THE PRESENCE OF CARBON DIOXIDE AND COPOLYMERIZATION WITH TETRAFLUORO-
......................................................................................... ............. ETHYLENE ........... ... 61
4.1 List o f Abbrcviations ....................... ., ................................................................... 6 1
4.3 RcsuIts ....... .................................... ....................................................... .......... ......... 64
4.3. 1 Et- TF VE Solubiiity in CO? ......................................................................................... 6-1
4 3 . 2 Hornopdymeri=crrion (.f Et- TFC'E ics-i~g CO2 ............................................................. (ij
4.3.3 hfA L DI Chuructwi:arion of Poly(i3- TFVE) Absolute it/olur ~bfus.sc.s ....................... 67
4 . 3 MAL DI Characterizarion of Pdy(i3-TFVE) EnJ-gru lr/ls ....................................... 6 9 " ') 4.3.5 Quantification af Rrfuhc &scission Chuin Trunsfir in Poiy(Et-TFVE)s ................ I J
4.3.6 Quunttjicarion of Rudical H'clrogc'n Abstraction Chain Tran.sfir in Pob(lIi- ....................................................................................................................... TFVE)s 74
................................................. -1.3. 7 Copolymcrimion of Et-TFCE widr TFE under CO2 76
4.4 Discussion .................... ...... ............................................................................................ 78 ........................................... 4.4. / E//ectivcncss o/C@ for Et-TFVE F~omopolymcriration 7rY
4.4.2 Et-TF VE copoIymerization wi<h TFE ........................................................................ 81
..................... 4.5 References ... .................................................................................... 8 2
5 SYNTHESIS OF POLYflETRAFLUOROETHYLENE-CO-VINYL ACE- TATE) IN SUPERCRITICAL CARBON DIOXIDE ...................................................... 83
5.1 Introduction .................... ...... ............. ........................................................................... 83
5.2 Results ........................................................................................................................ 84
2 1 Copolymer Synthesis .................................................................................................. 84 ................................................................................................ 5.2.2 CopoIymer Hydrolysis 86
5.3 Discussion ......... .... ................................................................................................. 89

6 CONCLUSIONS AND RECOMMENDATIONS ............................ ... ........................ 93 7 EXPERIMENTAL PftOCEDURfS .......................... .......................... ................... 96
Expcrimental for Chapter 2 ........................................................................................ 96
Experimentnl for Chapter 3 ......................................................................................... 98
Experimental for Chapter 1 ........................... ............. ................................................. 101
Expcrimental for Chapter 5 ................... .....- .... ........ ..................................................... 105
...................................................................................................... Rcfcrcnce~ 109
vii
LIST OF FIGURES
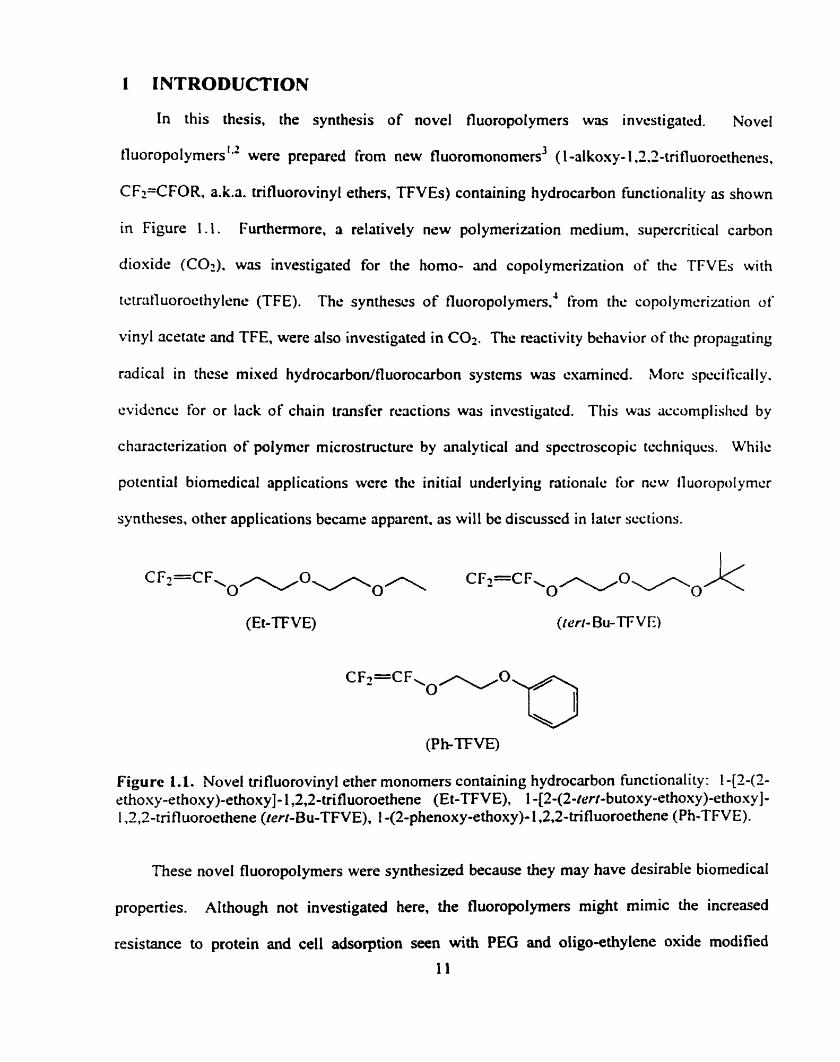
.................................................................... Figure 1.1. Novel influorovinyl ether monomers I I
Figure 1.2. Homo- (x = 0) and copolymers (x > 0) of 1 -( I '. I '-dihydrofluoroalko.yy j- 1.2.2.trifluoroethenes with TFE .......................................................................... 14
Figure 1.3. Ionic addition of fluoroalkenes to poly(viny1 alcohol) (PVA) .............................. 15
Figure 1.4. Copolymers from TFE and VAc rnonomers ......................................................... 16
Figure 1.5. P-scission chain transfer of the macro-radical on PPVE during PFA synthesis ................................................................................................................ I7
Figure 1.6. The phase d i a g m for CO2 ................................................................................... 19
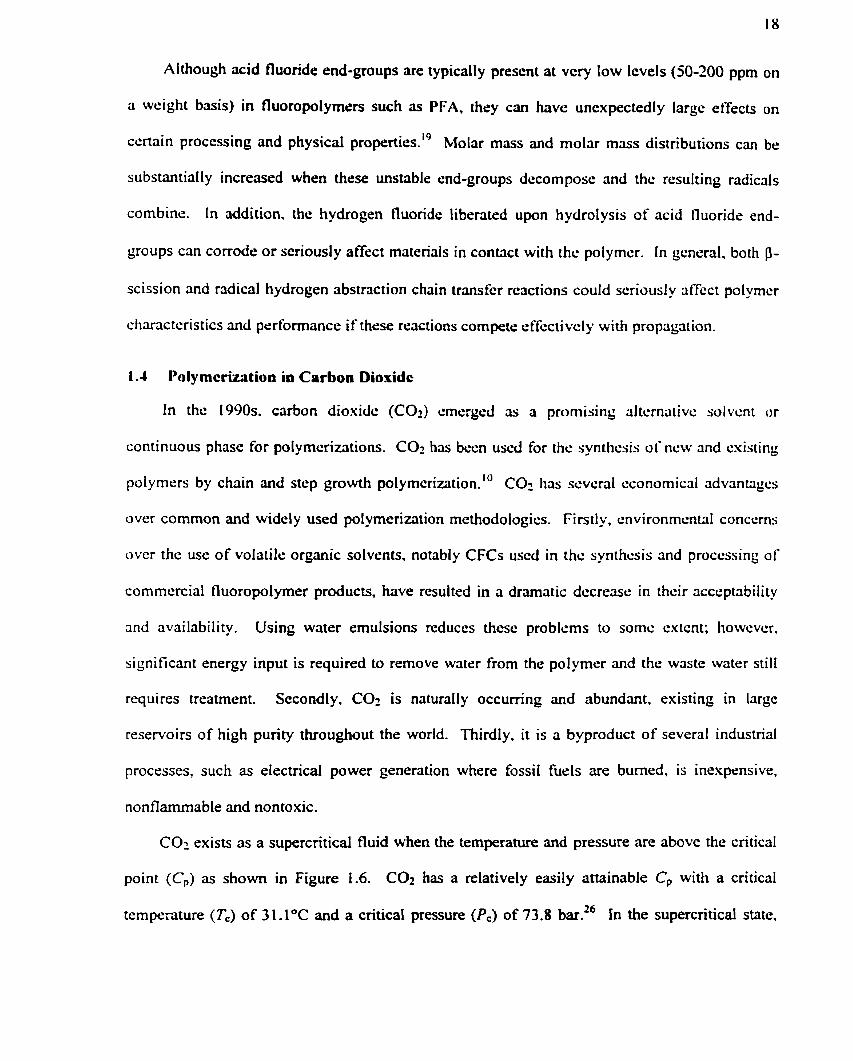
Figure 1.7 Homopolymers (rn = 0) and copolymers of hydrocarbon TFVEs (m > 0) ........... 24
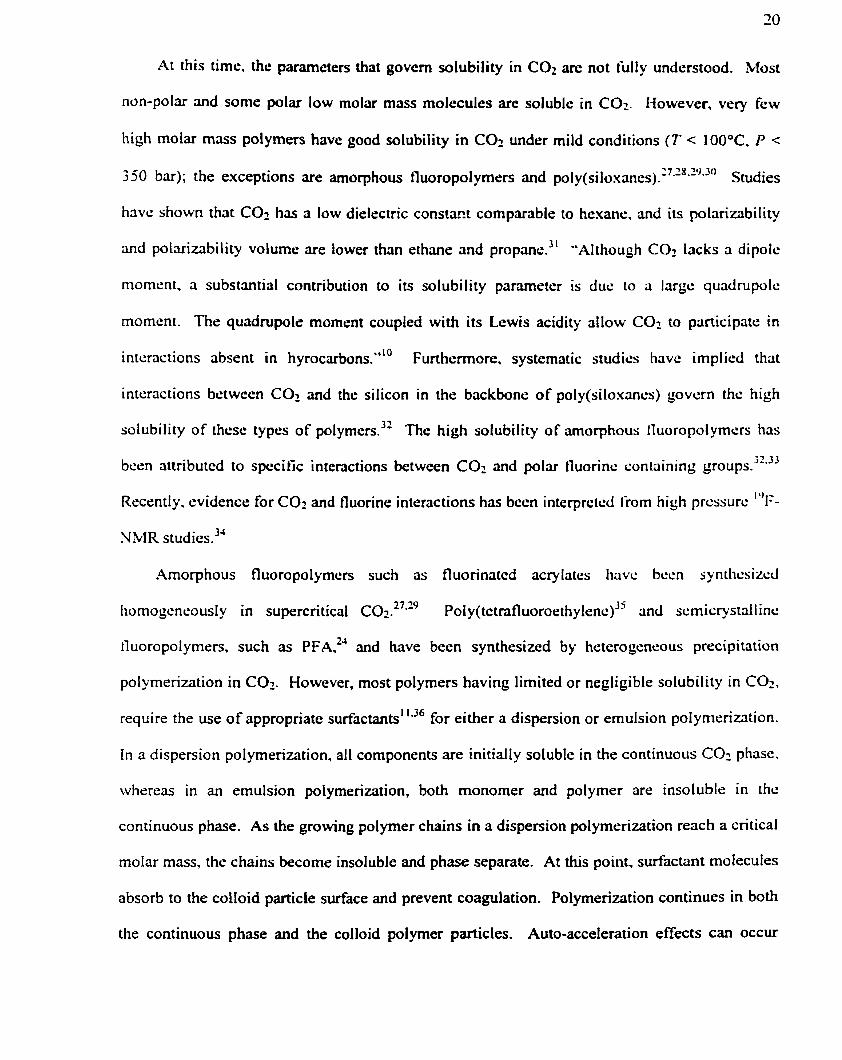
Figurc 1.8 Copolymers of TFE and VAc ........... .................. ......................................... 24
Figurc 2.1. Homopolymerization of 1-(2-alkoxy-ethoxy)- 1.2. 2.trifluoroethcncs (TFVE)s ................................................................................................................. 25
Figurc 2.2. The mol= mass of poly (Et.TFVE). ris detcrmined by GPC ................................ 31
............................ Figure 2.3. Chain transfer by p-scission of the propagating macro-radical 34
Figurc 2.4. Hydrogcn abstraction by the propagating macro-radical ...................................... 35
Figure 2.5. The rnolar mass of poly(Et-TFVE) calculatcd by end-group andysis liorn H-NMR ............................................................................................................. 3 7
Figure 2.6. Hydrogen abstraction liklry occun from the pcndant group adjacent to thc .................................................. propagating macro-radical through a 1 -6-H shi ft 39
Figure 3.1. Copolymerization of Ph-TFVE or Et-TFVE with VAc or EVE ........................... 42
Figure 3.2. Partial hydrolysis of poly(TFVE-CO-VAc) ......................................................... 13 t Figure 3.3. An example H-NMR spectra of each copolymer ........................................... 45
Figure 3.4. Estirnated reactivity ratios and 95% confidence ellipses for the bulk copolyrnerization of Ph-TFVE with EVE or VAc ............................................... 49
............................ Figure 3.5. FPh-TF~E vs . fPh-TNE experimental data and the predicted curve 50
Figure 3.6. FTIR spectra of poly(Et.TFVE.co.VAc). 7. before and after hydrolysis ............. 51
Figure 3.7. FTIR spectra of poly(Ph=TFVE.co.VAc). 6. before and after hydroiysis ............ 52
Figure 3.8. Molar mass distributions of poly(Ph.TFVE.co.VAc). 6. before and after .............................................................................................................. hydrol y sis 54
Figure 3.9. Molar mass distributions of poly(Et-TFVE-CO-VAc) before and after .............................................................................................................. hydrolysis 55
Figure 3.10. Examples of intramolecular radical hydrogen abstraction during TFVE ................................................................................................... CO pol ymerization 57
viii
Figurc 4.1.
Figurc 4.2.
Figure 4.3.
Figure 4.4.
Figure 4.5.
Figure 4.6.
Figure 4.7.
Figurc 4.8.
Figure 4.9.
Hornopolymers of Et-TFVE (y = 0) and copolymcrs with TFE (y > 0) . ................................................................................................ synthesized in COz 62
Et-TFVE solubility in CO? at different concentrations and two temperatures ...... 64
Molar mass distributions relative to polystyrenc standards in ethyl acetate of poly(Et-TFVE)'s ................................................................................................... 66
MALDI spectrum of poly(Et-TFVE), 2 ................................................................ 68
............................................ Rearrangernent of the poly(Et-TFVE) molecular ion 69
..................... MALDI spectrum o f the low mohr mass region of poly(TFVE). 2 70
Initiation by the pendant group radical fragment and s u bsequcnt terminrit ion . . .......................................................................................................... by P-scission 71
FTIR spectn of poly(TFVE)'s synthesizcd in bulk under a blankct of CO2. ............................................. in bulk under vacuum, and in an aqueous emulsion 73
I H-NMR spectrurn of poly(Et-TFVE). 4. shows the hydridc doubler rcsonance at 5-7 ppm .......................................................... 75
Figure 4.10. Mol= mass distributions of poly(Et-TFVE-CO-TFE) and poly(Et.TFVE) . 2 . synthcsizcd under similar conditions for cornparison ......................................... 76
Figure 4.1 1 . 'H-NMR of poly(Et-TFVE-CO-TFE) shows multiple hydridc resonanccs ............ 77
Figure 4.12. Polyrner structures which were expectcd but not obscrvcd in thc MALDl spectra of poly(Et-TFVE)s .............................................................................. 80
Figure 5.1. FTlR spectra of poly(TFE.co.VAc). 4. before and ritter Iiydrolysis ..................... 87
Figure 5.2. Molar mass distributions of poly(TFE.co.VAç). 2 . bsforc and aftcr hydrolysis .............................................................................................................. 88
Figurc 5.3. A proposed intramolecular 1.6-H abstraction mechanism during copolymeriwtion of VAc and TFE ....................................................................... 91
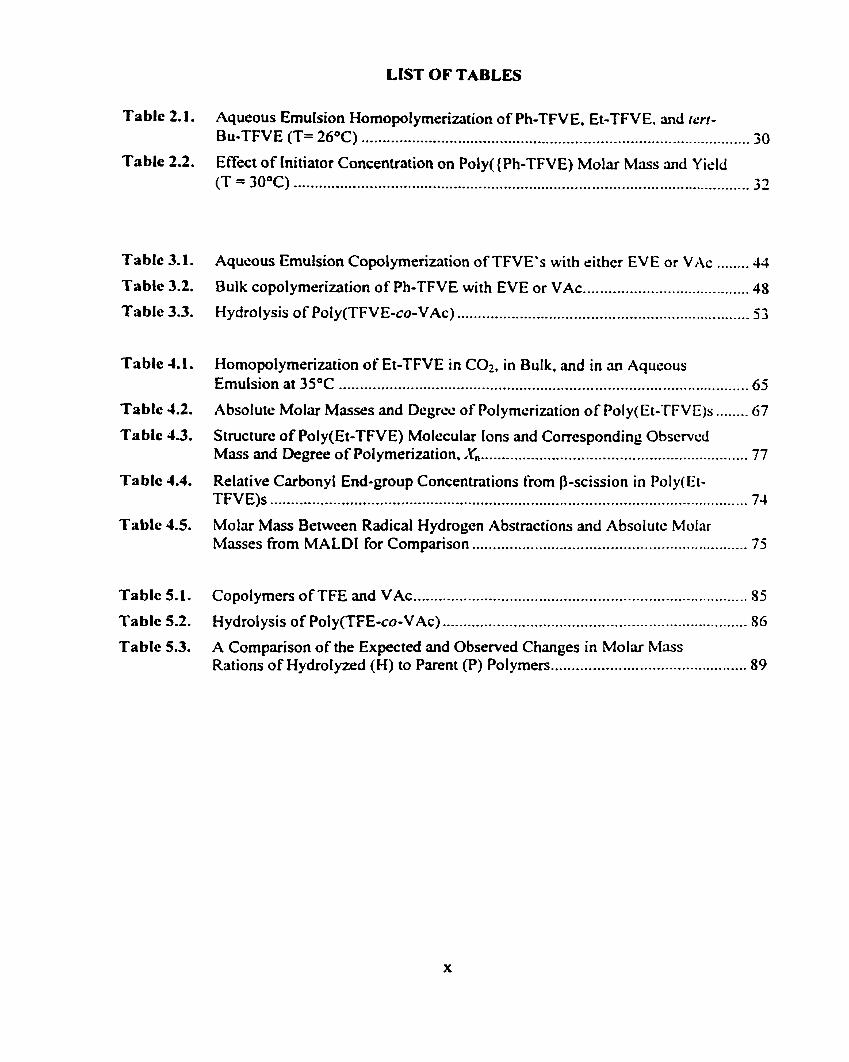
LIST OF TABLES
Table 2.1. Aqueous Emulsion Homopolymerization of Ph.TFVE . E t J F V E . md rerr- Bu-TFVE (T= 26°C) ....................................................................-........................ 30
Table 2.2. Effect of lnitiator Concentration on Poly({Ph-TFVE) Molar Mass and Yicld (T = 30°C) ............................................................................................................. 32
Table 3.1. Aqueous Ernulsion Copolymeriwtion of TFVE's with rithcr EVE or VAc ........ 44
........................................ Tablc 3.2. Bulk copolyrnerization of Ph-TFVE with EVE or VAc 45
Table 3.3. Hydrolysis of Poly(TFVE-CO-VAc) ............................... ,... .............................. 53
Table 4.1. Homopolymerivtion of Et-TFVE in COz. in Bulk. and in an Aqueous Emulsion at 35°C .................................................................................................. 65
Table 1.2. Absolute Molar Masses and Degrcc of Polymcrization o f Poly(Et-TFVE)s ........ 67
Table 4.3 . S tmcture of Pol y(Et-TFVE) Molecular Ions and Corresponding Obscrvcd ................................................................ M a s and Degree of Polymerization. .Y, 77
Tablc 4.4. Relative Carbonyl End-group Concentrations frorn P-scission in Poly(Et- TFVE)s .................................................................................................................. 74
Ta blc 4.5. Molar Mass Between Radical Hydrogen Abstractions and Absolutc Molrir Masses from MALDI for Cornparison .................................................................. 75
Table 5.1. Copolymers oFTFE and VAc ............................................................................ 85
Table 5.2. Hydrolysis of Poly(TFE-CO-VAc) ......................................................................... 86
Table 5.3. A Comparison of the Expected and Observed Changes in Mol= M a s Rations of HydroIyzed (H) to Parent (P) Polymers ............................................... 89
1 INTRODUCTION
In this thcsis. the synthesis of novel fluoropolymers w u investigated. Novel
3 t l u o r ~ ~ o l ~ r n e r s ' ~ ~ were prepared from new fluoromonomeo (1 -alkoxy- 1.22-trifluoroethencrs.
CFpCFOR. a.k.a. trifluorovinyl ethers, TFVEs) containing hydrocarbon functionality as shown
in Figure 1.1. Furthemore, a relatively ncw polymerization medium. supcrcriticûl carbon
dioxidr (CO?). was investigated for the homo- and copolymerization of the TFVEs wiih
tctr~kluorocthylcnr (TFE). The synthrscs of fluoropolymers.J from the copolymsrization of
vinyl aceiatr and TFE, were also investigated in COz. The reactivity behavior of thc propagating
radical in thcsc: mixed hydrocarbon/fluoroc;irbon systcms was cxamincd. More spccilically.
cvidcnce for or lack of chûin transfcr rcactions was invcstiyatcd. This w u accompiishcd by
charactcrizrition of polymcr microstructurc by andytical and spcctroscopiç tcchniqucs. Whilr:
potcntial biomedical applications wcre the initial undcrlying rationair: for ncw lluoropolymcr
synthescs, other applications becme apparent. as will bc discusscd in latcr sections.
(Et-TFVE) (cerf- Bu-TF VE)
Figure 1.1. Novel trifluorovinyl ether rnonomers containing hydrocarbon functionality: I -[I-(2- ethoxy-ethoxy)-ethoxyl- 1,2,2-tri fluoroethene (Et-TFVE), 1 -[2-(2-ierf-butoxy-ethoxy)-ethoxyl- 1.2,2-tri fluoroethene (fer[-Bu-TFVE), 1 -(2-phenoxy-ethoxy). 1,2,2-trifluoroethene (Ph-TFVE).
These novel fluoropolymers were synthesized because they may have desirable biomedical
properties. Although not investigated here, the fluoropolymers might mimic the increased
resistance to protein and ce11 adsorption seen with PEG and oligo-ethylene oxide modified
1 1

surfaces as well as some of the chemical stability of conventional fluoropolymers. A hydroxyl
functionality. synthcsized protected as tert-butoxy from one of the TFVEs. or vinyl acetate.
would allow for further surface modification. Funhennorc, the hydrocarbon pendant groups
were rxpccted to impart drmatically different bulk physical properties to the fluoropolymers
relative to conventional fluoropolymers, such as rendering them soluble in common organic
solvcnts. However. with improved processability and solubility. a considcrablc dccreasc in
p hysical and chemical stability, relative <O conventional fluoropol ymrrs. w;is expected. This
mriy not be a signiflcant issue since what is required is chemical stability in vivo. Conditions cire
such that they may perform satisfactorily.
1.1 Trifluorovinyl Ethcr Polymcrs
1. 1. I Polymcrs from Fluoro- and Per-uorocarhon TriJtttorovinyl E[hc.r.s
Fluoro- andor pcrfluorocarbon TFVEs are vinyl monomcrs and havc bwn uscd in thc ficc
radical synthesis of commercial fluoropolymcrs such as DuPont's Nation@. Thc TFVEs wcrc
used as CO-monomers usually in highly fluorinated polymcrs,5 sinçc thcy did not
homopolyrnerize readily. except under extreme condition^.^ Furthemore. thrre w r e no
cxamples of TFVE polymers successfully synthesized using other methods such as anionic or
cationic polymerization. Thus, radical polymerization was the standard synthcsis method and
usually required an excess of the monorner to achieve desirable levels of TFVE incorporation in
the fluoropolymer. Polymerizations were done in solution using organic solvents (i.e. tluoro- or
perfluorocarbon solvents) but were more commonly done in aqueous ern~lsions.'.~.~ In the
1990s, CO2 begun to emerge as an effective medium for the free radical synthesis of many
different classes of polymers, including fluorocarbon and perfluorocarbon polymers.'O
Cornpounds which can spontaneously form radicais, such as ammonium or potassium
persulfate, were used as initiators in aqueous ernulsion polyrnerizations. With the addition of an
appropriate reducing agent. such as sodium metabisulfite. effective "rcdox" initiation was
possible over a widc range of temperatures. Polymerization ai relatively low tcrnperatures was
advantageous since many TFVEs have undesirable chain trmsfer reactions at elrvated
temperaturcs. as will be discussed in later sections. Addi tiondly. perfluoroaliphatic carboxylate
salt surfactants, such as ammonium or sodium perfluorooctanoatr. were required to stabilize the
riqurous srnulsion polyrnerizations. Funhermore, stabilizcrs such ris hydrocarbon-bloc&-
I I nuorocarbon copolymen were used for dispersion polymerizations in COZ. Fluorinated
diacy lpcroxides. such as perfluoropropiony l peroxide." and dialkyl pcroxydicarbonïtcs. " which
3rc ilctivc at IOW tcmporaturcs. have been uscd as radical initiators for polyrnerizations in COr-
Fluoro- and perfluorocarbon TFVEs can dnmatically alter thc cliemical and physical
propsrtirs of the fluoropolymcr whilc often retaining fairly Iiiyh chcmicül and/or rhcrmd
stribility. For cxamplc, a component of pcrfluororilkoxy (PFA) rcsins. ri copolyrncr with TFE. is
1 -pcrfluoropropoxy- 1.2.2-trifluoroçthçnc (PPVE). PPVE lowcrs thc m d t viscosity of' tlic
copo 1 ymcr. Consequently. PFA can be molded using convcntiond mcl t proccssing tccliniqucs
with are not possible for poly(tetnfluoroethylene).6 A componcnt of Nation@ is a tluorocarbon
TFVE with a pendant sulfonic acid group. This monomcr imparts dramatic propcrtics to
Nation@, such as facilitating swelling in water and ion conductivity. Howcvcr. thcsc and other
predorninantly fluorinated polymers still have limited solubility in organic solvents.
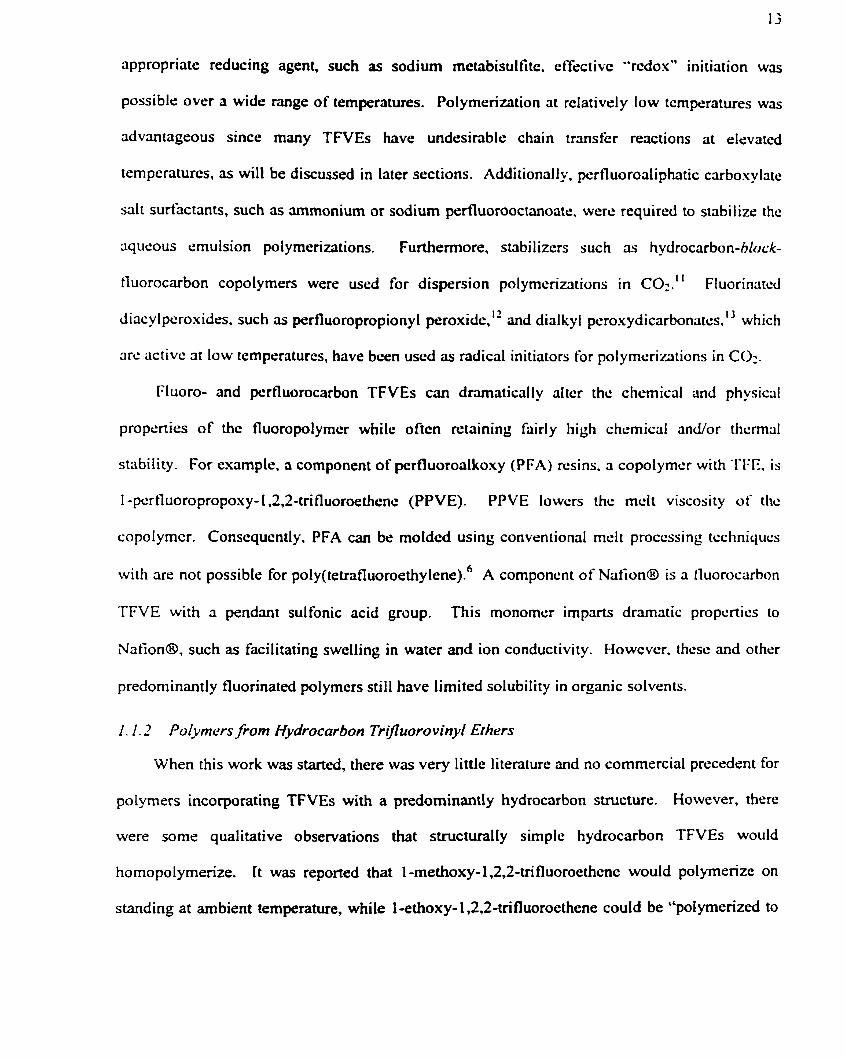
i l . Poiynersfrorn Hydrocarbon Tr fluorovinyl Ethers
When this work was started, there was very little litenturc and no commercial precedent for
polymers incorporating TFVEs with a predominantly hydrocarbon structure. However. there
were some qualitative observations that structurally simple hydrocarbon TFVEs would
homopolymerize. It was reported that 1 -methoxy- 1,2,2-trifluoroethene would poiymerize on
standing at ambient temperature, while 1-ethoxy-1,2,2-trifluoroethene could be "polymerized to

a balsarn like mass with cornmon frec radical initiators."" Thcsc simple, hydrocrvbon
containing. poly(TFVE)s were soluble in organic solvents such as acetonc. cthyl acetatc. etc.. .
Recently, i t was reported that 1 -( 1 ', 1 '-dihydrofluoroalkoxy)- 1 -2.2-trifluoroethenes,
incorponting a terminal hydrocarbon thio-ether group. would radically homopolymcrize as well
ris copolymerize with TFE in Freon 1 13TU as shown in Figure l.2.1'.'5 Substitution of a
diiluoromethylene group with a methylrne group, beta to the propagating radical. appeared to
drmaticaliy alter the reactivity of the monomer. Consequcntly. thc 1 -( 1 ', 1 '-
Dihydrofluoroalkoxy)-1.2.2-trifluoroethenes were shown to stritisticrilly copolyrnsrizc with TFE.
Figure 1.2. Homo- (x = 0) and copolyrncrs (x > O) of thio-cthcr Iùnctionalizcd 1 -( 1 *. 1 '- dihydrofluoroa1koxy)- 1 J.2-tri fluoroethenes with TFE. R = C Hs, C(CI-1,).
1.2 Othcr Partially Fluorinatcd Polymcrs
1.2.2 Grafr Fluoropolymers/rorn Poly (vinyl alcohol)
Recently, a novel synthesis of polymers incorporating both hydrocarbon and tluorocarbon
segments was reported.I6 The synthesis involved the grafting of a fluoromonomer. such TFE or
PPVE. to a hydrocarbon polymenc substrate. "Ionic additions of alcohols and phenols to
fluoroalkenes were well knownL4*" but had rarely been applied to polyrneric18 s~bstrates."'~ For
example. catalytic ionic addition of TFE to poly(viny1 alcohol) (PVA) resulted in the
tluoropolymer shown in Figure 1.3. The underlying rationale for the work was the development
of lower cost. physicaliy tough fluoropolymers with low refractive indices, which might be of
interest for optical applications such as polymeric optical fibers and waveguides. Gnft yields
with up to 77 mol% of the fluoromonomer incorporated, were reported. Polymer films were
colorless, transparent and amorphous and they had relatively good solubility in organic solvents.

The polymers also had thermal degradation onsct wmpcntures approaching 300°C and refnctive
indices as low as 1.385; properties desirable for optical applications. Ar present. the polymer
with the lowest known refractive index (1 -3 1 ) and dislectric constant of any organic material is
an expensive, amorphous. perfluorinated ring-coniaining copolymer with TFE as a co-monomer.
This fluoropolymer is known by the trade namc. Tcflon APM." Teflon AF has a thermal
degradation onset temperature of more than 360°C.
PVA-O 3 CF2=CFi - (PVA-gruji-TFE)-OCFZCFi ? + 1 3 0 - p ~ ~
Figure 1.3. Ionic addition of tluoroalkenes to poly(viny1 alcohoI) (PVA).
/ . 2.7 Fiuoropoiyrners from TFE and Vinyl A Ç C I ~ L '
Another approach to prepare processablc. organic solvcnt soluble fluoropolymcrs was to
copolymerize a fluorornonomer with a hydrocarbon monomer such ris T E with vinyl acctate.
TFE with VAc copolymers have been previously synthesized, in aqueous emul~ions~~-" and in
.'mini-emulsions", which used an organic co-so~vcnt.~~ by free radical polymerization. Thc
monomers were reported to statisticaliy copolyrnerize and the copolymers were amorphous and
could be solvent cast into colorless, transparent films. Given the known crystallinity and lack of
solubiiity of poly(tetrafluoroethylene),6 copolymers with at l e s t 70 mol % TFE were amorphous
and organic solvent soluble. Partial hydrolysis of poly(TFE-co-VAc) to vinyl alcohol (VA)
yielded terpolymers, poly(TFE-co-VAc-co-VA), providing reactive functional sites for cross-
linking. Cross-linking, with reagents such as di-isocyanates, was used to form hard polymer
films with potential for tough, weather-resistant coatings applications.20
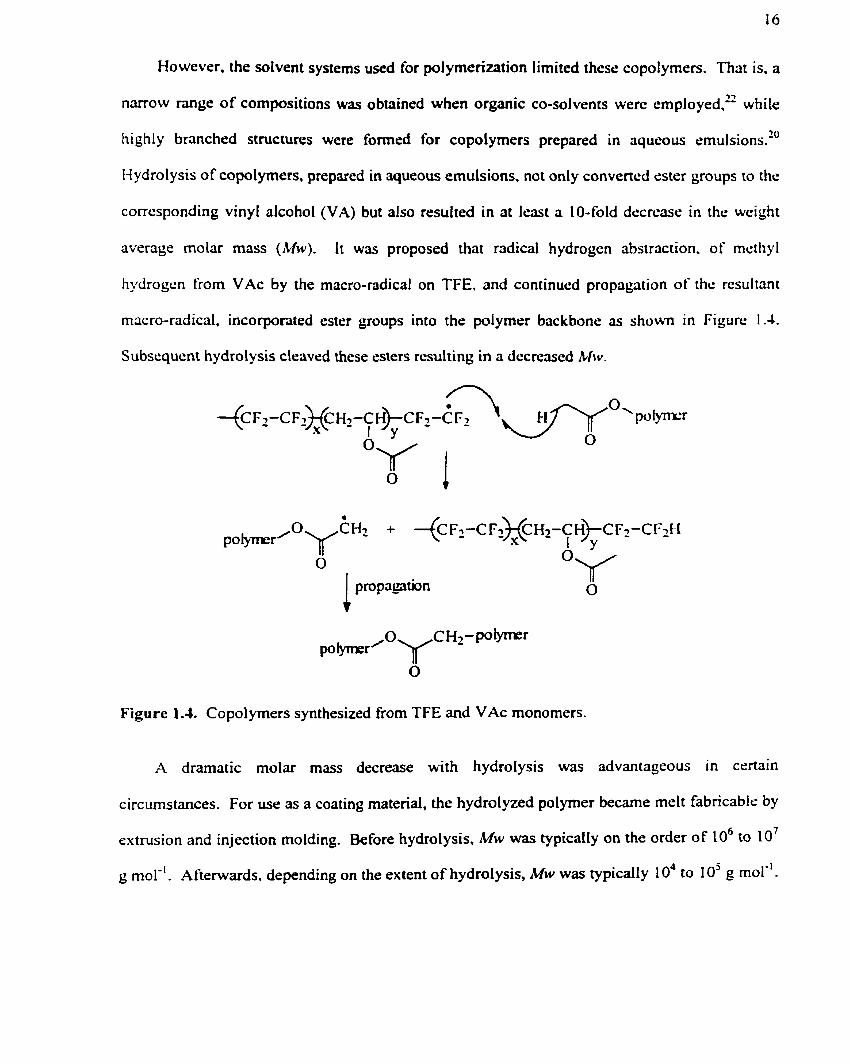
Howcver. the solvent systems used for polymerization limited these copolymen. That is. a
narrow range of compositions was obtained when organic CO-solvents werc employed," white
highl y branched structures were formrd for copol ymers prepared in aqueous emulsions."
Hydrolysis of copolymen. prepared in aqueous emulsions. not only convened ester groups to the
corrcsponding vinyl alcohol (VA) but also resulted in at l e m a 10-fold dccrease in the weight
average molar mass (MW). It was proposed that radical hydrogcn abstraction. of mcrliyl
hydrogen from VAc by the macro-radical on TFE, and continucd propagation of thc rcsultant
mricro-radical. incorponted ester groups into the polymer backbone as shown in Figure 1.4.
Subscqucnt hydrolysis cleaved these esters rcsulting in a dçcrcased MW.
i propagation
Figure 1.4. Copolymers synthesized from TFE and VAc monorners.
A drarnatic molar mass decrease with hydrolysis was advantageous in certain
circumstances. For use as a coating material, the hydrolyzed polymer becarne melt fabricable by
extrusion and injection molding. Before hydrolysis, iMw was typically on the order of 106 to 10'
g mol-'. Aftewards. depending on the extent of hydrolysis, MW was typically 10' to 1 O' g mol-'.

However. a M v reduction with hydrolysis may not be advantageous in other applications where
good chcmical and/or physical mistance without funher cross-linking is desired.
1.3 Chain Transfcr Reactions in Fluorocarbon Polyrncrizations
As discussed, copolymers of TFE and VAc. prepared in aqueous cmulsions. were bruchrd
as a result of radical hydrogen abstraction of methyl hydrogcn of VAc by the rnacro-radical on
TFE, with continued propagation of the resulting rnacro-radical (cf. Figurc 1.4). This type of
rcactivity is charactcristic of radicals in fluorinated or psrfluorinatcd systcms. whcrc: thr: radical
is on carbon atoms which have bonds to fluorine. Thcsr radicals arc known to be very
elcctrophilic. Consequently, hydrogen containing monomers and solvents. exciudiny writcr. arc
typical l y avoided in the polymerization of fluoroa~kcnes.~ The electrophil ic tluorocarbon
rnxro-radicals rcdily abstract hydrogen from virtuall y al1 hydrocarbons.'" subsiantiall y limiting
thc molru mass of the resulting fluoropolymrrs if propagation docs not continuc.
A second side rcaction which is charactcristic of somc fluoro/perHuorocarbo~~ macro-
radicds. is p-scission. More specifically. p-scission is a chmctcristic chain trrinsfcr rcaction in
fluoro- and perfluorocarbon TFVES.'* As excmplified in Figurc 1 S. p-scission of tlic macro-
radical on PPVE during PFA synthesis resulted from homolytic cleavage of thc carbon oxygcn
bond beta to the propagating radical. This lead to an acid fluoride intemediate and a second
radical species. which may initiate a new polymer chain. In aqueous emulsions. the acid fluoride
end-group may be hydrolyzed to the carboxylic acid or salt.
Figure 1.5. p-scission chain transfer of the rnacro-radical on PPVE during PFA synthesis.
Although ncid fluoride end-groups are typicaily present at very low lcvels (50-200 ppm on
a wcight basis) in fluoropolyrnen such as PFA. thry can have uncxpectedly large effects on
ccrtain proccssing and physical properties.'9 Molar mass and rnolnr mass distributions can be
su bstantiall y increased when thrse unstable end-groups decompose and thc rcsulting radicnls
combine. In addition, the hydrogen fluoridc liberated upon hydrolysis of acid thoride end-
groups c m corrode or seriously affect materials in contact with thc polymer. In gcneral. both P-
scission and radical hydrogen abstraction chain transfer reactions could scriously affect polyrncr
charactcristics and performance if these reactions cornpetc rffectivcly with propagrrtion.
4 Polymcrization in Carbon Dioxidc
In thc 1990s. carbon dioxidc (CO2) emeqed 3s a promising altcrnüiivc solvcnt or
continuous phase for polyrntxizrrtions. CO2 has bccn uscd for tlic syndicsis ol'ncw and cxistinç
polymers by chain and stcp growth polymerization." CO2 has scvcnl cçonomiçal advantaycs
civer common and widcly used polymerization methodologics. Firstly, cnvironmcn~al conccrns
ovcr thc usc of voIatile organic solvents, notably CFCs uscd in the syntlicsis and proccssing o r
commercial fluoropolymer products, have rcsulted in a dramatic dccreasc in thcir riccsptability
and availability. Using water emulsions rcduccs thesc problcms to somc cxtcnt; howcvcr.
significant energy input is required to remove water from the polymer and the wriste water stil1
requires treatment. Secondly. COz is natunlly occurring and abundant. existing in large
reservoirs of high purity throughout the world. Thirdly, it is a byproduct of several industrial
processes, such as electrical power generation where fossil fuels are burned, is inexpensive,
nonflammable and nontoxic.
CO? exists as a supercritical fluid when the temperature and pressure are above the critical
point (C,) as shown in Figure 1.6. CO2 has a relatively easily attainable C, with a critical
temperature (Tc) of 3 l.l°C and a cntical pressure (P,) of 73.8 bar.26 In the supercritical state.

CO1 has no discemable liquid-gas interface. Consequently. supçrcntical COz has unique
properties such as (1 ) gas-like difisivities, which c m have unique effects on reaction
kineti~s.~~." and (2) liquid-like densities. which allow for solvation of many types of small
molecules. Furthemore. small changes in temperature or prcssure, near the critical point.
significantly, alter fluid density and dielectric constant without altering fluid ~orn~os i t ion . '~ In
this rnanner, solvent quality c m be tuncd. and c m have substantial cffects on polymerizrition
work-up such as separation of the polymer from stiuting rnaterials. purification and fracrionation.
-- - -
31.1 Temperature (OC) +
Figure 1.6. The phase diagram for COz, which h a a critical point (C,) at 73 .Y bar and 3 1 . 1 OC.
CO? is a gas at arnbient temperatures and pressures and quickly dissipatcs when the high-
pressure liquid or supercriticai fluid is vented to the atmosphere. Consequently. polymers can be
easily isolated from the reaction by simple depressurization. Complcte evaporation of CO?
el iminates energy-intensive drying pmcedures, that are required when other solvents are used in
the rnanufacturing process. To avoid any contribution to greenhouse effects, the CO2 can be
relatively easily purified and recycled. CO2 re-pressurization would require some energy input.
In retrospect, since the gas was likely obtained as a byproduct of other industrial processes.
simpty venting it would not result in a net CO2 release to the environment.
At this tirnc. the parameters chat govcrn solubility in COl arc not fully undcrstood. Most
non-polu and sorne polar low mol= mass molecules are solublc in CO2. However, very few
high molar mass polymers have good solubility in COz under rnild conditions (T < 100°C. P c
350 bm); the exceptions are arnorphous fluoropolyrncrs and poly(siloxancs).'7~2882"~30 Studies
have s h o w that CO2 has a low dielectric constant comparable to hexane. and its polarizability
and polarizability volume are lower thûn ethane and Wthough CO? lacks n dipole
moment, a substantial contribution to its solubility parameter is dur: ro a Iargc quadrupole
moment. The quadrupole moment coupied with its Lewis acidity allow CO2 to participate in
interactions absent in hyrocarbons."'O Furthcmore, systcmatic studics Iirtvc irnplied thrit
intcractions bctwcen COz and the silicon in the backbone of poly(siloxancs) çovcrn thc high
solubility of thesc types of polyrncrs.3' Thc high solubility of amorphous Iluoropolymrirs hîs
bcen attributed to spccitic interactions betwcen COz and polar fluorinc contciining groups. 52.33
Reczntly, evidence for CO2 and fluorine interactions has bccn interprctcd Iiorn high prcssurc "'1:-
NMR s tud i~s . ' ~
Amorphous fluoropo1ymc.r~ such as fluorinatcd acrylates hrivc bwn syntlicisizcd
1iomogcnt.ousIy in supercritical COz. 27.29 ~ol~(tetrafluoroeth~lenc)~~ and scmiçrystallinc
tluoropolymrrs, such as P FA." and have been synthesized b y heterogcneous precipimtion
polymeriwtion in CO2. However, most polymers having limited or negligible solubility in COZ.
require the use of appropriate ~ u r f a c t a n t s ' ' ~ ~ for either a dispersion or emulsion polymerization.
In a dispersion polyrneriwtion, al1 components are initially soluble in the continuous CO? phase.
whereas in an emulsion polymerization, both monomer and polymer are insoluble in the
continuous phase. As the growing polymer chains in a dispersion polymerization reach a critical
molar mass, the chains become insoluble and phase separate. At this point, surfactant molecules
absorb to the colloid particle surface and prevent coagulation. Polymerization continues in both
the continuous phase and the colloid polymer particles. Auto-acceleration effects can occw

sincc the initiotor and monorner/s are not compartmentali~ed.'~ In this context. dispersion
polymrrizations arc often viewed as "modificd precipitation polyrnerïzations."'7 Given that most
small molecules have good solubility in COz, dispersion polymerirations constitute the majority
of examples in the Iiterature.
There are numrrous exmples of different types of chain growth polymcrizations in
supercritical COz in the litenture. such as cationic". rnrtal-catalyzsd. and frcr radical
polymcriwtions. " However, most research has focussed primari 1 y on ticc radical
polymrrizations. The initiation and propagation kinetics of free radical pol ymcrization in
supercritical COz have bcen studied. Early research explored the thermal dccomposition ratc and
initiator et'ticiency of AlBN (2.2'-azobisisobutyronitrilc) using ultraviolst spcctroscopy."
Dccomposition mes. kJ. and initiator rfficicncies wcrc cornparcd to ihosc: rcportcd in tlic
litcraturc for othcr solvcnts. From tltis, the authors concluded that highcr iniiiator cf-ficicncics.
rclative to highcr viscosity solvents, wcrc a result of a dccrcascd solvcnt cagc sff2ct in tlic
supercritical phase. Furthcrmore. propagation ratcs for styrcnc and mctliyl mcthricrylatc wcrc
rneasured in CO2, without a surfactant. using pulsed laser polymerization (PLP).") Conversions
wcrc kept very low (G%) and the polymer chains rcmained in solution. Thc propagation rritc
constants, kp, were found to be very close to thcir bulk polymerization values. indicating thrit
CO2 does not interfere with the free radical polymerization process.
Another reported advantage of COz has been the suppression of p-scission in the
copolyrnerization of fluorocarbon TFVEs with TFE (cf. Figure 1.5)? For copolymers
synthesized in CO2, the concentration of acid end-groups, resulting from of 0-scission. were at
Ieast 365 times lower than copolymers prepared in conventional solvents.. The authors concluded
that this was a consequence of propagation competing more effectively with P-scission. CO? has
a proven invasive ability to facilitate diffusion of small molecules, even into crystalline
fluoropolymer matrices.40 This would increase the rate of propagation, a bimolecular process, in

the precipitated
diffusion would
polymrr ph=. "Since p-scission is a unimolecular process, changes in
have little effect on its rate. and propagation relative to p-scission was more
tavorablt: than in conventional sol vent^."'^ Ovcnll, CO2 appeared to be an excellent medium for
the synthesis of Huoropolymers.
1.5 FIuoropolymcrs as Biomatcrials
Biological systems intcract at the surface or interface of implanted matcrialsJ' and most will
quickly adsorb a mono-layer of proteins and ceiis. Thesc protcins will occupy rnïny diffcrcnt
conformational and orientational States. As a rcsult, cells at thc interfacc will rcspond in speciliç
ways to the ditTerent conformation and orientational statcs. rcsulting in 3 vriricty of cellular
proccsscs bcing triggcred. This can lead to an inflanmatory rcsponsc by thc immunc systcm.
which crin rçsult in isolation of the material from the rcst of the biological systcm. and ultimatcl y
in failure of the implant. In biological applications. fluoropolymcrs arc chcmically stable and
have bccn found to bc rclativcly biologically incrt.
Fluoropol ymers such as expanded pol y(tetraHuorocthy lene) (ePTFE) have bccn uscd wi th
ycnerally acceptable clinical success in biornatcrial applications such as vasculnr gra~ts.'" and
peripheral ncrve repair.'" Part of this success was a rcsult of high chemical stability. low surhcc
energies and relatively good resistance to protein adsorption in vivo;44 yet they still absorbed
proteins. Thus, surfaces have been engineered with the intention of producing minimal a d o r
specific biological responses. Fluoropolymer surfaces have been altered by chemical etchinç
and other techniques such as microwave frequency generated plasmas. However,
tluoropol ymers are dificult to process into complex structures, are insoluble in common organic
solvents, and require highly reactive species for surface modi f i ca t i~n .~~
Research has also focused on the modification of material surfaces with poly(ethy1ene
glycol) (PEG). Interest in PEG has grown increasingly important in recent years.46 Surfaces

modified with PEG have been shown to have increased resismce to protein adsorption relative
to unmodified surfaces. PEG has unique propenies such as a lack of toxicity." a lack of
i m r n ~ n o ~ e n i c i t ~ ~ ~ solubility. hi@ mobility and a large excluded volume in water.." PEG
modification renders the surface more hydrophilic, less protein and ce11 a d s ~ r ~ t i v e . " ~ and less
recognizable by the immune system.
However, there is no clear consensus on how PEG surfaces are bettcr abIr to resist protein
and ceIl adsorption. Hydration and mobility (i.e. "ri brush effcct") factors mriy bc prirtly
rcsponsibls. With hydration and mobility, molecules such as proteins tcthcrcd to surfaces via
PEG cxhibit activity similar to that of a freely soluble rno~eculc.~" In this manncr. dcsircd
cellular responses may be engincered back to a material surface. Findly. surt'riccs moditicd with
poiycthylcnç glycol (PEG) oligomers have aIso bern shown to have an incrcascd rcsistrincc to
protcin ad~or~ t ion .~ ' '
1 .G Novcl FIuoropolymer Synthcscs
It was hypothesized that novel fluoropolymcrs, incorporating hydroclirbon T W E s (cf.
Figure 1.1), could be synthesized by frec radical aqueous emulsion or bulk polyrncrizrition. It
was also anticipatcd that the TFVEs would copolymerize with monomers such as cthyl vinyl
rther (EVE) or vinyl acetate (VAc). In chapter 2, the homopolymerization of the TFVEs was
investigated while, in chapter 3, TFVE copolymerization with EVE and VAc was investigated.
Furthemore. it was hypothesized that TFVE potymers rnight be synthesized by free radical
polymeriwtion in supercritical CO2. Polymeriwtion in COz was anticipated as a means of
obtaining TFVE copolymers with increased fluorine content. Thus, in chapter 4. the homo- and
copolymerization of Et-TFVE with TFE in CO2, was investigated. Figure 1.7 shows the
proposed TFVE homopolymers and copolymers.
Figure 1.7. Homopolymers (m = 0) and copolymen of hydrocarbon TFVEs (m > O). R is 2- tert-butoxyethyl, 2-ethoxyethyl, or phenyl. X is H or F. Y is H or F. Z is H. F. cthoxy. or acetate.
11 was also hypothcsized that proccssablr.. organic solvent solublc tluoropolym~rs çould bc
synthesized by copolymeriwtion of TFE with vinyl ncrratc as discussed in chapter 5. Bulk or
surface hydrolysis of the copolymer's acetate groups to vinyl alcohol would providc a rcactivc
hondlc for furthcr surface modification as shown in Figure 1.8.
hydroiysis - ~ C F ~ - C F ~ ~ C X
O 1-1
Figure 1.8. Copolymen of TFE and VAc. synthesized in supercritical CO2. and subsequcnt hydrolysis.
Given the known reactivity of macro-radicals in fluorinated systems. evidencc of chain
transfer reactions. by characterization of polymer microstructure by analytical and spectroscopic
techniques such as 'H- and "F-NMR, FTIR, GPC and MALDI. was investigated. It was
hypothesized that chain transfer reactions might be suppressed relative to propagation if
polymerizations were success£ûl in COz. Furthemore, since radical hydrogen abstraction from
VAc by the macro-radical on TFE was known for the aqueous emulsion synthesis of this
copolymer, it was proposed that the copolyrner be synthesized in supercritical CO,. If
successhil, it was hypothesized that abstraction might be suppressed relative to propagation,
thereby yielding predominantly linear copolyrners. These copolymers might be more robust than
their aqueous cmulsion synhesized analogs and may have potential applications, such as
biomedical, electronics, and coatings.

1.7 References
(1) Lousenberg, R. D.; Shoichet, M. S., J. Polymer Sci.: Part A: Polym. Chem. 1999, 37, 3301-3308
(2) Lousenberg, R. D.; Shoichet, M. S., J Poiymer Sci.: Part A: Poiym. Chem. 2000, 38, 1344-1354
(3) Lousenberg, R. D.; Shoichet, M. S., J. Org. Chem. 1997,62,22, 7844-7849
(4) Lousenberg, R. D.; Shoichet, M. S., Macromolecules 2000,33, 1682- 1685
(5) Farnham, W. B. United States Patent 5391 796 1995
(6 ) Feiring, A. E. Organofluorine Chemistry: Principles and Commercial Applications (R. E. Banks, B. E. Smart, J. C. Tatlow, Eds.) Plenum Press, New York, 1994, ch. 15
(7) Euell , B. R.; Carl, W. P.; Mod, W. A. UnitedStatesPatent4,337,2Il 1982
(8) Ezzell, B. R.; Carl, W. P.; Mod, W. A. United States Patent 4,515, 989 1985
(9) Kotov, S. K.; Pedersen, S. D.; Qiu, W.; Qiu, 2.; Burton, D. J. J. Fluor. Chem. 1997,82, 1 3
(1 0) Kendall, J. L.; Canelas, D. A.; Young, J. L.; DeSimone, I. M. Chem. Rev. 1999, 99, 543- 563
( 1 1) Canelas, D. A.; Betts, D.E.; Yates, M. Z.; Johnston, K. P. J DeSimone, J. M. iMacromolecules 1998,3 1,6794-6805
(12) Feiring, A. E.; Wonchoba, E. R.; Rozen, S. Poiymer Preprints 1998, 39, 2, 837-838
(13) Charpentier, P. A.; Kennedy, K. A.; DeSimone, J. M.; Roberts, G. W. Macromolecules 1999,32,5973-75
(14) Okuhara, K.; Baba, H.; Kojima, R. Bull. Chem. Soc. Jap. 1962,35,532-535
(1 5) Feiring, A. E.; Wonchoba, E. R.; Rozen, S. J. Fhor. Chem. 1999,93,93-101
(1 6) Feiring, A. E.; Wonchoba, E. R. Macrornolecules 1998,3 1,20,7 103-7 104
(1 7) Feiring, A. E.; Wonchoba, E. R. J. Org. Chem. 1992,57,7014
(1 8) Sletkina, L. S.; Rogovin, 2. A. Vysokomol. Soedin., Ser. B. 1967, 9, 3487. Yamaguchi. F.; Sakamoto, E. PCT Int. Appl. WO 9736933 (Chem. Abstr. 1997, 27, 308395) and WO 9736934 (Chem. Abstr. 1997,27,308396)
(19) Feiring, A. E.; Imbalwno, J. F.; Kerbow, D. L.; TRIP 1994,2, 1,26-30
(20) Jones, C. W. United States Patent 5,723,556 1998
(2 1) Modena, M.; Borsini, G.; Ragazzini, M. European Poiymer J. 1967 3,5- 12
(22) Mares, F.; O x e ~ d e r , B. C.; Long, D. J.; Sibilla, J. P. United Stdes Patent 5.032.6.56 1991
(23) zhvlpjQb.Kb$ m d d , BE U.; Lusztyk, J.; Dolbier, W. R.; Pan, H. Q.; Muir, M . 1 Chem. Soc. 1994,116,99-104
(24) Romack, T. J.; DeSimone, J. M.; Treat, T. A. Mocromolecules 1995,28, 8429-843 1
(25) DeYoung, J. P.; Romack, T. J.; DeSimone, J. M. Polymer Preprints 1997,38, 2,424-5
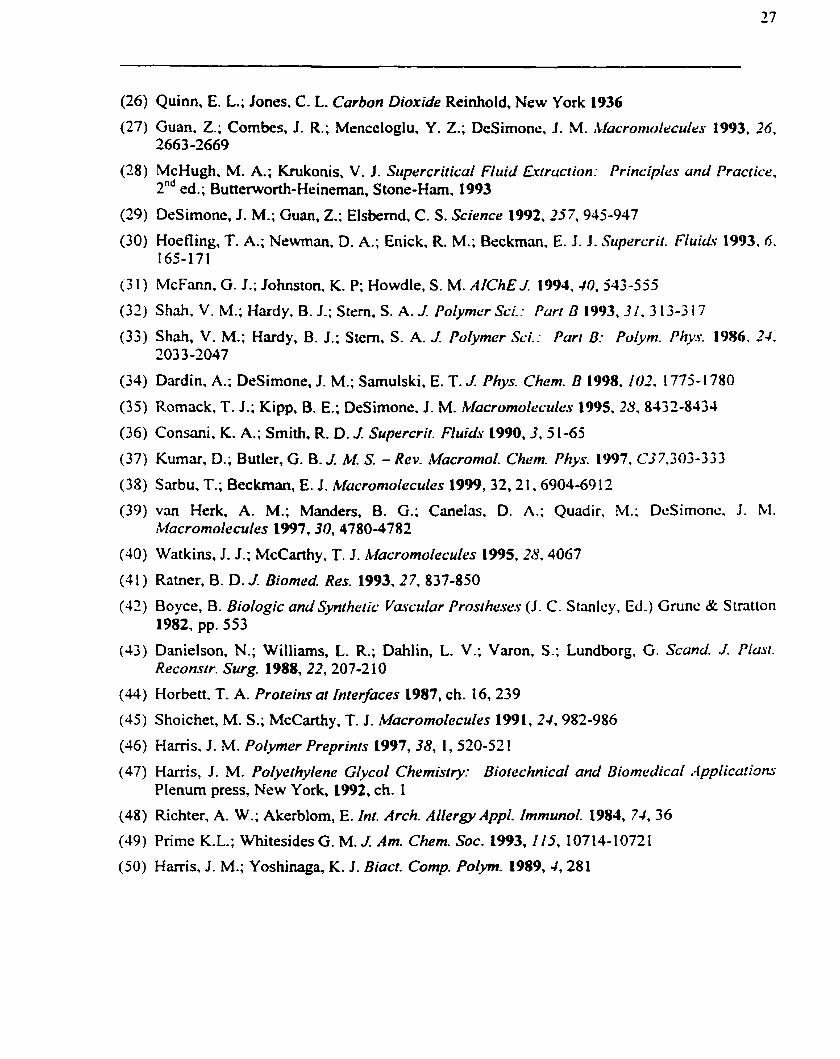
(26) Quinn. E. L.; Jones. C. L. Carbon Dioxide Reinhold, New York 1936
(27) Guam 2.; Combes. J. R.; Menceloglu. Y. 2.; Desirnone. J . M . iLfucromolrcules 1993, 26, 2663-2669
(38) McHugh, M. A.; ffikonis. V. I. Supercritical Fluid Exmction: Principks und Practicr, 2nd ed.; Buttenuorth-Heinernan, Stone-Ham. 1993
(29) DeSimonc, J. M.; Guan, 2.; Elsbernd, C. S. Science 1992,257,943-947
(30) Hoefiing, T. A.; Newman. D. A.; Enick, R. M.; Beckmm. E. J . J . Sqerçrit. Fiuids 1993. ri. 165-171
(3 1) McFann, G. J.; Johnston. K. P; Howdle, S. M. AfChEJ. 1994.40. 543-555
(32) Shah. V. M.; Hardy, B. 1.; Stem. S. A. J Polyrner Sci: Porc i? 1993.31, 3 13-3 17
(33) Shah, V. M.; Hardy, B. J.: Stern. S. A. J. Polymcr Sci.: Purt B: Poiyrn. Phys. 1986. 24. 203 3-2047
(34) Dardin, A.; DeSimone, J. M.; SamuIski, E. T. J. Phys. Chem. B 1998. lO2, 1775- 1 780
(35) Romack, T. J.; Kipp, B. E.; DeSimone, J. M. bfucromoleçulc..~ 1995. 28,8332-8434
(36) Consani. K. A.; Smith. R. D. J. Supercrir. Fluids 1990.3, 5 1-65
(37) Kurnar, D.; Butler, G. B. J. hl S. - Rev. Macrornol. C k m . Phys. 1997, C3 7.303-3 3 3
(38) Sarbu, T.; Beckman, E. J. bfucrornokcuics 1999,32,2 1,6904-60 12
(39) van Herk, A. M.; Manders, B. G.; Canelas, O. A.; Quadir, M.; DcSimonc. J . M. A4acromolecules 1997,30,4780-4782
(40) Watkins, J. J.; McCarthy, T. 1. Itlacrornokcufes 1995,2Y, 4067
(4 1 ) Ratner, B. D. J. Biorned. Res. 1993,27, 837-850
(42) Boyce, B. Biologic and Synrhetic Vasczriar Prns~hc'sc's (J. C . S tanlcy, Ed.) Grunc & S tratton 1982, pp. 553
(43) Danielson, N.; Williams, L. R.; Dahlin, L. V.; Varon. S.; Lundborg, G. Scand J. Piust. Reconsrr. Surg. 1988, 22,207-2 10
(44) Horbett, T. A. Proteins ut Interfaces 1987, ch. 16,239
(45) Shoichet, M. S.; McCarthy, T. J. Mucrornoiccules 1991,24982-986
(46) Harris, J. M. Poiymer Preprints 1997, 38, 1,520-52 1
(47) Harris, J. M. Poiyethylene Glycol Chentistry: Bio technical and Biomer, Plenum press, New York, 1992, ch. 1
(48) Richter, A. W.; Akerblom, E. Int. Arch. AZlergy Appl. Irnrnunol. 1983, 74,36
(49) Prime K. L.; Whitesides G. M. J: Am. Chem. Soc. 1993, 115, 10714-1072 1
(50) Harris, J. M.; Yoshinaga, K. J. Biacf. Comp. Polym. 1989, 4,28 1

2 HOMOPOLYMERIZATION OF HYDROCARBON TRIFLUORO- VINYL ETHERS'
2.1 Introduction
The homopolymeriution of threr new TFVE monomers was investiyatcd. As shown in
Figure 2.1, the monomers havc an oligosthylenr oxide pendant group in common and differenr
terminal funciional groups. The presence of the oligo-ether pendant group may rrndcr the
tluoropolymer Iess protein adsorptive.' thsreby making thcrn dcsinblç t o r biorncdiwl
applications. Funhemorc, the rrrr-Bu-TFVE is a protccted alcohol. nllowing for funher
modification of the polymer post polymeriration. Thc Ph-TFVE providcs ü morc ngid
polymeric structure and was expectcd to havc a highcr glass transition temperaturc (Td.
Figure 2.1. Homopolymerization of 1 -(2-alkoicy-ethoxy)- 1,2,2-trifluoroethenes (TFVEs): Et- TFVE, rerr-Bu-TFVE, and Ph-TFVE.
Although not investigated here, it was also anticipated that these new TFVE polymers
would have properties different from those with fluorinated pendant groups. it was thought that
the inherent incompatibility between the hydrophobic/oleophobic perfluorinated backbone and
the hydrophiiic oligo-ether pendant group would lead to micro- or nano-scale domains. When
+ Lousen berg R. D.; Shoichct, M. S., J. Polymer Sci. : Part A: Polym. Chem. 1999.3 7,330 1-3308
28

used as additives in blcnds. the TFVE polyrners might enrich the surface while the pendant
oligo-cthrr group would anchor the polymrr within the bulk. The fluorocarbon brickbone may
enhance the longevity of the additive at the surface.
Before the propertics of new fluoropolyrners could be investigated. they had to be
s y nt hesized. Thus, aqucous emulsion methodology previousl y described for rhc: pol ymerïzation
of tluorocarbon TFVES" was used For the polymerization of the hydrocarbon TFVEs. Given the
unique structure of these rnonomers. it kvas anticipated that the polymcrizrition would be
cornplex. Thus, the effccts of reaction temperature and initiritor concentration werc investigritcd
with regard to molar m a s , polydispersity index (PDI), and yield. To undcrstrind the mcchanisms
of tcrmination and chain transfer, the polymers wcre characterizcd by 'H-NMR. "'F-NMR. and
FTIR.
2.2 Rcsults
1.2. i Emulsion Hornopolymerimion of Er-TFVE, rcrt-Bu-TFVE and Ph-TFLE
PoIy(Et-TFVE), poly(rerr-Bu-TFVE), and poly(Ph-TFVE) wcrc homopolymcrized by frcc
radical aqueous emulsion polymerization using a sodium dodecylsulhtc surfactant and
potassium persulfate/iron (II)/sodium hydrogensulfite redox initiation, at 1 mol% relative to
monomer. The polymers were initially characterized by gel permeation chromritography (GPC)
relative to polystyrene standards and differentid scanning calorirnetry (DSC). Poly(Et-TFVE)
and poly(terî-Bu-TFVE) were transparent, highly viscous liquids. both of which had a glass
transition temperature (Td of-6Q°C. Poly(Ph-TFVE) was a white powder with a Tg of 23°C. As
shown in Table 2.1, the polymers were initially prepared at 26OC or 30°C.
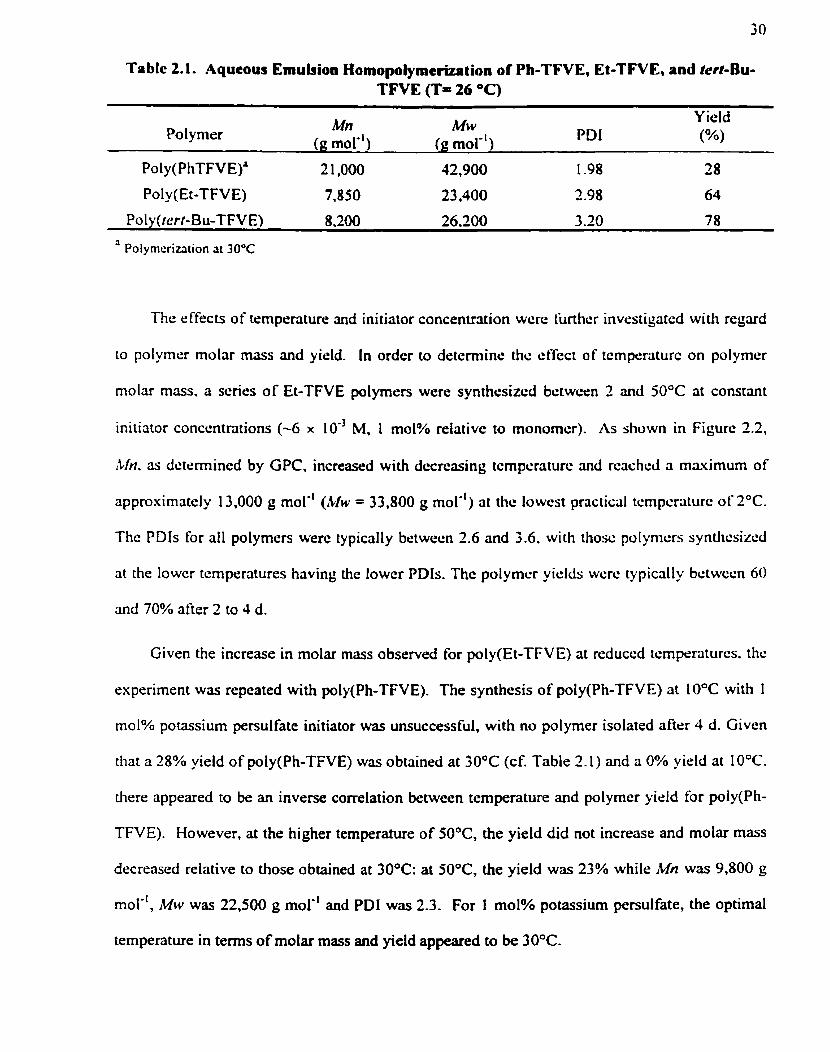
Table 2.1. Aqucous Emuisioa Homopolymeriution of Ph-TFVE, Et-TFVE. and teif-Bu- TFVE (T= 26 O C )
Mn MW Y ield Polymer
(p mol") (g mol-' ) PD1 ("A)
Pol y(PhTFVE)' 2 1,000 42,900 1.98 28
Poly(Et-TFVE) 7,850 23,400 2.98 64
Poly(rërt-Bu-TFVE) 8,200 26.200 3 -20 78
Polymerization at 30°C
The effects of tempenture and initiator concentration wcrc hrther invcstiçatcd with regard
to polymcr molar m a s and yield. In ordcr to detcnninr: thc ctTect of tcmpttmturc on polymer
molar m a s , a series of Et-TFVE polymers wcte synthcsizcd betwcen 2 and 50°C at constant
initiator conccntntions (-6 x 10" M. 1 mol% relative to monomer). As shown in Figure 2.2.
?Lin. as dctrrrnincd by GPC, increased with dccrcasing tcmpcraturc and rcachcd a maximum of
approximately 13.000 g mol-' (ltlw = 33.800 g mol-') at thc lowcst practiçiil tcmpcraturc of2"C.
The PDIs for al1 polymers werc typically between 1.6 and 3.6. with thosc polymcrs synilicsizcd
at the lowcr tcmperatures having the lowcr PDIs. The polymcr yiclds wcrc typically bctwccn 60
and 70% after 2 to 4 d.
Given the increase in molar mass observed for poly(Et-TFVE) at reduced tcmpenturcs. thc
experiment was repeated with poly(Ph-TFVE). The synthesis of poly(Ph-TFVE) at 10°C with 1
mol% potassium persulfate initiator was unsuccessful, with no polymer isolated afier 4 d. Givcn
that a 28% yield of poly(Ph-TFVE) was obtained at 30°C (cf. Table 2.1) and a 0% yield at 10°C.
there appeared to be an inverse correlation between temperature and polymer yield for poly(Ph-
TFVE). However, at the higher temperature of 50°C, the yield did not increase and molar mass
decreased relative to those obtained at 30°C: at 50°C, the yield was 23% while Mn was 9,800 g
mol", MW was 22,500 g mol*' and PD1 was 2.3. For 1 mol% potassium penulfate, the optimal
temperature in terms of molar mass and yield appeared to be 30°C.

O 10 20 30 40 50
Temperature ( OC)
Figure 2.2. The moIar mas of poly (Et-TFVE), as dctcrmined by GPC. dtxreased with increasing tempemturc.
Since 25 x 10" M potassium persulfate has bcen uscd to initiate the emulsion
polymerization of other fluorocarbon TFVES.' it was thought that the initiation process for
poly(Ph-TFVE) may be inefficient. In an attempt to produce higher rnolar mass poly(Ph-TFVE)
in greater yields, thc effect of initiator concentration was investigatcd by succcssively doubling
the concentration of potassium persulfate. As shown in Table 2.2. the isolatcd yield of poly(Ph-
TFVE) increased with potassium persulfate concentration. The potassium persulfate
concentration had no significant effect on Mn until the highest concentration (25 x 10" M, 4
mol%) where Mn decreased by approximately 25% overall. Although the yield was high (75%).
the latex was unstable at this high initiator concentration, resulting in partial precipitation of the
polymer and likely accounting for the lower Mn observed.
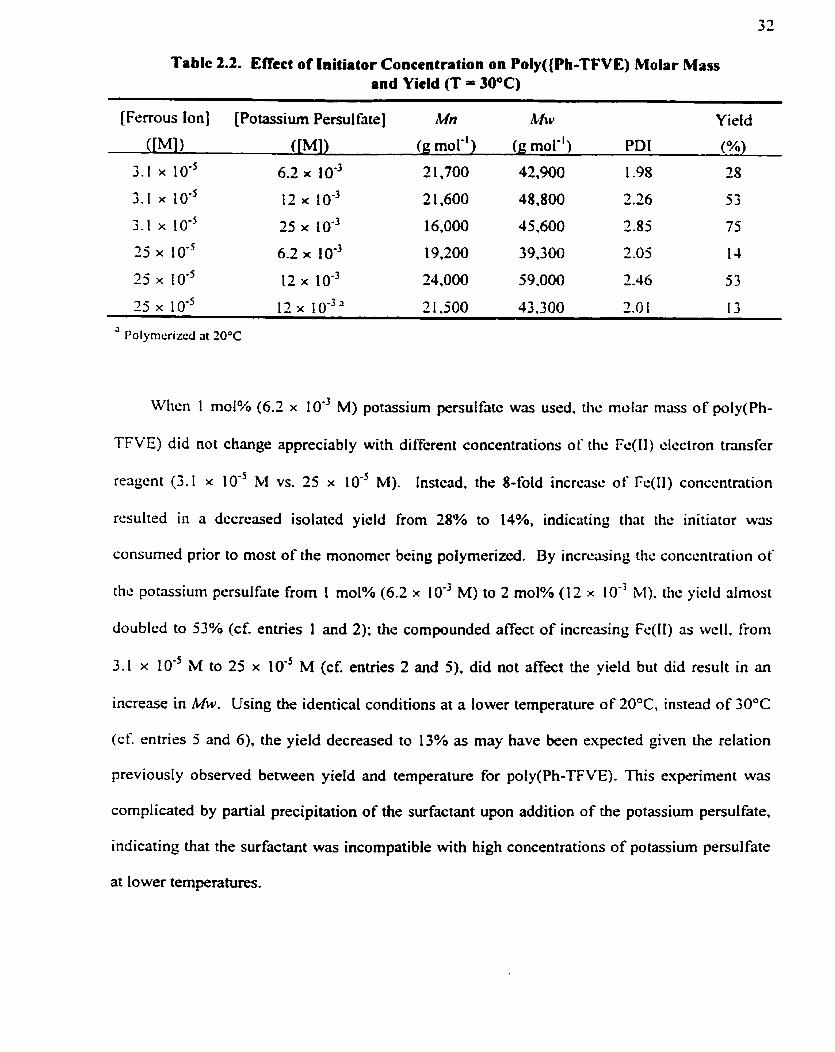
Table 2.2. Effect of lnitiator Concentration on Poly((Ph-TFVE) Molar Mass and Yield (T = 30°C)
[Ferrous Ion] [Potassium Persul fate] M n hfw Y ield
Whcn 1 mol% (6.2 x 10" M) potassium persulfatc was used. tlic molar mars of poly(Ph-
TFVE) did not change appreciably with diffcrent concentrations of thc Fc(l1) clcctron transfcr
reaçent (3.1 x IO-' M W. 25 x IO-' M). Instcad. the 8-fold incrcasc of Fc(11) conccntration
resulted in a decreased isolated yield from 28% to 14%, indicating that thc initiator wûs
çonsumsd prior to most of the monorncr being polymerized. By incrcuing ~ h c conccntrotion of
the potassium persulfate €rom 1 mol% (6.2 x IO" M) to 2 mol% (12 x 10" M). the yicld almost
doubled to 53% (cf. entries 1 and 2); the compounded affect of incrcasing Fc(l1) as wcll. from
3.1 x M to 25 x 10" M (cf. entries 2 and 5) . did not affect the yield but did result in an
increase in MW. Using the identical conditions at a lower temperature of 20°C, instead of 30°C
(cf. rntries 5 and 6) . the yield decreaçed to 13% as may have been expected given the relation
previously observed between yield and temperature for poly(Ph-TFVE). This experirnent was
complicated by partial precipitation of the surfactant upon addition of the potassium persulfate,
indicating that the surfactant was incompatible with high concentrations of potassium persulfate
at lower temperatures.

The effects of temperature and initiator concentration on polymer molar mûss werc evidcnt
and could be used to elucidate the polymeriwtion mechanism. As was s h o w in Figure 2.2. the
resulting Mn of poly(Et-TFVE) were lowcr than may have been axpeçtcd. piven that rdativrly
low initiator concentrations were used and propagation rnay be exprctrd to bc: fast relative to
4 termination on a carbon radical which bears electron withdrawing groups. Whilc tor tluorinatrd
polymcr systems, radical recombination has been suggestcd as thc predominant mode of
termination. this was unlikely for the hydrocarbon TFVEs which had PD[s grcatcr thm or cqud
to 2. As was show in Table 2.2, for low isolated yields o f poly(Ph-TFVE) (i-C. icss than 30%).
ihc: PD1 approachcd a lirniting value of 2. suggcsting termination by disproportionaiion." In an
attcmpt to rationalize thc limited molar masses achicved for pol y(Et-TFVE) and understand the
disproportionation rnrchanisrn suspectcd for poly(Ph-TFVE). thc polymcrs wcrc further
charncterized by FTIR and 'H-NMR.
2.7.2 ~llechanisms o/ Chain Transfir und Termination
To investigate possible mcchanisms of c h a h transfer or termination. the polymcrs werc
chonctcrized by FTIR A weak carbonyl pcak at -1 770 cm-', which was not present in m y of
the reagents prior to polymcrization. was observed in the I;T(R spcctra of al1 thrcc
homopolymers. A similar absorption has been previously observed during the polyrncrization of
1 -tluoroalkoxy- l.2,2-trifluoroethenes and explained by p-scission.' The FTIR carbonyl
absorption observed herein was ascnbed to p-scission as well. As shown in Figure 2.3. P-
scission results fiom homolytic cleavage of the carbon-oxygen bond that is two positions away
from the propagating macro-radical, leadin$ to the formation of a carboxylic acid end group. via
an acid fluoride intermediate, and a radical species which may initiate a new polymer chain.
Furthemore, the acid fluoride intermediate was later observed directiy by FTIR, with an
absorption at 1874 cm-', for bulk-polymerized Ph-TFVE. The assignment of the FTIR peak was

34
confimicd by comparison to a small moleculeV clF2CCOrH. which has o carbonyl absorption at
1772 cm".
Figure 2.3. Chain transfer by p-scission of the propagating rnacro-radical. R is 2-cthoxyethyl. 2-lm-butoxyethyl, or pheny!.
The disproportionation mechanisrn suspctcd for poly(Ph-TFVE) may ba explainrd by P-
scission, which c m be viewcd as a unimolecular disproportionation. Thus. it is litely that P-
scission is the predominant mode controlling Mn of poly(Ph-TFVE) under the aqueous emulsion
conditions employed herein. For poly(Et-TFVE), molar m a s increased as the polymerization
temperature decreased, likely as a resulr of suppressed fbscission relative to propagation (cf.
Figure 2.2).
Since radicaIs on carbon bonded to fluorine are very eiectrophilic and can abstract
hydrogen from many hydrocarbon-containing cornpounds~ it was suspected that hydrogen
abstraction might be Further limiting rnolar mas . it is for this reason that synthesis of high molar
mass polymers of I -perfluoropropoxy- l,2,2-trifluoroethene (PPVE) and tetrafluoroethylene
(TFE) are limited to media such as aqueous emulsions, fluoro/perfluorocarbon solvents, and
supercritical CO^. ' H-NMR was used to determine whether hydrogen abstraction was involveci
in the polymerization mechanism. In addition to the peaks expected based on the monomer
composition, the 'H-NMR spectra of al1 poly(Et-TFVE)s and poly(tert-Bu-TFVE) had a broad
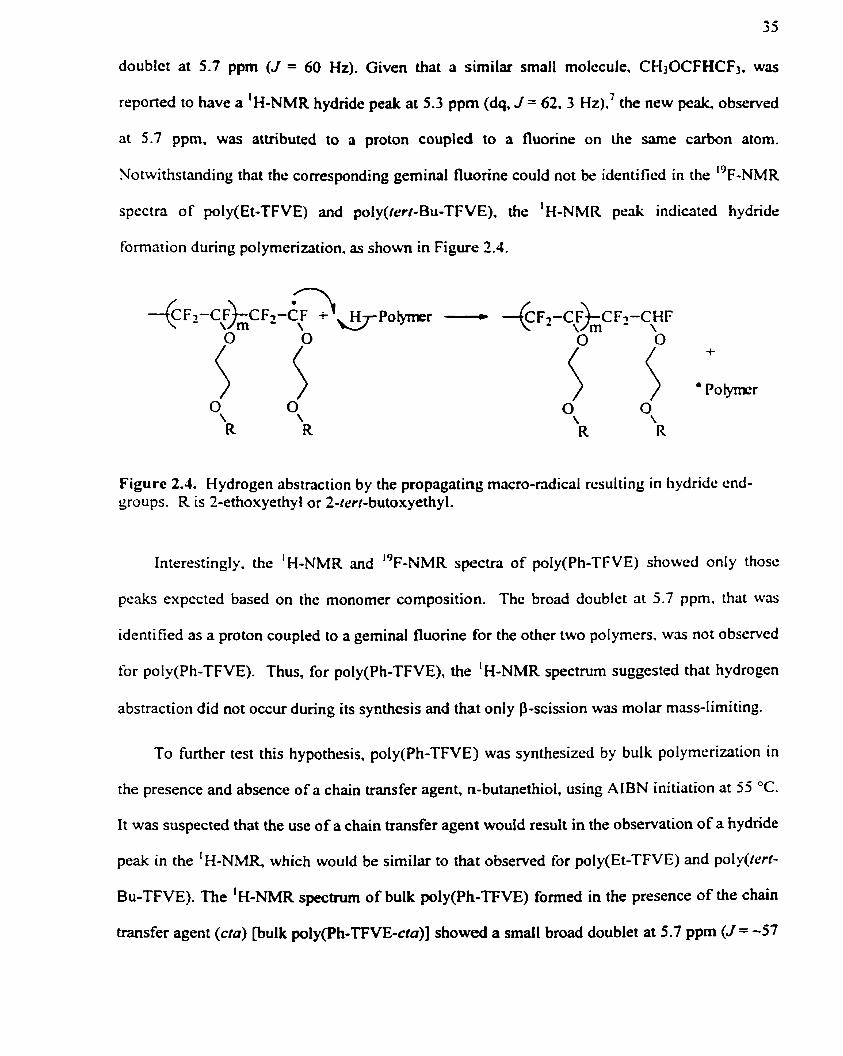
doublet at 5.7 ppm (J = 60 Hz). Given that a similar small molccule. CH30CFHCF3, was
reponed to have a 'H-NMR hydride peak at 5.3 ppm (dq, J = 62. 3 HZ).' the new peak. observed
at 5.7 ppm. was attributed to a proton coupled to a fluorine on the s m e carbon atom.
Notwithstanding that the corresponding geminal fluorine could not be identificd in the "F-NMR
spectra of poly(Et-TFVE) and poly(cerc-Bu-TFVE), the 'H-NMR peak indicated hydride
fornation during polymerization, as shown in Figure 2.4.
Figure 2.4. Hydrogen abstraction by the propagatinp mûcro-radical rcsulting in hydride end- groups. R is 2-ethoxyethy 1 or 2-cerf-butoxyethyl.
Interestingly. the 'H-NMR and ' 9 ~ - ~ ~ ~ spectra of poly(Ph-TFVE) showed only thosc
pcaks expected based on the monomer composition. Thc broad doublet at 5.7 ppm. that was
identified as a proton coupled to a geminal fluorine for the other two pol
for poly(Ph-TFVE). Thus, for poIy(Ph-TFVE), the 'H-NMR spectrum
abstraction did not occur during its synthesis and that oniy p-scission wa
ymers, was not observed
suggestcd that hydrogen
s molar mass-limiting.
To further test this hypothesis, poly(Ph-TFVE) was synthesized by bulk polymerization in
the presence and absence of a chah ~ a n s f e r agent, n-butanethiol, using AIBN initiation at 55 OC.
It was suspected that the use of a chain transfer agent would result in the observation of a hydride
peak in the 'H-NMR, which would be similar to that observed for poly(Et-TFVE) and poly(fert-
Bu-TFVE). The 'H-NMR spectnun of bulk poly(Ph-TFVE) fonned in the presence of the c h i n
transfer agent (cta) [bulk polyvh-TFVE-da)] showed a srnail broad doublet at 5.7 ppm ( J = -57
36
132) whrreas that of bulk poly(Ph-TFVE). fomed in the absence of the chain transfer agent,
showed no hydride peak. The presence of a wcak carbonyl pcak at -1 770 cm-' in the FTIR
spectra of both polymers indicated P-scission. As determincd by GPC. the bulk poly(Ph-TFVE-
çra) had a M n of 6.600 g mol'' and a MW of 11,200 g mol-' whercas bulk poly(Ph-TFVE) had a
M n of 8,100 g mol-' and a rClw of 15.400 g mol-'.
In order to understand thc role of hydrogen abstraction in the polymrriuiion mcchmism.
thc 'H-NMR data for poly(Et-TFVE) and poly(rcrr-Bu-TFVE). shocvn in Table 7.1. \vas uscd to
- calculate the degrec of polymerivtion (y. ) by end-group analysis. S. wcre calculated using
the normalized ratio of protons in the pendant ethrr group to that of the hydride. Poly(Et-TFVE)
had an ,Yn of 7.7 2 0.4. corresponding to a M n of 1.650 g mol*' as dctsmincd by end group
mnlysis. yet a GPC-determined hfn of 7.850 g mol*'. Similarly. poly(rert-Bu-TFVE) had an 7.
of 9.1 + 0.4. corrcsponding to a &ln of 7.200 g mol" as detennined by end group analysis. yct a
GPC-detemined Mn of 8,200 g mol-'. Notwithstanding that GPC mcasurcs rnolar mass
indirectly through hydrodynamic volume, the differenccs in iL/n arc likcly signiticant and may
indicrite that multiple hydrides formed pcr polymer chain. thcrcby lowcring the rLfn calçulatcd by
end group analysis relative to that calculated by GPC. Multiple c h a h trruiskr rcactions pcr
polymer chain may have occurred if the radical that was fonned by abstraction continued to
propagate. Figure 2.5 summarïzes the effect of temperature on the Mn of poly(Et-TFVE). ûs
calculated by end-group analysis from 'H-NMR data. The data in Figure 2.5 is consistent with
that in Figure 2.2 where Mn increased as temperature decreased. The data in Figure 3.5 also
indicate that hydrogen abstnction was suppressed relative to propagation at Iower temperatures.

O 10 20 30 40 50
Temperature ( OC)
Figure 2.5. The molar mass of poly(Et-TFVE), calculated by end-group analysis from 'H-NMR data, decreased with increasing temperature.
2.3 Discussion
The emulsion polymerizations of Et-TFVE and rert-Bu-TFVE appeared to follow similar
mechanisms, leading to a FTIR carbonyl absorption at 1770 cm-', a n b e d to p-scission, and a
'H-NMR resonance at 5.7 pprn, ascribed to hydrogen abstraction. By cornparison to the 'H-
NMR of a small molecule, CH30CFHCF3, I was confident that this resonance had been correctly
assigned. For greater certainty, poly(Ph-TFVE) was synthesized by bulk polymerization in the
presence and absence of n-butanethiol, a chah transfer agent. The 'H-NMR spectrum of bulk
poly(Ph-TFVE-cta) had a broad doublet at 5.7 pprn, similar to that observed for poly(Et-TFVE)
and poly(iert-Bu-TFVE). thereby confiming the presence of hydrogen abstraction in the
synthesis of poIy(Et-TFVE) and poiy(rert-Bu-TFVE).
Although the presence of hydrogen abstraction during the synthesis of poIy(Et-TFVE) and
poly(tert-Bu-TFVE) had k e n observed, where the source of the abstracted hydrogen had not
been ascertained. It was likely tbat the propagating macro-radical abstracted hydrogen fiom the
pcndant hydrocarbon ethcr group. leading to hydride formation and potentially low molar mass
polymrirs. However. it was not clrar which pendant group o r what pans of the pcndant group
were underpoing hydmgen abstraction. If h y d r o p n was abstracted from a pendant group that
was within thc same c h a h as the propagating macro-radical. part of the pendant group may br
incorponted into the backbone, potentially resulting in branchcd polymïrs. Funhc.rmorc. if
hydrogen abstraction was interrnolecular in nature. branchcd polymers would most likcly havc
t'ormed.
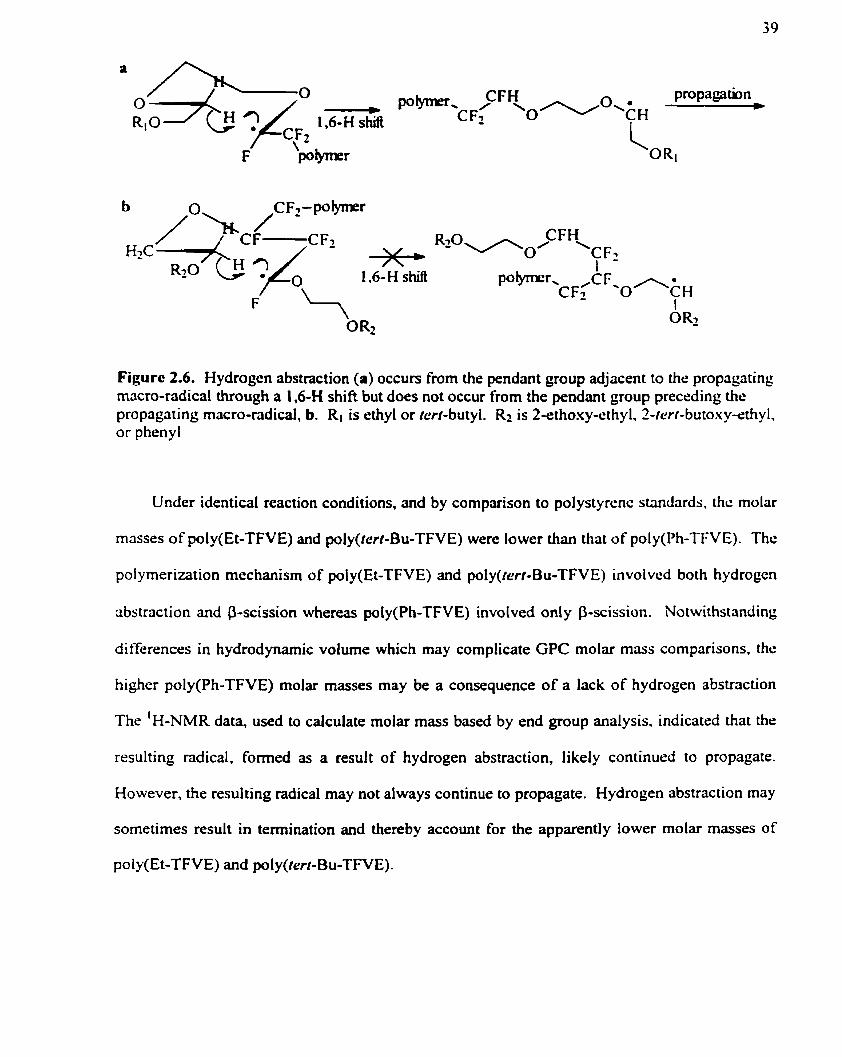
Given that hydrogen abstraction was observed only in poly(Et-TFVE) and poly(rer1-Bu-
TFVE) and not in poly(Ph-TFVE). suggested that abstraction was a localizcd intramulccuItir
proccss. likcly occurring through a 1.6-H shift frorn the mcthylcnc of thc pcndant group adjriccnt
to thc propagating macro-radical. Ali three polymcrs havc an oxygcn aiom at thc tilili position
of the adjacent pendant group; at the sixth position, poly(Ph-TFVE) has an aromatic ring. Whilc
ri 1.5-H or 1 . 6 4 shift from the TFVE pendant group prcceding thc propagating mricro-rridical
can also bc rationalizcd. this was unlikely given that hydrogcn abstraction was not widcnt in
poly(Ph-TFVE). Thus, the differcncc at position six of the adjaccnt pcndant group. and possibly
beyond. likely accounts for the source of hydrogen. Figure 2.6 rcprcscnts a possiblc mcchanisrn
for radical hydrogen abstraction through a 1.6-H shift €rom the adjacent but not thc prcceding
pendant group.
The yield o f poly(Et-TFVE) was greater than that of poly(Ph-TFVE) under similar
polymerization conditions. While the yield of poly(Et-TFVE) was unaffected by temperature.
that of poly(Ph-TFVE) seemed to be temperature-dependant. In addition, the yield of poly(Ph-
TFVE) increased with initiator concentration. These results suggested that initiation of Ph-
TFVE was less efficient than that of Et-TFVE. This may be a consequence o f different
monomer partitioning in the aqueous phase.
CFH Rzo-,,3.0 \ CF2 I
Figure 2.6. Hydrogcn abstraction (a) occun from the pendant group adjacent to the propagating macro-radical through a 1.6-H shiA but does not occur from the pendant group preceding the propagating macro-radical, b. RI is ethyl or rwr-butyl. Rz is 2-ethoxy-ethyl, 2-rerr-butoxy-ethyl. or phenyl
Under identical reaction conditions, and by cornparison to polystyrenc standards, thc molar
masses of poly(Et-TFVE) and poly(rert-Bu-TFVE) were lower than that of poly(Ph-TFVE). The
polymerization mechanism of poly(Et-TFVE) and poly(rcrt-Bu-TFVE) involved both hydrogcn
abstraction and p-scission whereas poly(Ph-TFVE) involved only 0-scission. Notwithstmding
di fferences in hydrodynamic volume which may cornplicate GPC mol= mass comparisons. thc
higher poly(Ph-TFVE) molar masses may be a consequence of a lack of hydrogen abstraction
The 'H-NMR data, used to calculate rnolar mass based by end group analysis. indicated that the
resulting radical, formed as a result of hydrogen abstraction, likely continued to propagate.
However, the resulting radical may not always continue to propagate. Hydrogen abstraction may
sometimes result in temination and thereby account for the apparently lower molar masses of
poly(Et-TFVE) and poly(terz-Bu-TFVE).

Prime K.L.; Whitesides G. M. J. Am. Chem. Soc. 1993, l l j , 10714-10721
Eueil. B. R.; Carl. W. P.; Mod, W . A. UnitedSfates Patent 4.515.989 1985
Kotov. S. K.; Pedersen. S. D.; Qiu, W.; Qiu. 2.; Burton. D. J. J. Fluor. Chem. 199'1.82. 13
Odian. G. Principles of Pofymerization 2nd Edition. John Wiley & Sons. New York. 1981
DeYoung. J. P.: Romack. T. 3.; Desirnone, J. M . Polymer Preprinrs 1997.361. 2.424-5
Rornack. T. J.: Desirnone, J. M.; Treat. T. A. Macromolcculrrs 1995.28. 8429-3 1
Rozov. L. A.; Rafalko, P. W.: Evans. S. M.; Brokunirr. L.; Ramig. K. J. Org. Chcm. 1995. 60, 13 19-25
3 COPOLYMERIZATION OF TIUFLUOROWNYL E T H R S WITH ETHYL VINYL ETHER AND WNYL ACETATE'
3.1 Introduction
As discussed in chapter 2, hydrocarbon TFVEs have a complicated polyrnerization
mechanism that involves both hydrogen abstraction andor p-scission by the propagating radical,
the latter of which was dso observed for fluoro/perfluorocarbon TFVEs. When the molar mass
data obtained by GPC, were compared with those obtained by 'H-NMR end-group analyses.
there appeared to be multiple hydnde end-groups per poIymer chah, indicating that the resulting
rnacro-radical on the oligo-ether pendant group was capable of re-initiating polymerization
across the fluorocarbon double bond. This suggested that copolyrners of vinyl ether monomers
and hydrocarbon TFVEs might be prepared by the same redox-initiated emulsion
polymerization.
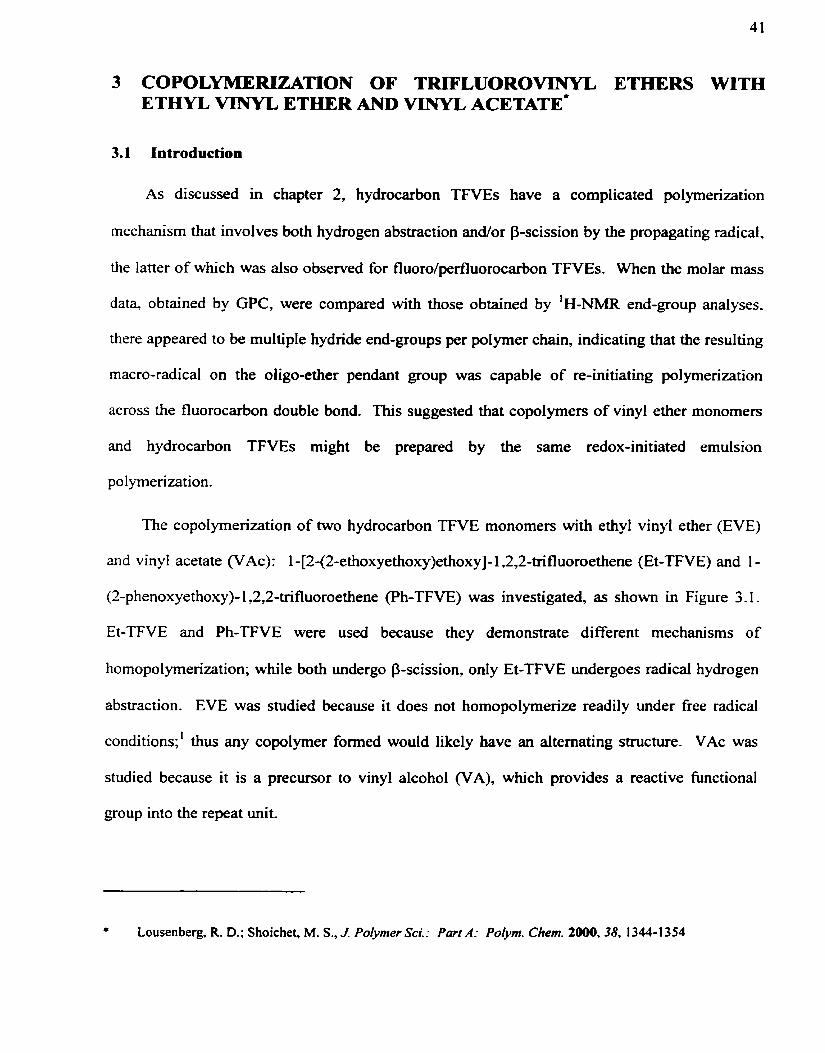
The copolymerization of two hydrocarbon TFVE monomers with ethyl vinyl ether (EVE)
and vinyl acetate (VAc): 1 -[2-(2-ethoxyethoxy)ethoxy]- l,2,2-trifluoroethene (Et-TFVE) and 1 -
(2-phenoxyethoxy)- l,2,2-trifluoroethene (Ph-TFVE) was investigated, as shown in Figure 3.1.
Et-TFVE and Ph-TFVE were used because they demonstrate different mechanisms of
homopolyrnerization; while both undergo p-scission, oniy Et-TFVE undergoes radical hydrogen
abstraction. EVE was studied because it does not homopolymerize readily under fiee radical
conditions;' thus any copolymer formed would likely have an alternathg structure. VAc was
studied because it is a precursor to vinyl alcohol (VA), which provides a reactive functional
group into the repeat unit.
* Lousenberg, R. D.; Shoichet, M . S., J . Pofymer Sci.: Part A: Po[ym. Chem. 2000.38, 1344-1354

42
Given the aliemating structure obscrvcd for copolymers of elcctron-rich and electron-poor
monomers.' it was suspected that the TFVEs would copolymerize azeotropically with EVE and
possibly VAc. in order to detennine rertctivity ratios, a series of Ph-TFVE copolymers were
prcpared under bulk conditions, thercby avoiding any differences related to monomcr
partitioning or diffusion in an aqueous emulsion.' Copolymer compositions. of bulk
polymerized Ph-TFVE with EVE or VAc, were determined at low monorncr conversions using
1 H- and "F-NMR for a serits of fccd compositions. Reactivity ratios wcre then dctemincd
using the crror-in-variables mode1 (EVM).'
Figure 3.1. Copolymerization of Ph-TFVE or Et-TFVE with VAc or EVE to prepare: a; poly(Ph-TFVE-CO-VAc). b; poly(Ph-TFVE-CO-EVE), C; poly(Et-TFVE-CO-VAC). d: poly(Et- TFVE-CU-EVE).

43
Copolymers of poly(TFVE-CO-VAc) served as precurson to two new terpolyrnen as a
rcsult of pmial h ydrol ysis of vinyl acewte groups: pol y(Ph-TFVE-CO-V Ac-CO-VA) and pol y(Et-
TFVE-CO-VAc-CO-VA), as shown in Figure 3.2. FTIR was used to quantitatively estimate the
extent of hydrolysis while GPC was used to dctermine relativc rnolrir mass bcforc and after
hydrolysis, thereby providing some insight into the mechanism of polymerization.
Figure 3.2. Partial hydrolysis of poly(TFVE-CO-VAc) resulting in tcrpol ymcrs. poly(TFVE-CO- VAc-CO-VA). R is 2-ethoxyethyl or phenyl.
3.2 Rcsults
A series of copolymers of Ph-TFVE or Et-TFVE with cithcr EVE or VAc w r c synthcsizcd
by free radical aqueous emulsion polymeriwtion. Poly(Et-TFVE-CU-EVE) was a transparent.
colorless, highly viscous material at room temperature whilc poly(Et-TFVE-CU-VAc) wris a
transparent, colorless material with a rubbery texture at room temperature. The latter would cold
flow if left undisturbed over a penod of days. Both Ph-T FVE-containing copolymers. poly(Ph-
TFVE-CO-EVE) and poly(Ph-TFVE-co-VAc), were white solid materials at room temperature
which formed transparent colorless films when cast from solution. As listed in Table 3.1,
examples of representative polymers generaily had high rnolar masses, were isolated in yields as
high as 80%, and yet were polydisperse. Copolymers of Et-TFVE and Ph-TFVE with EVE
(entries 1-4) appeared to be enriched with the TFVE relative to the monomer feed composition
whereas copolyrners of Et-TFVE and Ph-TFVE with VAc (entries 5-9) were generally slightly
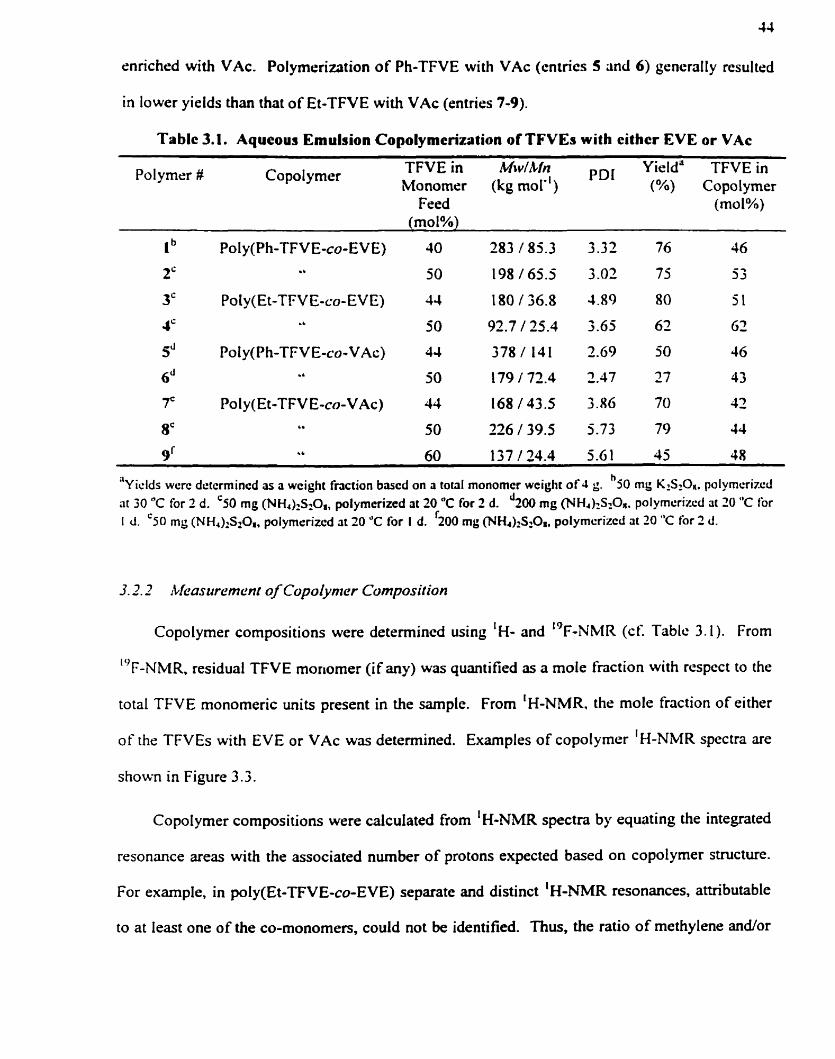
enriched with VAc. Polymerizîtion of Ph-TFVE with VAc (cntrics 5 and 6) gcnerally resulted
in lower yields than that of Et-TFVE with VAc (entries 7-9).
Table 3.1. Aqucous Emulsion Copolymcrization of TFVEs with eithcr EVE o r VAc
Po! ymer # Copol ymer TFVE in Mw/Mn PDI Yield" TFVE in Monomer (kg mol") (%) Copolymer
Feed (moI%) (mol%)
9' C L 60 137/24.4 5.G1 45 48 h
" ~ i e l d s werc detcrmined as a wcight fraction bucd on a total monomer wcight o f 4 g. 50 mg K2S20.. polyrncrizcd d
at 30 "C for 1 d. '50 mg (NH&S201, polyrnnized at 20 '>C for 2 d. 200 mg (NH&S20g. polyrnerizcd at 20 "C h r f
I d. '50 mg (NH,)2S20,, palyrnerizcd 31 20 "C for I d. 200 mg (NH4)2S20#, polyrncrizcd at 70 "C for 2 d .
3.2.1 ~bfeasuremcnr of Copolymet Composition
Copolymer compositions were determined using 'H- and "F-NMR (cf. Tablc 3.1 ). From
1 9 F-NMR, residual TFVE moriomer (if any) was quantified as a mole fraction with respect to the
total TFVE monomeric units present in the sample. From 'H-NMR. the mole fraction of either
of the TFVEs with EVE or VAc was determined. Examples of copolymer 'H-NMR spectra are
shown in Figure 3.3.
Copolyrner compositions were calcuiated from 'H-NMR spectra by equating the integrated
resonance areas with the associated number o f protons expected based on copolymer structure.
For example, in poly(Et-TFVE-CO-EVE) separate and distinct 'H-NMR resonances, attributable
to at least one of the CO-monomers, could not be identified. Thus, the ratio of methylene ancilor
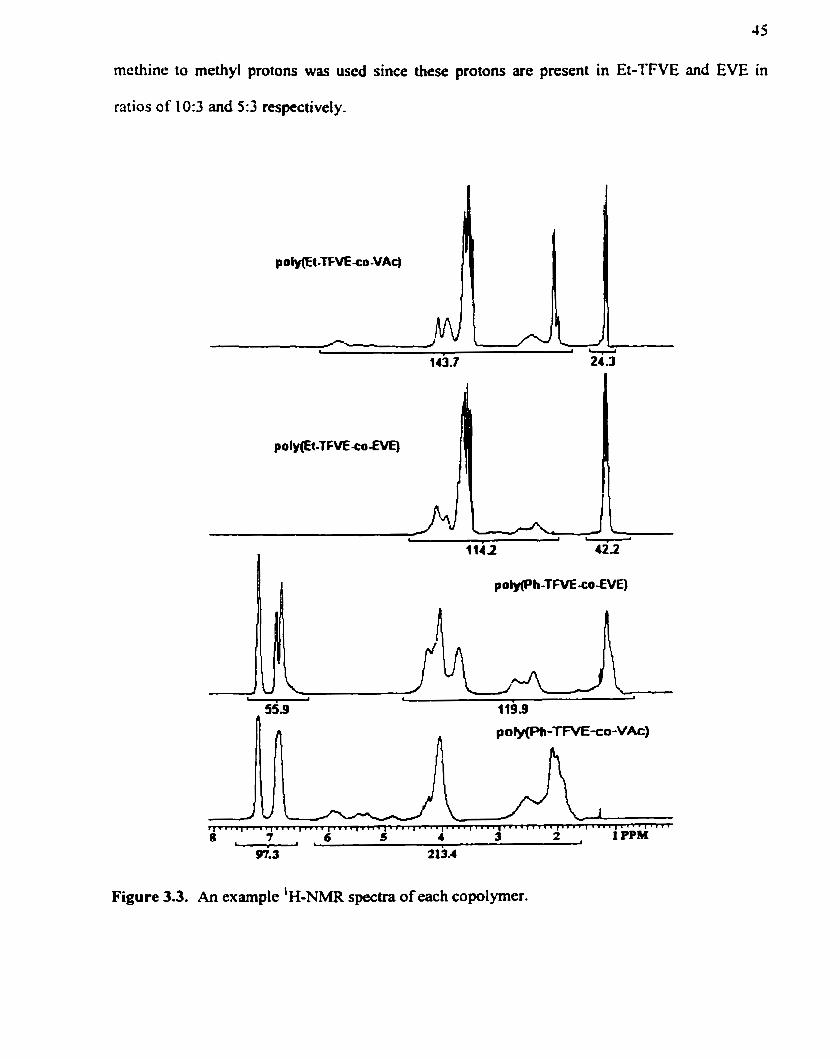
45
methine to methyl protons was used since these protons are present in Et-TFVE and EVE in
ratios of 103 and 5:3 respectively.
pol ~(€1-TFVE ro-EVE)
Figure 3.3. An example 'H-NMR spectra of each copolymer.

The composition of poly(Et-TFVE-CO-EVE) was calculated using equation f3.11:
areas of the methylene/merhine and rnethyl proton resonances respectively. and xat.rr;va is the
mole fraction of polymrrized Et-TFVE in the sarnple. as determined by '"F-NMR. xriirpv~
corrects for the presence of residual Et-TFVE monomer.
[n poly(Et-TFVE-CO-VAc), thc Et-TFVE mcthyl proton rcsonanccs wcrc wcll separateci
tiom ail other resonances and were used to determine copolymcr composition according to
cquation [3.2]:
where clcku is the integnl area of the Et-TFVE rnethyl protons and rnvtlç is the relâtiv~ rnolcs of
VAc in the copolymer sample as calculated by equation [3.3]:
.&Z+VAc is the total integral area of Et-TFVE methylene protons and VAc protons.
In determining the composition of poly(Ph-TFVE-CO-VAc) or poly(Ph-TFVE-CU-EVE), the
aromatic proton resonances of Ph-TFVE were well separated in both copolymers and were used
to similady deterrnine composition according to equation [3.4]:
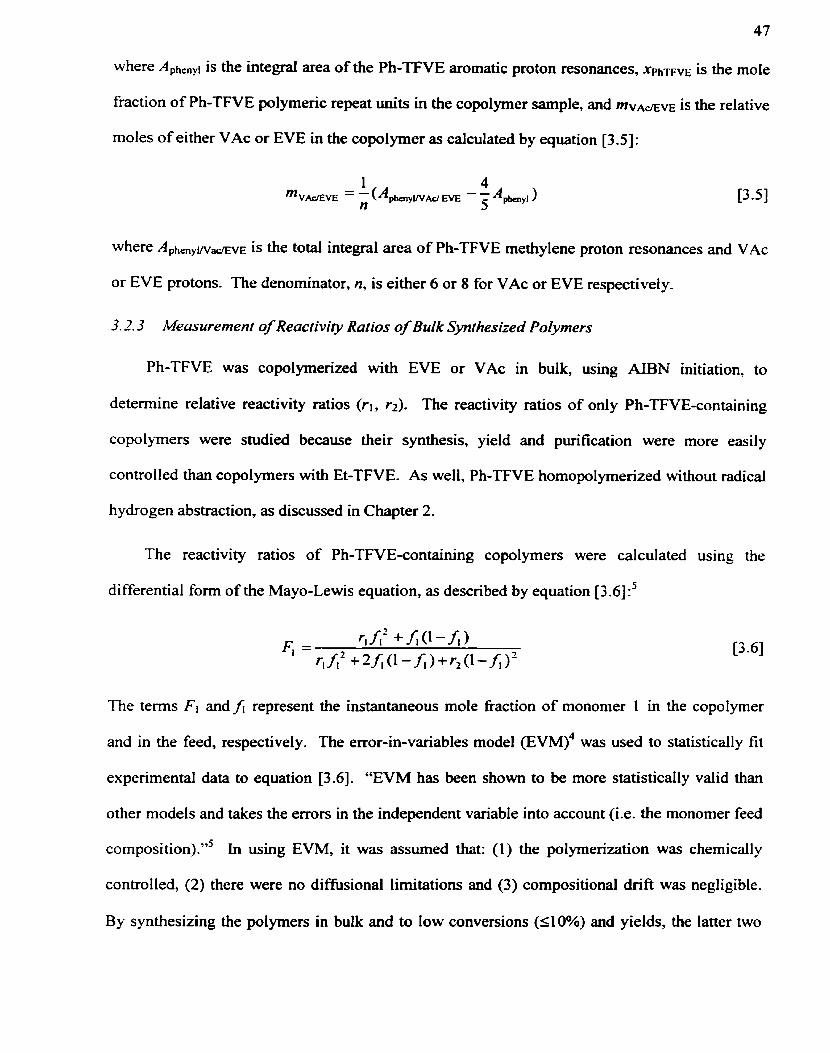
47
where Aphrnyl is the integral area of the Ph-TFVE aromatic proton resonances, XP~TWE is the mole
fraction of Ph-TFVE polymeric repeat units in the copolymer sample, and r n v ~ f i v ~ is the relative
moles of either VAc or EVE in the copolymer as calculated by equation [3.5]:
where AamyvvafivE is the total integrai area of Ph-TFVE methylene proton resonances and VAc
or EVE protons. The denominator, n, is either 6 or 8 for VAc or EVE respectively.
3.2.3 Meusurement of Reactivity Ratios of Bulk Synthesized Po(ymers
Ph-TFVE was copolymerized with EVE or VAc in bulk, using N B N initiation' to
determine relative reactivity ratios ( r l , rz). The reactivity ratios of o d y Ph-TFVE-containing
copolymers were studied because their synthesis, yield and purification were more easily
controlled than copolymers with Et-TFVE. As well, Ph-TFVE homopolymerized without radical
hydrogen abstraction, as discussed in Chapter 2.
The reactivity ratios of Ph-TFVE-containing copolymers were calculated using the
differential form of the Mayo-Lewis equation, as described by equation [3.6]:'
The terms FI andfi represent the instantaneous mole fraction of monomer 1 in the copolymer
and in the feed, respectively. The error-in-variables mode1 (EVM)~ was used to statistically fit
experimental data to equation [3.6]. "EVM has k e n s h o w to be more statistically valid than
other models and takes the errors in the independent variable into account (Le. the monomer feed
~orn~osition)."~ In using EVM, it was assurned that: (1) the polymerization was chemically
controlled, (2) there were no difihional limitations and (3 ) compositional drift was negligible.
By synthesizing the polyrners in bulk and to low conversions (110%) and yields, the latter two

assurnptions were satisfied. The polymerization results for poly(Ph-TWE-CO-EVE) and
pol y( P h-TFVE-CO-VAc) are sumrnarized in Table 3 -2.
Table 3.2. Bulk Copolymcrization of Ph-TFVE with EVE or VAc
Ph-TFVE + EVE
To estirnate reactivity ratios, as implernented by the RREVM" cornputcr progrm. error
0.205 6.7 0.503 52330.1 1.74
0.338 9.3 0.51 7 46.6E6.4 1.77
0.495 1 1.8 0.549 42.4/26.7 1.59
0.583 10.6 0.585 42.9/26.4 1.63
0.649 8.3 0.570 41.4/25.0 1.66
0.69 1 2 0.575 19.8/11.9 1 -66 Il II Il ll 0.644 Il II Il Il 0.632
estimates were required for both the monomer feed composition and the copolymer composition.
0.244 5 .O 0.209 13 1/9 1.2 1.66
0.294 5.2 0.241 1 19/68.9 1.73
0.364 5.0 0.283 89.4/49.7 1-80
0.490 6.7 0.369 7 1.34 1.3 1.73
0.726 12.2 O.JG1 . 1 / 1 8 8 1.76 $9 11 t l ll 0.429
An error cstimate of 0.7% was used for monomer feed compositions. reflecting the prccision of
'Y ields are correctcd to account for residual Ph-TFVE monomer in the copolyrncr sarnpiç.
gravimetric measurernents and estimated monomer purity. An error estimate of 6% was used for
copolymer compositions, reflecting the standard deviation calculated for threr separate 'H-NMR
measurements of the composition of poly(Ph-TFVE-CO-EVE) (cf. last 3 entries in Table 3.2 for
Figure 3.4 is a graphical representation of the estimated reactivity ratios for both copolymer
series and their respective 95% confidence ellipses. Under bulk copolymerization conditions,
Q~-TFVE was 0.25 f 0.07 and ~ E V E was 0.016 f 0.04, indicating that the radical on EVE primariiy

49
cross-propagated with Ph-TFVE whereas the radical on Ph-TFVE was not as selective. Given
that the confidence interval for ~ E M overlaps zero and EVE does not readily homopolymerize
under fiee radical conditions, ~ E V E is likely very close to zero. Under similar bulk
copolyrnerization conditions, r p h - m ~ was 0.034 f 0.04 and r v ~ = was 0.89 + 0.08, indicating that
the radical on Ph-TFVE primarily cross-propagated with VAc whereas the radical on VAc
propagated aimost randomly. Given that the confidence interval of rPh-TF= overiaps zero yet Ph-
TFVE can be homopolymerized, r p h - ~ ~ v ~ i~ likely non-zero.
- A Ph-TFVE + EVE 0 Ph-TFVE + VAc
Figure 3.4. Estirnated reactivity ratios and 95% confidence ellipses for the bulk copolymerization of Ph-TFVE with EVE or VAc. For Ph-TFVE with EVE: r p h - m v ~ = 0.25 k 0.07, ~ E V E = 0.016 k 0.04. For Ph-TFVE with VAC: r ~ h - n v ~ = 0.034 f 0.04, VA^ = 0-89 k 0-08.
The experimental FPh-TF~E VS. fph-rn data (cf. Table 3.2) and the predicted curve based on
estimated reactivity ratios and equation [3.6] for each copolymerization series are plotted in
Figure 3.5. Copolymers of Ph-TFVE and EVE were enriched with Ph-TFVE for lower f p h . ~ ~ ~
yet reached a plateau at higher contents. Copolymers of Ph-TFVE and VAc were enriched with
VAc, with a practical limitation of less than 50% Ph-TFVE incorporated.
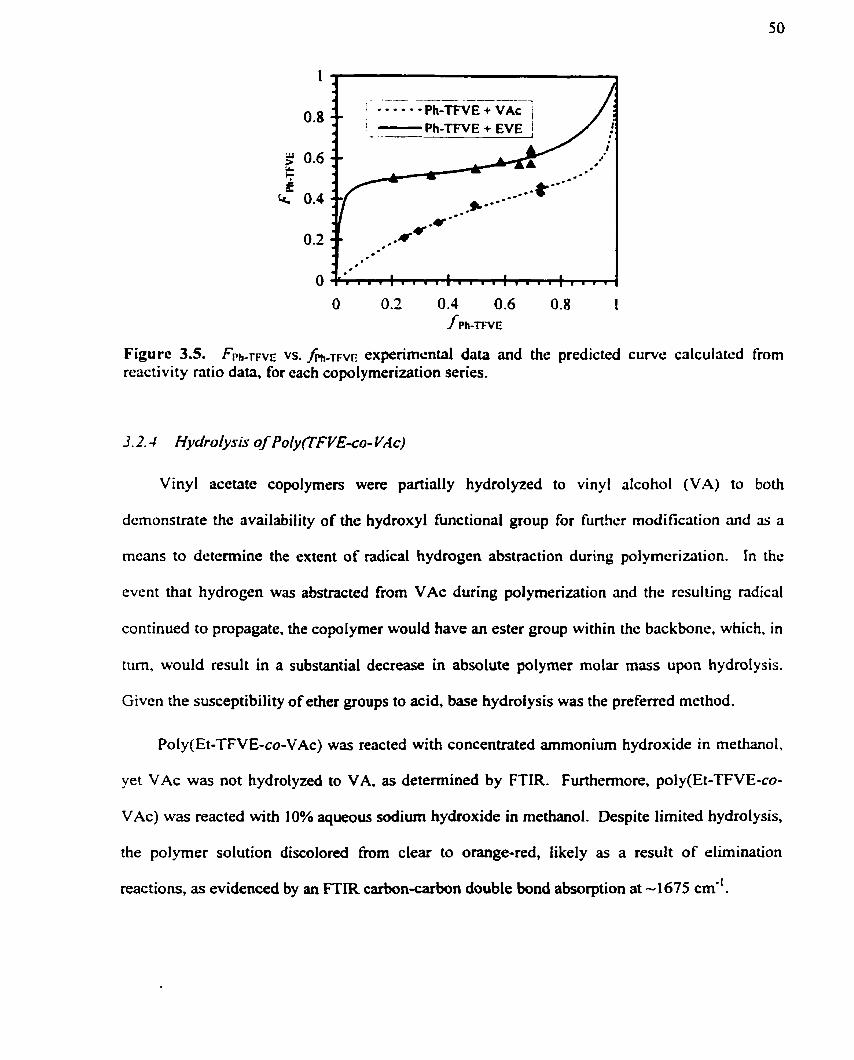
Figurc 3.5. FPL-TFV~ VS. /Ph-TF~E experimental data and the predicted curvc ciilcu1atc.d from reactivity ratio data. for cach copolymerization series.
Vinyl acetate copolymers were partially hydrolyzed to vinyl alcohol (VA) to both
dcmonstrate the availability of the hydroxyl functional group for furthcr modification ruid as a
means to determine the extent of radical hydrogen abstraction during polymçrizrition. In the
event that hydrogen was abstracted from VAc during polymerization and the rcsulting radical
continued to propagate. the copolymer would have an ester group within the backbone. which, in
turn, would result in a substantial decrease in absolute polymer molar mass upon hydroIysis.
Given the susceptibility of ether groups to acid, base hydrolysis was the preferred method.
Poly(Et-TFVE-CO-VAc) was reacted with concentrated ammonium hydroxide in methanol.
yet VAc was not hydrolyzed to VA, as determined by FTIR. Furthemore, poly(Et-TFVE-CO-
VAc) was reacted wi th 1 0% aqueous sodium hydroxide in methanol. Despite limi ted hydrolysis,
the polymer solution discolored fiom clear to orange-red, likely as a result of elimination
reactions, as evidenced by an FTIR carbon-carbon double bond absorption at -1675 cm".

5 l
Reaction o f poly(Et-TFVE-CO-VAc) with sulfuric acid in aqueous rnethanol succnsfully
hydrolyzed VAc to VA. which was confirmed by FTIR. The fraction of hydrolyzed VAc was
calculated fiom the FTIR data by comparing the absorbance of the carbonyl peak before and
after hydroIysis. Assuming similar extinction coeficients for the parent and hydrolyzed polyrner
and correlating absorbance with weight fraction of residual VAc, the sxtcnt of hydrolysis was
calculated. As s h o w in Figure 3.6 for poly(Et-TFVE-CO-VAc) (entry 7. Tablc 3.1). the VAc
carbonyl peak at 1760 cm" decreased while the VA hydroxyl peak at -3400 cm" incrcaçcd and
broadened with increased hydrolysis.
Figure 3.6. FTIR spectra of poly(Et-TFVE-CO-VAc), 7, before and afier hydrolysis.
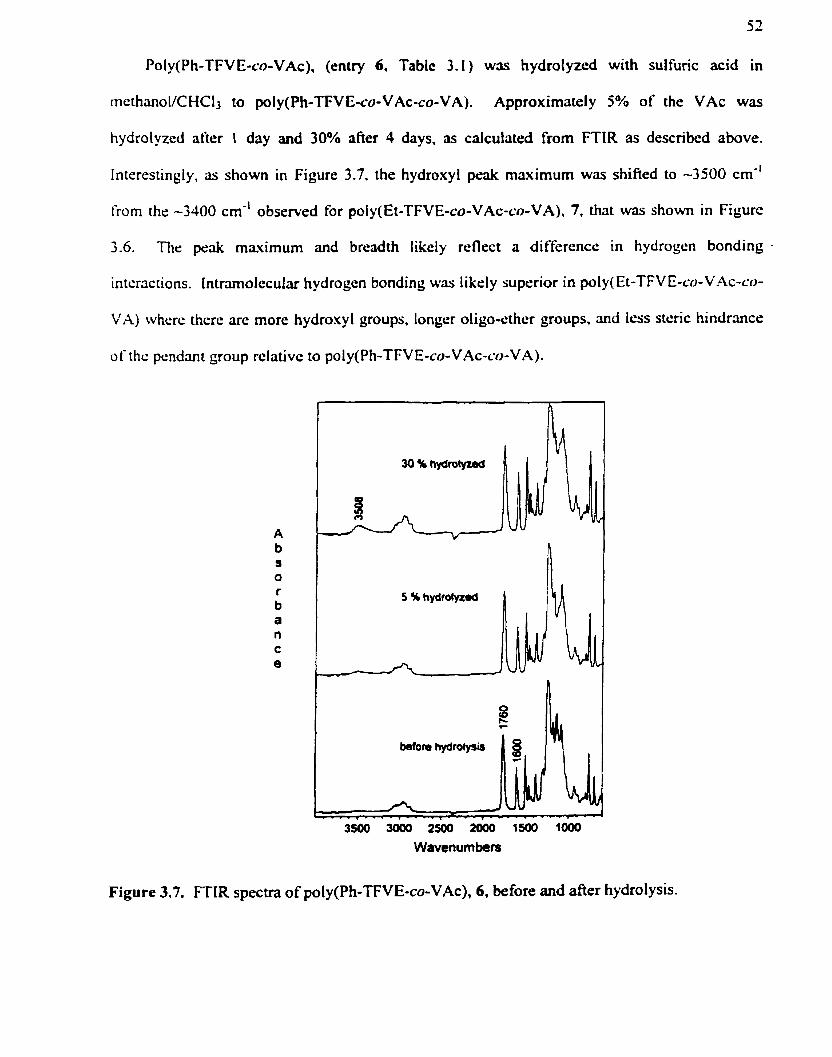
52
Poly(Ph-TFVE-CO-VAC). (entry 6. Tablc 3 .1 ) was hydrolyzed with sulfuric acid in
methano1/CHCl3 to pol y(Ph-TFVE-CO-VAc-CU-VA). Approximately 5% of the VAc was
hydroiyzcd after I day and 30% afier 4 days, as calculrited from FTIR as described above.
Interestingly. as shown in Figure 3.7. the hydroxyl pmk maximum was shified to -3500 cm"
Srom the -3400 cm-' observed for poly(Et-TFVE-CO-VAc-co-VA). 7, that was shown in Figure
6 The peak maximum and breadth likely reflect a difference in hydrogen bonding
interactions. lntramolccular hydrogen bonding was likrly superior in poly(Et-TFVE-CO-VAc-CO-
VA) whcrc therc are more hydroxyl groups. longer oligo-cther groups. and less steric hindrmce
of the pcndant group rclativc to poly(Ph-TFVE-CO-VAc-CO-VA).
Wavenumbers
Figure 3.7. FTIR spectra of poly(Ph-TFVE-CO-VAc), 6, before and after hydrolysis.

Whiie the FTIR data confirmcd the availability of hydroxyl functional groups for further
modification. the GPC data was used to detenninr whether hydrogen abstraction occurred during
the synihesis of VAc-containing copolyrners. It was anticipated that the simple conversion of
vinyl acctatc to vinyl aicohol would result in a modcst decrease in absolutc m o h r m a s .
However, the GPC-detcrmined molar rnasscs changed unexpcctedly d w r hydrolysis as
summarized in Table 3.3. For poiy(Ph-TFVE-CU-VAc). 6, an apparent incrcrisc in both &fw md
.id.. werç observed following hydrolysis with 3 greater increase observcd for greritcr amounts of
VAc hydrolyzed. For poly(Et-TFVE-CO-VAc), the change in moiar mass wris rt function of both
cstcnt of hydrolysis and the fraction of Et-TFVE in the monomtx fccd. As shown for cntry 7,
(44 mol% Et-TFVE in the rnonomsr feed), at 58% hydrolysis. both M v and !Cfn increascd
wlicreas at 84% hydrolysis M v and M n decreascd. As shown for entry 9 (60 mol% Et-TFVE in
the monomer feed), at 45% hydrolysis. both M r v and M n appcarcd to dccrcrisc.
Tablc 3.3. Hydrolysis of Poly(TFVE-co-VAc)
Polymer ft Po lyrntx Typc VAc Before Hvdrol~sis Aftcr HvdroIvsis Hydro 1 yzcd
(mol%) IMw/M~ PD1 ll4\~/iCht PD[ (kg mol") ( tg mol-')
6 Poly(Ph-TFVE-CO-VAC -5 t 92 / 75.4 2.55 285 / 118 2.42
9 I? 45 137 / 24.4 5.61 92.0 / 22.2 4.13 b '~efluxed for 4 d; No waier added to the hydrol ysis reaction.
The GPC molar mass distributions provide a more complete picture of the changes in molar
mass that were summarized in Table 3.3. The distributions are s h o w in Figures 3.8 and 3.9 for
poly(Ph-TFVE-co-VAc) (entry 6, Table 3.3) and poly(Et-TFVE-CO-VAc) (entries 7 and 9, Table
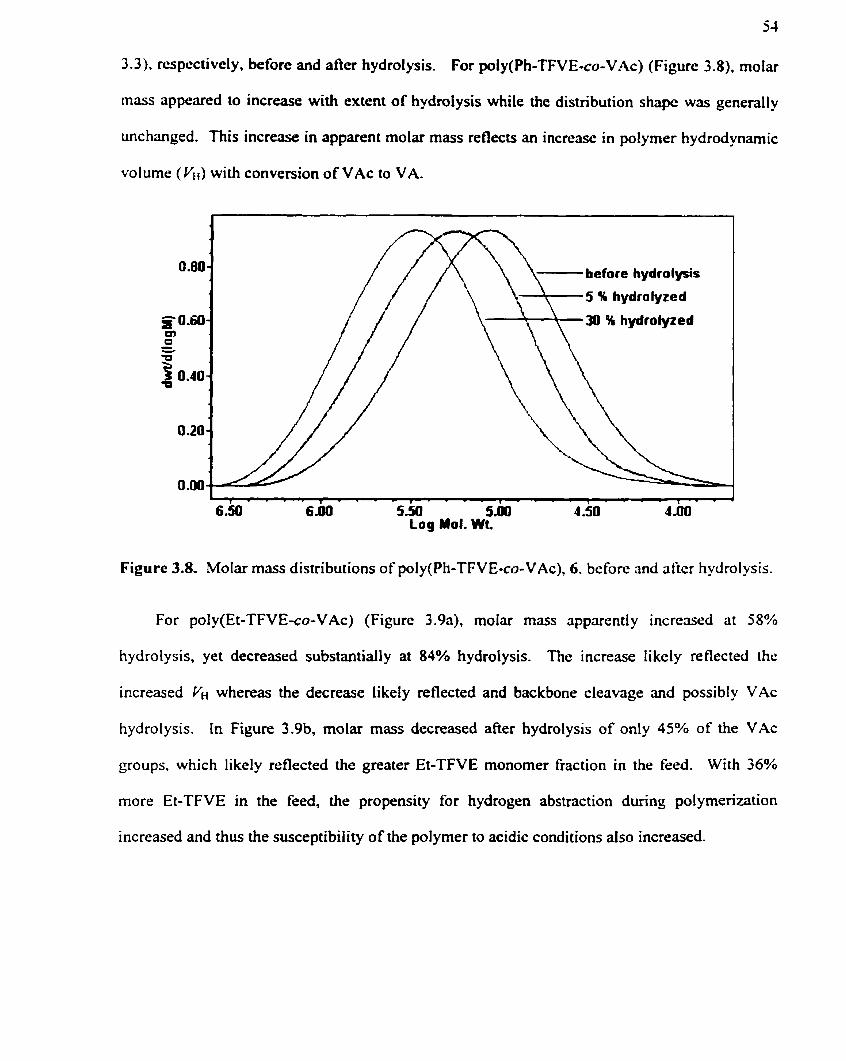
54
3.3). respectively. before and afler hydrolysis. For poly(Ph-TFVE-CO-VAc) (Figure 3.8). rnolar
mass appeared to increase with extent of hydmlysis while the distribution shape was generally
unchanged. This increase in apparent molar mass reflects an increase in polymer hydrodynamic
volume (ykt) with conversion of VAc to VA.
1 - - - - 1 - - - - 1 - - - - 1 . - - - 1 - -
6.50 6.ûû 5.50 SM) 4 -50 4 .O0 Log Mol. Wt.
Figure 3.8. Molar mass distributions of poly(Ph-TFVE-CO-VAc), 6. bcforc and siftcr hydrolysis.
For poIy(Et-TFVE-CO-VAc) (Figure 3.9a), molar mass apparentty increased at 58%
hydrol ysis, yet decreased substantiall y at 84% hydrolysis. The increase 1 i kel y re flected thc
increased VH whereas the decrease likely reflected and backbone cleavage and possibly VAc
hydrolysis. In Figure 3.9b, molar mass decreased after hydrolysis of only 45% of the VAc
groups, which likely reflected the greater Et-TFVE monomer fraction in the feed. With 36%
more Et-TFVE in the feed, the propensity for hydrogen abstraction during polymerization
increased and thus the susceptibility of the polymer to acidic conditions also increased.

- - - - - - - - - - 1 -
6#1 5 S I 5 ~ x 1 4 5 0 4.ûO 3.50 3 M Log Mol. Wt
6 h l 5.50 5.h 4 3 0 4 m 3-50 3-00 Log Mol. wt.
Figure 3.9. Molar mass distributions of poly(Et-TFVE-CO-VAc) before and after hydrolysis: 3.9a; Table 3.3, entry 7, 44% Et-TFVE iri the monomer feed, 3.9b; Table 3.3, entry 9, 60% Et- TFVE in the monomer feed.
3.3 Discussion
CopoIymers of Et-TFVE and Ph-TFVE with EVE or VAc (cf. Table 3.1) were synthesized
by free radical aqueous emulsion polymerization with compositions between 42 and 62% TFVE.
Under bulk polymerization conditions, the reactivity ratios were calculated for Ph-TFVE with
either EVE or VAc. Poly(Ph-TFVE-CO-EVE) likely had a significant fiaction of EVE repeat
uni ts altemating with those of Ph-TFVE, while poIy(Ph-TFVEco-VAc) likely had Ph-TFVE
rcpcat units altemating with those of VAc. but no< vice versa. The reactivities of the propagating
radicals of Ph-TFVE and Et-TFVE were expectcd to be sirnilar. Thus. it was assumed that the
reactivity ratios of Et-TFVE with either EVE or VAc werc sirnilar to that calculated for Ph-
TFVE under similar reaction conditions. excluding the etrccts of ndical hydrogen abstraction
obscmed for Et-TFVE.
Intramolzculrir ndical hydrogen abstraction was prcviously identified during the
homopolymerization of Et-TFVE, but not for Ph-TFVE. duc to diffcrenccs in pendant çroup
structure adjacent to the propagating macro-radical, ris discussed in chaptcr 1 . Those TFVEs
with rncthylene groups 6 or more atorns away from the propagating macro-radical scerncd most
susccptiblt: to hydrogen abstraction. However. it was suspccted that intrmoleçulrir hydrogcn
abstraction from VAc or EVE might have occurred during copolyrncriz.~tion. with continucd
propagation of the resulting rnacro-radical. Previous synthcscs of poly(TFP-co-VAc) by lice
radical aqueous emulsion polyrnerization idrntificd radical hydrogcn abstraction. cvith continucd
propagation of the resulting macro-radical."he rcsulting polymcr had cstcr groups in th<:
backbonc. thereby accounting for the 210-Fold drcrease in m o l x mass obscrved by GPC
following hydrolysis. As shown in Figure 3.1Oa. 1.6-H abstraction of methyl hydrogcn tiom
VAc preceding the propagating macro-radical on either Ph-TFVE or Et-TFVE. and continued
propagation of the macro-radical, would also result in ester groups in the backbone. In addition.
copoiymers with Et-TFVE may have ether groups in the backbone, as shown in Figure 3.10b.
bccause of 1.6-H abstraction from the pendant group adjacent to the propagating macro-radical.

O 0
propagation O
-0.CF.CF2 O RO
I OR H
PO b e r . CFH CF/ '0-O
propagation - Figure 3.10. Exmples of intrarnolecular radical hydrogcn abstraction during TFVE copolymerization with continued propagation of the resulting radical: (a) 1 -6-H abstraction from VAc preceding the propagating macro-radical, R is 2-ethoxyethyl or phenyl. (b) 1 .64 abstraction from the Et-TFVE pendant group adjacent to the propagating mricro-radical.
1 E-1-NMR was not useful in identifying the hydride proton that rcsultcd fiom sibstrrrction.
This was likely due to the high molar mass of polyrners relative to absirrictcd hydrogcn and. in
some cases, overlapping NMR resonances. Thus, an alternate way to test whcthçr hydrogcn \vas
abstracted from VAc during copolymerization with TFVE was to study the effcct of hydroiysis
on mol= mass of poly(Ph-TFVE-CO-VAc). if hydrogen were abstracted, it would bi: from VAc
alone (and not Ph-TFVE). Upon hydrolysis there should have been a significant decrcase in the
weight average rnolar rnass, if esters were incorporated in the backbone.
Unexpectedly, hydrolysis of poly(Ph-TFVE-CO-VAc) to poly(Ph-TFVE-co-VAc-CO-VA)
(entry 6, Table 3.3) resulted in a large distribution shifi to higher rnolar m a s (cf. Figure 3.8): for
only -5 % VAc hydrolysis, MW increased by 48% while for 30% VAc hydrolysis. MW increased
by 1 19%. The shapes of both distributions afier hydrolysis appeared to be unchanged relative to
the parent copolymer. Since FTIR showed that VAc had k e n hydroiyzed to VA (cf. Figure 3.7),
the apparent increase in GPC-detennined molar mass reflected an increase in VH. With the

apparent increase in rnolar masses after hydmlysis. it was likely that few or no esters were
incorporatrd in the backbone as a consequence of hydrogen abstraction during polymeriwtion of
VAc with Ph-TFVE and. by analogy. with Et-TFVE. Funhcrmorc. given the unchanged
distribution shapes after hydrolysis and the large excess of mcthanol that was used during
hydrolysis, it was unlikely that intermolecular esteri fication contributcd to the increscd molar
masses.
Hydrolysis of poly(Et-TFVE-CU-VAc) to poly(Et-TFVE-~.o-V.4c-~-o-V~2) (cntry 7. Triblc
3.3. Figure 3.9a) resulted in a 52% increase in M v after 58% VAc hydrolysis; yet a 46%
dccrerise in M v atier 84% VAc hydrolysis. Given the FTIR cvidrncz for VAc hydrolysis to VA
(cf. Figure 3.6). the apparent increase in molar mass of the former may bc rationalizcd in tcrms
of incrcased qr. Given that no cvidcncc of VAc hydrogcn abstraction was found Sor thc
copo1ymcrization of Ph-TFVE and VAc, the significant dccrcascl in , M v rit 84% VAC hydrolysis
must bc rationalized differently. Sincc ethers arc suscsptiblc to strong acids and
homopolyrncrizsition of Et-TFVE results in othcr segments in the polymcr backbonc. thc
decrease in MW c m be attributed to hydrolysis of backbone ether segments. Thcrc may have
also been some backbone ether cteavage for the 58% VAc hydrolyzcd smplr . However. its
effect on molar mass was masked by the apparent increase in VI!.
While the decrease in rnoiar mass might also be rationalized by the hydrolysis of pendant
oiigo-ether groups. the rnethylene C-H absorption (2860 cm-') and the ether C-O absorption
(1 1 15 cm") were relatively unchanged (cf. Figure 3.6). In addition. the FTIR specua of poly(Ph-
TFVE-CO-VAc), 6, can also be used to address oligo-ether pendant group cleavage. As s h o w in
Figure 3.7. the aryl C=C absorption was apparent at 1600 cm-'. Afier 30 % VAc hydrolysis, the
ratio of the VAc carbonyl absorption to aryl C=C absorption had decreased 19%. This was aIso
equivalent to the fraction of VAc hydrolyzed. Given that the estirnated error in both values is
24%. there may have bcen some cleavap of oligo-ether pendent groups. However. it was
unlikely that it resulted in a significant contribution to the distribution sh ih .
H ydrol ysis of poly(Et-TFVE-CO-V Ac) to pol y(Et-TFVE-CO-V Ac-CO-V A) (entry 9, Table
3.3)- resulted in a 30% decrease in M u after only 35% VAc hydrolysis. As was shown in Figure
3.9b. the distribution of the hydrolyzed sample was narrower with a 47% higher peak molu
mrtss. This suggested thnt there was a significant amount of ether cleavage in the polymer
backbone. Given that 9 had the highest Et-TFVE fnction in the rnonomer feed of thosc studied.
and if it is assumed. from the Ph-TFVE rerictivity ratio data, that Et-TFVE dso alternates with
VAc. then thc lifctimc of a radical on Et-TFVE was relatively long, resulting in a high
probability of abstraction. Thus. it was likcly that rnany more ether groups wcrc incorporrited
into the backbone and somç of these were cleaved under mildcr sicid conditions. Thc distribution
shift wris somewhat offset by an increase in VI, , resulting in a dccrcascd polydispcrsity.
[nterestingly, the distribution shifts observed for poly(Ph-TFVE-CO-VAc-co-VA) werc
significantly larger than those observed for poly(Et-TFVE-CO-VAc-CO-VA) in virw of the
fraction of VAc hydrolyzed. Considering that radical hydrogen abstraction from the pendant
group of Ph-TFVE did not occur, thrre were no ether bonds in the backbone of the polymer to be
hydrolyzed. Consequently, the increase in 6, was not offset by the formation of smaller
molecules.
It may have been possible that hydrogen was abstncted from EVE pendant groups during
copolymenzation. Abstraction from EVE might have been identified in copolymers with Ph-
TFVE but not in copolymers with Et-TFVE under acidic hydrolysis conditions. However, given
that 'H NMR evidence suggested that 1,s-H or 1,6-H abstraction fiom the preceding pendant
group in Ph-TFVE homopolymers (cf chapter 2) was unlikely, and 1,6-H abstraction fiom VAc
was not observed, abstraction from EVE also seems unlikely. From a practical standpoint,

60
copolymers incorporating VAc had greater application potential. Thus, abstraction from EVE
was not investigated.
3. J Refercnces
Biswas, M.; Mazumdar, A.; Mitra, P . Encyclopedia of Poiym. Sci. and Eng. (John Wiloy & Sons, New York) 1989,17,446-468
Xi. F.; Bassett. W. Jr.; Vogl. O. J. Polym. Sei.: Pari A: Polyrn. Chcm. 1983. T I . 891
h/furray. D. L.; Harwood, H. J.; Shendy, S. M. M.; Piirma, 1. Polyrner 1995.36. 383 1
Dube, M.; Sanayei, R.; Penlidis, A.; O'Dnscoll, K. F.; Rcilly. P . M . J . Polym. Sei.: Pur( A: Pdym. Chem. t991,29,703-8
Polic, A. L.; Duever, T. A.; Penlidis, A. J. Polym. Sei.: Part A: Polyrn. Chem. 1998, 36, 8 1 3-22
Joncs, C . W . United States Patent 5,723.556 1998
4 HOMOPOLYMERIZATION OF ET-TFVE IN THE PRESENCE OF CARBON DIOXIDE AND COPOLYMERIZATION WITH TETRA- FLUOROETHYLENE
4.1 List of Abbreviations
N m b e r average molar m a s Weight average molar mass Absolute number average molar mass Absolute molar mass between radical hydrogen abstractions Instantaneous average kinetic chah length Propagation rate constant Initiator decomposition rate constant Rate of propagation Rate of termination ancüor chain transfer Rate of radical hydrogen abstraction
4.2 Introduction
Carbon dioxide (CO2) has k e n shown CO be a good solvent or continuous phasc for the
polymerization of many types of monornen (cf. chapter 1). In particulnr. COz was shown to bc
effective for the polymerization of fluoromonornea. Propagation rates wcrc mcasurcd in CO2
for styrene and acrylic monomers and were vcry similar to thcir rcspcctivc bulk polymerization
I values. Furthemore, PFA synthesized in CO2, was shown to have signi ficantl y reduced
concentrations of acidic end groups on account of increased propagation rates relative to P-
scission chain transfer reactions.'
The homo- and copolymerization of Et-TFVE with TFE was investigated in CO?. As
discussed in chapters 2 and 3, hydrocarbon TFVEs have a complicated polymerization
mechanism, which involves p-scission and can include radical hydrogen abstraction. depending
on the structure of the TFVE pendant group. The macro-radical resulting from abstraction
continued to propagate with the monomer, incorporating portions of the pendant group into the
polymer backbone, but did not appear to be molar mass limiting. However, B-scission chain
transfer was evident in al1 homopolymers and likely limited molar mass. Et-TFVE undergoes
6 1

both I)-scission and radical hydrogen abstraction chain transfcr rcactions in aqueous crnulsions
and the chain transfer reactions could be used to probe the effectiveness of hydrocarbon TFVE
polymerization in CO2.
Polymerization of Et-TFVE in COz was anticipated as a means of incrcasing moIor mass if
rates of propagation were increased relative to P-scission chain transfcr rcactions. lncrcased
propagation rates relative to radical hydrogen abstraction reactions were cxpected to rcducr the
frequency of rnonomer pendant group fragments incorponted into the polymer backbone. With
frwer pendant group fragments in the backbonr. the polymars might bc cxpccted to be more
robust than the polymers synthesized in aqueous cmulsions. Polymerization in CO2 was rilso
anticipated as a means of incorporating tetrafluoroethylcne (TFE). ieading to ncw TFVE
copolymcrs with grcatcr fluorine contcnt as shown in Fiyurc 4.1. Highcr tluorinc contcnt was
cxpectcd to impart greater oleophobicity and hydrophobicity to the copolymcr.
Figure 4.1. Homopofymers of Et-TFVE (y = 0) and copolymers with TFE (y > 0). synthcsizcd in COz.
To hrther minimize P-scission and hydrogen abstraction chain transfer reactions. an
initiotor. diethyl peroxydicarbonate (DEPDC), which is active at lower temperatures. was
synthesized and used for polyrneriwtion.3 DEPDC and similar peroxydicarbonates have
previously been used for polymerizations in CO^.'' To compare the effectiveness of using a CO2
continuous phase, Et-TFVE homopolymers were also prepared in bulk at the same temperature
of 35°C using DEPDC, and at 35'C in an aqueous emulsion using similar conditions to those
reported for homopolymers in chapter 2. Polymerization at 35 C for ail polymers, was
anticipated to result in higher molar masses for the CO2, and possibly bulk, synthesized
homopolymers relative to the aqueous emulsion synthesized polymcr, notwithstanding
differences in ratés of bi-radical termination. if propagation rates of thc former were higher. The
homopolymcrs. prepared by three different methods, were analyzed for molar mass by GPC and
for (3-scission and radical hydrogen abstraction using FTIR and 'H-NMR. respectivrly.
To gain further insight into the initiation, propagation, termination. and chain trmsfcr steps
of Et-TFVE. two of the lower molar mass hornopolymzrs werc successfuI1y chrirrictcrizcd by
rnatrk assisted laser de-sorption ionimtion timc of flight m u s spcctromctry (MALDI). MALD 1
spectrornetry uses ultraviolet laser light, a very mild ionizsition energy source. to genrratc
molccular ions. Conscquently, rcln<ivcly large rnolcculcs (up to 10' g mol-') c m bc detcctrd
with very Iittle fragmentation of the parcnt ion. With detection of intact polymcr chains. MALDI
c m bc used to determine absolute molru m u s as well as charactcrizc polymcr chain end groups.
Knowlcdgc o f both the absolute molar mass and the rclativc molar rnass, dstrirrnincd by GPC.
allowcd for the estimation of the absolutc molar mass of 311 othcr EL-I'FVE hornopolymcrs.
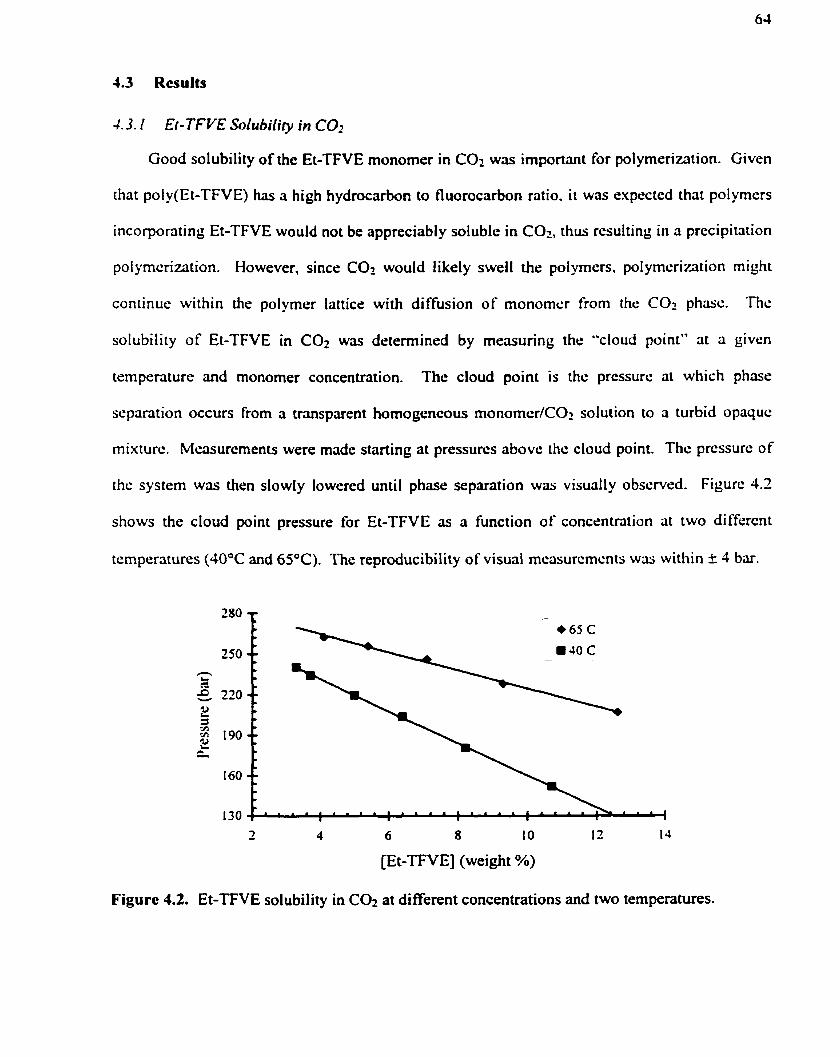
3 1 Et-TFVE Solubility in CO2
Good solubility of the Et-TFVE monorner in CO2 was important for polymerization. Given
that poly(Et-TFVE) has a high hydrocarbon to fluorocarbon ratio. it was rxprctcd that polymcrs
incorporating Et-TFVE would not be appreciably soluble in CO2, thus rcsulting in a precipitation
polymrriution. However. since CO2 would likely swell the polymers. polyrnerization might
continue within the polymer lattice with diffusion of monomer from the CO, phasc. Thc
solubiiity of Et-TFVE in COz was determined by mesuring the "cloud point" rit a given
temperature and monomer concentration. Thc cloud point is the prcssurc rit which phrise
separation occurs from a transparent homogcneous monomcr/COz solution to a turbid opaquc
mixture. Measurernents were made starting at pressures abovç the cloud point. Thc pressurc of
the system was then slowly lowered until phase sepantion was visually obscrvcd. Figure 4.2
shows the cloud point pressure for Et-T FVE as a function of concentration rit two differcnt
temperatures (JO°C and 65OC). The reproducibility of visual mcasurcrncnts was witliin k 1 bar.
2 4 6 8 1 O 12 14
[Et-TFVE] (weight %)
Figure 4.2. Et-TFVE solubility in COz at different concentrations and two temperatures.
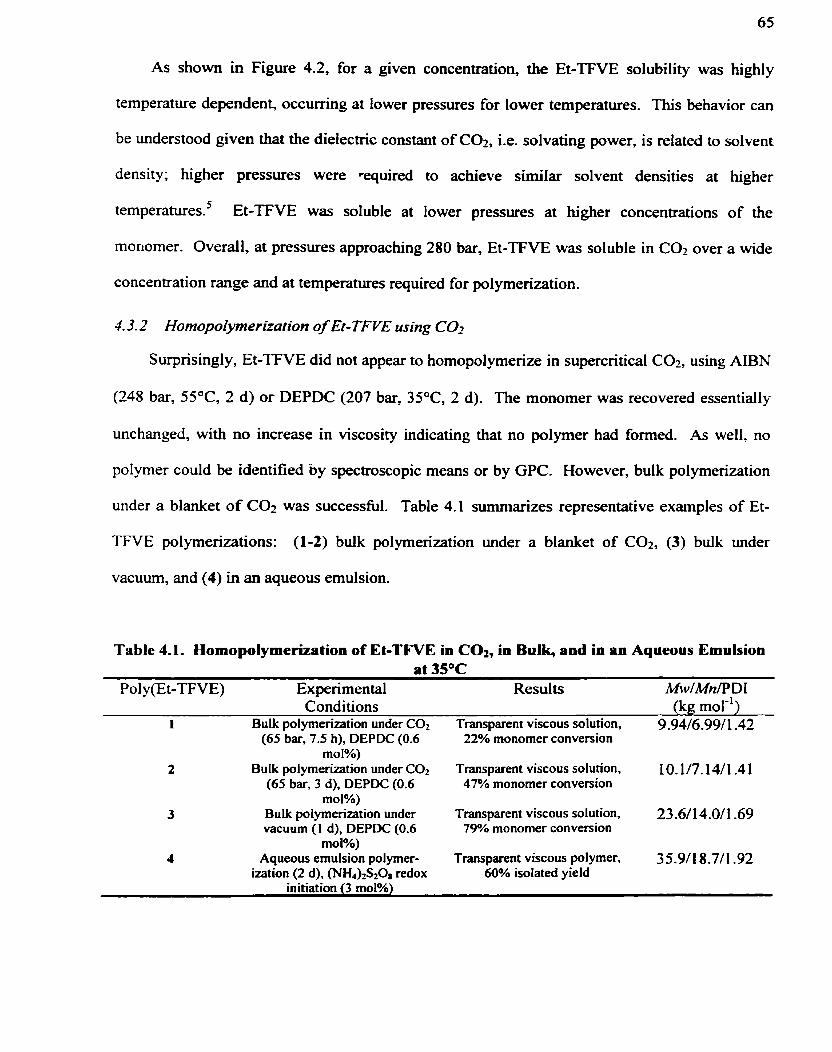
As shown in Figure 4.2, for a given concentration, the Et-TFVE solubility was highly
temperature dependent, occurring at lower pressures for lower temperatures. This behavior can
be understood given that the dielectric constant of COz, i.e. solvating power, is related to solvent
density; higher pressures were vequired to achieve similar solvent densities at higher
temperatures.5 Et-TFVE was soluble at lower pressures at higher concentrations of the
moriomer. Overall, at pressures approaching 280 bar, Et-TFVE was soluble in CO? over a wide
concentration range and at temperatures required for polymerization.
3.3.2 Homopolymerization of Et- TFVE using C a
Surprisingly, Et-TFVE did not appear to homopolymerize in supercritical COz, using AlBN
(248 bar, 5S°C, 2 d) or DEPDC (207 bar, 3S°C, 2 d). The monomer was recovered essentially
unchanged, with no increase in viscosity indicating that no polymer had formed. As well. no
polymer could be identified by spectroscopie means or by GPC. However, bulk polymerization
under a blanket of CO2 was successful. Table 4.1 summarizes representative examples of Et-
TFVE polymerizations: (1-2) bulk polymerization under a blanket of CO2, (3) bulk under
vacuum, and (4) in an aqueous emulsion.
Table 4.1. Homopolymerization of Et-TFVE in CO2, in Bulk, and in an Aqueous Emulsion at 35°C
Pol y(Et-TFVE) Experimental Results MrvlMn/PDI Conditions (kg mol-')
1 Bulk polyrnenzation under COz Transparent viscous solution, 9.94/6.99/1.42 (65 bar, 7.5 h), DEPDC (0.6 22% monomer conversion
mol%) 2 Bulk polymerization under CO2 Transparent viscous solution, 10.1/7.14/1.41
(65 bar, 3 d), DEPDC (0.6 47% monomer conversion mol%)
3 Bulk polyrnerization under Transparent viscous solution, 23.6/14.0/1.69 vacuum (1 d), DEPDC (0.6 79?4 monomer conversion
mol%) 4 Aqueous emulsion polymer- Transparent viscous polymer, 35.W 8.711.92
ization (2 d), (NH4)2S208 redox 60% isolated yield initiation (3 mol%)

Unlike polymerization in supercritical COz. bulk polymerization of Et-TFVE under a high-
pressure blanket of CO2 gas, using DEPDC. did result in the formation of polyrner. However,
the molar masses were lower than that obtained by bulk polymerization under vacuum. As well,
the molar masses of al1 bulk polymerizations were lower than that obtained by aqueous emulsion
polymerization. The latter was initially anticipated to have the lowest molar mass given that
diffusion elfects are known to occur in aqueous emulsion polymcriwtions.6 That is. the rate of
monorner diffusion into the growing micelle may have been expected to reduce the ovcnll rate
of propagation if propagation is €aster han diffusion. Figure 4.3 shows the rnolar mass
distributions of thret: polymerizations, obtained frorn GPC relative to polysiyrcne standards using
an ethyl acctate mobile phase. The GPC detennined Mn were - 7,000 g mol", corresponding to
- a degree of polymcrization, X , - 30. Howcvcr. while ethyl acetate is a good solvcnt for
poly(Et-TFVE), it is a poor solvent for polystyrcnc. Thus. the absolute Mn were potcntially
significantly lower. The GPC mobile phase was changed frorn THF to ethyl acetate, since ethyl
acetate has a iower refractive index (RI). Ethyl acetate would be required for solubility and RI
detection of copolymers containing TFE. as discussed in section 1.2.7 and chapter 5.
- -- -- - Bulk undcr CO2 ,
Bulk undcr vacuum !
Aqucous cmulsion ,
m . . . . . . . . 1
1 .OE+06 I .OE+OS 1 .OE+04 1 .OE+03 1 .OE+02
Molar Mass (g mol-')
Figure 4.3. Molar mass distributions of poly(Et-TFVE)s (cf. Table 4.1) synthesized under a blanket of CO2 (2); under vacuum (3); and in an aqueous emulsion (4).
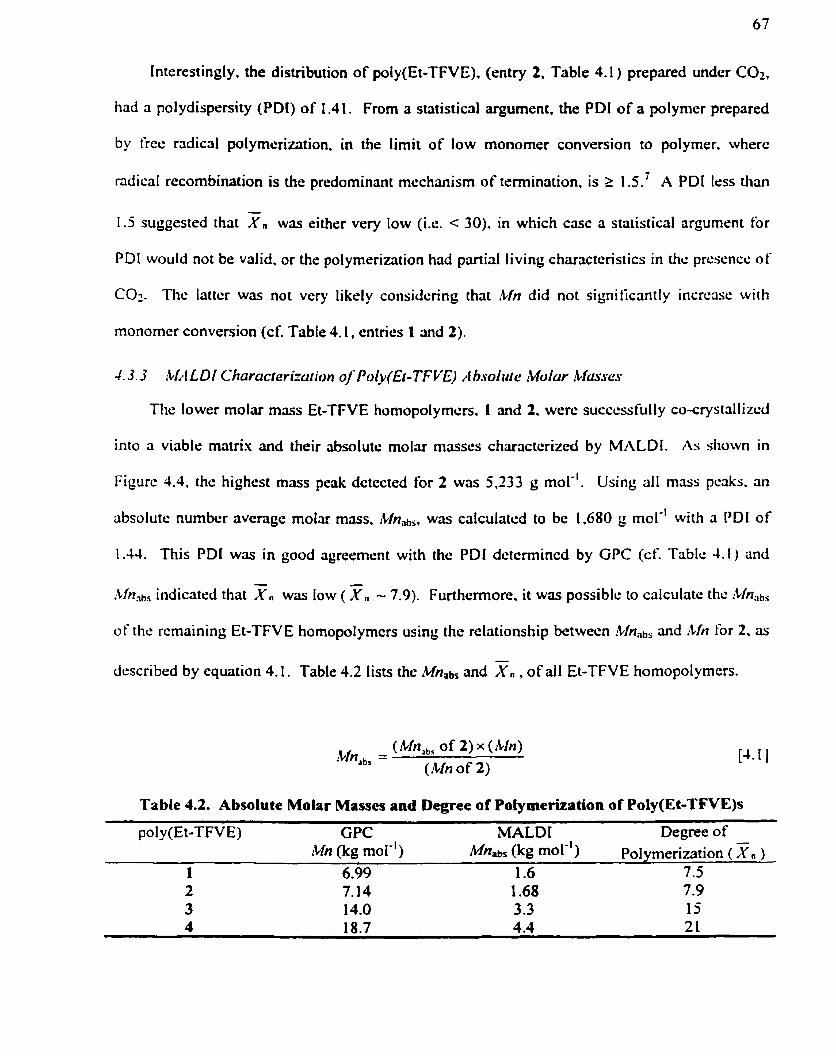
Interestingly. the distribution of poly(Et-TFVE), (rntry 2. Table 4.1 ) prepared under COz.
had a polydispenity (PD[) of 1.4 1. From a statistical argument. the PD1 of a polymer prepared
by fret: radical polymerization. in the limit of low monomer conversion to polymer. wherc
radical recombination is the predominant mtichanism of termination. is > 1 S.' A PD1 lrss than
1.5 suggested that X. was either very low (Le. c 30). in which case a statistical argument for
PD1 would not be valid. or the polymerization had partial living characteristics in ths prcsencc of
CO2. The latter was not very likely considcring that Mn did not signiticantly incrcasr wiih
monomer conversion (cf. Table 4.1, entriés 1 and 2).
4.3.3 M t L DI C'haraçterizurion of Poly(Es-TF VE) 11 hsol ure hi0 Iur 12.fus.~~..s
Tlic lower rnolar m s s Et-TFVE homopolym~rs, 1 and 2. werc succsssfully co-crystallizcd
into a viable matrix and their absolutc molar masses charactcrizcd by iMr\tDI. 11s sliown in
Figure 4.4. the highrst mass peak dctccted for 2 was 5.233 g mol". Using d l m a s pcaks. an
absolute number average molar mass. Mn,b,. was calculritcd to bc 1.680 g mol-' with a PD1 of
1 .JJ. This PD[ was in good agreement with the PD[ dctcrmincd by GPC (cf. Tablc J. I ) and
Mn,,,, indicated that ,Y. was low ( X. - 7.9). Furthemore. it was possiblc to calculate thc ~ U n ~ h ,
of the rcmaining Et-TFVE homopolymcrs using the relationship between !î4nabs and M n for 2. as
drscribed by equation 4.1. Table 4.2 lists the Mnab, and X,, , of al1 Et-TFVE homopolymcrs.
(Mn,,, of 2) x ( M n ) 1Cln,,, =
( M n of 2)
Table 4.2. Absolute Molar Masses and Degree of Polymerization of Poly(Et-TFVE)s
poly(Et-TFVE) GPC MALDI Degree of - -
Mn (kg mol-') (kg mol-') Polymerization ( )
1 6.99 1.6 7.5
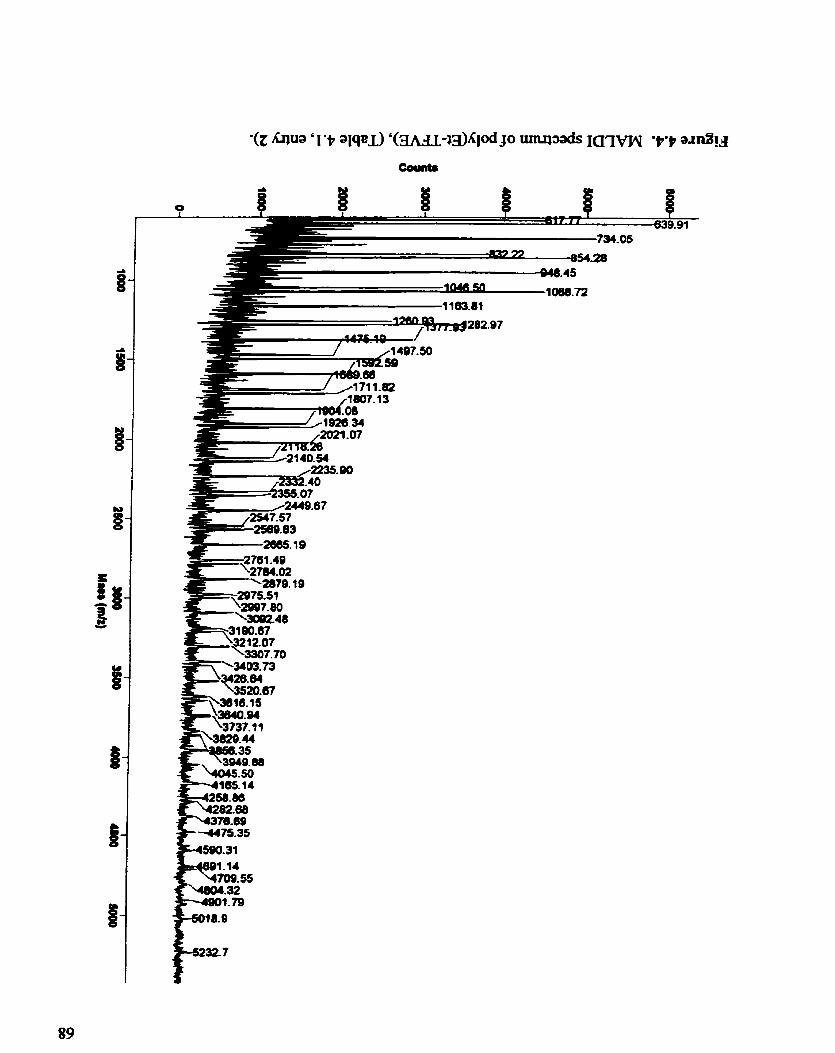
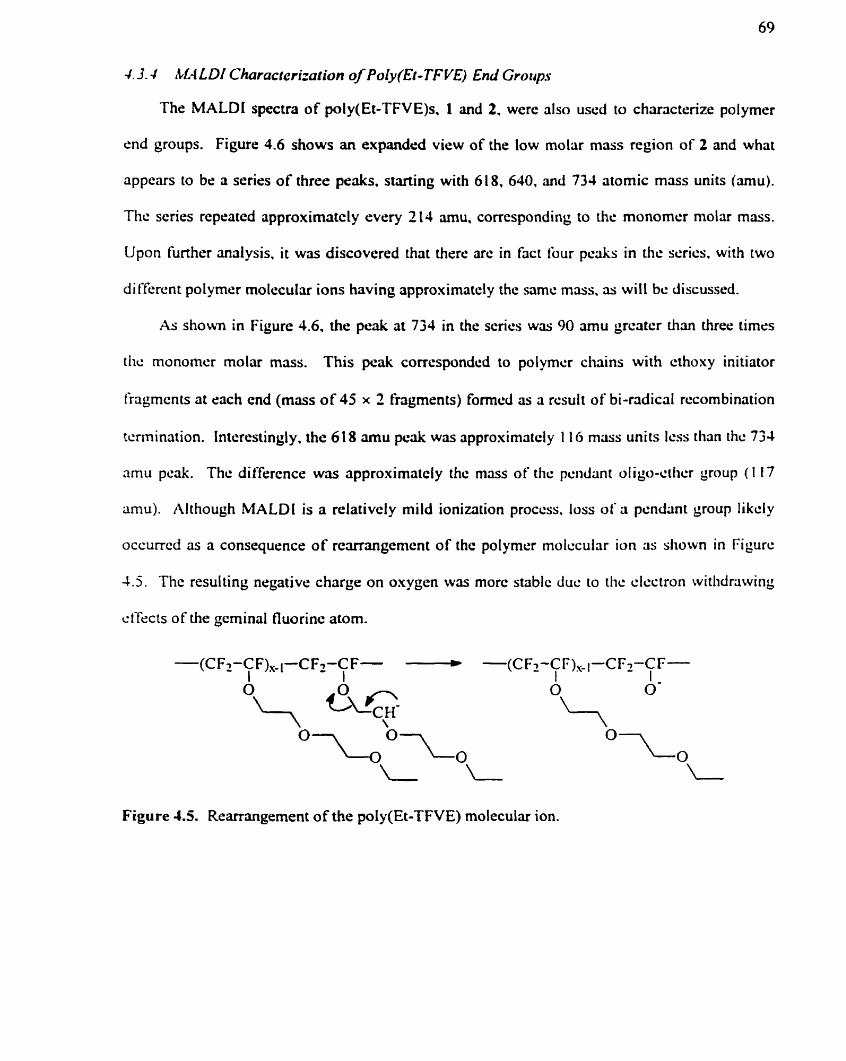
43.4 MA L DI Charucterization of Poly(Et-TF VE) End Croups
The MALDI spectra of poly(Et-TFVE)s. 1 and 2. werc also usïd to characterize polymer
end groups. Figure 4.6 shows an expanded view of the low motar m a s region of 2 and what
appcars to bs a series of three peaks, starting with 61 8, 640, and 734 atomic mriss units (arnu).
The series rcpcatcd approximatcly every 21 4 rimu. corresponding to the monomcr molar m a s .
Upon tùrther analysis, it wm discovered that there are in fact tour pcaks in thc scrics. with two
difterent polymer molccular ions having approximatcly the samc m s s . as will bc discussed.
As shown in Figure 4.6. the peak at 734 in the scries was 90 amu grcatcr than three timzs
the monomer molar mas. This pcak corrcsponded to polymcr ciiains with cthoxy initiator
fragments at each end ( m a s o f 45 x 2 Fragments) formcd as a rcsult of bi-radical rccombination
tcrmination. Intercstinyly, the 618 amu pcak was approximatcly 1 16 mriss units Icss than thc 734
amu pcak. Thc differcnce was approxirnatcly thc mass of thc pciidiint ol igo-cihcr group ( 1 1 7
amu). Although MALDi is a relativciy rnild ionization proccss. loss of ri pendant g o u p likcly
occurrcd as a consequence o f rcarrangcmcnt of thc polymèr rnolcculrir ion ris sliown in Figurc
4.5. The resulting negative charge on oxygen was rnorc stablc duc to tlic clcctron witlidrriwing
cfTects of the gcminal fluorine atom.
Figure 4 5 Remangement of the poly(Et-TFVE) molecuiar ion.
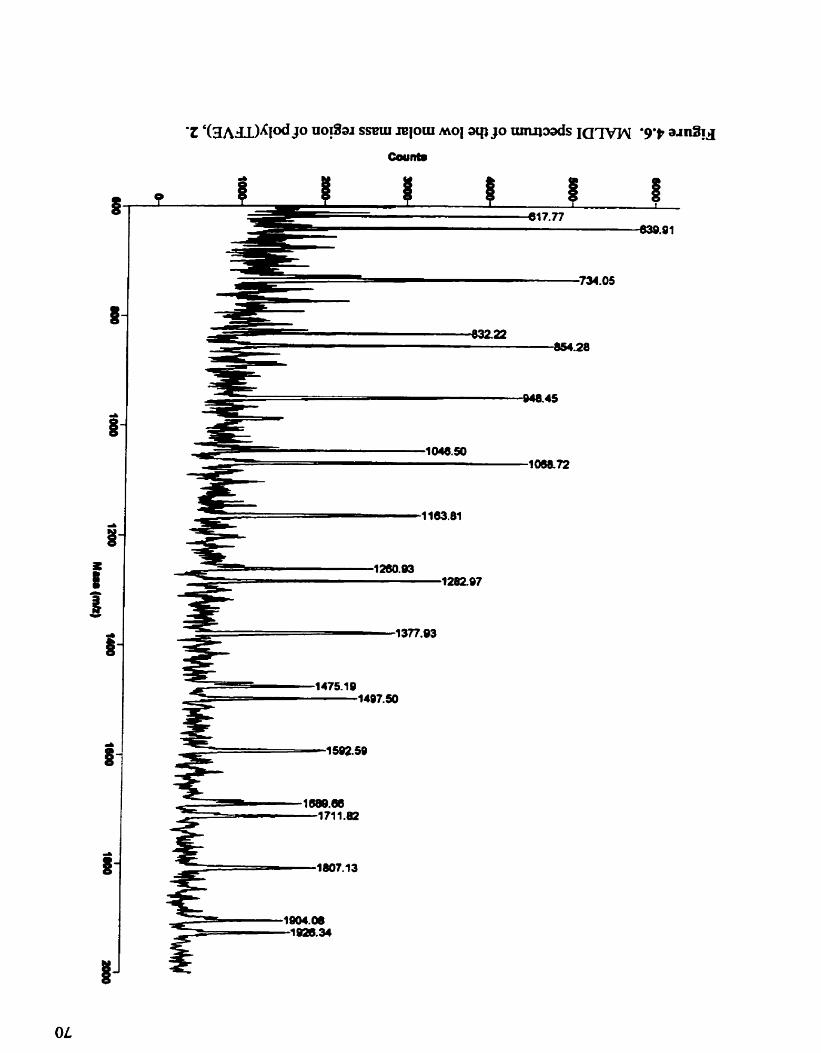

The 640 arnu peak was approximately three times the monomor repeat unit mas . 7'his was
initially unexpected, since it did not reflect the m a s of initiator fragment(s) at the chain ends.
However. given the propnsity of the Et-TFVE propagating macro-radical for p-scission and the
fact that the resulting pendant-group-radical-fragment may initiate a new polymer chain. this
mass could be rationalized. Initiation of a polymer chain by the pendant-group-ndical-fragment
and subsequent termination by p-scission would result in a m a s thac was an integcr multiple of
the monomer repeat unit mass as outlincd in Figure 4.7.
Figure 4.7. Initiation by the pendant group radical fragment and subsequent termination by P- scission results in poly(Et-TFVE) chains with masses that are integral multiples of the monomer repeat unit molar m a s .
I t was expected that polymer chains, with masses that were integer multiples of the
monomer repeat unit. would also undergo rearrangement of the molecular ion during MALDI,
with loss of a pendant group fragment. However, the mass of such a molecular ion is very close
to the mass of polymer chains with two ethoxy initiator end groups. For example, fragmentation
of a parent molecdar ion of 854 amu (X. = 4), with Ioss of a pendant group (1 17 m u ) was
expected to result in a moiecular ion of 737 arnu. This mass was very close to the observed 734

m u peak. corresponding to a polymer chain with two ethoxy end groups and y. = 3. Closer
examination of Figure 4.6 suggested that the peaks at 734, 948. 1 164. etc. .. were in fact
composed of multiple peaks, thus accounting for the reananged moleculrir ion. Table 4.3
correlates the polymer structures and degrees of polymerivtion with the observed MALDI peak
masses in Figure 4.6. By analogy, the analysis could havc been sxtended to al1 mass periks
shown in Figure 4.4.
Tablc 4.3. Structure of Poly(Et-TFVE) Molccular tons and Corrcsponding Obscwed iMass
and Degree of Polymcrizatian, 2. -
MolecuIar ion Observed mass .Yn (x)

4 . 3 . Quaniifica f ion of Relu~ive pscission Chain rransfer in Poly(Et- TF VE)s
The FTIR spectn of the poly(TFVE)s synthesized in bulk under a blanket of COz. in bulk
under vacuum. and by aqueous emulsion polymerization (cf. Table 4.1) were obtained from thin
films of the viscous polymers cast onto sodium chloride disks. As shown in Figure 4.8. the
intensity of the carbonyl peak. at approximately 1774 cm-', as a result of j3-scission and
subsequent hydrolysis, was greatest for poly(Et-TFVE), 2. prepared in bulk undrr a blanket of
Figure 4.8. FTIR spectra of poly(TFVE)s synthesized in bulk under a blanket of CO2 (2); synthesized in bulk under vacuum (3); synthesized in an aqueous emulsion (4).
To compare the arnount of carbonyl end groups that resulted frorn p-scission, a carbonyl
concentration ratio was calculated by referencing the carbonyl absorbance to the methyl C-H
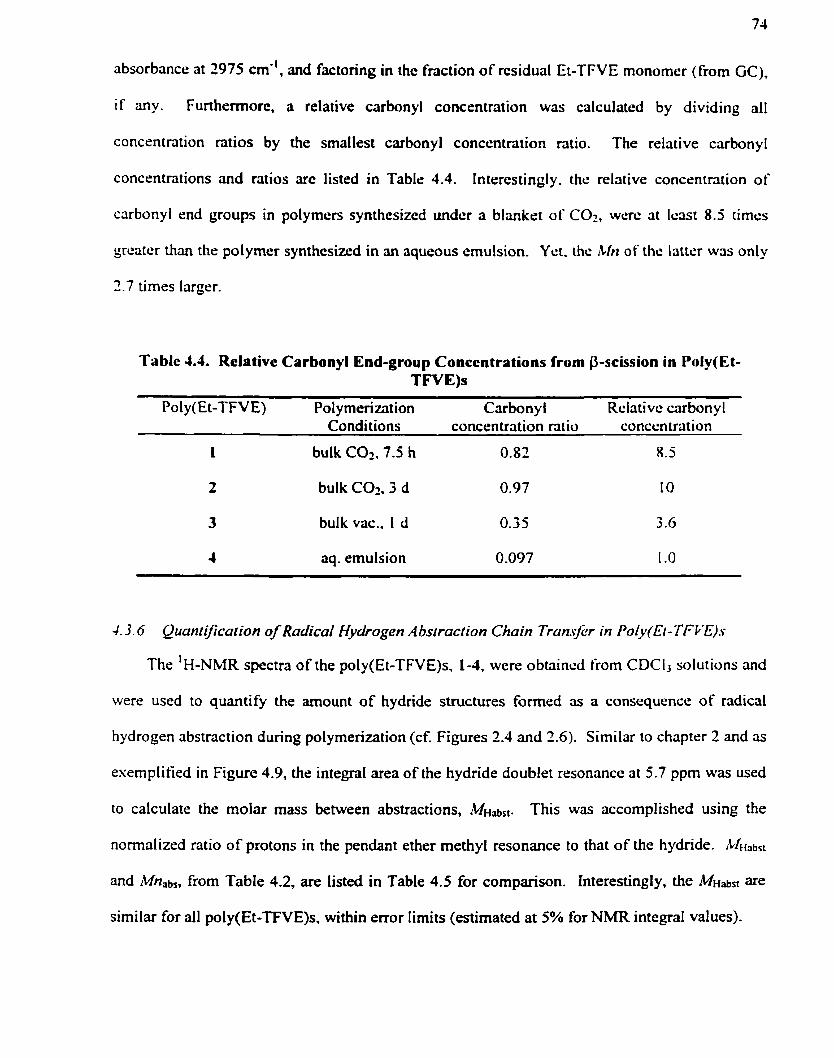
absorbance at 2975 cm". and factoring in the fnftion of rcsidual Et-TFVE monomer (from GC),
i f any. Funhermorc, a relative carbonyl concentration was calculated by dividing al1
concentration ratios by the smallest carbonyl concentration ratio. The relative carbonyl
concentrations and ratios are listed in Table 4.4. Intercstingly. thc relative concentration of
carbonyl end groups in polyrners synthesized undar a blankrt of CO2. were at l e s t 8.5 rimcs
grcater than the polymer synthesized in an aqueous srnulsion. Yct. the Mn of the latter was only
3.7 times Iarger.
Tablc 4.4. Rclativc Carbonyl End-group Coaccntrations from p-scission in Poly(Et- TFVE)s
PoIy(Et-TFVE) Polymerization Carbony l Reiativç carbonyl Conditions concentration ratio concentration
1 bulk COz, 7.5 h 0.82 8.5
2 bulk CO2. 3 d 0.97 I O
3 bulk vac.. 1 d 0.35 3 -6
4 aq. emulsion 0.097 1 .O
4.3.6 Quan r ijication of Radcal Eiydrogen Absrraction Chain Trun.$$r in Poly(l3- TI;FvE).s
The 'H-NMR spectra of the poly(Et-TFVE)s, 1-4, were obtûincd from CDCI, solutions and
were used to quantify the amount of hydride structures forrned as a consequencc of radical
hydrogen abstraction during polymerization (cf. Figures 2.4 and 2.6). Similar to chapter 2 and as
esemplified in Figure 4.9, the integral area of the hydride doublet resonance at 5.7 ppm was used
to calculate the molar mass between abstractions, lCiHasl. This was accomplished using the
normalized ratio of protons in the pendant ether methyl resonance to that of the hydride. Mtiabst
and kfn,b,, from Table 4.2, are listed in Table 4.5 for cornparison. Interestingiy, the M ~ a b s t are
similar for al1 poly(Et-TFVE)s, within error lirnits (estimated at 5% for NMR integral values).

1 Figure 4.9. H-NMR spectmm of poly(Et-TFVE), 4, shows the hydnde doublet resonance at 5.7 PPm-
Table 4.5. A Cornparison of the Molar Mass between Radical Hydrogen Abstractions and the Absolute Molar Mass Calculated from MALDI
Pol y(Et-TFVE) Molar mass between Absolute molar mass, Mn&, abstractions, M H ~ ~ ~ (kg mol-') (kg mol-')
1 1.52 f 0.08 1.6 2 1.54 f 0.08 1.7 3 1.52 f 0.08 3.2 4 1.69 i 0.08 4.4
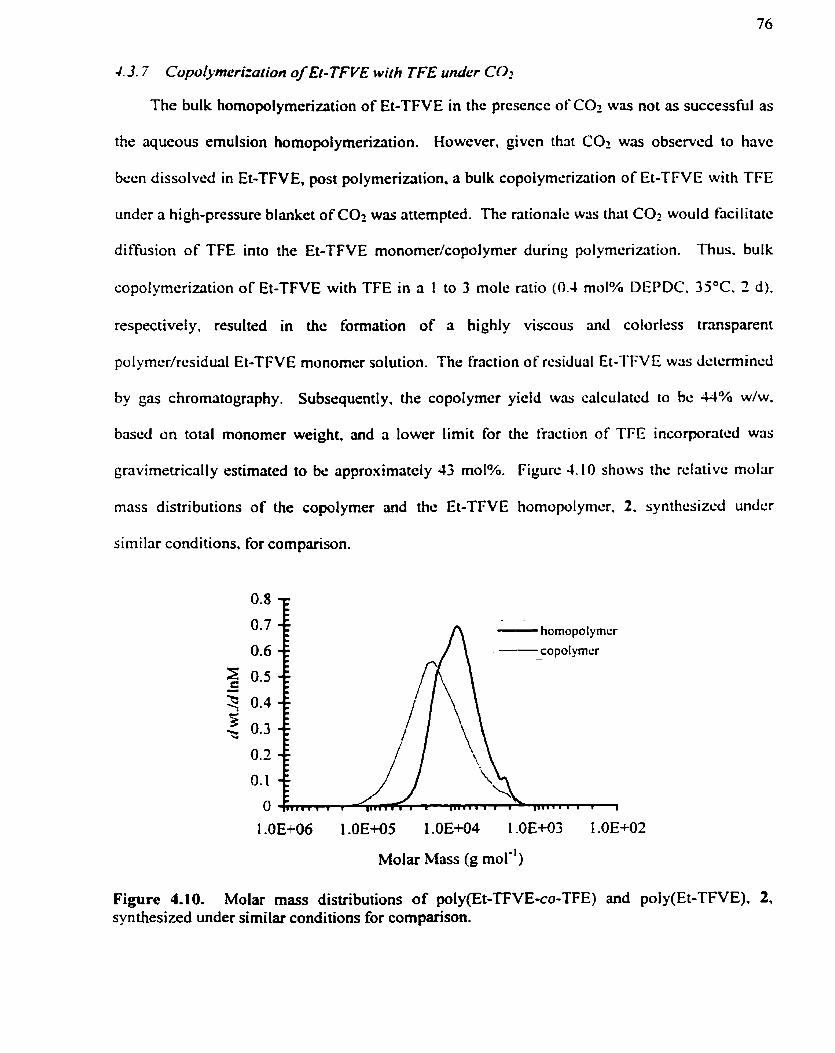
43 .7 Copolymerization of Et-TFVE with TFE under CO2
The bulk homopolymerization of Et-TFVE in the prcscncc of COL was not as successful as
the aqueous emulsion homopolyrneri~tion. However, givcn thrit CO:! was observcd to have
bern dissolved in Et-TFVE, post polymeriution. a bulk copoiymcriwtion of Et-TFVE with TFE
under a high-pressure blanket of CO2 was attempted. Thc rationalc was that CO2 would hcilitatc
diffusion of TFE into the Et-TFVE monomcr/copolymer during polymcrizrition. Thus. bulk
copolymrrization of Et-TFVE with TFE in a 1 to 3 mole ratio (0.4 mol% DEPDC. 35°C. 2 d).
respectiveiy, resuftcd in the formation of a highly viscous and colorlrss transparent
polymcr/rcsidual Et-TFVE monomer solution. Thc fraction of rcsidual Et-TFV il was dclcrmincd
by gas chromatography. Subsequently, the copolymer yield was calculatcd to bc 44% w/w.
briscd on total monorner weight, and a lowcr limit for the tiaction of TFE incorporatcd wris
gravimetrically estimated to be approximately 43 mol%. Figurc 4.10 shows the rclativc moinr
mass distributions of the copolymer and thc Et-TPVE homopolynicr. 2. synthcsizcd undcr
sirnilar conditions, for comparison.
Molar Mass (g mof ' )
Figure 4.10. Molar mass distributions of poly(Et-TFVE-CO-TFE) and poly(Et-TFVE). 2, synthesized under similar conditions for comparison.
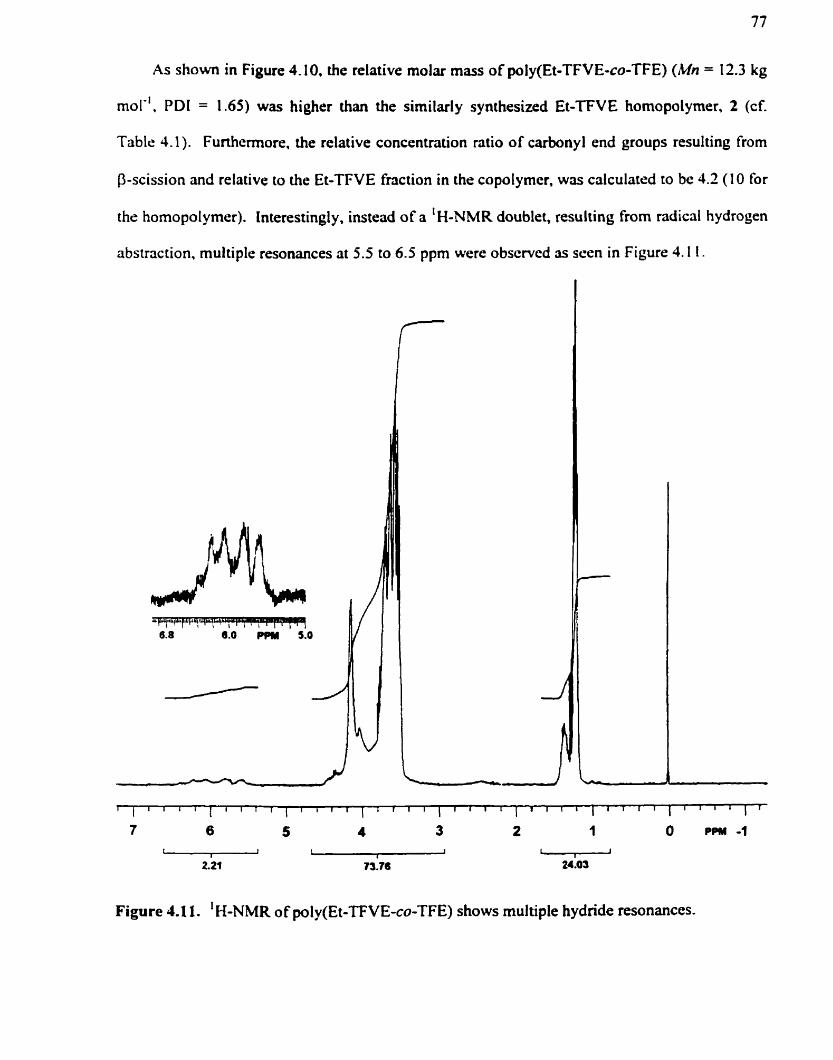
As s h o w in Figure 4.10. the relative molar mass of poly(Et-TFVE-CO-TFE) (Mn = 12.3 kg
mol". PD1 = 1.65) was higher than the similarly synthesized Et-TFVE hornopolymer, 2 (cf.
Table 4.1). Furthcrmore, the relative concentration ratio of carbonyl end groups resulting from
p-scission and relative to the Et-TFVE fraction in the copolymcr. was calculated to be 4.2 (1 0 for
the homopolymer). Interestingly* instead of a 'H-NMR doublet. resulting from radical hydroçen
abstraction. multiple resonances at 5.5 to 6.5 ppm were observed as seen in Figure 4.1 1.
1 Figure 4.1 1. H-NMR of poly(Et-TFVE-CO-TFE) shows multiple hydnde resonances.
Given the clectrophilic nature of TFE, the multiple resonances indicatcd that the macro-radical
on TFE had also abstracted hydrogen during copolymerization. The molar m a s between
abstractions. factoring in the Fraction of TFE in the copolymer. was calculated to be 930 g mol-'
which was notably lowcr than the homopolymer (1.540 g moi*' for 2).
4.4 Discussion
4.4. f Ejfcçtiveness of CO2 for Et-TFVE Hornopolym~rizution
Surprisingly. Et-TFVE did not hornopolymerizc in supercritical CO?, using .4IBN or
DEPDC initiation. Howcver, Et-TFVE did homopolyrnerizr under a blankct of high prcssurc
CO?, but thc GPC determincd rclativc rnolar masses werc lowcr thm poly(Et-TFVE)s
synthcsizcd in bulk under vacuum which wcrc, in tum. lower than the homopolymcr synthcsizcd
in an riqucous cmulsion (cf. Table 4.1). Furthcrmorc, thc absolutc rnolrir masses ( M n , , b , ) of JI[
poIy(Et-TFVE)s, cstimated from MALDI, werc evcn lower than the GPC dctcrrnincd molrir
masses (ltfn),
Givcn that Mnab, for the bulk synthesized poly(Et-TFVE)s (cf. Figurc 4.4 md Tablc 4.2)
were low, the apparent iack or limited polyrnerization in COz could bc rationdizcd i f thc rate
constant, k,, for propagation was srnail. Thc monomer concentration ([Et-TFVE]) would then
- have a considerable influence on the instantancous average kinetic chain length. v . to the extent
that termination and chain uansfer processes, r,, would effectively compete with propagation. r,,
under dilute monorner conditions ( ; = r , l r , o &,[Et - T F V E ] I ~ : " for bulk or solution
polyrnerization. kt is the temination rate constant).
The probability of P-scission chain transfer was proportional to the lifetime of the radical
between propagation steps which was inversely proportional to [Et-TFVE]. Thus, monomer
dilution resulted in the observed concentrations of carbonyl end groups (cf. Table 4.4) and
contributed to the lack of polymerization in supercritical CO2. It also contributed to the lower
rnolar masses and yields for the homopolymers synthesizcd under high-prcssurc CO? relative to
bulk polymerimtion under vacuum. For the former. an appreciable amount of COz was visually
obscrved to b r soluble in the bulk monomer upon venting and opening the rcactor post
polymerimtion.
The relative concentration of cvbonyl end proups. resulting from p-scission chûin tmsfer.
was lowest for poly(Et-TFVE) synthcsized in an aqueous emulsion. This was likcly duc to
monomer diffusion. into the growing micelle. beinp non rate limiting bricausc of a small k,.
Given. the unique reaction kinetics7 of emulsion polymerizations. a sma!l k, would rffcctively
result in a high and constant local concentration of the monorner in thc miccllc for the duration
of the polymcrization. Accordingly. the relative concentration of carbonyl end groups was 3.6
timcs lowcr than in the polymer synthesizcd under bulk vacuum conditions. but thc numbcr
rtvcragc molrir mas, Mn, was only 1.3 times larger. Whilc tcmpcraturcs wcrc idcntiçril in bot11
polymcrizations. DEPDC or ammonium persulfatc initiator decomposition ratc constants. k d . and
- f ic ienc ies werc not mesurcd and could not br: r:.~pcctcd to be identical. Ikthcrmorc. v was
invcrsely proportional to the initiator concentration. [I?], in the emulsion polymcrization whilc it
would have been inversely proportional to [[*] '" under bulk conditions.' Conscqucntl y. bi -
radical termination rates were undoubtedly dissirnilar among the differcnt polymcrizacions.
The molar masses between radical hydrogen abstractions, Mtlabst, were similar or less than
their respective absolute molar masses, Mnab, for al1 po l y(Et-TFVE)s. within erro r estimates (cf.
Table 4.5). This confirmed that the radical resulting from intramolecular abstraction continued
to propagate since hfnabs from MALDI aIso reflected P-scission. The fb&abst were proportionai to
rdr&bst where r, was first order in [Et-TFVE] and Qlrbsc was the rate of abstraction. Thus. the
l&abst were a measure of the kinetic chah Iength between abstractions. The evidence for
intramolecular abstraction fiom the pendant group adjacent to the propagating radical suggested
that r ~ d ~ ~ should be independent of [Et-TFVE]. However, the similarities between the M~aba for
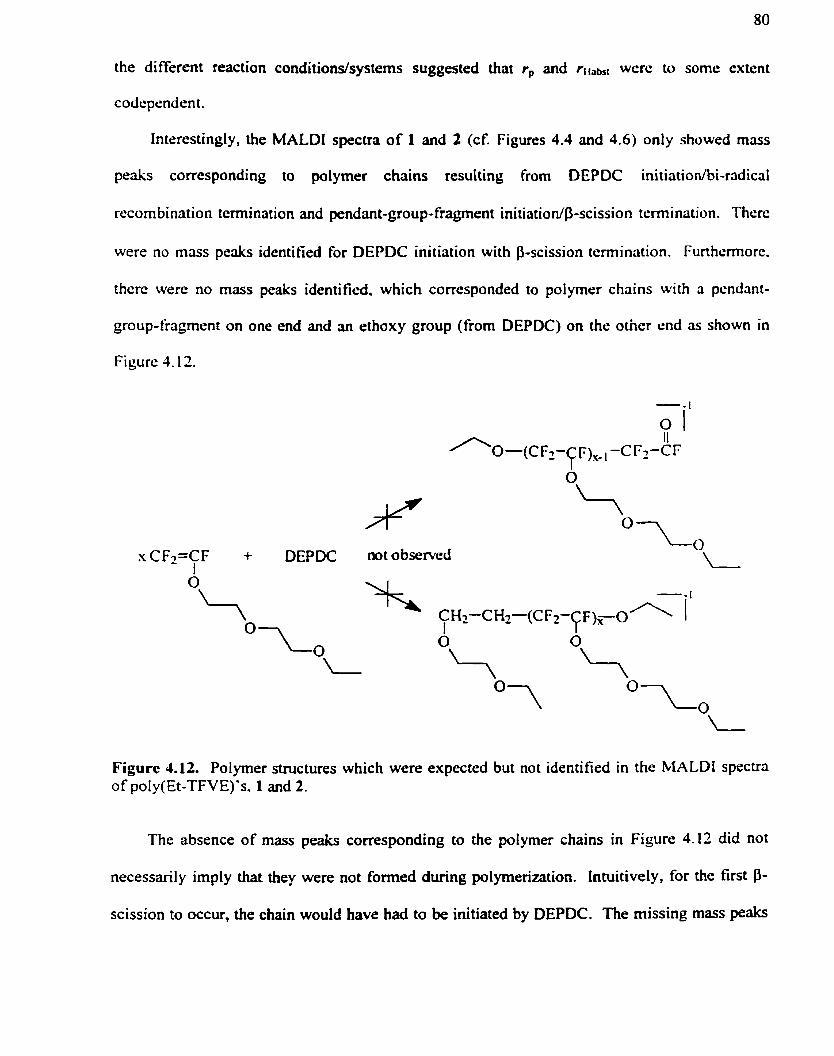
the different reaction conditions/systems suggested that r, and r l l r b ~ wcrc to some extcnt
codependent.
Interestingly, the MALDI spectra of 1 and 2 (cf. Figures 4.4 and 4.6) only showed mass
peaks corresponding to pulymer chains resulting from DEP DC initiationhi-radicd
recombination termination and pendant-group-fragment initiation@-scission termination. Therc
were no mass pcriks identified for DEPDC initiation with p-scission terminrition. Furthcmorc.
there were no mass peaks identified, which conesponded to polymer chains with ri pcndant-
group-fragment on one end and an ethoxy group (from DEPDC) on the otncr end as s h o w in
Figure 4.12.
Figure 4.12. Polyrner structures which were expected but not identified in the MALDI specva of poly(Et-TFVE)'s. 1 and 2.
The absence of mass peaks corresponding to the polymer chains in Figure 4.12 did not
necessarily imply that they were not formed during polymerization. Intuitively, for the first P-
scission to occur, the chain would have had to be initiated by DEPDC. The missing mass peaks
were likely formed in low concentrations and were obscured by the background. To test this
hypothesis. the intensities of the MALDI mass peaks of t and 2 were compared. It was observed
that mass peaks corresponding to pendant group fragment initiation@-scission termination (i.c.
integcr multiples of the monomer m a s ) were noticeably less intense in thc spectrum of 1 .
Furthemore, the polymerization tirne of t was the shortcst with the lowest monomer conversion
to polyrncr. This suggested that DEPDC initiation with bi-radical rccombination termination
w u prcdominant at the beginning of the polymerization; whils the majority of chrtins rcsultiny
from pendant-group-fragment initiation@-scission termination wcrc formed nsar thc end of the
polymcrizrition whcn [DEPDC] and [Et-TFVE] wers lowcr. Thus, thc missing chrtins in Figure
4.12 wcre iikely fomed to some cxtent o w r a transition psriod.
4.4.2 Ef-TFVEcupolymerizu;ion with TFE
Po i ymcrization of Et-TFVE with TFE under high-pressure COI using thrcc equivalents of
TFE. resulted in copolymer formation. Howevcr, rvcn with a largc cxcess of TFE. only a 44%
copolymer yield with approximately 43 mol% TFE incorponted was obtained. It was initially
anticipated that if there was a significant amount of TFE homo-propagation. then the molar mass.
yield and fraction of TFE in the copolymcr. would be relatively high. That is. a TFE content
grcater or equal to 75 mol%, notwithstanding TFE soiubility during the polymerization.
However. given that earlier results suggested that the rate of Et-TFVE homopoIymerization was
Iow. the low copolymer yield suggested that the rate of cross-propagation to TFE was also low.
Not surprisingly, the relative concentration of carbonyl end groups resulting from P-
scission was less han half that for the homopolymer, 2, synthesized under similar conditions.
This was n result of disproportionation not occurring when the macro-radical was on TFE.
However, the rnacro-radical on TFE did radically abstract hydrogen during polymerization as
evidenced by a complex 'H-NMR hydnde resonance and a 40% lower rnolar mass between

82
abstractions. This suggested that the rate of cross-propagation of the macro-radical on TFE rnay
have been small as well; likely within an order of magnitude of Et-TFVE. Overall. the results
presrnted indicate that Et-TFVE and sirnilar TFVEs are not very reactive towards homo- and
copolymcrization with TFE, likely as a rcsult of small homo- and cross-propagation rate
constants. Thus, TFVEs are likely not a viable approach to prcparing soluble highly tluorinated
potymers.
4.5 Rcfcrcnces
van Herk, A. M.; Manders, B. G.; Canela hfucrornolc.cuirs 1997.30.47804782
s, D. A.; Qi ladir, M.; DcSimonc, J. M.
DcYoung. J. P.; Romack, T. J.; Desirnone, J. M. Polymer Preprints 1997.38.2.424-5
Strain, F . ; Bissinger, W. E.; Dial, W. R.; Rudoff. H.; DcWitt. B. J.; Stçvcns. 1-I. C.; Langton, J. H. J. Am. Chem. Soc. 1950 72, 12%- 1263
Canelas, D. A.; Bctts, D.E.; Yates, M. 2.; Johnston, K. P.; DcSimonc, J . M. bfucromoiecuies 1998,3 1,6794-6805
Mc Hugh, M. A.; Knikonis, V . J. Supercritical FluiJ Ektruct ion: Principlcs and Pruc~ice. 2""d.; Buttenvorth-Heincman, Stone-Ham. 1993
Murray. D. L.; Hanvood, H. J.; Shcndy, S. M. M.; Piirrna. 1. Pofymer 1995,36,3841
Odian. G. Principies ofPoiymcrizarion 2" Edition. John Wilcy & Sons. Ncw York. 1981

5 SYNTHESIS OF POLY(TETRAFLUOR0ETHYLENE-CO-VINYL ACE- TATE) IN SUPERCRITICAL CARBON DIOXIDE'
5.1 Introduction
As discussed in chapter 4. the propagation rates for homo- and copoiymerization of Et-
TFVE with TFE appeared to be low. As a consequence. high molar mass homopolymers. and
copolymers with high fluorine contents, could not bc synthesizrd using hydrocarbon TFVEs.
Furthermore. polymerization in CO?, a solvent favorable for copolymcrization with TFE. did not
result in polymer formation. It was likely that termination m d chain trmsfer rcactions werc
effectively competing with propagation under dilute monomer conditions. I-lowcvcr. the
underlying rationale behind the rescarch rcmaincd. That is. the synthcscs of proccsssiblc. orgmic
so lvcnt solublc fluoropolymers which rnay evcntually havc biomcdiçal applications.
An altcmatc approach to prcparc proccssablc, organiç solvcnt solublc, and highly
îluorinated polymers was to copolyrnerizc a fluoromonorncr with a hydrocarbon monomcr such
as TFE with vinyl acetate. TFE with VAc copolyrners havc bccn prcviously synthesizcd in
aqueous emulsionsl2 and in *'mini-emulsions", usinp an organic CO-~olvcnt.~ by frce radical
polyrnerization. The monomers were appeared to statistically copolymerize and thc copolymers
were morphous and could be solvent cast into colorless, transparent films. Givcn the known
crystallini ty and lack of solubility of poly(tetrafluoroethy!ene)." copolymcrs with at lerist 70 mol
% TFE were amorphous and organic solvent soluble. Partial hydrol ysis of poly(TFE-CO-VAc) to
vinyl alcohol (VA) yielded terpolymers, poly(TFE-CO-VAc-CO-VA), providing reactive
functional sites for cross-linking. Cross-linking, with agents such as di-isocyanates, was used to
f o m hard polymer films with potential for tough, weather-resistant coatings applications.*
Lousenberg, R. D.; Shoichet, M. S., Macromolecules 2000.33, 1682-1685
83
Howevcr, the solvent systcms used for polyrnerization limited thcsc copolyrnen. A narrow
range of compositions w s obtained when organic CO-solvcnts wcrc cmployed.h while highly
brmchrd structures were formed, for copolymen prepared in aqueous e m u l s i o n ~ . ~ Hydrolysis of
copolymers, prepared in aqueous emulsions, not only convcnrrd cstcr groups CO thc
corrcsponding vinyl alcohol (VA) but also resulted in at least 3 IO-told decrcasc in thc wcight
average molar mass (MW) of the copolymers. It was proposed that radical hydrogen abstraction.
of mcthyl hydrogen from VAc by the macro-radical on TFE, and continucd propagation of thc
resulting macro-radical, incorponted ester groups into thc polymcr backbonc (cf. Figure 1.3 1-
Subscqucnt hydrolysis cleaved thrse esters resulting in a dccrcascd Mc).
In this chaptcr, the copolymerization of TFE and VAc in supcrcritical crirbon dioxide (CO?)
was invcstigatcd. CO2 is an environmcntally frirndly and convenient solvent for tluoropolymer
synthcsis.'.' It has also been used for the dispersion homo- and copolymcriwtion of VAc with
othcr hydrocarbon mono mer^.^ By using COz, the nced to rcmovc organic solvcnts post-
polymerization may be avoided. Furthcrmorc, m insignificant dccrcasc in rnolar mriss upon
hydrolysis of VAc to VA was observeci, indicating that thesc copolymcrs. unlikc thosc
prcviously synthesized in aqueous emulsions, are essentially lincar.
5.2 Rcsults
5 2 . 1 Copolymer Synthesis
Poly(TFE-CO-VAc)s were synthesized in supercritical carbon dioxide at three TFE and two
initiator concentrations, the results of which are summarized in Table 5.1. The copoiymcr
compositions were estimated by elemental analysis, NMR, and mass balance. For the latter, it
was assumed that: (1) al1 of the VAc monomer was incorporated into the copolyrner and ( 2 ) the
polymer had been quantitativeIy isolated fiorn the reactor. Using these assumptions, a Iower
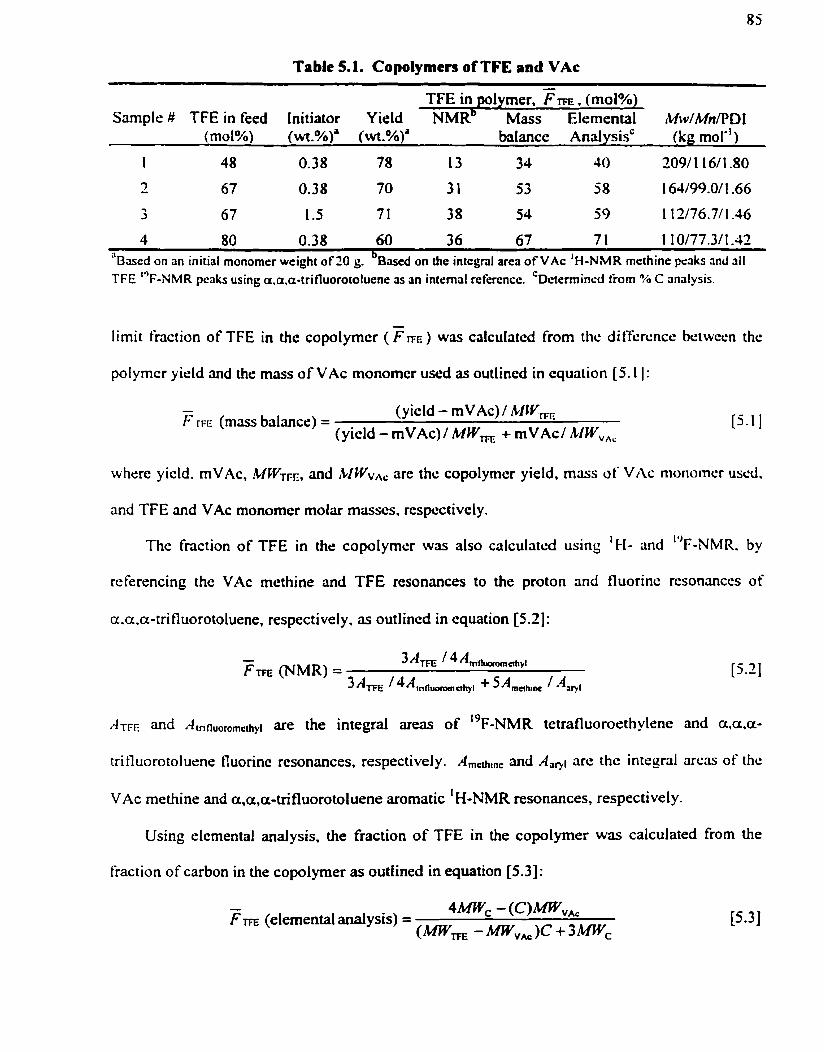
Table S. 1. Copolymem of TFE and VAc
TFE in polyrner, FTFE . (mol%) Samplr # TFE in feed Initiator Yield NMR' Mass Elrmental iMw/Mn/PDI
(mol%) (W.%)" (w.%)~ balance AnalysisC (kg mol")
1 48 0.38 78 13 34 40 2091 1 16/ 1.80
b ' ~ased on an initial monomer weight o f 20 p. Based on the integral area o f VAc 'H-NMR rnethine praks and dl
TFE 'IF-NMR pcaks using a.a,a-trifluorotoluene as an intemal refcrencc. C~ctemined !tom " ! C analysis.
limit fraction of TFE in thc copolymer ( F ) was calculated from th<: di ffercnce brtwccn thc
polymcr yield and the mriss of VAc monomcr used as outlined in cquation 15.1 1:
- (yicld - mVAc) / MYm F rrx (mas balruicci) =
( yicld - mVAc) 1 hf Wm + mVAc l MIVv,\,
where yicld. mVAc, and MWv,,, are thc copolymcr yield, mriss of VAL monomcr uscd.
and TFE and VAc monomcr molru masscs, rcspcctivcly.
I The fraction of TFE in the copolymer was also calcuhtcd using FI- and "IF-NMR. by
referencing thc VAc rnethine and TFE resonances to the proton and fluorinc rcsonanccs of
a.a.u-trifluorotoluene, respcctively, as outlincd in equation 15.21:
ATPE and ilinnuoromchri are the integral areas of ' 9 ~ - ~ ~ ~ tetrafluorocthylenc and u,a.a-
trifluorotoluene fluorine resonances, respectively. Amcthlnc and A,I arc the inteçnl areris of thc
VAc methine and a,a,a-trifluorotoluene aromatic 'H-NMR resonances, respectively.
Using elemental analysis, the fraction of TFE in the copolymer was calculated from the
fraction of carbon in the copolymer as outlined in equation [5.3]:
- F TFE (elemental anal ysis) =
4 m - I ~ ) M W , , , ( M m - M W , )C + 3Mwc

C is the fraction of carbon detemined by elemental analysis and MWc is the molar mûss of
elcmcntril carbon.
Interestingly. the composition calculated by NMR was consistently lowcr than that
calculatcd by mass balance; longer "F-NMR transirnt ncquisition/pulse dclay times wcre of no
consequencr to composition. Feiring obsewed similar discrepancics between NMR and
elemental analysis for his fluoropolymers.10 Thus, the composition calculatcd by elemental
analysis was determined to be the better estimate. The TFE content in the copolyrnrir was
slightly lower than that in the feed. Initiator concentration affccted molrir mss but was of little
consequrnce to copolymcr composition. Al1 of the polymcrs had MW S grcater than 100.000 g
mofl and PDIs less than 2.
3 - 2 2 Copoiymcr Hydrolysis
Po~~(TFE-c~-VAC)S were hydrolyzed undcr acidic conditions to ~OI~(TFE-~O-VA~-CO-VA)
as detemined from FTlR by both a large dccrcase in the VAc carbonyl absorption ( 1 772 cm")
and the appearance of a hydroxyl absorption (ca. 3350 cm-'). Thc cxtcnt of hydrolysis was
calculatrd by the change in the carbonyl absorption relative to a referencc absorption (ca. 1 120
or 1 157 cm-') in which the intensity did not change significantly following hydrolysis. As listcd
in Table 5.2 and shown in Figure 5.1, most of the VAc groups were hydroiyzcd to VA groups.
Table 5.2. GPC Molar Mass Data of Poly(TFE-co-VAc), before and after Hydrolysis
~ -
Mw/Mn/PDI (ke mol") VAc hydrol yzed Sarnple # Before hydrolysis After Hydrolysis (mol%)

Figurc 5.1. FTIR spectm of poiy(TFE-CU-VAc), 4, bcfore and afttcr hydrolysis.
By comparing the GPC molar mass data in Tabic 5.2, rnolar mass typically dccrcascd and
polydispersity increased a f e r hydrolysis. The molar mass distribution shiftcd to iowcr mol=
mriss as a result of hydrolysis, yct a srnaII high moiar rnass tail appciucd as shown in Figurc 5.2.
Some of the polymer chains likely condcnscd under the acidic hydrolysis conditions uscd.
Although hydrolyses were carried out in dilutc solutions in the prescnce of watcr, the high molar
mas tail was evident in al1 distributions. While base hydrolysist would have been the preferred
method of hydrolysis, it was ineffective, resulting in discoloration and decomposition of the
polymer. iikely as a result of elimination reactions.
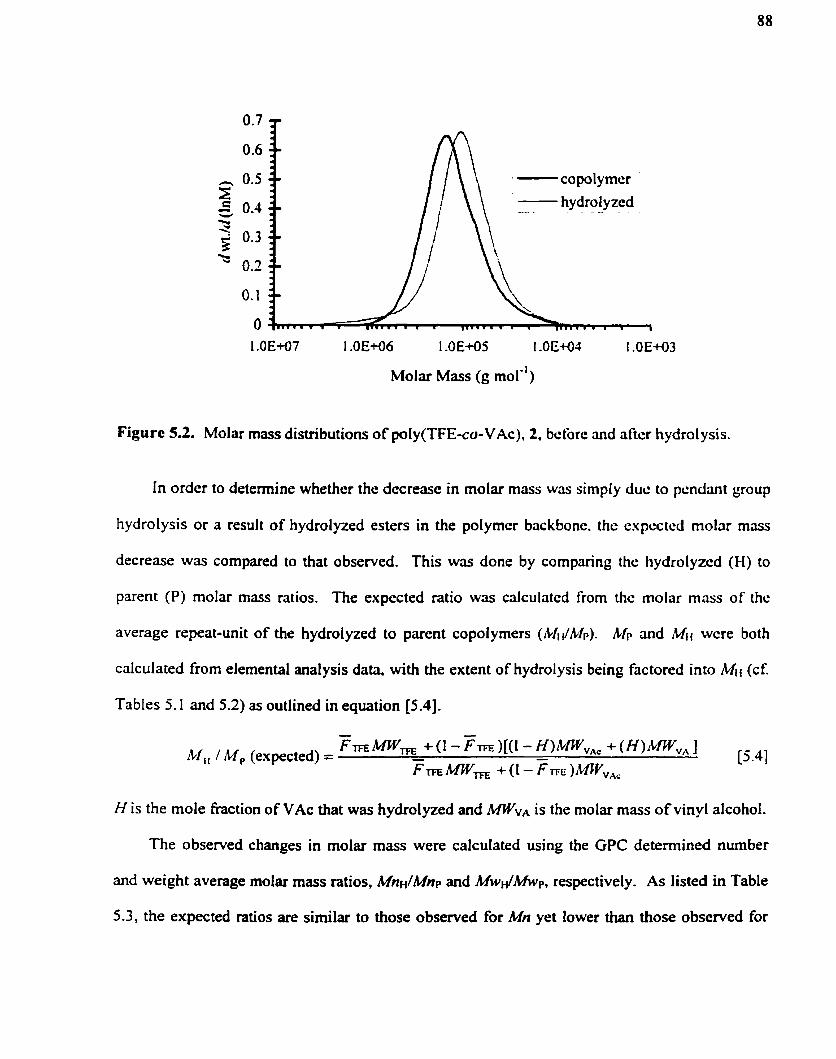
I .OE+07 I .OE+û6 I .OE+ûS l .OE+O4 I .OE+03
Molar Mass (g mol-')
Figure 5.2. Molar mass distributions of poly(TFE-CO-VAc). 2. bcforc and aftcr hydrolysis.
In order to determine whethcr the dccrease in molar mass was simply dus to psndant group
hydrolysis or a result of hydrolyzed esters in the polymcr backbonc. the cxpcctcd molar mass
decrease was compared to that observed. This was done by comparing the hydrolyzed (H) to
parent (P) rnolar mass ratios. The expccted ratio was calculritcd from the rnolar m a s of thc
average repeat-unit of the hydrolyzed to parent copolymers (~~IIMP). l& and hfif wcre both
calculated from elemental analysis data, with the extent of hydrolysis being factored into bfi~ (cf.
Tables 5.1 and 5.2) as outlined in equation [5.4].
- - Ad,, / M , (expected) = Fm MW, + (1 - F m )KI - WMWV, + ( H ) f M W , , 1
[ - F m - +(1 -FTFE)ICIIV~,,~
H is the mole fraction of VAc that was hydrolyzed and MWV, is the molar mass of vinyl alcohol.
The observed changes in molar m a s were calculated using the GPC determined nurnber
and weight average molar mass ratios, MnH/Mnp and MwH/Mwp, respectively. As listed in Table
5.3, the expected ratios are similar to those observed for Mn yet lower than those observed for

MW. The high molar mass tail o b ~ r v e d for the hydrolyzcd samples likely accounts for the
discrepancy in the MW ratio data with that expected.
Table 5.3. A Cornparison of the Expectcd and Obscrved Changes in Molar Mass Rations of Hydrolyzed (H) to Parent (P) Polymers
Expected O bsçrved Sample # MHI M p Mnlclhfnp Mwl d1Llrvp
1 0.70 0.60 0.93
5.3 Discussion
Unlikc previous poly(TFE-CO-VAc) synthcscs in aqucous or mini- emulsions wherc a
branchcd structure was formed. in supercritical carbon dioxidc a predorninantly lincar polymcr
was f o m d . It was suggested that a "dendridic" or brmched polymer was formed during the
aqueous o r mini- emutsion polymerizations due to radical hydrogcn abstraction of VAc methyl
hydrogen. Continued propagation of the resulting macro-radical resulted in ester groups at the
branch Furthemore. MC wwas observed <O decrease significantly upon hydrolysis.
Herein, the molar mass avenges did not change substantially upon hydrolysis of COz-
synthesized polymcrs. More importantly, the expected and observed moiar mas ratios are
simi l x , yet in al1 cases, !C(nkf/Mnp are consistent1 y slightl y lowcr than the respective Mkilbfp (cf.
Table 5.3). Notwithstanding that GPC measures molar mass indirectly through hydrodynarnic
volume, this suggested that hydrogen abstraction was negligible and likely did not occur in most
cases. If hydrogen abstraction did occur, the results suggested that it may be slightly more
prevalent in cases where the fraction of VAc in the copolyrner was equal to or greater than the
fiaction of TFE (Le. sarnple #1).
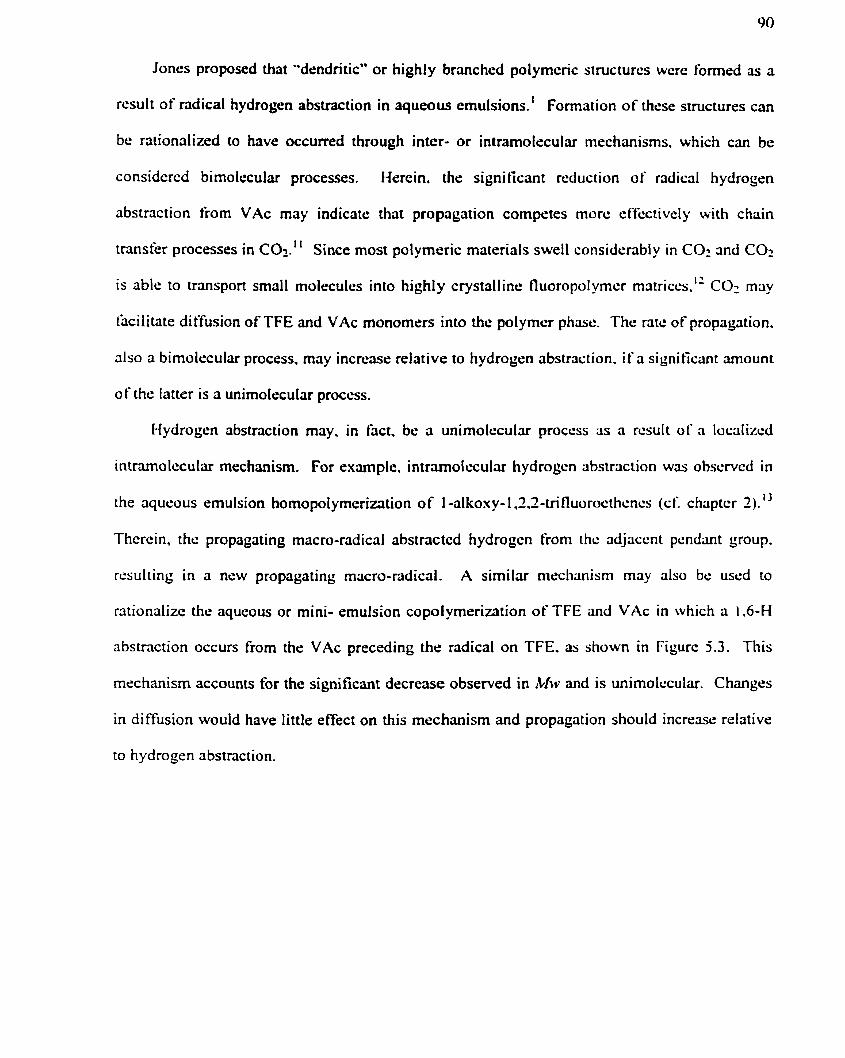
Jones proposed that "dendritic" or highly branched polymcric structures wcre fomcd as a
rcsult of radical hydrogen abstraction in aqueous ernu~sions.~ Formation of these structures can
be rationalized to have occurred through inter- or intramolrcular mechanisms. which c m be
considered bimolçcular processes. Horein. the significant rcduciion of radical hydrogen
abstraction tiom VAc may indicate that propagation cornpetes marc cffcctivcly with chriin
I I transkr processes in CO2. Since most polymcric materials swell considerably in CO, and CO,
is able to transport small molecules into highly crystalline fluoropolymcr matriccs.12 CO- may
facilitate diffusion of TFE and VAc monomers into the polymcr phase. The n i e of propagation.
d s o a bimolt.cular process, may incrcase relative to hydrogen abstraction. if a signitiçant amount
of the latter is a unimolccular proccss.
Hydrogen abstraction may, in fact, be a unimolc.cular proccss as (i rcsult of 3 locdizcd
intramolccular mechanism. For example. intnmolccular hydrogcn abstraction wris obscrvcd in
the aqucous emulsion homopotymerizrition of 1-alkoxy-1.3.2-triflut>rocthcncs (cf. chaptcr 2). 1 3
Thcrcin, the propagating macro-radical abstractcd hydrogcn tiom thc ridjriccnt pcndmt group,
resulting in a new propagating macro-radical. A similar meçlirinisrn may also bc uscd to
rritionalizc the aqucous or mini- emulsion copolynrerization of TFE and VAc in which a 1.6-H
abstraction occurs from the VAc preceding the radical on TFE. as shown in Figure 5.3. This
mechanism accounts for the significant decrease observed in MW and is unimolccular. Changes
in diffusion would have little effect on this mechanism and propagation should increrise relative
to hydrogen abstraction.
O
'Oiymr Y 'YHi propagation ,CF2 O
FzHC
Figure 5.3. A proposed intramolecu1ar 1 -6-H radical abstraction mechanisrn during aqucous emulsion copolymerization of VAc and TFE.
Ovenll. the experimrntal evidence indicated that propagation wu: favorcd ovcr hydrogen
abstraction in COz to a grcater extcnt than it was in aqueous or mini- smulsions. Consequently.
predominantly Iinear copoIymsrs wcrc synthesized in COz which arc. likcly more robust than
those synthesized in aqueous or mini- ernulsions. Other hydrocarbon monorncrs might also
copolymcrizc in COz with TFE to fom lineu copolymrrs. Evcntually. îluoropolymcr propcrties
rnay be tailorcd to spccific applications instcad of having thc application tï t thc Huoropol ymcr.
5.4 Rcfcrenccs
- - - -- -
(1 2) Watkins, J. J.; McCarthy, T . J . Macrumolecules 1995 28,4067
Jones, C. W. United Stutes Patent 5,723,556 t 998
Modena, M.; Borsini, G.; Ragazzini, M. European Polyrner J. 1967 3. 5- 12
Mares, F.; Oxenrider, B. C.; Long, D. J.; Sibilla, J. P. LTnitedStufcs Pclfcnt j.032.656 1991
Feiring, A. E. Organofluorine Chemisiry: Principles and Commcrciul .-lpplicutions ( R. E. Banks, B. E. Srnart, J. C. Tatlow, Eds.) Plenum Press. New York, 1994. ch. 15
Jones, C. W. United States Patent 5,723,556 1998
Mares. F.; Oxemider, B. C.; Long, D. J.; Sibilla, J. P. United Stutes Pafcnf 5,032656 1991
DeSimone, J. M.; Guan. 2.; Elsbemd, C. S. Science 1992 257,945-947
DeSimone. J. M.; Romack, T. United States Patent 5,618,894 1997
Canelas, D. A.; Betts, D. E.; DeSimone, J. M.; Yates, M. Z.; Johnston. K. P. ~Macrornolecules 1998 31,6794-6805
Feiring, A. E.; Wonchoba, E. R. ~facromolecules 1998,31,20,7 103-7 1 04
DeYoung, J. P.; Romack, T. J.; DeSimone, J. M . Pofyrner Preprinfs 1997 38,2,424-425

(13) Lousenberg. R. D.; Shoichet. M. S.. J. Polymer Sci.: Part A: Pdym. Chem. 1999, 37, 330 1-3308
6 CONCLUSIONS AND RECOMENDATIONS
The synthesis of novcl fluoropolyrners incorporating novcl hydrocarbon TFVEs was
investigated. Potential biomedical applications were the initiai underlying rationale with the
expectation that the polymers would bc more processable and soluble in organic solvents relative
to convcntional fluoropolymers. Al though the TFVEs were shown to homopolyrnerize in
chripter 2 and 4, the absolute molrir masses were low, likcly because of low propagation rates.
Furthermore, chain transfer rerictions such as radical hydrogcn abstraction and (1-scission wcrc
observed and were significant. Thrsc side reactions rnay havc signi ticant consequcnces whcrc
chernical stability is rcquired.
Intramolc.cular radical hydrogcn abstraction chain transtkr rcsultcd in incorporation of
portions of the hydrocarbon pcndmt group into the fluorocarbon potymcr backbonc and 0-
scission resultcd in cmboxytate cnd-groups and likcly contributcd signiticantly to Iimiting rnolrir
mus . Interestingly. the molar masses of Ph-TFVE homopoiymcrs wcrc signi ticantly hiçhcr than
similarly synthesized Et-TFVE and fer[-Bu-TFVE homopoiymcrs (cf. chapter 2).
Notwithstanding differences in hydrodynamic volurnc which mriy complicatc GPC molar mass
comparisons. thc higher poly(Ph-TFVE) molar masses may bc a consequcncc of a lack of
hydrogen abstraction. Given that evidence prcsented in this thcsis indicatcd thrit thc macro-
radical resulting from abstraction continued to propagate, this may not alwriys occur and the
radical might terminate. However, a more likely scenario, which was not investigated. was thrit a
more sterically compact Ph-TFVE pendant group structure allowed for higher rates of
propagation. Thus, structurally simpler TFVEs may be advantageous and lead to higher molar
mass polymers and copolymers.
Much higher molar mass copolymers were realized when the TFVEs were aqueous
emulsion copolymerîzed with electron rich hydrocarbon monomers such as EVE and VAc as
93

discussed in chnpter 3. This was a resuit of highrr TFVE cross-propagation rate constants as
cvidrnccd by reactivity ratios that were siyniticantly lcss than 1 . Funhcrmorc, P-scission was
likely inconsequential in thesc systcms but tadical hydrogcn abstraction was still cvidcnt ruid wris
more prevalent for higher fractions of the TFVE in the monomer kcd.
Although higher molar mass TFVE polymers werc realizcd from copolymcrizrition with
EVE and VAc, thcse copolymsrs had reduced fluorinc contents which wcrc not necessarily
desirable. Unfortunately. copolymerization with TFE in the prescnce of high prcssurc carbon
ciioxidt: was not as succcsshl ris would have bccn dcsired. Only. slightly higher rnotar mass
copolymers with respect to homopolymerization were rcalizcd. Furthcrmorc. a higher rate of
radical hydrogen abstraction was cvident and the fraction of TFE in thc copolymer was
significantly towcr thm the fraction in the monomcr fccd. Otlicr tluoromonomcrs such as
vinylidcne fluoridc might copolymcrizc satisîàctorily. Howcvcr. radical hydrogcn abstraction
will still likely bc problematic.
Finally, therc is some conccrn rcgarding thc long-tcnn hydrolytic stability O t' somc of tlic
TFVE polyrners. It was observcd that Et-TFVE and tuf-Bu-TFVE homopolymcrs would
cicvelop a very sharp smell on standing ovcr a pcriod of several wccks to months and wcrc acidic
to pH paper. 1 suspect that the hydrophilic pendant groups are susceptibIc to hydrolysis with
formation of HF. Given these results, 1 would recommend that hydrocsirbon TFVEs rirc not
particularly practical, cost effective or a viable approach to preparing processablc and organic
solvent soluble fluoropolymers.
However. copolymerization of TFE with VAc in supercritical CO2 was vcry successîÙl and
high molar mass copolymers with TFE contents up to 7L moloh were realized. as discussed in
chapter 5. These copolymers were soluble in organic solvents and could be fonned into
transparent, tough films. Furthemore. it was observed that radical hydrogen abstraction was
suppressed relative to propagation. Consequently, predominantly linear polymers resulted which

did not have ester groups incorporated within the backbone. Thus, 1 would recommend further
research be conducted on this polymer synthesis. Other fluorornonomen such as vinylidene
fl uoride or chlorotri fluoroethy lene will undoubtedly copolyrnerize. Final l y. other h ydrocarbon
monomers rnay copolyrnerize with the fluorornonomers and yield predorninantly linear
copolymers. Preliminary results with acrylates indicate that this class of hydrocarbon monomers
copolyrnerizes with TFE and mrry be linear.

7 EXPERIMENTAL PROCEDURES
7.1 Expcrimental for Chapter 2
Reagenrs. The three TFVE monomers, Et-TFVE. cerf-Bu-TFVE and Ph-TFVE. wcrc
prepared according to published rnethods ' and as prcviousl y dcscri bed.' Thc monomers wcrc
purified by fractional distillation to greater than 99% purity. as detemincd by gas
chromatognphy. 'H- and 1 9 ~ - ~ ~ ~ . Al1 water was deionized and distillcd from MiIliporc Milli-
RO 10 Plus and Milli-Q UF Plus (Bedford. MA) systems and used at 18 iL1R rcsistmcr. Al1
other rcagents were obtained from Aldrich (Ontario, Canada) and used as rcceivcd.
Characrcrizu~ion. Polyrners wcrc characterized for molar mass using a gcl pcrmcation
chromatograph (Waters 2690, Bedford. MA), cquipped with a refiactivc indcx dctcctor (Waters
4 10, Bedford, MA) and a series of ~ t ~ r o ~ e l " columns (Waters lo5. 10" and 500 I\. Bcdford.
MA). Using a THF mobile phase, polymer molar mass was calculatcd rclativc to polystyrcnc:
1 standards (Aldrich. Ontario, Canada). H- and "F-NMR spcctra wcrc obtiiincd on a Varian
Gemini 300 MHz spectrometer in CDCI, using TMS and CFCIi as cxtcrnal rclkrcnccs.
respectively. FTIR spectra were obtained using a G a l u y Series 5000 spcctromctcr. Glriss
transition temperatures (Ta were measured using a Perkin Elmer DSC-7 diffcrcntial scanning
calorimeter under an inert nitrogen atmosphere at a heating rate of 1 0°C-minel, rither from -
120°C to 0°C for poty(Et-TFVE) and poly(cert-Bu-TFVE) or from -50" to +50°C for poly(Ph-
TFVE)
Emufsion Homopolymerization of Et-TFYE, tert-Bu-TFVE o r Ph-TFVE. To a 100 mL
round bottom flask equipped with a magnetic stirrer and nitrogen purge. 22 or 29 mL of
deionized water and 8 or 1 mL of a 3.1 x 10" M aqueous fernous ion solution [Fe(II) as FeSO4 .
7H20] solution were added for a total volume of 30 rnL. Dissolved oxygen was removed using a
y ). and sodium hydrogensul rite (50 1 00. or 200 mg) were addcd to the flask. Thc temperature of
the Hask was adjusted to the dcsired polymcrization temperature (2 to 50 OC) using a Haake KI 5
watrr bath with a DC3 tempenture controller. Potassium pcrsulfate ( 1 wt. rquiv. to NAHS03;
50 to 200 mg) was addrd to the flask prior to the addition of of monomcr (3.0 g). Tht: monomcr
was polymerized for 2 to 4 days after which 4 . 5 ml of concentrated HCI was added to the
poly(Et-TFVE) and poly(rerr-Bu-TFVE) synthsses, followed by centrifugation. Poly( Et-TFVE)
and poly(rc.rt-Bu-TFVE) werc dissolved in cthanol and thcn prccipitatcd into writcr (twicc)
bcfore drying undrr vacuum (P -- 0.1 mmHg. 40°C). The polyrncrivtion of Ph-TFVE was
tcrminatcd by the addition of -300 mL of acidified mcthanol ( i . ~ . . with -0.5 mL concentratcd
IlCl). Thc polyrnér w;is vacuum tïltcrcd on a coarse frittcd funncl and washcd with -50 mL
rncrhanol (tiirce timrs) before dryiny undcr vacuum (P = 0.1 mmHg. 40°C).
For poly(Et-TFVE): 'H NMR: 8 = 4.15 (broad S. 214. CFOCH2). 3.8-3-4 (broad m. 811.
OCHz). 1.2 (t. 314. CH3). "F NMR: S = -1 I 1 to -1 17 (brocid m. ZP, CF?). - 134 to - 137 (broad m.
1 F. CF).
For poly(rerr-Bu-TFVE): 'H NMR: ü = 4.15 (broad S. 2H. CFOCI-f:). 3.8-3.4 (broad m.
61 1. OCH-). 1.2 (S. 9H. C(CH3),). "F NMR: '? FNMR: S = - 1 1 1 to -1 17 (broad m. 2F. CF?). -
134 to - 137 (broad m, 1 F, CF).
For poly(Ph-TFVE): 'H NMR: 6 = 7.4-6.6 (broad m. 5H. Ph). 4.2 (broad S. 2H. CFOCH2).
3 -8 (broad S. ZH, 0CH2).; 1 9 ~ NMR: 6 = - 1 1 1 to - 1 15 (broad d. J = -85 Hz. 2F. CF?). - 13-4 to -
136 (broad m. 1 F, CF).
Bulk Homopolymerizution of Ph-TFVE. The initiator, 2,2'-azobisisobutyronitriie (AIBN 15
mg, 2 mol%). was added to a 2 ml glass vial that was sealed with a screw cap and a septum and
purged with nitrogen (5 min). To the vial was added either 1.00 g of Ph-TFVE or a mixture of
1.00 g of Ph-TFVE and 41 mg of n-butanethiol (10 mol%). The vial was placed in a 5S°C oven

for 3 days, af er which most of the unreacted monomcr was rcrnoved undcr vacuum ( P = Ton, T
= S O C ) . 'H- and "F-NMR data are in accord with those reportcd for the emulsion-polymerized
P h-TFVE; however. an additional ' H-N MR resonance was observcd for poly(Ph-TFVE)
preparçd in the presence of n-butanethiol: 6 = 5.7 (broad d. CF2CFH).
7.2 Erperimental for Chapter 3
Reogcnrs. Et-TFVE and Ph-TFVE were synthcsized as previously described' and
nccording to published methods' and puritied by vacuum fractional distillation to çrcntcr thm
97% purity as determincd by GC. 'H- and 'IF-NMR. EVE and VAç wcrc purchucd from
Aldrich (Ontario. Canada) and puri fied by short path distillation prior to use. Mcthanol.
ammonium hydroxidc, chloroforrn, and ricctonc wcrc obtaincd from Fishcr Scicntifk (Ontario.
Canada). Ali othcr reagents wcre obtaincd fiom Aldrich and uscd as rcccivcd. AI1 watcr wris
dcionizcid and distilled from Milliporç Milli-RO 10 Plus and Milli-Q UF Plus (Bedford. MA)
systems and uscd rit 18 MCT resistmcc.
Churuc[erixrion. Copolymers wcrc chanctcrizcd for molar mass by GPC (Wtrtcrs 2690.
Bedford, MA) equipped with a refractive indcx detector (Waters 410) and a scrics of styragcl'"
columns (Waters 106, lo4 and 500 A). Usinp a THF mobile phasc. polymcr molar m a s was
calculatrd relative to polystyrene standards (Aldrich). 'H- and "F-NMR spcctn were obtained
in CDClj on a Varian Gemini spectrometer at 300.75 and 282.33 MHz, respectivcly. using TbfS
and CFC13 as externa1 references. FTIR spectra (16 scans, 4 cm-' resolution) wcre obtained from
thin polymer films or solutions using a Galaxy Series 5000 spectrometer. Thin films were
prepared from -2 % w/v polymer solutions (in CHC13 or THF) that were cast onto NaCl disks.
Solution FTIR spectra were obtained from CHCl3 or THF polymer solutions using a solution ceil
with a 0.10 mm path length and NaCl windows.
Emulsion C0polymeri:ation of TFVEs with EVE or VAc. To a 100 mL round bottom flask
equipped with a magnetic stir bar and nitrogen purge. 29 mL of deionized watcr and 1 mL of 3
3.1 x 10" M aqueous ferrous ion [Fe(II) as FeS04 . 7Hz0) solution were addcd for a towl
volume of 30 mL. The flask was placed in a temperature controllsd reaction b c k r and
dissolved oxygen was removed using a nitrogen purge ( 1 h). Sodium hydrogen phosphate (O. 15
y ) . sodium dodccylsulfate (0.3 g) and sodium hydrognsulfitc (50 to 100 mg. 1 W. equiv.
rclativc to the initiator) were riddcd to the flask. With magnctic stirring. thc tcmpcrriturc of tlic
h s k was adjusted to the dcsired polymerizrition tempcrciture (typically 20°C) using ri H a k c KI5
writcr bath with a OC3 tcrnpcmture controllcr. Ammonium pcrsulfatc (or potassium pcrsulhtc)
(50 to 200 mg) was added to the flask before thé addition of a rnonorncr mixture (4.0 g): ( 1 ) Et-
TFVE + EVE; (2) Et-TFVE + VAc; (3) Ph-TFVE + EVE; (4) Ph-TFVE + VAc. Thc monomcrs
wcrc polymcrized for 1 or 2 days.
h-ohrion und PurYicatiun (if* El-TFVE Copdymers: Poly(Et-TFV 13-CO- EVE): P d y ( Et-
TFVE-CU-VAc). 0.5 ml of concentratcd HC1 was added to thc copolymer Iritcx. thcn it wris
ccntritùged to collect thc prccipitatc. The copolymcr was dissolvcd in ctlinnol and thcn
precipitated into water (twice) before drying under vacuum (P - O. 1 mmf-ig. 40°C) to constant
weight.
/J-dation and Purfjication of Ph-TFVE Copoiymers: Poly(Ph-TFVE-CU-EVE); Poly(Ph-
TFVE-CU-VAc). The polymer latex was added to -300 mL of acidified methmol (with -0.3 mL
concentrated. HC1)to precipitate the polymer. The polymer was vacuum filtered on a coarse
fritted funnel, washed twice with -50 mL methanol, twice with -50 mL deionized water, and
finally with -50 mL of methanol before drying under vacuum (P - 0.1 mmHg, 40°C) to constant
weight.
Bulk Copolymerization of Ph-TFVE with E VE or VAc. To a 2 mL g l a s via1 was added
2,2'-azobisisobutyronitrile (AIBN, 19 mg). The via1 was sealed with a septum screw cap and
purged with nitrogen for 5 minutes. Into the vial were injectcd 1.75 g of n mixturc of Ph-TFVE
and EVE or Ph-TFVE and VAc. The vial was placed in a 55 to 57°C ovcn until a change in
solution viscosity was visually observed (0.5 to 6 h). At that point. thc contents of the vial were
poured into 4 0 mL of methanol to precipitatc the polymer. Thc polymcr was wrishcd scvcral
times with methanol before drying undsr vacuum (P - 0.1 mmHg. -10°C) to constant wcight.
rl cid Hydrolysis of'Poly(Ph-TFVE-co- U c ) . To a 50 mL round bottom tlrisk equipped wi th
a magnetic stir bar and reflux condenser were added 0.50 g of polymcr. IO mL of CHC13. 10 mL
of rnethanol. up to 0.5 mL of water. and 0.25 mL of concentrated sulîùric a d . The mixture was
stirrcd and rcfluxcd for either 1 or 4 d. At that point. a colorlcss trrinsluccnt mixture had formed.
The volume of the mixture was rcduccd to approximately half by solvcnt ovaporzition. The
mixturc w3s thcn dilutcd to 25 ml with CHC13. Sodium bicarbonritc wris addcd to thc polymcr
solution with stirring until neutral to pH papcr. The solution was dccrintcd and the solvcnt
rcmoved by rotary evaporation. Thc crudc polymcr was dissolvcd in I O mL ol' ticctonc: and
precipitatcd in IO0 mL of watcr. The po1ymt.r was further puriticd by ccntrifùging. Jcctinting
thc supernatant solution, wrishing with wiitcr, and ccntrifuging agriin to collcct thc polymcr. TIic
polymcr was dricd to constant mass under vacuum (P - 0.1 mmtlg. 40°C)-
.4cid h'ydrolysis of Pofy(Ef-TFVE-co-Vtlc). To a 50 mL round bottom tlask cquippcd witli
a magnetic stir bar and reflux condenser were added 0.50 g of polymer. 15 mL of mcthrinol. up
to 0.5 mL of water, and 0.25 mL of concentrated sulfuric acid. The mixture was retluxcd for 1 d.
At that point. a colorless transparent solution had fonned. The volume of the mixture \vas
reduced to approximately half by solvent evaporation. The polymer solution was then dilutçd to
approximately 25 mL with methanol. Sodium bicarbonate was added to the polymer solution
and stirred until neutrai to pH paper. The solution was decanted and the solvent removed by
rotary evaporation. The crude polymer was dissolved in 10 mL o f acetone and filtered on a fine
frit fünncl or centrifuged to remove residual salis. The acctonc was removed by rotary
cvaporation and the polymer was dried to constant mass under vacuum (P - 0.1 mmHg, 40°C).
Base Hydrufysis ofPoly(Et-TFVE-co-Y,.Zc). Two methods werc attcmptcd: ( 1 ) To a 50 mL
round bottom flrisk equipped with a magnetic stir bar werc addsd 0.50 g of polymer. 15 mL of
mcthrinol, and 1 mL of concentrated ammonium hydroxide. Thc mixture wris stirrcd at room
temperrtturc for up to 4 d at'ter which the solvent was rernovcd by rotary cvaporation. The
polymcr was dried to constant mriss under vacuum (P - 0.1 mmf-1g. 40°C). ( 2 ) To a 50 mL
round bottom flask equipped with a magnetic stir bar wcrc acidcd 0.30 g of polymsr. 1 5 mL of
inzthanol. and 1 mL o f 10% aqucous sodium hydroxidc in mcthrinol. Thc mixture was stirrcd at
room tcmpcraturc for up to 1 d aficr which an o rmgc to rcd solution color wris obscrvcd. The
solvcnt W ~ S rcmovcd by rotary evaporation and thc polymcr puriticd by rcpcatcd
prccipitatiodccntrifugrition in writcr. Thc polymcr wris dricd to constant mas undcr vacuum (/'
- 0.1 mmHg. 40°C).
7.3 Expcrimcntal for Chapter 4
Reqyenrs. Et-TFVE was synthcsized as prrviously describcd' and aççording to publishcd
mcthods' and purified by vacuum fractional distillation to greatcr than 97% purity as dctcrmincd
by GC. 'H and "F NMR. TFE was prepared by vacuum pyroiysis of polytctra~uorocthylcne3
(Aldrich. Ontario, Canada) and stored at room temperature ovcr ci-limonme in a 300 mL
stainless steel sample cylinder fitted with an 1800 psi sakty mpturc disc. Caution! The
hcrnding of' TFE i'; inhererttly dungero zts. Anyunr con~ernpIu;ing t h hundling of. hi-@ pres'ittrt.
TFE shortid familiarize himself or hersey with safe handling procecitrres. Utder the right
conditions, TFE can explode rvith the force of TNT. The inhibitor was removed by inline
filtration thmugh chrornatographic silica gel (200-425 mesh, Fisher Scientific, Ontario, Canada)
prior to use. The diethyl peroxydicarbonate (DEPDC) initiator was prepared using a published
proccdurc.' and stored in Freon 1 1 over anhydrous mûgnesium su1 fatr: ai -20°C. The D EP DC
was standardized by iodometry and was 5.1 % (w/w). Methanol, ammonium hydroxidc.
chloroform, Freon l f 3w, and acetone were obtained from Fisher Scientiîlc (Ontario. Canada).
SFC purity CO2 was obtained frorn Mathcson (Ontario. Canada). AI1 other rcagcnts werc
obtained tiom Aldrich and used as rcceived. Al1 water wris deionizcd and distillcd from
btillipore btilli-RO 10 Plus ruid Milli-Q UF PIus (Bedford, M.-\) systems and uscd at 18 MC2
rcsistance.
Charucrerizarion. Polymèr rnolar mass distributions wcrc chamctcrizcd by GPC (Waters
U6K injcctor. 5 10 pump) equipped with a refractive indcx dctcctor (Watcrs 24 10) and a scrics of
~ l t r n s t ~ r o ~ c i " colurnns (Waters. lo4, 500 A. 50 A). Using an cthyl acetntc mobile phasc ( 1 mL
min"). polymer molar masses werc calculatcd rclativc to polystyrcnc standards (Aldrich.
Ontario. Canada). FTIR absorbance spcctra (16 scruis. 4 cm-' rcsolution) werc obtaincd h m
thin films of the viscous polymcrs cast ont0 sodium chloridc disks using a Grilaxy Scrics 5000
1 spectrometcr. H- and "F-NMR spectra w r c obtaincd in CDClj on r i Vnrian Gcmini
spectrometer at 300.75 and 282.33 MHz, respectivcly, using TMS (Aldrich. Onlario. Canada)
and CFC13 as cxternal and interna1 refercnces. rçspectively. blritrix rissisicd Iriser dc-sorption
ionization time of Right mass spectroscopy (MALDI) spectrri wcrc O btaincd in ncgativc
ionization mode on a Voyager-DE STR MALDI-TOF mass spectrorneter (Perceptive Biosystcms
Inc., Farminçham, MA). The spectrometer was equipped with a pulsed nitrogen laser (337 nm.
3-ns pulse). Polymer samples were CO-crystailized with 2,5-dihydroxybenzoic acid in methmol.
Operating parameters were: 20 KeV accelerating voltage, grid voltage 95.5% of accelerating
voltage, guide wire voltage 0.15% of accelerating voltage, and delay time of 300 ns. The
spectrometer was extemally calibrated using a mixture of peptides (molar mass range of 903.36
to 5733.58 g mol").

Et-TFVE soluhility in CO3 Et-TFVE solubility was measurcd in a custom built high-
prcssure "cloud point" apparatus. The cloud point apparatus consistcd of a thick wallad glass
tube within a high pressure view ccll. The glass tube had connections at on<: end for the
introduction of monomer and COz. The other end was sealcd by a movablc piston. The spacc on
the outsidc of the g l a s tube and piston. inside thc view cell. was tillcd with hydraulic tluid. The
pressure differential across the glas tube was nevcr more than 13 bar. The vicw ceIl was rocked
and maintained nt a constant tcmperature within a circulating oven.
Monorner (3.0 g) was added to the giass tube at the dcsircd tcmperriturc. A known volume
of CO? was then added to the tube from a high prcssurc rcscrvoir syringc located outside the
ovcn. From the prcssurc: and tcmpcraturc of thc CO, addcd. the dcnsity, rind tlius thc wcight of
CO? addcd was dctcrmincd. Thc tube was scalcd and thc prcssurc wris raiscd abovc thc cloud
point by incrcasing the hydnulic fluid prcssurc. By slowly lowcring thc hydrauliç lluid prcssurc.
thc cloud point was detcrrnincd. To furthcr dilutc thc solution. thc tiydrriulic tluid prcssurc was
lowercd to that of the COz reservoir. A known volumc of CO2 was tlicn addcd to the cxisting
volumc to dilutc thc monomer and the procrss was rcpeated.
Polymerizations with CO?. Polymerizations wcre carrisd out in a custom buiit. 50-mL.
stainless steel. rind high-pressure reactor. The head of the reactor was tittcd with a Parr@
(bioline, IL) Al IZOHC magnetic drive. The base of the reactor wcis hcatcd ty a removable
electric heating jacket which was controlled by a P d 4843 temperature controller.
The reactor was sealed and evacuated (P 5 0.01 mmHg). Thc base of the reactor was then
chilled to approximately -50°C using a liquid nitrogen bath. Meanwhile, Fluorad FC- 1 7 1
surfactant (1 -00 g) and ice cold Et-TFVE (20.0 g) were added to a cold 25-mL test tube. The
desired amount of initiator (either AIBN or DEPDC) was then added to the test tube. The test
tube contents were mixed with shaking, then transferred by cannula to the evacuated reactor.

The reactor was evacwted again to degas the monomer. The desircd rimount of TFE. if used.
\vas added.
Pulyrneri:ufiun under high pressure CO2. CO? was added and maintsincd at a pressure o l
20 to JO bar while wanning the reactor and contents. At a temperature of approximately 25°C.
CO? was condsnsed into the reactor at a pressure of 56 f 5 bar. The reactor was heated to the
desimd polymerization tcmperature (35 f 1 ) OC whilr: maintaining the prcssurc at 56 2 5 bar.
Pressure adjustments to 65 + 3 bar were made using 3 high pressure gcncrator. (HIP. Eric. PA).
Polymrrimtions wcre stopped by venting the COz to atmospheric prcssurc. Thc rcacior was
opencd and the monorner/polymer solution was transfcrred to a storagc viol with added 4-fer[-
butylcatechol to inhibit Further poiymerization.
Btdk polymerizution under vucuum. The procedure was the mmc as dcscribcd for
polymerization under high pressure COr, except that the CO? was omittcd and tlic rcaction
heated to the polymerization temperature (35 f 1) OC.
Polyrneriscriiun in supercrificui CO?. COt was addcd and maintnincd at n prcssurc o f 10 to
J O bar while warming the reactor and contents. At a tcmperature of approximatcly 1 O°C bclow
rimbient temperature, COz was condensed into the reactor at a prcssurc of 56 2 5 bar. Thc
reactor was closed and heated to the desired polymcrizrition tempenturt: ( 3 5 or 55 2 1)OC. At the
desired polymeriwtion temperature, pressure adjustments to either 207 k 3 or 248 f 3 bar.
respectivcly, were made using a high pressure generator (HIP, Erie. PA). Polymerizritions werc
stopped by cooling the reactor to 25°C then venting the COz to atmospheric pressure. The
reactor was opened and the monomer/polymer solution was transferred to a storcige via1 with
added 4-fer[-butylcatechol to inhibit further polymerization.
Aqueous emulsion polymerization of Et-TFVE. To a 1 00 mL round bo ttom flask equipped
with a magnetic stir bar and nitrogen purge. 29 mL of deionized water and 1 mL of a 3.1 x

M riqueous ferrous ion [Fe(II) as FeSOi 7Hz0) solution werc sdded for ri total volume of 30
mL. The flask was placcd in a temperature controlled reaction braker and dissolved oxygen was
rcmoved using a nitroyen purge ( 1 h). Sodium hydrogen phosphate (0.15 ç). sodium
dodccylsulfatc (0.2 y) and sodium hydrogensulfite (100 mg, 1 wt. equiv. rclativc to thc initiator)
wcrc addrd to the flask. With magnetic stimng, the temperaturc of thc tlask was adjusted to the
desired polyrnerirntion temperature of 35°C using a Haakc KI5 watcr bath with a DCS
tcmperaturc controiler. Ammonium pcrsulfatc (LOO mg) was addcd to the tlask bcforc. the
addition of monomer (3.0 g). Thc monomer was polymerized for 2 d q s . Poly(Et-TFVE) was
isolatcd by adding 0.5 ml of concentrated HCI to thc latex, then it was csntrihgcd to collcct the
prccipitatc. The polymer was dissolvcd in cthrinol and thcn prccipitritcd into watcr ( twiçc) bctorc
drying undcr vacuum ( P - 0.1 mmHg, 40°C) to constant weight.
7.4 Expcrimcntd for Chaptcr 5
Reugenrs. Vinyl acetatc (Aldricli. Ontario. Canada) was uscd ris rcccivcd. -fF13 wris
prcpared by vacuum pyroiysis of polytctrafluoroathylanc' (Aldrich. Ontario. Canada) and storcd
at room temperature over cl-limonenc in a 300 mL stainlcss stcel smplc cylindcr tittcd witti an
1 800 psi safety rupture disc. Caution! The hunding of TFE is inherently cltrngc'rolrs. .-l t y ) n c .
cuntcmpiuting the handing of high pressure TFE shou/djârniliurize himself-or her.self*tr.ith suf2
handing procedirres. Under the ri& conditions, TFE can explode with rhe jhrce cf TiV7'. The
inhibitor was removed by inline filtr~tion throuçh chrornatographic silica gel (200-425 mesh.
Fisher Scientitic. Ontario, Canada) prior to use. The diethyl peroxydicarbonate initiator was
prepared in THF. using a published procedure." and stored in THF over anhydrous maçnesium
sulfate at -20 O C . The initiator was standardized by iodometry and was typically 7.5 % (dw) .
FC- 17 1 FluoradTM was kindly provided by 3M (St. Paul, Minnesota) and used as received. SFC
purity COi was obtained from Matheson (Ontario, Canada). Acetone, ethy l acetate. et hanol,

THF. and concentrated sulfuric acid wcre obtaincd from Fisher Scicntilic (Ontario. Canada).
Water was deionized and distillcd from Millipore Miili-RO 10 Plus and Milli-Q UF Plus
(Bedford, MA) systcms and used at 18 M R resistmce.
Churacteri=orion. Polymer molar mass distributions wcre chnnctcrized by GPC (Waters
U6K injecter. 5 10 pump) equipped with a refractive index dctcctor (Waters 24 1 O) and a serics of
~ l t r a s t ~ r o ~ e l " columns (Waters 106, IO' and 500 A). Using an ethyl ncemtc mobile phase ( 1 mL
min-'). polymer rnolar masses were calculated rrlativc io polystyrcnc srmdards (Aldrich.
Ontario. Canada). FTIR absorbance specaa (16 scans. 4 cm" rcsoluiion) wcre obtaincd liom
thin polymrr films using a Galaxy Scries 5000 spectromctcr. Thin films wcrc prcpnred from -2
% w/v THF solutions cast ont0 NaCl disks. 'H- and ' 9 ~ - ~ ~ ~ spectrû. werc obtaincd in acctonc-
4, on a Varian Gemini spectromcter at 300.75 and 282.33 MHz. respcctivcly. using TMS and
u.u.a-trifluorotoluene (Aldrich, Ontario. Canada) as cxtcrnû.1 and intcmd rcfcrcnccs.
rcspcctivcl y. Elemental anal ysis was donc by Canadian bl içrorinalyticril Scrvicc Ltd. ( British
Columbia, Canada).
Polymcri~arions in COt Polymerizations werc carricd out in a custom built. 50 mL.
stainiess steel. and high-pressure reactor. The head of thc reactor was fittcd with a Parr@
( MoIine. IL) A 1 I20HC magnetic drive. The base of the rcrictor was hcritcd by a rcmovablc
stainless steel water jacket comected to a temperature controtled watcr bath (modd 116OA.
V WR. Ontario. Canada).
The reactor was sealed and evacuated (P 5 0.0 1 mmHg). The base of the rerictor was then
chilled to approximately -50°C using a liquid nitrogen bath. Meanwhile, the desired amount of
initiritor in THF was added to a cold 25 mL test tube. The test tube was evacuated (P - 0.1-1
mmiig) to remove most of the THF. Then the desired amount of chilled VAc (T - O°C) and 1 .O0
g of Fluorad FC-171 surfactant were added. The test tube contents were mixed with shaking,

then transkrrcd by cannula to the evacuatcd reactor. Thc reactor was cvacuated again to degas
ttic VAc. With stirring. the desired amount of TFE was added to the rcactor for a total monomer
wcight of 20 g. CO? was thrn addrd and maintaincd at a pressure of 70 to 10 ber while warming
the rcactor to epproximately 5 OC. At that ternpenture, COz was condcnsed into the reactor at a
pressurc of 56 + 5 bar over 1 to 2 minutes. The prehcaied water jacket was placed around the
base of thc rcactor. The reactor was hsated to the dcsired polymerization tcmpcrriture (43 k 1)
"C ovcr 3 pcriod of 30 to 40 minutcs. Prcssurcs wcrc initidly betwc.cn 230 and 260 bar.
Polymerimtions were stopped aftcr 24 hours by first cooling thc rcactor to room
tcmpcraturc and slowing thc rate olstirring. Thc rcactor \vas thcn slowly ventcd to etrnospheric
prcssurc. At a prcssurc of ICSS than 60 bar. stirring was stoppcd as the polymcr ~ o ~ ç u l a t c d rind
strirtcd to binci thc stir shati. The rcaçtor was thcn fulIy vcntcd to ritinosphcric prcssurc and
opznod. Thc whitc and tricky soiid. which hrid formcd in thc rcactor. was dissolvcd in ricctonc
ihcn qurintitativcly rcmoved and precipitatcd into watcr to give a whitc polyrncr. Tlic polymcr
wris tùrthor puritïcd by blcnding in JO0 mL of an icc coId mixture of watcr and cthmol ( 1 : 1 v h ) .
The polymer was collccted by vacuum filtration and washed sevcnl timcs with watcr bcforc
dryinç (JO°C. P < 0.1 mmHg). Four copolymer compositions were prepared:
Po!-v(TFE-co- VAc) [ I j . Yicld 15.6 g (78%). ' H NMR: 6 = 6.05 (broad peak. 0.281-1. -TFE-
CH:-CH(0Ac)-TFE-), 5.65 (broad peak, 0.28H. -VAc-CHZ-CH(0Ac)-TFE-). 5.3 (brorid perik.
0.26H. -TFE-CHZ-CH(0Ac)-VAc-). 5.0 (broad peak. 0.17H. -VAc-CH2-CH(0Ac)-VAc-). 2.2-
2.9 (broad peaks. 2H. CHz). 1.9-2.' (sharp peaks. 3H, CH3); 1 9 ~ NMR: 6 = -17 to -53 (broad
peaks. CF2). -55 to -64 (broad peaks. CF2). Anal. Found: C, 42.02; H. 3.99; F, 20.58.
PolyITFE-CO-VAC) [2]. Yield 14.0 g (70%). 'H NMR: 6 = 6.05 (broad peak. 0.52H. -TFE-
CH?-CH(0Ac)-TFE-), 5.63 (broad peak, 0.22H, -VAc-CH2-CH(0Ac)-TFE-), 5.4 (broad peak,
0.20H. -TFE-CH2-CH(0Ac)-VAc-), 5.0 (broad peak, 0.06H, -VAc-CHz-CH(0Ac)-VAc-), 2.2-

2.9 (broad peaks. 2H, CHI), 1.9-2.2 (sharp peaks, 3H. CH,); ' 9 ~ NMR: 6 = 418 to -53 (broad
peaks, CF2). -55 to -64 (broad peaks. CF2). Anal. Found: C. 36.35; H. 2.90; F. 36.13.
PolyTTFE-CO-V'c) (31. Yield 14.2 g (71%). 'H NMR: 6 = 6.05 (broad peak. 0.53H. -TFE-
CHz-CH(0Ac)-TFE-), 5.65 (broad peak, 0.22H. -VAc-CH2-CH(0Ac)-TFE-), 5.4 (broad pcak.
0.20H, -TFE-CH2-CH(0Ac)-VAc-), 5.0 (brond peak, 0.05H. -VAc-CH2-CH(0Ac)-VAc-). 2.2-
2.9 (broad peaks. 2H. CH2). 1.9-2.2 (sharp peaks, 3H. CH,); ' 9 ~ NMR: 6 = 118 to -53 (broad
peaks, CF2). -55 to -64 (broad peaks, CF2). Anal. Found: C, 36.02; H. 2.77; F. 33.81.
Poly(TFE-CO- VAc) [4]. YYld 1 2.0 g (60%). ' H NMR: 6 = 6.05 (broad peak. 0.66H. -TFE-
CH2-CH(0Ac)-TFE-), 5.65 (broad peak, 0.17H. -VAc-CH2-CH(0Ac)-TFE-), 5.4 (broad peak,
0.15H. -TFE-CH2-CH(0Ac)-VAc-), 5.0 (broad pedc. 0.02H, -VAc-CH2-CH(0Ac)-VAc-), 2.2-
3.9 (broad peaks. 2H. CHt). 1.9-2.2 (sharp peaks. 3H. CHi); 1 9 ~ NMR: 6 = -49 to -53 (brosd
pcriks, CF:). -55 to -64 (broad peaks, CF2). Anal. Found: C. 32.24; H. 2.08; F. 49.19.
Polymer hydrolysis. To a 125 mL round bottom flask with a condenser and ri magnetic stir
bar. werc added 3 g of polymer, 75 mL of ethanol, 1 mL of water and 0.5 mL of concentrated
sulfuric acid. The flask was heated and the contents stirred and refluxed for 3 days. A neariy
colorless, transparent solution resulted. The solution was then coolcd to room temperature.
Sodium bicarbonate was slowly added, with vigorous stimng, until the solution was neutral to
pH paper. The polymer solution was precipitated into water with vigorous stimng, collected by
vacuum filtration and repeatedly washed with water prior to drying (40°C. P < 0.1 mmHg).
Base hydrolysis. To a 125 mL round bottom flask with a magnetic stir bar, were added 3 g
of polymer, 75 mL of ethanol, and 5 mL of 30% aqueous NaOH. The contents of the flask were
stirred overnight resulting in an orange to dark red solution. The polymer solution was
precipitated into water with vigorous stimng, collected by vacuum filtration and repeatedly
washed with water prior to drying under vacuum (40°C, P < 0.1 mmHg).
(1) Okuhara, K.; Baba, H.; Kojima. R. Bull. Chem. Soc. Jap. 1962,35, 532-5
(2) Lousenberg, R. D.; Shoichet. M. S. J. Org. Chem. 1991.62.7844-9
(3) Hunadi, R. J.; Baum, K. Synthesis 1982 39,454
(4) Strain. F.; Bissinger, W. E.; Did. W. R.; Rudoff, H.; DeWitt. B. J.; Stevens, H. C.; Langston, J. H. J. Am. Chem. Soc. 1950 72, 1254- 1263
U M I MICROFILMED 2001
INFORMATION TO USERS
This manuscript has been reproduced from the microfilm master. UMI films
the text directly from the -inal or copy submitted. Thus, some thesis and
dissertation copies are in typewnter face, wtiile othen may be from any type of
cornputer printer.
The quaiii of this rieprodudon is dependent upon the qurlity of the
copy submitted. Brdcm or indistirrd print, odored or poor quality illustatiûns
and photographs, print Meedthrough, substandard margins, and improper
alignment can adversely affect neproduction.
ln îhe unlikely event that the author did not send UMI a cornplete manuscript
and there are missing pages, these will be noted. Also, if unauthorized
copyright material had to be removed, a note will indicate the deletion.
Oversize materials (e-g., maps, drawings, &arts) are reproduced by
sectiming the original, beginning at the upper left-hand amer and continuing
from left to right in equal sedions with smalt overlaps.
Photographs inciuded in the original manuscript have k e n reproduced
xerographically in this -y. Higher quality 6' x 9' bbck and mite
photographie prints are availabk for any photographs or illustrations appearing
in this copy for an additional charge. Contact UMI diredly to order.
Bell 8 Howell Information and Leaming 300 Nom Zeeb Road, Ann Arbor, Mt 48106-1346 USA
800-521-0600

POLYELECTROLYTE INDUCED DOMAINS LN CATIOMC LIPID BILAYER
MEMBRANES:
A DEUTERIUM NUCLEAR MAGNETIC RESONANCE PERSPECTIVE
Peter Mitrakos
A thesis submitted in conformity with the requirements
for the degree o f Doctor o f Philosophy
Graduate Department of Chemistry
University of Toronto
0 Copyright by Peter Mitrakos, 2000
National Library 1*1 of Canada Bibliothèque nationale du Canada
Acquisitions and Acquisitions et Bibliographie Services services bibliographiques 395 Wellington Street 395. rue Wellington OttawaON K l A W Ottawa ON K l A W CaMda canada
The author has granted a non- exclusive licence dowing the National Library of Canada to reproduce, loan, distribute or sel1 copies of this thesis in microform, paper or electronic formats.
The author retains ownership of the copyright in this thesis. Neither the thesis nor substantial extracts fkom it may be printed or othenvise reproduced without the author's permission.
L'auteur a accordé une licence non exclusive permettant à la Bibliothèque nationale du Canada de reproduire, prêter, distribuer ou vendre des copies de cette thèse sous la forme de microfiche/fih, de reproduction sur papier ou sur format électronique.
L'auteur conserve la propriété du droit d'auteur qui protège cette thèse. Ni la thèse ni des extraits substantiels de celle-ci ne doivent être imprimés ou autrement reproduits sans son autorisation.
Polyelectrolyte Induced Domains in Cationic Lipid Bilayer Membranes:
A Deuterium Nuclear Magnetic Resonance Perspective
Degree of Doctor of Philosophy, 2000
by Peter Mitrakos
Graduate Department of Chemistry, University of Toronto
The e f f i of membrane surface charge was studied via deuterium ('H) and phosphorus ("P) nuclear
magnetic resonance (NMR), by the addition of amphiphilic cationic charge into a neutral
phospholipid membrane and then subsequent neutralization of this charge through the addition of
anionic polyelectrolyte. The effect of added charge was monitored by the use o f a specifically
deuterated phosphatidylcholine molecule which produces a predictable change in the 'H NMR
quadrupolar splitting ( A v ~ ) in response to changes in membrane surface charge. Addition of
amphiphile cationic charge produced a decrease (increase) in the quadrupolar splitting for the a (P)
deuterons. The subsequent addition of anionic polyelectrolytes ont0 these cationic surfaces induced
the appearance of a dual component spectrum consisting of two quadrupole splittings indicative of
two different charge environments. While one charge population is enriched in cationic charge the
other is depleted. Therefore, the addition of polyelectrolyte induces the existence of long lived lateral

inhomogeneities or domains at the cationically charged membrane surface. The degree of separation
and the composition of the domains was quantified through spectral simulations. The data show that
domain formation and composition depended greatly on the identity and size of polyelectrolyte. the
initial cationic surface charge, in addition to the ionic strength of the solution. The effect of anionic
polyelectrolytes was also studied via % NMR of methyl-deuterated cationic amphiphiles. Although
this data produced no evidence of domain formation. information was obtained which supported the
results gained fiom deuterolabeled phosphatidylcholine. The results also indicated that the
polyelectroIyte orders the headgroup of cationic amphiphiles and that salt addition reduces this
electrostatic interaction. Finally, the behaviour of two nucleotides as well as the macroscopic
architecture of these mixed membrane systems was followed via "P NMR. These results show that
polyelectrolytes bound to these cationic surfaces become immobilized. The data also indicate that
the lipids retain a biiayer arrangement, under most conditions. However. various non-bilayer phases
were produced when phosphatidylcholine was replaced with phosphatidylethanolamine, in the
absence and presence of polyelectrolyte. Non-bilayer phases could also be produced in the presence
of double chained cationic lipids but not single chained cationic amphiphiles.
ACKNOWLEDGEMENTS
Fust and foremost 1 wish to thank my research supervisor Peter MACDONALD, who had
initially pronded me with an interesting field of research to study. He has consistently provided
me with insight and direction throughout this work as well as an enthusiasm for experimental
research. I also wish to thank him for the experïence and experimental skius which he has passed
on to me which will greatly aid me in my hture as a scientist.
My sincere thanks are extended to Drs. Michele AUGER, Uhch KRULL, William
REYNOLDS and Stuart WHITTINGTON for readig this thesis as well as sitting on my oral and
defense cornmittees. I would also wish to thank my coworkers at Erindaie College who have
constantly supported me throughout my graduate work and made everything more bearable at
the most difficult of times.
To my parents John and Fotini, I am forever gratetùl for al1 the love and suppon they have
given me throughout the years and for instilling in me the belief that 1 could accomplish
whatever 1 set my rnind to.
Finaiiy, to my M e Kathy who has suffered with me through the trials and tribulations of
graduate work, I thank her for her support, sense of humour and patience.
TABLE OF CONTENTS
ABSTRACT
ACKNOWLEDGEMENTS
CONTENTS
LIST OF TABLES
LIST OF FIGURES
SYMBOLS AND ABBREVIATIONS
1 INTRODUCTiON
1.1 Overview
1.2 Lipids and Membranes
1.3 Membrane Electrostatics
1.4 Polyelectrolyte Adsorption
1.5 Membrane Domains
1.6 Gene Transfection
2 TaEORY
2.1 Solid State 'H and 31P NMR Studies of Membranes
2.1.1 Advantages of *H NMR Spectroscopy
2.1.2 Advantages of "P NMR Spectroscopy
2.2 Theory of Deuterium Nuclear Magnetic Resonance
ii
iv
v
in
x
xiv

2.3 The uMolecular Voltmeter" Modtl for the Headgroup Response of Phosphatidylcholine to Surface Charge 53
3 MATERiALS AND METBODS
3.1 Materials
3.2 Syntheses of Choline Dtuterated Phospholipids
3.3 Syntheses of Cationic Amphiphiles
3.4 Sample Prtparation
3.5 UV Difference Assay of Polyelectrolyte-Membrane Binding
3.6 Solid State NMR Measuremtnts
4 RESULTS AM) DISCUSSION
4.1 'H NMR Response of Phosphatidylcholine Eeadgroup to Binary Mixtures with Cationic Amphiphiles
4.1.1 'H Nuclear Magnetic Resonance Spectroscopy
4.2 '8 NMR Evidence of Polyelectrolyte Induced Domain Formation in Mixed Cationic Amphiphile + POPC Membranes
4.2.1 Quantitation of Domain Separation and Composition
4.2.2 Polyelectrolyte Binding to a Charged Bilayer S u ~ a c e
4.3 Factors Influencing Polyelectrolyte Binding and Domain Formation in Deuterated POPC Bilayers
4.3.1 Polyelectrolyte Chemistry
4.3 -2 Polyelectrolyte Molecular Weight
4.3.3 Initial Surface Charge
4.3.4 Ionic Strength
4.4 Influence of Polyelectrolyte Binding oa Deuterated Cationic Am phi philes
4.4.1 'H NMR of Quaternary Methyl-Deuterated Cationic Amphi philes in Lipid Bilayers
4.4.2 Effect of Polyelectrolytes on Deuterated Cationic Amphi philes
4.4.3 Effect of Ionic Strength on 1 : 1 Cationic Amphiphile-PolyA Complexes
4.4.4 Conclusions
4.5 "P NMR Obsewations of the Morphology of Complexes with Cationic Amphiphiles
4.5.1 UV-assay of Nucleotide Binding to DOTAP / POPC Mixtures
4.5.2 Nucleotide Mobility
4.5.3 'H NMR of DOTAP-y-d, in Complexes with Nucleotides
4.5.4 "P NMR of Complexes of Nucleotides with DOTAP / POPC Mixnires
4.5.5 WV-assay of Ionic Strength Effect on Nucleotide Binding to Cationic Liposomes
4.5.6 ,'P NMR of Ionic Strength Effect on Nucleotide Binding to Cationic Liposomes
4.5.7 ,'P NMR of DOPE in Mixtures with Cationic Amphiphile
4.5.8 Effect of Nucleotide Binding on the Morphology of DOTAP / DOPE Mixtures
vii

4.5.9 Effect of Nucleotide Binding on the Morphology of CTAB / DOPE Mixtures
4.5.10 Effect of Salt on Nucleotide Binding to DOTAP / DOPE and CTAB / DOPE Mixtures 197
5 FUTURE DLRECTIONS
6 CORRESPONDLNG REFERENCES
7 REFERENCES
viii
LIST OF TABLES
2 1 . 1 Selected elements of the Wigner rotation matrix
4.2.1 Experimental *H NMR parameters for POPC + cationic amphiphile + polyA mixtures
4.2.2 Simulated %I NMR data for POPC + cationic amphiphile + polyA mixtures
4.3.1 Number of amphiphiles per PSSS chain in PSSS-bound domain
4.3 2 Number of amphiphiles per polyelectrolyte in polyelectrolyte-bound domain
4.4.1 'H NMR Tzq' relaxation times for deuterated cationic amphiphiles as a function of POPC composition
4.4.2 'H NMR Tzq' relaxation times for deuterated cationic amphiphile + POPC as a bnction of added polyA + sait
4.5.1 "P NMR isotropie chemical shifts and static chemical shift tensor elements for OligoS and polyA as dry powders o r bound to 100% DOTAP MLVs
LIST OF FIGURES
1.2.1 Fluid-Mosaic mode1 of a plama membrane
1.2.7 Self-assembly of lipids in a bilayer arrangement and various classes of lipids
1.2.3 Sorne thermotropic phase transitions of phospholipids
1.2.4 Various motions exhibited by lipids with their respective timescales
2.1.1 Deuteriurn NMR powder pattern of lipids in a bilayer arrangement 25
2.1.2 Phosphorus NMR powder pattern of lipids in a bilayer arrangement 28
2.2.1 Wigner rotation of the principal axis system of the electric field gradient tensor into the laboratory fiame of reference 36
3-22 Theoretically determined deuterium NMR powder pattern for the case of axial sYm"'etrY 44
22.3 Orientation of the electric field gradient tensor with respect to the magnetic field and the director axis of motional averaging 48
2.3.1 Nomenclature for the headgroup deuterolabeIling positions of phosphocholine 53
2 .32 Orientation of the phosphocholine dipole moment with respect to the C-D bond and electric field emanating fiom a charged membrane surface 58
4.1.1 Structures for three cationic amphiphiles and polyA 85
4.1.2 'H NMR spectra from headgroup deuterated POPC mked with CTAB 86
4.1.3 Surface charge dependence of the 'H NMR quadrupolar splittings fiom headgroup deuterated POPC in binary mixtures with cationic amphiphiles 88
4.1.4 a-P correiation plots for headgroup deuterated POPC in binary mixtures with cationic amphiphiles 90
'H NMR spectra fiom headgroup deuterated POPC in binary or temary mixtures with DODAP / polyA
Cornparison of two methods for calculating the mole fiaction of DODAP bound in the polyelectrolyte-bound dornain
Two-dimensional schematic representation of polyelectrolyte induced domain formation in mixed POPC + cationic amphiphile lipid bilayers
Chernical structures for three anionic polyelectrolytes
NMR spectra of rnixed DODAP + POPC lipid bilayers in the absence and presence of PS SS
Ultraviolet (UV) depletion assay of polyelectrolyte binding to lipid bilayers composed of DODAP + POPC
*H NIvlR spectra of mked DODAP + POPC-a-d, bilayers as a fùnction of added PSSS
'H NMR spectra of mked DODAP + POPC-P-d, bilayers as a fùnction of added PSSS
'H NMR A v ~ ' s of the component Pake doublets in the 'H NMR spectra of mixed DODAP + deuterated POPC bilayers as a fiinction of added
polyelectroIyte
Fraction of polyelectrolyte-bound DODAP or POPC as a fùnction of added polyelectrolyte
Composition of the polyelectrolyte-free and -bound domains in rnixed DODAP + POPC bilayers as a tiinction of added polyelectrolyte
Schernatic representation of a rnixed cationic + zwitterionic lipid bilayer exposed to anionic polyeiectrolytes
'H NMR spectra of mixed DODAP + POPC-a-d, bilayers with added PSSS (N = 3790)
'H NMR spectra of rnixed DODAP + POPC-P-d2 bilayers with added PSSS (N = 3790)
4.3.12 'H NMR Av,'s of the sub-spectra in the 2H NMR spectra of mixed DODAP + deuterated POPC bilayers as a fùnction of added PSSS chains with different
MW's
4.3.13 Fraction of PSSS-bound DODAP or POPC as a fùnction of added PSSS
4.3.14 Composition of the PSSS-fiee and -bound domains in mixed DODAP + POPC bilayers as a fiinction of added PSSS
3.3.15 Number of domain-entrapped amphiphiles (N,, + NmDm) and proportion of zwitterionic to cationic amphiphiles within a domain (N,, / N,,,)
43.16 'H NMR spectra of temary mixtures of DODAP + POPC-a-d, + PSSS exposed to Uicreasing levels of NaCl
4.4.1 Chemical structures of the three deuterolabeled cationic amphiphiles
4.4.2 -% NMR spectra of mixed deuterated cationic amphiphile + POPC bilayers
4.4.3 'H NMR quadrupolar splittings fiom lipid mixtures of deuterated cationic amphiphiles + POPC with increasing mole fiaction of cationic Iipid
4.4.4 'H NMR spectra of deuterated cationic amphiphile + POPC bilayers in the absence of polyq in the presence of polyA and in the presence of polyA plus sait
4.4.5 'H NMR quadrupolar splittings of deuterated cationic amphiphiles + POPC bilayers as a fùnction of added polyelectrolyte
4.4.6 'H NMR quadrupolar splittings resulting from the addition of NaCl to mixtures of deuterated cationic amphiphiles + POPC + polyA
4.4.7 UV diEerence assay of polyelectrolyte desorption from mixed cationic amphiphile + POPC bilayers as a fiinction of added sait
4.5.1 Chemical structures for zwitterionic lipids and nucleic acid chains
4.5.2 W difference assay of nucleotide binding to DOTAP + POPC mixtures
4.5.3 "P NMR spectra of dry powders of nucleotide chains and nucleotide chains bound to 100% DOTAP MLV7s
4.5.4 %i NMR spectra of 100% DOTAP-y-d, MLVs mixed with polyA and OligoS
xii

4.5.5 "P NMR spectra of mixed DOTAP + POPC bilayers as a function of added nucleotide 182
4.5.6 UV difference assay of salt induced desorption of polyA and OligoS fiom DOTAP + POPC mixtures 186
4.5.7 31P NMR spectra of salt induced desorption of polyA and OligoS fiom DOTAP +- POPC mixtures 188
4.5.8 3 L ~ NMR spectra of DOPE in binary mixtures with cationic amphiphiles 190
4.5.9 "P NMR spectra of DOTAP + DOPE mixtures as a function of added nucleotide 193
4.5.10 "P NMR spectra of CTAB + DOPE mixtures as a function of added nucleotide 196
4.5.1 1 "P NMR spectra of salt induced desorption of nucleotide fiom CTAE3 + DOPE and DOTAP + DOPE mixtures 198

SYMBOLS AM) ABBREVIATIONS
NMR UV TLC MLV
CTAB DODAP DOTAP DC-CHOL TC-CHOL POPC POPA DOPE
TPS TPB
PolyA OligoS PSSS PACA PGLU
proton deutenum phosphoms
quadrupole splitting chemical shifi anisotropy isotropie chemical shifl longitudinal, spin-lattice relaxation time transverse, spin-spin relaxation tirne
nuclear magnetic resonance ultraviolet thin layer chromatography multilarnellar vesicle
cetyltrimethylammonium bromide 1,2-dioleoyloxy-3-(dimethyIamino) propane 1,2-dioleoyloxy-3-(trimethylamino) propane 3 P-IN-(N',N y -dimethylaminoethane)~i~barnoy1] cholesterol 3 P-IN-(N',N',N y -trimethylarninoethane)~~ cholesterol 1 -palmitoyl-2-oleoyl-sn-giycero-3 -phosphatidylcholine 1 -palmitoyl-2-oleoyl-~1~-glycero-3-phosphatidic acid 1,2-dioleoyl-m-glycero-3-phosphatidylethane
2,4,6-tnisopropylbenzenesulfonyl chioride tetraphenylboron
poly(adeny1ic acid) phosphorothioate oligonucleotide poly(sodium 4-styrene sulfonate) poly(acry1ic acid) poly(glutamic acid)

1. INTRODUCTION
This thesis describes a study of domains induced by polyelectrolytes in lipid bilayer
membranes. The major tool used to study these domains is deuterium nuclear magnetic resonance
spectroscopy ('H NMR). A domain is defined as a region of the membrane possessing a distinct
composition and having sufficient dimension and duration to be of biological significance. The types
of domains which may exist in lipid bilayer membranes may be subdivided into those which produce
transbilayer asymmetries and those which produce lateral heterogeneities in the plane of the bilayer.
The studies presented here are concemed with the latter. These laterai domains may range in size
fiom a few lipid molecules to a square micron and may exist for times ranging fiom a nanosecond
to the Metirne of the cell. Microdomains usuaily originate from lipid-lipid interactions (Mabrey and
Sturtevant, 1978; Cullis et al., 1983; McElhaney, 1982). Macrodomains, on the other hand, are
usually associated with either protein-lipid or protein-protein interactions (de Kruijff and Cullis, 1980;
Haverstick and Glaser, 1989).
Polyelectrolytes are poiyrners in which the monomer segments are charged. Many bio-
macromonomers such as complex carbohydrates, proteins and polynucieic acids are charged. When
these charged polymers bind to membranes they produce domains, although the details are as yet still
unclear. The interaction between the lipids and polyelectrolytes is electrostatic in nature, although
hydrophobic forces rnay also play a role. This interaction is of prime importance for dmg delivery

in which a synthetic polyelectroiyte coats a lipid membrane which encapsulates the dmg (Lasic and
Needham, 1995; Winnik et al., 1995). On the other hand, the interaction of biological
polyelectrolytes with Epid bilayer membranes has also been shown recently to be of great importance,
as a highiy efficient mode of gene transfer (Felgner et al., 1987; Leventis and Silvius, 1990;
Monkkonen and Urti, 1998).
The significance of lateral domains in biological membranes lies in their fùnction. Lipid
domains can serve to concentrate lipids which act as substrates for particular enzymes. The maximal
activity of membrane associated enzymes can be controlled by the degree of enrichment of the
particular lipid involved in the enzyme-substrate reaction (Yang and Glaser, 1996). The ability to
determine the significance of domains rats on the particular techniques used to view domains. Some
of the most recent techniques used to study the details of lateral domains are fluorescent recovery
der photobleaching (FRAP), fluorescent digital imaging, differential scanning calorimetry @SC) and
'H NMR (Vaz, 1992; Glaser, 1992; Tocanne, 1992; Wolf, 1 992; Mitrakos and Macdonald, 1996 and
1997; Macdonald et al., 1998).
'H NMR is a spectroscopic technique capable of measuring charge at the surface of
membranes. The technique is not only capable of measuring the absolute charge at the surface but
is also capable of measuring both lateral (Macdonald et al., 1991) and transbilayer (Marassi and
Macdonald, 1993; Franzin and Macdonald, 1996) heterogeneities. The capability of monitoring
membrane surface charge comes fiom the use of a specifically headgroup deuterated POPC ( 1 -
palmitoyl-Zoieoyl phosphatidylcholine). The choline-deuterated headgroup of the POPC molecule
is believed to undergo a concerteci tilt in response to an electrostatic field emanating from the surface.
The tilting of the headgroup of deuterated POPC produces changes in the *H NMR spectmm which
can be quantined. Qualitatively similar changes in the *H MUR spectrum have been noted for any
of a varkty of charged species which bind within the polar headgroup region of the bilayer. Thus,
this 'H NMR technique has been dubbed the "molecular voltmetei'.
This thesis begins by descnbing the 'H NMR studies of a series of cationic amphiphiles
homogeneously mixed with POPC. Next, 1 descnbe the 'H NMR studies of domain formation in
these cationidy charged mode1 membrane systems, induced by a series of anionic polyelectroIytes.
1 demonstrate that the 'H NMR spectra can be used to quanti@ domain size and composition. 1 then
systematically investigate the effect on domain size and composition of polyelectrolyte identity,
polyelectrolyte molecular weight, initial surface charge density and salt concentration. In addition,
1 have directly investigated the other components of these mixtures using 'H NMR for deuterated
cationic amphiphiles and 'lP NMR for polynucleotides. Furthermore, 1 have studied the influence of
a bilayer destabilizing amphiphile (DOPE) on membrane architecture, in the presence of various
cationic amphiphiles, polyelectrolytes and salt.
Chapter 1 of the thesis involves a discusssion of the basic features of membrane systems,
followed by a discussion of polyelectrolyte adsorption and the lateral reorganization of lipids into
dornains. This topic is covered in only basic outline and more detailed accounts are found in the
articles by Cullis et al. (1983), Gennis (1989), Voet and Voet (1990) Welti and Glaser (1994),
Tocanne et al. (1994) and Raudino (1995). Chapter 1 also covers the promising field of gene therapy
through liposome delivery. Chapter 2 outlines the use of solid state NMR techniques to study bilayer
membrane systems as well as a detailed account of solid state 'H NMR theory and more detailed
discussion of the response of the choline headgroup to surface charge. An even more detailed
description of the subject matter may be gained fiom Seelig (1977), Griffin (198 l), Davis (1983),
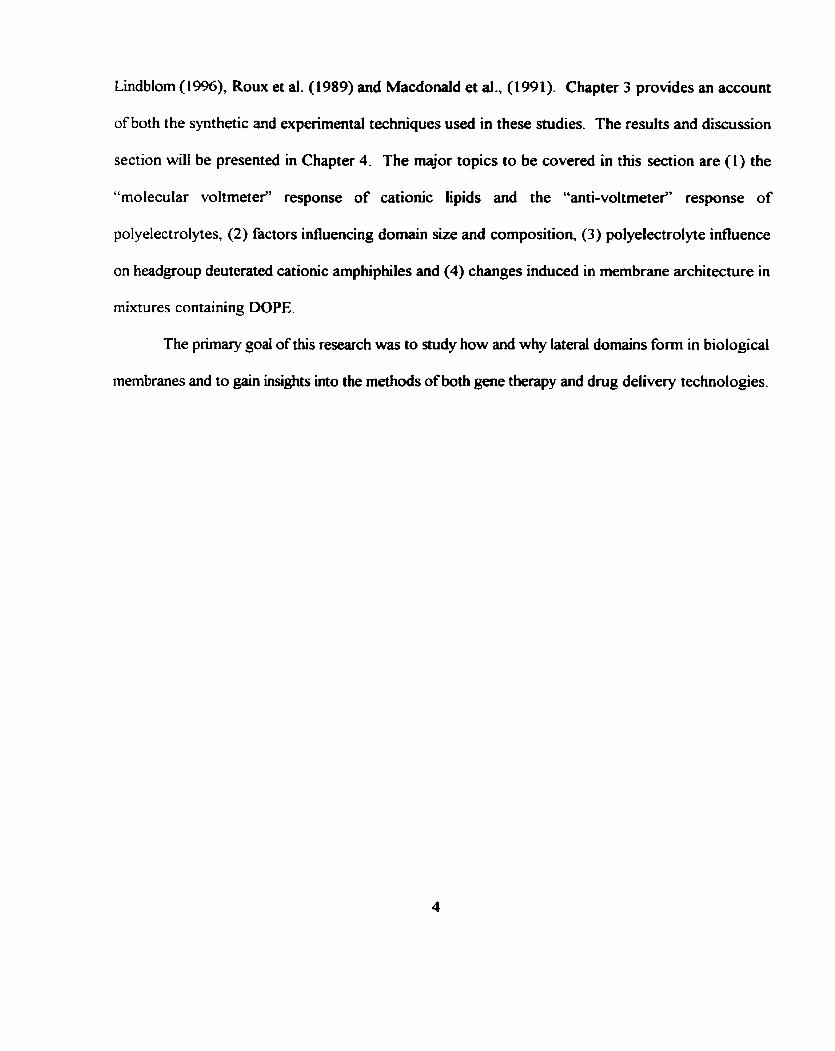
Lindblom (1996), Roux et al. (1989) and Macdonald et al., (1991). Chapter 3 provides an account
of both the synthetic and experimental techniques used in these studies. The results and discussion
section will be presented in Chapter 4. The major topics to be covered in this section are (1) the
"rnolecular voltmeter" response of cationic lipids and the "anti-voltmeter" response of
polyelectrolytes, (2) factors influencing domain size and composition, (3) polyelectrolyte influence
on headgroup deuterated cationic amphiphiles and (4) changes induced in membrane architecture in
mixtures containing DOPE.
The primary goal of this research was to study how and why laterai domains form in biological
membranes and to gain insights into the methods of both gene therapy and dnig delivery technologies.
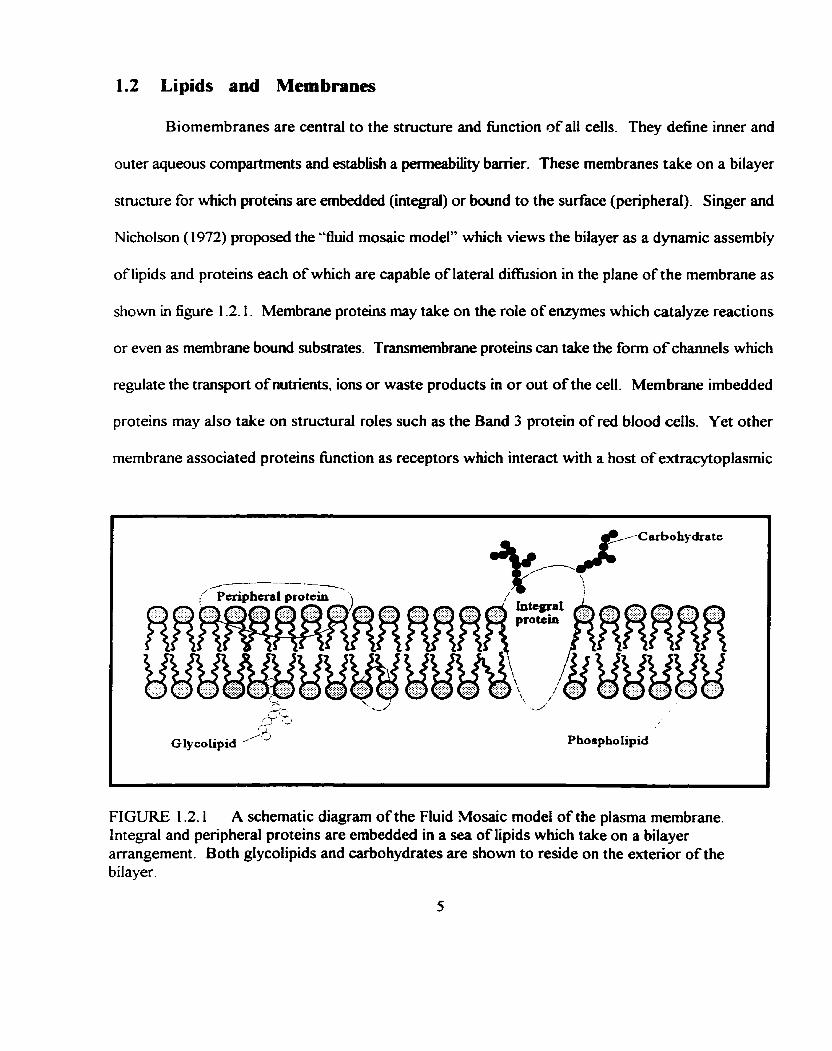
1.2 Lipids and Membranes
Biomembranes are centra1 to the structure and fiinction of al1 cells. They define inner and
outer aqueous compartrnents and establish a permeability barrier. These membranes take on a bilayer
structure for which proteins are embedded (integrai) or bound to the surface (peripheral). Singer and
Nicholson (1972) proposed the "fluid mosaic model" which views the bilayer as a dynamic assembly
of lipids and proteins each of which are capable of lateral difision in the plane of the membrane as
shown in figure 1.2. I . Membrane proteins may take on the role of enzymes which catalyze reactions
or even as membrane bound substrates. Trammembrane proteins can take the fonn of channeis which
regulate the transport of nutrients, ions or waste products in or out of the cell. Membrane imbedded
proteins may also take on structural roles such as the Band 3 protein of red blood cells. Yet other
membrane associated proteins fùnction as receptors which interact with a host of extracytoplasmic
Phosphoiipid
FIGURE 1.2.1 A schematic diagram of the Fluid Mosaic model of the plasma membrane. Integral and peripheral proteins are embedded in a sea of lipids which take on a bilayer arrangement. Soth glycolipids and carbohydrates are shown to reside on the exterior of the bilayer.
components.
The lipid component of biological membranes spontaneously assemble into a bilayer
arrangement. Lipid molecules are amphiphilic in that they contain bot h a polar headgroup region and
a non-polar acyl chah region- These molecules selliassemble into spherical bilayered vesicles in order
to minimize the area of contact between the non-polar chains ana the aqueous environment. Thus,
the polar headgroup regions of the iipids are oriented towards the aqueous phase while the
hydrophobic chains are sequestered towards the interior of the bilayer as shown in figure 1 - 2 2
The active fùnctions of the membrane are carried out by proteins. Most lipids have a passive
function which is to provide the correct physical environment for membrane associated proteins.
Some lipids such as phosphatidylinositol (PI) play more specialized roles as substrates for certain
enzymes whereas lipids such as diacylglycero1 @AG) are involved in activation of membrane
associated proteins (protein kinase C). There also exists a great variety of lipids which are capable
of producing a number of non-biIayer arrangements. Examples of the vanous classes of lipids are
depicted in figure 1.2.2.
The fluidity of these membranes depends mainly on the nature of the acyl chain region of the
bilayer. The lipids themselves can undergo a temperature dependent transition from a viscous gel
phase in which the acyl chains are hlly extended, to a fluid liquid-crystalline state, where individual
portions of the chains undergo a rapid trans-gauche isomenzation, resulting in a reduction of bilayer
thickness as well as lateral expansion of the bilayer. In biomembranes the lipids are in a liquid-
crystalline state because of chain unsaturation which lowers the phase transition temperature. Tm.
Lipids may also undergo another type of phase transition which involves the alteration of the
macroscopic assembly of the amphiphiles. For instance, a larnellar (L,) to hexagonal (H3

1. Lipid B ilayer 1 (Lipid Long A*)
W ater 1
W ater
2. Lipid Classes
B. Triacy IgIyceroIr
C. Steroidr D. Glycerophospholipids
FIGURE 1.2.2 (1) Self-assembly of lipids into a bilayer arrangement. The polar headgroups of the lipids are exposed to the aqueous medium while the non-polar acyl chains of the lipids are segregated to the interior of the bilayer, preventing direct contact with water. (2) The generalized structures of various classes of membrane lipids. R, R,, R, and R, represent long hydrocarbon chains while X represents the variety of different headgroups of phospholipids.
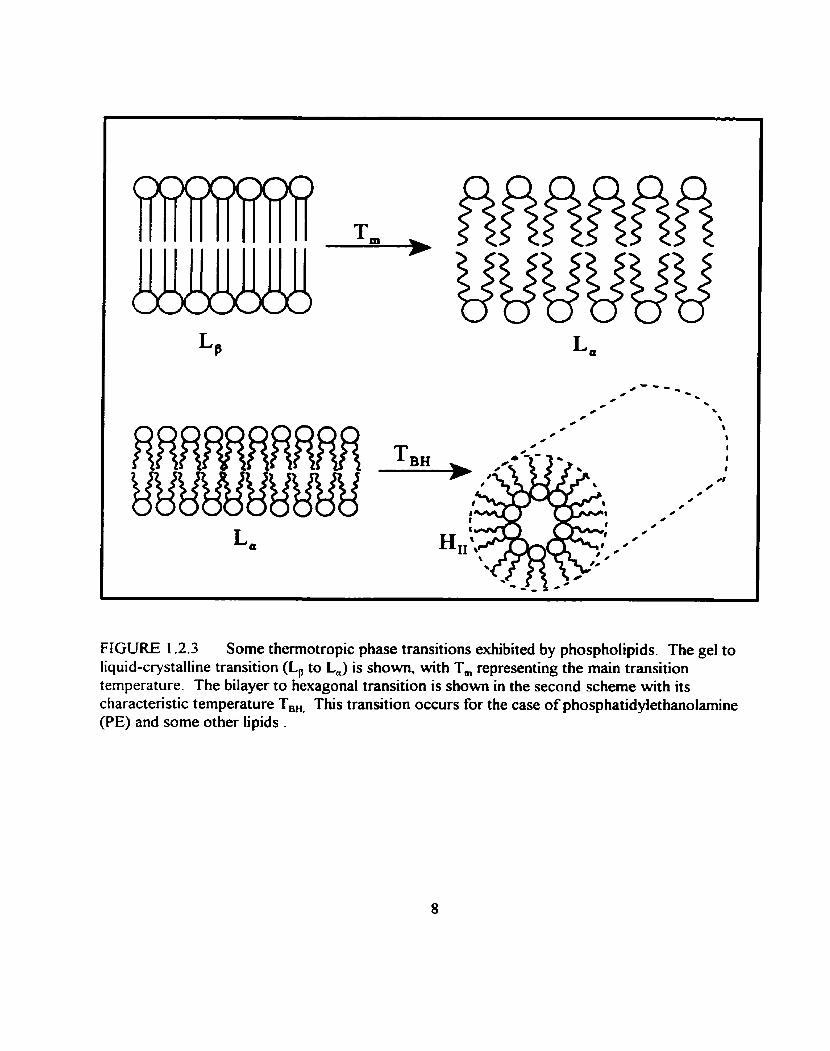
FIGURE 1.2.3 Some thermotropic phase transitions exhibited by phospholipids. The gel to liquid-crystalline transition (Lp to La) is shown, with Tm representing the main transition temperature. The bilayer to hexagonal transition is shown in the second scheme with its characteristic temperature TB, This transition occurs for the case of phosphatidylethanolarnine (PE) and some other lipids .

arrangement involves the conversion of planar bilayers into long cylinders of lipids with an imer
aqueous environment is shown in figure 1.2.3. Such a conversion may be induced thermotropically
or by the addition of various amphiphiles. Such a change is thought to aise because of the optimal
packing of Iipids which possess difTerent molecular shapes (Israelachvilli, 1975).
Lipid molecules which are incorporated in membranes can undergo a variety of whole body
or internal motions. Lipids may exhibit slow motions such as lateral dif is ion o r transbilayer flip-flop,
which occur on the order of days, to faster motions such as rotation about their long axes. Lipids
may also exhibit internal motions such as methyl rotation in the headgroup region o r trandgauche
isomerization in the acyl chah region. Figure 1.2.4 shows the type of motions exhibited by lipids
dong with their respective tirnescales and the types of techniques used to study them. Depending on
I Lipid 'flip-fJop"
Protein rotation - Laterai diffusion of lipids and proteins - Lipid long axis rotation
I - Tram / gauche isomcrization - -CH, vibration 1 m I B I a I 1 m Freqacmcy (Hz)
I I 1 I I I I u I I I
1oa4 la1' 10' 1 oz 10" 1 o4 - Raman / IR - ESR Fluorescence depolarkation
' H NMR
I NMR relaxation
FIGURE 1.2.4 Molecular motions exhibited by Iipid and protein membrane components with their respective timescales and the spectroscopic techniques used to study them.
the technique used to study the molecular motions the membrane may be pictured as static or highly
dynamic.
The great diversity o f lipid and protein components o f biological membranes makes it
challenging to study the physical properties and fùnctional roles o f tipids. T o circumvent this
difficulty one prepares mode1 membranes o f defined composition. Mode1 membranes can be readily
produced through simple hydration of dried lipid mixtures. sonication, extrusion or dialysis of lipid
dispersions (Gennis, 1989).
E.3 Membrane Electrostatics
Membrane electrostatics play an important regulatory role in many cellular functions. For
instance, membrane electrostatics control the rate of transverse transport of ions as well as the gating
of channels, promotion of cell fùsion and the binding of peripheral proteins to the membrane surface
(McLaughlin, 1989).
Most biomembrane surfaces are negatively charged primarily due to the presence of 10-20%
of anionic phospholipids. The charges arise from the phosphate or carboxylate groups of acidic
phospholipids such as phosphatidylserine (PS) or phosphatidylionositoI (PI) which reside at the
membrane surface. When the charge at the surface is çolely attributed to the charged amphiphiles the
s u ~ a c e charge density can be calculated fiom:
where e is the elernentary charge. Zi and X, are the valence and mole fraction of the charged lipid
species i, and Si is the cross sectional area occupied by the lipid in the liquid-crystalline phase. A
similar expression may be used when the surface charge is due to bound hydrophobic ions or charged
proteins to neutral membranes (Seelig et al., 1988).
An electrical potential is produced by the charges at the surface and a difise cloud of ions
responds to the electrical potential. The ions are not fixed at the membrane surface and distribute
themselves in the aqueous phase in a balance between their entropic drive to randomize and the
favourable electrostatic interaction at the surface. Thus, the fixed charges at the membrane surface
are not electrically neutralized at the surface by the counterions. This results in a surface potential
which extends out into solution. The electrical potential at the membrane surface is then dependent
on the charge density at the surface and the concentration and valency of the counterions.
The surface charge density which generates the surfàce potential, Y,, may then be determined
by Guoy-Chapman theory (McLaughlin, 1977; McLaughlin, 1989; Cevc, 1990) according to the
Poisson equation:
where é, = 78 is the dielectric constant of water, E, the permittivity of fiee space, R is the gas
constant, T is the temperature, Ci, is the concentration of the ith electrolyte in the buik aqueous
phase, F is the Faraday constant and Zi is the valency of the ith species. The effect of Y, is to attract
ions of opposite charge and repel ions of like charge. Thus, the concentration of oppositely charged
species adjacent to the membrane surface is greater than the equilibrium concentration. On average,
a dfise cloud of counterions is distributed near the surface creating what is termed a difise double
layer. Based on the surfàce potential produced, the local concentration of the ions in solution can be
calculated by using the Boltzman equation:
where C(x) is the concentration of the ion at a distance x fiom the membrane surface and al1 other
symbols have been defined previously. A 60 mV surface potential can increase the local
concentration 10 fold, adjacent to the surface as compared to the bulk (Gennis, 1989)
Guoy-Chaprnan theory predicts that the magnitude and the extension of the electrical potential
from the surface is reduced at high salt concentrations and that this effect is greatly enhanced by ions
with higher vaiency. The ionic screening of the surface charge is related to the Debye length, aiso
referred to as the screening length, corresponding to the distance fiom the surface at which the
surface potential drops to I/e of its value. Although the Guoy-Chapman relationship gives good
qualitative resuits, the quantitative method has its shortcomings which arise fiom some of the basic
assumptions of the model, which are: (1) the membrane charges are u~formly smeared over the
surface (homogeneous); (2) the ions are treated as point charges; (3) the dielectric constant of the
aqueous phase is constant everywhere; (4) the repulsion of the ions is neglected as they approach the
dielectric interface.

1.4 Polyelectrolyte Adsorption
Many naturaiiy o c c u ~ g rnacromolecules are polyelectrolytes. Clearly their interactions wit h
membranes will involve electrostatic interactions. These electrostatic interactions (Van de Steeg, et
al., 1992) are in addition to the chemical interactions (Van der Waals interaction, hydrophobic forces,
hydrogen bonding etc.) of uncharged polymers. In addition to the electrostatic contibution to the
Gibbs energy of adsorption, polyelectrolytes also have conformational entropy effects which
contribute to their adsorption behaviour, unlike simple ions.
When polyelectrolytes adsorb to uncharged surfaces, t hey accumulate because of the c hemical
afinity for the surface. Further accumulation is opposed when the unfavourable electrostatic
repulsion overcomes the chemical afiinity of the polyelectrolyte for the surface. When
polyelectrolytes interact with charged surfaces they may have either a positive or negative adsorption
energy depending on the charged signs of the two. For the special case of a strong polyelectrolyte
in low salt adsorbing to an oppositely charged surface of high surface charge density, the system lies
in the "charge compensation limit". The adsorbed polyelectrolyte chains are predicted to then fonn
stoichiometric charge complexes with the oppositely charged surface. Experimental verifications of
these predictions are numerous. For instance, stoichiometric complexes form between
polyelectrolytes and oppositely charged single chah amphiphiles (Hayakawa and Kwak, 1 99 1 ) as well
as oppositely charged double chah amphiphiles (de Meijere et al., 1997; 1998; Shimomura and
Kunitake, 1984; Okahata et al.. 1985). When enough polyelectrolyte has bound to the oppositely
charge surface to neutraiize if additional polyelectrolyte will change the charged sign of the surface
and electrostatic repulsion will inhibit fiirther accumulation.
The addition of simple electrolytes to polyelectrolytes bound to oppositely charged surfaces
results in the screening of segment-surface interactions and interpolyelectrolyte repulsions. These
forces act antagonisticaliy and depending on the balance of the two forces, polyelectrolyte adsorption
rnay be enhanced or diminished (Stuart et al., 1991). At high salt concentrations polyelectrolyte
desorption fiom oppositely charged surfaces is enhanced for various reasons. First, the electrical
energy stored in the difise double layer, which aids in accumulating the oppositely charged
polyelectrolyte to the surface, is d i s h e d (Denisov et al., 1998). At high enough salt concentration
the ions compete for lattice sites on the surface with the polyelectrolyte. Also, desorption of the
poIyelectro1yte f?om the surface produces a gain in conformational entropy of the chah The effects
of the electrolyte solution upon polyelectrolyte chain adsorption will play a role up to 2M of added
salt .
When bound to surfaces, polyelectrolytes may adopt a variety of conformations. Individual
portions of the polyelectrolyte chain may be adsorbed to a surface in train sections while other non-
adsorbed portions may take the form of tail or loop regions. For the specid case of "charge
compensation" the chain conformation statistics predict that the adsorbed polyelectrolyte lies flat on
the surface and this has been proven experimentally by Cosgrove et al., 1986. However, in general,
polyelectrolyte chains exhibit mixtures of train, tail and loop regions. Each distinct conformation may
have a different energy associated with it depending on the distribution, length and number of tail,
loop or train portions. Train portions of polyelectrolytes result in a favourable Gibbs fiee energy of
adsorption while formation of loops and tails result in conformational entropy gain. The
conformation entropy becornes an increasingly important terrn when considering binding statistics for
polyeIectrolyte chains with contour lengths many times greater than their persistence length. The
volume fraction profile of the polyelectrolyte, which is defined as the number of monomer units of
the polyrner chah which are contained within defined regions away from the adsorbed surface, may
be obtained fiom the sumrnation of al1 possible conformations (Stuart et al., 1991).
Lnteractions between polyelectrolyte and oppositely charged lipid bilayers are of fùndamental
scientific, as well as applied biomedical research. Two types of biological polyelectrolytes and the
consequences of their binding to charged bilayer surfaces will be discussed in the next two sections.

1.5 Membrane Domains
The importance of membrane domains is evidenced by al1 the recent reviews articles of
Thompson et ai., ( L992), Vaz ( 1992), Glaser (1 Wî), Tocanne ( 1992), Edidin ( 1 992), Wolf (1 992),
Jesaitis ( 1992), Welti and Glaser (1 994), Tocanne et ai., (1994) and Raudino ( 1995) on the subject
matter.
Polyelectrolyte adsorption to oppositely charged arnphi philes leads to formation of membrane
domains. The individuai charge-carrying amphiphiles are able to difise laterally wit hin the plane of
a two-dimensional lipid bilayer membrane. This permits domain formation upon polyelectrolyte
adsorption when the Coulombic attraction draws the relatively mobile amphiphiles towards the
relatively immobile polyelectrolyte. Models of domain formation induced upon peptide or protein
bindiig to oppositely charged mixed neutral and charged lipid bilayer membranes account for domain
formation by considering the Gibs fiee energy of the system to be the sum of contributions from the
favourable electrostatic fiee energy and the unfavourable f?ee energy of demixing the charged fiom
the neutral arnphiphiies (Denisov et al., 19%). The latter term is dorninated by the negative entropy
of demixing the two amphiphiles into separate domains.
Microdomains are generdy associated with lipid immiscibility, in the absence of proteins, due
to the ciiversity of amphiphiles with different transition temperatures, Tm. Macrodomains are usually
associated with protein interactions with the membrane. Lipid-protein interactions, such as the
electrostatic interaction between cytochrome c and anionic phospholipids (de Kniijff and Cullis,
1980), are capable of producing microdomains which can aggregate into macrodomains as in the case
of the MARCKS peptide (myristoylated alanine-nch C kinase substrate) and the Rous Sarcorna Virus
(RSV) proteins (Haverstick and Glaser, 1989; Denisov et al., 1 998; Yang and Glaser, 1995). Most
b io logical membranes possess these heterogeneities and a homogeneous membrane is t hus the
exception to the d e .
The existence of a variety of heterogeneous biomembranes has led to the study of the origin
o f these domains as well as determining their functional significance. Firstly, lipid domains can
provide enzymes with unique environrnents where the activity of the enzyme may be optimized by
distinct lipid-protein interactions. For instance, the maximal activity of protein kinase C (PKC) in
phosphorylating the MARCKS peptide depends on the inclusion of the MARCKS peptide into
cardiotipin and p hosphatidylserine (PS) enriched domains (Yang and Glaser, 1 996). The existence
of domains may also Iead to an increased passive transport of hydrophobic and ionic species across
the bilayer membrane. This is believed to occur through pores which are created at the borders
between domains because of induced "packing defects" (Gennis, 1989). It is also known that both
the accessibility of lipids to phospholipases and the rate oflipid flip-flop are enhanced by the presence
of these boundary "defects", yielding other plausible functions o f domains. Much more experirnental
work needs to be cornpleted, though, in order to produce more definitive results on the significance
of domains.
The main difficulty in assessing the significance of membrane domains is t o first find
techniques capable of not only defining domains but also producing molecular level details in terms
of size and composition. Each unique method has its particular advantages and disadvantages in
studying domains. Fluorescent digital imaging is a popular method used to assess domain size and
shape but fails in determining domain composition (Luan, 1995; Glaser, 1996). FRAP has been
primarly used in detennining difiùsion coefficient of lipids and permits one to extract domain shape
information. Difhction (Blasie et al, 1985) and calorimetric techniques (McElhaney, 1982) provided

for the assessment of only global properties of domain structure through the construction of phase
diagrams.
Until recently, N M R spectroscopy has been incapable of distinguishing in-plane domains.
This inability to resolve domains was likely due to the timescaie of the technique. NMR has a long
timescale (-IO-' s) relative to other spectrosopic techniques such as electron spin resonance (ESR
- I 0%) or infra-red (IR -1 O-'' s) spectroscopy. Thus, NMR allows for considerable exchange of
lipids, through lateral diffùsion, in and out of domains, leading to an averaging of the properties of
two or more distinct regions of the membrane and thus the inability to observe domain structure
(Bloom and Thewalt, 1995).
1.6 Gene Transfection
An important use for polyelectrolytes interacting with lipid bilayer membranes is in the field
of gene transfection. Gene transfection involves the introduction of foreign genetic matenal inside
a cd. One type of genetic material used are oligonucIeotide drugs which inhibit protein production.
A second type of genetic material used in transfection provides a cell with a gene sequence which
is lacking. An example of the latter is the curent work that is being done in cystic fibrosis and cancer
treatmefit. The types of oligonucleotide drugs used may be subdivided into anti-sense, anti-gene
nucleotides and ribozymes which are distinct in their mode of action. Anti-sense oligonucleotides
hybridize to m-RNA and thus block translation, whereas anti-gene nucleotides hybridize to DNA to
block transcription. Ribozymes, on the other hand, act by binding to the correct sequence in m-RNA
and then degrading it (Monkkonen and Urti, 1998). In al1 these instances the limiting step in gene
translocation is the ability of a vehicle to transport the gene efficiently and safely to the nucleus.
There are various such vehicles. One such vehicle is electroporation in which a membrane is
subjected to an applied electric field which produces stnicturd defects in the membrane, thus creating
a pathway to the ceil interior (Nicolau, 1999) . Another method uses vimses such as a retrovims or
adenovims as vectors (Miller, 1990; Kotin, 1994). A third involves packaging DNA into cationic
liposomes (Felgner et al., 1987; Leventis and Silvius, 1990; Gao and Huang, 199 1). Al1 of these
particular methods have certain shortcornings. Electroporation, for instance, suffers fiom the fact that
it requires sophisticated and expensive equipment. Viruses are probably the most efficient method
for gene transfer however they produce immunogenic side-effects, the size of DNA that can be
packaged is limiteci (Joiiy, 1987) and their large scale production is complicated (Crystal, 1995). The
use of liposomes to encapsulate genes has the advantage that it is non-toxic, lipids are biodegradable,
easy to synthesize, large quantities can be produced and the liposomes protect the DNA from
nucleases. The one major shortcoming of this method is that it suffers tiom a low entrapment
efficiency (Fraley, 1 985).
Cationic liposomes have gained wide spread use in gene transfer research. Along with the
advantages already mentioned for DNA encapsulation by liposomes, this method has the capability
of transporting a much larger arnount of DNA. With this method the genetic material is
electrostaticdy packaged with cationic Iipids. This favours the condensation of DNA which aids in
trammembrane transfer. The electrostatic interaction aiso proves to be usefùl since the packages
contain an excess of cationic charge to encourage binding to the anionicaily charged biomembranes.
The cationic lipid/DNA packages are accepted to enter into the cell's interior by an endocytosis
mechanisni (Leventis and Silvius, 1990; Zabner et al., 1995; Farhood et al., 1995). The endosomal
membrane must be destabilized by some stimulus in order to release "naked DNA into the cytoplasm
before lysosomal degradation takes place. Incorporating phosphatidylethanolarnine (PE), a membrane
destabilizing amphiphile, into mixtures with the cationic amphiphile encourages vesicle fusion,
disruption of the endosomal membrane and consequently increases the potency of gene transfer
(Felgner et al., 1994; Farhood et al., 1995). Vesicle fùsion is defined as a polymorphic change in the
bilayer structure that occurs when two apposed membranes corne into close contact and mix with
each other. It not only proves to be important for disruption of the endosmal membrane but also for
release of DNA fiom the lipid complexes. The importance of non-bilayer phases in gene delivery is
proven by the drastic increase of transfection potency in the presence of phosphatidylethanolarnine.
The final step in the transfection process occurs when a proportion of the "naked" DNA difises
through the nuclear pore complex such that transcription can take place.

Finally, improved technologies for cationic liposome trader of genetic materiai involves
stabiiïïng the fiposornes in order to diminïsh the amount of senim-induced leakage of the vesicles by
direct interaction with senirn macromolecules and lipoproteins (Semple et ai., 1998). Part of this
problem has been overcome by incorporating either saturated lipids or cholesteroi into the vesicles
(Sternberg et al., 1998)- Polymer mats have also been suggested to stericaliy stabilize the liposomes
in "Stealth" liposomes technologies as discussed by Lasic and Needham (1 995).
2. THEORY
2.1 Solid State 'H and 3'P NMR Studies of Membranes
NMR is the lowest sensitivity spectroscopie technique which is used for the study of
biological systems. Yet this technique has gaine- widespread use as a powerfbl tool for determining
rnolecular dynarnics and structure. Solid state in particular, is ideatly suited to such systems
in comparison to the usual solution state NMR and difiaction techniques. Many biological
macromolecules and molecular assemblies do not lend themselves to crystailization for difiaction
studies. Secondly, certain macromolecular assemblies do not possess the rapid isotropic motions
required for solution state such as lipids in bilayer arrangement. These anisotropic motions
lead to spectral line broadening and are ideally suited to study by solid state NMR. Thus, there are
no intrinsic size limitations to the technique and the degree to which motional averaging occurs may
be measured by the breadth of the residual powder pattern lineshape. The important sources of line
broadening in soiid state NMR arise fiom the chemical shift m,), scalar coupling (H,), dipolar (H,)
and quadrupolar (JQ nuclear spin interactions. The various terms of the spin Hamiltonian and the
size of the interactions are shown in equation 2.1 (Griffin, 198 t ).
H - - Hcs + H, + HD + H,
for solids (Hz) lo3 - 10' 10 - IO* 101 - los 10' - 106 (2- 1)
Due to the isotropic motion in liquids both the dipolar and quadrupolar terms are averaged to zero.
with only the isotropic portions of the chernical shift and scalar coupling terms remaining in the
spectra. However, in solids there is little or no motional averaging and depending on the sample,
either the dipolar or quadrupolar interactions may dominate the appearance of the spectmm. In the
intermediate case of semisolids, such as lipids in a bilayer arrangement, molecules possess anisotropic
translational and rotational motion, leading to incomplete averaging of the nuclear spin interactions.
In particular, the study of two different nuclei in solid state NMR has yielded a wealth of
information concerning the state and dynamics of phospholipid bilayer membrane systems. 1 will
discuss the detailed information and advantages that both 'H and "P NMR have afforded us. For
more detailed reviews of the subject matter the reader is directed to the reviews of Seelig (1977).
Seelig (1 978). Cullis and de Kniijff (1979), Seelig and Seelig (1980). Griffin (198 1). Davis (1 983)
and Siminovitch ( 1998).
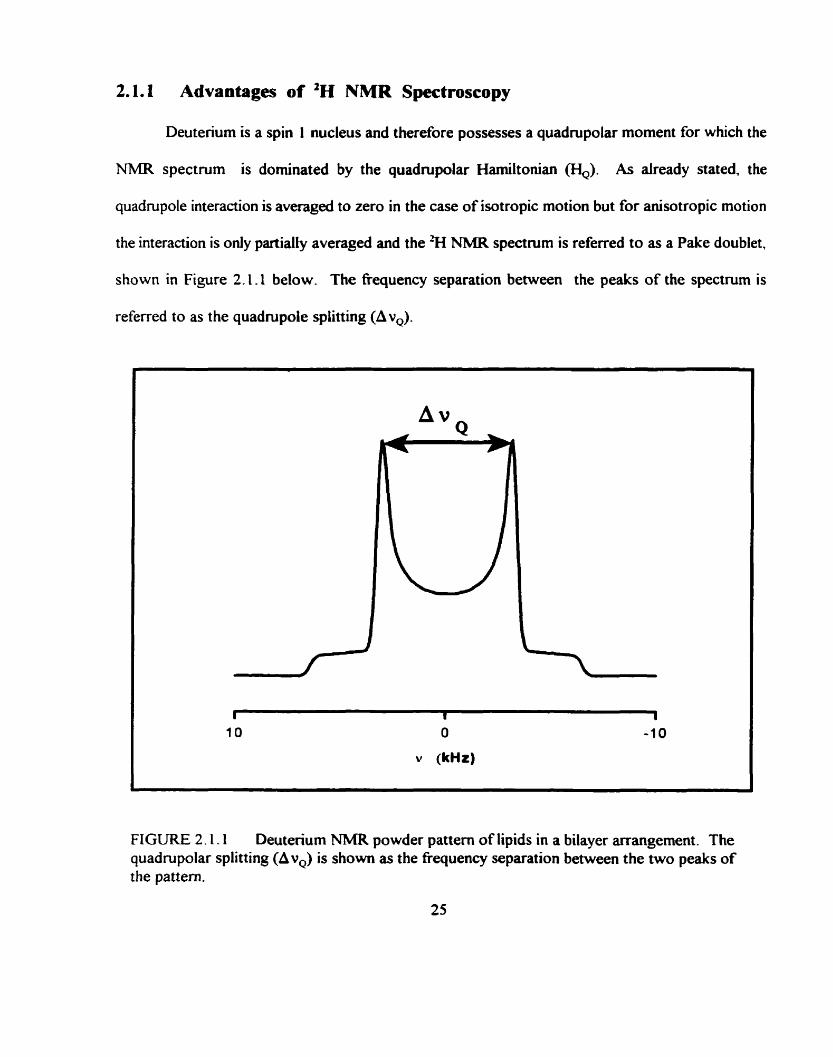
2.1.1 Advantages of 'H NMR Spectroscopy
Deuterium is a spin 1 nucleus and therefore possesses a quadrupolar moment for which the
NMR spectrum is dominated by the quadrupolar Hamiltonian (H,). As already stated. the
quadrupole interaction is averaged to zero in the case of isotropie motion but for anisotropic motion
the interaction is only partially averaged and the 'H NMR spectrum is referred to as a Pake doublet.
shown in Figure 2.1.1 below. The fiequency separation between the peaks of the spectrum is
referred to as the quadrupole spiitting (A v,).
I 1 1 10 O -1 0
v (kHz)
FIGURE 2.1.1 Deuterium NMR powder pattern of lipids in a bilayer arrangement. The quadrupolar splitting ( A v ~ ) is s h o w as the frequency separation between the two peaks of the pattern.

The residual quadrupolar splitting is dependent on the amount of motional averaging as well as the
orientation of the C-D bond vector with respect to the axis of motional averaging and the orientation
of the director axis with respect to the laboratory fiame of the magnetic field. Rates of molecular
motion in the range of at least -10-100 lcHz are required to average the quadrupolar interaction
(Watts, 1998).
The main advantage of the use of deuterium is that it behaves as an isolated nucleus. Due to
the fact that " is a low abundance isotope, molecules under study must be isotopically labelled.
Thus the deuteriurn label may be placed anywhere along a molecule and the 'H NMR spectmm will
consist of a few resonances which may be unambiguously identified. Furthermore because of the low
abundance of 'H the spectra will remain essentially unaf5ected by homonuclear dipolar interactions.
Het eronuclear dipolar interactions are also greatl y reduced due to the relatively small gyromagnetic
ratio (y) of the nucleus. Thus, the dipolar broadening effects are removed fiom the spectra. This
greatly simplifies the interpretation of both line shapes and relaxation time measurements. The
analysis of relaxation times is also simplified due to the large quadrupole moment for which
quadrupolar relaxation becomes the dominant route.
The tirne scale of various dynamic processes that occur within a membrane are well matched
to the breadth of the quadrupolar interaction. Thus, through the use of spin-lattice (Tl) and spin-spin
(TJ relaxation tirne measurements for fast motions (Vold and Vold, 199 l), single and multiple pulse
refocussing experiments (Bloom and Stemin, 1987) for intermediate rate processes, as well as the use
of two-dimensional(2-D) chernical exchange experiments (Auger and Janell, 1990) for slow motions,
'H NMR is capable of following molecular motional fiequencies in the range of 10 - 10'' Hz.
'H NMR also has the advantage of a being a non-perturbing spectroscopic technique as

opposed to the use of bulky labels used in fluorescence spectroscopy and the nitroxide group used
in electron spin resonance techniques. Thus, replacing a proton by a deuteron does not introduce any
perturbation unlike the case with fluorescent dye or spin labels which are used in lateral diffusion
measurements of lipids (Tocanne et al., 1994).
Fmally, the rnost important quantity which may be measured fkom a 'H NMR spectrum is the
quadrupolar splitting (Av,). This is due to the fact that the measured quadrupolar splitting is
dependent upon both the C-D bond orientation and it amplitude of fluctuation. Thus, the quadrupolar
splitting can provide structurai information. The quadrupolar splitting is also related to the order
parameter, S, and represents the ensemble and time average fluctuations of the local geornetry of
the C-D bond about an average orientation. Since lipids may be specifically labelled anywhere dong
their acyl chain or polar headgroup regions, 'H NMR can provide a panoramic view of the structure
and dynamics of a lipid molecule.

2.1.2 Advantages of ''P NMR Spectroscopy
Phosphonis is a spin '/z nucleus and its spectrum is dominated by the chemical shift
Hamiltonian. Because of the relative size of the chemical shielding versus the dipolar coupling
interactions between phosphorus and protons, strong broadband proton decoupling is required in
order to remove the "P-'H dipolar broadening which overlaps the chemical shifi anisotropy eeects
to produce broad feahreless spectra. Thus, the decoupled spectral shape is detennined solely by the
chemical shift anisotropy (CS A) of the "P nucleus which is only partially averaged in phospholipid
bilayers. The residuai chemical shifi anisotropy, Au = a, - oL, can be directly determined fiom the
edges of the spectrum (Seelig, 1978) as shown in Fig 2.1.2
FIGURE 2.1.2 Phosphonis NMR powder pattern for phospholipids in a bilayer arrangement. The chernical shift anisotropy (ho) is shown as the fiequency separation between o, and O,
and has a spread of resonances of approxirnately 40 ppm for the case of lipids in a liquid-crystalline
phase.
A major advantage of "P NMR is that mon lipids in biological membranes are phospholipids
and the natural abundance of the NMR active nucleus "P is 100% and therefore no isotopic labelling
is required as in the case of -% NMR This is a non-perturbing technique which cm be used to study
average orientation and fluctuation of the phosphate segment by measurement of the chemicai shifi
anisotropy (CSA) (Seelig and Seelig, 1980). The minimum rate of motionai averaging of the CSA
is -4 - 6 kE4z which is much slower than for 'H NMR.
Another advantage of "P NMR is the fact that the CSA is obtained with the sign in the NMR
spectmm. Unlike the 'H NMR powder pattern (Pake doublet) which is symmetric and consists of
nvo overlapping Pake patterns the ''P NMR lineshape is not, which proves to be useful in its ability
to recognize lipid polyrnorphism (Cullis and d e h i j e 1979). For instance. if the lipid geometry of
the phase changes fiom lamellar to hexagonal the "P NMR lineshape will have reversed symrnetry
(negative sign) and the CSA will be reduced by a factor of two. The reduction of the CSA can be
understood by an additional motional averaging that the lipids experience due to lateral difision
about a cylinder with a small radius (-20 A). The lamellar versus hexagonal phase could not be
decisively distinguished by 'H NMR. Finaily, a third type of spectmm can be viewed by3' P NMR
which results from rapid movement of the phospholipid molecules about al1 angles in space. an
isotropic spectmm. In this case, the lipids can be arranged in a variety of phases such as micellar,
inverted micellar, cubic and rhombic which each allow for effective isotropic motional averaging due
to rapid lateral d i s i o n of the iipids. In aich a case, other techniques such as freeze-fracture electron
rnicroscopy are required to yield a unique interpretation of such a spectmm (Cullis et al.. 1983;
Gennis, 1989). 31P NMR can also be used to identw a simultaneous mixture of phases as well as
quantitating the amounts through spectral simulation.
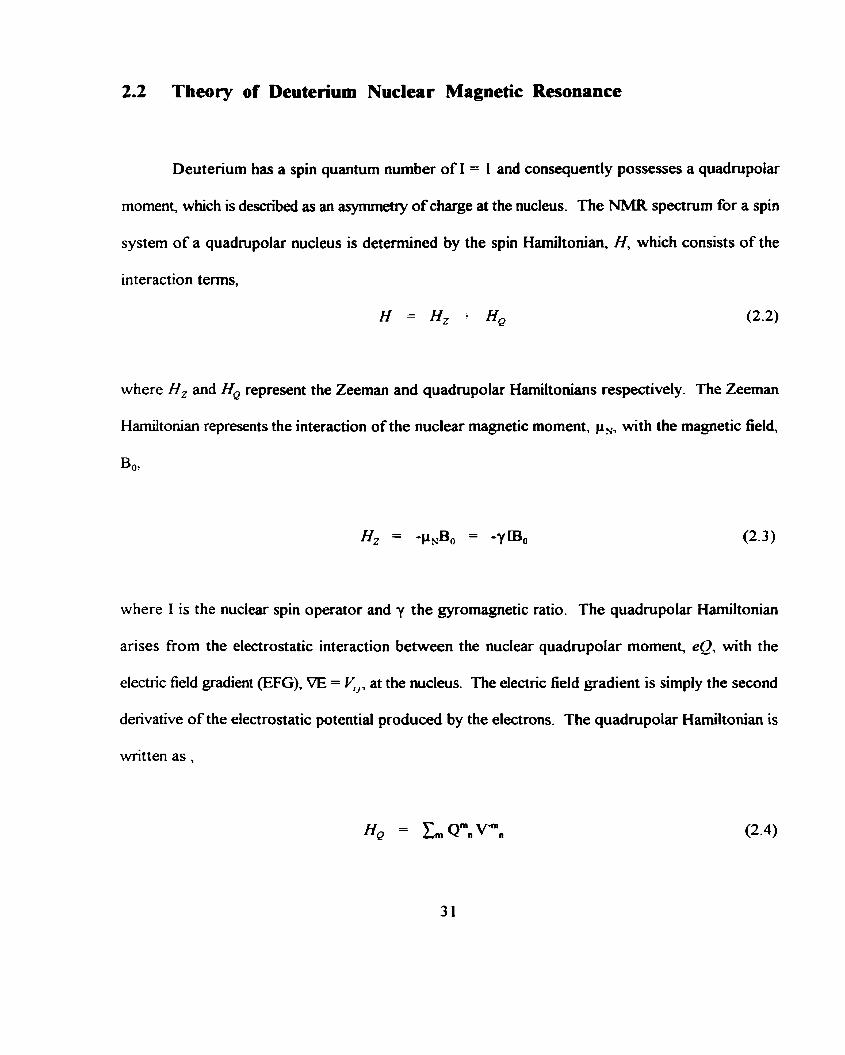
2.2 Tbeory of Deuterium Nuclear Magnetic Resonance
Deuterium has a spin quantum number of 1 = 1 and consequently possesses a quadrupolar
moment, which is described as an asynunew of charge at the nucleus. The NMR spectrum for a spin
system of a quadrupolar nucleus is determined by the spin Hamiltonian, H, which consists of the
interaction terrns,
where Hz and ff, represent the Zeeman and quadrupolar Hamiltonians respectively. The Zeeman
Hamiltonian represents the interaction of the nuclear magnetic moment, ~ r , , with the magnetic field,
Bo3
where 1 is the nuclear spin operator and y the gyromagnetic ratio. The quadrupolar Hamihonian
arises fiom the electrostatic interaction between the nuclear quadrupolar moment, eQ, with the
electric field gradient (EFG), W = y,, at the nucleus. The electric field gradient is simply the second
denvative of the eiectrostatic potential produced by the electrons. The quadrupoiar Hamiltonian is
written as ,

where Qm, and V",, are the quadrupole moment and electric field gradient second rank tensor
operators and the quadrupole Hamiltonian is the scalar product of the two tensors. The value n
describes the syrnmetry of the charge disaibution within the nucleus or the electric field gradient, with
2n + 1 components. For a quadrupolar distribution of charge n = 2 and thus the quadrupole second
rank tensor has the five components (rn = 0, *1, k2):
where Q is the scalar quadrupole moment, e is the elementary charge, 1 is the nuclear spin (1 = 1 for
deuterium) and I, is the raising and lowering operator with L = 5, k i4. Since only tems Qm2 appear
in the quadrupole Hamiltonian then only the tems of Va, need to be considered for the electric field
gradient tensor operator which distinguishes the electric field gradient produced by the electron cloud
and thus its five components are:
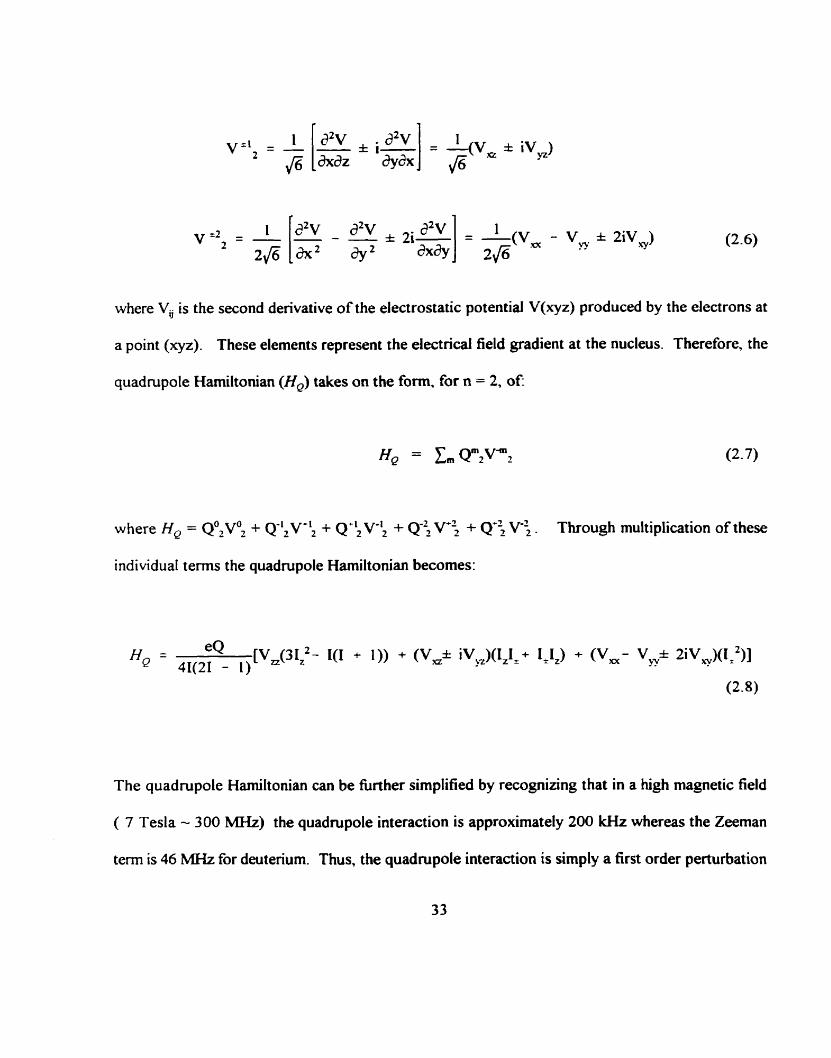
where V, is the second denvative of the electrostatic potential V(xyz) produced by the electrons at
a point (xyz). These elements represent the eiectrical field gradient at the nucleus. Therefore, the
quadrupole Hamiltonian (Hp) takes on the fonn. for n = 2, of:
where Hp = Qo2v02 + Q-~~V-: + Q+: V-i + Q-2, v+: + Q-\ V-\. Through multiplication of these
individual terrns the quadmpole Hamiltonian becomes:
The quadmpole Hamiltonian can be further simplified by recognizing that in a high magnetic field
( 7 Tesla - 300 MHz) the quadmpole interaction is approximately 200 kHz whereas the Zeeman
term is 46 MHz for deuterium. Thus, the quadrupole interaction is simply a first order perturbation

of the Zeeman interaction and since the total Hamiltonian is the sum of these hwo tenns, then only
the terms in H, which cornmute with Hz need to be considered. Since the tems containing the raising
/ lowering operator alter the wavefunction they are dropped fiom H, and the expression reduces to:
The above equation is the general formulation of the quadrupole Hamiltonian and is valid proMded
that V, and the spin operator 4 are defined in the same reference h e . But, I, is defined in the
laboratory frame whereas V, is defined in a molecular fixed M e of reference. In order to use
equation 2.9 it is necessary to rotate the molecuiar fixed fiame into the laboratory coordinate system
through successive rotation through Eulerian angles a, Q and y.
Principle Axis Coordinate System of the I rducible V", Elements
The electrostatic field gradient tensor is a 3 x 3 mat* which is synunetric and traceless. It
may be transformeci into a principal axis system in which its matnx elements are diagonal and al1 off-
diagonal elements are zero, in the form:
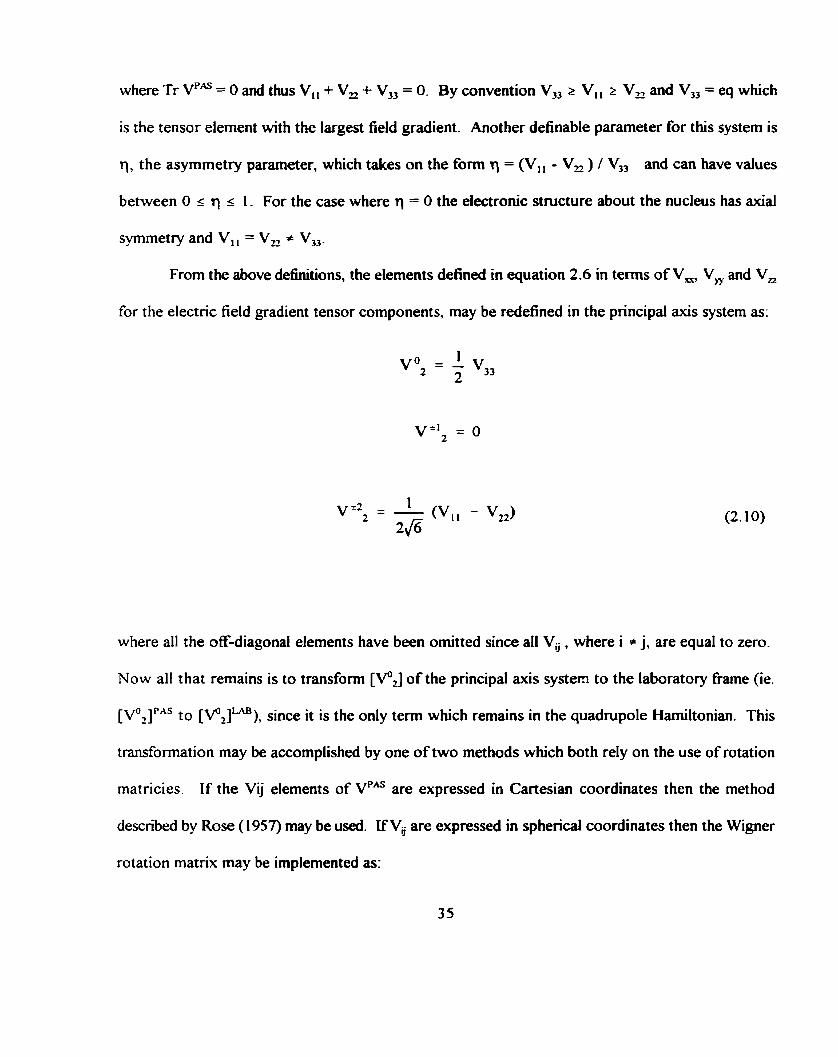
where Tr VPAS = O and thus V,, + V, + V, = O. By convention r VI, 2 V, and V,, = eq which
is the tensor element with the largest field gradient. Another definable parameter for this system is
q, the asymmetry parameter, which takes on the fonn q = (V,, - Vn ) / V,, and can have values
between O 5 q < 1. For the case where q = O the electronic structure about the nucleus has axial
syrnrnetry and VI, = V, * V,,.
From the above dennitions, the elements defined in equation 2.6 in ternis of V , V, and V,
for the electric field gradient tensor components, may be reâefïned in the principal axis system as:
where al1 the off-diagonal elements have been omitted since al1 Vij, where i + j, are equal to zero.
Now al1 that remains is to transfomi [VJ of the principal a i s system to the laboratory fiame (ie.
[VOJPAS to [V2ILm), since it is the only term which remains in the quadrupole Harniltonian. This
transformation may be accomplished by one of two methods which both reIy on the use of rotation
matricies. If the Vij elements of VPU are expressed in Cartesian coordinates then the method
describeci by Rose (1957) may be used. If V, are expressed in spherical coordinates then the Wigner
rotation matrix may be implemented as:

Applying the Wigner rotation matrix D,,(8 @ y) , where (8 @ y) correspond to the Euler angles of
(a B y), is equivalent to performing two rotations of the principal axis system, to which y = 0.
Consider that initially the z-axis ofthe PAS is defined as being parallei to the magnetic field Bo. The
angle 4 is therefore defined as a rotation angle about the z-axis, ie. in the xy plane of the magnetic
field whereas the angle 8 is de- as a rotation about the y-axis, ie. in the xz plane. Thus, the P.AS
of the EFG tensor is rotated by an orientation dehed by the polar and azimuthal angles 0 and @ with
FIGURE 2.2.1 Wigner rotation of the principal axis system of the electric field gradient tensor into the labotatory fiame of reference.
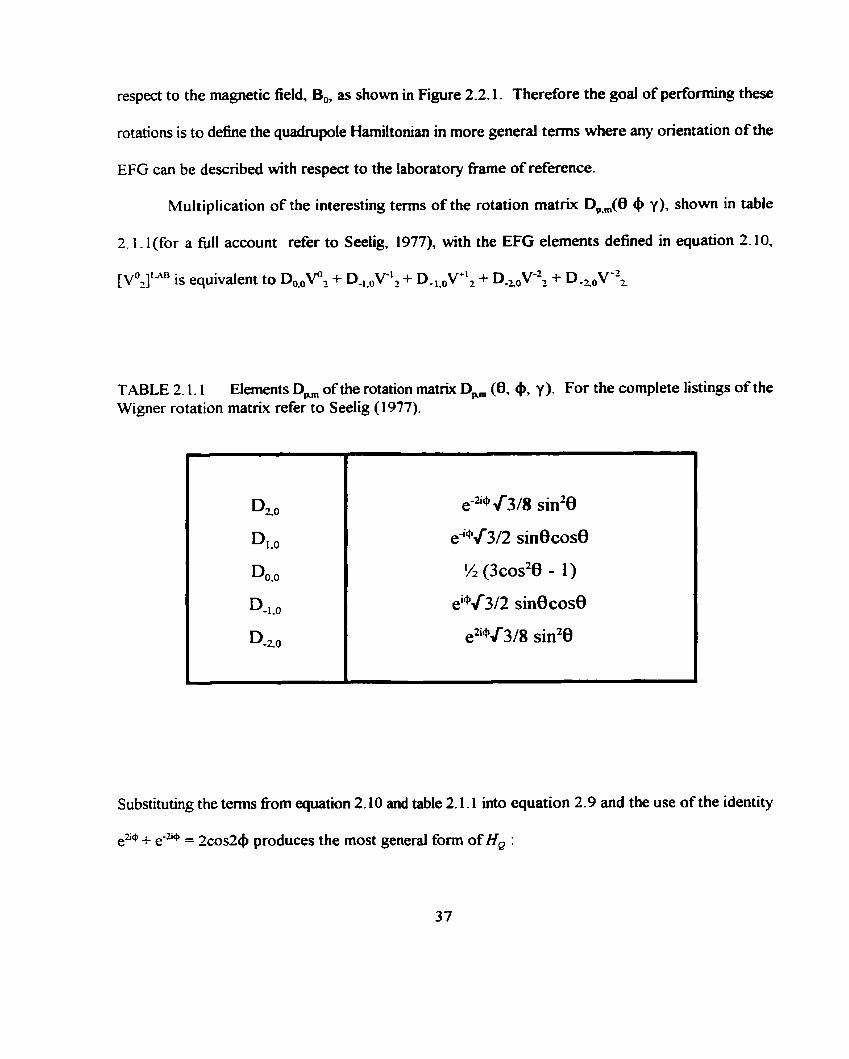
respect to the mapetic field, Bo, as shown in Figure 2.2.1. Therefore the goal of performing these
rotations is to define the quadrupole Hamiltonian in more general terms where any orientation of the
EFG can be described with respect to the laboratory fiarne of reference.
Multiplication of the interesting terms of the rotation matrix D,,,(8 4 y), show in table
2.1.1 (for a full account refer to Seelig, 1977), with the EFG elements defined in equation 2.10.
[V2IUB is equivalent to D,v2 + D.l.oV-12 + D.,,,V+12 + D,oV-22 + D+roV+2z
TABLE 2.1.1 Elements Dm of the rotation matrix Dm (8, 0, y). For the complete listings of the Wigner rotation matrix refer to Seelig (1977).
Substituting the tems corn equation 2.10 and table 2.1.1 ïnto equation 2.9 and the use of the identity
e2@ + e"@ = 2cos29 produces the most general fom of H, :
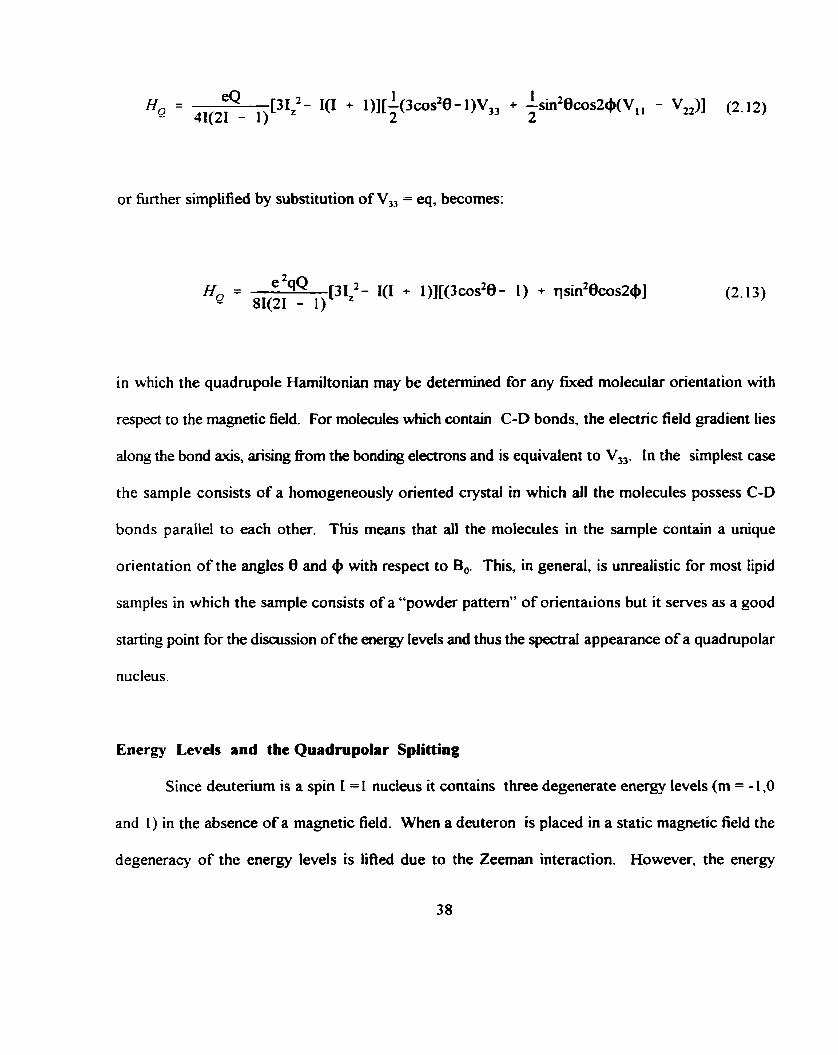
or fùrther simplified by substitution of V,, = eq, becomes:
in which the quadrupole Harniltonian may be determined for any fixed molecular orientation with
respect to the magnetic field. For moIecu1es which contain C-D bonds, the electnc field gradient lies
dong the bond ais, arising ffom the bonding electrons and is equivalent to V,,. In the simplest case
the sample consists of a homogeneously oriented crystal in which al1 the molecules possess C-D
bonds parallel to each other. This means that al1 the molecules in the sample contain a unique
orientation of the angles 8 and 4 with respect to Bo. This, in general, is unrealistic for most Iipid
samples in which the sample consists of a "powder pattern" of orienta~ions but it serves as a good
starting point for the discussion of the energy levels and thus the spectral appearance of a quadrupolar
nucleus.
Energy Levels and the Quadrupolar Splitting
Since deuterium is a spin I =1 nucleus it contains three degenerate energy levels (m = - 1 ,O
and 1 ) in the absence of a magnetic field. When a deuteron is placed in a static magnetic field the
degeneracy of the energy levels is lifted due to the Zeeman interaction. However, the energy

difference behveen any two levels separated by Am = +1 is degenerate. Nevertheless, the total
Hamiltonian is a sum of both Zeeman and quadrupole interactions. The latter is a small perturbation
of the former and causes a shift in the Zeeman energy states. This lies the degeneracy of the energy
differences and lads to a doublet of resonances. This can best be understood by considering the form
of the energy levels of the total Hamiltonian:
where the first term represents the Zeeman energy term and the second the quadrupole contribution
to the energy states. Since deuterium possesses three values for the magnetic quantum number (ie.
rn = 1 ,O,- 1) then the three resulting energy levels are:
The two allowed transitions are determined by the the selection rule Am = * l , which lead to the
resonance fkequencies:
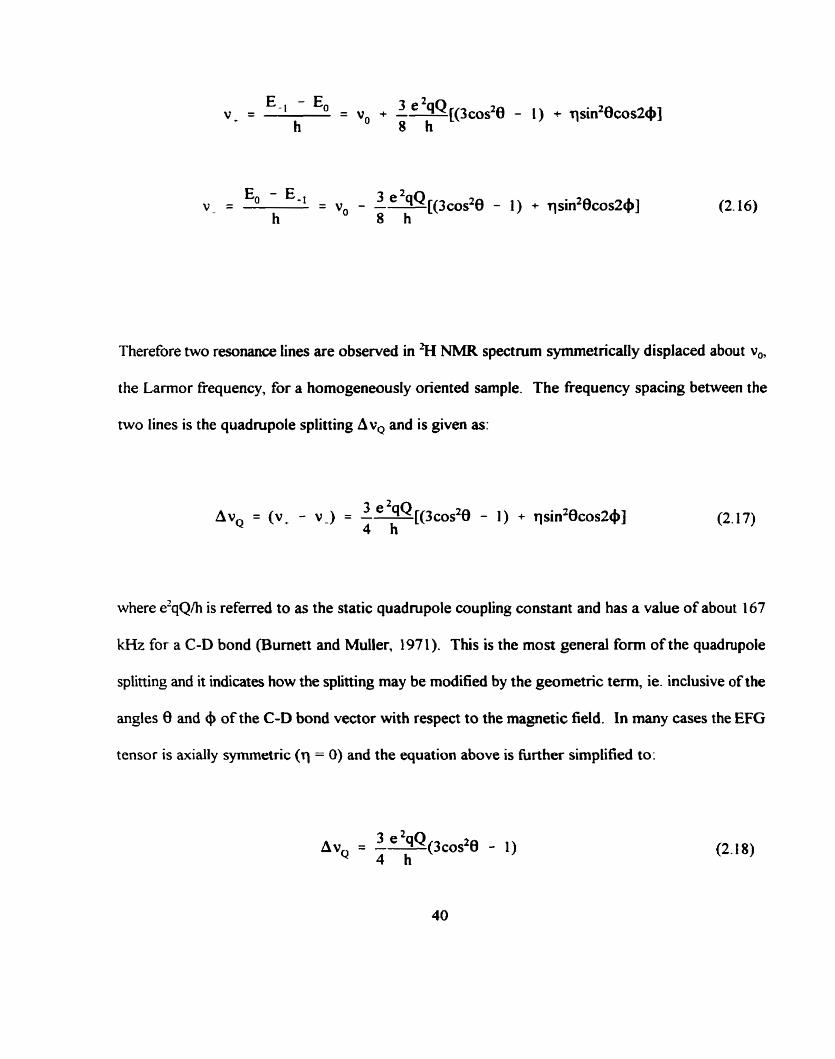
Therefore two resonance lines are observed in *H NMR spectmm symmetricdly displaced about v ,
the Larmor frequency, for a homogeneously oriented sample. The frequency spacing between the
two lines is the quadrupole splitting AvQ and is given as:
where e2qQ/h is referred to as the static quadrupole coupling constant and has a value of about 167
kHz for a C-D bond (Bumett and Muller. 1971). This is the most general form of the quadrupole
splitting and it indicates how the splitting may be modified by the geometric term, ie. inclusive of the
angles 8 and @ of the C-D bond vector with respect to the magnetic field. In many cases the EFG
tensor is axially syrnrnetric (q = 0) and the equation above is fùrther simplified to:
where, by inspection of the equation, the quadrupole splitting may be reduced to zero by the right
choice of 0 in the geometric term. This angle is referred to as the "magic angle7' and has a value of
0 = 54.7". At the same time, the largest value that the quadmpole splitting may take on occurs at 0
= O, ie. with the C-D bond aligned with the magnetic field, and has a value of 255 kHz.
Powder Pattern Lineshapes and Polycrystalline Samples
In the previous section both the energy levels and quadrupolar splittings were deterrnined for
a homogeneously onented sample. As aiready mentioned, though, many sarnples including lipids are
difficult to prepare as single crystals. Samples which are most ofien prepared and under study in 'H
NMR are polycrystalline powders in which the nuclear sites of the sample are randody oriented with
respect to the extemal magnetic field, Bo. The "powder" pattern lineshape in the NMR spectrum
results fiom the average over aii possible orientations of the C-D bond vectors. In other words, each
orientation 8, of the C-D bond vector with respect to Bo, produces a doublet of resonances and each
of the individual doublets add together to produce an envelope of resonances, as already shown in
the introduction. The intensity of each of the doublets depends on the number of nuclei present at
a particular orientation of 0 and 4. Thus, the 'H NMR spectrum is a map of frequency versus the
probability of a particular 0 and 4. The shape of such a spectrum will be denved as follows for the
simplest case which is that of axial symmetry (q = O) ie. only consider the angle 8.
Assume that there is a unifiorm distribution of N nuclei over the surface of a sphere with radius
r. This means that ail angies are equally probable. Thus, the density of spins on the surface is given
by the expression ~/4n8. The fiction of nuclei dN contained between an area defined on the surface
by the angles 0 and 0 + de, with respect to Bo, is determined as the latitudinal area of a zone of a

sphere, Zxisin0d0, multiplied by the surface density of the spins:
where the probability distribution of the angle 0 is P(0) = dN/Ndû which is simply the haction of the
total surface area defined by 0 - 0 + dB and fiom the above equation reduces to:
Now consider the f o m of the doublet raonance eequencies derived in equation 2.16 for the case of
axial symmetry:
in order to proceed fùrther it is instructive to introduce the "reduced" resonance frequency, E, which
is a simple rearrangement of the previous equation and which isolates the geometric term containing
8:

where 1 r E , 2- '-A and -1 z + r !A for the range of frequencies between 0 = 0' and 0 = 90'. We
may now define the fraction of spins with reduced fiequency between E and E + de as l'(€)de. The
relationship between the two probability densities. P(8) and P(E) is:
From equation 2.22 for the reduced fiequencies cos0 = [ (*2~ + 1) /3 ] '~ and by substituting this into
equation 2.23 and taking the derivative P(E) becomes:
The -% NMR powder specuum is obtained by plotting the two resonances, E+ and E., versus the total
of the probability densities, P(E) = P(E,) + P(E- ), as shown in figure 2.2.2. Assuming that the
transition probability is equivalent for each of the individual transitions then the total absorption
intensity S(E) is linearly related to P(E).
By examination, the fiequencies diverge at E = *Il2 and this corresponds to the situation of
the C-D bond onented perpendicular to Bo. ie. 0 = 90'. The fiequency spacing of these two most
intense peaks A r = 1 is the quadrupole splitting and thus the static quadrupole coupling constant may
be determined directly for a static polycrystalline sample.
The above treatment is tme for the case where the individual resonance lines of the powder
spectrum are delta fiinctions. But, what if the resonance lines are Lorentzian or Gaussian? This
would mean that intensity at one particular fiequency contains contributions fiom overlapping

FIGURE 2.2.2 Theoretical NMR powder pattern for a deuterium nucleus in the case of axial symmetry (q = O ). The dotted lines show the individual components of the two transitions (m = -1 to m = O for E, and m = O to m = 1 for E-). The solid line represents the sum of the two components.
neighbouring resonances. For a line centred at E* the shape o f the individual resonance may be
approximated by either a Lorentzian Iineshape,
or a Gaussian lineshape:

where the fiill width at half height, (k),, for the single resonance line is equal to 2.350. The total
intensity I(E) at a fiequency r, is the integral over al1 contributions fiom al1 possible E* as expressed
by the convolution of the liieshape fiinction with the probability fùnction in:
Seelig (1977) has shown that through the use of computer lineshape simulations, using either the
Lorentzian or Gaussian distributions, that vaqing the line width parameter produces the theoretical
vaiue for the quadrupole splitting for only very sharp lines ie. small o. In ail other cases the "real"
quadrupole splitting is obscured by the broadening and attains a value smaller than that predicted for
the case where individual resonances are delta tùnctions. In such an instance, the true quadrupolar
splittin~ may be detennined through "de-Pakeing" the powder spectrurn in order to retain the 0 = 90'
orientation resonant frequencies for the two transitions (Bloom and Stemin, 1983). Another origin
to the smoothing of the spectral lineshape, which should always be considered, is due to the
overlapping of distinct Pake patterns which differ in breadth.
Fially, derivation of the powder pattern which results fiom a non-zero asymmetry parameter
becomes much more complicated and the details may be found in Cohen and Reif (1957).
Motions in Orientcd Liquid Crystals
The previous treatment was carried through for both single crystals and polycrystalline
powders in the absence of motions by individual molecules. Liquid crystals are fluid systems which

exhibit both motion and at the same time order as is the case for lipid molecules in their
macrorno1ecula.r assernblies such as the lameiiar or hexagonal phases. For such an instance the above
equations must be modied in order to account for motion in these systems. In the liquid crystalline
phase rod-like molecules align paraIIel to one another, dong their long molecular axes, and exhibit
unrestricted motion about these axes with frequencies in the range of 10' - 10" Hz. On the other
hand, although angular motions perpendicular to the long a i s are restricted the parailel packing of
the molecules is not perfect and angular excursions do occur rapidly, although comparatively reduced
in amplitude. The long axis of motional averaging is referred to as the director axis (z') and the
movement of the molecules about this a i s are cy1indrically symmetric. In the case of lipid molecules
the director axis is normal to the bilayer surface.
The starting point for incorporation of these and other molecular motions is to consider the
average order of the systern. We begin by attaching a Cartesian coordinate system (x,y,z) onto the
Iiquid-crystalline molecule and then define the average fluctuation of these axes about the director
âuis, z'. As mentioned in the introduction, the rneasure of such fluctuations is contained within the
order parameter, S. In this instance the order parameter Su is defined as:
where cos20i is represented by a time average of the fluctuations of the ith (i = x,y,z or 1,2,3)
coordinate axis with respect to the director ais. The order parameters S, are defined as the diagonal
elements of a 3 x 3 order matrix and thus define the fluctuations of a second-rank tensor. Since
cos20i = 1, then Si = O and because cos20i can only take values of between O and 1, then al1 Si are

restricted to values between 4 2 and 1. Therefore, if the tensor is axially symmetric and the z-axis
is defined as the axis of symmetry then its order parameter is S,, and the order parameter of the other
two axes are equivalent, S,, = S,. By definition, this means that S,, = - 112 S, = - 1/2 SI,.
in deriving the equations which incorporate motions of the lipid molecules we first consider
the case of a liquid crystal which is macroscopically ordered between parallel g las plates. Lipid
molecules will arrange themselves in parailel layers on the supporting plates such that the director
axes z' are aü parallel to one another and perpendicular to the glass surfaces. The molecular motions
of the lipids are thus anisotropic and the EFG at the deuterium nucleus is not averaged to zero and
thus there remains a residual quadrupolar splitting. In the case of single crystals the angles 0 and 4
defined the polar and azimuthal angles of the EFG with respect to Bo. In a liquid crynal the unique
axis becomes the director axis of motion. If the magnetic field is applied parallel to this a i s then the
average position of the EFG tensor is defined by the same angles as for the case of a single crystal.
But, if the glas plates of the planar-oriented iiquid crystals are rotated such that the director axis and
Bo are no longer parallel. a new angle must be defined P' . As shown in figure 2.2.3, P'is the angle
made between the director axis and Bo, for the more general case , while the angles 0 and C#I now
speclfy the orientation of the C-D bond with respect to the director axis. What this effectively does
is to aiiow for the incorporation of the rapid fluctuations of the molecules about z' into the equation
for the quadrupole splitting by expressing the electric field gradient tensor into the molecular
coordinate system of z. . The static EFG is averaged by this motion and only the new effective field
gradient tensor is detected and it is axially syrnmetnc about 2'. Thus. the angles 0 and 4 must be
replaced by their time average about the principal axes of the static electric field gradient tensor,
KY,^).
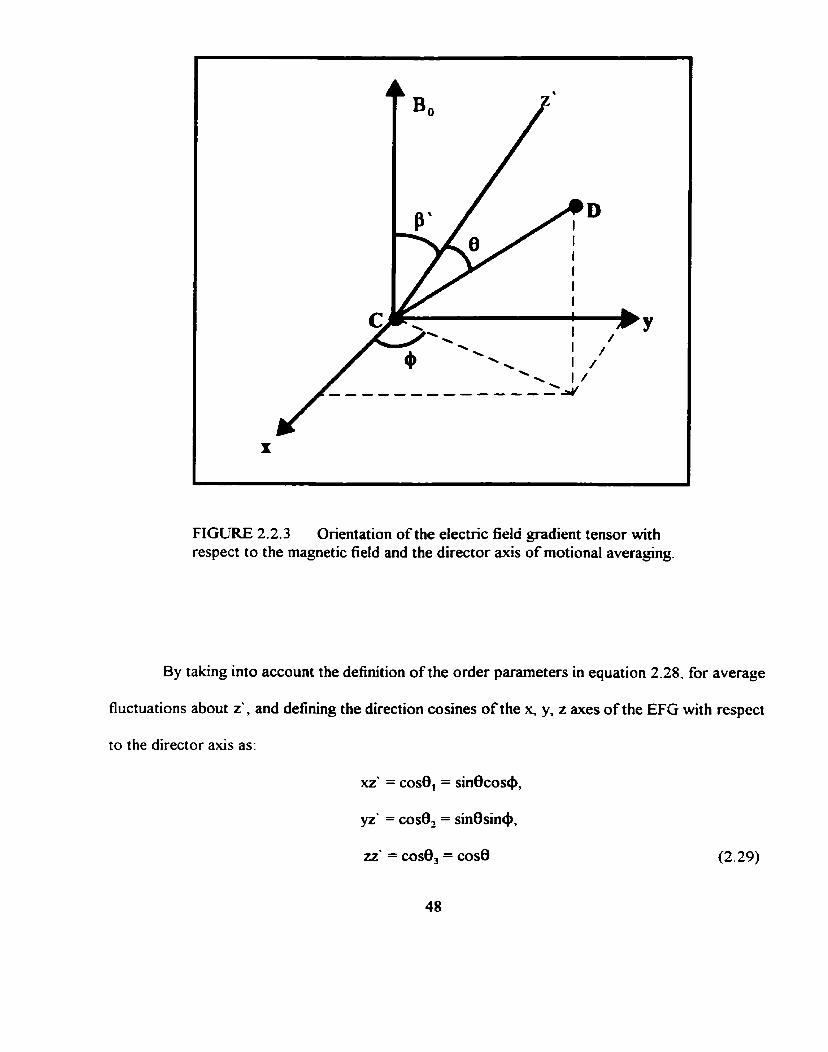
FIGURE 2.2.3 Orientation of the electric field gradient tensor with respect to the magnetic field and the director axis of motional averaging.
By taking into account the definition of the order parameters in equation 2.28. for average
fluctuations about z', and defining the direction cosines of the x, y, z axes of the EFG with respect
to the director axis as:
XZ' = COS^, = sinecos+,
yz' = casez = sinesin@,
ZZ' = COS^^ = COS^
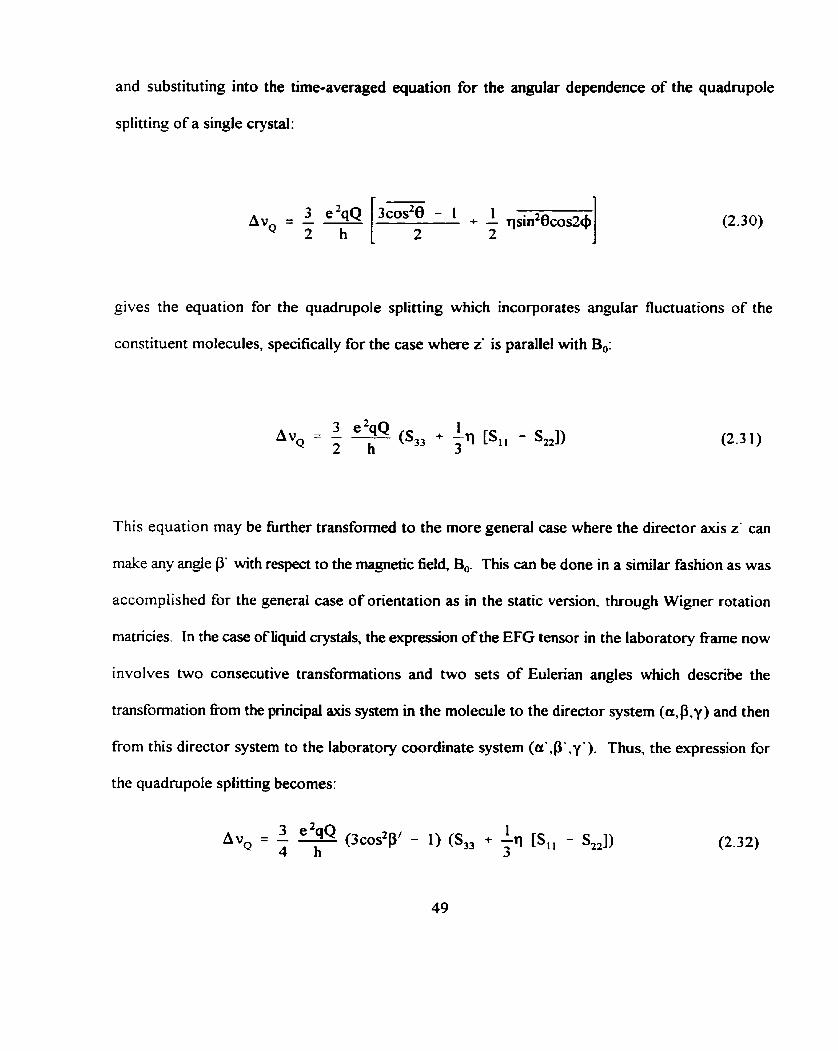
and substituting into the time-averaged equation for the angular dependence of the quadnipole
splitting of a single crystai:
çives the equation for the quadrupole splitting which incorporates angular fluctuations of the
constituent molecules, specifically for the case where z' is parallel with Bo:
This equation may be fùrther transformed to the more general case where the director a i s z' can
make any angle P' with respect to the magnetic field, Bo. This can be done in a similar fashion as was
accomplished for the general case of orientation as in the static version. through Wigner rotation
matricies. In the case of liquid crystais, the expression of the EFG tensor in the laboratory fiame now
involves two consecutive transformations and two sets of Eulerian angles which describe the
transformation fiom the principal axis system in the molecule to the director system (a ,P,y) and then
fiom this director system to the laboratory coordinate system (a ' ,P ' .y ' ) . Thus. the expression for
the quadrupote splitting becomes:

which in the case of axial synimetry (q = O), fùrther reduces to:
By observation, in the most general case for q + 0, the quadrupole splitting is detennined by two
order parameters due to the fact that S. = O, while for axial symmetry only one order parameter
is required to determine the quadrupole splitting. The latter case is generdly observed and thus
equation 2.33 applies. This is true because not only is it known fiom crystal studies (Derbyshire et
al., 1 969; Barnes and Bloom, 1973; Fung, 1974) and theoretical calculations (Hoyland, 1968) that
the asymmetry parameter is small (q c 0.05) and can be neglected for C-D bonds but also lipid
motions are axially syrnrnetric and thus S,, = Sü.
By comparing the expressions of the quadrupole splitting for a homogeneous static crystal
and a homogeneously oriented liquid q s t a l , it becornes obvious that the effect of motionai averaging
is to reduce the size of the static AvQ by a factor of &, . For lipid bilayers, this means that Av, is
reduced by S,, due to the angular fluctuations (0 and 4) of C-D bond about the normal of the bilayer
surfàce. By inspection of the geometric terrn of equation 2.33, the quadmpole splitting collapses to
zero for p = 54.74 the magic angle, while reaching its maximum value at P' = O. By cornparison of
Av, of homogeneously oriented bilayers for P' = 0' to the static value for a C-D bond (255 kHz) the
segmental order parameters may be detennined for a lipid molecule (Seelig and Niederberger, 1974)
by specifidy deuterolhlling dong the molecule. The overail effect of rapid axial rotation of a lipid
about its long ais , on a timescale faster than that of 'H is to reduce the quadmpole splitting
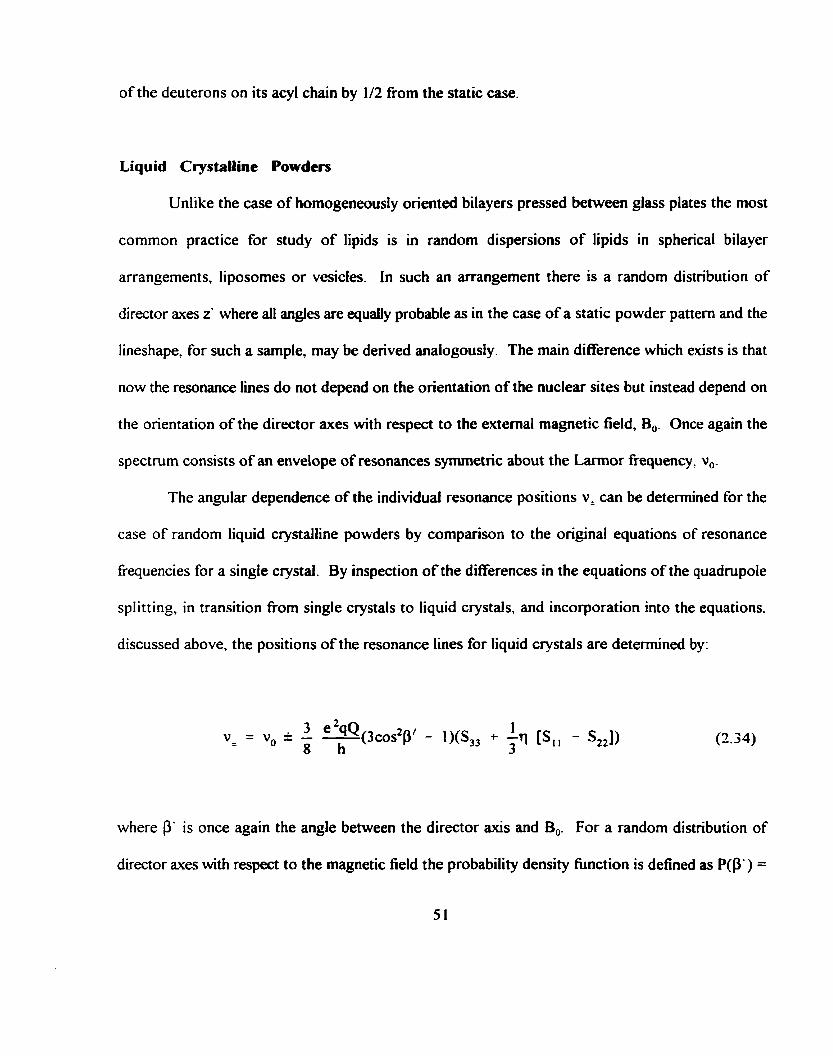
of the deuterons on its acyl chah by 1/2 fiom the static case.
Liquid Crystalline Powdcrs
Unlike the case of homogeneously oriented bilayers pressed between glas plates the most
common practice for study of lipids is in random dispersions of lipids in spherical bilayer
arrangements, liposomes or vesictes. In such an arrangement there is a random distribution of
director axes z' where al1 angles are equaily probable as in the case of a static powder pattern and the
lineshape, for such a sarnple, may be derived anaiogously. The main difference which easts is that
now the resonance lines do not depend on the orientation of the nuclear sites but instead depend on
the orientation of the director axes with respect to the extemal magnetic field, Bo. Once again the
spectrurn consists of an envelope of resonances symmetric about the Larmor fiequency, v,.
The angular dependence of the individual resonance positions v= can be determined for the
case of random liquid crystailine powders by cornparison to the original equations of resonance
frequencies for a single crystal. By inspection of the differences in the equations of the quadrupole
splitting, in transition fiom single crystals to liquid crystais, and incorporation into the equations.
discussed above, the positions of the resonance lines for liquid crystals are determined by:
where p is once again the angle between the director axis and Bo. For a random distribution of
director axes with respect to the magnetic field the probability density function is defined as P@') =
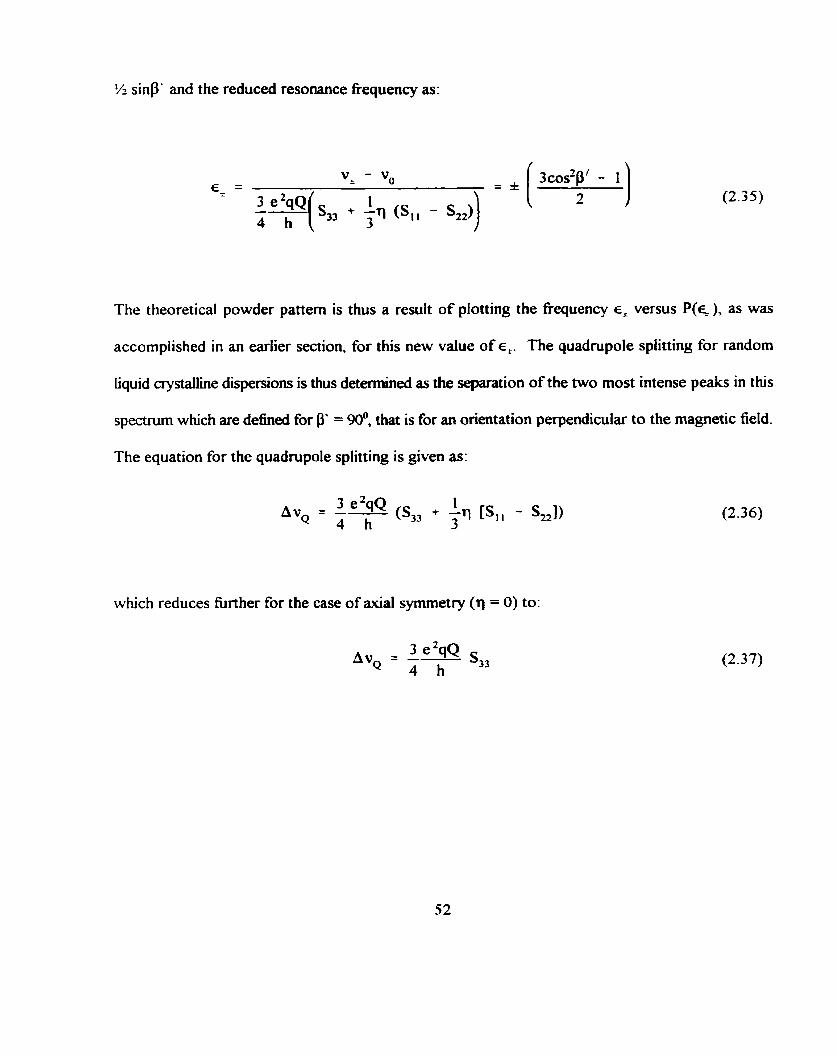
Y? sinpu and the reduced resonance frequency as:
The theoretical powder pattern is thus a result of plotting the fiequency q versus P(<), as was
accomplished in an earlier section. for this new value of a,. The quadrupole splitting for random
tiquid cryadine dispersions is thus detefmined as the separation of the two most intense peaks in this
spectrum which are dehed for P' = 90'- that is for an orientation perpendicular to the magnetic field.
The equation for the quadrupole splitting is given as:
which reduces fiirther for the case of axial symmetry (q = O) to:
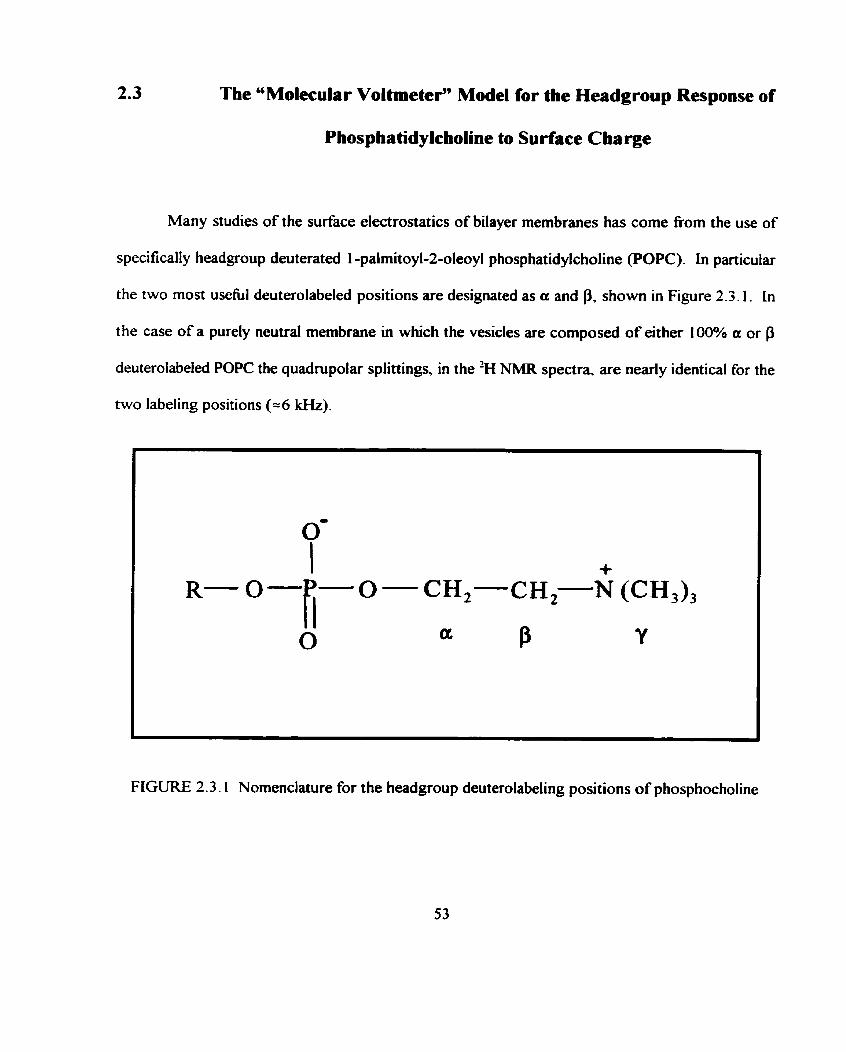
The uMolecular Voltmeter" Model for the Headgroup Response of
Phosphatidylcholine to Surface Charge
Many studies of the surface eiectrostatics of biiayer membranes has corne from the use of
specifically headgroup deuterated 1 -paimitoyl-Zoleoyl phosphatidylcholine (POPC). In particular
the two most useîùl deuterolabeled positions are designated as a and P, shown in Figure 2.3.1. In
the case of a purely neutrai membrane in which the vesicles are composed of either 100% a or P
deuterolabeled POPC the quadrupolar spiittings, in the 'H NMR spectra, are nearly identical for the
two labeling positions (=6 kHz).
0- I +
R-o-i O - CH,-CH,-N (CH,),
O a P Y
FIGURE 2.3.1 Nomenclature for the headgroup deuterolabeling positions of phosphocholine

In the most general sense, by depositing charge at the surface in the form of metal ions
(Akutsu & Seelig 198 1 ; Altenbach & Seelig, 1984; Macdonald & Seelig, 1987 gb), hydrophobic ions
(Altenbach & Seelig, 1985), charged local anesthetics (Browning & Akutsu, 1982; Seelig et al.,
I988), chaotropic agents (Macdonald & Seelig, 1988). charged peptides (Six1 & Watts, 1985; Roux
et al.. 1989; Kuchinka & Seelig, 1989; Beschiaschvili & Seelig, 1990; 1991) or negatively and
positively charged Lipids (Scherer & Seetig, 1987; Scherer & Seelig, 1989) the quadrupolar splittings
observed in the Nh4R spectra Vary in a predictable manner. When negative charge is added to the
POPC surface in the form of an anionic lipid such as 1-palmitoyl-2-oleoyl phosphatidylglycerol
(POPG), the quadrupolar spiitting progressively increases for the POPC-a-dz case and decreases for
POPC-P-d2 with increases in surface charge. On the other hand, the opposite effect is noted for the
addition of cationic charge to the surface in the form of 1,2-dioleoyl-3-tnmethyIaminopropane
(DOTAP) where the quadrupolar splitting decreases for POPC-a-d2 and increases for POPC-P-d,
bilayers. The variation of the quadrupolar splittings for the extrerne cases of charge can differ by tens
of kilohertz. The addition of neutrai molecules such as cholesterol or indifferent electrolytes such as
NaCl, which do not specifically bind to the surface of these membranes result in little or no change
of the % NMR response (Scherer and Seelig, 1987; Bechinger et al.. 1988). Thus. the fact that any
and al1 sources of surface charge produce similar changes in the quadrupolar splittings of deuterated
POPC resulted in terming this 'H NMR technique as the "molecular voltmeter".
The next question which then aises is what is the physical situation which produces this
response? The fact that there is an inverse relationship in the change of quadrupolar splittings from
the two deuterolabeling positions rules out a generalized increase or decrease in the order of the
choline headgroup, which would give rise to either an increase or decrease in the quadrupolar
splittings for both POPC-a-d2 and POPC-P-d2. Akutsu and Seelig ( 198 1) first proposed that there
was a conformational response of the choline headgroup of POPC to surface charge in which the
entire headgroup tilted with respect to the plane of the membrane surface. The choline headgroup
is thought to tilt about the C,-O-P dihedral angle, between the hinge point of the glycerol backbone
and headgroup region of the molecule. Scherer and Seelig (1 989) discussed this "choline-tilt" model
as a result of an electrostatic attraction / repulsion mechanism of the phosphocholine headgroup (-
P-N' dipole) in response to charge deposited within the headgroup region. The zwitterionic
headgroup of POPC possesses a large dipole moment of approximately 19 D (Shepherd & Büldt,
1978) in the form of a -P-N+ dipole which lies nearly parallel with the bilayer membrane, within 30°,
for a neutrai membrane. This tilt angle changes in the presence of charge at the surface such that the
dipole moment of the phosphocholine group will seek to align itself with the electrical field lines
emanating fiom the charged surfice. Upon addition of cationic charge the p hosphocholine di pole will
move out of the bilayer plane while addition of negative surfâce charge will produce the opposite
rotation and thus pull the dipole towards the bilayer surface. This can best be visualized by placing
the surface charges close to the phosphate segment ie. the lower dielectric medium of the headgroup
region. This is reasonable since generally ody charged molecules which can penetrate the interface
between the glycerol backbone and headgroup region of the bilayer, produce the desired 'H NMR
response. The qualitative response of the phosphocholine headgroup, to a variety of compounds.
is similiar as long as their charge cames the same sign. Quantitatively the sensitivity of the "molecular
voltmeter" wil! also depend on the valency of the molecule, on the extent of binding to the surface
and on both the vefiical and lateral distance ofclosest approach to either the positive or negative end
of the P-N dipole.
Further evidence of the fact that the phosphocholine headgroup undergoes only two types of
conformational changes comes fiom the so cded a-p plots (Akutsu & Seelig, 198 1 ; Altenbach and
Seeiig, 1984; Beschiaschvili & Seelig 1991). ln this method the quadrupolar splitting of POPC-p-d,,
A vP, is plotted against the corresponding splitting of POPC-a-&, A va, for the same molar fraction
of charge in the membrane. The effect is to show the different effects of charged molecules on the
two different deuterolabeling positions. Due to the counterdirectiond nature of the two positions the
dope of such a plot is aiways negative. However, it has been noted that the slopes of such curves
falls within two charge regimes. At1 anions produce slopes of approximately -1.0 while cations
produce dopes of -0.55, regardless of the variety of anions or cations (Beschiaschvili & Seelig, 199 1).
These results are consistent with the fact that cationic charge will position itself closer to the
phosphate segment of the phosphocholine molecule hence afkcting the u segment more than the P
segment because of close prortimity. On the other hand, anionic charges should be positioned cioser
the N end of the dipole thus increasing the conformational change of the p segment comparitively.
To date the precise nature of the conformational response undergone by the choline
headgroup is not certain and the only evidence nipponing it comes 60m 'H NMR. Recent simulation
studies (Konstant et al., 1994) have suggested that in addition to the overall tilting of the headgroup
with respect to the bilayer surface that there are also changes in the internai torsion angles which need
to be considered to explain the changes in the quadrupolar splittings. Also, since this model predicts
a displacement of the quatemary N of 5A for the extremes of added charge perhaps neutron
difiaction techniques may be used to prove or refine the model. As well, recent NMR techniques
used to determine 13C-31P and '%-"C dipolar couplings in lipids can be used to extract both distance
and conformational information (Hong, et al., 1995).

On the other han4 %I NMR results have produced a quantitative model (Roux et al., 1989)
of the choline tilt concept which correctly predicts the essential features of the dependence of the
quadrupolar splitings on surface charge (Macdonald et al., 1991). Before getting into the details of
the mode1 we must remember that lipid molecules undergo fast rotation about their long molecular
a i s which reduces the quadrupolar splitting. But, since the motion is anisotropic the averaging is
incomplete leaving a residual quadrupolar splitting. The starting point for the model begins with the
relationship between the quadrupolar splitting and the conformation of the headgroup as a two-step
model first proposeci by Akutsu and Seelig ( 1 98 1 ). The model assumes that the polar headgroup of
a lipid possesses two types of motion so that an orientational order parameter Si can be expressed as
the product of the two parameters, which are characteristic of each motion:
where Avi is the observed quadrupole splitting at the ith deuterolabelling positions while Av, is the
static quadrupole splitting constant. Sr represents the order parameter of the molecular axis with
respect to the director axis and characterizes the degree of off-axis "wobbling" about the motional
axis. This order parameter has values wtiich range between O and 1. A value of zero indicates that
the angular fluctuations about the motional axis are so large that no orientation is preferred while a
value of S, = 1 indicates a narrow distribution about the average angle. The other order parameter
Si is referred to as the geometrical order parameter and is sensitive to the average angle 0, between
the C-D bond and the lipids long molecular axis and thus also provides us with information on

molecular conformation. This intemal order parameter for the choline headgroup reflects the
statistical distribution of an instantaneous orientation about a preferred orientation, averaged over
tirne and al1 the m o l d e s in the sarnple. Therefore it is this average orientation of the choline moeity
which changes in this model.
Roux et al. (1989) formalized this expression by introducing an "equilibrium" angle of tilt of
the choline group which resulted fiom two offsetting forces. The headgroup expenences a torque
which results fiom the dipole aligning itself with the electrical field while a countertorque resists this
due to intra- and intennolecular steric interactions. The discussion of this model and the extensions
introduced to it by Macdonald et al, (1991) begin by consideration of figure 2.3.2.
FIGURE 2.3.2 Orientation of the phosphocholine dipole moment with respect to the C-D bond and electric field emanating fiom a charged membrane surface.
The choline headgroup is represented by the PN vector which is assumed to be rigid body hinged
about the CrO tonion angle. The vector E represents the electrk field emanating fiom the surface
as well as both the axis of motional averaging and the normal to the bilayer surface. Although the
electrical field produced by the surface charges consists of both radial and axial elements, due to the
fast molecular axis rotations a net field will only by experienced in the direction parallel with this
motion axis ie. normal to the membrane surface. The final vector to be noted is D which represents
the C-D bond. The three angles defined in figure are y .O and 41 which represent the angles between
PN and D, D and E and finally PN and E, respectively.
The total torque exerted on a point charge q located at N about the hinge position is given
by:
where F is the electrical field force vector. The magnitude of the torque is shown to be:
where a is the surface charge density, PN is the length of PN, E , is the permitivity of free space and
E, is the dielectric constant of water. The surface charge density, for a binary mixture of charged and
neutral lipids, is defined as XZe/S where X is the mole fiaction of the charged species with valence
2, e being the elementary charge, and S the cross sectionai area occupied by the lipid, assumed to
equivalent for double chained lipids such as PC, PG and DOTAP (68 A').

For a purely neutral surface charge the PN vector is known to Lie within 30' of the bilayer
surface and this represents the equilibrium situation where al1 forces acting on the headgroup sum to
zero. When a torque is exerted on the headgroup due to an electrostatic field the preferred torsion
angle 4 wiii be resisted by an interna1 rotation potential, modelled as a countertorque of magnitude:
[ ~ , l = K sin (@ - 60)
where K is a force constant. Under al1 surface charge States an equilibrium is met where the forces
cancel each other, such that:
z + T , = O (2 -42)
By substituting equations 2.40 and 2.41 into equation 2.42 the equilibrium position of the choline
headgroup is determined to be:
where C = OAK-' + cos 60 / sin 60 and A = q PN / ZE,E, and 4 = 60' at equilibrium. Thus for
o < 0, C#I is shown to increase while the opposite is true for o > O. The resistance to changes in @
become effective as it approaches 90' due to intermolecular hard core repulsions.
Now that there is an expression for the dependence of 4 on the surface charge density the
next step is to derive the dependence of Avi on @. This can be accomplished by relating the angle 0,
the angle between the C-D bond vector and a i s of motional averaging, in equation 2.38 to the angle
$. The addition theorem for spherical harmonies (Rose, 1957) provides the desired relationship:

P2(cose) = PL(cos~)P2(c~sy) + 3sin4 cos4 siny cosy cosa + 3/4 sin2+ sin? cos(2a) (2.44)
where PL(x) = % (3 x2 - 1) and al1 angles are defined in figure 2.3.2. Through modelling of X-ray
crystallography data, Pearson and Pascher (1979) determined that the angle y = 90'. Thus, equation
2.44 reduces to:
Substituting equation 2.45 into 2.38 produces the relationship between the quadrupole splitting and
4:
By turther substitution ofequation 2.43 into the above equation the relationship is made between the
quadrupolar splitting and the surface charge density. such that:
The angle a, which is dehed in figure 2.3.2 as the dihedral angle of the C-D bond in the coordinate
61

system of the headgroup vector PN, is fked by the molecular geometry and does not change with
rotation of the choline headgroup and is thus treated as a constant. Therefore cos(2a) may be
estimated by substitution of the quadmpole splitting and $ = 60' for the case of neutraiity for both
the a and p segments. Macdonald et al, (1 99 1) chose a value of S, = 0.25 for both positions and
determined two values for cos(2a) (Marassi, Phi3 thesis) due to the fact that the sign of the
quadrupole splitting is not expressly written in equation 2.38 and cari be taken to be either positive
or negative. The values of a were tabulated and chosen for both deuterolabeling positions such that
the correct experimental response of the 'H NMR quadrupole splitting was replicated for the specific
membrane surface charge. Finally, through substitution of the remaining constants into equation 2.47.
Macdonald et ai, (1991) were able to reproduce al1 the main features of the quadrupole splitting
dependence on surface charge through this model. The reproduced features included the
counterdirectional effect of positive versus negative charge on the quadru polar splittings from eit her
of the individual deuterolabeling positions as well as the opposite effects in change of quadmpole
splittings for POPC-a-d, and POPC-P-d2 for the same surface charge. The greater sensitivity of the
quadmpole response to positive versus negative charges as well as the non-linear dependence of
change in quadmpole splittings at extreme surface charge densities were also reproduced as well as
the greater sensitivity of Av, versus Avp.

3. MATERIALS AND METHODS
3.1 M a t e r i a l s
Solvents. Reagent grade pyrÏdine was dried by refluxing over calcium hydride followed by
sodium hydride. Reagent grade diethyl ether and tetrahydrotùran (THF) were dried over sodium
metal using benzophenone as an indicator- Chloroform (HPLC grade) used for the synthesis of DC-
CHOL was dned over phosphorus pentoxide and then distilled ont0 motecular sieves.
Reagertts and Chernimis. 3-Dimethylamino- 1-2 -propanediol, 2,4,6-triisopropylbenzene-sulfonyl
chioride (TPS), tetraphenylboron (TPB), cholesteryl chloroformate, N,N-dimethyl-ethylenediarnine,
iodomethane-d, and deuterium depleted water were purchased from Aldrich (Milwaukee, W).
Oleoyl chioride was obtained fiom Sigma (St. Louis, MO).
Phosphoiipids. Amphiphifes and Polyeiecfroly~es. Non-deuterated phosphoIipids were
purchased fiom Avanti Polar Lipids ( Alabaster. AL) without hrther purification. 1 -palmitoyl-2-
oleoyl-SI-glycero phosphatidic acid (POPA) was dried by evaporation with dry pyndine prior to use
in synthesis. Non-deuterated DOTAP (1 -2-dioleoyl-3-trimethylaminopropane) was obtained from
Avanti Polar Lipids while CTAB was purchased fiom BDH (Toronto, ON). Poly(adeny1ic acid)
potassium salt (PolyA, MW 7 000 000, degree of polymerization N = 18 000) and poly(l-glutamic
acid) sodium salt (PGLU, MW = 80 000, N = 550) were obtained fiom Sigma (St. Louis, MO).
Poly(acrylic acid) sodium sait (PACq MW = 30 000, N=320) and poly(sodium 4- styrene sulfonate)
(PSSS, MW = 70 000, N = 340) were purchased fiom Aidrich. Poly(styrene sulfonate) sodium salt.
molecular weight kit, (MW = 780 000, 100 000, 35 000 and 4 600 with N = 3790, 485, 170 and 22)
63
was purchased from Polysciences, Inc. (Wamnsoq PA). OligoS, a phosphorothioate
oligonucleotide (MW = 7 183, N = 21, 5'-GCCGAGGTCCATGTCGTACGC-3'). was a @fi from
ISIS Phmaceuticals (Carlsbad, CA).
3.2 Syntbesis of Choline Deuterated Phospholipids
The phosphatidylcholine derivative of 1-palmitoyl-2-oleoyl-mglycero phosphatidic acid was
prepared in the L isomer form. The headgroup deuterated POPC was synthesized by coupling the
specifidly deuterated choline headgroup with POPA using TPS as the condensing agent (Aneja et
al., 1970). Tetraphenylborate (TPB) was used as an organic transfer agent to solubilize the choline
salt in pyridine prior to its coupling with POPA.
Choline-a-d2 TPB
Choline-a-d2 TPB was prepared according to the method of Harbison and Griffin ( 198 1 ) as
shown in Scherne 2.1. The first step involves the reduction of N,N-dimethylglycine ethyl ester with
lithium aluminum deutende ( L i i J . 2g (48 rnmol) of LiAiD, are suspended in 100 mL of dry THF.
The mixture was stirred until homogeneous. 10 mL (70.7 mmol) of N.N-dimethylglycine ethyl ester
was dissolved in 50 mL anhydrous THF and was then added dropwise to the mixture over the course
of 45 min. The mixture was then gently shed and refluxed for an hour. The reaction was quenched
by the slow addition of 2 mL of distilled water, followed by 2 mL of 15% w/v NaOH and then 6 rnL
of distilled water, in order to decompose excess LIAU),. The solution was then stirred for
approximately 1 hour until the evolution of hydrogen gas ceased. The inorganic salts were removed
by filtering the mixture through a sintered glass fùmel and washing them with 300 - 400 mL of
diethyl ether. The combined filtrate was then reduced to approximately 100 mL by rotary
evaporation and 15 mL (240 rnmol) o f iodomethane were added and the mixture was stirred in the
dark ovemight at room temperature. The solvent was then removed by rotary evaporation and the

residue taken up in 100 mL of distilled water and then washed with 100 mL of diethyl ether. The
aqueous layer was then divided evenly between two 150 rnL centrifiige bottles and to each was added
75 rnL of a NaTPB solution created by adding 34g of NaTPB to 150 mL of water. The result is a
white precipitate of choline-a-dl TPB salt which was subsequently centrifùged for 20 min at 5000
rpm (4000Xg). The solvent was decanted and the precipitate was washed 4x with 100 mL of distilled
water. The choline salt was then dried azeotropically with toluenelethanoi (20/75 v/v) and then
recrystallized &ce from hot acetonitrile. The choline-a-d2 TPB salt was then coliected as
transluscent hexagonal crystals which were dried under high vacuum and stored at -20 OC. Yield: 1 8g
(70%).
'H NMR in DMSO-d6, 200 MHz: 8 = 3.10 ppm, singlet, 9H methyl choline protons; 8 =
3.35 ppm, triplet, 2H P-choline protons; 8 = 5.26 ppm, broad multiplet, 1H choline OH; 6 = 6.80
ppm. multiplet, 4H TPB para protons; 8 = 6.90 ppm, multiplet, 8H TPB meta protons; 6 = 7.20
ppm, multiplet, 8H TPB ortho protons.
Scheme 2.1
Choline-P-d, TPB
Choline-P-d, TPB salt was produced by a combination of methods by Aloy and Rabaut ( 19 13)
and Harbison and Griffin (198 1) as illustrated in Scheme 2.2.
Cyarmnethylbenrmk 7 g of NaCN are weighed out directly in a flask and then dissolved
in 25 rnL of distilleci water. The solution was stirred for 20 min while being cooled in an ice bath at
O OC. 1 1 rnL (146 mrnol) of 37% (v/v) formalin in water were added dropwise and low temperatures
were maintained by replenishing the ice, since the reaction is exothermic. To the clear solution 16
rnL of benzoyl chloride were added dropwise and the mixture was stirred vigorously for 2 tus.
Cyanomethylbenzoate fonns oily droplets in solution and it was extracted with 5x 100 m . portions
of diethyl ether. The ether solution was then washed with 300 mL of O. 1 M NaOH in order to
remove benzoyl alcohol. The ether was then removed by rotary evaporation and the product purified
by vacuum distillation (125 OC under reduced pressure) to yield a colourless oil. The product
crystallized as long needles at -20 OC. Yield: Zog (84%).
'H NMR in CDCl,, 200 M H i : 8 = 5.10 ppm, singlet, 2H methylene protons; 6 = 7.45 ppm,
triplet, 2H meta benzyl protons; 6 = 7.62 pprn, triplet, IH para benzyl proton; 8 = 8.10 ppm, doublet,
2H ortho benzyl protons.
Cholirze-pd2 77%. 4 g (95 mrnol) of LiAD, were suspended in 100 mL of dry THF and
stirred until there was a homogeneous mixture. 9.5 g (59 mrnol) of cyanomethyl benzoate were
dissolved in anhydrous THF and added dropwise to the L A D I solution. The mixture was then gently
refluxed for 3 hrs. Excess L i , was then decomposed by the addition of 4 mL of water, followed
by 4mL of 15% NaOH and then 4 mL of water. The mixture was stirred and allowed to sit for 1 hr,
until the evolution of gas ceased. The insoluble inorganic salts were filtered by suction through a

sintered glas fùnnel and washed with approximately 300 mL of diethyl ether. The filtrate was then
reduced to 150 m., by rotary evaporation, and 50 mL of 10% NaOH (w/v) were added followed by
1 5 mL (240 mmol) iodomethane and the helutuion s h e d in the dark ovemight . The solution was
evaporated to a small volume, diluted to 100 mL with water and washed with 2x 100 mL ponions
of diethyl ether in order to rernove benryl alcohol. To the aqueous layer was added NaTPB solution
(34g of NaTPB in 150 mL of water). The white precipitate of choline-P-d, TPB was poured into a
sintered glass funnel and washed with copious amounts of water. The product was then dned and
punfied as described above. Yield: 3.8g (1 5%).
'H NMR in DMSOd, 200 MHz: 6 = 3.10 ppm singlet, 9H methyl choline protons; 6 = 3 -80
ppm, multiplet, 2H a-choline protons; 6 = 5.30 ppm, singiet, 1H choline OH proton; 6 = 6.80 ppm,
multiplet, 4H TPB para protons; 6 = 6.90 ppm, multiplet, 8H TPB meta protons; 6 = 7.20 ppm,
multiplet, 8H TPB ortho protons.
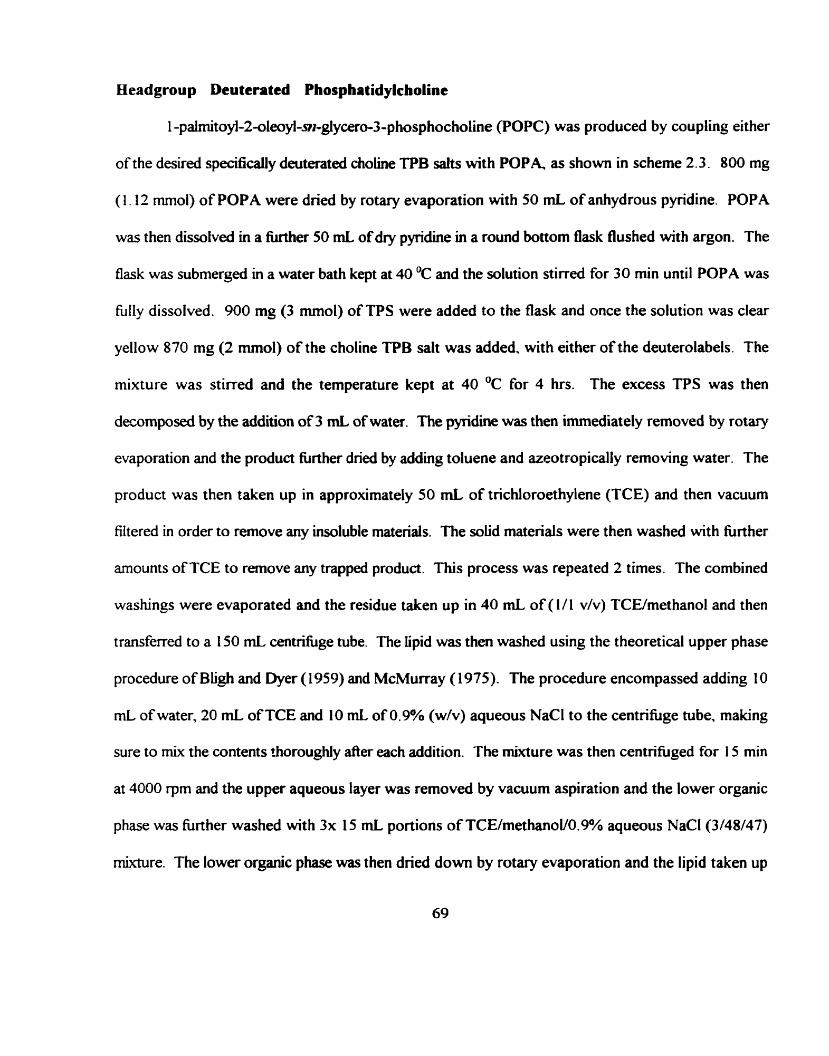
Beadgrou p Deuterated Phosphatidylcholine
1 -palmitoyl-2-oIeoyl-~1t-giycer0-3-phosphocholine (POPC) was produced by coupling either
of the desired specifically deuterated choline TPB d t s with POP4 as s h o w in scheme 2.3- 800 mg
(1.12 mmol) of POPA were dried by rotary evaporation with 50 rnL of anhydrous pyridine. POPA
was then dissolved in a fùrther 50 mL of dry pytidine in a round bottom flask flushed with argon. The
flask was submerged in a water bath kept at 40 OC and the solution stirred for 30 min until POPA was
hIIy dissolved. 900 mg (3 mmol) of TPS were added to the flask and once the solution was clear
yellow 870 mg (2 mmol) of the choline TPB sait was added, with either of the deuterolabels. The
mixture was stirred and the temperature kept at 40 OC for 4 tus. The excess TPS was then
decomposeci by the addition of 3 mL of water. The pyridine was then immediately removed by rotary
evaporation and the product fiirther dried by adding toluene and azeotropically removing water. The
product was then taken up in approximateIy 50 rnL of trichloroethylene (TCE) and then vacuum
fiItered in order to remove any insoluble materiais. The solid materials were then washed with tùrther
amounts of TCE to remove any trapped product. This process was repeated 2 times. The combined
washings were evaporated and the residue taken up in 40 mL of ( l / l v/v) TCE/methanol and then
transferred to a 150 mL centrifuge tube. The lipid was then washed using the theoretical upper phase
procedure of Bljgh and Dyer (1959) and McMurray (1975). The procedure encompassed adding 10
rnL of water, 20 rnL of TCE and 10 mL of 0.9% (w/v) aqueous NaCl to the centrifùge tube, making
sure to mùc the contents thoroughly afler each addition. The mixture was then centrifùged for 15 min
at 4000 rpm and the upper aqueous fayer was removed by vacuum aspiration and the lower organic
phase was fùrther washed with 3x 15 rnL portions of TCE/methanoV0.9% aqueous NaCI (3/48/47)
mixture. The lower organic phase was then dried down by rotary evaporation and the lipid taken up

in a ( 1/1 V/V) chlorofonn / methanol mixture. The product was then passed through 100g (capacity
0.5 - 0.8g of lipid100g resin) of Amberlite mixed-bed ion exchanger (BDH, Toronto, ON). The
Arnberlite is prewashed with methanol and the solvent is exchanged with CHCl, / MeOH (11 l v/v).
The tipid is applied to the colurnn and eluted. 125 mL -ions are coiiected and the elution of POPC
is monitored with TLC on silica gel plates (Kieselgel 60) using the solvent systern of
chloroform/methanoi/acetone/ acetic acid/distilled water ( 1 O/4/4/2/ 1 v/v). The TLC plates were
visualized in an iodine tank POPC had an R, of 0.25 in this system while POPA has a value of 0.8.
The POPC fi-actions were pooled and the solvent removed and POPC was fùrther p~rified by acetone
precipitation (Kates, 1972). In this step a 1-2 mL chloroform solution of POPC was added to a 1 5
rnL centrifùge tube with 10 m . of acetone, gently warming it to dissolve POPC. The centrifùge was
then cooled to -20 OC and the POPC was precipitated. The mixture was centrifûged at -20 OC for 10
min at 6000 rpm. The supernatant was decanted and the procedure repeated twice. The final product
was characterized by TLC (already described) 'H NMR and 'H NMR. Yield: for POPC-a-d,: 530
mg, 74%; for POPC-0-d,; 600 mg, 86%.
'H NMR in deuterium depleted water, 300 MHz: Av, = 6.4 kHz and 5.8 W for 100°/0
POPC-a-d2 and POPC-P-dZ, respectively.
'H NMR in CDCI,, 200 MHz: 8 = 0.84 ppm, triplet, 6H acyl methyl protons; 6 = 1.24 ppm.
singlet, acyl methylene protons; 6 = 1.60 ppm, multiplet. 4H acyl P-methylene protons: 6 = 2.30
ppm, multiplet, 4H acyl a-methylene protons; 6 = 3.37 ppm, singlet, 9H choline rnethyl protons; 6
= 3 -60 ppm, singlet, 2H choiine-P protons; 6 = 3.95 ppm, multiplet, 2H giycerol-3 protons; 6 = 4.15
ppm, multiplet, 2H glycerol-1 protons; 6 = 4.35 ppm, singlet, 2H choline-a protons; 6 = 5.20 ppm,
multiplet, 1H glycerol-2 proton; 6 = 5.35 ppm, triplet, 2H olefinic protons.

TPS - pyridine
Scheme 2.3
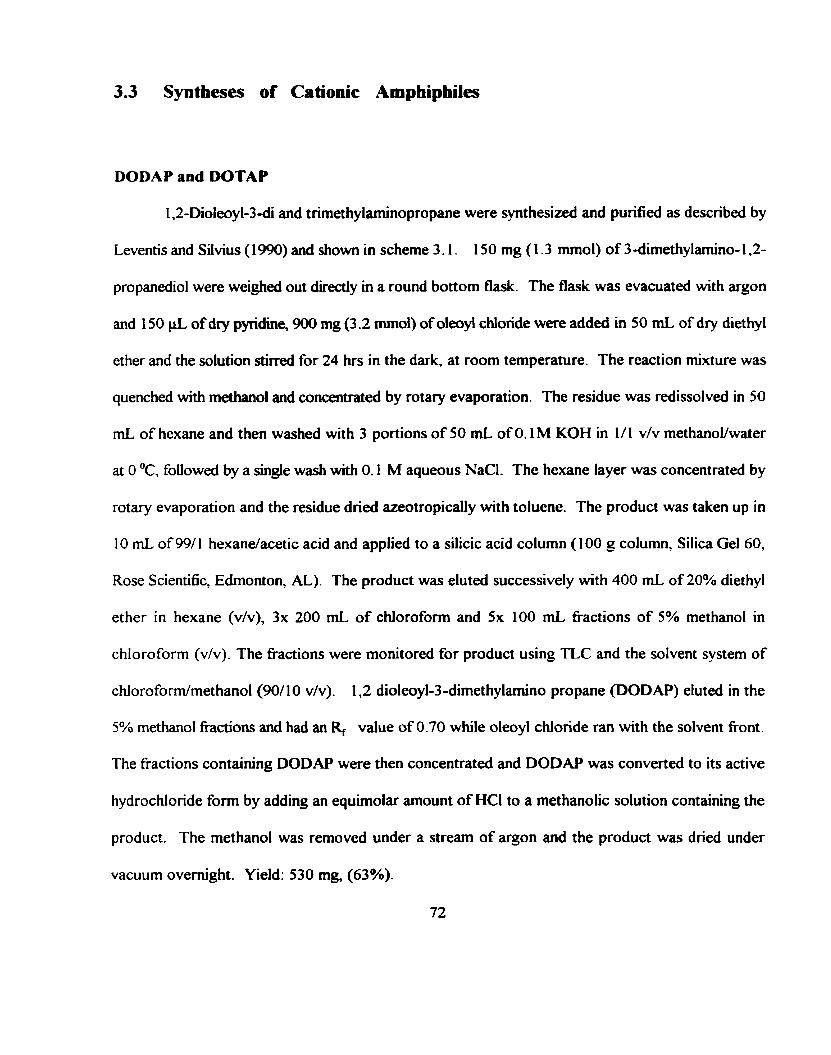
3.3 Syntbeses of Cationic Amphiphiles
DODAP and DOTAP
1,2-Dioleoyl-3-di and trimethylaminopropane were synthesized and purified as descnbed by
Leventis and Silvius (1 990) and shown in scheme 3.1 . 1 50 mg ( 1.3 rnmol) o f 3 -dimethylarnino- 1,2-
propanediol were weighed out directly in a round bottom flask. The flask was evacuated with argon
and 150 pL of dry pyridine, 900 mg (3 -2 mmol) of oleoyl chloride were added in 50 mL of dry diethyl
ether and the solution shed for 24 hrs in the dark, at room temperature. The reaction mixture was
quenched with methanol and concentrated by rotary evaporation. The residue was redissolved in 50
mL of hexane and then washed with 3 portions of 50 mL of O. IM KOH in 1/1 v/v methanovwater
at O OC, foilowed by a single wash with O. 1 M aqueous NaCl. The hexane layer was concentrated by
rotary evaporation and the residue dried azeotropically with toluene. The product was taken up in
10 mL of 99/ 1 hexandacetic acid and applied to a silicic acid column (100 g column, Silica Gel 60,
Rose Scientific, Edmonton, AL). The product was eluted successively with 400 mL of 20% diethyl
ether in hexane (v/v), 3x 200 mL of chloroform and 5x 100 m . fiactions of 5% methanol in
chloroform (v/v). The fractions were monitored for product using TLC and the solvent system of
chloroform/methanol (!JO/ 10 v/v). 1,2 dioleoyl-3-dimethylamino propane (DODAP) eluted in the
5% methanol fiactions and had an R, value of0.70 while oleoyl chloride ran with the solvent fiont.
The fractions containing DODAP were then concentrated and DODAP was converted to its active
hydrochioride form by adding an equimolar amount of HCl to a methanolic solution containing the
product. The methanol was removed under a Stream of argon and the product was dried under
vacuum ovemight. Yield: 530 mg, (63%).
72

'H NMR in CDCI,, 200 MHz: b = 0.9 ppm, tnplet, 6H, oleoyl methyls; 8 = 1.3 ppm, broad
singiet, 40H oleoyl methylene protons; 6 = 1.65 ppm, multiplet, 4H oleoyl P-methylenes; 8 = 2.05
ppm, multiplet, 8H a-methylenes to double bond; 6 = 2.28 ppm siiet , 6H amino methyls; 8 = 2.35
ppm. tnplet, 4H, oleoyl a-methylenes; b = 2.47 ppm, triplet, 2H, C 1-propyl protons; 8 = 4.1 and
4.35 ppm, doublet of doublets, 2H, gerninal coupling (J = 12 Hz) and vicinal coupling with C2
proton (J = 3 -6 Hz and 6.1 Hi), C3-propyl protons (inequivalent H, and H, ); 6 = 5.2 ppm,
multiplet, 1 H, CIL-propyl proton; 6 = 5.3 5 ppm, triplet, 4H oleoyl o l e f i ~ c protons.
DOTAP. 500 mg (0.73 mrnol) of DODAP were added to 100 m . of dry diethyl ether. To the
mixture was added 0.48 rnL (7.7 mrnol) of methyl iodide and the flask sealed and the solution s h e d
in the dark for 36 hrs. The solvent was then removed by rotary evaporation and the product purified
by two acetone precipitations. The lipid was then chromatographed on a Sio-Rad AG 1-X4 anion
exchange resin prepared in the chloride form (Bio-Rad, Mississauga, ON) in order to conven liom
the iodide f o m . The product was put on the colurnn in a minimal amount of 111 vlv o f
chloroforrdmethanol and was eluted fiom the column with 300 rnL of the same solvent system. The
punty of DOTAP was monitored as desaibed for DODAP. The 'H NMR spectmm was identical to
that of DODAP with the exception of the shift o f the 6H amino methyl protons liom 6 = 2.28 ppm
to 6 = 3.55 ppm for the 9H arnino methyl protons. The punty o f the product was determined based
on the absence of the 8 = 2.28 peak. Yield: 285 mg (56%).
DOTAP- y-d,. The procedure was identical t o the synthesis of DOTAP above. The amino
functionality was quatemked with an excess of methyl-d, iodide t o produce DOTAP with one
deuterated aminomethyl g o u p . The 'H NMR spectrum was identical t o that o f DOTAP with the
exception that the peak at 6 = 3.55 pprn contained only 6 H arnino methyl protons.

ether
Scheme 3.1

DC-CHOL
DC-CHOL was synthesized and characterized according to the method of Gao and Huang
( 1 99 1 ) as shown in scheme 3 -2. 2.25 g (5 mmol) of cholesteryl chloroformate in 20 mL of dry
chloroform was added dropwise to a flask containhg 2 rnL ( 18 mmol) N,N-dimethylethylenediamine
in 20 mL of dry chloroform submersed in an ice bath kept at O OC. The mixture was stirred and
allowed to react for 1 hr and the solvent was then removed. The fina1 product was recrystallized
twice from absoiute ethanol at -20 OC and dned under vacuum yielding a compound which
chromatographed as a single spot on TLC CR, = 0.58 in 65/35 v/v chloroform/methanoi eluent).
Yield: 0.56 g (22%).
'H NMR in CDCI,, 200 MHz: b = 2.18 ppm, singlet, 6H amino rnethyl protons; 6 = 2.36
ppm, triplet, 2H C 1 -ethyl protons; 6 = 3.2 1 ppm, multiplet, 2H C2-ethyl protons; 6 = 5.18 ppm.
broad triplet, 1 H amido proton; 6 = 5.35 ppm, broad triplet, 1H olefinic cholesterol proton.
TC-CHOL- y 4 820 mg ( I -63 mrnol) of DC-CHOL were reacted wit h 83 0 mg (5.77 mrnol)
of methyl-d, iodide in 50 mi, of dry diethyl ether for 24 hrs in the dark at room temperature. The
solvent was removed by rotary evaporation and the product was then punfied by two acetone
precipitations and run through an anion exchange colurnn (chloride form) as described above for
DOTAP. Finaiiy TC-CHOL-y-d, was recrystailized fiom absolute ethanol and dried under vacuum.
The purity of the compound was monitored by TLC and 'H NMR. Yield: 220 mg (26%). The 'H
NMR spectmm was identical to DC-CHOL with the exception of the shifi in the aminomethyl peak
(6H) of 6 = 2.18 ppm to 6 = 3.35 ppm.

c:: ' 1 diethyl ether
CD3 i
Scheme 3.2
CTAB-y-d9
CTAB-y-c& was synthesized by the methylation of hexadecyiamine with methyl-d, iodide as
described by Semchyschyn et al. (1996).
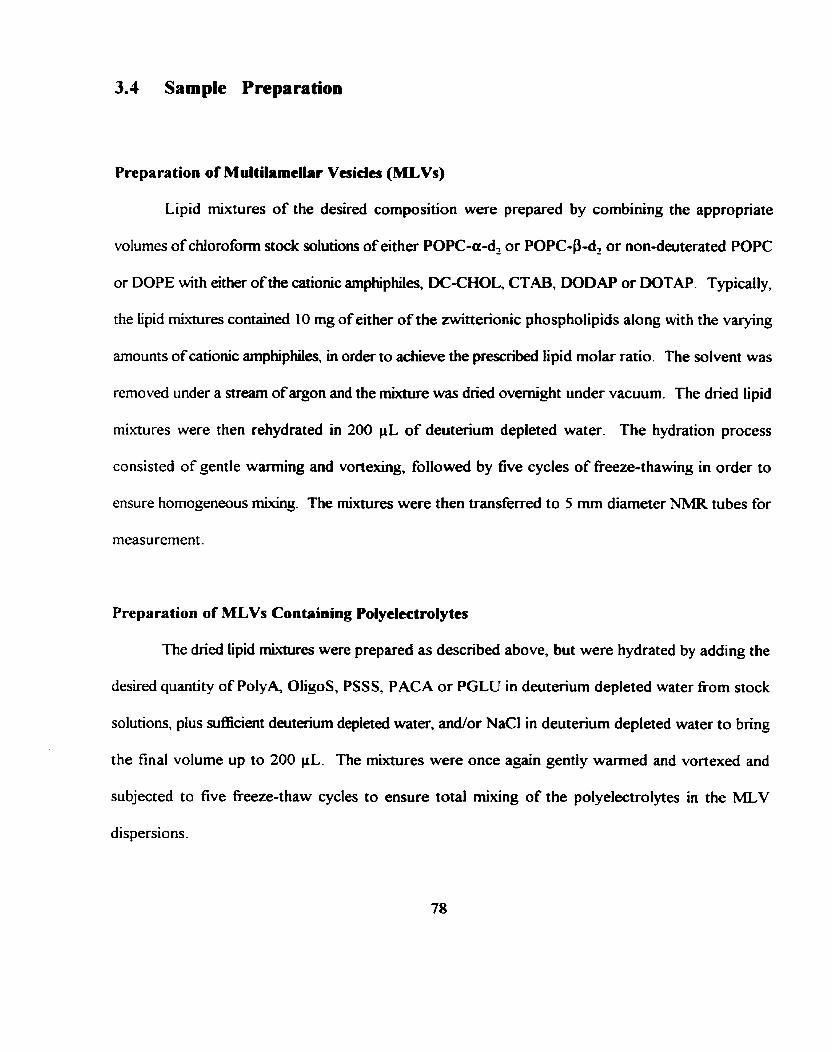
3.1 Sample Preparation
Preparation of Multilamellar Vtsicles (MLVs)
Lipid mixtures of the desired composition were prepared by combining the appropnate
volumes of chlorofonn stock solutions of either POPC-a-d, or POPC-P-d2 or non-deuterated POPC
or DOPE with either ofthe cationic amphiphiles, DC-CHOL, CTAB, DODAP or DOTAP. Typically,
the iipid mixtures containeci 10 mg of either of the zwitterionic phospholipids dong with the varying
arnounts of cationic amphiphiles, in order to achieve the prescribed lipid molar ratio. The solvent was
removed under a stream of argon and the mixture was dned ovemight under vacuum. The dried lipid
mixtures were then rehydrated in 200 PL of deuterium depleted water. The hydration process
consisted of gentle warming and vortexing, followed by five cycles of fieeze-thawing in order to
ensure homogeneous mixing. The mixtures were then transferred to 5 mm diameter NMR tubes for
measurement.
Preparation of MLVs Containing Polyelectrolytes
The dried lipid mixtures were prepared as described above, but were hydrated by adding the
desired quantity of Poly.4 OligoS, PSSS, PACA or PGLU in deuterium depleted water fiom stock
solutions, plus sufficient deuterium depleted water, andor NaCl in deuterium depleted water to bring
the final volume up to 200 PL. The mixtures were once again gently warmed and vortexed and
subjected to five tieeze-thaw cycles to ensure total mixing of the polyelectrolytes in the MLV
dispersions.
3.5 UV Difference Assay of Polyelectrolyte - Membrane Binding
Dried lipid samples were prepared as described above and a sufficient arnount of any of the
difKerent polyelectrolyte stock solutions were added to achieve the desired anionkation ratio. Further
deionized water andior NaCl solution was added to bring the final volume of the mixture to 300 pL.
The sarnples were then hydrateci and equiiibrated as described above, then centrifùged at 1 3 000 rpm
for 1 hr to pellet the iipid/polyelectrolyte mixtures. Approximately 200 p L of the supernatant was
removed, diluted and passed through a Centricon-500 microconcentrator (Amicon, Oakville, ON)
to remove any unpelleted lipid, by centrifugation at 4 000 rpm for 15 min. The filtrate, containing
any unbound polyelectrolyte chahs was ftrther diluted until its UV absorbante fell into the
concentration regirne where Beer's law was obeyed. as measured using a Hewlett Packard 8452A
Diode Amy spectrophotometer. The polyelectrolyte concentration in the original supernatant was
then calcdated fiom a standard curve, and the arnount bound was calculated ffom the difference with
respect to the initial concentration.
3.6 Solid State NMR Measurements
'H NMR Spectroscopy
3 NMR spectra were recorded on a Chemagnetics CMX300 NMR spectrometer operating
at 45.98 MHz, using a Chemagnetics wideline probe, equipped with a 5 mm solenoid coil. The
quadrupole echo sequence (Davis et al., 1976) was employed (90°x - r - 9@ y - s - acq) using
quadrature detection with complete phase cycling of the pulse pairs and a 90" pulse length of 2.0 ps.
an interpulse delay of 30 ps, a recycle delay of 100 ms, a spectral width typically between 50 - 100
kHz and a 2K data size.
Longitudinal (T3 und Transverse (T,4') ReIaxatio~i Times. The longitudinal relaxation tirne, T,,
was measured by the combined inversion recovery and solid echo sequence (180°x - t - 9@x - T -
90% - 7 - acq) by vatying the t h e t, typically between 1 ps to 30 ms. The transverse relxation times
(TT ) were obtained 6om the echo intensity as a fûnction of the separation s between the two 90'
pulses in the quadrupolar echo sequence. 1/TzPc corresponded to the dope in a semilogarithmic plot
of the normalized intensity at the peak of the echo versus the time t = 2 ~ . Al1 measurements were
perfonned at room temperature.
Temperature Dependence Studies. The temperature of the sample was controlled by passing air
first through a coi1 cooled in an ice bath and then through a sidearm resistance heater before entering
the probe. The temperatures were set at the low end of the temperature studies followed by heating
the sarnple progressively by lO0C and recording the spectmm. The temperature was equilibrated for
each spectmm for approximately 15 min before acquistion.

"P NMR Spectroscopy
"P NMR spectra were recorded on the same spectrometer operating at 12 1.25 MHz, using
a Chemagnetics double-resonance magic-angle spinning (MAS) probe but without sample spinning.
For hydrated MLV samples. the Hahn echo sequence (90% - 7 - 1 80°y - r - acq) with complete phase
cycling of the pulses and high power proton decoupling during acquisition was employed as
described by Rance and Byrd ( 1983). The 90' pulse length was 6.0 p. the echo spacing was 40 ps,
the recycle delay was 2 s, the spectrai width was 100 kHz, and the data size was 2K. T, relaxation
times were measured using a standard inversion-recovery protocal with Hahn echo detection, with
t typically varied fiom 1 ps - 2s. Tl relaxation times were measured fiom the dependence of the
signal intensity on the length of the detay in the Hahn echo sequence, typically between 30 ps - 30
ms.
"P NMR spectra of dry powders of PolyA and OligoS were recorded using a single-contact
cross-polarization technique combined with Hahn echo detection. In this instance the 'H 90' pulse
length was 4.9 ps, the contact time was 3.0 ms and the spectral width was 250 kHz.
Pake Pattern Spectral Line Shape Simulations
'H and "P NMR Pake pattern line shapes were simulated using a computer program, written
in Our laboratory, based on the tiling method introduced by Aiderman ef al. (1986). The simulation
variables include either the quadrupolar splitting, Av,, or the chernical shielding tensorial
components, O,,, a, a,,, and the h e width parameter, T,, and the intensity of a given Pake pattern.
The program, however, does not include provisions for T, asymmetry effects. This can sometimes
lead to a less than perfect appearance of the spectral shoulders of the experimental Pake pattern.

De-Pakoing of 'H NMR Spcctn
% NMR spectra were 'de-Paked ' as described by Stemin et al. ( 1 983) for the 90' orientation
of the Pake doublet.
4. RESULTS AND DISCUSSION
4.1 *H NMR Response of Phospbatidylcholine Headgroup to Binary
Mixtures with Cationic Amphiphiles
The use of cationic liposomes in the transfer of genes has become a popular method of gene
therapy. Cationic lipids are known to enhance the transport of genetic material across the plasma
membrane due to their ability to electrostatically condense DNA as well as targeting biomembranes
by binding to their typicaily anionic surface. Cationic lipids are very rare in nature though and this
has necessitated the synthesis of various lipids (Felgner et al, 1987; Behr et al, 1989; Leventis and
Silvius, 1990; Gao and Huang, 1991; Deshmukh and Huang, 1997). Although in recent years the
mechanism of gene transfer has been detennined, no definitive answers have been detennined as to
how the molecular structure of different amphiphiles lead to different propensities as gene transfer
agents, in order to design improved transfection agents. Obviously the rote played by electrostatics
in these techniques must be pivotal.
-% NMR of choline deuterated phosphatidylcholine is an approach for monitoring membrane
surface electrostatics. It has been used to characterize the binding of charged ligands to membrane
surfaces as well as to examine lateral phase separation of charged lipids and also to resolve differences
between two surfaces of a tipid bilayer membrane (Seelig et al, 1987; Macdonald, 1995; Macdonald,
1997). This technique is sensitive to the detailed topography of surface charge distribution.

4.1.1 'Fi Magnetic Resoaance Spectroscopy
In the studies presented here the membrane electrostatic surface response was determined for
three daerent cationic amphiphiles which have al1 previously been used in gene transfection studies.
The structures of the three cationic amphiphiles and a polyelectrolyte (polyA) are displayed in figure
4.1.1. Each of the three cationics are shown to contain either a tertiary or quaternary amino
headgroup, where the charge is located, attached to a hydrophobic moeity. In the case of CTAB
(cetyl trimethyl ammonium bromide) the hydrophobic group is a single chah C 16 group. In DC-
CHOL (3 P FI-(N',N'-dimethylaminoethane) carbamoyl] cholesterol) the hydrophobic group is a
sterot ring structure. DODAP (dioleoyl dirnethyl arnino propane), on the other hand, has a
hydrophobic moeity consisting of a double acyl chah group. The cationic lipids may be arranged
in the order CTAB > DC-CHOL > DODAP in terms of their hydrophile-lipophile balance (HLB)
(Griffin, 1949). This is an estimate of the polarity of a molecule obtained by sumrning up al1 the
individual chernicd groups in terms of their hydrophile versus lipophile contributions as detailed by
Davies and Rideai (1 963).
Each of the cationic amphiphiies produces a cationic surface charge when mixed with the
zwitterionic POPC as detected by 2H NMR of choline deuterated POPC. The fundamental
spectroscopic observations are show in figure 4.1.2, for the specific case of CTAB. The left-hand
column of spectra were obtained with POPC-a-d2 whereas the right-hand colurnn represent the
spectra obtained with POPC-P-d2. All spectra consist of a 'H MUR Pake doublet. which is
characteristic of liquid-crystalline lipids arranged in a bilayer arrangement. As already discussed in
the introduction., the quadrupolar splitting is measured as the fiequency separation between the two
maxima in the spectra. The central resonance line (O Hz) displayed in these spectra is due to the

H DC-CHOL
PolyA
FIGURE 4.1.1 Structures of the three cationic amphiphiles employed here and the polyelectrolyte PolyA (ie. polyadenylic acid). From top to bottom CTAB, DODAP, DC-CHOL and PolyA.
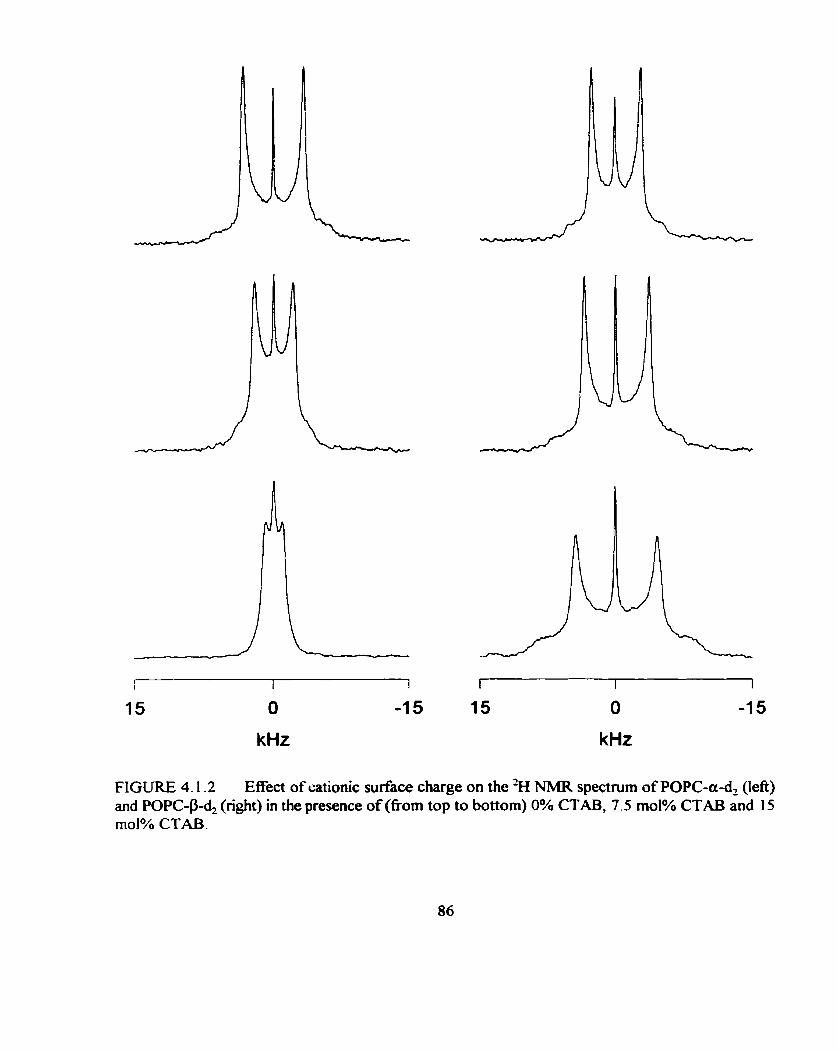
15 O -1 5 15 O -7 5
kHz kHz
FIGURE 4.1.2 Effect of cationic surface charge on the *H NMR spectrum of POPC-a-d2 (left) and POPC-9-4 (right) in the presence of (6om top to bottom) 0% CTAB, 7.5 mol% CTAB and 15 mol% CTAB.
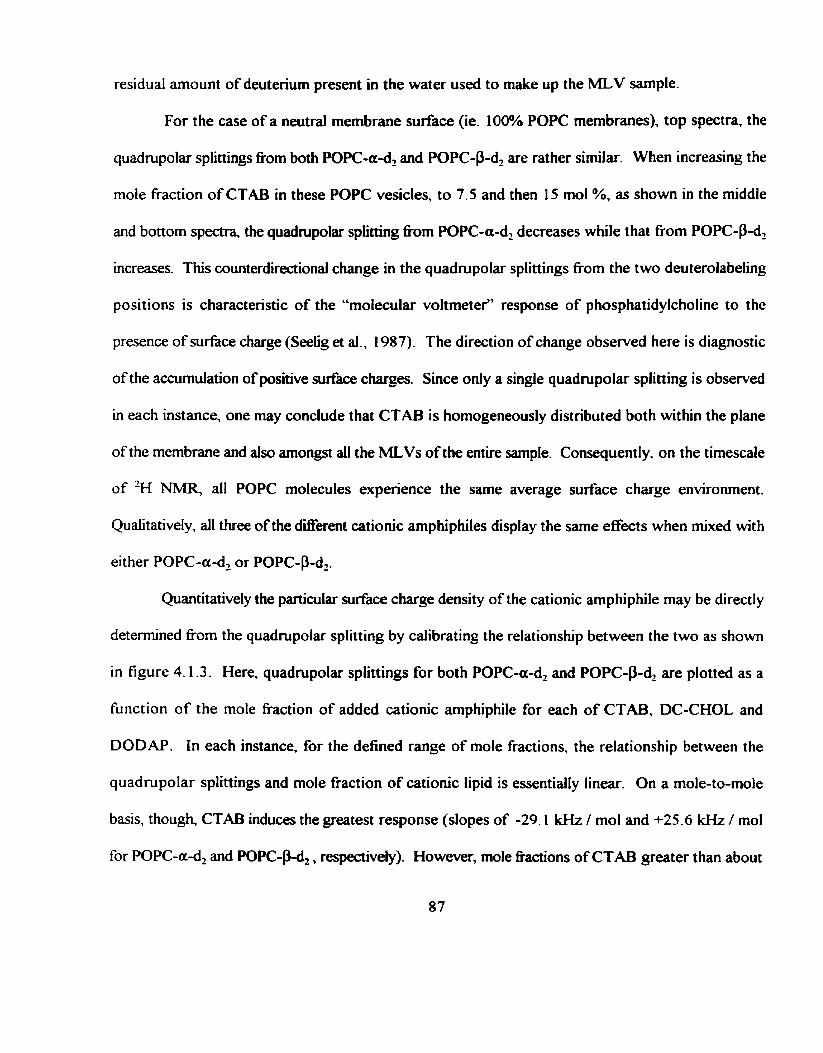
residud arnount of deutenum present in the water used to make up the MLV sample-
For the case of a neutral membrane surface (ie. 100% POPC membranes), top spectra, the
quadrupolar spiittings fiom both POPC-a-ci, and POPC-P-d2 are rather similar. When increasing the
mole fi-action of CTAB in these POPC vesicles, to 7.5 and then 15 mol %, as shown in the middle
and bottom spectra, the quacinipolar splitting 6om POPC-a-d2 decreases while that from POPC-P-d,
increases. This counterdiredonal change in the quadmpolar splinings from the two deuterolabeling
positions is characteristic of the "molecular voltmeter" response of phosphatidylcholine to the
presence of surface charge (Seelig et al., 1987). The direction of change observed here is diagnostic
of the accumulation of positive surface charges. Since only a single quadrupolar splitting is observed
in each instance, one may conclude that CTAB is homogeneously disttibuted both within the plane
of the membrane and also amongst ail the MLVs of the entire sarnple. Consequently. on the timescale
of 'H NMR, al1 POPC molecules experience the same average sunace charge environment.
Qualitatively, al1 three ofthe dserent cationic amphiphiles display the same effects when mixed with
either POPC-a-d2 or POPC-P-d2.
Quantitatively the particular surface charge density of the cationic amphiphile may be directly
determined f?om the quadmpolar splitting by calibrating the relationship between the two as shown
in figure 4.1.3. Here, quadrupolar splittings for both POPC-a-d, and POPC-P-d, are ploned as a
finction of the mole fraction of added cationic amphiphile for each of CTAB, DC-CHOL and
DODAP. In each instance. for the defined range of mole fractions, the relationship between the
quadmpolar splittings and mole -ion of cationic lipid is essentially linear. On a mole-to-mole
basis, though, CTAB induces the greatest response (slopes of -29.1 kHz 1 mol and +25.6 kHz / mol
for POPC-a-d2 and POPC-P-ci, , respectively). However, mole hctions of CTAB greater than about
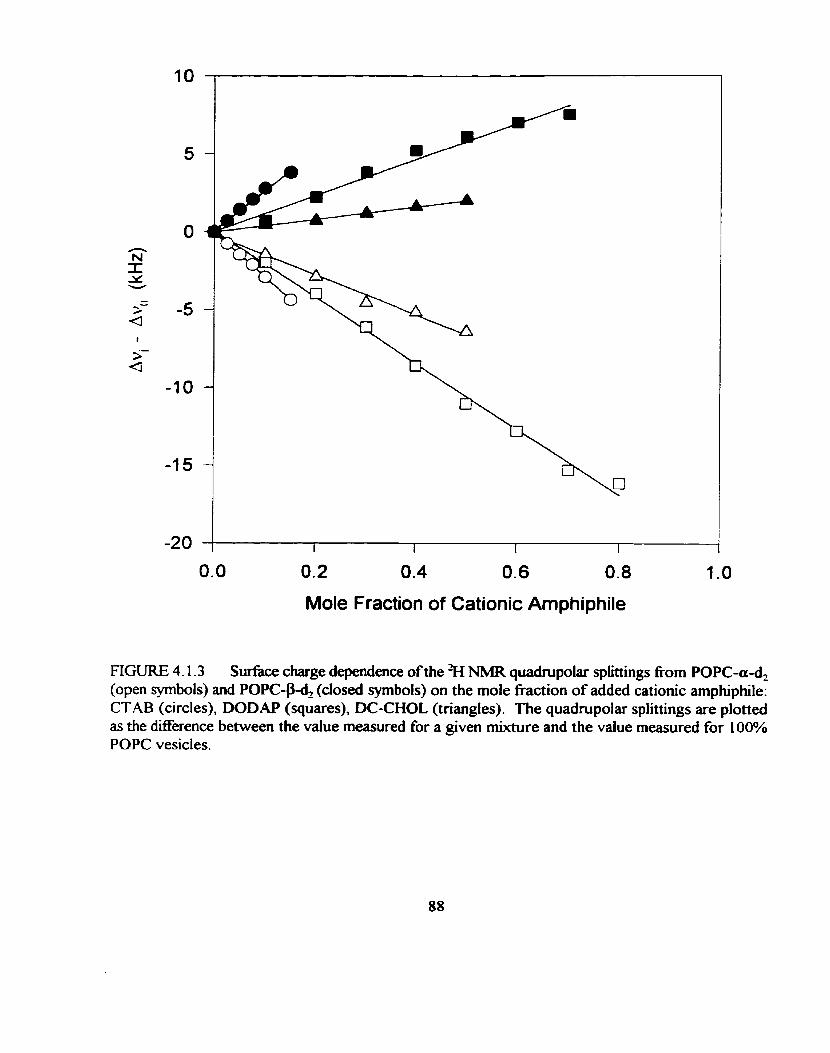
0.0 0.2 0.4 0.6 0.8 1 .O
Mole Fraction of Cationic Amphiphile
FIGURE 4.1.3 Sufice charge dependence of the %I NMR quadrupolar splittings fiom POPC-a-d2 (open symbols) and POPC-P-(S (closed symbols) on the mole fraction of added cationic amphiphile: CTAB (circles), DODAP (squares), DC-CHOL (triangles). The quadrupolar splittings are plotted as the difFerence between the value measured for a given mixture and the value measured for 100% POPC vesicles.

15 % lead to distruption of the bilayer due to its surfactant properties. DC-CHOL produced the
slightest response of the three cationic amphiphiles with slopes of -12.8 and 4.0 lcHz / mol for POPC-
a-d, and POPC-P-à, respectively. Levels of up to 50 mol % were used for DC-CHOL above which
broad 'H NMR spectra were produced, indicative of an inhomogeneous distribution of DC-CHOL
within the plane of the membrane. On the other hand, DODAP produced well defined spectra over
the widest range of molar ratios indicating that it remains homogeneously mked in POPC membranes.
DODAP also produced an intermediate response of the " molecular voltmete?' in that the calibrated
slopes for the POPC-a-d2 and POPC-g-d2 responses were -2 1.2 and 1 1.5 lcHz / mol. respectively.
Funher evidence of the distinctness of the -M NMR response of t he t hree cationic arnphip hiles
is obtained when a correlation is made between the quadrupolar splitting between POPC-a-d, and
POPC-B-d2 for a given level of added charge as shown in figure 4.1.4. The linearity of such an a-p
correlation plot suggests that the phosphatidylcholine headgroup undergoes a concerted
conformational change in response to sufiace charge. as already discussed. It has been generally
noted that most cationic species yield slopes of approximately -0.50 in such correlation plots (Scherer
& Seelig 1989; Beschiaschvili & Seelig, 199 1). For instance, it is calculated fiom figure 4.1.4 that
DODAP displays a slope of -0.53. However, CTAB produces a slope of -0.88, while DC-CHOL
displays a slope equal to -0.32. There appears to be a correspondence between the dope of an a-p
plot and the location or depth of a given charge relative to the plane of the choline headgroup of
PO PC (Beschiaschvili & Seelig, 1 99 1 ; Rydall & Macdonald. 1 992). For instance, aqueous ions,
which bind superficidly to the membrane surface in general produce a slighter response than
hydrophobic ions which are known to penetrate well into the bilayer proper (Beschiaschvili & Seelig,
1 99 1 ; Rydall & Macdonald, 1992).
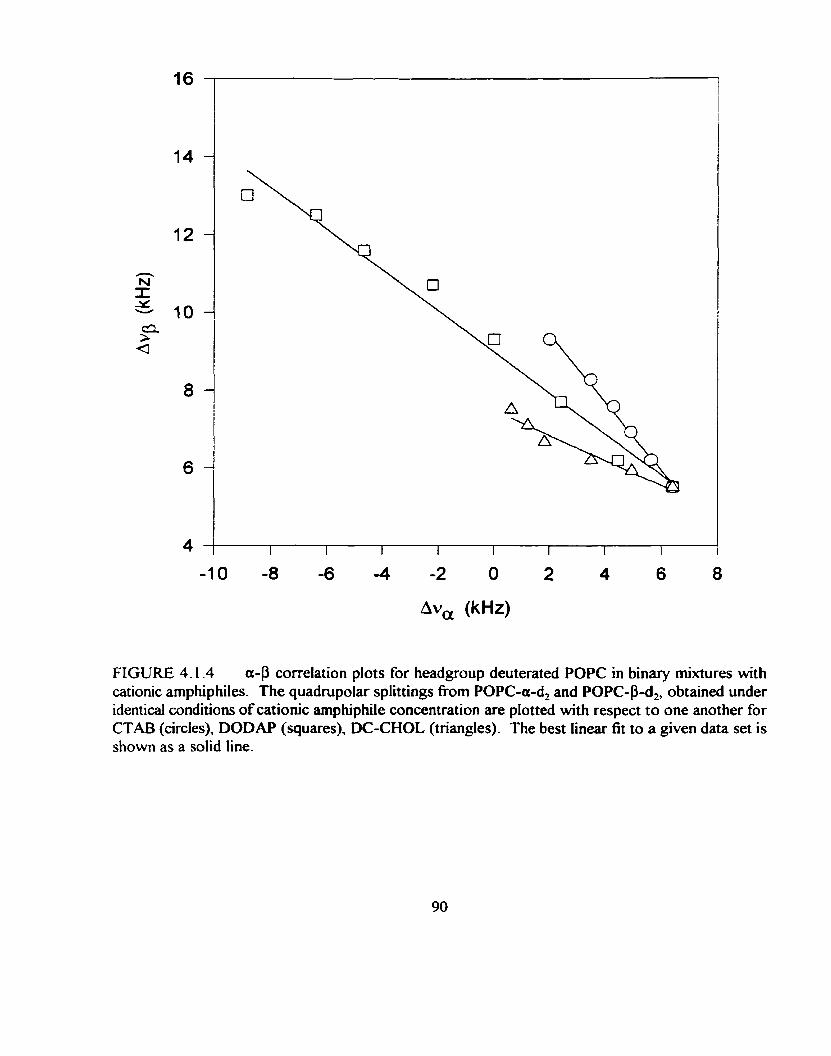
Av, (kHz)
FIGURE 4.1.4 a-p correlation plots for headgroup deuterated POPC in binary mixtures with cationic amphiphiles. The quadrupolar splittings fi-om POPC-a-d2 and POPC-P-d2, obtained under identical conditions o f cationic amphiphile concentration are plotted with respect to one another for CTAB (circles), DODAP (squares), DC-CHOL (tiangles). The best linear fit to a given data set is shown as a solid line.

The sensitivity of the "molecular voltmeter" response depends on a number of factors other
than the location of the charged group relative to the plane occupied by the phosphocholine group
of POPC. One factor is whether the charge is cationic or anionic. Another is the statistical
probability that POPC and the charged species 4 1 encounter one another. Since ail three
amphiphiles under consideration are cationic, they each display calibration constants greater than
comparable anionic species (Beschiaschvili & Seelig, 1990). Likewise, al1 three are sufficiently
hydrophobic that one expects them to penetrate deeply into the membrane proper. However, the
location of their charge relative to that of phosphocholine will depend on the length of any polar
spacer between the hydrophobic portion of the molecule and the charge carrier. In general, if the
charged portion of the molecule f d s to penetrate the polar headgroup region of the membrane it will
not be sensed by the "molecular voltmeter" (Rydall & Macdonald, 1992). The data obtained fiom
the a-p correlation plot in figure 4.1 -4 indicates that differences exist in the actual location of the
charged group between the three cationic amphiphiles. Yet. the three cationic amphiphiles differ in
other respects. For instance, CTAB is the only amphiphile which will be entirely charged at
physiological pH. DODAP and DC-CHOL. bearing only a tertiary amino headgroup with pKa7s in
the range of 8.5-9.0, wiil only be 90% charged at physiological pH. Another difference exhibited by
the cationic amphiphiles is the cross-sectional area that they occupy in the plane of the bilayer. The
single chained CTAB amphiphile will be expected to occupy only half the area as a double chained
lipid like DODAP. Consequently, at a given molar ratio CTAB produces a higher surface charge
density th&! by DODAP and thus a greater response. Also, on a 1 : 1 encounter bais of the cationic
amphiphile with POPC, the lateral separation between the charge of CTAB and choline headgroup
of POPC is much reduced in cornparison to DODAP which can fùrther contribute to increased

sensitivity of the ''voltmeter" (Beschiaschvili & Seelig, 1990). Finally, cholesterol and its derivatives
are notorious for demixing (Wst & Davis, 1990; McMullen & McElhaney, 1995). This suggests the
possibility that, even at lower rnolar ratios, POPC might not have the same statistical encounter
probability with DC-CHOL as it does with other cationic species which mix ideally, such as CTAB
or DODAP. Now whereas these 2H NMR results cannot decisively distinguish between the
possibilities it has been shown that the charge location can profoundly influence the efficacy of
transfection agents. For instance, Farhood et al., (1992) investigated a series of cationic cholesterol
derivatives similar to DC-CHOL in which the derivatives containing a succinyl spacer arm between
the substituted ethylenediamine and ring structure of the lipid were the most effective as transfection
agents.

4.2 'H NMR Evidence of Polyelectrolyte Induced Domain Formation
in Mixed Cationic Amphiphile + POPC Membranes
The three cationic amphiphiles CTAB. DC-CHOL and DODAP are of interest because of
their roles as agents of transfection of genetic material. Their interaction with DNA or RNA will be
primarily eiectrostatic in nature, although hydrophobic contributions must dso be considered to the
overall interaction energy. It is of interest, therefore, to examine the 'H NMR response of cationic
Iiposomes to the addition of DNA. In order to model the interaction of DNA to these surfaces a
model polyelectrolyte is used which possesses both the anionic sugar-phosphate backbone of RNA
as well as the hydrophobic bases, in single stranded form, polyadenylic acid (ie. poiyA). The
monomer structure of polyA was shown in Figure 4.1.1 and this particuiar polyelectrolyte is large
and has a degree of polymerization of approxirnately N = 18 000. The effects of added polyA on the
-% h m spectra of choline deuterated POPC mixed with cationic amphiphiles is illustrated in figure
4.2.1. using DODAP as the model cation. The top row of spectra show the 'H NMR spectra for
POPC-a-d, mixed with DODAP while the bottom row of spectra show the corresponding series of
spectra for POPC-P-d2. The details regarding the composition of the lipid mixtures, with each of the
different cationic amphiphiles, dong with the added amounts of polyA are displayed in table 4.2.1.
R e f e ~ g back to figure 4.2.1 . the left column of spectra represent the controls of the binary
mixture of lipids in the absence of any added polyA. The quadrupolar splittings are altered in a
manner expected for the presence of cationic surface charge relative to 100% POPC lipid bilayers.
The middle column of spectra shows the effect of adding polyA to the cationic lipid bilayers. The
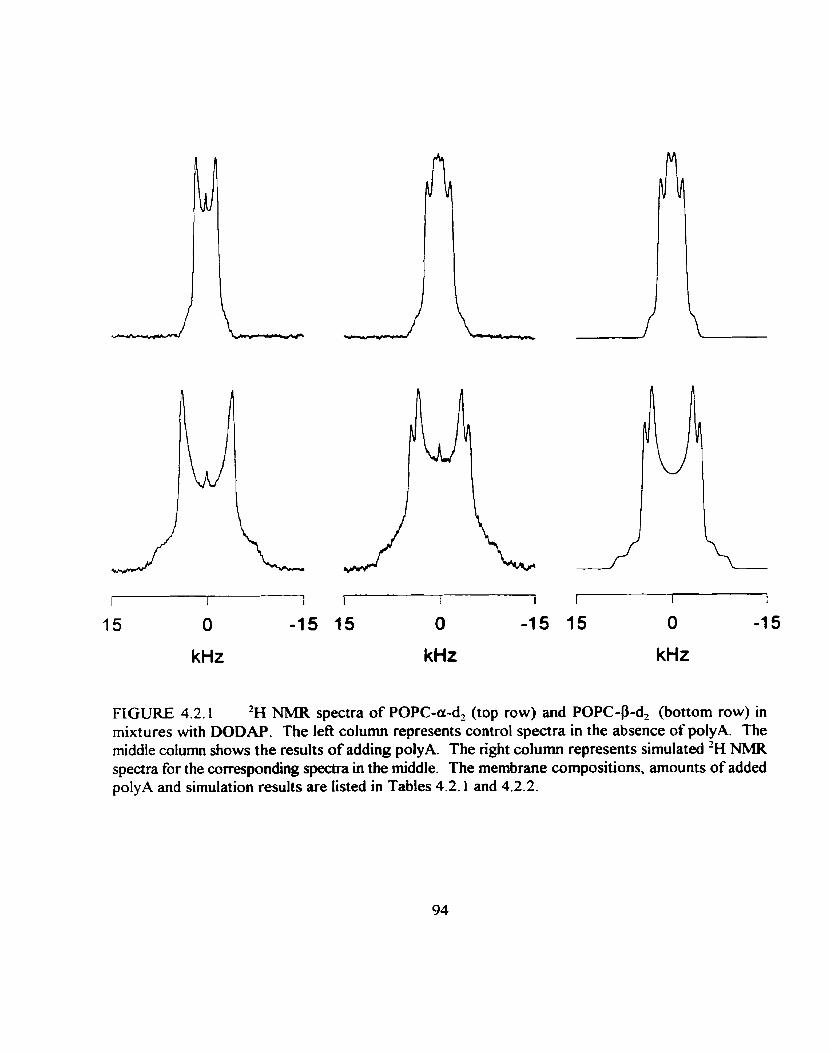
kHz kHz kHz
FIGURE 4.2.1 'H NMR spectra of POPC-a-d, (top row) and POPC-P-d, (bottom row) in mixtures with DODAP. The lef3 column represents control spectra in the absence o f polyA. The middle colurnn shows the results of adding polyA. The nght column represents simulated 'H NMR spectra for the correspondhg spectra in the Mddle. The membrane compositions. arnounts of added polyA and simulation results are listed in Tables 4.2.1 and 4.2.2.

TABLE 4.2.1 Experimental 'H MW€ data for deuterated POPC + cationic amphiphile + polyA mixtures. Ad and A\P represent the quadrupolar splittuigs for both the fiee and bound domains, respectively.
Membrane Composition Calibration" PolyA 1 Catipn Av ' AV controlb Constant m Charge Ratio (kHz)
t (kHz) ( W m o l )
90/ 10 POPC-ad? / CTAB -35.0 0.50 3 -20 1 .O0 2.90
90/10 POPC-P- / CTAB 25.6 1 .O0 6.60 8.60 8.06
90/10 POPC-ad2 / DODAP -3 1.0 0.50 3.70 1.60 3 -30
80/20 POPC-P-d2 / DODAP 12.5 0.75 6.80 9.00 8-00
80/20 POPC-a-d, / DC-CHOL -20.0 0.50 5 .O0 4.10 4.7
70/30 POPC-P- 1 DC-CHOL 8.5 0.75 6.00 6.30 6.2
" - m, is the calibration constant used in equation 4.3 as obtained fiom data in Figure 4.1.3 b - equal to the quadrupolar splitting in the absence of polyelectrolyte
most obvious noted change is the appearance of a second overlapping spectral component. In
cornparison, there was no change in the quadrupolar splittings of 100Y0 POPC-a-d, or POPC-P-d,
MLVs exposed to polyA, or the appearance of a second spectral component. Consequently, there
is nominal DNA-Iipid bilayer interaction in the abscence of an electrostatic attraction.
The right column of spectra are simulations of the 'H NMR spectra in the rniddle column.
The simulations each consist of a superposition of two spectral components, each of which has a
quadrupolar splitting and h e width factor corresponding to that observed experimentally. Hence, the
only variable is the intensity contnbuted by a particular component to the overall spectrum. This
strategy has successfully reproduced the -M NMR spectra obtained for the ovedapping Pake doublets,
in the presence of polyA. One concludes that polyA addition produces two distinct POPC
populations which are in slow exchange with one another on the time scale of 2~ NMR experiment,
delimited by the diffierence in their quadrupolar splittings. As will be discussed in a moment. anaiysis
of the 'H NMR quadrupolar splittings and spectral intensities provides complete information
regarding the degree of phase separation and the composition of each of these separate lipid domains.
The results show in figure 4.2.1 and table 4.2.1 were obtained with one particular amount
of added anionic charge fiom polyA, yielding the overall aniodcation charge ratio listed in table 4.2.1.
As will be shown in section 4.3.1, it was detemined that by increasing the amount of added
polyelectrolyte (ie. polyA) that the intensity of the spectral component with the smaller quadrupolar
splitting increased for POPC-a-d2 while conversly the intensity of the spectral component with the
larger quadrupolar splitting increased for POPC-P-d2. This helps to identify which spectral
cornponent corresponds to the polyA-associated POPC versus polyA-fiee POPC. Due to the fact
that T, and T2 relaxation times show no significant differences between the two spectral components.
the spectral simulations may be used to obtain the fiaction of the total POPC contained within either
domain.
By focussing on the polyA-6ee POPC component, one observes that its quadrupolar splitting
always reports a diminished cationic surface charge relative to the initial control splitting (ie. more
neutrai) regardless of whether one studies the 'H NMR spectra tiom POPC-a-d2 or POPC-p-d2. The

results therefore indicate that the polyA-Cee domain is depleted with respect to cationic amphiphile.
On the other hand, the polyA-associated POPC component has a quadrupolar splitting that
always reports a &e charge more cationic than the control values, whether one examines the 'H
NMR spectra fiom either POPC-a-d2 or POPC-P-4. This result is contrary to previous results
concerning ternary mixtures of cationic + anionic + zwitterionic charged species (Marassi &
Macdonald, 1992) wherein the quadrupolar sptittings report the expected neutralization of net surface
charge. An interpretation of this "anti-voltmeter" eRect of anionic polyelectrolytes on cationic
surfaces will be presented in the next section. These results are not simply localized to the use of
polyA but will be show to be a generalized response to a variety of anionic polyelectrolytes added
to cationic amphiphile containing lipid bilayers. Moreover, a similar "anti-voltmeter" response is
obtained when the electrostatic rnirror image experiment is performed by adding cationic
polyelectrolytes to anionic amphiphile containing bilayers (Crowell & Macdonald. 1997: Crowell &
Macdonald, 1998). Therefore, this property seems to be comrnon for polyelectrolytes of sufficient
size acting on oppositely charged surfaces under conditions of low salt.
4.2.1 QUANTITATION OF DOMAIN SEPARATION AND COMPOSITION
The 'H NMR spectra obtained in such instances may be analyzed to reveal both the degree
of dornain separation and the composition of the various domains. The global composition of
zwitterionic (y? or cationic (h3 lipid is defined in mole fractions according to:
Each of such lipid populations may be subdivided into those which are polyelectrolyte-bound
(superscnpt b) and those which are polyelectrolyte-free (superscript f), according to:
=%b + &'
X, ' = X, + x + ~ (4-2)
The ratio of POPC in the polyelectrolyte-bound versus polyelectrolyte-fkee domains (xbw ) at any
given level of added polyelectrolyte is equal to the intensity ratio of the two components in the
corresponding 'H NMR spectmm as obtained directly fkom spectral simulations. The details for
polyA are listed in table 4.2.2.
in generai, the cationic arnphiphile composition of the polyelectrolyte-fiee domain is obtained
fi-om the quadrupolar splitting of the corresponding component in the 'H NMR spectmm via:
where Av, is the quadrupolar splitting measured for 100% POPC and tq is a calibration constant for
either the a or p deuterolabeling position for a particular cationic arnphiphile. This equation is readily
rearranged to yield directly the desired quantity X.' in tenns of known and/or experimentally
measured quantities:

TABLE 4.2.2 Simulated 'H NMR data for deuterated POPC + cationic amphiphile + polyA mixtures
Membrane Fraction Mole Fraction Cationic Composition POPC Amphiphile
"fiee (bound)" "fiee (bound)"
Predicted CatiodAnion A v b Charge Ratio
in (kHz) polyA "bound"
Domain
9O/l O POPC-a-d, 1 CTAB
901 1 0 POPC-Pd2 1 CTAB
9011 0 POPC-a-dt l DODAP
80120 POPC-Pd2 1 DODAP
80120 POPC-a-d2 l DC-CHOL
7013 0 POPC-P- 1 DC-CHOL
0.75 (0-25) 0.09 (O. 13) 2.00 0.90
0.28 (0.72) 0.04 (O. 12) 8.60 0.87
0.75 (0.25) 0.09 (O. 14) 2.20 O. 86
0.43 (0.57) O. 10 (0.26) 8.80 0.99
0.69 (0.3 1) O. 16 (0.27) 4. I O 0.83
0.55 (0.45) 0.25 (0.35) 6.20 0.7 1

The results of applying this analysis, for poiyA with the three different cationic amphiphiles, are listed
in table 4.2.2. They demonstrate that the polyA-free domain is depleted with respect to cationic
amphiphiles relative to the initial global composition. Finally, the amount o f cationic amphiphile
contained within the poIyelectrolyte-bound phase is obtained by simple substraction according to:
The results o f such calculations are likewise listed in table 4.2.2. They indicate that the ratio of
cationic to anionic charge within the polyelectrolyte (polyA) -bound domain is approxirnately 1 : 1.
indicating a neutral complex if it is assumed that every single phosphate monomer of polyA is able
to interact with a cationic amphiphile. Note that al1 four undetermined quantities in equation 4.2 are
obtained without direct reference to the quadrupolar splittings measured for POPC-a-d, or POPC-P-
dl in the polyelectrolyte-bound domain, which behave in an apparently contradictory fashion.
In binary lipid mixtures, such as the initial cationic surface produced in the absence of polyA.
it is a straightforward process to relate the observed quadmpolar splitting for either of the
deuterolabeling positons to the mole eaction of charged lipid in a sirnilar fashion to equation 4.3. In
temary mixtures of zwitterionic + cationic + anionic amphiphiles, however, the observed quadmpolar
splitting (AvJ is altered by an arnount which is the sum of the perturbations due to the cationic and
anionic species taken individually in binary mixtures (Marassi & Macdonald, 1992), according to:

where Av, once again is the quadrupolar splitting for 100% POPC, Av- and Av- are the respective
quadrupolar splittings of POPC in binary mixtures with the cationic species of mole fraction X- or
the anionic species of mole hction X, whiie m and m- are the corresponding calibration constants.
In order to apply this equation one must have knowledge of the calibration constants in the cognate
binary mixtures.
Polyelectrolytes, such as polyq exhibit little if any binding to 100% POPC lipid bilayers so
that an independent determination of m- is not readity achieved. To analyze the quadrupolar
splittings of polyelectrolyte-bound domains in terms of compositions one must resort, therefore, to
certain assumptions. What if one assumes that POPC does not directly respond to the presence of
polyA, for instance, and only detects its presence indirectly through the po:yelectrolytes effect on the
local distribution of cationic amphiphiles? If this situation physically exists then the calibration
constant, m- , is qua1 to zero and the etf i ive mole fiaction of anionic charge (XJ drops out of the
equation.
The validity ofthis assumption may be proven as follows. If the calibration constant m - is
equal to zero then equation 4.6 reduces to equation 4.3 and the effective mole fiaction of cationic
charge (X,) in the polyelectrolyte (po1yA)-bound domain is obtained directly fiom the quadrupolar
splitting of the corresponding spectral component. By comparing the cationic amphiphile
composition detemined directly fiom the quadrupolar splittings to that determined using equations
4.1-4.5 the validity of this assumption should be proven. This was accomplished for polyA and for
three other polyelectrolytes, in which DODAP was used as the cationic amphiphile in each instance.
The results are shown in figure 4.2.2. The raw data obtained for the other polyelectrolytes will be
presented and discussed in a later d o n . But, what these results show is the 1 : 1 correlation between
I 1 I I I l
0.00 0.25 0.50 0.75 1 .O0
Mole Fraction of DODAP Bound (2)
FIGURE 4.2.2 Cornparison of the two methods of calculating the mole fraction of DODAP bound in the polyelectrolyte-bound domain. Method 1 employs equations 4.1-4.5 and utilizes only the quadrupolar splitting of the polyelectrolyte-fiee domain plus the intensity ratios of the two components in the % NMR spectmm. Method 2 employs equation 4.6 as applied to the quadrupolar splitting of the polyelectrolyte-bound domain with the assumption that the cdibration constant for the polyelectrolyte is zero. The dashed line shows the result expected for a 1 : 1 correspondence between the two methods. Open symbols: POPC-a-d,; Closed symbols, POPC-P-d, ; PolyA (diamonds), PSSS (squares), PACA (circles) and PGLU (triangles).
the two methods of calculating Xb, once again indicating the validity of assurning that m- is equal
to zero in equation 4.6. The results also show that this "anti-voltmeter" response is not specific to
poiyA, but instead seems to be a generalized effect of al1 polyelectrolytes.
What these results show is that the presence of polyelectrolyte is somehow masked fiom
direct detection by POPC and whose presence is detected oniy indirectly through its influence on the
local lipid composition. In the following section is a mode1 of the polyelectrolyte-lipid bilayer
interaction which explains the physical origin of the polyelectrolyte "masking" effect.
4.2.2 POLYELECTROLYTE BINDCNG TO CEiARGED BILAYER SURFACE
The 'H NMR results reporteci above permit a proposal for the arrangement of a polylectrolyte
such as polyA at the sudace of a lipid bilayer containing a mixture of cationic + mitterionic
amphiphiles, as show schematically in figure 4.2.3. The anionically charged polyelectrolyte (polyA)
is drawn to the membrane surface through electrostatic interaction. Upon binding, the adenosine
bases penetrate into the acyl chah region of the lipid bilayer, as indicated by infiared (Mal'tseva et
al . 1983) and NMR (Budker et al., 1990) evidence. This leaves the sugar-phosphate backbone
located within the polar interface region. At this point, the intercalated polyelectrolyte is pictured to
assume a two-dimensional self-avoiding random walk configuration where the individual nucleotide - ---
units occupy sites on a lattice.
The region of the lipid bilayer occupied by the polyelectrolyte defines a distinct domain
through a combination of two effects. First, electrostatic interaction between the anionic monomer
units and cationic amphiphiles tends to draw the two together such that the Iipid composition in the
vicinity of the polyelectrolyte will become more cationic than that of the bulk. If these coulombic
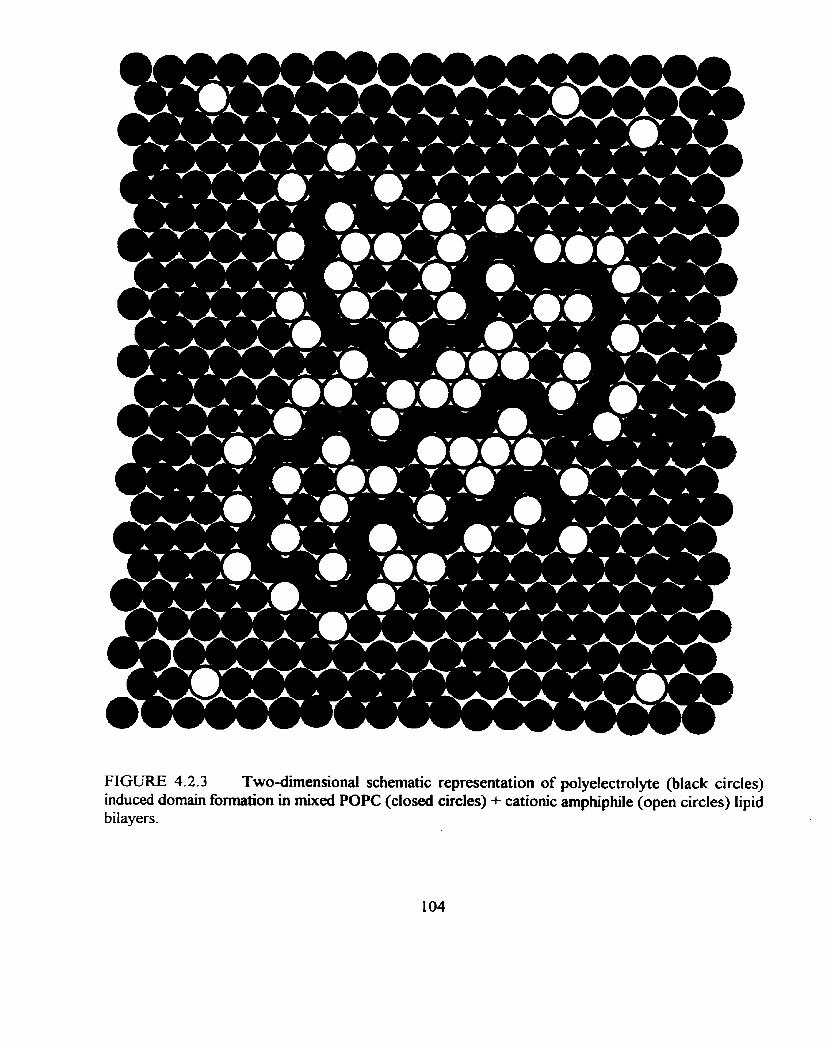
FIGURE 4.2.3 Two-dimensional schernatic representation of polyelectrolyte (biack circles) induced domain formation in mixed POPC (closed circles) + cationic amphiphile (open circles) lipid bilayers.
forces of attraction are sufficiently strong, then the cationic amphiphiles screen the charge of the
anionir; polyelectrolyte fiom POPC. Second, the effective lateral diffùsion coefficient o f individual
lipids will be reduced because of the well known archipelago effect (Saxton, 1993), within these
domains. This should inhibit the POPC lipids, which are fortuitously trapped within the
polyelectrolyte-bound domain, fiom exchanging with and averaging over the bulk lipid population
in order to produce long iived domains on the 'H NMR timescale. The dimensions of a random-coi1
polyrner permits the inclusion of considerable amounts o f the zwitterionic lipid. the details of which
should depend o n a number of factors including the hydrophobicity of the polymer, the global
cationidnvitterionic arnphiphile in the iipid biiayer, the s t f i e s s of the polymer backbone. the polyrner
molecular weight, the polyelectrolyte's linear charge density and the ionic strength of solution.
This mode1 explains ail the -%-I NMR observations including the appearance of distinct POPC
populations, the e ~ ~ h m e n t of cationic amphiphile in the polyelectrolyte-bound domain. the
concorninant depietion o f cationic amphiphiles in the polyelectrolyte-fiee domain and the "anti-
voltmeter" response observed in the former. This "anti-voltmeter" response can be rationalized
because of the overwhelming preference o f the charged polyelectrolyte for the oppositely charged
arnphiphile, for which direct access to POPC will be blocked thus removing its statisticai probability
of interaction with the polyelectrolyte. Instead, POPC trapped within the polyelectrolyte-bound
dornain wiil simply encounter an environment which is locally enriched in cationic charge. Ieading to
the "anti-voltmeter" response. Alternatively, this response can be explained in tenns of the plane of
binding of the oppositely charged molecules. For instance, should the anionic phosphates of polyA
bind in a plane located above the headgroup region o f the POPC molecules this would have the
overall result of decreasing the sensitivity of the "moIecular voltmeter" t o the presence of the
polyelectrolyte. However, this scenario is less likely than the fbst given the evidence of hydrophobic
penetration of the nucleotide bases of polyA into the membrane interior. Also, it would be difficult
to conceive that such a superficial binding would lead to domain formation.
4.3 Factors Infiuencing Polyelectrolyte Binding and Domain Formation
in Deuterated POPC Bilayers
The investigations reported in the previous section encompass a narrow set of circumstances
for which there are many other key experimental variables which demand fùrther investigation.
Although it has been shown that a variety of polyelectrolytes are capable of producing laterally
segregated domains the detailed composition and size of domains so produced should depend on a
variety of factors, a few of which will be examined in the following sections. As well, a more detailed
account of polyelectrolyte binding and conformation at the oppositely charged surface of bilayer
membranes wiil be presented fiom the point of view of the zwitterionic POPC molecule. As wiil be
documented later on, interactions between anionic polyelectrolytes and cationic amphiphiles were also
studied directly fiom the perspective of both molecules.
Before embarking on the detailed information determined fkorn choline-deuterated POPC
there are some general properties of cationic bilayers exposed to anionic polyetectrolytes that need
to be mentioned. The general propetties of these molecules will be presented specifically for bilayers
composed of DODAP and POPC exposed to the three anionic polyelectrolytes shown in figure 4.3.1.
The figure shows the repeating units of the three polyelectroiytes, PSSS (poly sodium styrene
sulfonate), PACA (poly acrylic acid) and PGLU (poly glutamic acid).
Pure aqueous mixtures of DODAP and POPC spontaneously assemble into lipid bilayers at
al1 proportions examined in these midies. This point is demonstated in the top lefi "P NMR spectrum
of figure 4.3.2 for a 20/80 (moVmol) mixture of DODAP + POPC, in which the line shape is

PSSS
POLYELECTROLYTES
PACA PGLU
FIGURE 4.3.1 Chemical structures of the three anionic polyelectrolytes (PSSS, PACA, and PGLU) employed here. The degree of polymerization CN) is 340 for PSSS, 320 for PACA and 550 for PGLU

v 7 ' ' 75 O -75 5 O -5 15 O -15 15 O -1 5
PPm kHz kHz kHz
FIGURE 4.3.2 NMR spectra of mixed DODAP + POPC lipid bilayers in the absence (top row) and presence (bottom row) of PSSS ( 1 : 1 anionkation charge ratio). From left to right, spectra correspond to "P NMR spectra of DODAP + POPC (20/80), 'H N M R spectra of DOTAP-y-d, + POPC (20/80), %I NMR spectra of WDAP + POPC-a-dz ( 1 0/90) and 'H NMR spectra of DODAP + POPC-P-d2 (20/80).

diagnostic o f lipids in a bilayer arrangement (Seelig, 1978; Cullis & de Kruijff, 1979).
When any of the three anionic polyelectrolytes are added to the aqueous medium with which
the DODAP + POPC mixtures are hydrated, the dispersions so produced exhibit colloidal properties
markedly different fiom those observed in the absence of polyelectrolytes. Specifically, the MLVs
fonned for the pure lipid mixtures are tinely disperseci and d ' i cu l t to centrifùge, due to intervesicular
charge repulsion between the cationic sudaces, in accordance with classical DLVO theory of colloidal
stabiIity (Dejaguin & Landau. 1941; Verwey & Overbeek, 1948). In the presence of
polyelectrolytes, the MLVs clump together and are readily centrifùged, indicative of particle
flocculation or bridging of vesicles by polyelectrolytes (Pefferkom., 1995). These are the macroscopic
manifestations of t he interactions between these particles.
At the point where enough polyelectrolye has been added to neutralize the cationic lipid
surfiace charge, the lipids retain a bilayer arrangement as dernonstrated in the bonom left "P NMR
spectrum in figure 4.3.2. Also, s h o w separately fiom the point of view of amino deuterated cationic
lipid @OTAP-y-d,) and deuterated POPC, both in the absence and presence o f polyelectrolyte, the
-% NMR spectra are characteristic of fluid lipids in a bilayer arrangement. Thus, despite the binding
of the polyelectrolyte to the iïpid vesicles and the resultant neutralization o f surface charge and vesicle
flocculation, the assembled lipid molecules maintain a fluid bilayer organization.
Finally, the arnount of polyelectrolyte chah binding to DODAP + POPC vesicles (10/90
mol/mol) may be quantified by an independent UV depletion assay, as described in the Materials and
Methods section. The results are shown in figure 4.3.3 and indicate that al1 three distinct
polyelectrolyte chains bind quantitatively to the surface up to the anionkation equivalence point.
Above this point ail the polyelectrolytes bind fùrther to the bilayers but at a reduced level relative to
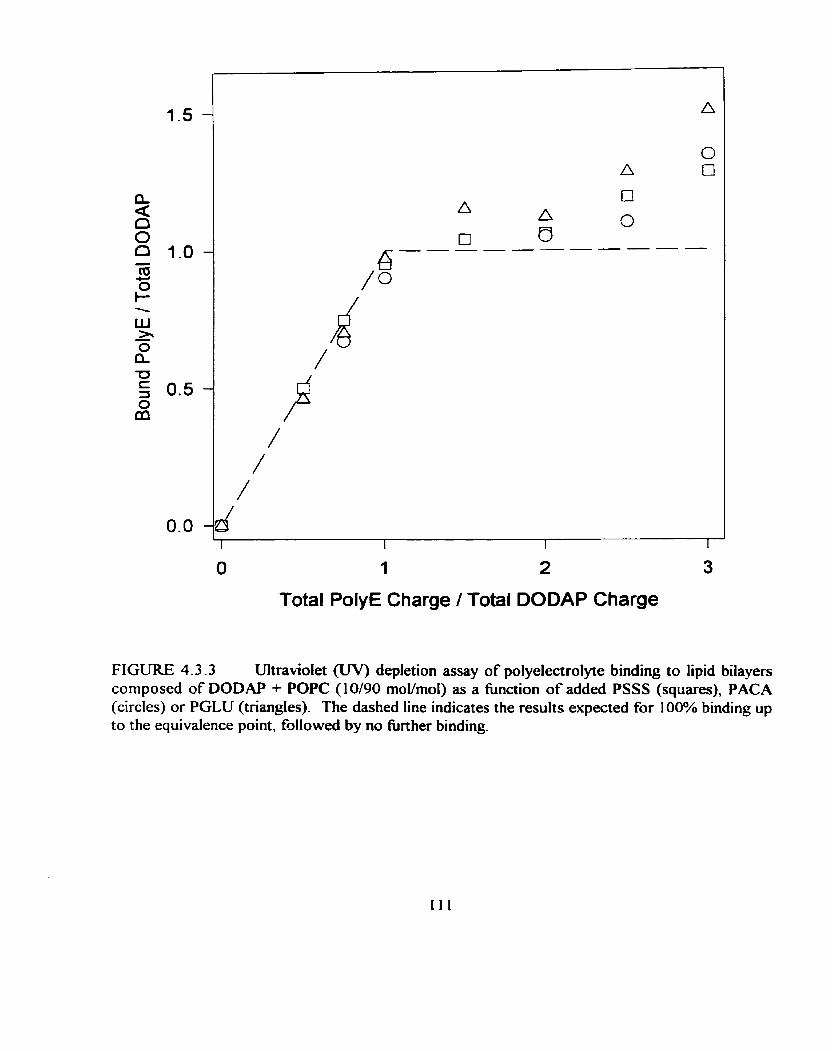
O 1 2 3
Total PolyE Charge / Total DODAP Charge
FIGURE 4.3 .3 Ultraviolet 0 depletion assay of polyelectrolyte binding to lipid bilayers composed of DODAP + POPC (10/90 mol/mol) as a fùnction of added PSSS (squares), PACA (circles) or PGLU (triangles). The dashed line indicates the results expected for 100% binding up to the equivalence point, f ~ l l o w e d by no firrther binding.

the amount of polyelectrolyte added. This method is capable of recording only those full
polyelectrolyte chains which are completely unbound and remain in the supernatant of the aqueous
mixtures. With respect to the results shown in figure 4.3.3, this means that above the equivalence
point more anionic charge is present in the polyelectrolyte chains near the bilayer surface than there
is cationic charge to neunalize it. Thus, above this point there must be cornpetition for the cationic
lipids by the individual polyelectrolyte chains.
4.3.1 Polyelectrolyte Chemistry
By closer examination of the structures of the three polyelectrolytes used in these studies,
which wiil be compared and contrasted for their ability in forming laterally segregated domains, there
are obvious differences in the hydrophobicity of their polymeric backbones. Of the three, PGLU is
clearly the most hydrophilic, since its polymeric backbone consists of a peptide chah In cornparison.
the ethylenic backbone of PACA or PSSS is relatively hydrophobic. When the aromatic ring of PSSS
is considered, it is evident that one may arrange these three polyelectrolytes in order of increasing
hydrophobicity as follows: PGLU < PACA < PSSS. Cornparison of the effects of the diferent
polyelectrolytes on DODAP + deuterated POPC bilayers permits the evaluation of the electrostatic
and hydrophobic contributions to sequestration of cationic lipids into polyelectrolyte dornains.
Al1 three anionic species will be studied for their ability to induce in-plane domain formation
by focussing on the detailed composition and size of domains so formed through a titration method.
But before embarking on the detailed analysis of the effects of the three species the general features
of figure 4.3.2 will be presented. The 'H NMR spectra of POPC-a-d2 and POPC-P-d,. in the
presence of 10% and 20% DODAP respectively, are show in the top row of figure 4.3.2 as the

second fiom right and rightmost spectra, respectively. These particular compositions were chosen
to give the best resolution for each of the deuterolabeling positions. Once again the values of the
quadrupolar splittings fiom these spectra (3400 Hz and 8200 Hz for POPC-a-d, and POPC-P-d2,
respectively) are altered fiom the values measured in 1 00% POPC membranes in a manner consistent
with accumulation of cationic surface charge. The subsequent addition of anionic polyelectrolyte,
in particular PSSS, to the cationic lipid bilayers produces two distinct POPC populations, as shown
in the spectra directly underneath the control spectra in figure 4.3.2. Similar two component 'H
NMR spectra are produced by addition of any of the three polyelectrolytes. As already mentioned
for the effect of polyA on the 'H NMR spectra, these three anionic polyelectrolytes also produce
overlapping Pake doublets in which, regardless of the deuterolabeling position. one of the component
Pake doublets exhibits a quadrupolar spiitting greater than the control value, while the second exhibits
a splitting l e s than the control. This once again suggests that one POPC population is enriched while
the other is depleted in cationic charge. relative to the global molar fraction of cationic charge present
in the homogeneous membrane in the absence of polyelectrolyte.
The spectra in the top and bottom row of the column secondmost from the lefi are
representative of the %I NMR spectra obtained for aminomethyl-deuterated DOTAP. in the absence
and presence of PSSS, respectively. The main observable, in these spectra. is the absence of a two
component spectrum for the addition of PSSS. The reasons for this and a more detailed discussion
of the effect on a series of deuterated cationic lipids will be deferred to a later section.
Refering back to the results obtained with deuterated POPC, the particulars regarding the
amount and composition of the polyelectrolyte-induced domains are obtained ti-om a detailed
examination of the two *H NMR quadrupolar splittings and relative intensities of the two Pake
doublets as a function of dded polyelectrolyte. Figure 4.3.4 consists of a senes of *H NMR spectra
fiom lipid bilayers composed of mixed DODAP + POPC-a-d, (10/90). The four experimental spectra
of the left column were obtained upon addition of PSSS in the amounts (fiom top to bottom): 0, 0.75,
1.00 and 2.00 equivaients of PSSS anions to DODAP cations. The corresponding computer-
simulated spectra are arrayed in the right column.
From figure 4.3.4 it is evident that, for vesicles produced by a mixture of POPC-a-d2 with
DODAP, addition of PSSS produces two-component 'H NMR spectra across the series, except for
the highest level of PSSS. By foltowing the series it becomes evident that the Pake doublet with the
srnaIler of the two quadrupolar splitting grows in intensity with subsequent addition of PSSS.
SimuItaneously, the second Pake doubIet, which possesses the larger quadrupolar splitting, has its
intensity decrease with added PSSS. This titration series therefore unequivocally identifies the
narrower Pake doublet as arising fiom POPC-a-d, associated with added polyelectrolyte. FinalIy,
when an excess of anionic charge fiom PSSS is added to overcome the cationic surface charge. only
a single quadrupolar splitting can be discerned and its value corresponds closeIy to that of the control
measured in the absence of PSSS.
It may be difficult to evaluate. by inspection, which of the two spectral components is
increasing or decreasing in intensity across such a series. As well, the overlap of two such Pake
doublets tend to reduce the true quadrupolar splittings by broadening of the peaks. These problems
were overcome by the use of cornputer-simulated spectra, which aided in detemining both vital
quantities by carefùl cornparison to experimental spectra. For instance, it was determined. through
the simulations presented in the bottom row of figure 4.3.4, that in going frorn the 0.75 to 1.00
addition of PSS S that the narrower Pake doublet increased fiom approximately 30% to 45% of the
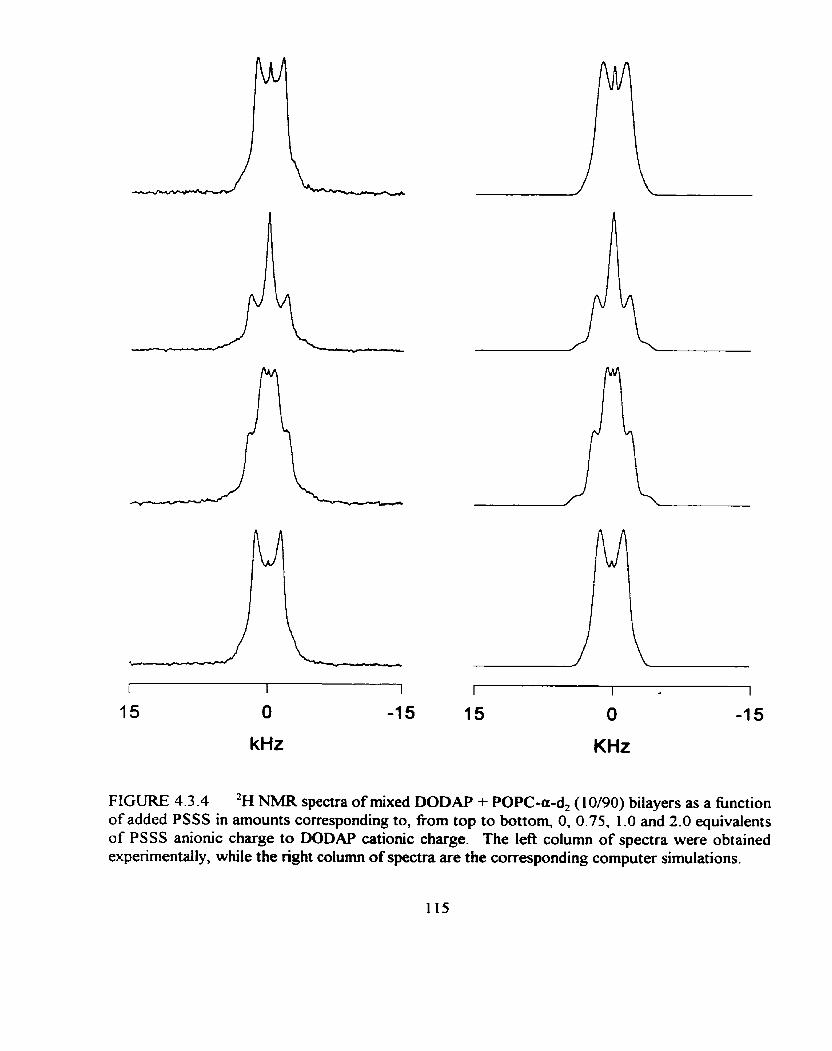
I I I r I I
15 O -1 5 15 O -1 5
kHz KHz
FIGURE 4.3.4 'H NMR spectra of mixed DODAP + POPC-a-dz (10/90) bilayers as a function of added PSSS in arnounts conesponding to, fiom top to bottom, 0, 0.75, 1.0 and 2.0 equivalents of PSSS anionic charge to DODAP cationic charge. The lefi column of spectra were obtained expenmentaily, while the right column o f spectra are the corresponding computer simulations.
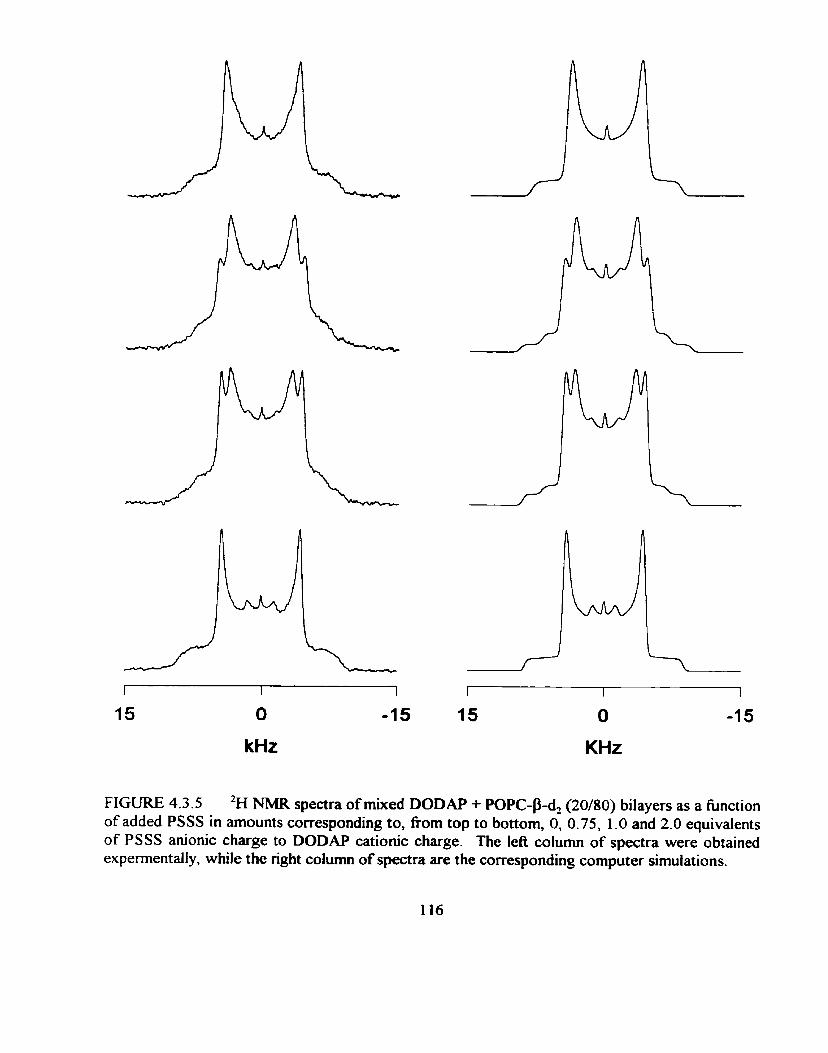
kHz KHz
FIGURE 4.3.5 'H NMR spectra o f mixed DODAP + POPC-P-d2 (20/80) bilayers as a function of added PSSS in amounts corresponding to, from top to bottom, 0, 0.75, 1 -0 and 2.0 equivalents of PSSS anionic charge to DODAP cationic charge. The lefi column of spectra were obtained expennentally, while the nght column of spectra are the corresponding cornputer simulations.
total POPC-a-d, spectral intensity.
The results for the observed changes in the 'H NMR spectrum for the case of lipid bilayers
composed ofDûDAP + POPC-P-d2 (20/80) are illustrated in figure 4.3.5. As previously, the four
spectra, £Yom top to bottom where obtained upon addition of PSSS in the following amounts: 0,
0.75, 1 .O0 and 2.00 equivalents of PSSS anions to DODAP cations. Once again. the experimental
spectra are arrayed in the left column, while the corresponding cornputer-simulated spectra are
arrayed in the right column. Fundamentally the same results are obtained as observed with POPC-a-
dl as far as the presence of two overlapping Pake doublets across the series is concerned followed
by the observation of a single Pake doublet at an addition of excess PSSS. However. for the case of
POPC-P-d2 it is the Pake doublet wÏth the larger quadrupolar splitting that increases in intensity with
added PSSS, while that with the smaller splitting decreases in intensity. There is a third. minor
component having a narrow quadrupolar splitting which contributes less than 5% of the total spectral
intensity, which is observed only for the case of PSSS added to bilayers containing POPC-P-d,.
Since no such component was observed in the presence of PACA or PGLU. there is no reasonable
explanation for its origin. Regardless, the same major points are noted for the results obtained for
POPC-P-d, as for POPC-ad2 indicating that either method could be used for amving at the detailed
results of domain size and composition as outlined in the mathematical model.
The treatment of the data begins by accumulation of the raw data determined by spectral
simulation. First, the detailed dependence of the quadrupolar splittings of the two spectral
components, polyelectrolyte-bound and polyelectrolyte fiee, are shown in figure 4.3.6 for al1 three
polyelectrolytes investigated (PSSS, PACA, PGLU) and for the two different mixed bilayers,
DODAP +POPC-a-d2 (1 O D O ) (figure 4.3.6A) and DODAP + POPC-P-<S (20/80) (figure 4.3 AB).
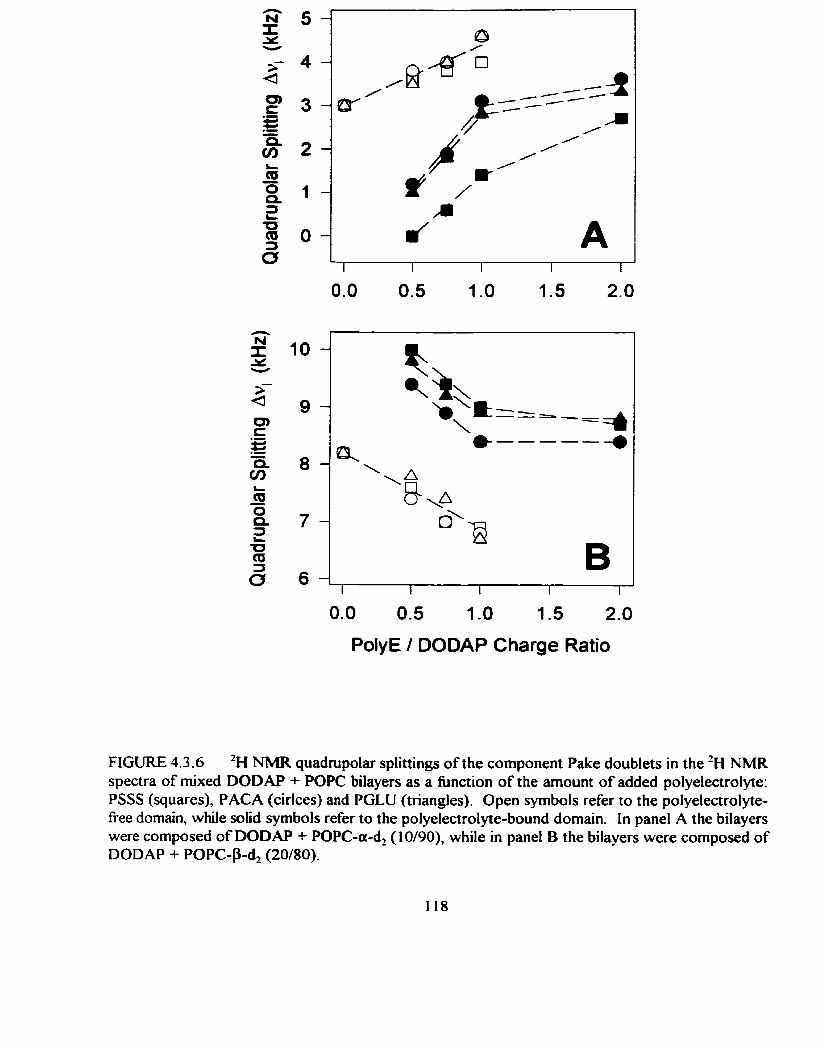
0.0 0.5 1 .O 1.5 2.0
PolyE / DODAP Charge Ratio
F I G W 4.3.6 'H NMR quadrupolar splittings of the component Pake doublets in the 'H NMR spectra of rnixed DODAP + POPC bilayers as a fùnction of the amount of added polyelectrolyte: PSSS (squares), PACA (cirlces) and PGLU (triangles). Open symbols refer to the polyelectrolyte- free domain, while solid symbols refer to the polyelectrolyte-bound domain. In panel A the bilayers were composed of DODAP + POPC-a-d, (10/90), while in panel B the bilayers were composed of DODAP + POPC-P-d2 (20180).
First, when looking at the figures it should be noted that it was not possible to resolve two Pake
doublets for polyelectrolyte:DODAP ratios less than 0.50. However, over the range at which two
spectral components could be resolved, it is evident that with increasing levels of polyelectrolyte the
quadmpolar splitting fkom both POPC-adz and POPC-P-d2 contained within the polyelectrolyte-fiee
domah tends towards a more neutral surface charge. In other words there is a progressive depletion
of DODAP fiom the polyelectrolyte-free domain as polyelectrolyte is added. Concomitantly, the
quadrupolar splittings from POPC-a-d2 and POPC-P-d, in the polyelectrolyte-bound domains is
characteristic of high cationic surface charge. This is consistent with an enrichment of DODAP in
the polyelectrolyte-bound domains. It is also evident fkom both figures that the quadrupolar splittings
for the polyelectrolyte-bound domains revert back toward the values characteristic of the initial
cationic surface charge in the absence of polyelectrolyte, with increasing levels of added
polyelectrolyte. Although there may be some slight difEerences between the responses of the different
polyelectrolytes here, a proper analysis and comparison of the polyelectrolytes requires taking into
consideration the intensities of the two populations as well as the quadrupolar splittings.
The fkst quantity that may be evaluated by such data determined from the 'H NMR spectra
is the fiaction of total DODAP (XbB(-' ) or POPC (cB(: ) bound in the polyelectrolyte domain as
a funaion of the polyelectrolytelDODAP charge ratio for the three polyelectrolytes as calculated by
equations 4.1-4.6. As show in figure 4.3.7 A and B there is a near linear dependence of the fraction
of bound lipid on the level of added polyelectrolyte for both DODAP and POPC and for al1 of the
distinct polyelectrolyte chahs. Figure 4.3.7A shows the results determined for bilayen composed
of DODAP + POPC-a-d, (1 0/90) and indicates that regardless of the particular identity of
polyelectrolyte that each equivalent of polyelectrolyte anionic charge binds approximately 0.75
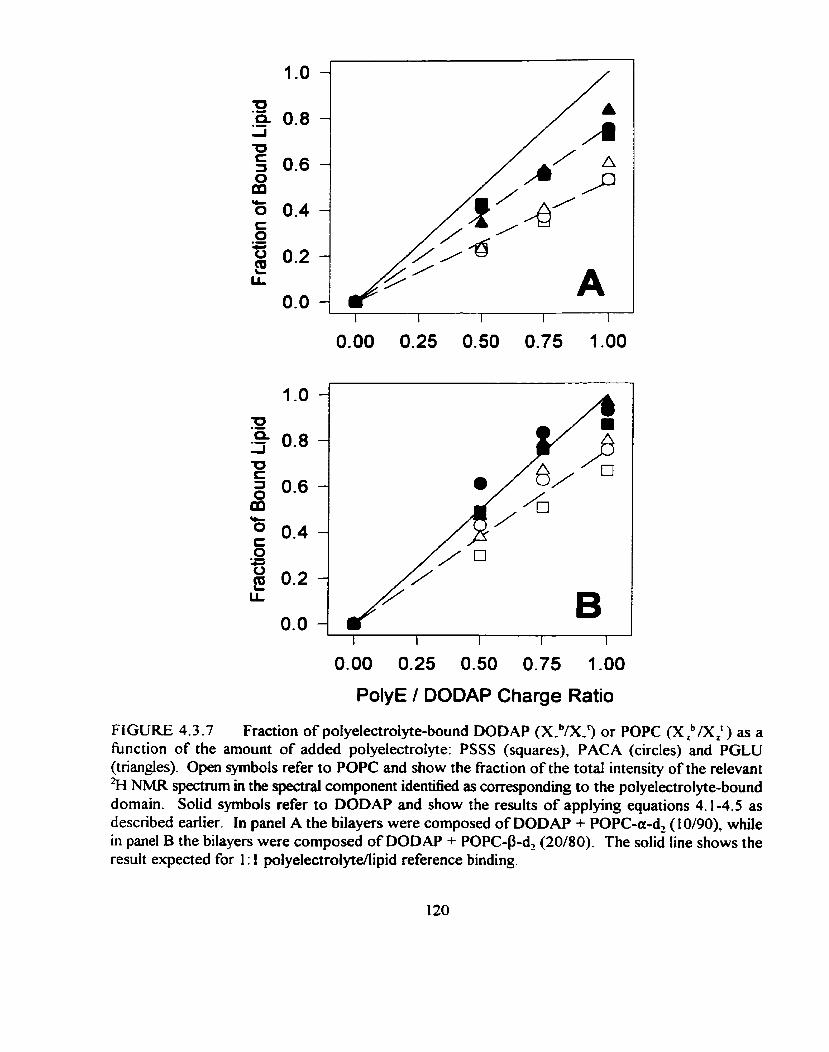
I I I I 1
0.00 0.25 0.50 0.75 1.00
PolyE 1 DODAP Charge Ratio
FIGURE 4.3.7 Fraction of polyelectrolyte-bound DODAP (X-bB(.3 or POPC (X ,bB( ,L) as a function of the amount of added polyelectrolyte: PSSS (squares), PACA (circles) and PGLU (triangles). Open symbols refer to POPC and show the fraction of the total intensity of the relevant % NMR spectnim in the spectral component identined as correspondhg to the polyelectrolyte-bound domain. Solid symbols refer to DODAP and show the results of applying equations 4 - 1 4 5 as descnbed earlier. In panel A the bilayers were composed of DODAP + POPC-a-d, (1 0/90), while in panel B the bilayers were composed of DODAP + POPC-P-d2 (20/80). The solid line shows the result expected for 1 : 1 polyelectrolyte/lipid reference binding.
equivalents of DODAP cationic charge. On the other hand figure 4-3-78 shows the results for
bilayers composed of DODAP + POPC-P-d2 (20/80) and this time indicates that each equivalent of
polyelectrolyte anionic charge binds virtuaiiy 1 .O equivalent of DODAP cationic charge, independent
of the detailed chernical structure of the polyelectrolyte. This result is more reminiscent of the results
obtained for polyA as discussed earlier in mixtures with POPC and the three different cationic
amphiphiles. In polyetectrolyte-surfactant complexes, there is a critical micellar surface charge that
must be exceeded before the entropic cost of forming a 1 : 1 surface-bound charge complex is
outweighed by the coulombic forces of attraction (Dubin et ai., 1989). This effect might explain the
apparent nonstoichiometric anionxation ratios for the DODAP + POPC ( 1 0/90) case. As well other
-% NMR expenments (CroweU & Macdonald, 1998) and centrifugation techniques (Denisov et al..
1998) have dso provided evidence that the affùiity of cationic polyelectrolytes (polylysine) decreases
markedly as the mole fiaction of anionic lipid (PG) decreases in PC vesicles.
For POPC, the fiaction trapped within the polyeiectrolyte-bound domains always lags
behind the amount of DODAP and can be reiated to the fact that POPC is not actively bound in these
domains as is DODAP, instead it is fortuitously trapped.
The second quantity that can be evaluated from the -%I NMR data is the DODAP composition
of the polyelectrolyte-fiee and polyelectrolyte-bound domains as shown in figure 4.3.8. Whereas the
data for the quadrupolar sptittings for POPC-a-dz and POPC-P-dZ were nearly mirror images of one
another, the data presented in figure 4.3.8 indicate how evaluation of the NMR data produces similar
results for both cases, indicating the validity of use of either of the deuterolabeling positions for
information. The data in figure 4.3.8A and B both indicate the progressive depletion of DODAP out
of the polyelectrolyte-fiee domain with added polyelectrolyte even though the specifics of DODAP
0.00 .-'
0.0 0.5 1 .O 1.5 2.0
PolyE / DODAP charge ratio
FIGURE 4.3.8 Composition of the polyelectrolyte-free and polyelectrolyte-bound domains in mixed DODAP + POPC bilayers as a function o f the amount of added polyelectrolyte: PSSS (squares), P ACA (circles) and PGLU (triangles). Open symbols are for pol yelectrol yte-free domains, while solid symbols are for polyelectrolyte-bound domains. A, DODAP + POPC-a-d, (10190); B, DODAP + POPC-9-d2 (20/80).

composition Vary for the two cases due to differences in initial surface charge density. This effect will
be discussed in more detail in section 4.3.3. Also shown in figure 4.3.8A and B is that there is an
enrichment of DODAP within the polyelectrolyte-bound domains. The DODAP composition of this
domain is not constant with increasing polyelectrolyte but rather approaches the initial composition
as the membrane sufice becornes saturated with polyelectrolyte. Now, whereas no differences could
be discemed, between the three dEerent polyelectrolytes, with respect to the mole fiaction of bound
lipid the distinct behaviour of the polyelectrolytes is now quite evident in figure 4.3.8. The
polyelectrolyte least capable of segregating DODAP into distinct polyelectrolyte-bound domains is
PGLU, the most hydrophilic of the three polyelectrofytes. At the same time, the most hydrophobic
polyelectrolyte, PSSS, exhibits the greatest tendency to segregate DODAP and exclude POPC in its
polyelectrolyte-bound domain. Thus, the propensity of the polyelectrolyte to segregate cationic
amphiphiles and thus its ability to form distinct domains correlates with the potential of the
polyelectrolyte to penetrate into the bilayer interior.
This behaviour has several plausible origins. The ability of certain polyelectrolytes to form
lateral domains on oppositely charged bilayer surfaces may be related to their hydrophobic portions.
Certain polyelectrolytes like polyk which contain hydrophobic bases. are known to intercalate
between membrane lipids. This can have the effect of producing a barrier or "fence" for lipids
trapped within the dimensions of the polyelectrolyte chah. This results in a tortuosity effect whereby
lipids can no longer difise in a direct iine and thus have reduced difision coefficients.
Consequently, exchange between the bound and fiee domains would be reduced and we would
observe long Iived domains.
Another possible ongin to this behaviour is the aggregation of multiple numbers of chains in

order to fom "superdomains''. This is a reasonable assumption due to the fact that this aggregation
of chains, in the plane of the bilayer, would reduce the hydrophobic mismatch behueen lipids
(Israelachvili and Mitchell, 1975; Israelachvili. 1977) and proteins (Killian, 1998). This favourable
clustenng of polyelectrolyte chains would reduce the number of packing defects in the bilayer and
would maximize the arnount of hydrophobic interactions within the bilayer. The sheer size of this
in-plane aggregation should produce long lived domains. The residence time of a lipid within this
aggegated domain would be long enough such that exchange between the bound and free domains
would be limitai. Thus, POPC wiii have a reduced ability to exchange and average out the behaviour
of distinctly charged lateral environments, resulting in the observance of domains.
Finally, it may also be the case that both of these effects act simultaneously. At present,
though. the data collected for the three polyelectrolytes used in these studies do not provide direct
evidence as to whether any of these explanations are operable.
The 'FI NMR data presented here have, however, provided an expansion to the mode1 of
polyelectrolyte binding to lipid bilayers, as show in figure 4.3.9. In the top portion of the figure is
the situation of the rnixed Mayer in the absence of polyelectrolyte. Lateral diffiision of the lipids
within the plane of the bilayer averages out the local fluctuations from the global average
composition. Thus, every POPC molecule experiences the identical DODAP composition during the
time course of the NMR experimznt and hence produces a single well-defined quadrupolar
splitting.
When the polyelectrolyte is added in an amount below the global anionkation equivalence
point. there is quantitative binding of polyelectrolyte to the bilayer surface as deduced from the 'H
NMR data, provided that there is sufficient initial surface charge density. This indicates that the
PolyE = O
PolyE < DODAP
PolyE > DODAP
FIG xposed to anionic polyelectrolytes. in the absence of polyelectrolyte the cationic and î&tterio& lipids mix homogeneously. When the polyelectrolyte is added in an amount below the anionkation equivalence point, there is a cationic lipid charge for each anionic polyelectrolyte charge and the polyelectrolyte lies flat on the surface. When the added amount of polyelectrolyte exceeds the anionkation equivalence point, the polyelectrolyte can no longer lie flat and the domain structure disappears.

polyelectrolyte lies flat along the bilayer surface under these circumstances, as s h o w in the rniddle
scheme in figure 4.3.9. Within the region defined by the polyelectrolyte there is an enrichment of
DODAP, maintained over t h e . Concomitantly, there is a depletion of DODAP fkom other regions.
Thus, the 'H NMR spectrum o f choline-deuterated POPC repons two separate s u r k e charge
environments corresponding to the distinct domains defined by the presence or absence of
polyelectrolyte.
When anionic polyelectrolyte is added in an amount above the aniodcation equivalence point.
binding is no longer quantitative and individual polyelectrolyte chains and monomeric units must
compete for cationic surface charges. Since the data fiom figure 4.3 -3 indicate that there is an excess
of chains binding to the surface above this point then there are fewer cationic charges than anionic
charge fkom the monomeric units. This means that the polyelectrolyte can no longer lie flat dong the
surface but instead contacts the surfâce only intennittentiy, in trains o r loops. as shown schematically
at the bottom of figure 4.3.9. Since interpolyelectrolyte charge repulsion will cause the
polyelectrolytes t o distnbute more o r Iess evedy over the bilayer surface. the DODAP molecules
Likewise wiii be more evenly be dismbuted over the surface. This situation produces a single common
environment for aU amphiphiles and consequently a single quadnipolar splitting for choline-deuterated
POPC with a value approximating that o f the initial conditions in the absence o f polyelectrolyte.
4.3.2 Polyelectrolyte Molecular Weight
There are a variety of distinct polyelectrolytes, which differ not only with respect to chemical
structure but also molecular size. Biopolyelectrolytes may range fiom small proteins, such as mellitin
with 26 arnino acid residues, to large proteins. such as myelin basic protein, having 170 amino acid
residues, or in the case of DNA, fiom srnall plasmid DNA with only about 10' bases to DNA strands
of 106 base pairs. The size of these polyelectrolytes is expected to be an important factor in
controlling the composition and size of the induced domains, which in turn will affect the domain's
fùnctional properties. The degree of enrichment with anionic lipids, for example, can influence the
activity of membrane-bound enzymes (Robinson et al.. 1980; Gennis, 1989). In the case of DNA it
is known that the efficiency of DNA entrapment (Monnard et al.. 1997) and transfection (van der
Woude et al., 1995) decreases with hjgher molecular weight DNA fragments.
In the studies presented here, the properties of domains induced by four different molecular
weight chains of the anionic polyelectrolyte PSSS in lipid bilayers consisting of mixtures of either
POPC-a-d, or POPC-9-d2 with the cationic Iipid DODAP are examined. The focus of these
experiments is to study how the details of the polyelectrolyte induced domain properties Vary with
respect to the molecular weight of PSSS.
The type ofanalysis followed for the effect of the four different molecular weight chains on
domain formation is sirnilar to that already produced in the previous section for the distinct
polyelectrolytes and begins with the results shown in figures 4.3.10 and 4.3.1 1. The 'H NMR spectra
of POPC-a-dz and POPC-P-d are shown in figure 4.3.10 and 4.3.1 1. respectively. The results
presented here and throughout this study are for bilayers composed of 40% DODAP. The top
spectra of figures 4.3.10 and 4.3.1 1 are the control spectra in the absence of polyelectrolyte. The
change in quadrupolar splittings to -3 .O and 1 1 .O W for POPC-a-dl and POPC-P-d, respectively,
is indicative of the ''voltmeter" response for the accumuiation of cationic charge at the bilayer surface.
relative to the control values for 100% POPC vesicles. Since there is only one quadrupolar splitting
obtained for either case, the lipids are homogeneously mixed on the timescale of the 'H NMR

kHz
I 1 I
-1 5 O 15
kHz kHz
FIGURE 4.3.10 'H NMR spectra of mixed DODAP + POPC-a-d, (40/60) bilayers with added PSSS (N=3790) in amounts corresponding to, fiom top to bottom, 0,0.50 and 0.75 equivalents of anionic charge fiom PSSS to catioruc charge fkom DODAP. The lefi column corresponds to the experirnental spectra, the middle column to the corresponding de-Paked spectra and the right column to simulated spectra obtained using parameters determined fiom de-Pake-ing.
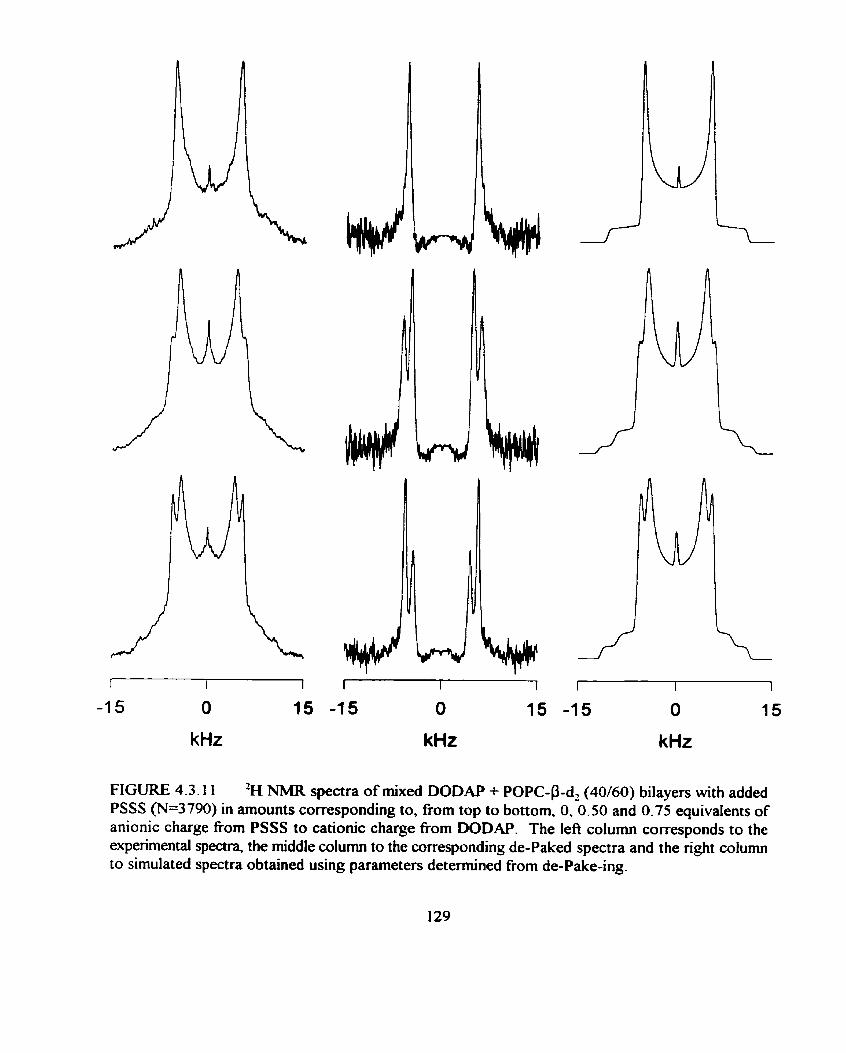
kHz kHz kHz
FIGURE 4.3.1 1 'H NMR spectra of mixed DODAP + POPC-P-d2 (40160) bilayers with added PSSS (N=3790) in amounts corresponding to, fi-om top to bottom. 0, 0.50 and 0.75 equivalents of anionic charge from PSSS to cationic charge from DODAP. The left column corresponds to the experimental spectra, the middle column to the corresponding de-Paked spectra and the right column to simulated spectra obtained using parameters determined from de-Pake-ing.
experiment .
The sign of the quadrupolar splittings cannot be detennined in these expenments, only their
absolute values. The assigrunent of the value of -3 .O kHz to the quadrupolar splitting of POPC-a-d,
in the presence of 40 % DODAP arises fiom the fact that the caiibration curve relating the
quadrupolar splitting to DODAP concentration passes through a value of O Hz at approximately 25%
DODAP. If a positive value is assumed for the control splitting, for 100% POPC-a-dz, then the
negative sign for the quadrupolar splitting of 40% DODAP follows. This effect is only observed for
POPC-a-d2 in these studies and delicate determination of the quadrupolar splittings is required when
vaIues become close to O Hz.
The consequences of adding the largest molecular weight chah of PSSS, used in these studies,
to these bilayers is illustrated by the middle and bottom spectra in the lefi column of figures 4.3.10
and 4.3.1 1. One observes a second overlapping Pake pattern which increases in intensity as PSSS
is added to the MLVs. In this instance, for both POPC-a-d, and POPC-9-d,, the spectral component
with the larger absohte quadrupolar splittings (outer quadrupolar splittings) grows in intensity as
PSSS is added, identïfjmg it as the POPC component associated with PSSS. The effect still indicates
the counterdirectional nature of the u and P deuterolabeling positions of POPC due to the fact that
in alrnost aü instances the quadrupolar spiittings for both spectral components, for the case of POPC-
a-d,, are negative. Thus, this indicates that the outer quadrupolar splitting is in fact smaller due to
its sign and thus represents a polyelectrolyte-associated domain which is in fact more cationic.
in many cases of overlapping Pake pattern subspectra it can be exceedinçly difficult to extract
the desired quadrupolar splittings and spectral intensities by examination, particularly when one
intensity is much lower than another or the quadrupolar splittings are poorly resolved. A usefiil
approach is to "de-Pake" the Pake powder patterns using the method devised by Stemin et al. ( 1983).
This mathematical manipulation removes the spectral broadening due to the distribution of
orientations of the iipid long axes in spherical bilayers, while leaving the sharp doublet of resonances
fiom which the true quadrupolar splittings are obtained. Exarnples of such spectra are show in the
rniddle colurnns of figures 4-3-10 and 4.3.1 1. There is an enhanced resolution in the two POPC
populations and one may not only derive the relevant quadrupolar splittings but also the relative
intensities of the signals from the two POPC populations. The riçht-column of spectra in figures
4.3.10 and 4.3.1 1 are the correspondhg computer simulations of the expenmental spectra in the lefb
hand columns, as produced by using the quadrupolar splittings and relative intensities derived fiom
the de-Paked experimental spectra. This approach is succesful in reproducing the experimental
spectra, even for cases of poorly resolved quadrupolar splittings or low intensity of one component.
It is interesting to note that both the PSSS-bound and PSSS-fiee populations of POPC display
single well-defined quadrupolar splittings rather than distributions. In the case of the PSSS-fiee
population this means that the laterai diffùsion coefficient of POPC is rapid enough that each POPC
can sample a wide range of local charge environments such that the net charge experienced becomes
the mean value. In addition, for the PSSS-bound population, the charge environment within that
domain must be identical for each PSSS chain, in order to produce a therrnodynamic optimum of
lipid composition. More specificaily, if the POPC molecules are not at least somewhat fiee to
laterally diase within the PSSS-bound domain, and if different such domains contain different ratios
of DODAP to POPC, then a distribution of quadmpolar splittings would be observed in the 'H NMR
spectra, reflecting different charge environments. This would lead to spectral broadening, which is
clearIy not the case here. As weU as POPC being able to laterally difise within each of the separate

domains there must also be a lack of exchange of POPC between the domains which woutd result in
either exchange broadening or a third "boundary" POPC population. which was never the case. It
is also possible that two separate lamellar phases coexist. one of which contains PSSS and the other
of which does not, with no exchange between the two. But other studies have shown that a single
lamellar phase exists in which DNA molecules are homogeneously distributed amongst the lamdae
(Cevc, 1 996). Also, fluorescent digital unaging techniques have indicated t hat pol yelect rol yte- bound
domains begiri as isolateci chains which then laterally aggregate in order to produce "superdomains"
about a micron in diameter, on the sarne bilayer. (Yang and Glaser. 1996: Denisov et al., 1998).
The quadrupolar splittings and relative spectral intensities for PSSS-bound and -fiee domains
are shown in figures 4.3.12 and 4-3-13, for the four different PSSS molecular weights investigated
here. Once again, as the case for other polyelectrolytes, the quadrupolar splittings for the fiee and
bound populations change in opposite directions and the quadrupolar splittings for POPC-a-d, and
POPC-P-d2 are mirror images of one another. indicating their counterdirectional nature for similar
surface charge. For both deuterolabeling positions of POPC. it is shown that the greatest effects on
the quadrupolar splittings are caused by the highest molecular weight PSSS chain while the least
change is induced by the lowest molecular weight PSSS. In al1 cases, at high levels of added PSSS
the quadrupolar splittings of the bound domains retum towards the initial values measured in the
absence of PSSS.
in figure 4.3.13 it is evident that the amount of POPC trapped within the PSSS-bound domain
does not V a r y linearly with added PSSS. At low levels of added PSSS. a separate PSSS-bound
component cannot be resolved. Only at a PSSS/DODAP charge ratio of O S does the existence of
two POPC populations arise in the %I NMR spectrum. It is also evident that lower molecular weight

0.0 0.5 1 .O 1.5
PSSS I DODAP Charge Ratio
FIGURE 4.3.12 'H NMR quadrupolar splittings fiom POPC-a-d2 (panel A) and POPC-P-d, (panel B) of the PSSS-bound and PSSS-free sub-spectra in the 'H NMR spectra of mixed (40/60) DODAP + POPC cationic bilayers as a function of the amount of added PSSS: N = 3790 (circles), 485 (squares), 170 (triangles), 22 (diamonds). Open symbols refer to the PSSS-free domain. while closed symbols refer to the PSSS-bound domain. The quadrupolar splittings are plotted as the difference versus the values measured in the absence of PSSS.

I I 1 I I I
0.0 0.2 0.4 0.6 0.8 1.0
PSSS 1 DODAP Charge Ratio
FIGURE 4.3.13 Fraction of PSSS-bound lipid as a fùnction o f the PSSS / DODAP anion 1 cation equivalence ratio: N = 3790 (circles), 485 (squares), 170 (triangles). 22 (diamonds). A: POPC-a-d2. B: POPC-P-çI, The fiaction of PSSS-bound POPC, >ibB(: (open symbols). was obtained fiom the relative intensities of the correspondhg %I NMR sub-spectra. The fraction of PSSS-bound DODAP, XbW (closed symbols), was obtained using equations 2.1-2.5 as already described previously. The solid line shows the result expected for a 1 : 1 PSSS 1 DODAP complex.

PSSS traps more POPC within a domain at a @en PSSS/DODAP charge ratio than higher molecular
weight chahs. For instance, the oniy PSSS chin which traps ail the POPC into PSSS-bound domains
at the 1 : 1 charge ratio is the N = 22 case.
The data shown in these two figures is the raw data determined for the different molecular
weight chains of PSSS, through their de-Paked spectra, and they indicate that differences do exist in
the domain properties formed by the difEerent chains of PSSS. This data was analyzed, as descnbed
earlier for the domains of PSSS, PACA and PGLU. in order to determine information regarding
domain composition and size due to PSSS molecular weight.
The resutts of such an anaiysis begin by refering back to figure 4.3.13, which contains the
detaiis of the charge stoichiometry within the PSSS-bound domain. Figure 4.3.13A and B illustrates
the fraction of DODAP bound as a function of the global ratio of added PSSS anionic to DODAP
cationic charges, for both POPC-a-d, and POPC-P-d,. respectively. The solid line in the figure
represents the results expected for a 1 : 1 aniodcation stoichiometry within the PSSS-bound domain.
The PSSS-bound domains contain a near stoichiometric charge ratio regardless of the particular
molecular weight of PSSS chain, until saturation is approached. Identical conclusions are reached
with either POPC-a-d, or POPC-P-d, . This was also observed for the three polyelectrolytes
discussed in the previous section, but at rnuch lower surface loadings of polyelectrolyte (ie. 20180
DODAP + POPC vesicies).
Consider next the DODAP composition of the domains for the four molecular weight chains.
Figure 4.3.14A and B illustrates the manner in which the DODAP composition depends on the global
ratio of added PSSS anions to DODAP cations, for POPC-a-d, and POPC-P-d,, respectively. All
difFerent PSSS molecular weight chains qualitatively produce similar results in that their PSSS-bound

domains are e ~ c h e d in DODAP while PSSS-free domains were depleted. Also, the degree of
enrichment of the PSSS-bound domains decreases with increasing levels of PSSS. However. there
are quantitative dflerences in figures 4.3.14A and B in that the higher molecular weight PSSS chains
produce a higher degree of DODAP enrichment in the PSSS-bound domain. This means that the
higher molecular weight PSSS chah produces a more compact domain on a per monomer basis.
The 'H NMR results presented here may also be used in order to assess the surface area
occupied by a domain on a single polyelectrolyte chain basis. The surface area occupied by a
polyelectrolyte chain (AJ is the sum of the surface areas of the constituent lipids plus the
polyelectrolyte itself, according to :
A', = xi NiAi
where Ni is the number of species "i" within the domain, each occupying a surface area A,.
The number of DODAP bound per single PSSS chain equals,
where Q is the PSSS anion to DODAP cation equivalents ratio. X.' = X*' + Xb is the global
DODAP mole fraction (ie. equal to 0.4 in this case). and Np,,, is the degree of PSSS polyrnerization.
The number of POPC bound per single PSSS chah may be expressed in a similar manner:
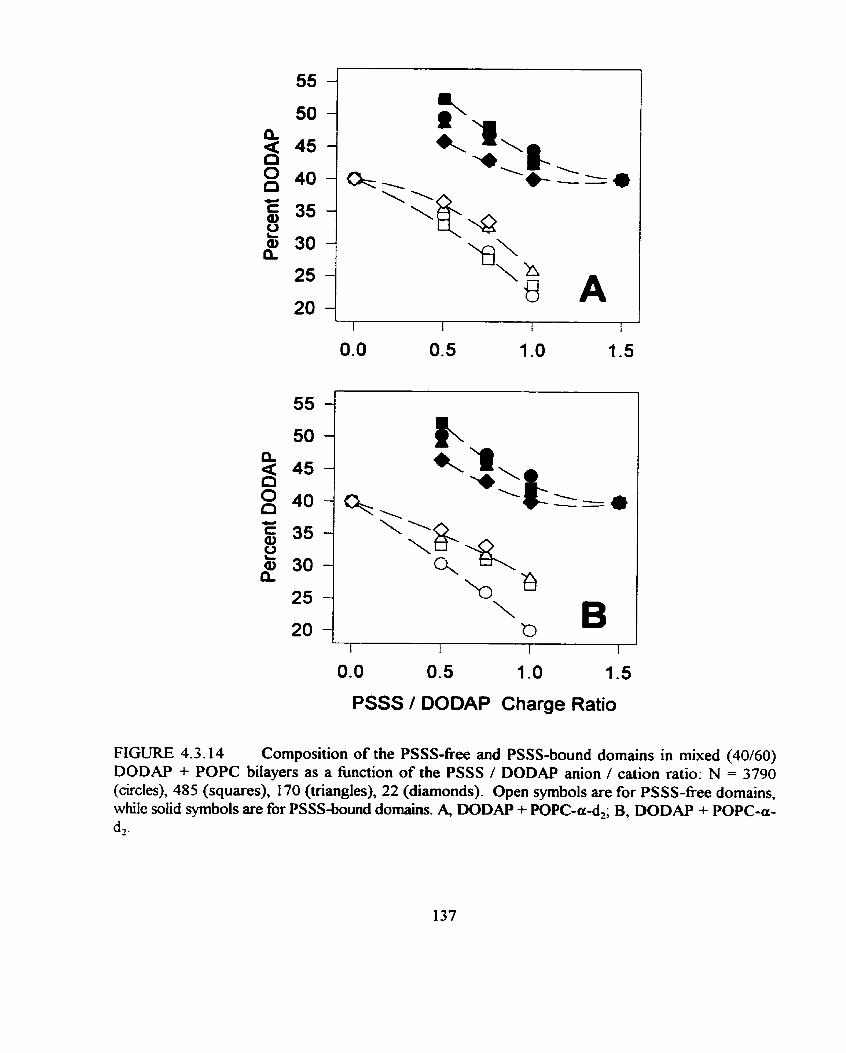
I t I I
0.0 0.5 1 .O 1.5
PSSS I DODAP Charge Ratio
FIGURE 4.3.14 Composition o f the PSSS-free and PSSS-bound domains in mixed (40/60) DODAP + POPC bilayers as a function of the PSSS / DODAP anion 1 cation ratio: N = 3790 (circles), 485 (squares), 170 (triangles), 22 (diamonds). Open symbols are for PSSS-free domains, while soiid symbols are for PSSS-bound domains. 4 DODAP + POPC-a-d,; B, DODAP + POPC-a- dz-

To complete the domain size calculation. appropriate values of the surface area occupied by
DODAP, POPC and DODAP must be chosen. For POPC, a surface area of 68 A' is accepted for the
liquid-crystalline state. To a first approximation. it may be assumed that both POPC and DODAP
occupy similar cross-sections and that these are not altered by the presence of the polyelectrolyte.
For PSSS, the surface area occupied will depend on the degree of penetration into the hydrophobic
region of the bilayer and the average orientation reIative to the bilayer normal. These are both
unknown. However, a rough estimate of the surface area occupied by a PSSS chain is obtained by
regarding it as a chain of length Nms 2.55 A (monomer-monomer spacing) (Borochov and
Eisenberg, 1994) and width 2.42 A (for the aromatic ring). Therefore the surface area occupied by
a monomer segment of PSSS (A& is about 6.2 A' whereas Ni equals the degree of polymerization.
There is some discussion in the literature regarding the correct choice for the monorner-monomer
spacing (Borochov and Eisenberg, 1994; Kassapidou et al., 1997) However. the calculation shows
that the area occupied by the PSSS chah never exceeds 5% of the total domain area. so the
monomer-monomer spacing is a moot point. Since it appears that the bulk of the domain area is
occupied by the amphiphiles, and to a first approximation DODAP and POPC occupy similar surface
areas, then the essential features of the domain size may be apprehended simply by exarning the
numbers of DODAP and/or POPC per PSSS chain.
Table 4.3.1 tists values ofNmDM and Np,,, caluclated accordinç to equations 4.8 and 4.9 as
a fùnction of Q for the different molecular weight chains of PSSS. Generally. N,,,,, is close to the

TABLE 4.3.1 Number of amphiphiles per PSSS chah in PSSS-bound domain.
AnionKation DODAP POPC Total
PSSS (3790)'
4140 320 4040 = 400
3800 * 140 4280 k 220
3420 * 60 4320 = 110
PSSS (485)
460 * 5 420 k 5
460 * 10 51015
445 * 5 605 * 5
PSSS (170)
150+5 150*5
15015 180*5
155 * 5 220 I j
PSSS (22)
* Number in parenthesis equds the degree of polymerization of PSSS
139
degree of polyrnerization of the particular PSSS chain (N,,,,) and is constant with changing Q, as
expected for stoichiometric electrostatic bkding. The exception is the largest PSSS chain (N=3 790)
where the average number of bound DODAP amphiphiles decreases at higher PSSS loadings. This
may reflect entandement or finite size effects, or even bridging between iamellae. In contrast, there
is a progressive increase in Nmpc with progressive addition of PSSS. This may anse fiom the
dependence of the degree of enrichment/depletion of the bound/fiee domains on the statistical
availability of DODAP / POPC and how this changes with increasing amounts of PSSS (Crowell and
Macdonald, 1998). Overall, table 4.3.1 demonstrates that. for a given initial DODAP 1 POPC ratio,
by far the single most important determinant of either NDoDM or Np,,, is the PS S S molecular weight.
Figure 4.3.15 demonstates graphicatly that the number of amphiphiles per polyelectrolyte
chah inmeases iinearly with Uiçreasing PSSS molecular weight. Across this range of PSSS molecular
weights, the N,, / FimD, ratio decreases 40% from low to high molecular weight. consistent with
increased e~chment ofthe PSSS-induced domain with respect to DODAP at high PSSS molecular
weights.
In the cases descnbed above the surface loading with PSSS is generally quite high and the
possibility of perturbations introduced by polyelectrolyte-polyelectroiyte interactions is considerable.
In order to reduce the extent ofchain-chah interactions expenments were conducted with 10 / 90
DODAP 1 POPC membranes and Q - 0.75. Since PSSS binding is proportional to the amount of
cationic surface charge, under these conditions, the overall surface concentration of PSSS will be a
factor of 5.33 lower than in the case of 40 1 60 DODAP 1 POPC membranes with Q - 1 .O. As shown
in figure 4.3.15, the number of amphiphiles per PSSS chain nevertheless increases in a linear fashion
with the size of the PSSS chah However. the total number of amphiphites per PSSS chain is now

I O 1 O0 1 O00 1 O000
Degree of PSSS Polymerization ( Np,,,)
FiGURE 4.3.15 Number of domain-entrapped amphiphiles O\],, + ND",,) (open symbols) and the proportion of NJitterionic to cationic amphiphiles within a domain (N,, 1 b,,) (closed ~ b o l s ) as a fiinction of the polyelectrolyte's degree of polymenzation (NpjSS). Squares: DODAP / POPC, 40/60, Q = 1.0, where Q is the PSSS 1 DODAP aniodcation equivalence. Triangles: DODAP / POPC, 1 ODO, Q = 0.75.
far p a t e r than in the 40 / 60 DODAP / POPC membranes. Since the DODAP cation / PSSS anion
ratio is d nearly stoichiometric in the PSSS-induced dornains, the additional amphiphiles are POPC,
as may be ascertained fiom the high POPC/DODAP ratio within the domains. illustrated in figure
4.3.15. This general effkt, in which a higher (lower) initial surface charge leads to a more compact
(difise) polyelectrolyte-induced domain can be attributed to the influence of entropy of mixing on
the thermodynarnics of domain formation (Crowell and Macdonald. 1998). Overall, the effects of
PSSS molecular weight on domain properties is qualitatively similar at both high and low PSSS
Ioadings.
The 'H NMR results described above demonstrate that PSSS binding to mixed DODAPI
POPC lipid bilayers induces a lateral segregation of DODAP into DODAP-rich domains. These
domains and other polyelectrolyte-induced domains contain a stoichiometric ratio of PSSS to
DODAP charges, so that the polyelectrolyte will essentially lie flat on the bilayer surface provided
that there remains an exçess of cationic charge. These are the general properties of polyelectrolyte-
induced domains in lipid bilayers. The specific findings reported here are that the domains are
observable with both small and large polyelectrolytes and that the domain size. on a per chain basis.
is linearly proportional to the molecular weight of the polyelectrolyte.
The fact that domains are observed via 'H NMR even with a polyelectrolyte chain as shon
as 22 monomers in length suggests that the observed domains must contain multiple polyelectrolyte
chains. The reasoning is as follows. The ability to observe domains via 'H NMR relies on a slow
exchange of lipids between polyelectrolyte-poor and -rich phases. The time scale for exchange must
be slower than the inverse of the difference in quadrupolar splitting between the two environments.
Typicai values are in the range of 1 to 10 ki-iz for the difference in quadrupolar splittings between the
two phases, as seen in figure 4.3.12. Thus, a lipid residence time shoner than between approximately
0.1 and 1 .O ms within a domain will correspond to fast exchange. This allows one to place a lower
limit on the domain size observable via 'H NMR. Assuming that the lipid two-dimensional lateral
das ion coefficient is the same in both phases and equal to a typical bulk value for liquid-crystalline
phosphatidylchoiine, e.g. Do = 5 1 O-" m?s (Tocanne et al.. 1994: Lindblom and Oradd. 1 994). then
the mean-square diasion distance in any direction in a çiven time is calculated via the Einstein
equation in two-dimensions.
The root-mean-square diffision distance which corresponds to difision times (t) between O. 1 and
1 .O ms is calculated to be between 45 and 140 nm. This means that domains which have radial
dimensions smaller than this difision distance will not produce domains observable by 'H NMR.
This difision distance corresponds to domains containinç between approximately 10,000 and
100,000 lipids, for lipids which occupy a surface area of 68 A'. By cornparison of these values to
those displayed in Table 4.3.1 and figure 4.3.15, for single chain dimensions, it becomes obvious that
the calculated dimensions are huge.
These conclusions force us to modiQ the eariier conceptions regarding the origin of the
separate Pake subspectra observed in the %I NMR spectra The previous studies presented here used
polyelectrolytes which were much larger than N = 22. the smallest of the PSSS chains used here.
It was reasonably supposed that a two-dimensional random coi1 conformation of the polyelectrolyte
at the bilayer surface might cover a sufficient surface area such that POPC trapped within the

polyelectrolyte's folds would be incapable of difising out of the domain so-formed on a time scale
sufficiently rapid as to lead to fast exchange spectra. This supposition no longer seems tenable in
light of the present results with shon polyelectrolytes. Instead. it appears that slow exchange 'H
NMR spectra are only to be expected if a domain contains multiple poleyelectrolyte chahs.
This conclusion must be considered tentative uritil lipid lateral difision coefficients within the
domains can be detennined, as it is entirely possible that lipid lateral difision within a polyelectrolyte
domain is slower than in the bulk lipid bilayer. Employing Einstein's equation for difision permits
an estimate of the lipid lateral diffusion coefficient necessary to produce slow-exchange 'H NMR
spectra for the case of domains fonned by the lowest molecular weight PSSS. For domains
containing 55 lipids, each with cross-sectional areas of 68 A'. the diffusion coefficient would have
to lie between 3 x and 3 IO-'' m'ls to produce slow exchange. Le. a decrease between 2 and
3 orders of magnitude relative to the bulk difision coefficient. It is dificult to conceive how this
decrease might be accomplished by so small a polyelectroyte when there is no direct Coulombic
attraction to POPC. It would also seem inconsistent with the nature of the 'H h'MR spectra of the
domain-entrapped POPC. which indicate a highly fluid environment. Finally. the fluorescence digital
imaging techniques of Glaser (1992) indicate that electrostatically-induced domain formation in lipid
bilayers can produce macroscopic domains with dimension approaching the micron scale.
The main difference between synthetic and bioloçical polyelectrolytes is the range of
conformations within a given population. First, synthetic polyelectrolytes are heterogeneous in length
as compared to the homogeneous size distribution of biolgical polyelectrolytes. Second, the
conformations of synthetic polyelectrolytes is dominated by electrostatics. while for biological
polyelectrolytes the conformation is detennined by a combination of electrostatic, steric. plus
hydrogen and covalent bonds. In a sample of biological polyelectrolytes eveq molecule can be
considered to adopt an approximately identical conformation. On the other hand, synthetic
polyelectrolytes have a distribution of conformations for which one panicular conformation can be
described by a statistical probability. Thus. only the average properties of the polyelectrolyte
population is measured. such as the average hydrodynarnic radius or radius of gyration.
Polymer physics predicts for an isolated. freely-jointed chain which lies flat on a two-
dimensional surface, that its radius of gyration should increase according to the polymer's rnolecular
weight to the power 314 (De Gennes, 1979). For the case of polyelectrolytes in low salt conditions,
segment-segment electrostatic repulsion dominates their behaviour and they behave as rigid rods in
which the radius of gyration of a single chain increases iinearly with molecular weight. At high salt
concentrations, when segment-segment electrostatic repulsion is screened, the polyelectrolyte can
collapse into a Gaussian coi1 in which the radius of gration scales according to the square root of
the molecular weight.
The -% NMR data provide little insight regarding the polyelectroiyte's conformation within
the domain, other than indicating that we are not dealing with isolated chains. Specifically, the
domain a m per chah is too smdl to accomodate fieely gratins rigid rods and since the domain size
suggest multiple chains per domain, isolated Gaussian coils are also disregarded. Furthemore the
linear dependence of the domain area per chain upon polyelectrolyte rnolecular weiçht also does not
pennit differentiation between close packed riçid rods or Gaussian coils which are both expected to
produce a linear increase of the total domain area with polyelectrolyte molecular weight. However,
there are severai studies which suggest that polyelectrolytes bound to amphiphiphilic surfaces assume
a rigid rod-like close-packed conformation (de Meijere et al., 1998; Van Gorkom et al., 1990; Lasic.
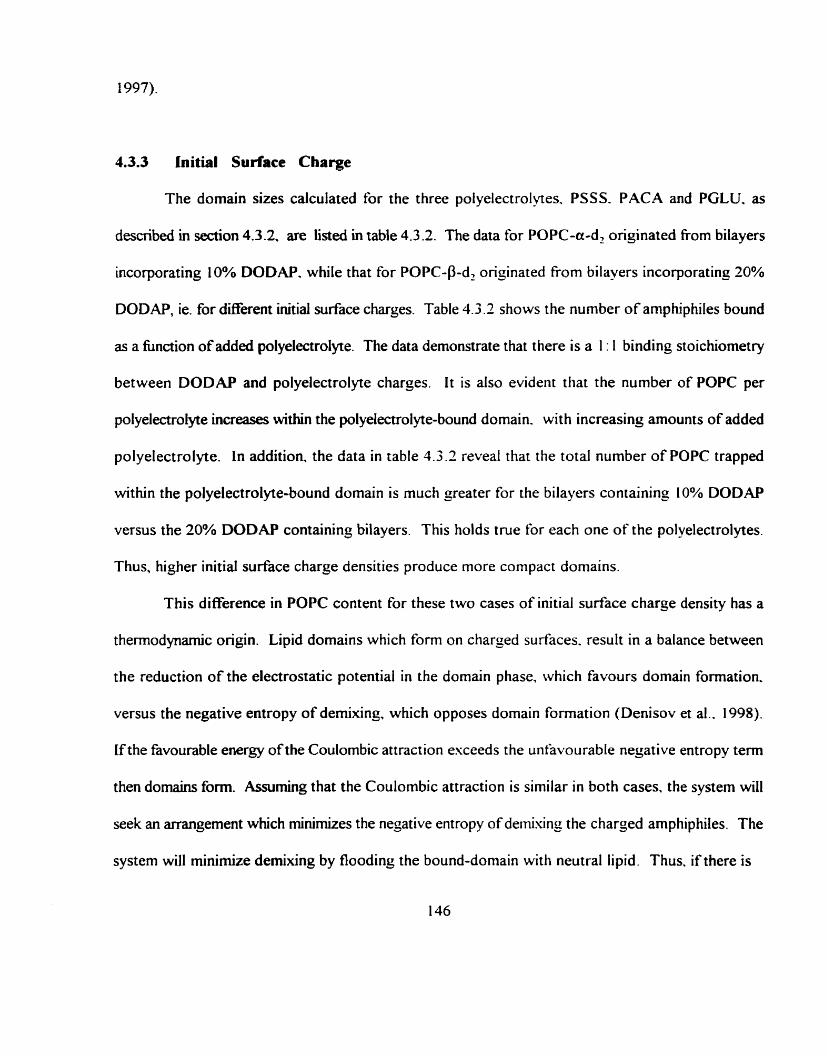
4.3.3 Initial Surface Charge
The domain sizes calculated for the three poiyelectroIytes. PSSS. PACA and PGLU, as
described in section 4.3.2, are listed in table 4.3 2. The data for POPC-a-d, originated fi-om bilayers
incorporating 10% DODAP. while that for POPC-0-d2 originated from bilayers incorporating 20%
DODAP, ie. for different initial surface charges. Table 4.3.2 shows the number of amphiphiles bound
as a fiinction of added polyelectrolyte. The data demonstrate that there is a 1 : 1 binding stoichiometry
between DODAP and polyelectrolyte charges. It is also evident that the number of POPC per
polyelectrolyte increases within the polyelectrolyte-bound domain, with increasing amounts of added
polyelectrolyte. In addition, the data in table 1.3.2 reveal that the total number of POPC trapped
within the polyelectrolyte-bound domain is much greater for the bilayers containing IO% DODAP
versus the 20% DODAP containing bilayers. This holds true for each one of the polyelectrolytes.
Thus, higher initial surface charge densities produce more compact domains.
This difference in POPC content for these two cases of initial surface charge density has a
thermodynamic origin. Lipid domains which form on charged surfaces. result in a balance between
the reduction of the electrostatic potentiai in the domain phase, which favours domain formation.
versus the negative entropy of demixing, which opposes domain formation (Denisov et al.. 1998).
Ifthe favourable energy of the Coulombic attraction esceeds the unîàvourable negative entropy term
then domains form. Assuming that the Coulombic attraction is similar in both cases. the system will
seek an arrangement which minimires the negative entropy of demising the charged amphiphiles. The
system will minimize demixing by flooding the bound-domain with neutral lipid. Thus. if there is

TA8 LE 4.3.2 Number of amphiphiles per polyelectrolyte in polyelectrolyte-bound domain
AniodCation # DOTAP # POPC Total
DOTAP + POPC-a-d, ( 1 0 / 90)
PSSS (340)
1405
1430
1655
PACA (320)
1260
1410
1540
PGLU (550)
2285
2700
3350
DOTAP + POPC-P-d7 (20 / 80)
PSSS (340)
335 795
340 910
300 940
PACA (320)
320 775
320 910
295 940
PGLU (550)
520 1545
550 1875
530 2000
The number in parantheses after the polyelectrolyte abbreviation is the nominal monomers per chah

more POPC initiaily present in the bilayer, then the bound-domain should also contain more POPC
molecules in order to lhnit the dserence between both domains. Thus, there is a greater entropic
cost to forming the sarne compact domains for the case of 10% global composition as compared to
20% global composition. Therefore, there shouldn't be the same degree of enrichment of cationic
charge within the bound domains in bilayers composed of 10% initial surface charge versus 20%.
Specifically, the predictions are compared to experiment by comparing the POPC / DODAP
ratios listed in table 4.3.2 for PSSS. For bilayers composed of 10% DODAP this ratio falls between
4 and 5, for the PSSS-bound domains. This number is reduced to 2 to 3 for the 20% DODAP case,
thus producing more compact domains. A fùrther reduction in the POPC / DODAP ratio to a value
of 1 is observed in table 4.3.2 for a 40% DODAP initial surface charge, for each o f the molecular
weight chains of PSSS. The results for PACA and PGLU also confirm this for domain site, based
on initial surface charge.
The results presented in table 4.3.2 also show the differences in domain formation based on
the chemistry of the polyelectrolyte, as already discussed in section 4.3.1. For the 20% DODAP
bilayers the POPC / DODAP ratio, in the polyelectrolyte-defined domains falls between
approximately 2: 1 and 3: 1 for PSSS and PACA but increases to between 3: 1 and 4: 1 for PGLU.
Thus, the most hydrophilic of the polyelectrolytes forms the largest domains, encompassing the most
POPC molecules.
4.3.4 Ionic Strength
The %f NMR spectra in figure 4.3.16 illustrate the effects of increasing NaCl concentration
on PSSS-induced domains in vesicles initially composed of 40 160 DODAP / POPC-a-dZ. In the
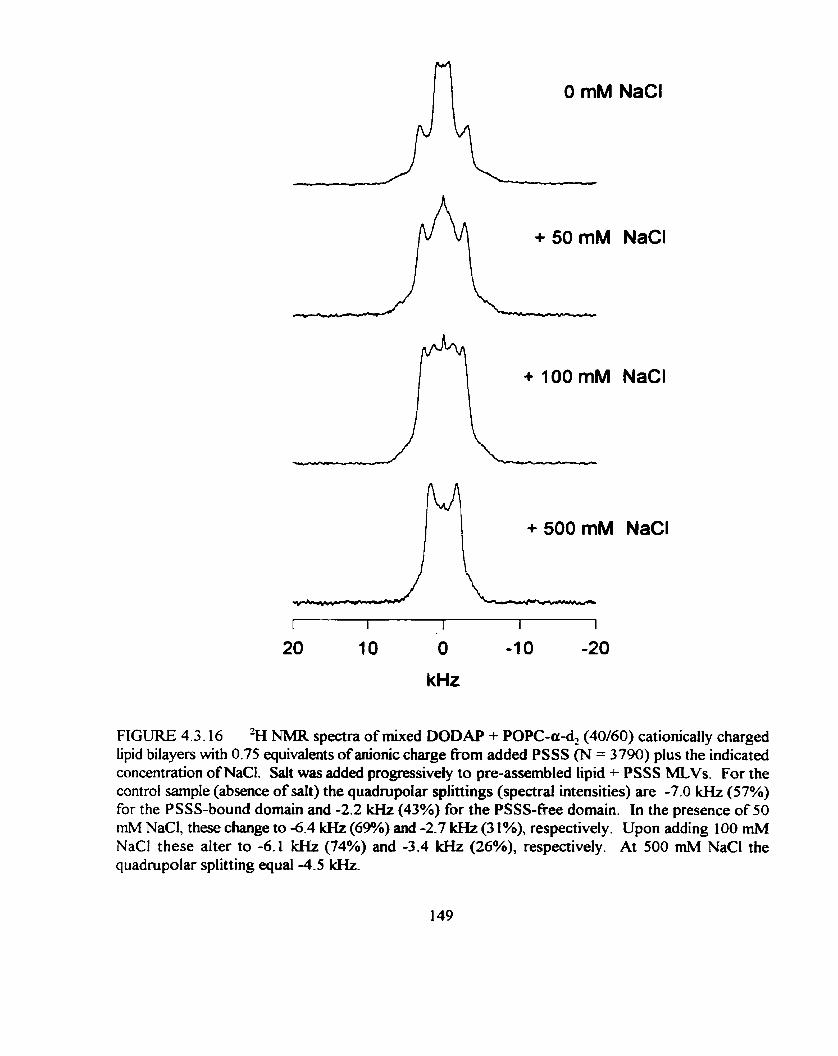
kHz
FIGURE 4.3.16 'H NMR spectra of mixed DODAP + POPC-a-d2 (40160) cationically charged lipid bilayers with 0.75 equivalents of anionic charge from added PSSS (N = 3790) plus the indicated concentration of NaCl. Salt was added progressively to pre-assembled Iipid + PSSS MLVs. For the control sarnple (absence of salt) the quadmpolar splittings (spectral intensities) are -7.0 lrHz (57%) for the PSSS-bound domain and -2.2 kHz (43%) for the PSSS-fiee domain. In the presence of50 mM NaCl, these change to -6.4 kەz (6%) and -2.7 kHz (3 1%), respectively. Upon adding 100 mM NaCl these alter to -6.1 kHz (74%) and -3.4 lcHz (26%), respectively. At 500 mM NaCl the quadmpolar splitting equd -4.5 W.

absence of NaCI (top spectrum) two sub-spectra are superimposed, corresponding to the PSSS-
bound and PSSS-fiee domains. At high ionic strength (bottom spectrum) only a single quadmpolar
splitting is evident and its value corresponds to that of the control measured in the absence of PSSS.
Since NaCI itself has little influence on the quadrupolar splittings, at this concentration, this result
indicates that there is a dissipation of the domains due to charge screening between the
polyelectrolyte and lipid bilayer surface which leads to polyelectrolyte desorption.
At intermediate ionic strengths (rniddle two spectra) the two -%I NMR Pake doublets gradually
coalesce with increasing the NaCl concentration, as the quadmpolar splitting of each sub-spectrum
progressively reverts towards the controt value. Other experiments, soon to be mentioned, with other
polyelectrolytes such as polyA or PACA suggest that even at 100 mM NaCI, little if any fiee PSSS
will be found in solution. Therefore, although domains exia at higher ionic strengths, the domain size
and composition is aitered. Qualitatively, the quadrupolar spIittings and spectral intensities indicate
that a higher ionic strength leads to a lesser degree of e ~ c h r n e n t with respect to the oppositely
charged amphiphile and a less compact polyelectrolyte-bound domain.
The results presented in figure 4.3.16 indicate that the PSSS-bound and PSSS-free domains
CO-exist on the sarne larnellae, as opposed to occupying separate lamellae. The gradua1 coalescence
of the 'H NMR sub-spectra fiom the PSSS-bound and PSSS-fiee populations upon titration with
NaCI indicates a complete re-equilibration between the two populations. This can only occur via a
lipid exchange mechanism. If the two populations occupied separate lamellae, then such an
exchange would require inter-larneUar iipid transport, an energetically unfavourable event with a time
scale measured in days when not enzymatically catalyzed. If the two populations occupied identical
lameiiae, then such an exchange would require only intra-larneilar iipid transpon, Le., lateral difision.
Intra-larnellar lateral lipid difision is fast relative to the time required for salt addition and sample
equilibration in these titration experiments (severd hours).
There is a fùrther, statisticai, arguement favouring the view that the PSSS-bound and PSSS-
free domains occupy common lamailae. First consider the DNA-cationic liposome complexes
investigated by Lasic et al., (1997) which were small Liposomes (130 nm average diameter) composed
of 1 : 1 DODAB / cholesterol. To these Liposomes, DNA chains of 4.7 kilobases were added in a 0.5 : 1
charge ratio to which heterogeneous complexes were formed. This can be understood by assuming
an approxirnate cross-sectional area of 68 A' per lipid, which amounts to about 16 DNA chains per
liposome. The probability of significant nurnber density fluctuations away from the global average
is profound resulting in a heterogeneous mixture. On the other hand, for MLVs with an average
diarneter of 1 Fm consisting of 40 160 DODAP 1 POPC mixtures such as employed here, adding PSSS
in a O S : 1 anionxation ratio produces a global polyelectrolyte chain 1 liposome ratio of 80,000 for the
case of the PSSS 22-mer. The probability of number density fluctuations so large as to produce
distinct liposomes having dl versus none of the polyelectrolytes, and thereby giving rise to the
obsenred 'H NMR spectra, seems remotely small.
4.4 Influence of Polyelectrolyte Binding on Deuterated Cationic
Amphiphiles
The previous results have focussed on the consequences of anionic polyelectrolyte-cationic
amphiphile interactions through the use of 'H NMR of choline-deuterated phosphatidylcholine. The
goai of the studies reported here is to probe directly the consequences of the complexation of three
cationic amphiphiles to anionic polyelectrolytes Ma 'H NMR The three are CTAB, DOT.4.P and TC-
CHOL (3P-[N-(N',N:N'-trimethylarninoethane)carbamoyl] cholesterol, each deuterated at their
quaternary rnethyl positions. In these studies the three specifically deuterated cationic amphiphiles
are rnixed into lipid bilayer membranes containing phosphatidylcholine and allowed to interact
specificaily with polyA. The 'H NMR spectra of the three deuterated cationic amphiphiles are
exarnined and compared as a fùnction of their mole fraction in mixtures with POPC. the amount of
added anionic polyelectrolyte and the ionic strength.
4.4.1 'A NMR of Quaternary MetbyCDeuterated Cationic Amphiphiles in Lipid Bilayers
The structures of the three cationic amphiphiles used in this study along with their
deuterolabeis are shown in figure 4.4.1.
The -% NMR spectra obtained upon incorporation of the three cationic amphiphiles into non-
deuterated POPC bilayer membranes is shown in figure 4.4.2. Each cationic amphiphile produces a
Pake pattern lineshape which is indicative of lipids undergoing fast axial motional averaging.
Previous "P MIR experïments indicate that al1 the mixtures of cationic amphiphiles with POPC, at
the particular mole fiactions specified in these studies, produce fluid lipid bilayers as opposed to some
152

FIGURE 4.4.1 Structures of the three cationic amphiphiles employed here. From top to bottom, CTAB-y-d,, DOTAP-y -d, and TC-CHOL-y -d,.
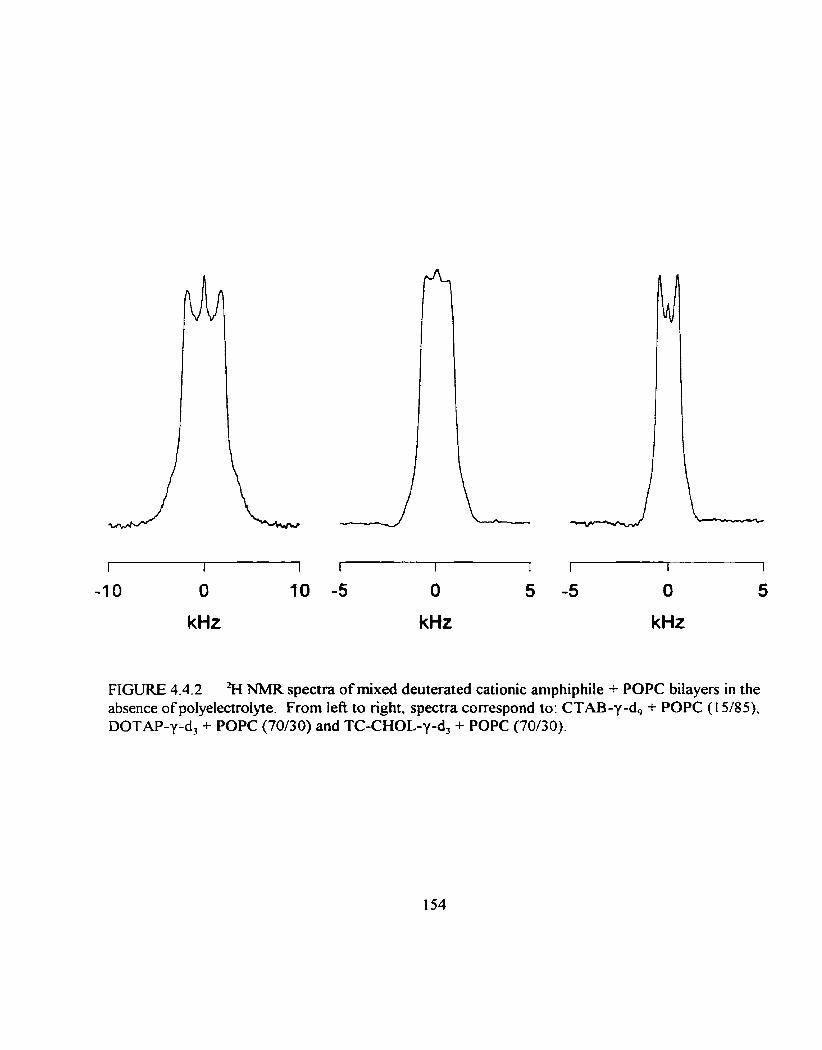
kHz kHz
I I I
-5 O 5
kHz
FIGURE 4.4.2 %I NMR spectra of rnixed deuterated cationic amphiphile + POPC bilayers in the absence of polyelectrolyte. From le& to right, spectra correspond to: CTAB-y-d, + POPC ( 1 5 /85 ) , DOTAP-y-d, -t POPC (70/30) and TC-CHOL-y-d, + POPC (70/30).
other architecture. The spectra in figure 4.4.2 indicate that each of the cationic amphiphiles
incorporate into the bilayer and experience considerable motional averaging but that in each case the
orientational order parameter at the position of the quatemary me:hyl deuteron labels is not so smatl
that the motionai averaging is effectively isotropic. The quadmpolar splittings measured for these
three cationics reflects a combination of differences in configuration and order at the level of the
trimethyiammonium group. Note that if the three cationic amphiphiles are arranged such that the
boundaries between theu respective hydrophobic and hydrophylic regions are aligned, then the CT.4B
quaternary methyls lie close to this boundary, while the polar regions of DOTAP and TC-CHOL
extend far from this boundary. If these three cations adopt equilibrium locations within the lipid
bilayer such that the boundary between their hydrophobic and hydrophilic regions are similar. then
the extension of the cationic trimethylamino groups into the aqueous bathing medium increases in the
order CTAB < DOTAP - TC-CHOL. The difference in the orientational order parameter that would
result between the three cationic amphiphiles would be sufficient to explain the differences in the
quadropolar splittings observed in figure 4 - 4 2
The quadmpolar splittings measured for each of the cationic amphiphiles depends on the
composition of the lipid bilayer membrane, as s h o w in figure 4-43. In the case of CTAB-y-d, the
quadrupolar splitting is large initially, but decreases progressively with increasing mole fraction of
CTAB relative to POPC. CTAB can only be added in amounts below approximately 15-20% before
the rnicellization properties of the surFdctant begin to isotropically narrow the 'H NMR spectra. It
seems as though incipient rnicellization is a factor in deterrning the concentration dependence of the
quadrupolar splittings for CTAB-y -dg.
Increasing the mole fraction of either DOTAP-y-d, or TC-CHOL-y -d , relative to POPC

Mole Fraction of Cationic Lipid
F I G U E 4-43 'H NMR quadrupolar splittings from lipid mixtures of the three deuterated cationic amphiphiles + POPC with increasing mole eaction of cationic iipid in POPC membranes: CTAB-y -d, (triangles), DOTAP-y-d, (cirlces) and TC-CHOL-y-d, (squares).
increases the quadrupolar splitting fiom a value of about 500 Hz to 1000 Hz. These values are
reminiscent of those deterrnined for the trimethylaminocholine deuterons in DMPC (Macdonald, et
al., 199 1). The headgroup of phosphatidylcholine undergoes a conformational response to changes
in surface charge density because of the large dipole moment that it bears. Since the cationic charge
in DOTAP and TC-CHOL is a monopole, there should not be any such response of the
trimethylammonium headgoup of these cationic amphiphiles to surface charge. Thus, the effect of
added cationic amphiphile on the quadrupolar spiittings as reported in figure 4.4.3 is more than likely
due to changes in orientational ordenng and dynamics.
The vafues of TF obtained for various cationic amphiphiles mixed with POPC, at different
proportions, are listed in table 4.4.1.
TABLE 4.4.1 'H NMR TZqc relaxation times for cationic amphiphiles mixed with POPC
POPC/X (moVm01) CTAB-y-& ( m ) DOTAP-y -d3 (ms) TC-CHOL-y -d, (ms)
95/5 0.88 - -
The results were obtained fiom quadrupolar echo intensity decay curves and were mono-exponential
for al1 the cationic amphiphiles studied. The T,4' values increased in the order, CTAB < DOTAP <
TC-CHOL, at comparable molar compositions. As the content of CTAB increased in these mixtures
157
the values of T F also increased. But, the results for DOTAP and TC-CHOL differed fiom this
behaviour in that TF decreased with increasing mole fiaction of cationic amphiphile. The relative
values of Tlqc for the three cationic amphiphiles have two possible origins. First, they could reflect
differences in orientational order associated with differences in the location of the trimethylamino
deuterons. Second, they could reflect differences in the lateral diflUsion coefficients of the three
cationic amphiphiles within the plane of the bilayer (Bloom and Stemin, 1987). Rein1 and Bayer1
(1993) have demonstrated the relationship between reduced tateral dission of lipids and increased
TZqc. I f this is so in these studies, this suggests that the diffisivity of the cationic amphiphiles
increases in the order: TC-CHOL < DOTAP < CTAB. It is interesting to note that this is the reverse
order of the cross-sectional area occupied by the three lipids when incorporated into bilayers.
However, both lipid packing and headgroup interactions with water and other lipids are major
determinants of diffisivity in bilayers (Tocanne et al., 1994; Lindblom and Oradd, 1994). Since t h e
cationic amphiphiles are expected to differ fiom one another in both respects, it becomes difficult to
determine the origin of the different values of Tzqc.
4.4.2 Effect o f Polyelectrolytes on 'E NMR of Deuterated Cationic Amphiphiles
The two anionic polyelectrolytes used in these studies are polyA and PACA, which have
already been show to induce domain formation in mixed bilayers, as demonstrated by the H NMR
results of choline deuterated POPC. When beginning these studies it was highly desirable to establish
whether dornain formation could also be observed fiom the perspective of these quaternary methyl-
deuterated cationic amphiphiles. The 2H NMR spectra of these cationic amphiphiles are shown in
figure 4.4.4 in the absence (top row) and presence (middle row) of polyA. The spectra were obtained
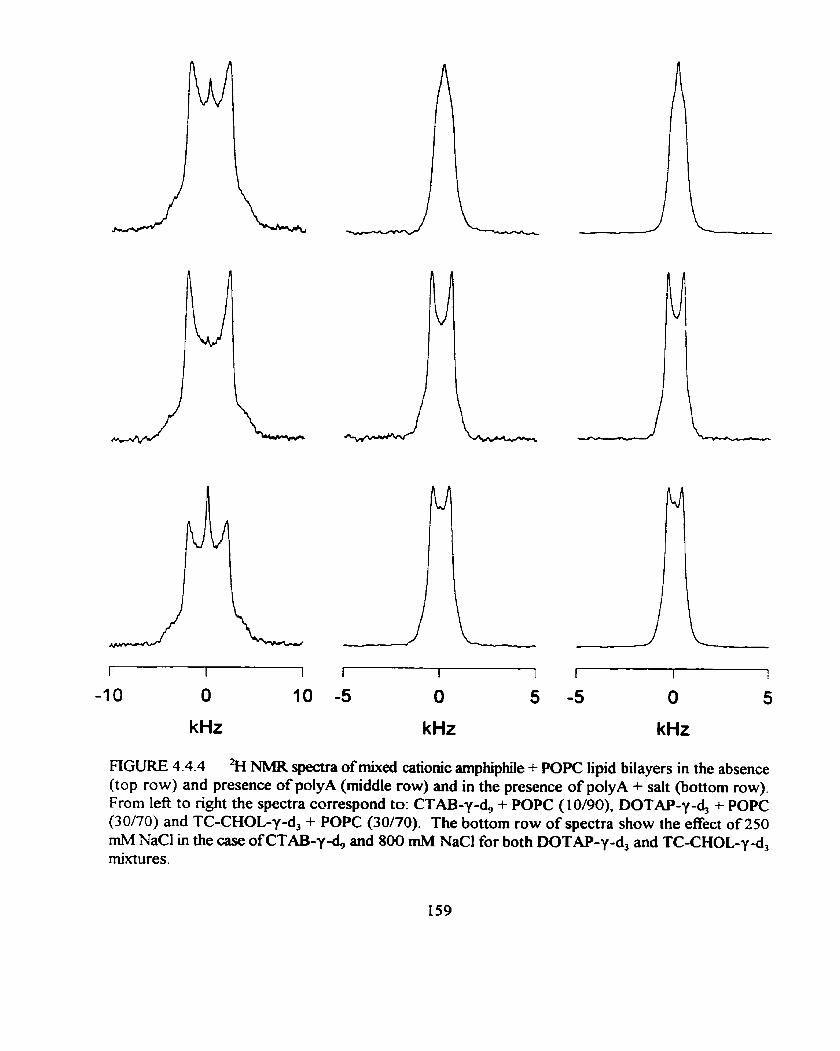
-1 0 O 10 -5 O 5 -5 O 5
kHz kHz kHz
FIGURE 4.4.4 %I NMR spectra of mixed cationic amphiphile + POPC lipid bilayers in the absence (top row) and presence of polyA (middle row) and in the presence of polyA + salt (bottom row). From left to right the spectra correspond to: CTAB-y-d, + POPC (10/90), DOTAP-1-4 + POPC (30/70) and TC-CHOL-y-d, + POPC (30170). The bottom row of spectra show the effect of 250 rnM NaCl in the case of CTAB-y-d, and 800 m M NaCl for both DOTAP-y-d3 and TC-CHOL-y-d, mixtures.

fiom lipid bilayers çontaining POPC mixed with (f'kom left to right): 10% CTAB-y-d,, 30% DOTAP-
y-d, and 30% TC-CHOL-y-d, . In each case, the effect of adding polyA is to increase the
quadmpolar splitting. There is no evidence for separate polyA-bound or polyA-free components.
At ail ratios of added poiyA anionic charges to cationic amphiphile charges, only a single Pake pattern
cornponent was observed in the %I NMR spectrum from each of the methyl-deuterated lipids. Even
low temperature experiments, which aid in resoiving such differences, were of no avail in these cases.
The question then arises as to why distinct fiee and bound populations of cationic amphiphiles
were not observed, when fiee and bound POPC molecules were differentiated. Since the cationic
amphiphiles associated with the polyelectrolyte are electrostatically bound, then it seems unlikely that
there is fast exchange between tiee and bound cations especially when Mrittet-ionic POPC has been
already shown to be in slow exchange between its bound and fiee forms. A reasonable explanation
is that the difference in quadrupolar splittings between the fiee and bound cationic amphiphiles is so
smali that they cannot be resolved spectroscopicalIy. In the case of choline-deuterated POPC, the
quadmpolar splitting response was sensitive to surface electrostatic charge, a quantity which was
vastly different for the polyelectrolyte-bound and -tiee phases. For rnethyl-deuterated cationic
amphiphiles the quadrupolar splitting response reflects local ordering effects, which do not widely
differ between the bound and free forms of the cationic amphiphiles.
Figure 4.4.5 shows the effects of adding increasing amounts of polyA and PACA on the
quadrupolar splittings, for the different cationic amphiphiles. In al1 three cases, not only does the
quadrupolar splitting linearly increase up to the 1 : 1 added anion / cation charge ratio but there is also
no hrther change observed beyond this point. These results suggest the formation of a 1: 1
stoichiometnc complex between the anionic and cationic charged groups, as already deduced fiom

Polyelectrolyte - Cation Charge Ratio
FIGURE 4.4.5 'H NMR quadrupolar splittings of rnixed cationic amphiphiles + POPC bilayers as a fiinction of added polyelectrolyte: CTAB-y-d, + POPC (10/90) (triangles), DOTAP-y-d3 + POPC (30/70) (circles), TC-CHOL-y-d, + POPC (30170) (squares). Open symbols refer to the addition of polyA while closed syrnbols refer to the addition of PACA. The quadrupolar splittings are plotted as the difference between the values measured for a given mixture of the cationic membranes with polyelectrolyte and the value measured in the absence of polyelectrolyte.

the deuterated POPC studies. As will be discussed shortly, TC-CHOL is the exception. The
absolute change in quadrupolar splitting, at the apparent neutralization point decreases in the order:
CTAB > DOTAP > TC-CHOL. The largest observed change in quadrupolar splittings for the two
extreme cases of 100% fiee to approximately 100% bound cationic amphiphiles is merely 600 Hz,
for CTAB. This gives definitive proof for the non-observance of distinct domains via the use of
methyl-deuterated cationic amphiphiles. This maximum observed change is smaller than the minimum
requirement of about 1 kHz required to spectroscopically distinguish domains for choline-deuterated
POPC.
Figure 4.4.5 also shows that polyA and PACA have virtually identical effects on the
quadrupolar splitting of each cationic amphiphile, implying that the precise structure of the
polyelectrolyte is less important than the fact of its charge. Buser et al, (1995) have reported that
polyelectrolyte binding is essentially independent of the chernical nature of lipids and polyelectrolytes.
The values of TPc obtained for the addition of polyA to the deuterated cationic amphiphiles
are provided in table 4.4.2.
TABLE 4.4.2 'H NMR T T relaxation times for POPC + cationic amphiphile + polyA + sait
tncreasing the amount of added polyA likewise causes an increase in the values for Tsc, relative to
the value obtained in polyAYs absence. This behaviour is similar for al1 three cationic amphiphiles.
It is interesting to note that no measurable difference in the longitudinal relaxation time T, could be
obtained upon addition of polyA. Similar trends have been reported by Reinl and Bayer1 (1 993) for
the electrostatic association of phosphatidylglycerol with myelin basic protein. The fact that T2 is
altered while T, remains unchangeci indicates that the changes in T T produced by the polyelectrolyte
is due to changes in the spectral density of slow motions, such as lateral difision.
The fact that both the quadrupolar splitting and Tzqc increase, by electrostaticaily coupling
polyA to the Mayer surface, suggests that polyA increases the order of the cationic amphiphile's head
group. PolyA is known to intercalate between membrane lipids and its size, rigidity and electrostatic
interaction could contribute to a decrease in the amplitude of motion of the cationic amphiphile head
group. The increase in the order parameter should be manifest in both the quadrupolar splitting and
T,qc (Halle, 1 99 1 ).
Another potential source for increased TPc relaxation times, when polyA is coupled to the
cationic amphiphiles, is slower lateral diffusion. Reinl and Bayer1 (1993) have demonstrated that a
reduction of the lipid lateral difision coefficient by one order of magnitude leads to a twofold
increase in T,, which is more or less what is observed in table 4.4.2 for polyA. Thus. both
electrostatic binding to polyA and the archipelago efFect (Saxton. 1993), in which the tortuosity of
the difision path increases due to the presence of the polyelectrolyte, should tend to decrease the
difision coefficient of the bound cationic amphiphile.

4.4.3 Eff't of Ionic Strength on 1:l Cationic Amphiphile-PolyA Complexes
The effect of sait addition on the %I NMR spectra of the deuterated cationic amphiphiles. for
1: 1 charge complexes formed with polyq is shown in the bottorn row of figure 4.4.4. The bottom
row of spectra in figure 4.4.4, from lefi to right, are the results of the addition of 250 rnM NaCl to
a 10/90 (moVmol) CTAB-y-d, 1 POPC mixture and 800 mM NaCl to 30170 DOTAP-y-d3 / POPC
and TC-CHOL-y-d, / POPC vesicles, respectively. The most obvious effect of the added salt, to the
1 : 1 charge complexes formed between polyA and cationic amphiphile, is to reduce the size of the
quadrupolar splitting. But, by comparison of the top and bottom rows of spectra in figure 4.4.4 it
is obvious that these quadrupolar splittings do not return back to the values measured in the absence
of polyA.
The titration curves, for increasing arnounts of added salt to the 1 : 1 charge complexes formed
between polyA and the three different cationic amphiphiles, are shown in figure 4.4.6. There is a
progressive decrease in the quadrupolar splittings with increased additions of salt. The response is
approximately linear with salt concentration, until eventually leveling off. This effect is the opposite
to that noted for the titration of polyA to the binary mixtures of lipids. Since the salt has no direct
effect on the quadrupolar splittings of the deuterated cationic amphiphiles, as shown in figure 4.4.6,
then the effect of salt can be attributed solely to its influence on the polyelectrolyte interaction with
the membrane surface. Since the effect of polyA is reversed by salt, it is most likely that salt acts to
screen the electrostatic interaction of polyA to the cationic surface. Thus, NaCl behaves as an
indifferent electrolyte rather than competing for binding sites with the polyelectrolyte.
The greatest change in quadrupolar splittings, noted for the addition of salt, is measured for
CTAB-y-& while the smallest change is obtained with TC-CHOL-y-d,. This simply reflects the fact
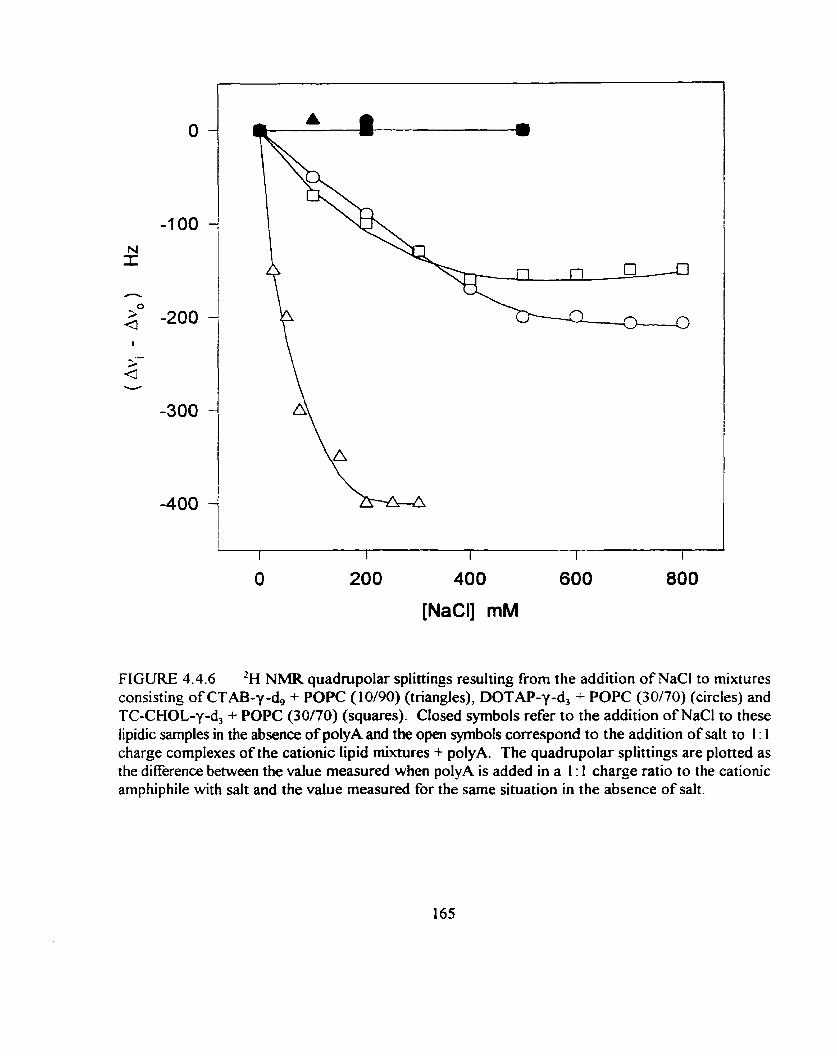
FIGURE 4.4.6 'H NMR quadrupolar splittings resulting from the addition of NaCl to mixtures consisting of CTAB-y-d, + POPC (10/90) (triangles), DOTAP-y-d, + POPC (30170) (circles) and TC-CHOL-y-d, + POPC (30/70) (squares). Closed symbols refer to the addition of NaCl to these Iipidic samples in the absence of polyA and the open symbols correspond to the addition of salt to 1 : 1 charge complexes of the cationic lipid mixtures + polyA. The quadrupolar splittings are plotted as the difference between the value measured when polyA is added in a 1 : 1 charge ratio to the cationic amphiphile with salt and the value measured for the sarne situation in the absence of salt.
that the addition of polyA to CTAB-y-& containing vesicles produced the greatest change while for
TC-CHOL-y -d, it was the least. However, the salt concentration required to achieve the maximum
reversal of the original polyA effèct is greater for DOTAP-y-d, than for CTAB-y -4 or TC-CHOL-y-
d,. But, before coming to any conclusion as to the strength of interaction between the cationic
amphiphile and polyA it should be noted that CTAB is initially present at 10 mo1eY0 as opposed to
the 30 mol% levels for DOTAP and TC-CHOL.
A direct measure of the amount of bound polyelectroiyte is obtained via a UV difference
binding assay. Figure 4.4.7 displays the results for the arnount of po1yA binding, to membranes
composed of one of the three cationic amphiphiles, as a function of sait concentration. In figure
4.4.7A each of the cationic amphiphiles was present at 10 mole%, which eliminates differences due
to initiai surface charge densities. in each instance polyA was added in an arnount to neutralize the
surface charge, if 1 : 1 binding occured. Each case shows a sigmoidal increase in the arnount of fiee
polyA with increasing salt concentration. Enough sait is added, in each instance, to remove al1 of the
bound polyelectrolyte f?om the membrane surface. One aiso observes that the amount of salt required
to remove polyA fiom the charged membrane surface, in its entirety, decreases in the order CTAB
> DOTAP > TC-CHOL. These results indicate that TC-CHOL binds po1yA with the least affinity.
This is aiso evident fkom the fact that not al1 of the added polyA adsorbed to membranes composed
of TC-CHOL.
Figure 4.4.78 shows the effects of added salt on polyA binding to cationic lipid bilayers
containing both 10 and 30 mo1Y0 of either TCCHOL or DOTAP. The cornparison with CTAB could
not be made, at both proportions in the membrane, since higher amounts of it solubilize Iipid bilayers.
The same sigmoidal dependence of polyA binding is noted for both initial surface charges. The
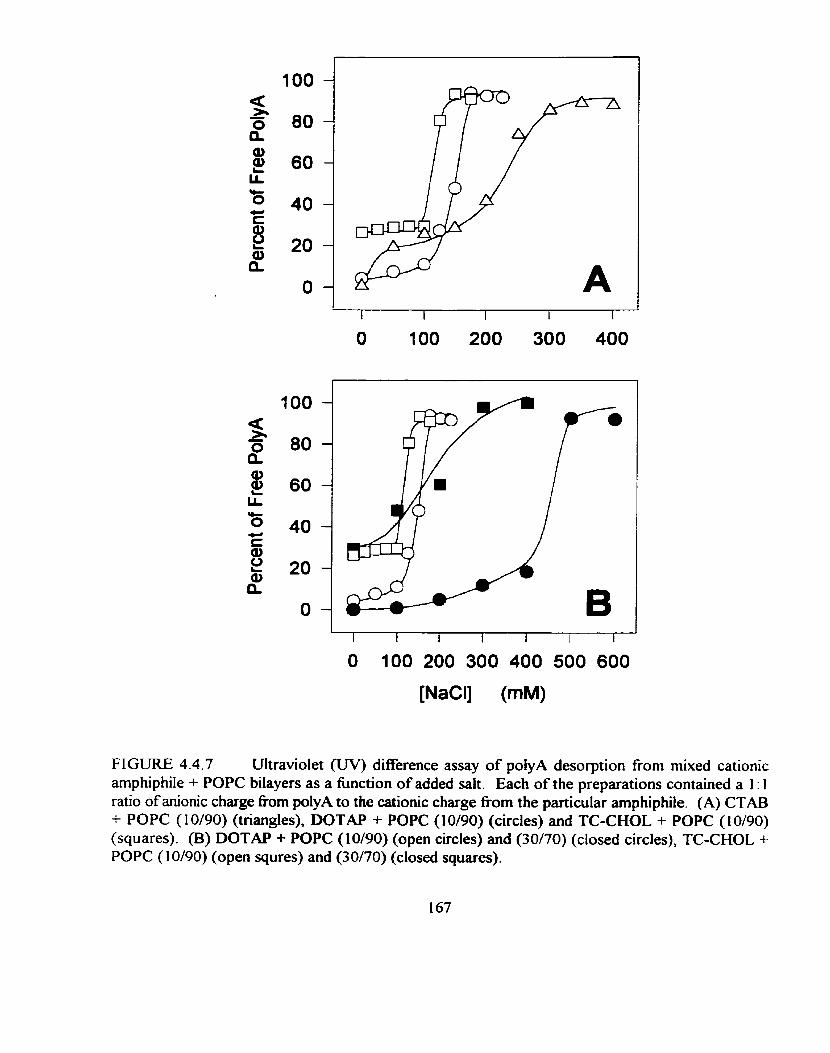
FIGURE 4.4.7 Ultraviolet 0 difference assay of polyA desorption from mixed cationic amphiphile + POPC bilayers as a function of added salt. Each of the preparations contained a 1 : 1 ratio of anionic charge fiom polyA to the cationic charge from the particular amphiphile. (A) CTAB + POPC (1 0/90) (triangles), DOTAP + POPC (10/90) (circles) and TC-CHOL + POPC (1 0/90) (squares). (B) DOTAP + POPC (10190) (open circles) and (30170) (closed circles), TC-CHOL + POPC ( 1 0190) (open squres) and (30/70) (closed squares).
difference for the two cases is that the curves shifi to a higher salt concentration at higher surface
charge density. For the case of 30 mole % cationic lipid, the difference between TC-CHOL and
DOTAP is magnified, clearly indicating that DOTAP binds polyA with a greater affinity.
Approxirnately 200 mM more NaCl is required to fùlly screen the mutual electrostatic attraction
between the cationic biiayers and polyA for the case of DOTAP over TC-CHOL.
It is interesting to note the difference between the results gained by 'H NMR and the UV
binding assay. The linear dependence of the change in quadrupolar splittings, for added sait, is in
direct contrast to the sigmoidal dependence of the UV results. This can be understood by realizing
that the UV assay monitors the desorption of entire polyelectrolyte molecules and thus the
cooperativity of binding and desorption of the polyelectrolyte can be monitored. On the other hand,
'H NMR monitors events at the level of individual arnphiphiles and thus the monomer segments of
the pol yelectrolyte. Increasing the salt concentration should reduce the number of pairwise
interactions, producing incremental changes which can be sensed by 'H NMR. When the incremental
changes reach the point where entire polyelectrolytes desorb from the surface then they will appear
in the supernatant where they can be measured by UV spectrophotometry.
4.4.4 Conclusions
These studies were airned at not only gaining insight into the state of the cationic amphiphile,
when mixed in t e rnq mixtures of lipid and polyelectrolyte, but also at differentiating aspects of the
behaviour of several cationic amphiphiles in their role as agents of gene transfection. The cationic
amphiphiles must each filfil1 at least two requirements for their application in gene transfer. First,
they must bind DNA with sufficient affinity in order to neutralize its charge and aiso condense DNA
to reduce the energy barrier to transmembrane transport. The strong electrostatic binding also
ensures that the maximum arnount of DNA can be transported. At the same time, the cationic
amphiphile must not bind DNA so tightly that it will not dissociate fiom the complexes when
endocytoseci, since it would fail to become utilized by the cell. Thus, it seems that the fine tuning of
the strength of this interaction would offer a route towards increased efficiency of transfection.
In short, the UV binding assay results have dernonstrated that the three different cationic
amphiphiles studied here differ with respect to their strength of interaction with DNA. CTAB
appears to bind DNA with the greatest avidity, since it is most resistant to the effects of salt, whereas
TC-CHOL exhibits the Iowest affinity.
The quantitative results obtained from 'H NMR also demonstrate the differences in the
behaviour of the three different caîionic amphiphiles. The effects of DNA binding on the qudrupolar
splittings and the transverse relaxation times of the cationic amphiphile's quaternary methyl deuterons
f d off in the order CTAB > DOTAP > TC-CHOL. Evidently the size of the DNA induced effects
correlates with the strength of DNA binding. From the results already presented for the same three
cationic amphiphile's effect on the headgroup of choline deuterated POPC, it was detetmined that
CTAB produced the most compact domains with the greatest e ~ c h m n t , while DC-CHOL produced
the most d f i s e domains. It is reasonable to consider that the more compact domains would produce
quantitatively larger effects on the cationic amphiphile's orientational order. Thus, both 'H NMR
perspectives point to the conclusion that the strength of interaction between DNA and the three
cationic amphiphiles decreases in the order CTAB > DOTAP > TC-CHOL.
One may understand the physical basis for the strength of interaction between cationic
amphiphiles and DNA by considering the depth of binding. For monovalent amphiphiles, the strength
of electrostatic binding by polyelectrolytes may be greater when the amphiphile's charge is located
deeper with the polar region of the lipid bilayer surface. Consider that when a polyelectrolyte like
DNA binds a charged surface that there must be some loss of the waters of hydration of the charged
moieties. It may be that this occurs more readily when the targeted charges are located in the lower
dielectric constant medium-
Several lines of evidence indicate that the cationic charge of CTAB penetrates deeper into
the bilayer's polar region while TC-CHOL extends fbrthest into the aqueous surroundings. First, the
cationic charge of CTAB is located irnmediately above the hydrophobic region of the molecule
whereas for DOTAP and TC-CHOL this charge is separated from the hydrophobic portions by a
polar spacer arm. Second, the larger quadrupolar splitting of the membrane-bound quatemary methyl
deuteratd CTAB indicate a greater l o d order. This is consistent with a greater depth of penetration
of the charged groups into the bilayer interior. Finaily, the sensitivity of the "voltmeter" response.
to the cationic amphiphiles, decreases in the order CTAB > DOTAP > TC-CHOL. The results are
interpreted to arise fiom the fact that the most sensitive "voltmete?' response fiom choline-deuterated
POPC, to a given surface charge density, corresponds to the charged species with the greater depth
of penetration into the membrane proper.
1.5 ''P NMR Observations of the Morphology of Complexes with
Cationic Am phiphiles
DNA-cationic liposome packages can be transferred across a cellular membrane by an
endocytotic mechanism (Leventis and Silvius, 1990; Zabner et al., 1995; Friend et al., 1996). M e r
entering the c e t the endosomal membrane is destabilized by some stimulus and the genetic material
is released for uptake by the cell's tmmaiption mechanism. The morphology of the DNA-amphiphile
complex is a major factor in determining the efficiency of transmembrane transfer. The morphology
of such complexes is known to depend on factors such as DNA size, the size of liposomes and the
identity of the cationic amphiphile and "helpe?' lipids (Gershon, et al., 1993; Sternberg et al., 1993;
Gustafsson et al., 1995; Mok and Cullis, 1997; Hamies et al., 1998; Battersby et al, 1998).
In the latter case, gene transfection technologies favour the use of the bilayer destabilizing
amphiphile, phosphatidylethanolamine (PE) (Felgner et al., 1994; Farhood et al., 1995). It is believed
that PE produces non-lamellar architectures, in mixtures with cationic amphiphiles, which helps to
destabilize the target membrane's lipid bilayer, thereby reducing the energy to transmembrane
transport of DNA.
Different cationic amphiphiles are known to display dserent transfection efficiencies Farhood
et ai., 1992; Egilmez et al., 1996; Deshmukh and Huang, 1997) for different cell lines. Even though
the role of the cationic lipid is to electrostatically bind both DNA and the target membrane it is also
possible, in theory, that these amphiphiles may also influence the morphology of the package.
It has been shown that the efficiency of DNA entrapment (Monnard et al., 1997) and
transfection potency (van der Woude et al., 1995) decrease with higher molecular weight DNA
171

hgments. Even though DNA seems to play a more passive role in altenng the morphology of these
"packages", clearly the interactions between DNA, the cationic amphiphile and helper lipid al1
contribute to the final morphology of the cornplex.
The 'lP NMR studies reported here wiil focus on the morphology of the complexes formed
by mixtures of these molecules. The size of the DNA molecule will be examined by comparing two
different single chah species, one a 21 nucleotide oligomer and the other an 18,000 nucleotide
polymer. The effects of two different cationic amphiphiles is also studied, CTAB and DOTAP.
Finally, the role of the "helper" lipid is studied by comparing the two zwitterionic lipids, PC and PE.
"P NMR is capable of disthguishg between various membrane architectures (Cullis and de
Kniijff, 1979). As weii, the effects of complexation on nucleotide chah dynamics may be examined
under differing conditions of the global anion / cation ratio as well as the ionic strength.
4.5.1 UV-assay of OligoS and PolyA Binding to DOTAPIPOPC mixtures
The structures of the chernical species used for these studies is show in figure 4-51.
The results for the binding of the two dEerent sized nucleotide chains, OligoS and PolyA, to cationic
MLVs composeci of 3O/7O DOTAP / POPC (rnoVmol) was quantified by a UV-difference assay. The
results are shown in figure 4.5.2.
The binding of both nucleotide chains is quantitative up to the anion / cation equivalence
point. Just above this point, the binding of OligoS essentially ceases. However, polyA continues to
bind to the surface up to a 2: 1 anion / cation charge ratio. This indicates that polyA is capable of
binding to the cationic membrane surface with only a fiaction of its monomer units in actual contact
with the surface. This means that the unbound charge of the nucleotide chah must extend outwards

O
9"" cH1,~e0 I 4-p POPC
DOPE
OligoS
FIGURE 4 - 5 1 Structures of the zwitterionic amphiphiles (POPC and DOPE) and nucleic acid chahs (PoiyA and OligoS) employed here.
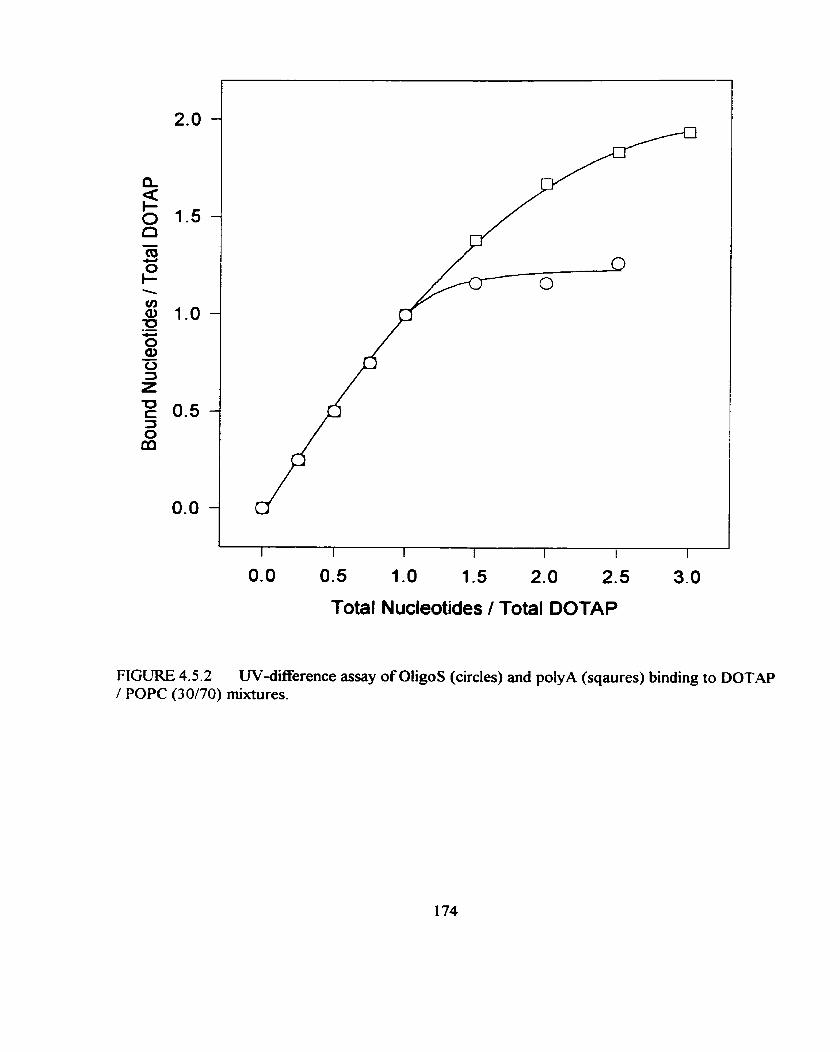
from the su~ace. Thus, polyA must undergo a change from a "pancake" conformation below the
equivalence point, to that of a "brush" above this point. For the bound OligoS, the "pancake"
conformation persists at al1 times.
The different behaviour exhibited by polyA and OligoS rnay be attributed to the
conformational flexibility of the chains. For relatively stiff polynucleotide chains it is usefd to
consider the persistence length of the chain, which is a measure of the segments of the chain to
continue in the sarne direction. When the chain is short in comparison to its persistence length then
it behaves as a rigid rod. Lfthe chah is several times longer than its persistence length then it retains
overall chah flexïbiiity and it behaves like a random coi1 polyrner, in solution. The persistence length
for double-stranded DNA can be greater than 50 nm, which corresonds to approximately 150 base
pairs (Merchant and RiIl, 1997). Even though the persistence length of single-stranded nucleotide
chains may be sfightly shorter than double-stranded, it is clear that OligoS is more like a rigid rod
while polyA should possess much more chain flexibility. Consequently, polyA is more capable of
adopting a "brush" conformation, above the equivalence point. In such an instance the chain will
maximize the number of nucleotide anion versus cationic amphiphile charge pairs and as the arnount
of added polyA increases the number of anionkation pairs should decrease on a per chain basis.
Eventuaiiy, fùrther binding should case when the favourable Coulombic attractions are overbalanced
by the entropic cost of conformational adaptation. However, OligoS cannot adapt confonnationally
and so this surface crowding point is reached much earlier.
4.5.2 Nucleotide Mobility
Various "P NMR spectra of OLigoS (left colurnn) and poIyA (nght column) are shown in
figure 4.5.3. The lower spectra were obtained for the dry powders of the nucleotide chains and are
characteristic lineshapes for static phosphorothio- and phospho-diesters, respectively. Al1 the data
concerning the isotropic chemicai shifts, static chemical shift tensor components and asymmetry
parameters listed in table 4.5.1, for the two nucleotide chains.
The middle row of spectra represent the addition of the two nucleotide chains to 100Y0
DOTAP MLVs in a 0 3 1 anionkation charge ratio, in order to ensure quantitative binding of the
nucleotide chains. Due to the absence of phospholipids in these Mxtures, the 31P N-MR signal
originates solely from the nucleotide chains. These spectra are essentially identical to the
corresponding dry powders, indicating the irnmobilization of the bound nucleotide chains as a result
of charge pairing. There is, however, a slight decrease in the chemical shift anisotropy for the bound
nucleotide chains, as shown in table 4.5.1. This implies some segmental librations within the bound
nucleotide chains. But, this change may also be interpreted as an aiteration in the electron density
distribution about the phosphorus atom, due to ion-pairing. This effect would also manifest itself in
alteration of the chemical shift tensor components.
The top row of spectra in figure 4.5.3 were obtained by addition of the two nucleotide chains
to 100% DOTAP MLVs in a 1 : 1 charge ratio. These spectra once again indicate the irnmobilization
of t h e nucleotide chains when bound to the bilayer surface. The spectrurn for OligoS is essentially
identical to that at the 0.5: 1 charge ratio. However, for polyA there is a more drastic change in the
spectrum as compared to its 0.5: 1 addition. The chemical shift does not only narrow considerably
but the highest intensity peak shifis towards the isotropic chemical shifl value for poiyA. Thus, polyA
enjoys more motional freedom at charge equivalence. It is difficult to distinguish whether the
spectrum represents a superposition of two populations with different mobilities or a single

FIGURE 4.5.3 Cross polarization "P NMR spectra of OligoS (le ft hand column) and polyA (right hand column) in the form of a dry powder (bottom spectra), mixed with fully hydrated 100% DOTAP in an anionkation charge ratio of 0.5: 1 (middle spectra) or rnixed with fùlly hydrated 100Y0 DOTAP in an aniodcation charge ratio of 1: 1 (top spectra). The isotropic chemical shifts, chemical shift tensor components and asymmetry parameters for the various spectra are tisted in Table 4.5.1.
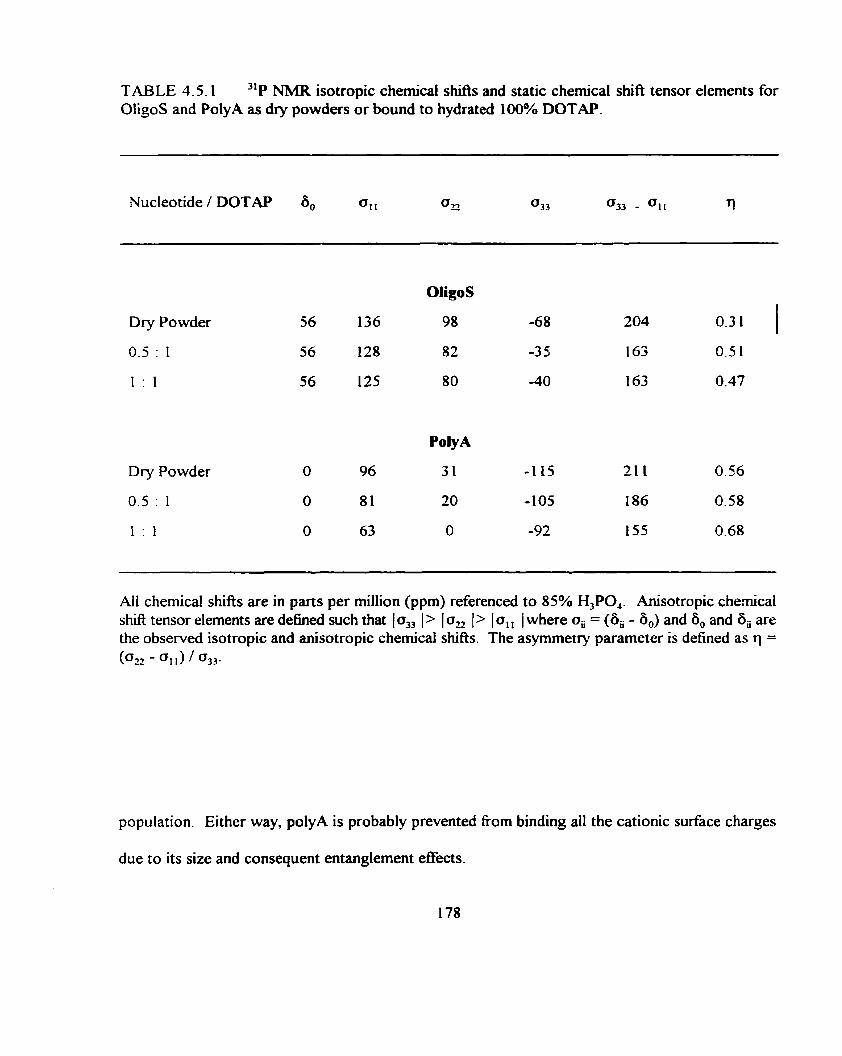
TABLE 4.5.1 "P NMR isotropic chernical shifts and static chemical shifi tensor elements for OIigoS and PolyA as dry powders or bound to hydrated 100% DOTAP.
Nucleotide / DOTAP b0 01 1 an a 3 3 0 3 3 - 011 rl
OligoS
Dry Powder 56 136 98 -68 204 0.3 1
0.5 : 1 56 128 82 -3 5 163 0.5 1
1 : 1 56 125 80 -40 163 0.47
Poly A
Dry Powder O 96 3 1 -1 15 21 1 0.56
0.5 : 1 O 8 1 20 - 1 O5 186 0.58
1 1 1 O 63 O -92 155 0.68
Al1 chemical shifts are in parts per million (ppm) referenced to 85% H3P0,. Anisotropic chernical shifi tensor elements are defïned such that 1 o, 1 > 1 i 1 > 1 O, 1 where O, = (6. - 60) and 6, and 6" are the observed isotropic and anisotropic chemical shifis. The asymmetry parameter is defined as q =
(022 - %) 0 3 3 .
population. Either way, polyA is probably prevented from binding al1 the cationic surface charges
due to its size and consequent entanglement effects.

45.3 'H NMR of DOTAP-yod, in Complexes with OligoS and PolyA
Figure 4.5.4 shows a senes of-% NMR spectra of 10W DOTAP-y-d, in complexes with
either OligoS (iefi colurnn) or polyA (right colurnn). The top spectrum in each column was obtained
in the absence of added nucleotide chains. The value for the two quadrupolar sptittings is
approximately 1.2 kHz for each case and is similar to the values reported for the mixtures of this
cationic lipid with POPC, discussed in the previous section.
Adding OligoS and PolyA to the 100°/0 DOTAP-y-d, MLVs produces no change in the
quadrupolar splitting, either at 1 : 1 (rniddle row) or 2: 1 (bottom row) anion / cation charge ratios.
However, there is an obvious decrease in the intensity at the centre of these spectra upon addition of
nucleotide chauis. This can be accounted for by the fact that the neutralized MLVs were more readily
concentrated than the kighly charged MLVs. The concentration of the vesides, by centrihgation,
will remove smdl vesicles which contribute to a centrai isotropie resonance fkequency.
From figures 4.5.3 and 4.5.4 a rather contradictory picture of the OligoS or PolyA complexes
with 100% DOTAP aises. The bound nucleotide chains are virtually immobilized, except for
librations at the level of individuai nucleotide segments, yet the cationic lipids retain virtually fidl
rnobility.
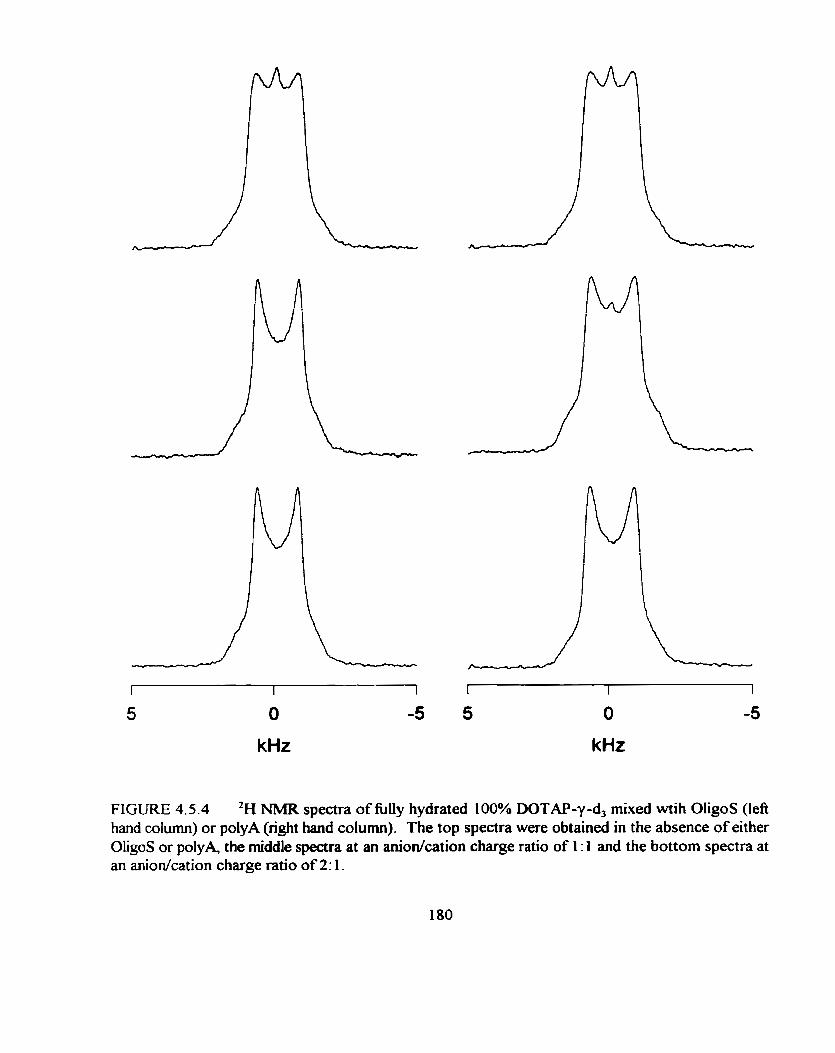
r I I
5 O -5
kHz kHz
FIGURE 4.5.4 'H NMR spectra of fùlly hydrated 100% DOTAP-y-d, mixed wtih OligoS (lefl hand colurnn) or polyA (right hand colurnn). The top spectra were obtained in the absence o f either OligoS or polyA, the middle spectra at an anionkation charge ratio of 1 : 1 and the bottom spectra at an aniodcation charge ratio of 2: 1.

4.5.4 ''P NMR of Complexes of OligoS or PolyA witb DOTAP/POPC Mixtures
Figure 4.5.5 contains "P NMR spectra of complexes of rnixed 30/70 DOTAP/POPC MLVs
as a function of added OligoS (lefi column) or polyA (right colurnn). The top spectrum in each
column is identical and was obtained in the absence of nucleotide chains. The lineshape is
characteristic of phospholipids in a bilayer architecture where the lipids exhibit rapid anisotropic
motional averaging about their long rnolecular axes (Seelig, 1978; Cullis and de KruijR, 1979). The
spectrum is motionally narrowed (Au = a,, - a,, = 40 ppm) from the static case and is also axially
symrnetric (q = 0).
The addition of either polyA or OiigoS to the cationic lipid bilayers does not aiter the overall
architecture of the bilayer, as show by the series of spectra in figure 4.5.5. Below the anion / cation
equivalence point there is evidence of a broad resonance, centered at 56 ppm, for the addition of
OtigoS. Its Eequency is centered at the isotropic chemical shift of OligoS. There is no similar signal
at the isotropic chemical shift of polyA (O ppm) below the 1: 1 anionkation ratio. Above the
equivaience point, though, a much narrower resonance line begins to grow at the isotropic chernicd
shift of OtigoS. This also occurs for poly4 but only at anionkation charge ratios of approximately
2: 1. This narrow resonance is attnbuted to nucleotide chains which are fiee in solution.
The fact that the bound nucleotide chains are not observed in these spectra is not
unreasonable. The full breadth of the "P NMR spectra of the bound nucleotide chains, in figure
4.5.3, are nearly 5 times greater than that fiom the phospholipids. This greatly reduces the signal to
noise ratio for the bound nucleotides and its signal is dwarfed by that of the bilayer pattern of the
phospholipids. In fact the signal to noise of the bound nucleotides was so low that a cross-
polarization technique was used to enhance the signal.
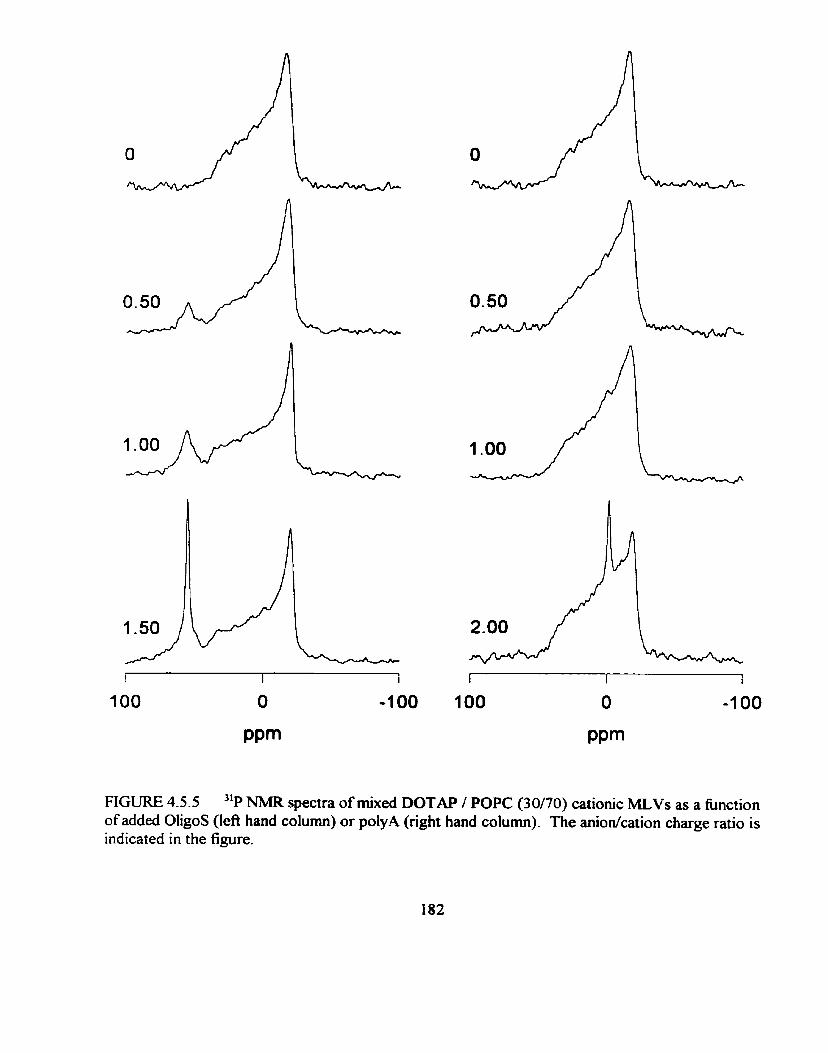
FIGURE 4.5.5 "P NMR spectra of mixed DOTAP / POPC (30170) cationic MLVs as a function of added OligoS (lefi hand column) or polyA (right hand column). The anionkation charge ratio is indicated in the figure.
These spectra confirm the results from the UV-assay, in that signals corresponding to fiee
nucleotide chains only appear above the anion/'cation equivalence point. But, remember that the UV-
dEerence assay reports on the biiding of the entire polyelectrolyte while NMR techniques report on
the average properties of individual nuclei. phosphorus in this case. Thus, with the "P NMR
technique used here it is possible to distinguish between monomer units of the nucleotide bound to
the membrane surface and individual unbound segments which have a higher degree of mobility. In
particular polymers bound to surfaces are known to form tail and loop regions which retain
considerable mobility. It may be reasoned then that the broad resonance obsewed at the isotropie
chernical shifi of OligoS. below the anionkation equivalence point, could arise from a proportion of
mobile chain ends. It may also be reasoned that the nucleotide chah mobility was enhanced in the
presence of POPC relative to the 100% DOTAP case.
The next question to be addressed is whether or not the amount of free OligoS can be
quantitated from these spectra. The quantitation cm be accomplished if the "P NMR intensity From
the phospholipid POPC, the interna1 standard, can be directly related to that of OligoS. Separate
relaxation time experiments (T, and T2 ) were run for both POPC MLVs and fiee OligoS.
Longitudinal relaxation times (T,) of 930 ms and 900 ms were determined for POPC and fiee OligoS,
respectively. This indicates that if there was any signal intensity saturation, due to rapid repetition
of the pulse sequence, it would be equivalent for both signals. In order to prove this a "P NMR
spectrum was acquired for OligoS added to 100% POPC MLVs, where no OligoS binding should
occur. The pulse delay between sequences was increased fiom 2 s to 10 s to disallow any saturation
effects and there was no change in relative intensities of the two distinct signals. The transverse
relaxation time (TL) was then determined to be approximately 10 ms for both OligoS and POPC.
Thus, any transverse relaxation between the t delays of the echo sequence would be minimal. Finally,
the ratio of integrated intensities of OligoS to POPC resonances was about 90% of that expected,
fiom the known composition. Therefore, it is reasonable to determine the amount of free OligoS by
comparing its resonant intensity to that of the intemal standard of POPC.
An example of this quantitation can be seen by focussing on the result obtained for an addition
of 1.5 : 1 aniodcation of OligoS to the membrane surface, in the lefi column of figure 4.5 .5 . The
isotropic resonance at 56 ppm is about 113 the intensity expected for the case of 100% free OligoS.
But, there is a broad signal underlying the narrow isotropic resonance of fiee OligoS which cannot
be separated. This broad signal is attributed to the relatively mobile segments of bound OligoS,
determined below the equivalence point. At the equivalence point, the broad signal accounts for 115
of the total intensity expected if there was no OligoS binding to the bilayer. Thus, assuming that no
more than 1/5 of the bound OligoS contributes to the integrated signal intensity at 56 ppm, then 1 .2
equivalents of OligoS are calculated to be bound for the 1.5: 1 aniodcation ratio. Even though this
agrees well with the UV results one appreciates the approximate nature of this calculation.
This quantitation procedure would seem to be less reliable for determinhg the amount of fiee
polyA for various reasons. First, when polyA was added to 100Y0 POPC MLVs in a 317 phosphorus
ratio. the isotropic resonance attniuted to fiee polyA was only 113 the intensity expected, given that
no polyA binding should occur in the absence of cationic amphiphile. Since, the T, and TZ relaxation
times of the isotropic polyA and POPC resonances were comparable, they could not be used to
explain the loss in signal intensity from polyA. Secondly, when a calibration experiment was
performed relating the "P intensity of polyA to its concentration in aqueous solution, the relationship
was not linear. In fact the observed intensity fell below the expected value by about 50% at a
concentration of 10 mghi, which is the concentration range pertinent to these studies. A possible
explanation for this behaviour is that long DNA chains are known to form anisotropic phases, in
solution, at much lower concentrations than shorter chains (Merchant and Rill, 1997). This effect
would lead to line broadening and a dierential intensity loss. In either case, it becomes obvious that
quantitating fiee polyA would be a much more difficult endeavour.
4.5.5 UV-assay of Ionic Strength Effect on Nucleotide Binding to Cationic Liposomes
The results of polyA desorption fiom cationic liposomes in the presence of added salt have
already been described and are show in figure 4.5.6 dong with the new data for OligoS. The
nucleotide anion to amphiphile cation charge ratio was kept at 1 : 1, for both cases. The most obvious
characteristic in figure 4.5.6 is the sigrnoidal increase in chah desorption, for both OligoS and poiy A,
as ionic strength increases. Progressive addition of salt reduces the Coulombic attraction between
the oppositely charged species by a charge screening mechanism. The concentration of NaCl required
to reduce the number of bound chain by half is approximately 400 -500 rnM for both OligoS and
polyA. Note also that a nearly quantitative amount of the nucleotide chains remain bound to the
surface at physiological ionic strength (1 50 mM).
However, there is a clear distinction between the salt induced desorption of OligoS and
poIyA. PolyA shows a much steeper transition fiom the bound to unbound States while the ultimate
ionic strength needed to achieve quantitative desorption is much lower. This result may be
understood by taking into consideration chain length effects which prevent 1 : i anionkation charge
pairing. The "P NMR spectra in figure 4.5.3 support this notion. Also, high salt will reduce
intersegmental charge repulsions, leading to a more compact chah conformation, which favours the
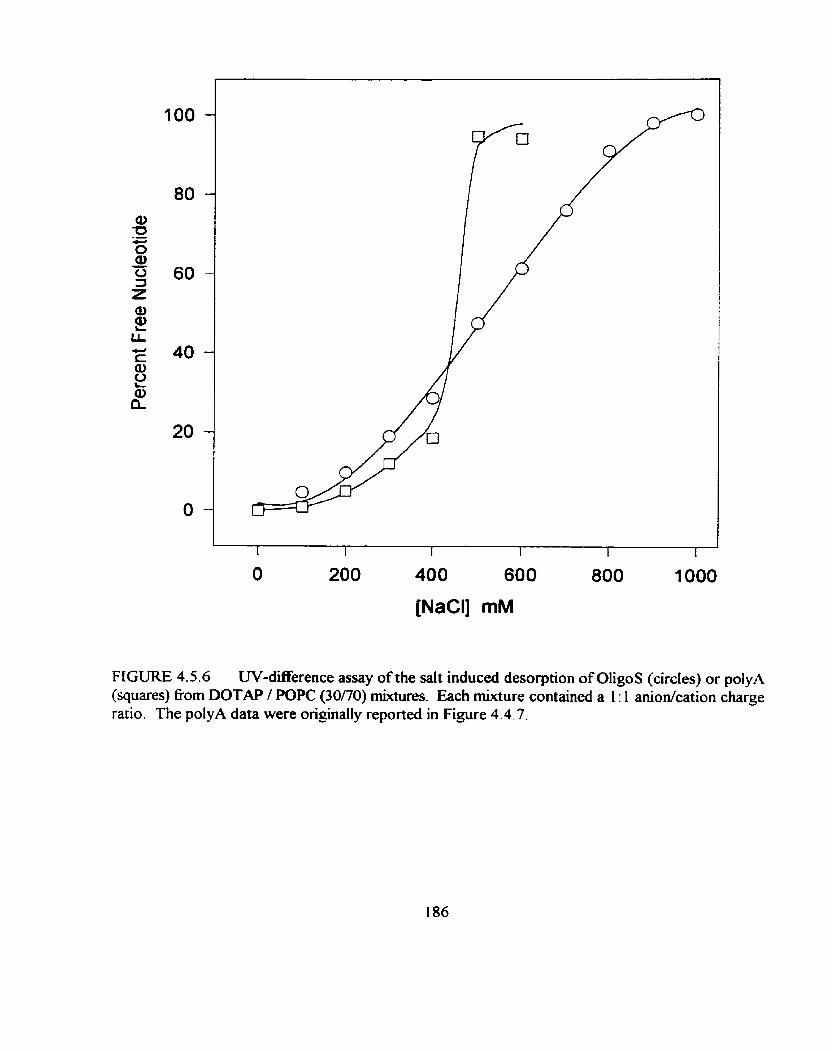
FIGURE 4.5 -6 UV-dïfFerence assay o f the salt induced desorption o f OligoS (circles) or polyA (squares) fiom DOTAP I POPC (30170) mixtures. Each mixture contained a 1 : 1 anionkation charge ratio. The polyA data were originally reported in Figure 4.4.7.
unbound state. Since the shorter OligoS chain has a geatly reduced ability to change its
conformation, it should be less influenced relative to polyA.
4.5.6 "P NMR of Ionic Strength Effect on Nucleotide Binding to Cationic Liposomes
The "P NMR spectra of OLigoS (lefi colurnn) and polyA (right colurnn) complexed to 30170
DOTAP/POPC MLVs in a 1 : 1 charge ratio are shown in figure 4.5.7 along with the different ionic
strengths of NaCI. Under d l conditions the iipids retain an overall bilayer arrangement. As the
concentration of salt inmeases so does the intensity of the narrow resonance at the isotropic chernical
shifl position of the conesponding nucleotide chain. These resonances correspond to fkee OligoS and
polyA. The salt concentration at which these isotropic peaks reached their maximum intensity
corresponded to 800 and 500 mM NaCl. for OligoS and polyA, respectively. This "P NMR data
confirms the UV results regarding nucleotide chain desorption by sait.
The integrated intensity obtained fiom the isotropic resonance of OligoS, at 800 mM NaCl,
was 92% of that expeçted for quantitative desorption. The difficulties for quanti@ng the arnount of
6ee polyA have already been mentioned. To circumvent this problem, a control sample was prepared
containing only polyA and POPC in the sarne phosphortis containing ratio as in figure 4.5.7, with 500
rnM NaCl added. Al1 polyA should be in the unbound state under these conditions. By using these
relative intensities of polyA and POPC as control values, it was deduced that polyA is entirely
desorbed fiom the surface of the 30/70 DOTAPIPOPC MLVs. Therefore, both the 31P NMR and U V
data agree both qualitatively and quantitatively.

FIGURE 4.5.7 "P NMR spectra of salt induced desorption of OligoS (lefi hand column) and polyA (right hand column) fiom DOTAP 1 POPC (30/70) mixtures. Each mixture contained a 1 : 1 aniodcation charge ratio. The NaCl concentration (mM) is shown in the figure.

4.5.7 "P NMR of DOPE mixed with DOTAP or CTAB
DOPE is commonly mixed with cationic amphiphiles in order to increase the efficiency of
transfection. This enhancement is believed to arise fiom the ability of DOPE to assume an inverted
hexagonal H, arrangement when incorporated into macromolecular lipid assemblies, which aids in
local destabiiization of a cell's membrane. This abiity can be important for direct fùsion with either
the plasma membrane or the endosornal membrane in an endocytotic mechanism of gene transfer
( Farhood et al., 1995; Wrobel and Collins, 1995). In either instance the ability of DOPE to form
non-Mayer phases is pivotal to this enhancement. Replacement of DOPE with a bilayer forming lipid
like DOPC has been shown to produce "packages" which are inefficient in promoting transfection.
The ability ofDOPE to promote non-bilayer phases is ascribed to its inverted cone shape, which is
due to a combination of a small headgroup and unsaturation in its acyl chains (Cullis and de Kmijff,
1979). In order to investjgate the effects of nucleotide chains on the architecture of the transfection
packages (cationic amphiphile + DOPE vesicles) the "P NMR spectra of DOPE mixed with either
DOTAP or CTAB were examined first, as shown in figure 4.5.8.
The spectra are identical and were obtained with 100% DOPE. The spectral line shape of
the "P NMR spectra in the top row of figure 4.5.8 is indicative of lipids in an invened hexagonal
arrangement (Hd. The sign of the CSA is reversed and reduced in magnitude by a factor of 2 (Ao
- 22 ppm), as compared to the pattern obtained for lipids in a bilayer arrangement (La).
The Iefi hand column of spectra were obtained for mixtures of DOTAP with DOPE. With
I O mole'Xo added DOTAP the mixture retains a hexagonal arrangement. At 20 mole% DOTAP, the
spectmrn shows a superposition of hexagonal (Hd and probably cubic (43 phases, the latter being
a high local curvature phase. Eventually at 50 mol% DOTAP the bilayer arrangement exists solely.
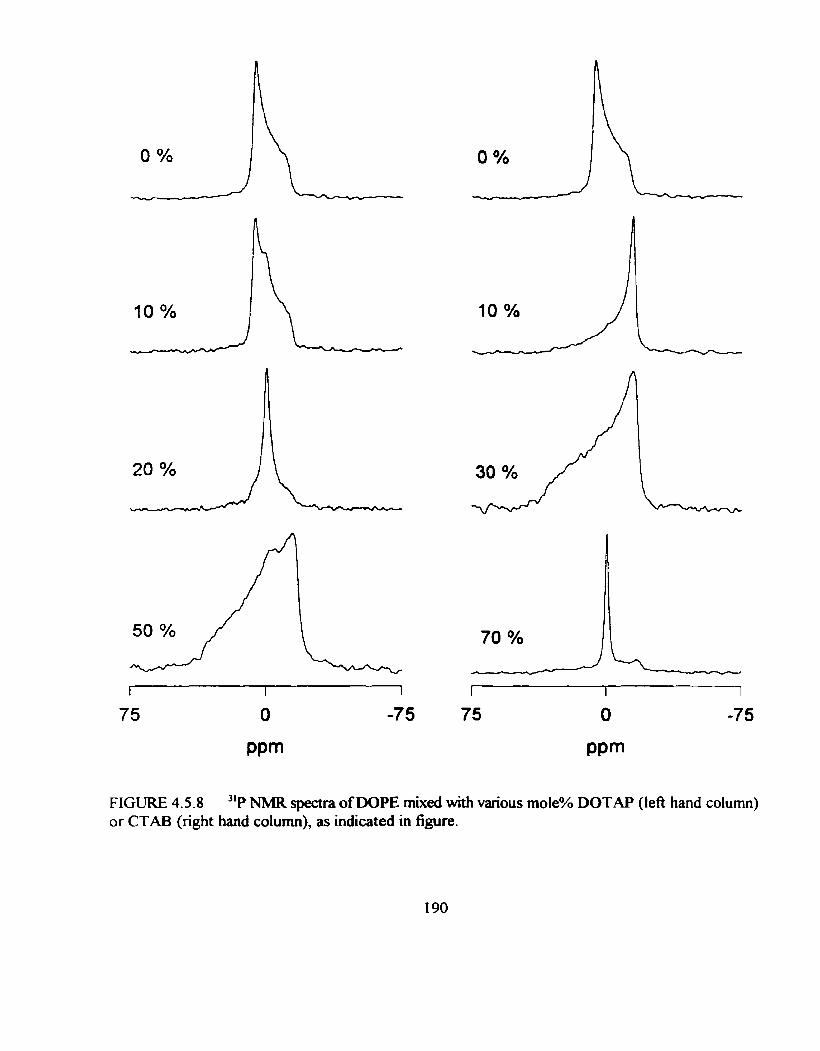
FIGüRE 4.5.8 "P NMR spectra of DOPE mixed with various mole% DOTAP (leA hand column) or CTAB (nght hand column), as indicated in figure.

The right hand colurnn of spectra were obtained for mixtures of CTAB and DOPE. With
only 10 mole% CTAB the amphiphilic mixture reverts completely to a bilayer arrangement. The line
shape is altered stightly fiom a sphericai bilayer arrangement of iipids and is indicative of an alignrnent
of vesicles in a magnetic field (Seelig et al., 1985). At 30 mole% CTAB, the mixture is entirely
biIayer in architecture with no induced orientation in the magnetic field. Eventually at 70 mole%
CTAB the spectrum is dorninated by a micellar isotropic resonance.
The changes in architecture of the lipid seif-assembly observed by "P NMR can be understood
in terms of the "shape" model of lsraelachvili (1975, 1977). In this model different classes of lipids
exhibit distinct shapes which act as building blocks for different amphiphilic architectures. POPC,
for instance, which contains a comparable size headgroup and acyl chain region is considered to have
an overall cylindrical profile wtûch preferentially assembles into a bilayer architecture. DOPE,
however, has a much smaiier head group and possesses unsaturation at both acyl chains. This yields
an inverted cone profile for DOPE which preferentially assembles into an inverted hexagonal
arrangement, H,. CTAB, with its single alkyl chain and large charged head group, is considered to
possess a cone shape and prefers to assemble into a micellar architecture. Finally, DOTAP possesses
the same large head group as CTAB but with two acyl chains, possesses an overall cylindrical profile
and is thus known to stabilize bilayer arrangements.
When DOTAP and DOPE are mixed, the bilayer tendencies of DOTAP eventually overcome
the hexagonal tendencies of DOPE at higher levels of added DOTA.. When CTAB and DOPE are
mixed, the cone shape of the former compIements the inverted cone shape of the Latter and a bilayer
arrangement dominates at only 10 mole% CTAB. This may indicate that the cone shape of CTAB
tapers more fully than the inverted cone shape of DOPE such that CTAB's shape has the ability to

dominate the overall architecture at lower mole fiactions of CTAB.
The ab'ility of cationicaily charged lipids to stabihze DOPE into a biiayer architecture has been
shown previously (Mok and Cullis, 1997), and is reminiscent of the behaviour of anionically charged
lipids (Cullis and de Kniijff, 1979).
4.5.8 Effects of Nucleotide Binding on the Morphology of DOTAPlDOPE Mixtures
The top row of "P NMR spectra in figure 4.5.9 indicate that pure lipid mixtures of 30/70
DOTAP/DOPE produce predominantly lamellar bilayer architectures. Aithough not obvious, t here
is a 6action of the "P NMR intensity attibuted to a hexagonal arrangement of lipids in these spectra.
Addition of OligoS promotes a conversion of the predominantly bilayer arrangement of lipids to a
predominantly hexagonal-type spectrum with a residue of an overlying isotropic signal, as shown in
the left column of figure 4.5.9. The isotropic lipid resonance disappears at higher ievels of added
OligoS. When an excess of OligoS is added another narrow resonance begins to appear at the
isotropic chernical shift of OligoS, while at the same time the lipids retain a hexagonal architecture.
The right hand column of spectra in figure 4.5.9 show the results for poIyA added to the
30170 DOTAWDOPE mixtures. There is an analogous conversion to a hexagonal arrangement,
through an intermediate isotropic phase, with fiee polyA eventually appearing at its isotropic
resonance position,
The results demonstrate that nucleotide chahs cause a conversion to a hexagonal architecture.
DOTAP is known to stabilize the bilayer architecture by virtue of its cationic headgroup. Binding
of the anionic nucleotide chains to the lipid/water interface neutraiizes the cationic surface charge,
in effect reducing the size of the DOTAP head group. This allows the DOPE to then exert its

FIGURE 4.5.9 "P NMR spectra of DOTAP 1 DOPE (30170) mixtures as a function of added OligoS (left hand column) or polyA (right hand column) at the indicated anionkation charge ratio.

influence in order to restore a hexagonal arrangement of lipids. Complete charge neutralization is
not required for this conversion, since the Epids are predominantly hexagonal at only 50%
neutralization. The behaviour of the two nucleotide chains are slightly different in that polyA is less
effective at causing this transition. in both instances, though, the "P NMR results obtained here
demonstrate that complexes of nucleotide chains with DOTAP/DOPE mixtures form non-bilayer
phases while complexes with DOTAP/POPC only produce bilayer phases (figure 4.5.5).
The conversion to the non-bilayer phase is more readily induced by OligoS than by polyA, a
state of &airs which may have to do with entanglement effects, Le. the difficulty of the larger polyA
chah to bring ali its charges to bear on the iipid surface. It may aiso be possible that the effect is due
to dficulty in packing the larger polyA chains into the intemal aqueous tubes present in the HE lipid
phase, relative to the shorter OligoS chahs. Certairûy, the 31P NMR spectral line shapes are less well
defined in the case of polyA versus OligoS. It seems reasonable that if non-bilayer phases are
important for gene transfection, then the fact that polyA does not readily induce this transformation
may explain the reduced transfection efficiency of large polynucleotide chains (van der Woude et al.,
1995).
Finally, the spectra presented in figure 4.5.9 indicate some differences in chah dynamics of
OligoS, when present within a hexagonal array of lipids versus a bilayer arrangement. Below the
equivalence point addition of OligoS to 30170 DOTAPPOPC mixtures there was a broad resonance
centered at 56 ppm which was attributed to tail segments of bound OhgoS. However, the comparable
spectra in figure 4.5.9 show aimost no evidence of this resonance below the equivalence point. This
result indicates that OligoS chah exhibits little or no motional fieedom when bound to lipids in a
hexagonal arrangement. This is probably due to the reduced dirnensionality of the cylindrical aqueous
spaces of the H, phase relative to the lamellar aqueous spaces of the bilayer phase.
4.5.9 Effects of Nuclcotide Chain Binding on the Morphology of CTAB/DOPE Mixtures
Figure 4.5.10 shows a senes of 31P NMR spectra of 3O/7O CTAB/DOPE mixtures to which
have been added either OligoS (lefi column) or polyA (right column) in the indicated anionkation
charge ratios. The top spectra in the figure indicate the same results shown in figure 4.5.8, that is that
the addition of 30 mole% of CTAB to DOPE vesicies causes a conversion to a bilayer architecture.
Addition of either of the distinct nucleotide chains does not produce a change in overall architecture
at any charge ratio. There is no question as to the binding of the nucleotide chains to the cationic
surfaces, since there is no free nucleotide present in the spectra until afker the aniodcation
equivalence point.
Evidently, charge neutralization is not a sufficient condition to induce non-bilayer phases in
CTABDOPE mixtures. Presumably, the complernentary shapes of the cone profile of CTAB and the
inverted cone profile of DOPE is sdiciently powerfùi to maintain a bilayer architecture even without
the added influence of' inter-headgroup charge repuision. This then suggest that CTAB/DOPE
mixtures should be less efficient in transfection, due to their inability to produce non-bilayer phases.

FIGURE 4.5.10 "P NMR spectra of CTAB / DOPE (30/70) mixtures as a function of added OligoS (left hand colum) or polyA (right hand colurnn) at the indicated anionkation charge ratio.
4.5.10 Effect of Salt on OligoS Binding to DOTAP/DOPE and CTAWDOPE Mixtures
Figure 4.5.1 1 shows a senes of ''P NMR spectra for increasing ionic strengths in complexes
of OligoS added in a 1: 1 aniodcation charge ratio in mixtures consisting of 30170 CTAB/DOPE (Ieft
CO lumn) and 3 O/7O DOTAFVDOPE (right column). Lncreasing the NaCl concentration causes
desorption of OligoS, since its narrow isotropic peak appears and increases in intensity. The
CTABDOPE mixtures produced a bilayer ''P NMR line shape at al1 salt concentrations. Thus, the
conehnverted cone complimentary of CTAWDOPE dominates the behaviour of the mixtures, with
or without saIt or bound OligoS. On the other hand, the DOTAPDOPE mixtures produced an
inverted hexagonal Iine shape at dl salt concentrations. This indicates that removal of OligoS fiom
the surface of DOTAP/DOPE mixtures does not cause the reversal of the macromolecular assembly
of lipids back to the orignal biayer phase, L, in the absence of OligoS binding. Thus, both NaCl and
OligoS are capable of screening the inter-headgroup repulsion of DOTAP charges.
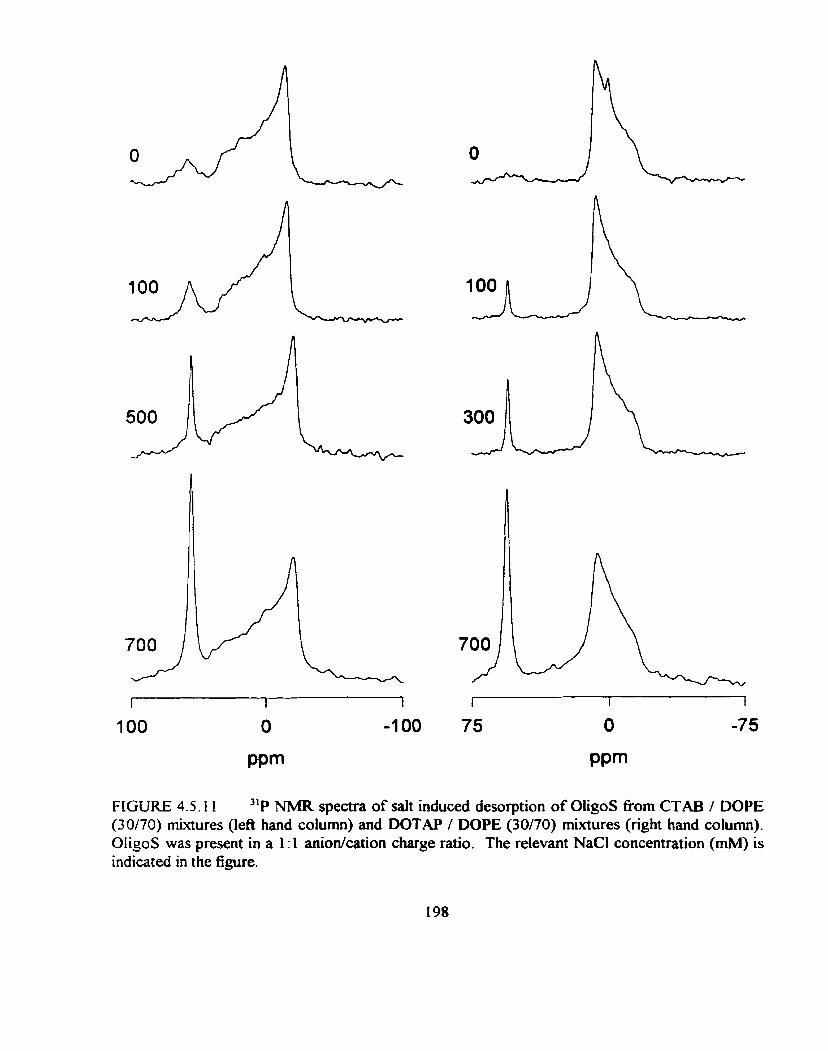
FIGURE 4.5.11 ''P NMR spectra of salt induced desorption of OligoS fiom CTAB / DOPE (30/70) mixtures (left hand column) and DOTAI' / DOPE (30/70) mixtures (right hand column). OIigoS was present in a 1 :1 anionkation charge ratio. The relevant NaCl concentration (mM) is indicated in the figure.

5 FUTURE DIRECTIONS
The studies presented here have constituted the first demonstration, by deuterium ('H) nuclear
magnetic resonance (NMR), of the formation of segregated domains of cationic lipids induced by
anionic polyelectrolytes. The data presented in this thesis has shown how domain size and
composition are altered as a function of polyelectrolyte identity and molecular weight, initiai surface
charge and the arnount of salt added to these mixtures. 'H and "P NMR have also provided insights
into the fluidity and mobility of the zwitterionic and cationic lipids, as well as the polyelectrolyte used
in these mixtures. Finally, "P NMR WBS used as a tool to determine how the architecture of these
"DNA-lipid packages alter as a fùnction of zwitterionic and cationic tipid and as the molecular
weight of polynucleotide chains. This can prove to be a good tool in determining the potential
eficacy of these "packages" for gene transfer. Although the investigations provided here give
detailed information regarding the interaction of cationic lipids with anionic polyelectrolytes, other
experirnental variables require fùrther investigation. There are at least four main topics which can be
investigated in greater detail.
The first field of research should involve studying, in more detail, the location of the
polyelectrolytes when electrostaticdly bound to these cationic surfaces. For instance, although our
results indicate that penetration of the polyelectrolyte into the hydrophobic region of the lipid bilayer
plays a role in domain formation, we do not know the depth of their penetration or the dynarnics of
their side chains. The degree of association of the polyelectrolyte with the membrane surface and
its mobiiity can be detennined fiom a variety of experiments. Fust, consider using a zwitterionic lipid
such as POPC, which is deuterated dong the length of its acyl c h . In this marner the order profile
of the hydrophobic region of the bilayer composed of deuterated POPC and some cationic lipid may
be detennined, fiom top to bottom. By direct cornparison of such results with those obtained in the
presence of a polyelectrolyte, the perturbation of the bilayer may be determined. By studying the
degree to which the order parameters are altered, both the depth and strength of penetration of the
polyelectrolyte into the bilayer proper may be determined. The obvious control for these sets of
experiments would be to find a polyelectrolyte which has no side groups and contains its charge on
its backbone.
A more direct method of studyùig the polyelectrolyte would be to specifically deuterate the
polyelectrolyte on its chah or on its side group. In this instance two 'H NMR control expenments
should be run. The first would be on the polyelectrolyte in powder (static) form and the other in
solution (isotropic). When the polyelectrolyte is electrostatically bound to the cationic membrane
surface at least huo 'H NMR populations should be observed. One for monomer units of the
polyelectrolyte which are bound and the other which are unbound in tail or loop regions. The
quadniopolar splittings for these two cases should differ greatly. Since the splittings should be easy
to identify then through spectral simulation amounts of polyelectrolyte bound and free could be
quantified, depending on their T, values. Quantification may aiso be accomplished through the
isotropic peak. These experiments would help to identify portions of the polyelectrolyte which
retained a degree of mobility within the "charge-compensation" Iimit. Another interesting variable
here would be to synthesize a deuterated "block" polymer which contains portions of its chah which
are charged and others which are not. This should provide information as to the degree of
hydrophobic association of the p~l~e~ectrolyte with the surface. Will the non-charged portions of the
polyeiectrolyte still adsorb to the surfiace? If so then a third population may anse in the 'H NMR
spectrum. The existence of such a population or the size of its quadrupolar splitting should provide
insight into the relative strength of the hydrophobic contribution to binding.
A second field of experiments would involve studying cationic lipids in more detail. Different
cationic lipids have recently been synthesized in order to improve the efficiency of transfection
"packages". The use of polycationic lipids has shown definite promise. Their ability to increase
efficiency is believed to correlate with their ability to condense DNA to a greater degree thus
reducing the energy banier for transport across a plasma membrane. Through 'H NMR of headgroup
deuterated POPC, the arnount of charge that these lipids bring to the surface of a membrane can be
determined relative to monocationic lipids. It is possible that these lipids produce a higher surface
charge density which enhances binding to DNA. "P NMR can provide information on the state of
the polynucleotide when bound to these polycationic species. The resulting size of the chemical shifl
anisotropy (CSA) can provide information about the relative size and mobility of the complex.
Another interesting cationic Iipid for study would be a POPC molecule with an ethyl group
bound to its phosphate region. If this molecule was headgroup deuterated it could produce a
"voltmeter" response to charge as does another charged lipid, phosphatidylglycerol. If its response
is sensitive to charge then it should be possible to observe domains directly through the cationic lipid.
Will the effect of added anionic polyelectrolyte charge be directly accounted for, unlike the case of
membranes containing deuterated zwitterionic POPC?
The third area of study involves determining the lipid lateral difision coefficient of POPC,
within the polyelectrolyte-bound domain. The conclusions made in this thesis regarding domain size
fiom %-I NMR was based on a difision coefficient for POPC that was in a bulk phase. Even though

the % NMR results indicate that the lipids are highly mobile within the bound domain, the effective
difision rate should be slowed by the "archipelago" effect (Saxton, 1993) of the polyelectrolyte
bound to the membrane surfàce. The difision coefficients of lipids in biiayers can be determined by
a ''P NMR 2D-EXSY technique (Picard, et al., 1998). This technique should aid in producing a more
reliable lower limit to the relative size of these domains.
The final area of study involves determining the presence of domains, by some independent
method, as weU as the size of these domallis. Fluorescence digital imaging techniques, run for single
vesicles, should provide definitive detection of domains in the plane of the bilayer. Another method
which may distinguish domains would be some x-ray or neutron scattering expenment which can
mdy changes in bilayer thickness. Differences in bilayer thickness would be expected to be present
between polyelectrolyte-bound and -fiee phases An NMR approach that may also provide insight
would be a 2D 'H NMR EXSY experiment. If lateral domains are present in the same bilayer then
the two populations in the 'H NMR spectrum should be capable of exchanging with one another.
This is in contrast to the situation where the domains actually exist on separate lamdlae. Thus, the
existence of a third POPC population in the spectrum, which is intermediate between POPC lipids
in their "bound and "fiee7' forrns, would be proof of exchange of lipids between two domains on the
sarne lamellae. This should be the case for large domains, in which lipids fiom both domains
exchange at the boundary between them. It may also be possible that, given enough time to
exchange, only a single POPC population WU be observed in the spectrum. This would indicate that
the domains are relatively small and that al1 POPC molecules can exchange in and out of both
domains many times in order to average out the properties of both.

6 CORRESPONDING REFERENCES
Mit rakos, P. & Macdonald, P. M. (2000) accepted to Biomacromolecules.
Molecular Weight Dependence of Polyelectrolyte-hduced Domain Size and Composition
in Cationic Lipid Bilayer Membranes.
Macdonald, P.M., Crowell, K.J., Franzin, CM., Mitrakos, P., & Semchyschyn, D.J. (2000)
su bmitt ed to Soiid State AMR
'H NMR and Polyelectrolyte-hduced Domains in Lipid Bilayers.
Mitrakos, P. & Macdonald, P.M. (2000) Biochim. Biophys. Acta., 1463, 3 5 5-3 73.
Nucleotide Chain Length and the Morphology of Complexes with Cationic Arnphiphiles:
3'P NMR Observations.
Macdonald, P.M., Crowell, K.J., FranWn, C.M., Mitrakos, P., & Semchyschyn, D.J. (1998)
Biochem. Cell Biol. 76, 452-464.
Polyelectrolyte-induced Domains in Lipid Bilayer Membranes: The Deutenum NMR
Perpsective.
Mitrakos, P. & Macdonald, P.M. ( 1 998) Biochim. Biophys. Ackx 13 74, 2 1-3 3.
Cationic Amphiphile Interactions with Polyadenylic Acid as probed via 'H NMR.
Mitrakos, P. & Macdonald, P.M. ( 1 997) Biochemistry 36, 1 3647- 13656.
Domains in Cationic Lipid plus Polyelectrolyte Bilayer Membranes: Detection and
Characterization via %I Nuclear Magnetic Resonance.
Mitrakos, P. & Macdonald, P.M. ( 1 996) Biochemistry 35, 2 67 14- 16722.
DNA-induced Lateral Segregation of Cationic Arnphiphiles in Lipid Bilayer Membranes as
Detected via 'H NMR-

7 REFERENCES
Akutsu, H. & Seelig, J. (1 98 1) Biochemistty 20, 7366-7373.
Altenbach, C. & Seelig, J. (1 984) Bioçhemisfry 23, 39 13-3920.
Altenbach, C. & Seelig, J. (1985) Biochim. Biophys. Acta 818, 4 10-41 5 .
Aneja, R., Chada, J.S. & Davies, A.P. (1970) Biochim. Biophys. Acta 218, 102-1 1 1
Auger, M. & Jarrelt, H.C. (1990) Chem. Phys. Lett. 165, 162-167.
Barnes, R.G. & Bloom, J.W. (1973) Molec. Phys. 25, 493-494.
Battersby, B.J., Grimm, R., Huebner, S. & Cevc, G. ( 1 998) Biochim. Biophys. Acta 1372. 379-
383.
Bechinger, B., Macdonald, P.M. & Seelig, J. (1 988) Biochim. Biophys. Acia 818, 38 1-385.
Behr, J.-P., Demeneix, B., Loeffler, J.-P. & Perez-Mutul, 3. (1989) Proc. Nat!. Acad. Sci. U.S.A.
86, 6982-6986.
Beschiaschvili, G. & Seelig, J. (1990) Biochemsitry 29, 52-58.
Beschiaschvili, G. & Seelig, J. (1991) Biochim. Biophys. Acta 1061, 78-84.
BIasie, J.K., Herbette, L. & Pachene, J. ( 1 985) J. Membr. Biof. 86, 1 .
Bligh, E.G. & Dyer, W.J. (1959) Can. J. Biochem. Physiol. 37, 91 1-917.
Bloom, M. & Stemin, E. (1987) Biochemistry 26, 2101-2105.
Bloom, M. & Thewdt, J. L. (1 995) Mol. Membr. Biol. 12, 9- 1 3.
Borochov, N. & Eisenberg, H. (1 994) Macrornolecufes 2 7, 1440- 1445.
Browning, J.L. & Akutsu, H. (1 982) Biochim. Biophys. Acta 684, 172- 178.
Budker, V.G. & Merkushin, Y. A. (1990) Biol. Membr. 7, 419-427.
Burnett, L.J. & Muller, B.H. (1971) J. Chem. Phys. 55, 5829-593 1.
Buser, C.A., Kim, J., McLaughlin, S. & Peitzsch, R.M. ( 1 995) Mol Membr. Biol. 12. 69-75
Cevc, G. ( 1 990) Biochim. Biophys. Acta. 1031-3, 3 1 1-3 82.
Cohen, M.H. & Reif, F. (1957) SolidSt. Phys. 5. 321438.
Cosgrove, T., Obey, T.M. & Vincent, B. (1986) J. Colloid Inter. Sci 11 1, 409-4 18.
Crowell, K.J. & Macdonald, P.M. (1997)J. Phys. Chem. 101. 1105-1 1 .
Crowell, K.J. & Macdonald, P.M. (1998)
Crystai, R.G. (1 995) Science 2 70, 404-4 10.
Cullis, P.R. & de Kniijff, B. (1979) Biochim. Biophys. Acta. 559, 399-420.
Cullis, PR., de Kniijff, B., Hope, M.J., Verkleij, A.J., Nayar, R., Farren, S.B., Tilcock, C.,
Madden, T.D. & Bal1 y, M. B. ( 1 983) Sh-itc fural Properfies of Lipids and 737eirFtrnctiorlal
Roles iri Biological Membranes. Membrane Fluidity in Biology, Acadernic Press, New
York.
Cullis, P.R., Fenske, D.B. & Hope, M.J. (1996) Biochemistry of Lipidr, Lipoprofeins und
Membranes, Elsevier Science,
Davies, J.T. & Rideal, E.K. (1963) InterjÙcial Phenornenon, 2nd ed., Academic Press, London.
Davis, J.H. (1983) Biochim. Biophys. Acta. 737, 117-171.

Davis, J.H., JeBey, K.R., Bloom, M., Valic, M.1. & Higgs, T.P. (1976) C h Phys. Left- 42.
3 90-3 94
De G e ~ e s , P-G. (1 979) Scufing Concepts in Po/ymer Physics. Comell University Press,
London.
de Kruijff, B., & Culiis, P.R. (1980) Biochirn. Biophys. Acta. 602, 477- .
de Meijere, K., Brezesinski, G. & Mowald, H. (1997) Macromolectries 30, 2337-2342.
de Meijere. K., Brezesinski, G., Kjaer, K. & Mowaid, H. (1998) Langmtrir 13, 4204-4209.
Denisov, G., Wanaski, S., Luan, P., Glaser, M. & McLaughlin, S. (1 998) Biophys. L 73, 73 1 -
744.
Derbyshire, W., G o ~ n , T. & Warner, D. ( 1 969) Moiec. Phys. 1 7. 40 1407.
Dejaguin, B.V. & Landau, L. (1941) Acta Physiochim, URSS 11, 63.
Deshmukh, H.M. & Huang, L. (1997) NewJ Chem. 21, 113-124.
Dubin, PL., Thé, S.S., McQuigg, D. W., Chew, C.H. & Gan, L.M. (1989) Lar~grntrir 5, 89.
Edidin, M. (1992) CommentsMol. Ceil. Biophys. 8, 73-82.
Egilmez, N.J., Iwanuma, Y. & Bankert, R.B. (1996) Biochem. Biophys. Res. Comm. 221, 169-
173.
Farhood, H., Bottega, R., Epand, R.M. & Huang, L. (1992) B i o c h Biophys. Acta 1111. 239-
246.
Farhood, H., Serbina, N. & Huang, L. (1 995) Biochim. Biophys. Acta 1235, 289-295.
Felgner, P.L., Gadek, T.R., Holm, M., Roman, R., Chan, H.W., Wenz, M., Northrop, J.P.,
Ringold, G.M. & Danielsen, M. (1987) Proc. Nat!. Acad Sci. 84, 74 13-74 17.
Felgner, J.H., Kumar, R., Sridhar, C.N., Wheeler, C.J., Tsai, Y.J., Border, R., Ramsey, P.,
Martin, M. & Felgner, P.L. (1994)J Biol. Chem. 269, 2550-2561.
Fraley, R., Subramani, S., Berg, P., & Papahadjopoulos, D. (1980) J, Bioi. Chem. 255, 1043 1 -
10435.
Franzin, C.M. & Macdonald, P-M. (1 996) Biochemisfry 35, 85 1-858.
Fnend, D. S., Papahadjopoulos, D. & Debs, R. J. ( 1996) Biochim. Biophys. Acta. 12 78, 4 1-50.
Fung, B .M. ( 1 974) in Crirical Evaluarion of Chernical and Physica f Stmctural Ir florrnaiion,
Lide D .R. & Paul M. A. eds, Washington DC, National Academy of Sciences, 436-448.
Gao. X. & Huang, L. (1991) Biochem. Biophys. Res. Comm. 179, 280-285.
Gennis, R. B. ( 1 989) Biomembranes: Molecula. Stmcture & Function. S pringer-Verlag, New
York.
Gershon, H., Ghirlando, R., Guttman, S.B. & Minsky, A. (1993) Biochemistry 32. 7 143-7 15 1.
Glaser, M. ( 1 992) Cumments Mol. Celi. Biophys. 8, 3 7-5 1.
Griffin, R. G. ( 198 1) Methoh Enlyntol. 72, 108- 174.
Griffin, W.C. ( 1 949) J. Soc. Cornet. Chem. 1, 3 1 1-3 20.
Gustafsson, J., Arvidson, G., Karlsson, G. & Ahgren, M. (1995) Biochim. Biaphys. Acta 1235,
305-3 12.
Halle, B. (1 99 1) J. Phys. Chem. 95, 6724-6733.
Harbison, G.S. & Griffin, R.G. (1 984) J. Lipid Res. 25, 1 140- 1 142.
Harries, D., May, S., Gelbart, W.M. & Ben-Shaul, A. (1998) Biophys. J 75, 159- 173.
Haverstick, D.M. & Glaser, M. (1989) Biophys. J. 55, 677-6 .
Hayakawa, K. & Kwak, J.C.T. (1991) in Cationic Surfactants, Rubingh, D.N. and Holland, P.M.
eds., Marcel Dekker, New York.
Hong, M., Schmidt-Rohr, K. & Nanz, D. (1 995) Biophys. J . 69, 1939- 1950.
Hoyland, J.R. (1 968) J. Am. Chem. Soc. 90, 2227-2232.
IsraeIachvili, J.N. & Mitchell, D.J. (1 975) Biochim. Biophys. Acta 389, 13- 19.
Israelachvili, J.N. (1 977) Biochim. Biophys. Acta -169, 22 1-225.
Jaroszeski, M.J., Gilbert, R., Nicolau, C. & Heller, R. (1999) Adv. Dmg Deliv. Rev. 35, 13 1-
137.
J esai t i s, A. J. ( 1 992) Comments Moi. Ceii. Biophys. 8. 97- 1 1 4.
Jolly, D.J.. Yee, J.K. & Friedmann T. (1987) Methods E~~yntol . 149. 10-25.
Kassapidou, K. , Jesse, W., Kuil, M.E., Lapp, A., Egelhaaf, S. & van der Maarel, J.R.C. (1 997)
Macromolecules 30, 267 1-2684.
Killian, J.A. (1998) Biochim. Biophys. Acta 1376, 401-416.
Konstant, P.H., Pearce, L.L. & Harvey, S.C. (1994) Biophys. J. 67, 713-719.
Kotin, R.M. (1994) Human Gene ïherapy 5, 793-801.
Kuchinka, E. & Seelig, J. (1 989) Biochernistry 28, 42 16-422 1.
Lasic, D.D. & Needham, D. (1995) Chem. Rev. 95, 260 1-2628.
Lasic, D.D. Strey, H., Stuart, M C A , Podgomik, R. & Frederik, P.M. (1997) J. Am. Chem. Soc.
119, 832-833.
Leventis, R. & Silvius, J.R. (1990) Biochim. Biophys. Acta- 1023, 124- 132.
Lindblom, G. & Oradd, G. (1994) Prog. M S'ctr. 26, 483-5 15.
Lindblom, G. (1996) A h . Lip. Method 3, 133-209.
Luan, P., Yang, L. & Glaser, M. (1995) Biochemishy 34, 9874-98 .
Mabrey, S. & Sturtevant, J.M. (1978) Methods in Membrane Biology, Vol 9. 237-271, Plenum
Press, New York.
Macdonald, P.M. (1995) Bui. M a . e s 18, 223-238.
Macdonald, P.M. (1997) Acc. Chem. Res. 30, 196-203.
Macdonald, P.M. & Seelig, J. (1 987a) Biochemistry 26, 123 1 - 1240.
Macdonald, P.M. & Seelig, J. (198%) Biochemistry 26, 6292-6298.
Macdonald, P-M. & Seelig, J. (1988) Biochemistry 27, 6769-6775.
Macdonald, P.M., Leisen, J. & Marassi, F.M. (1 99 1) Biochemisfry 30, 3558-3 566.
Mal'tseva, T.V., Bichenkov, E.E. & Budker, V.G. (1983) Biofizika 28. 55-65.
Marassi, R.M. & Macdonald, P.M. (1 992) Biochernzsîry 31, 1003 1 - 10036.
Marassi, F.M. ( 1993) Ph.D. Thesis, University of Toronto.
Marassi, F. M., Shivers, R. R. & Macdonald, P.M. (1993) Biochemisîry 32, 9936-9943.
McElhaney, R.N. (1 982) Chem. Phys. Lipids 30. 229-259.
McLaughlin, S. ( 1 977) Cum Top. Mernb. Tramp. 9, 7 1 - 1 44.
McLaughlin, S. (1989) Annu. Rev. Biophys. Biûphys. Chern. 18, 1 13- 136.
McMullen, T.P. W. & McElhaney, R-N. ( 1 995) Biochim. Biophys. Acta 1234. 90-98.
McMurray, W.C. (1975) Can. J. Bioçhem. 53, 784-795.
Merchant, K. & Rili, R.L. (1 997) Biophys. J. 73, 3 154-3 1 63.
Miller, A.D. (1990)Hrfman Gene ïherapy 1, 5 .
Mok, K. W.C. & Cullis, P.R. ( 1 997) Biophys. J. 73, 2534-2545.
Monkkonen, J. & Urtti, A. (1 998) A h . Dnrg Deiiv. Rev. 34, 37-49.
Momard. P-A., Oberholzer, T. & Luisi, PL. (1997) Biochim. Biophys. Acta 1329, 39-50.
Okahata, Y., Enna, G., Taguchi, K. & Seki, T. (1985) J. Am. C h . Soc. 107, 5300-5301.
Picard, F., Paquet, M.-J., Dufourc, E.J. & Auger, M. (1998) Biophys. J. 59, 857-868.
Pearson, R.H. & Pascher, 1. (1979) Nature (London) 281, 499-501.
Pefferkorn, E. ( 1995) A h . Coiioid lnteflace Sci 56, 33.
Phi Ili pot, J. R. ( 1 995) Liposomes as Tools in Basic Reseurch artd I~dztsby, CRC Press, Boca
Raton, FL.
Rance, M., & Byrd, R. A. (1 983) J. M u p . Resom 52, 22- .
Raudino, A. ( 1 995) Adv. Colloid Inter. Sci 57, 229-285.
Reid, H.M. & Bayerl, T.M. (1993) Biochim. Biophys. Acta 1151. 127- 136.
Robinson, N.C., Strey, F. & Talbert, L. ( 1 980) Bïochemistry 19, 3656-366 1 .
Rose, M .E. (1 957) Eiementary Theory of Anplar Momentrm, Wiley, New York.

Roux, M., Neumann, J.M., Hodges, RS., Deveaux, P. & Bloorn M. (1 989) Biochemistry 28,
23 13-2321.
Ruponen, M., Ma-Her~iala, S. & Urtti, A. (1 999) Biochiitn. Biophys. Acta 1415, 33 1-34 1 .
Rydall, J . R. & Macdonald, P.M. (1 992) Biochernistry 31, 1092- 1099.
Saxton, M.J. (1993) Biophys. .l 56, 1053-106 1,
Scherer, P.G. & Seelig, J. (1987) LMBO J. 6, 291 5-2922.
Scherer, P.G. & Seelig, J. (1989) Bicichernistry 28, 7728-7734.
Seelig, J. (1977) Q. Rev. Biophys. 10, 353-418.
Seelig, J. (1 978) Biochim. Biophys. Acta. 515, 105- 140.
Seelig, A., Allegrini, P.R. & Seelig, J. (1988) Bioçhim. Biophys. Acta. 939, 267-276.
Seelig, J., Borle, F. & Cross, T.A, (1985) Biochim. Biophys. Acta. 814, 1%- 198.
Seelig, J., Macdonald, P.M. & Scherer, P. G. (1987) Biochemistry 26, 7535-7541.
Seelig, J, & Niederberger, W. (1 974) J. Am. Chem. Soc. 96. 2069-2072.
Seelig, J. & Seelig, A. (1980) Q. Rev. Biophys. 13. 19-6 1.
Semple, S.C., Chom, A. & Cullis, P.R. (1998) A h . DrugDel. Rev. 32, 3-17.
Shepherd, J.C.W. & Buldt, G. (1978) Biochim. Biophys. Acta, 514, 83-94.
Shimomura, M . & Kunitake, T. (1984) Polymer J. 16, 187-190.
S imi novit ch, D. J. ( 1 998) Biochern. Cell Biol. 76, 4 1 1 -422..
Singer, S.J. & Nicholson, G.L. (1 972) Science 175, 720-73 1.
Sixl, F. & Watts, A. (1 985) Biochemisiry 21, 7906-79 10.
Sternberg, B., Sorgi, F.L. & Huang, L. (1994) FEBS Letr. 356, 361-366.

Stemberg, B., Hong, K., Zheng, W. & Papahadjopoulos, D. (1998) Biochim. Biophys. Acta
1375, 23-35.
Stemin, E., Bloom, M. & MacKay, A L . (198315. Magn. Reson. 55. 274-282.
Stuart, M.A.C., Fleer, G.J., Lyklema, I., Norde, W. & Scheutjens, J.M.H.M. (1 99 1) Adv.
Coiioid inter. Sei. 34. 477-53 5 .
Tanford, C . ( 1 980) 7ne Hydrophobie Effect: Formation of Micelles und Biological Membranes.
Wiley-Interscience, New York.
Thompson, T.E., Sankaram, M.B. & Biltonen, R.L. (1992) ComrnenisMol. C d . Biophys. 8. 1-
15.
Tocanne, J-F. (1 992) Comments Mol. CeM Biophys. 8, 53-72.
Tocanne, J-F., Cezanne, L., Lopez, A., Piknova, B., Schram, V., Tournier, J-F. & Welby, M.
( 1 994) Chem. Phys. Lip. 73, 139- 158.
Tocanne, J-F., Dupou-Cézanne, L. & Lopez, A. (1994) Prog. LipidRes. 33, 203-237.
van der Woude, I., Visser, H. W., ter Beest, M.B.A., Wagenaar, A., Ruiters, M.H. J., Engberts,
J.B.F.N. & Hoekstra, D. (1 995) Biochim. Biophys. Acta 1240, 34-40.
van de Steeg, H.F.M., Stuart, M.A.C., de Keizer, A. & Bisterbosch, B.H. (1 992) Langmuir 8,
2538-2546.
Van Gorkom, L.C.M. Horvath, L.I., Hemminga, M.A., Stemberg, B. & Watts, A. (1 990)
Biochemisiry 35, 3 828-3 834.
Vaz, W. L. C . ( 1 992) Comrnents Moi. Celi. Biophys. 8, 1 7-3 6.
Verwey, E. J. & Overbeck, J. Th.G ( 1948) Theory of the Stability of Lyophobic Coiioids,
Elsevier, Amsterdam.
Voet. D. & Voet, J.G. (1990) in Biochemisiry, John Wiley and Sons, Toronto.
Vold, R.R. & Vold, R.L. (1991)Adv. Magn. Opt. Reson. 16, 85-171.
Vist, M. R. & Davis, J.H. ( 1 990) Biochemistry 29, 45 1-464.
Watts, A. ( 1 998) Biochim. Biophys. Acta 13 76, 297-3 1 8.
Welti, R. & Glaser, M. (1 994) Chem. Phys. Lip. 73, 12 1- 137.
Winnik, F.M., Adronov, A. & Kitano, H. (1995) Can. J. Chem. 73, 2030-2040.
Wolf, D.E. ( 1 992) Comments Moi. Ceff. Biophys. 8, 83-95.
Wrobel, 1. & Collins, D. (1995) Biochim. Biophys. Acta 1235, 296-304.
Yang, L. & Glaser, M. ( 1 995) Biochemistry 34, 1500- 1506.
Yang, L. & Glaser, M. (1 996) Biochemistry 35, 13966- 13974.
Zabner, J., Fasbender, A.J., Moninger, T., Poellinger, K. A. & Welsh, M.J. ( 1 995) J. Bioi. Chem.
2 70, 1 8997- 19007.