synthesis of wave forms
TRANSCRIPT
8/10/2019 Synthesis of Wave Forms
http://slidepdf.com/reader/full/synthesis-of-wave-forms 1/34
Formal Report
Four ier Analysis
And
Synthesis of Wave forms
8/10/2019 Synthesis of Wave Forms
http://slidepdf.com/reader/full/synthesis-of-wave-forms 2/34
Learning objectives
This experiment will on completion, help the student to understand:
(a) The physical meaning of signal spectrum
(b) That each different waveform has a different spectrum (or spectral density)(c) That certain standard results exist for standard waveforms(d) The effects of spectrum limitation on the transmission of signals
Abstract
This experiment explores Fourier analysis. Fourier series is used to convert a
time-domain signal to frequency domain. Fourier series decomposes any
periodic function or periodic signal into the sum of a set of simple oscillating
functions, namely sines and cosines. This experiment is concerned with the
analysis of a signal and the exploration of the properties of the signal. In thisexperiment, we are going to study the basic waveforms such as sinusoidal,
square, saw tooth and triangular waves. We will use Fourier series to observe
and study the effects of limiting the bandwidth of real signal, the amount of
bandwidth needed to support a binary representation of an analogue signal,
quantisation of analogue signals and unusual signals. A special java basedapplication will be used to perform the experiment.
Introduction
Fourier series were introduced by Joseph Fourier for the purpose of solving the
heat equation in a metal plate. The Fourier series has many applications in
electrical engineering, vibration analysis, acoustics, optics, signal processing,
image processing, quantum mechanics, and econometrics etcThis experiment focuses on the analysis and synthesis of signals and Fourier
Transform. A synthesized signal will be generated which will be an
approximation of the input signal. The synthesized signal will look more andmore like the input signal as the number of terms will increase. Using Fourier
series a real signal in time domain will be characterised in frequency domain
which will be observed by the frequency domain graph. This experiment willalso demonstrate the effect of varying the number of terms, Quantizing, Phase
Shifting and Clipping the wave.
Background Theory
8/10/2019 Synthesis of Wave Forms
http://slidepdf.com/reader/full/synthesis-of-wave-forms 3/34
A signal can be regarded as the variation of any measurable quantity that
conveys information concerning the behaviour of a related system . A system is
a means of processing a signal. Signals come in many shapes and forms and
can be classified as; Analogue/ Continuous Time Signals and Digital/ DiscreteTime Signals.
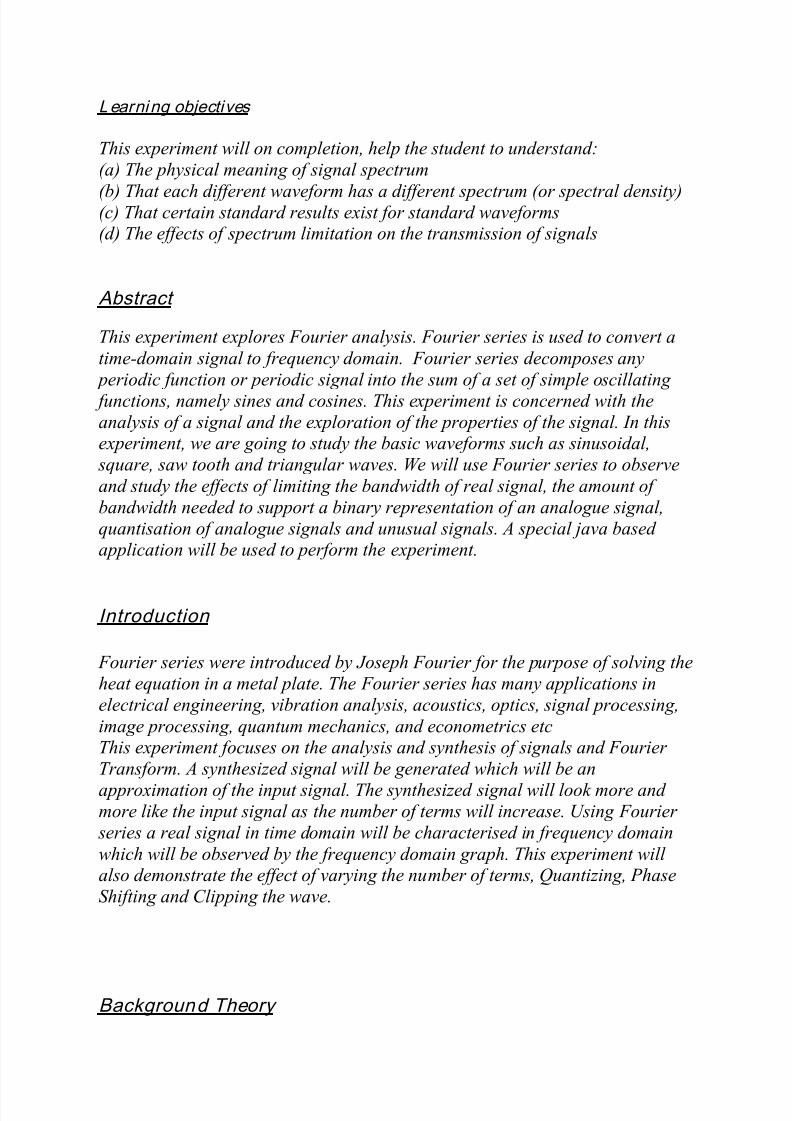
Analogue or Continuous Time Signal
A continuous time signal can be represented mathematically as a function of a
continuous time variable. It is defined at all time (t).
Digital or Di screte Time Signal
A discrete time signal is defined only at particular set of instants of time.
8/10/2019 Synthesis of Wave Forms
http://slidepdf.com/reader/full/synthesis-of-wave-forms 4/34
A discrete time signal is often derived from a continuous time signal
by sampling it at uniform rate.
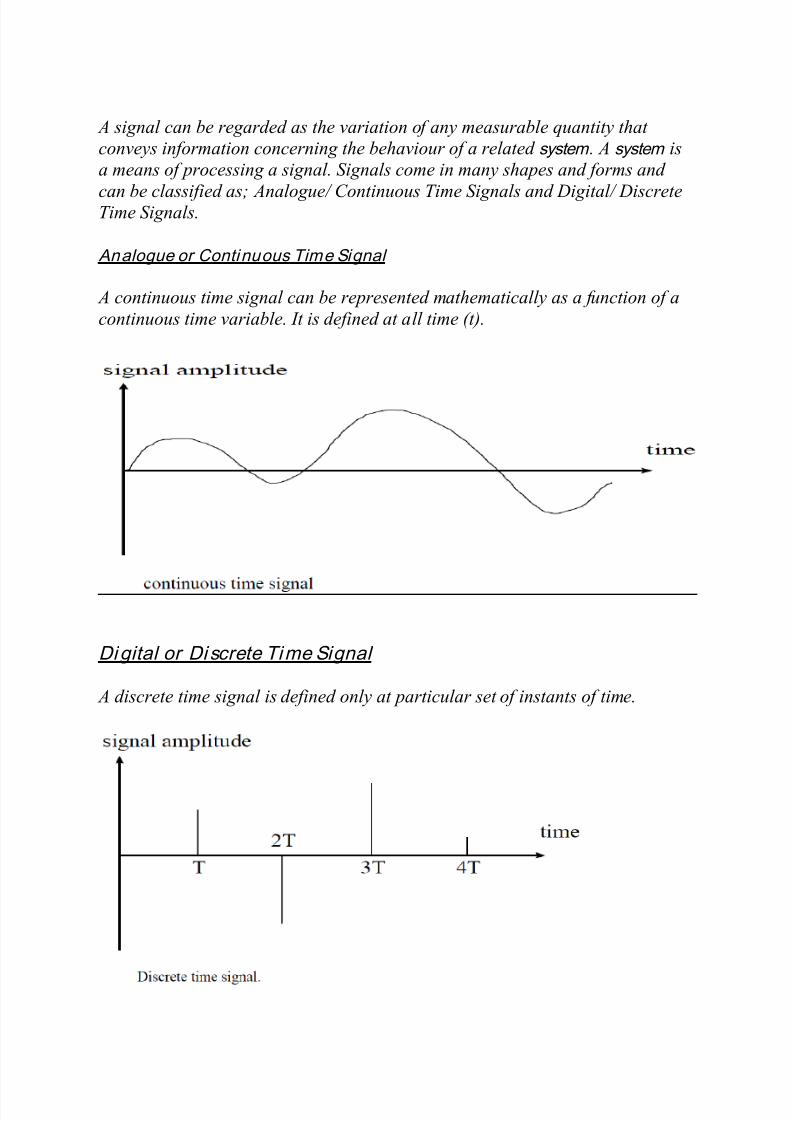
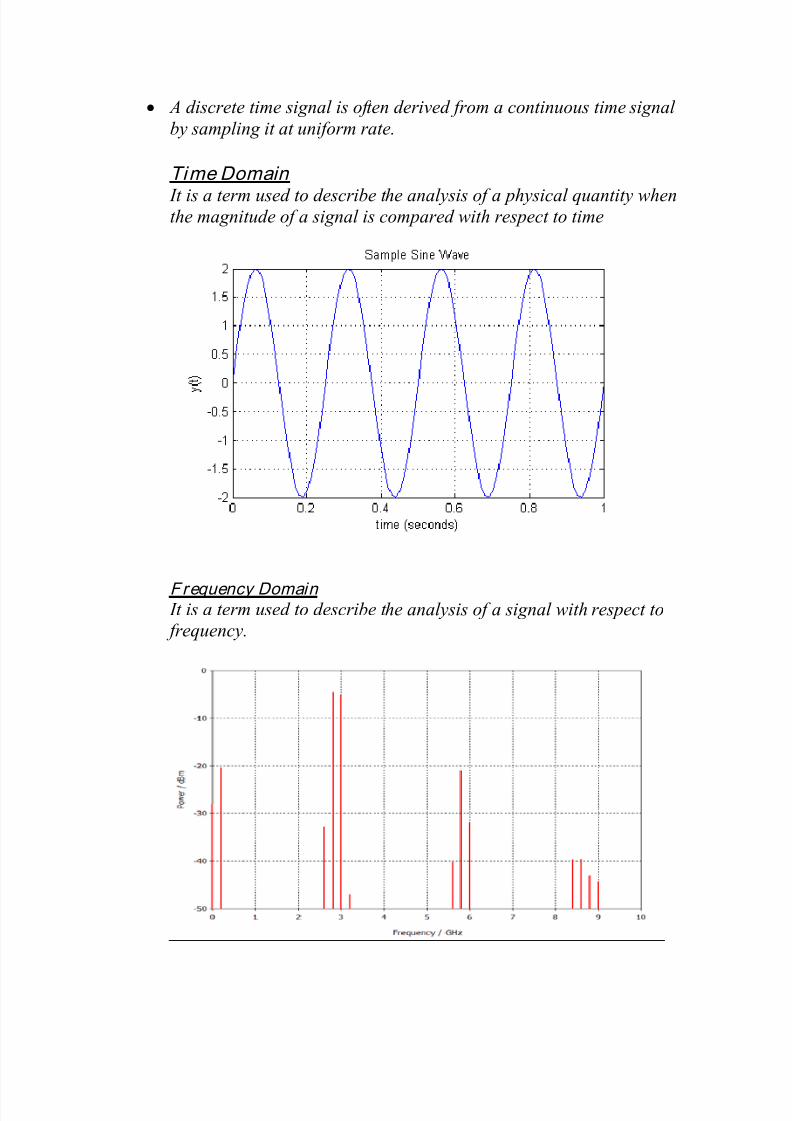
Time Domain
It is a term used to describe the analysis of a physical quantity whenthe magnitude of a signal is compared with respect to time
Frequency Domain It is a term used to describe the analysis of a signal with respect to frequency.
8/10/2019 Synthesis of Wave Forms
http://slidepdf.com/reader/full/synthesis-of-wave-forms 5/34
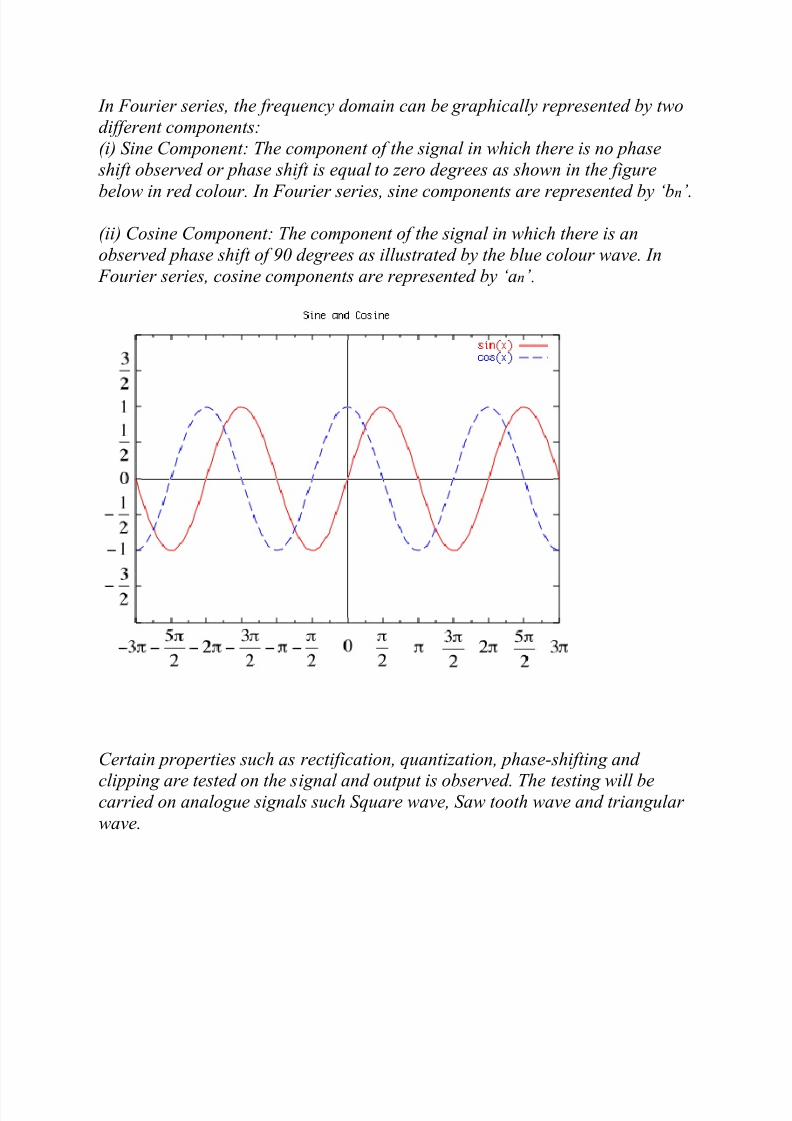
In Fourier series, the frequency domain can be graphically represented by two
different components:
(i) Sine Component: The component of the signal in which there is no phase
shift observed or phase shift is equal to zero degrees as shown in the figure
below in red colour. In Fourier series, sine components are represented by ‘bn’.
(ii) Cosine Component: The component of the signal in which there is an
observed phase shift of 90 degrees as illustrated by the blue colour wave. In
Fourier series, cosine components are represented by ‘an’ .
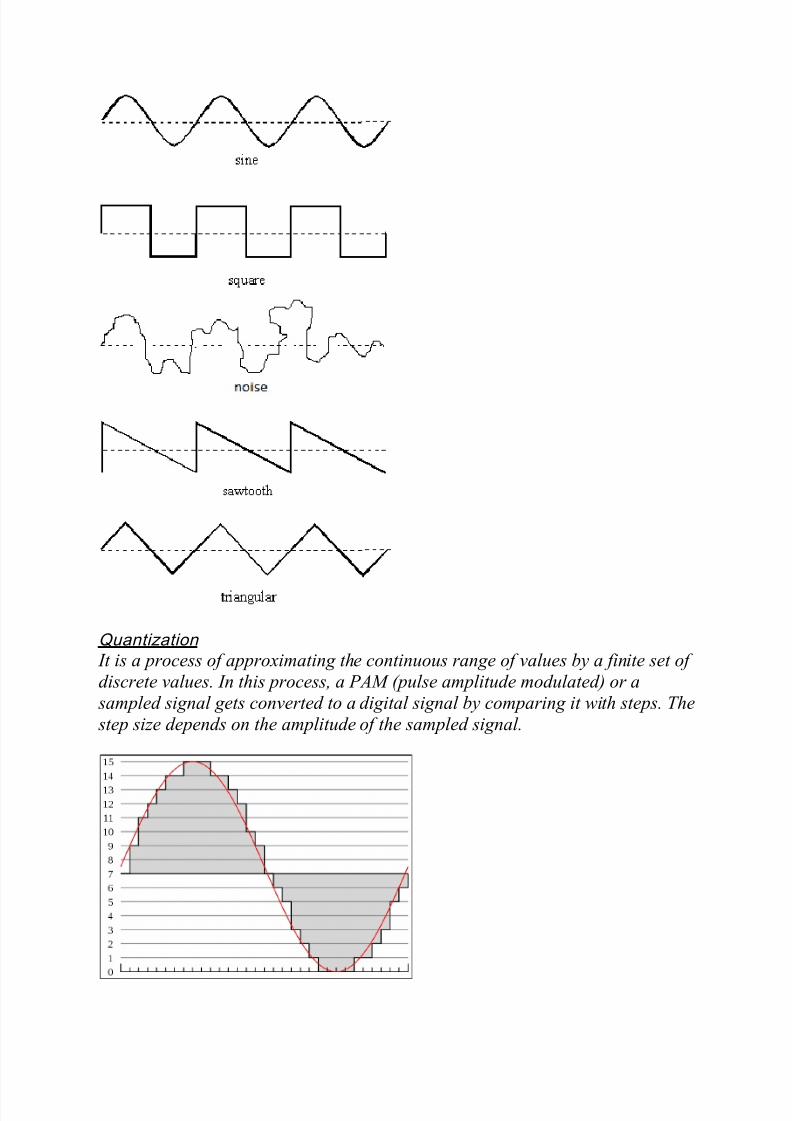
Certain properties such as rectification, quantization, phase-shifting and
clipping are tested on the signal and output is observed. The testing will becarried on analogue signals such Square wave, Saw tooth wave and triangular
wave.
8/10/2019 Synthesis of Wave Forms
http://slidepdf.com/reader/full/synthesis-of-wave-forms 6/34
Quantization
It is a process of approximating the continuous range of values by a finite set of
discrete values. In this process, a PAM (pulse amplitude modulated) or a
sampled signal gets converted to a digital signal by comparing it with steps. The
step size depends on the amplitude of the sampled signal.
8/10/2019 Synthesis of Wave Forms
http://slidepdf.com/reader/full/synthesis-of-wave-forms 7/34
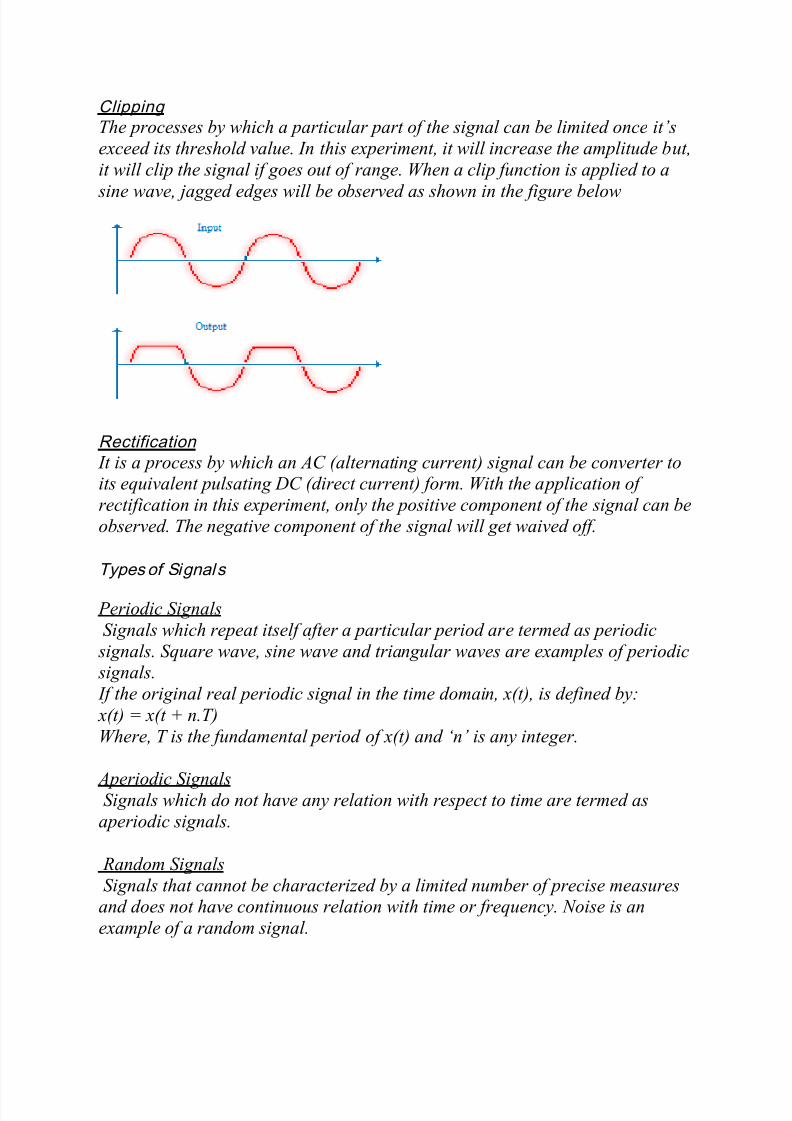
Clipping
The processes by which a particular part of the signal can be limited once it’s
exceed its threshold value. In this experiment, it will increase the amplitude but,
it will clip the signal if goes out of range. When a clip function is applied to a
sine wave, jagged edges will be observed as shown in the figure below
Rectification
It is a process by which an AC (alternating current) signal can be converter toits equivalent pulsating DC (direct current) form. With the application of
rectification in this experiment, only the positive component of the signal can be
observed. The negative component of the signal will get waived off.
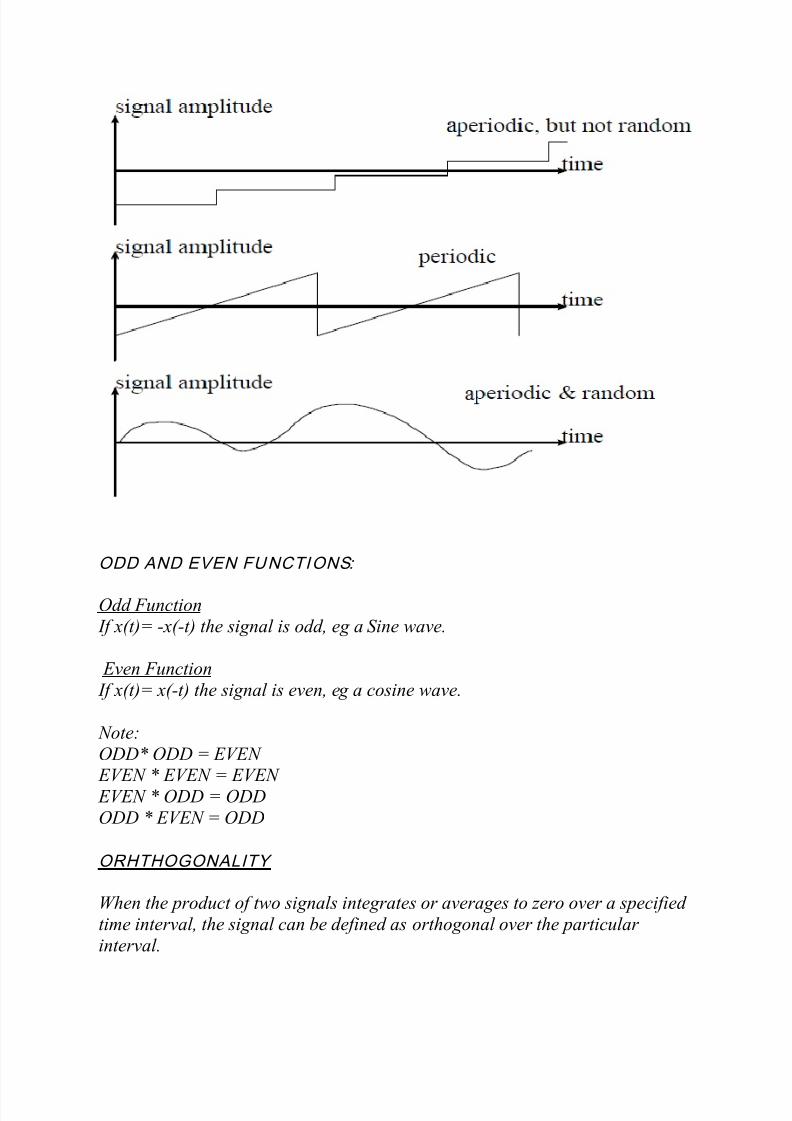
Types of Signals
Periodic Signals
Signals which repeat itself after a particular period are termed as periodic
signals. Square wave, sine wave and triangular waves are examples of periodic signals.
If the original real periodic signal in the time domain, x(t), is defined by:
x(t) = x(t + n.T)
Where, T is the fundamental period of x(t) and ‘n’ is any integer.
Aperiodic SignalsSignals which do not have any relation with respect to time are termed as
aperiodic signals.
Random Signals
Signals that cannot be characterized by a limited number of precise measuresand does not have continuous relation with time or frequency. Noise is an
example of a random signal.
8/10/2019 Synthesis of Wave Forms
http://slidepdf.com/reader/full/synthesis-of-wave-forms 8/34
ODD AND EVEN FUNCTIONS:
Odd Function
If x(t)= -x(-t) the signal is odd, eg a Sine wave.
Even Function
If x(t)= x(-t) the signal is even, eg a cosine wave.
Note:
ODD* ODD = EVEN EVEN * EVEN = EVEN
EVEN * ODD = ODD
ODD * EVEN = ODD
ORHTHOGONALITY
When the product of two signals integrates or averages to zero over a specified
time interval, the signal can be defined as orthogonal over the particular
interval.
8/10/2019 Synthesis of Wave Forms
http://slidepdf.com/reader/full/synthesis-of-wave-forms 9/34
Discrete signals
If the two signals averages to zero over the period T, then those two signals are
orthogonal in that interval(T).
Continuous signals If the product of two signals integrates to zero over the period T, then those two signals are ORTHOGONAL in that interval (T).
Time Domain Representation
Output signal to the input signal is represented as a function of time is called
Time Domain Representation.
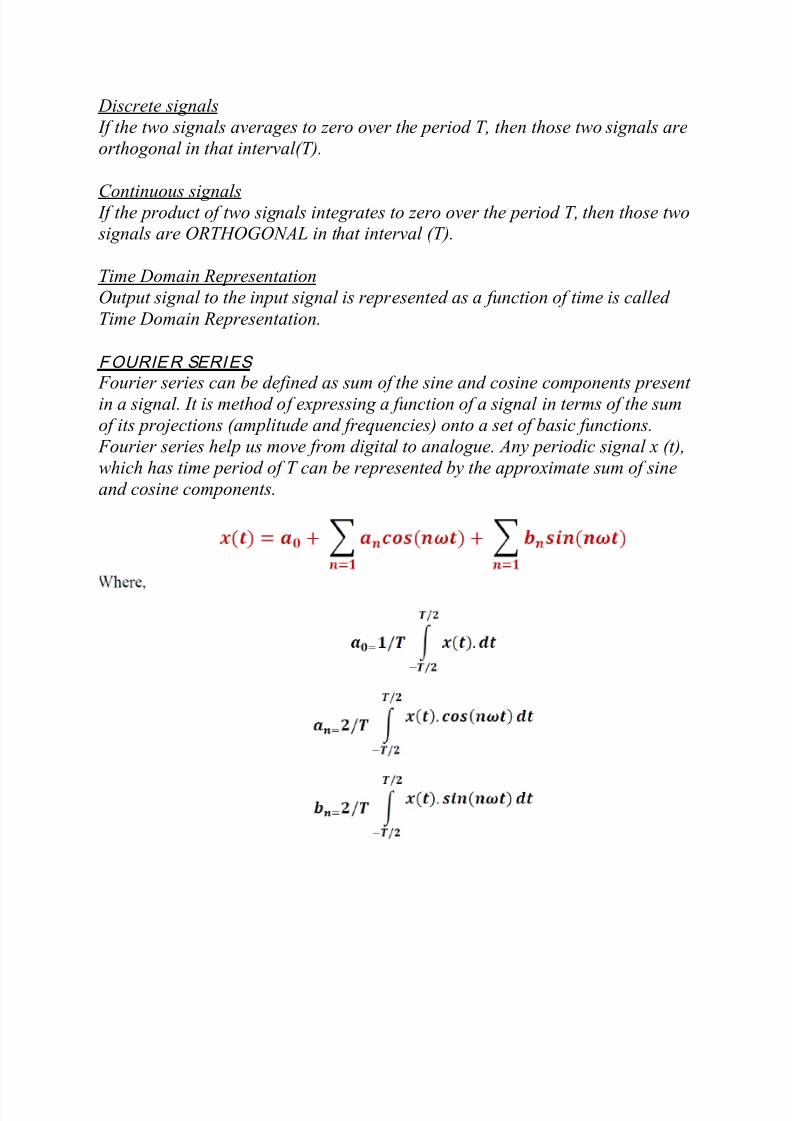
FOURIER SERIES
Fourier series can be defined as sum of the sine and cosine components present
in a signal. It is method of expressing a function of a signal in terms of the sum
of its projections (amplitude and frequencies) onto a set of basic functions.
Fourier series help us move from digital to analogue. Any periodic signal x (t),
which has time period of T can be represented by the approximate sum of sine
and cosine components.
8/10/2019 Synthesis of Wave Forms
http://slidepdf.com/reader/full/synthesis-of-wave-forms 10/34
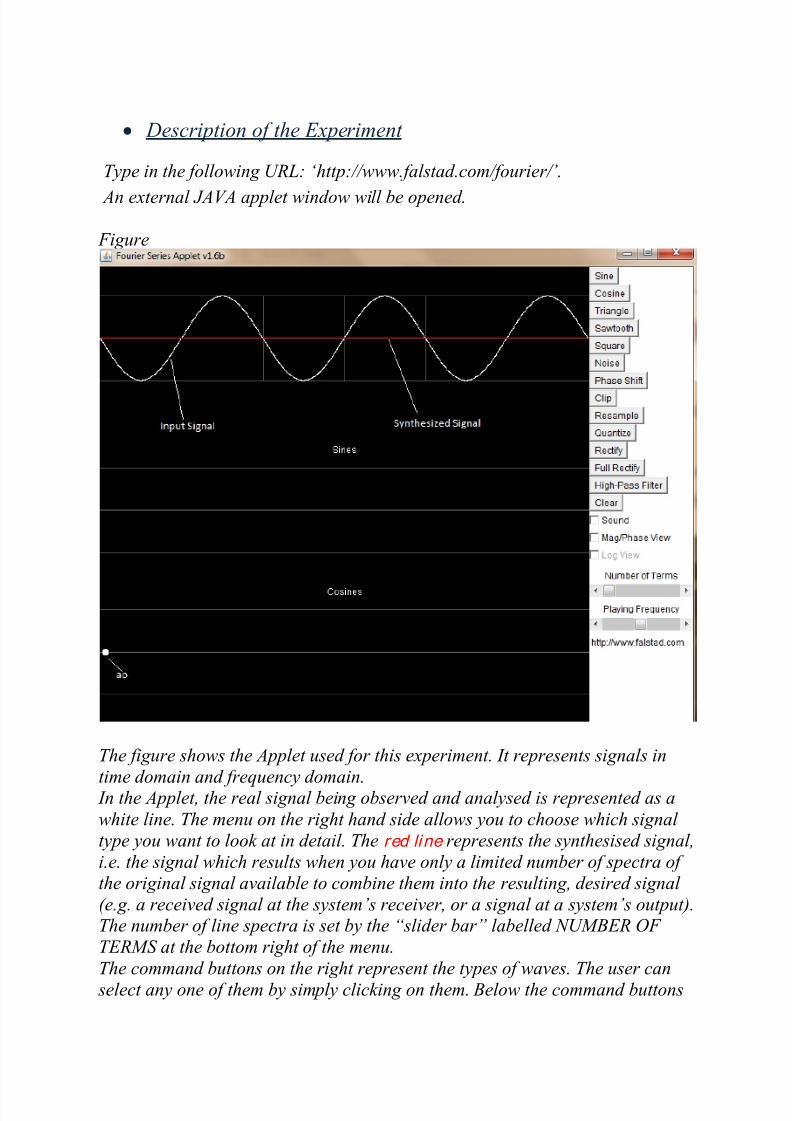
Description of the Experiment
Type in the following URL: ‘ http://www.falstad.com/fourier/ ’.
An external JAVA applet window will be opened.
Figure
The figure shows the Applet used for this experiment. It represents signals in
time domain and frequency domain. In the Applet, the real signal being observed and analysed is represented as a
white line. The menu on the right hand side allows you to choose which signal
type you want to look at in detail. The red line represents the synthesised signal,
i.e. the signal which results when you have only a limited number of spectra of
the original signal available to combine them into the resulting, desired signal
(e.g. a received signal at the system’s receiver, or a signal at a system’s output).The number of line spectra is set by the “slider bar” labelled NUMBER OF
TERMS at the bottom right of the menu.
The command buttons on the right represent the types of waves. The user can
select any one of them by simply clicking on them. Below the command buttons
8/10/2019 Synthesis of Wave Forms
http://slidepdf.com/reader/full/synthesis-of-wave-forms 11/34
are two sliders which represent number of terms and Playing frequency. They
can be set according to requirement by simply moving them right or left.
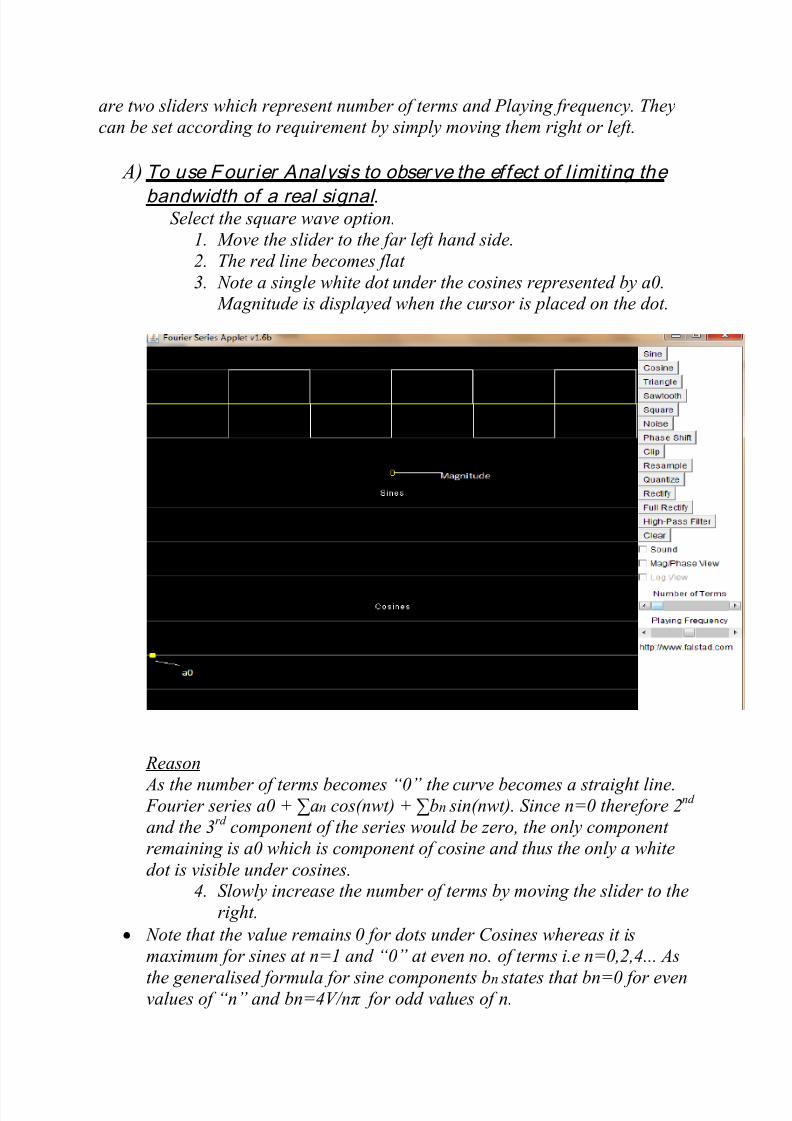
A) To use Four ier Analysis to observe the effect of l imiting the
bandwidth of a real signal .Select the square wave option.
1. Move the slider to the far left hand side.
2. The red line becomes flat
3. Note a single white dot under the cosines represented by a0. Magnitude is displayed when the cursor is placed on the dot.
Reason
As the number of terms becomes “0” the curve becomes a straight line. Fourier series a0 + ∑an cos(nwt) + ∑bn sin(nwt). Since n=0 therefore 2
nd
and the 3rd
component of the series would be zero, the only component
remaining is a0 which is component of cosine and thus the only a white
dot is visible under cosines.4.
Slowly increase the number of terms by moving the slider to the
right.
Note that the value remains 0 for dots under Cosines whereas it is
maximum for sines at n=1 and “0” at even no. of terms i.e n=0,2,4... As
the generalised formula for sine components bn states that bn=0 for evenvalues of “n” and bn=4V/nπ for odd values of n.
8/10/2019 Synthesis of Wave Forms
http://slidepdf.com/reader/full/synthesis-of-wave-forms 12/34
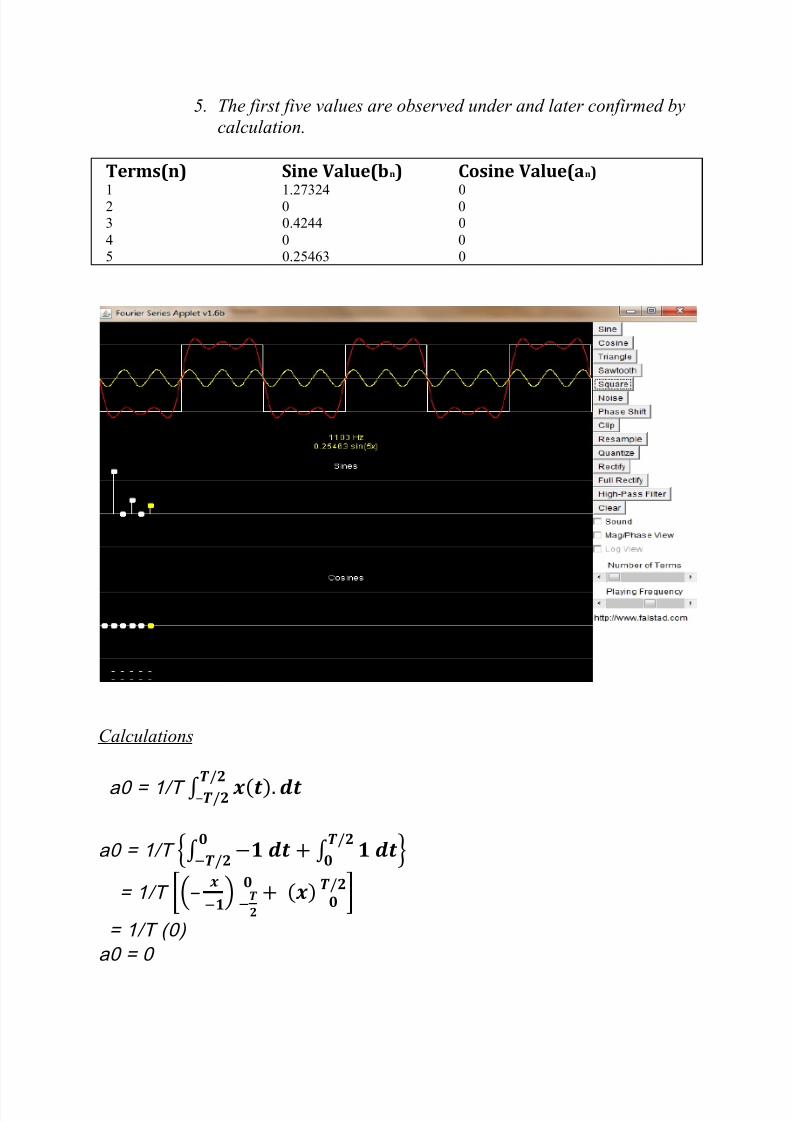
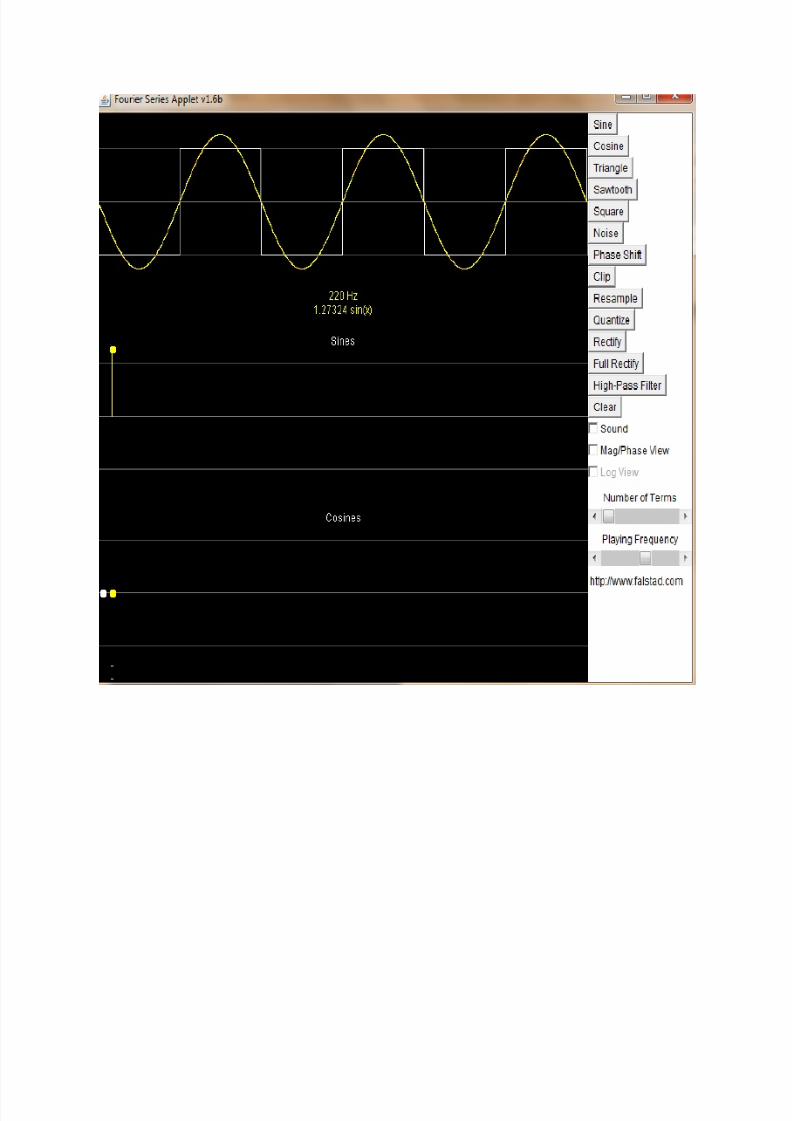
5.
The first five values are observed under and later confirmed by
calculation.
Terms(n) Sine Value(bn) Cosine Value(an)
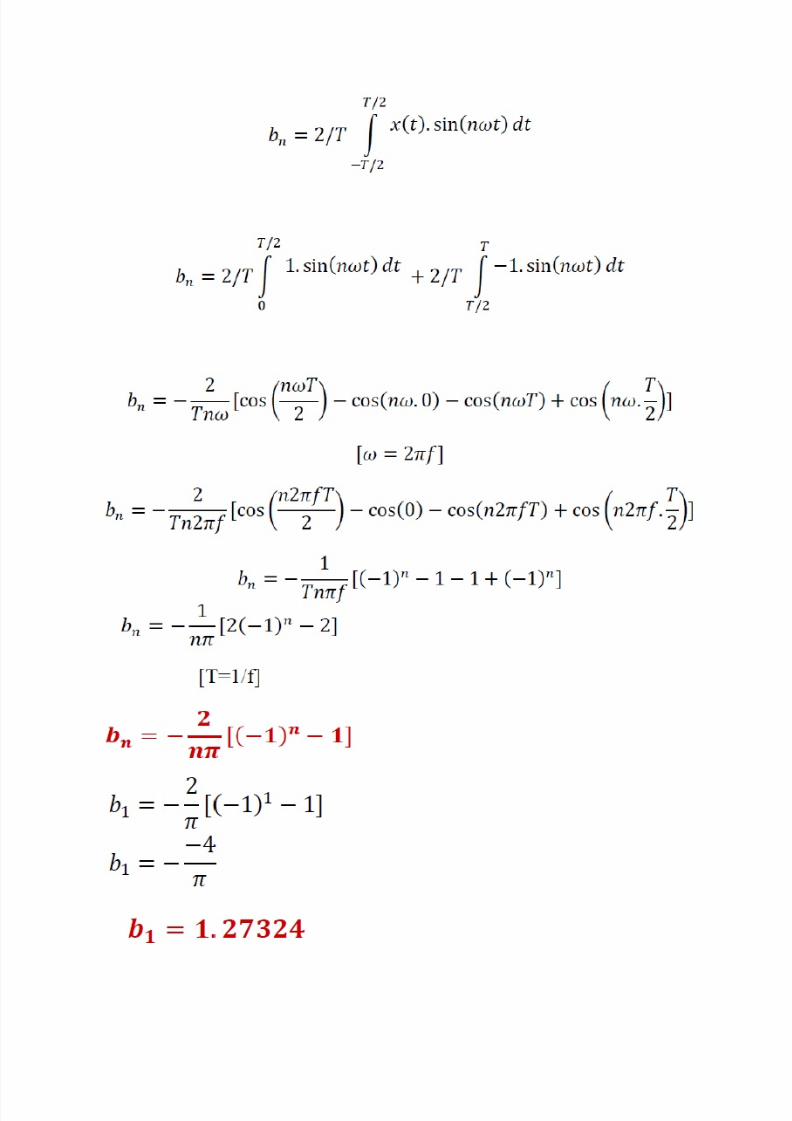
1 1.27324 0
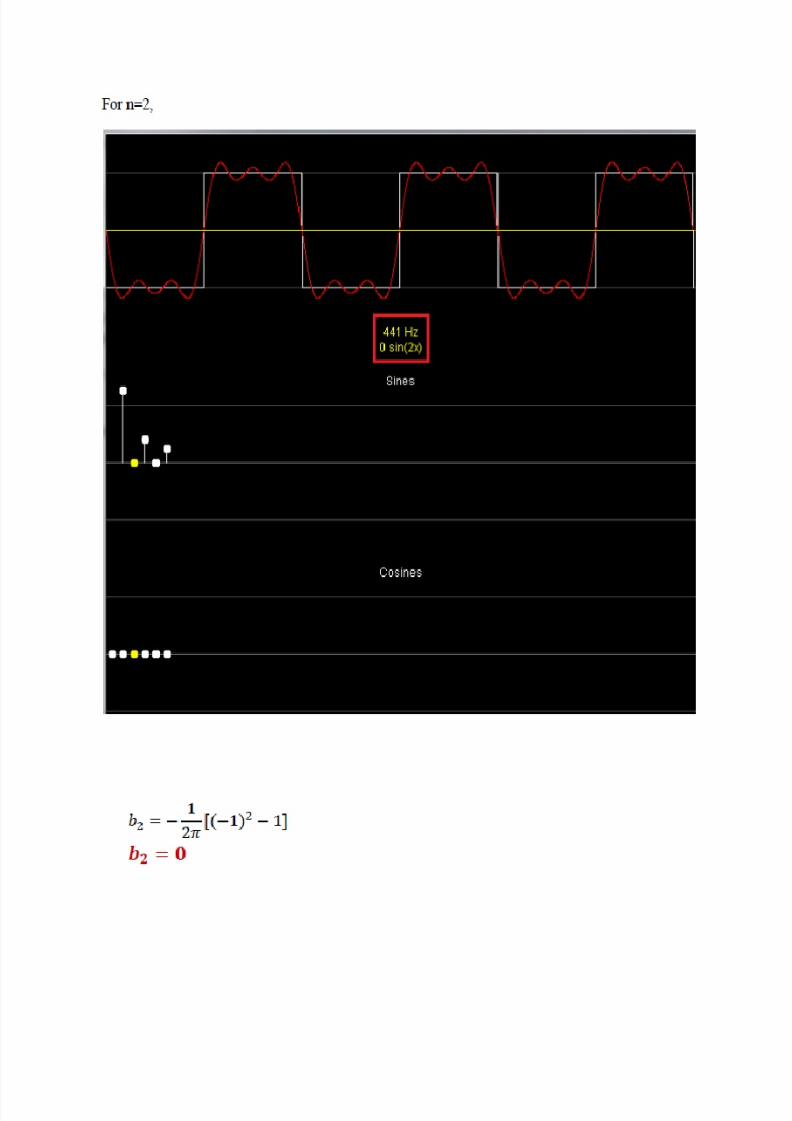
2 0 0
3 0.4244 0
4 0 0
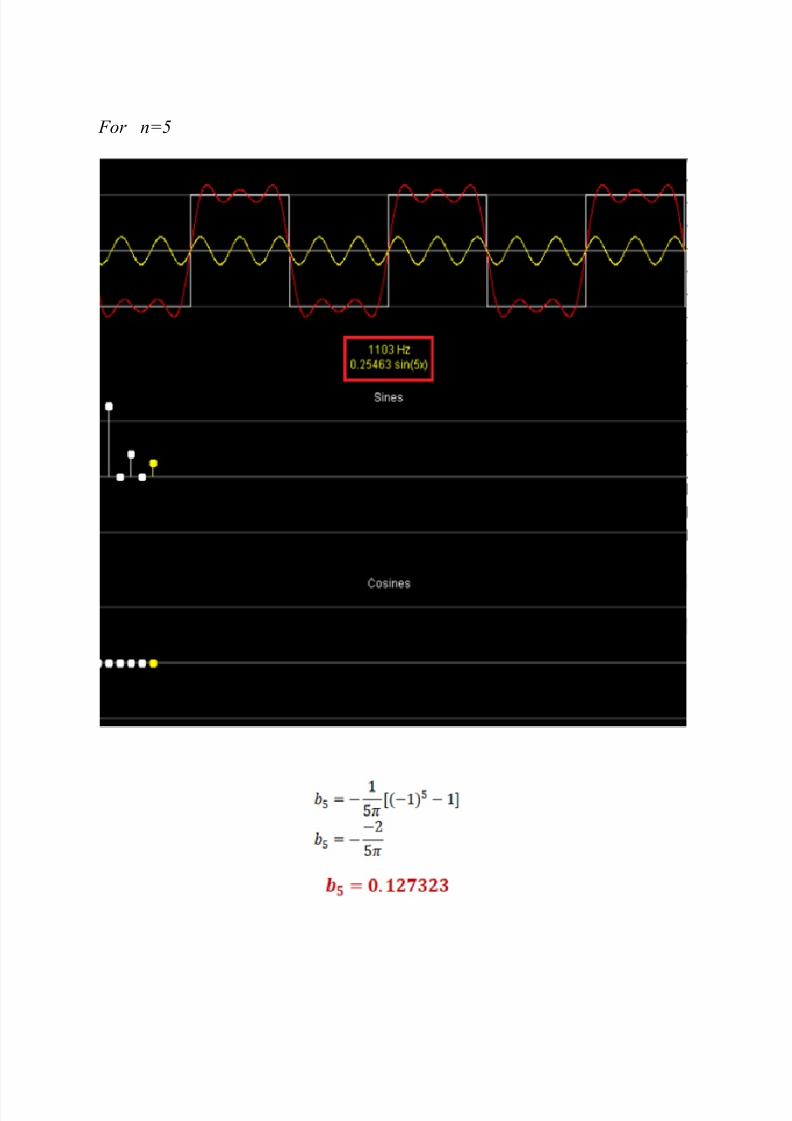
5 0.25463 0
Calculations
a0 = 1/T –
a0 = 1/T
= 1/T –
= 1/T (0)
a0 = 0
8/10/2019 Synthesis of Wave Forms
http://slidepdf.com/reader/full/synthesis-of-wave-forms 13/34
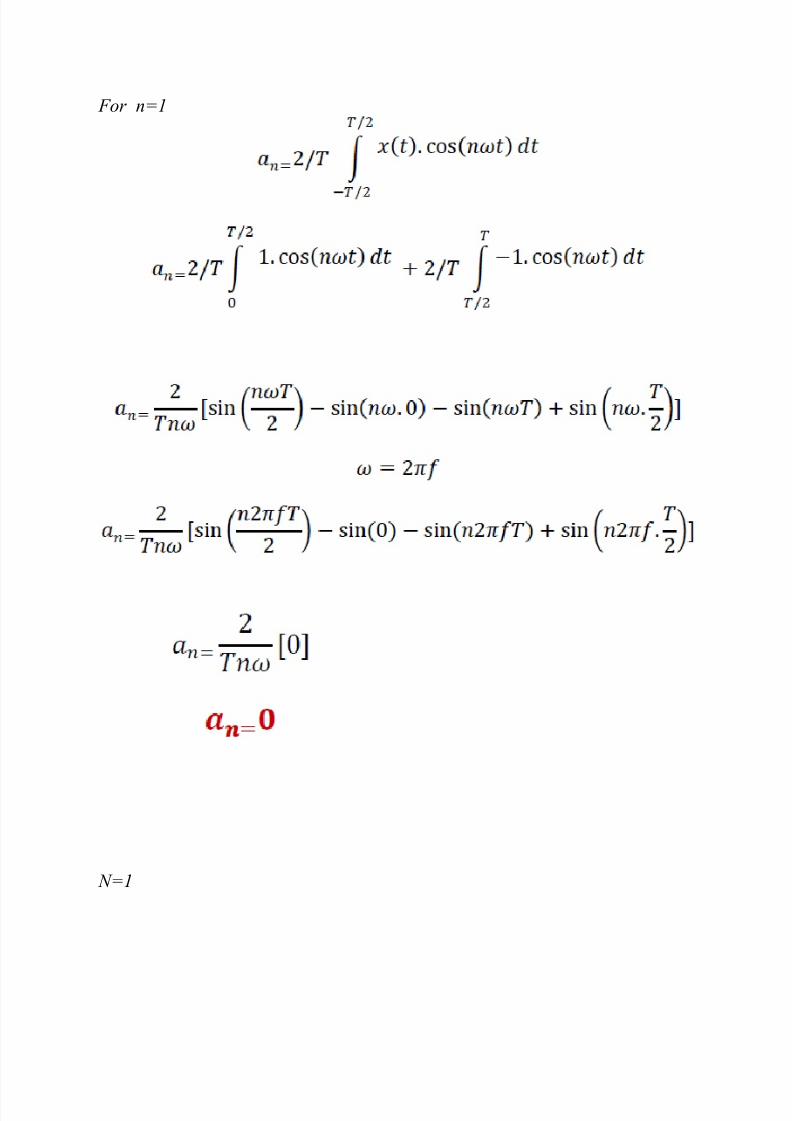
For n=1
N=1
8/10/2019 Synthesis of Wave Forms
http://slidepdf.com/reader/full/synthesis-of-wave-forms 14/34
8/10/2019 Synthesis of Wave Forms
http://slidepdf.com/reader/full/synthesis-of-wave-forms 15/34
8/10/2019 Synthesis of Wave Forms
http://slidepdf.com/reader/full/synthesis-of-wave-forms 16/34
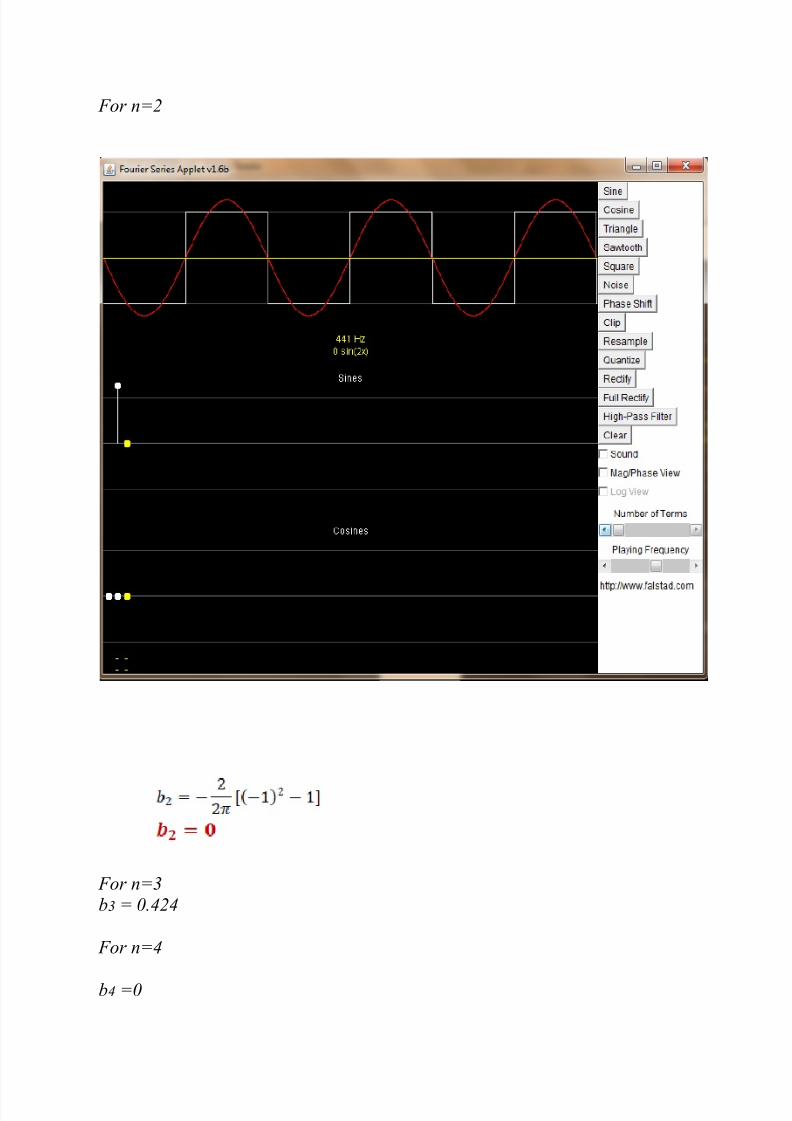
For n=2
For n=3b3 = 0.424
For n=4
b4 =0
8/10/2019 Synthesis of Wave Forms
http://slidepdf.com/reader/full/synthesis-of-wave-forms 17/34
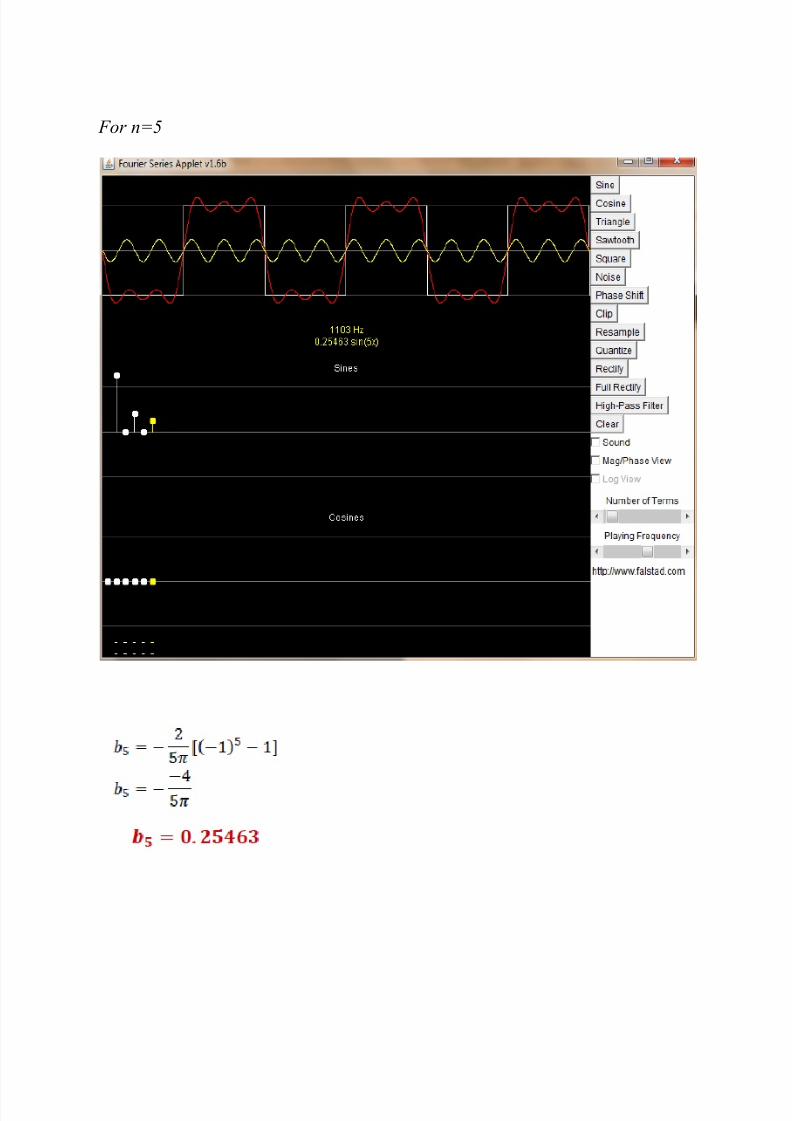
For n=5
8/10/2019 Synthesis of Wave Forms
http://slidepdf.com/reader/full/synthesis-of-wave-forms 18/34
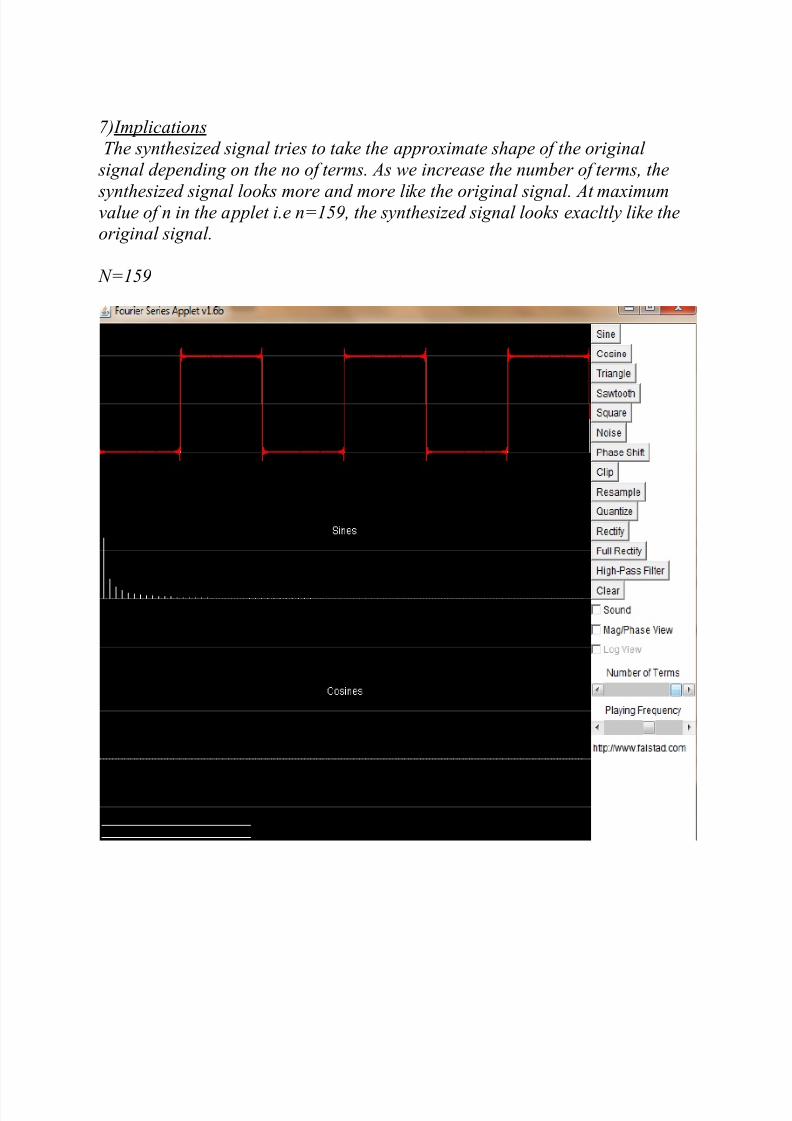
7)Implications
The synthesized signal tries to take the approximate shape of the original
signal depending on the no of terms. As we increase the number of terms, the
synthesized signal looks more and more like the original signal. At maximumvalue of n in the applet i.e n=159, the synthesized signal looks exacltly like theoriginal signal.
N=159
8/10/2019 Synthesis of Wave Forms
http://slidepdf.com/reader/full/synthesis-of-wave-forms 19/34
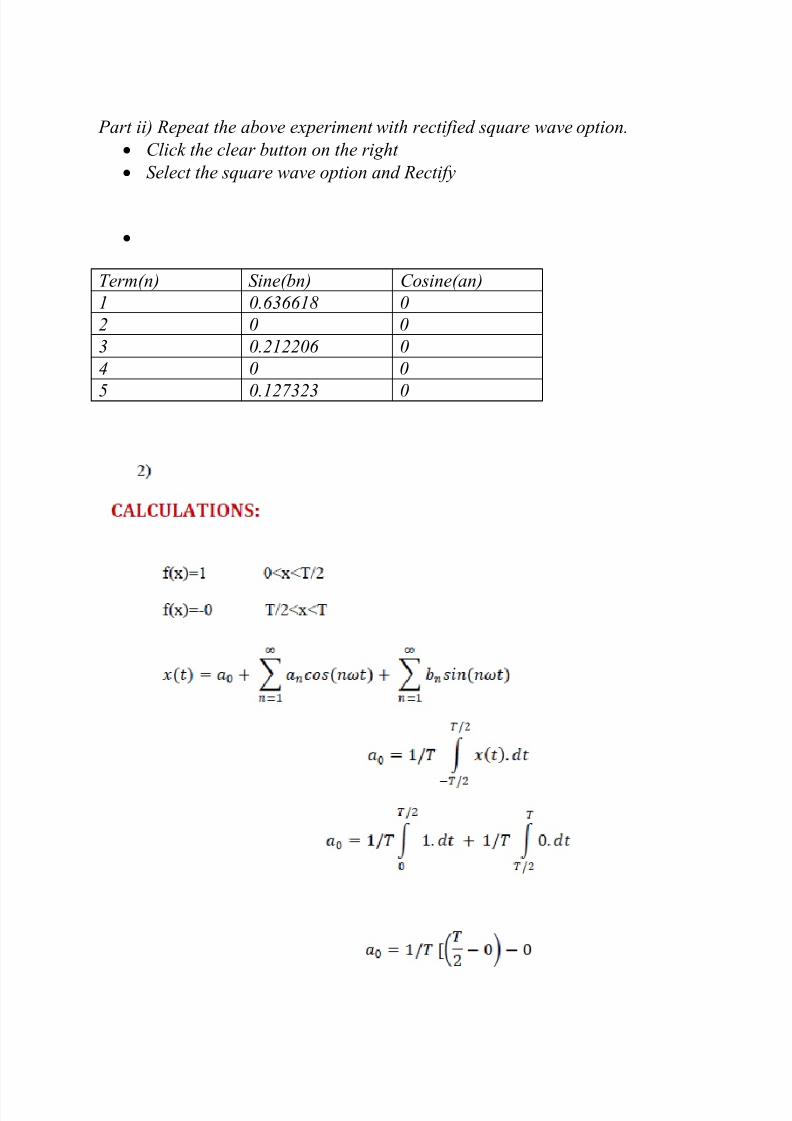
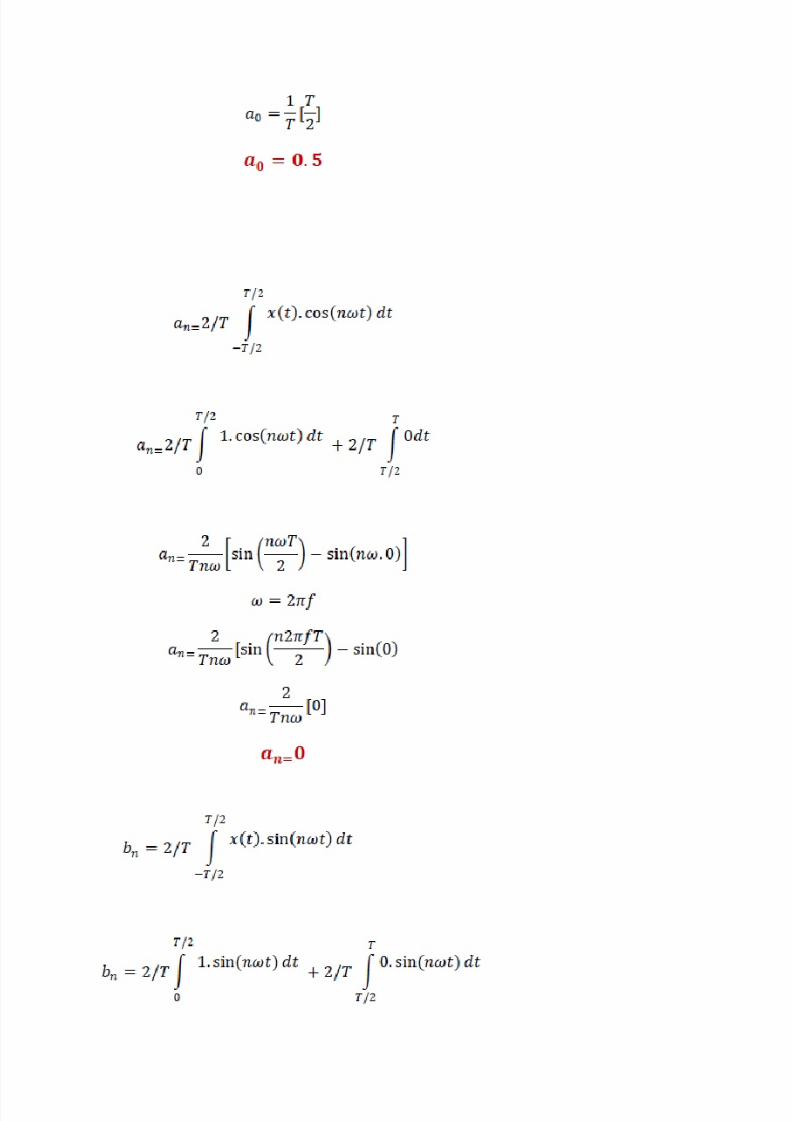
Part ii) Repeat the above experiment with rectified square wave option.
Click the clear button on the right
Select the square wave option and Rectify
Term(n) Sine(bn) Cosine(an)
1 0.636618 0
2 0 0
3 0.212206 0
4 0 0
5 0.127323 0
8/10/2019 Synthesis of Wave Forms
http://slidepdf.com/reader/full/synthesis-of-wave-forms 20/34

8/10/2019 Synthesis of Wave Forms
http://slidepdf.com/reader/full/synthesis-of-wave-forms 21/34
For n=1
8/10/2019 Synthesis of Wave Forms
http://slidepdf.com/reader/full/synthesis-of-wave-forms 22/34
8/10/2019 Synthesis of Wave Forms
http://slidepdf.com/reader/full/synthesis-of-wave-forms 23/34
For n=5
8/10/2019 Synthesis of Wave Forms
http://slidepdf.com/reader/full/synthesis-of-wave-forms 24/34
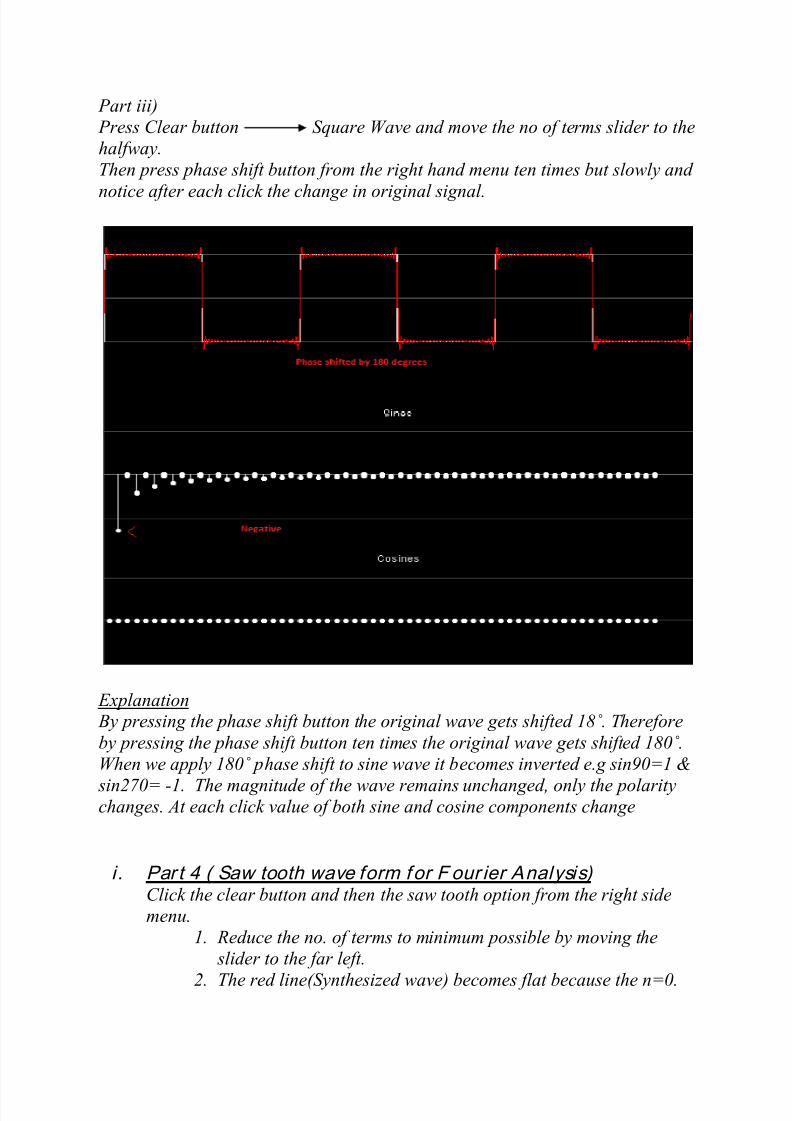
Part iii)
Press Clear button Square Wave and move the no of terms slider to the
halfway.
Then press phase shift button from the right hand menu ten times but slowly and
notice after each click the change in original signal.
Explanation By pressing the phase shift button the original wave gets shifted 18˚. Therefore
by pressing the phase shift button ten times the original wave gets shifted 180˚.
When we apply 180˚ phase shift to sine wave it becomes inverted e.g sin90=1 &
sin270= -1. The magnitude of the wave remains unchanged, only the polaritychanges. At each click value of both sine and cosine components change
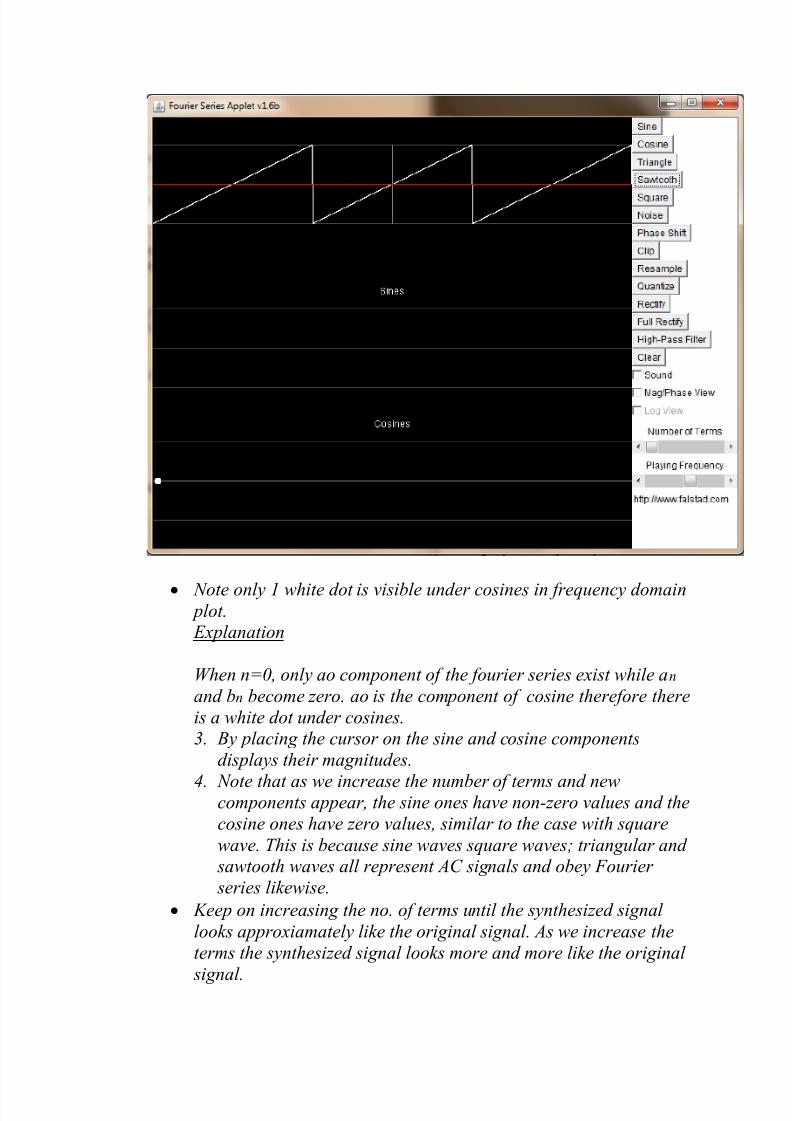
i . Part 4 ( Saw tooth wave form for F our ier Analysis)Click the clear button and then the saw tooth option from the right side
menu. 1. Reduce the no. of terms to minimum possible by moving the
slider to the far left.
2.
The red line(Synthesized wave) becomes flat because the n=0.
8/10/2019 Synthesis of Wave Forms
http://slidepdf.com/reader/full/synthesis-of-wave-forms 25/34
Note only 1 white dot is visible under cosines in frequency domain plot. Explanation
When n=0, only ao component of the fourier series exist while an
and bn become zero. ao is the component of cosine therefore there
is a white dot under cosines.3.
By placing the cursor on the sine and cosine components
displays their magnitudes.
4.
Note that as we increase the number of terms and newcomponents appear, the sine ones have non-zero values and the
cosine ones have zero values, similar to the case with square
wave. This is because sine waves square waves; triangular and sawtooth waves all represent AC signals and obey Fourier
series likewise.
Keep on increasing the no. of terms until the synthesized signal
looks approxiamately like the original signal. As we increase the
terms the synthesized signal looks more and more like the original
signal.
8/10/2019 Synthesis of Wave Forms
http://slidepdf.com/reader/full/synthesis-of-wave-forms 26/34
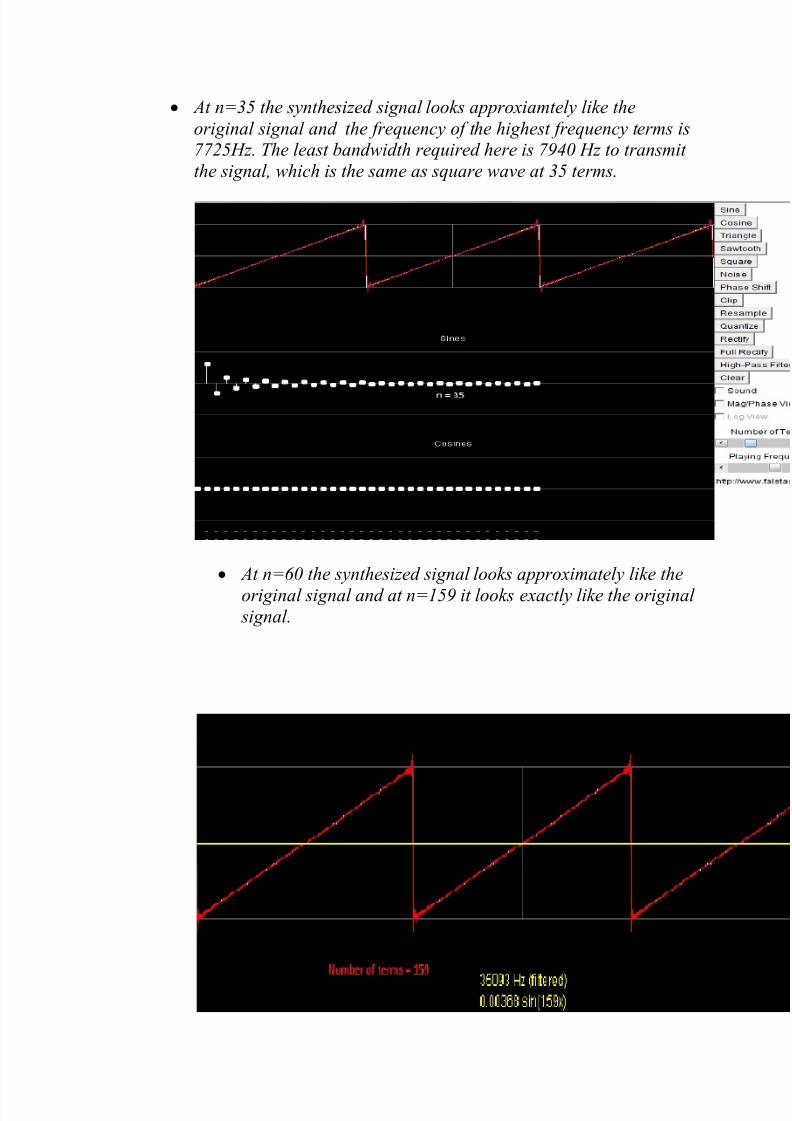
At n=35 the synthesized signal looks approxiamtely like the
original signal and the frequency of the highest frequency terms is7725Hz. The least bandwidth required here is 7940 Hz to transmit
the signal, which is the same as square wave at 35 terms.
At n=60 the synthesized signal looks approximately like the
original signal and at n=159 it looks exactly like the original signal.
8/10/2019 Synthesis of Wave Forms
http://slidepdf.com/reader/full/synthesis-of-wave-forms 27/34
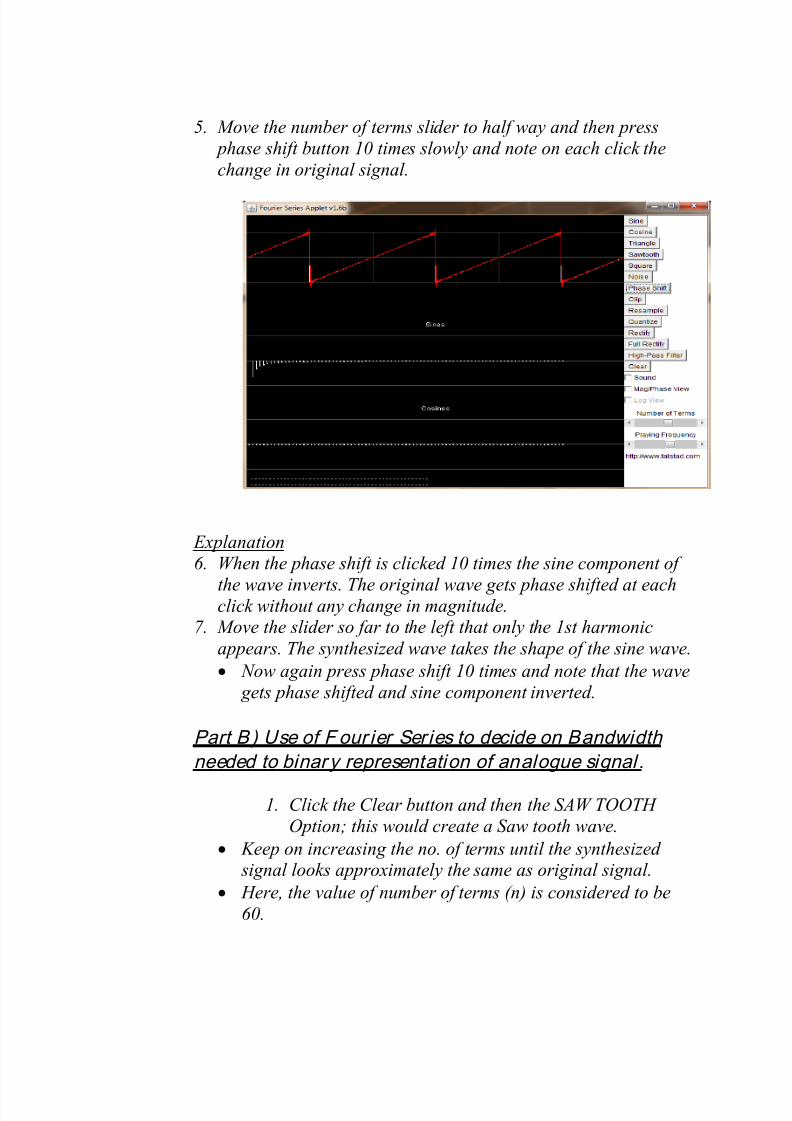
5.
Move the number of terms slider to half way and then press
phase shift button 10 times slowly and note on each click the
change in original signal.
Explanation
6. When the phase shift is clicked 10 times the sine component of
the wave inverts. The original wave gets phase shifted at eachclick without any change in magnitude.
7.
Move the slider so far to the left that only the 1st harmonic
appears. The synthesized wave takes the shape of the sine wave.
Now again press phase shift 10 times and note that the wave
gets phase shifted and sine component inverted.
Part B) Use of F our ier Series to decide on Bandwidth
needed to binary representation of analogue signal .
1. Click the Clear button and then the SAW TOOTH
Option; this would create a Saw tooth wave.
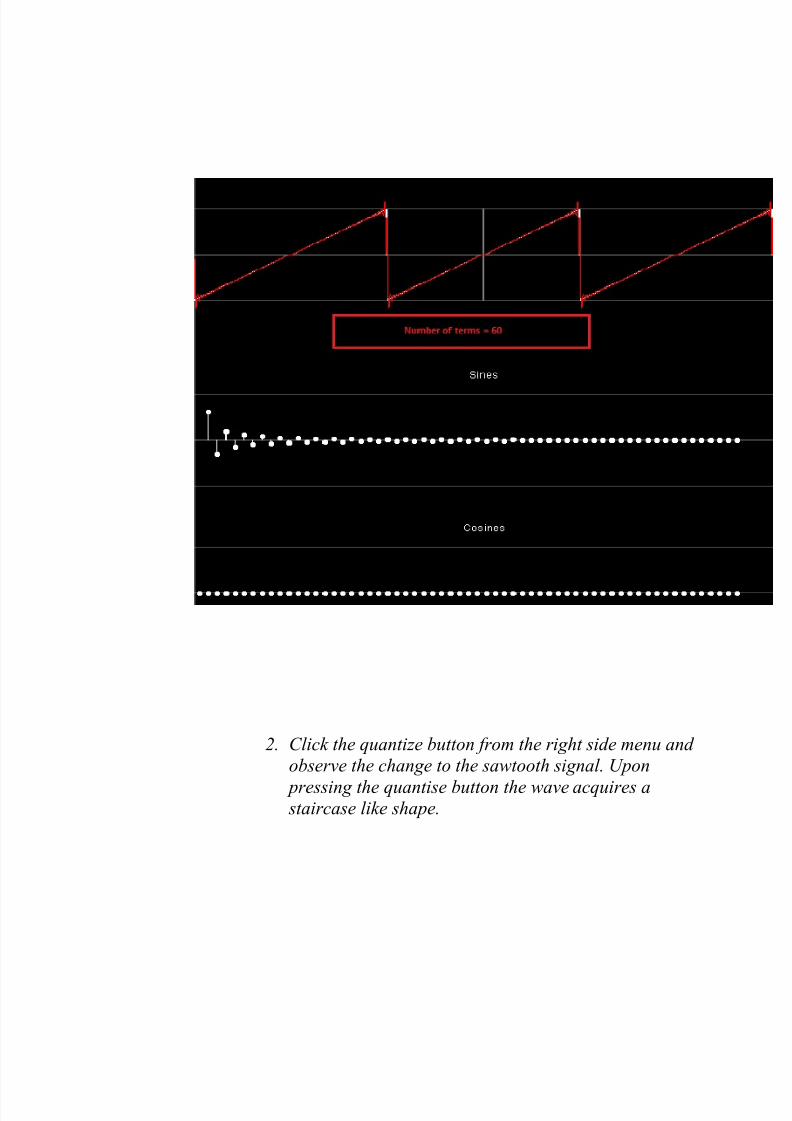
Keep on increasing the no. of terms until the synthesized signal looks approximately the same as original signal.
Here, the value of number of terms (n) is considered to be
60.
8/10/2019 Synthesis of Wave Forms
http://slidepdf.com/reader/full/synthesis-of-wave-forms 28/34
2.
Click the quantize button from the right side menu and
observe the change to the sawtooth signal. Upon
pressing the quantise button the wave acquires a staircase like shape.
8/10/2019 Synthesis of Wave Forms
http://slidepdf.com/reader/full/synthesis-of-wave-forms 29/34
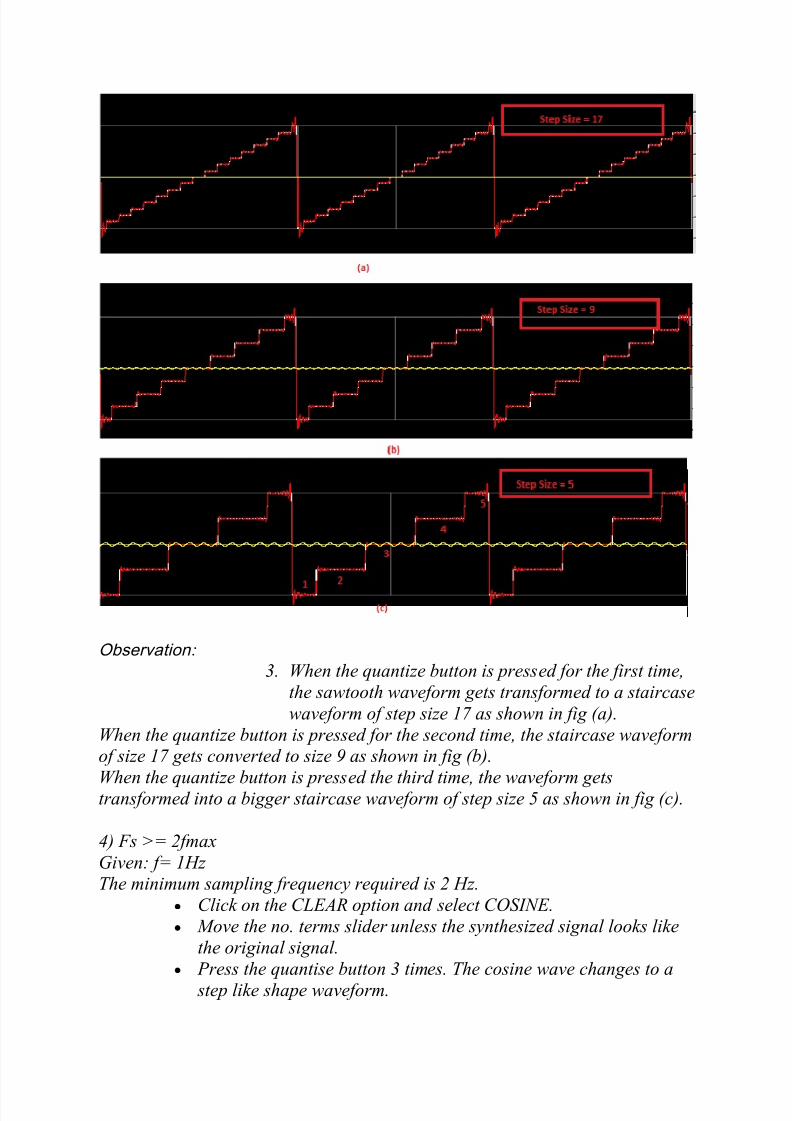
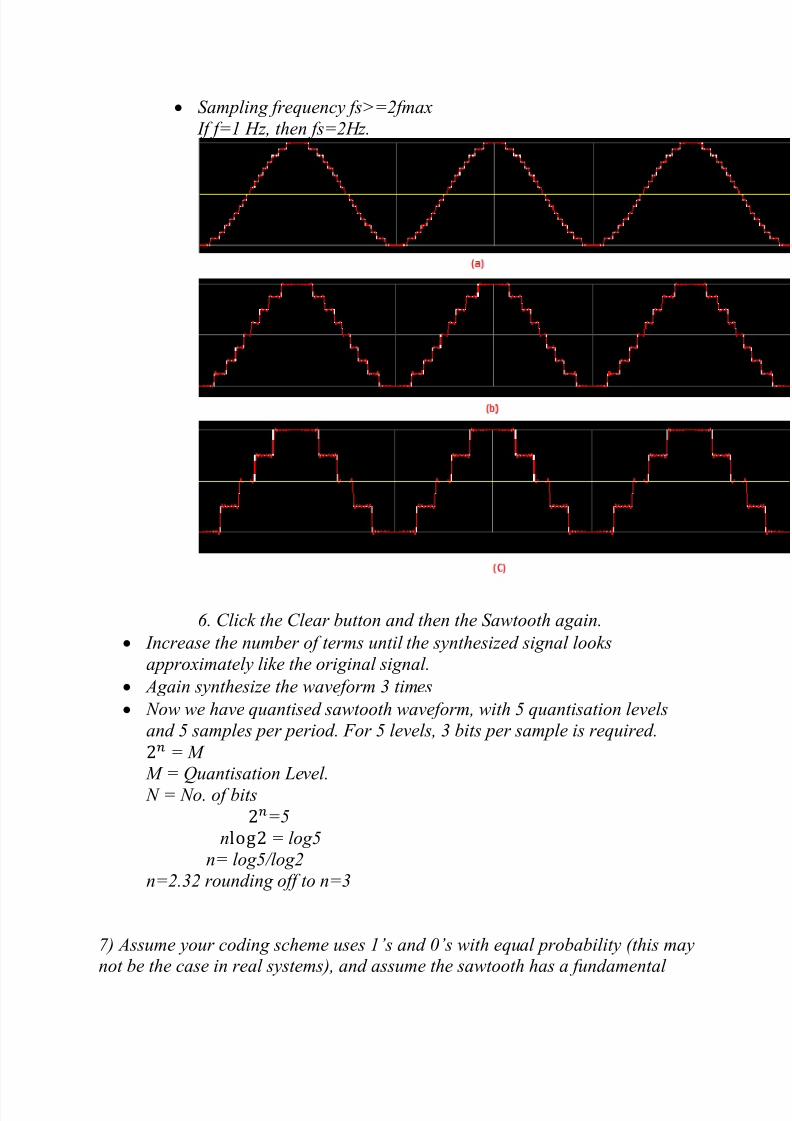
Observation :
3.
When the quantize button is pressed for the first time,
the sawtooth waveform gets transformed to a staircase
waveform of step size 17 as shown in fig (a).
When the quantize button is pressed for the second time, the staircase waveformof size 17 gets converted to size 9 as shown in fig (b).
When the quantize button is pressed the third time, the waveform getstransformed into a bigger staircase waveform of step size 5 as shown in fig (c).
4) Fs >= 2fmax
Given: f= 1HzThe minimum sampling frequency required is 2 Hz.
Click on the CLEAR option and select COSINE.
Move the no. terms slider unless the synthesized signal looks like
the original signal. Press the quantise button 3 times. The cosine wave changes to a
step like shape waveform.
8/10/2019 Synthesis of Wave Forms
http://slidepdf.com/reader/full/synthesis-of-wave-forms 30/34
Sampling frequency fs>=2fmax
If f=1 Hz, then fs=2Hz.
6. Click the Clear button and then the Sawtooth again.
Increase the number of terms until the synthesized signal looks
approximately like the original signal.
Again synthesize the waveform 3 times
Now we have quantised sawtooth waveform, with 5 quantisation levels
and 5 samples per period. For 5 levels, 3 bits per sample is required.
= M M = Quantisation Level.
N = No. of bits
=5
n = log5
n= log5/log2
n=2.32 rounding off to n=3
7) Assume your coding scheme uses 1’s and 0’s with equal probability (this maynot be the case in real systems), and assume the sawtooth has a fundamental
8/10/2019 Synthesis of Wave Forms
http://slidepdf.com/reader/full/synthesis-of-wave-forms 31/34
frequency of f=1Hz. What bit rate B do you need to transmit the bit stream
representing the coded quantised sawtooth?
k=3 bits
F=1 Hz
fs>=2f
fs = 2 Hz
B = fs*k
B=2*3=6 bits/s
8) A fundamental frequency is required and to get that a square wave is needed.
Square wave because of its infinite precision can be used as ideal wave.
9) Considering fs to be the minimum sampling frequency,
fq=fs/2 = 0.5 Hz.
11) Press the clear button. Select sawtooth wave. Press quantize button twice. It
is observed that there are nine quantization levels instead of 5.
12) Design a digital communications system which transmits this quantized
sawtooth as a stream of bits. There are 9 levels, so how many bits k will you
need per sample?
A: Consider k to be the number of binary bits to be transmitted, L as the
quantization level.Given: L = 9
=9
n = log9/log4
Since the value of k is in decimals, round it off to next digit)
n = 4
To transmit a sawtooth wave with 9 quantization levels 4 bits will be required.
It is observed that with the increase in quantization level, the bit rate required
to transmit the signal increase which in turn increases the cost
Part C) Unknown Signals
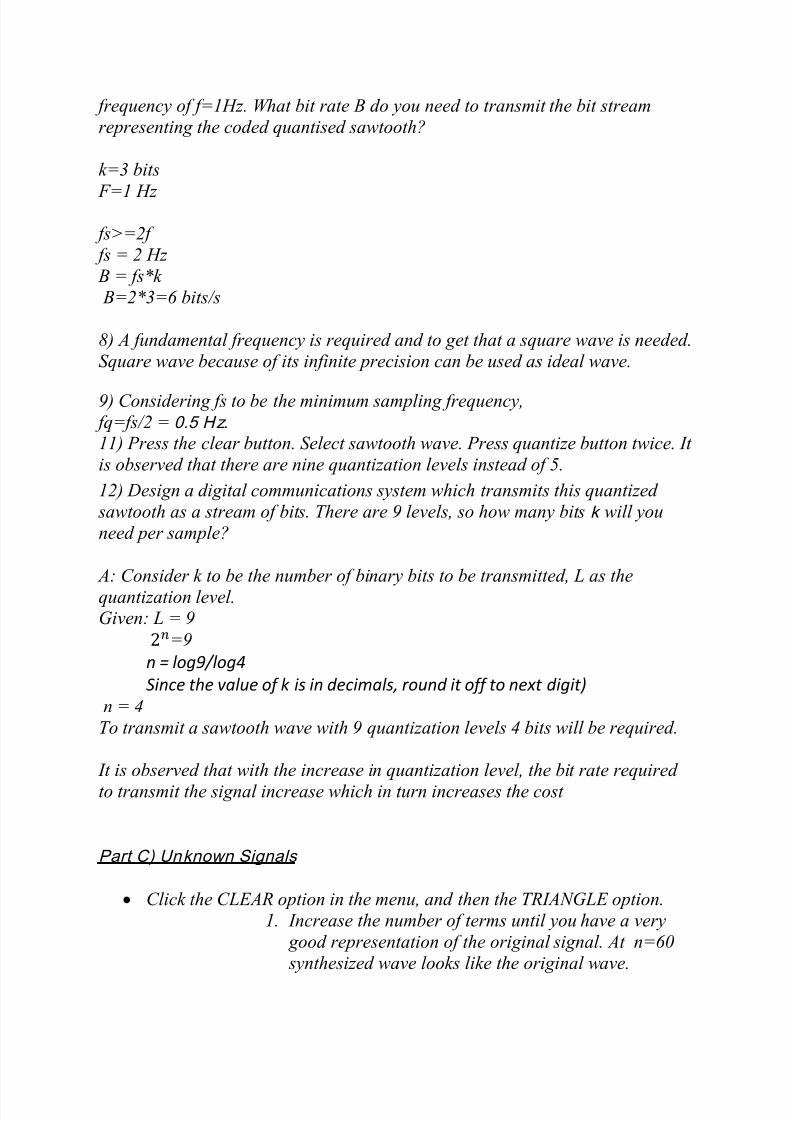
Click the CLEAR option in the menu, and then the TRIANGLE option.
1.
Increase the number of terms until you have a very
good representation of the original signal. At n=60
synthesized wave looks like the original wave.
8/10/2019 Synthesis of Wave Forms
http://slidepdf.com/reader/full/synthesis-of-wave-forms 32/34
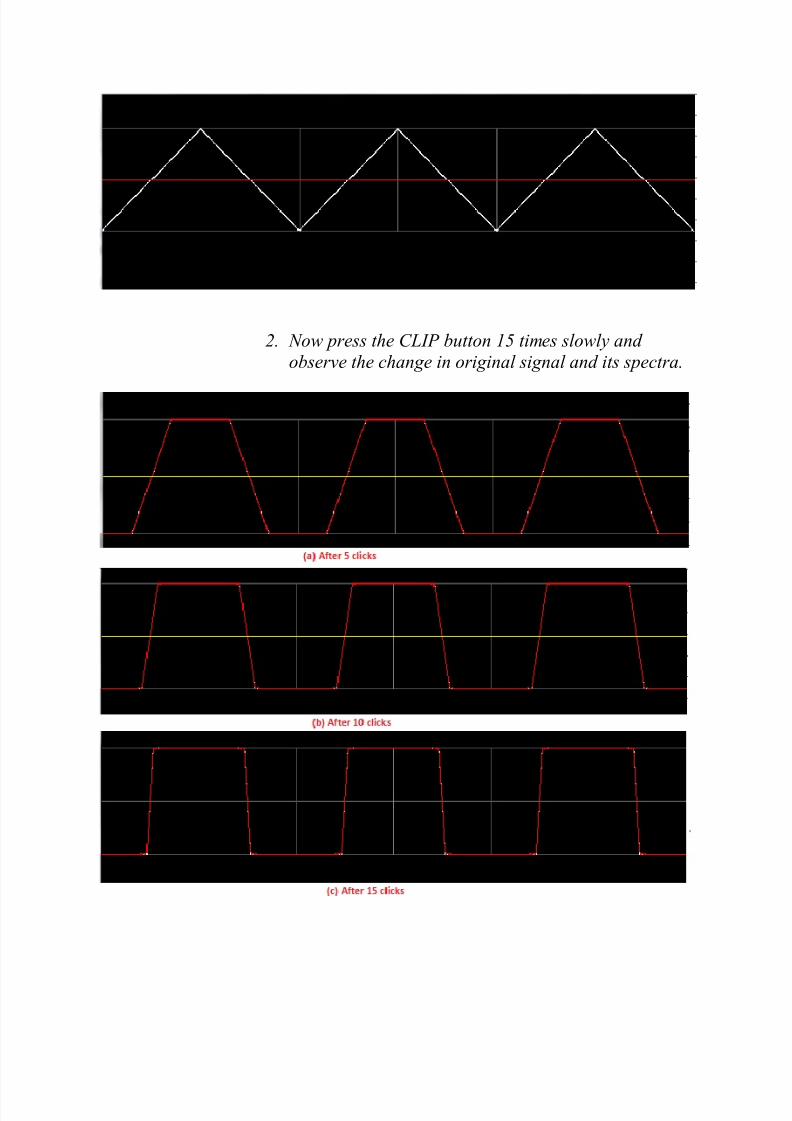
2.
Now press the CLIP button 15 times slowly and
observe the change in original signal and its spectra.
8/10/2019 Synthesis of Wave Forms
http://slidepdf.com/reader/full/synthesis-of-wave-forms 33/34
Note that the edge of the waves starts getting jagged when the
CLIP button is pressed. The amplitude of the waveform increaseswhile the frequency remains constant.
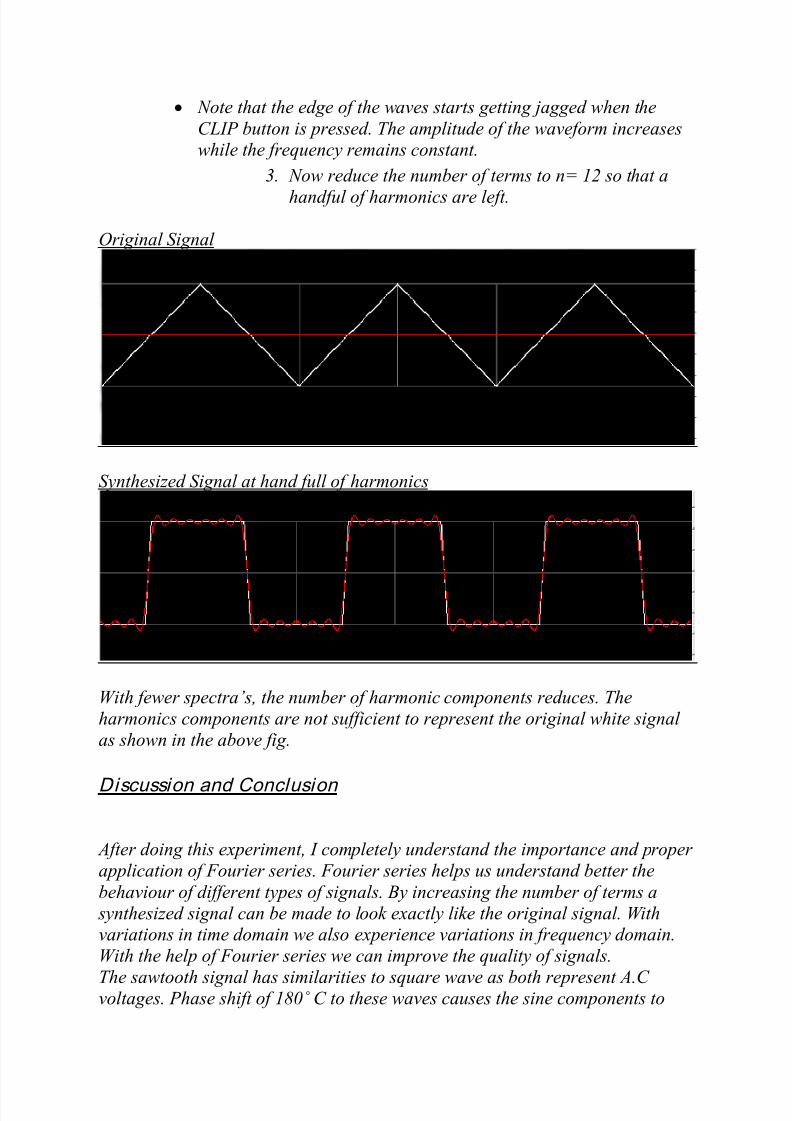
3. Now reduce the number of terms to n= 12 so that a
handful of harmonics are left.
Original Signal
Synthesized Signal at hand full of harmonics
With fewer spectra’s , the number of harmonic components reduces. The
harmonics components are not sufficient to represent the original white signal
as shown in the above fig.
Discussion and Conclusion
After doing this experiment, I completely understand the importance and proper
application of Fourier series. Fourier series helps us understand better the
behaviour of different types of signals. By increasing the number of terms a
synthesized signal can be made to look exactly like the original signal. Withvariations in time domain we also experience variations in frequency domain.
With the help of Fourier series we can improve the quality of signals.
The sawtooth signal has similarities to square wave as both represent A.Cvoltages. Phase shift of 180˚ C to these waves causes the sine components to
8/10/2019 Synthesis of Wave Forms
http://slidepdf.com/reader/full/synthesis-of-wave-forms 34/34
invert or change their polarity to negative. Fourier series also help us to decide
on bandwidth requirement and observe and work on quantized signals and
sample their frequencies.
We also learned that when a triangular wave is clipped, it starts to look more
and more like a square wave as the clipping goes on. FOURIER SERIES helpsengineer’s to calculate the required harmonic, Phase shift, Amplitude of Sine aswell as Cosine and the zero frequency components. It can analyze and process
images, it can efficiently compress images and video streams, and it can assist
in visual pattern recognition, where a complex pattern may be efficiently and
concisely described using a set of Fourier terms.
REFERENCES: Lecture notes by John Schormans, Dept of electronic engineering QMUL
Lab sheet 1 of ELE-374, Dept of electronic engineering QMUL
Signal and Systems by Meade and Dillon
Signals and System by Simon Haykins