synthesis of zeolite-like material from coal fly ash and
TRANSCRIPT

Synthesis of Zeolite-like Material from Coal Fly Ash and Bauxite Residue
Submitted to: The Engineering Honors Committee
244 Hitchcock Hall College of Engineering
The Ohio State University
By:
Natalie Sakian Civil Engineering Undergraduate
The Ohio State University
Under the supervision of:
Dr. John Lenhart Associate Professor
Dept. of Civil, Environmental and Geodetic Engineering
The Ohio State University
DATE

1
Abstract
Zeolites are crystalline aluminosilicate microporous materials which have three-
dimensional frameworks with arrangements of cages and uniform channels. Zeolites are used for
gas adsorption due to their high surface area, uniform pore structure and high void volume,
allowing gas molecules to penetrate, and become entrapped, into their microspores. In this
research, I have used fly ash produced from the combustion of Ohio bituminous coal, with an
industrial byproduct bauxite residue (Red Mud) to synthesize zeolite-like material. This benefits
the environment by giving waste products a functional purpose, reducing waste in Ohio’s
landfills, and if applied, decreasing harmful air emissions. This project’s objective was to utilize
waste products—versus the conventional method’s use of pure reagents, which is energy and
material intensive—to synthesize zeolites. Coal fly ash, composed of significant amounts of
alumina and silica, was the feedstock for synthesis, while Red Mud was the alkalinity source to
extract alumina and silica from the fly ash. The overall procedure involved leaching,
polymerization, crystallization, template removal, and analysis. Analysis included characterizing
the material to determine if it was zeolite-like, and whether it can be used for gas adsorption.
Several batches of material have been produced during this research. As the first three were
found to have low surface areas, modifications were made while synthesizing Batches 4 and 5,
resulting in higher surface areas. As the surface areas were still lower than those produced using
conventional methods, further testing was necessary. The outcome of this research suggested
that the microwave heating time, pH level, and silica-to-alumina mass ratio are crucial
parameters to improving the synthesis process. Based upon results from this study, the
combination of fly ash and red mud has great potential for further research to determine whether
a usable zeolite-like material can efficiently be synthesized.

2
Acknowledgements
Without Dr. John Lenhart’s and Dr. Chin-Min “Jason” Cheng’s support and direction, the
progress made during this research project would not have been nearly as great as the
accomplishments which were achieved. I am very grateful to Dr. Lenhart for sparking my
interests in Environmental Engineering in the first place, and for believing in my ability to
conduct research and my motivation to gain knowledge beyond the classroom. Dr. Lenhart
provided me with guidance and advice throughout my entire senior year with research and
classes as well as the professional world and life after earning my undergraduate degree in Civil
Engineering at The Ohio State University. I am extremely appreciative of Jason Cheng for
teaching me how to use each piece of laboratory equipment needed for synthesis and analysis,
for guiding me through the synthesis steps and educating me about the various chemical
reactions taking place, for providing me with thoughtful suggestions as to how I should continue
this research project individually, and finally, for answering any and all of my questions. In
addition, I would like to thank Matt Noerpel for his assistance in the lab in mixing solutions,
helping me use the FlowSorb to measure the specific surface areas of my samples, and using
Powder X-Ray Diffraction to characterize my samples. The support from Dr. Lenhart, Jason
and Matt was immensely helpful in the success of my research project.

3
Table of Contents:
ABSTRACT………………………………………………………………………………………1
ACKNOWLEDGEMENTS……………………………………………………………………..2
INTRODUCTION…………………………………………………………………………….4- 5
1.1 Objectives……………………………………………………………………….…………….4
1.2 Background………………………………………………………………………………….4-5
MATERIALS AND METHODS…………………………………………………………….6-13
2.1 Overview……………………………………………………………………………………6-7
2.2 Material Composition…………………………………………………………………….…7-8
2.3 Synthesis Process…………………………………………………………………..………8-13
RESULTS AND DISCUSSION…………………………………………………………….14-26
3.1 Specific Surface Area Analysis……………………………...………………………...…14-19
3.2 Characterization…………………………………………..………………………………20-26
CONCLUSIONS……………………………………………………………………………27-30
APPENDIX………………………………………………………………………………….…..31
REFERENCES……………………………………………………………..…………….…32-33

4
Chapter 1: Introduction
1.1 Objectives
The goal of this research project was to further utilize waste products such as coal fly ash
and bauxite residue (red mud) in the synthesis of porous zeolite-like material. This porous
media can then be used as an adsorbent to remove harmful air emissions (namely,
greenhouse and ozone-depletion gases) produced by industrial processes.
1.2 Background
Coal-fired power plants generate electricity, yet also produce many different byproducts,
known as coal combustion products (CCPs), including coal fly ash (Gross-Lorgouilloux,
Caullet, Soulard, Patarin, Moleiro and Saude). The coal fly ash, produced from the
combustion of Ohio bituminous coal, was an ideal feedstock for the synthesis of
aluminosilicate-based, porous zeolite-like material due to the significant amounts of alumina
and silica in its composition. Instead of using pure reagents, an aluminum ore industrial
byproduct known as “red mud” was used as the alkalinity source to extract the alumina and
silica from the fly ash. Although current methods of converting fly ash to zeolites (known as
FA zeolites) are not widely used commercially due to the strict temperature and composition
requirements for synthesis, this study attempted to overcome these drawbacks by using a
biomimetic approach. The addition of a polymer was believed to alter these constraints by
lowering the energy and time needed for FA zeolite synthesis, and allow for control over
pore sizes of the synthesized material.
Zeolites are crystalline silicate and aluminosilicate microporous materials, which have
three-dimensional frameworks with periodic arrangements of cages and uniform channels,
and characteristic properties that allow their use as sorbents, catalysts and molecular sieves

5
for gas separation. Porous zeolite materials can be used for gas adsorption due to their high
specific surface area, uniform pore structure, and high void volume, allowing gas molecules
to penetrate into its micropores and become entrapped. Using waste products such as fly ash
and red mud to synthesize zeolite-like material is beneficial to the environment by reducing
the amount of waste in Ohio’s landfills, providing waste products with a functional purpose,
and lessening the amount of harmful air emissions.

6
Chapter 2: Materials and Methods
2.1 Overview
The overall procedure for synthesis of a zeolite-like material from coal fly ash and red mud is
summarized in the flow chart shown in Figure 2.1.1.
Figure 2.1: Flow Chart of the Overall Process Used to Synthesize Zeolite-like Material from Coal Fly Ash
and Bauxite Residue (Red Mud)

7
From Figure 2.1, it can be seen that the overall synthesis process consists of leaching,
polymerization, crystallization, template removal, and analysis of the final product to determine
if it is, indeed, zeolite-like. This procedure will be expanded on in great detail in Section 2.3.
2.2 Material Composition
The complete chemical composition of the three main ingredients used for the synthesis of
zeolite-like material during this research project (Conesville Fly Ash, Red Mud Solution and Red
Mud Solid) have been organized into Table A.1 which can be found in the Appendix of this
report (Cheng). The red mud used during this project was delivered from ALCOA (Aluminum
Company of America.) As seen in Table A.1, many different elements are present in the
composition of each material, and at varying concentrations. Elements present include:
phosphorus, potassium, calcium, magnesium, sulfur, aluminum, boron, copper, iron, manganese,
molybdenum, sodium, zinc, arsenic, barium, beryllium, cadmium, cobalt, chromium, lithium,
nickel, lead, antimony, selenium, silicon, strontium, thallium, and vanadium. However, the
main elements of interest, and the amount present, are aluminum and silicon (which are
highlighted in blue.) Table 2.2.1 displays the proportions of aluminum and silicon contained in
the composition of fly ash, red mud solution and red mud solid.
Table 2.2.1. Aluminum and Silicon in the Chemical Composition of Fly Ash, Red Mud
Solution, and Red Mud Solid
Chemical Composition of Fly Ash, Red Mud Solution, and Red Mud Solid
Si-to-Al Ratio
Al (ug/ml) Si (ug/ml)
Red Mud Solution
1:1267 2153.2 1.7
Al (ug/g) Si (ug/g)
Red Mud Solid 1:342 62816.7 183.7
Conesville Fly Ash
1:254 27050.1 106.7

8
Upon observation of Table 2.2.1, the average amount of aluminum in the Conesville Fly Ash
is 27,050.1 ug/g and the average amount of silicon is 106.7 ug/g. This has a silicon-to-aluminum
ratio of approximately 1:254. However, it can also be observed that both, Red Mud Solution and
Red Mud Solid, have significantly larger amounts of aluminum than silicon in their
compositions. The Red Mud Solution was found to have 2153.2 ug/ml of aluminum and about
1.7 ug/ml of silicon in its composition, which provides a ratio of approximately 1:1266 silicon-
to-aluminum. The average amount of aluminum in the Red Mud Solid is 62,816.7 ug/g and the
average amount of silicon is 183.7 ug/g, which gives a ratio of approximately 1:342 silicon-to-
aluminum.
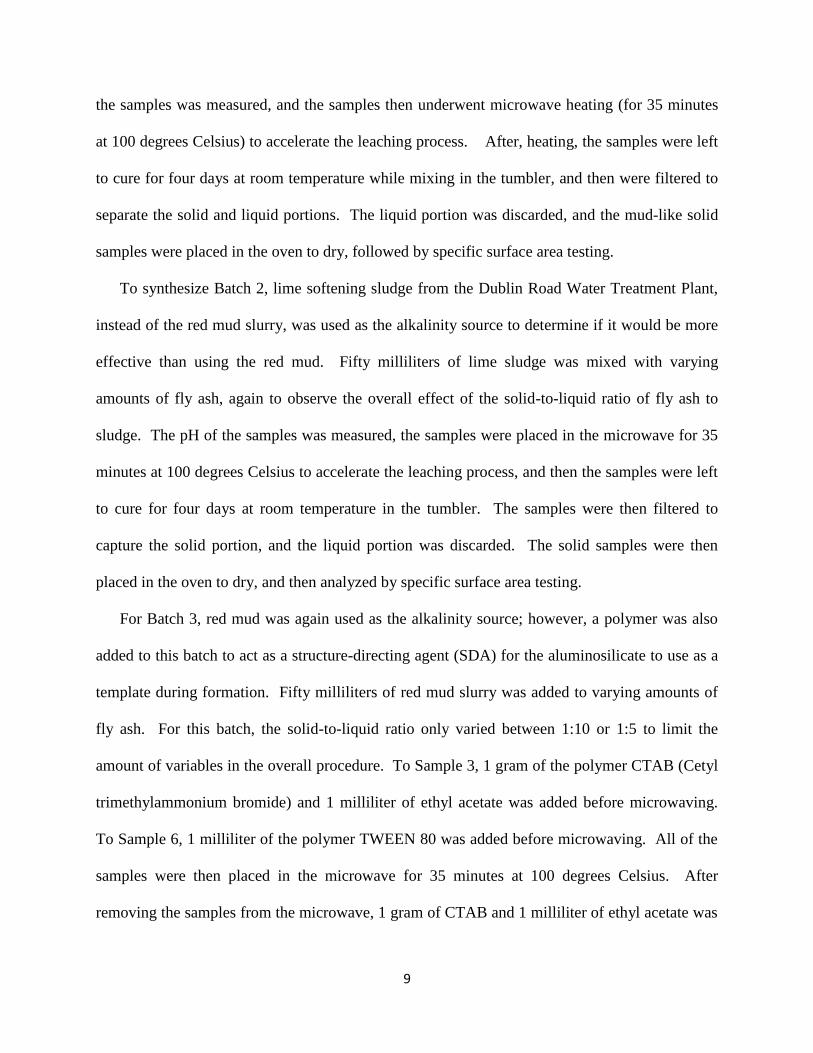
2.3 Experimental Procedure
2.3.1 Fall Semester 2013 Methods
Five different batches of fly ash and red mud material were produced during Fall Semester
2013. Each of the batches were created using the same overall procedure mentioned in Section
2.1 which can be illustrated in Figure 2.1; however, after testing the specific surface areas of the
first three batches and finding poor results, two new synthesis methods were introduced in
Batches 4 and 5 in an attempt to improve the final outcome.
As mentioned previously, the overall synthesis procedure consisted of leaching,
polymerization, crystallization, template removal, and finally, analyzing the final product. For
the first three batches, fly ash was mixed with the liquid portion of red mud to allow for alumina
and silica to leach from the fly ash particles. To synthesize Batch 1, 50 milliliters of liquid red
mud was mixed with varying amounts of fly ash. The purpose of this was to determine whether
the solid-to-liquid ratio of fly ash to red mud played a role in the synthesis process. To extract
alumina and silica from fly ash particles, a high pH level was necessary. Therefore, the pH of
9
the samples was measured, and the samples then underwent microwave heating (for 35 minutes
at 100 degrees Celsius) to accelerate the leaching process. After, heating, the samples were left
to cure for four days at room temperature while mixing in the tumbler, and then were filtered to
separate the solid and liquid portions. The liquid portion was discarded, and the mud-like solid
samples were placed in the oven to dry, followed by specific surface area testing.
To synthesize Batch 2, lime softening sludge from the Dublin Road Water Treatment Plant,
instead of the red mud slurry, was used as the alkalinity source to determine if it would be more
effective than using the red mud. Fifty milliliters of lime sludge was mixed with varying
amounts of fly ash, again to observe the overall effect of the solid-to-liquid ratio of fly ash to
sludge. The pH of the samples was measured, the samples were placed in the microwave for 35
minutes at 100 degrees Celsius to accelerate the leaching process, and then the samples were left
to cure for four days at room temperature in the tumbler. The samples were then filtered to
capture the solid portion, and the liquid portion was discarded. The solid samples were then
placed in the oven to dry, and then analyzed by specific surface area testing.
For Batch 3, red mud was again used as the alkalinity source; however, a polymer was also
added to this batch to act as a structure-directing agent (SDA) for the aluminosilicate to use as a
template during formation. Fifty milliliters of red mud slurry was added to varying amounts of
fly ash. For this batch, the solid-to-liquid ratio only varied between 1:10 or 1:5 to limit the
amount of variables in the overall procedure. To Sample 3, 1 gram of the polymer CTAB (Cetyl
trimethylammonium bromide) and 1 milliliter of ethyl acetate was added before microwaving.
To Sample 6, 1 milliliter of the polymer TWEEN 80 was added before microwaving. All of the
samples were then placed in the microwave for 35 minutes at 100 degrees Celsius. After
removing the samples from the microwave, 1 gram of CTAB and 1 milliliter of ethyl acetate was

10
added to both, Sample 1 and to Sample 4; 1 milliliter of TWEEN 80 was added to both, Sample
2 and Sample 5. The samples were left to cure for four days at room temperature in the tumbler,
and then underwent filtration to capture the solid portions. The solid samples were placed in the
oven to dry, and then underwent surface area testing. Table ?? in Results Section 3.2
summarizes the specific surface area results from Batches 1 through 3.
Based on the results from Batches 1 through 3, Batches 4 and 5 were synthesized a bit
differently. For Batch 4, fly ash was still mixed with liquid red mud and placed in the
microwave to begin and accelerate the leaching of alumina and silica from fly ash. However,
now the samples were filtered and the liquid portion was retained in order to form
aluminosilicate without the interference of fly ash particles. For Batch 5, fly ash was mixed with
the solid, sludge-like red mud to allow for fusion. The fly ash was fused with the red mud sludge
in a muffle furnace at 250 degrees Celsius in attempt to increase the extraction of alumina and
silica from fly ash in the leaching process. The product was then mixed with liquid red mud,
microwave-heated, and filtered (again, retaining the liquid portion.)
CTAB solution was then added to the liquid samples as the polymer source to aid in
crystallization and formation of aluminosilicate. Sulfuric acid was added to control the pH level
of the solution, which caused the polymer to form a specific shape. For instance, with a low pH,
the polymer took a spherical formation; with a neutral pH, a rod-like formation. After recording
the pH levels, the samples were heated at 80 degrees Celsius for four days, which provided
sufficient time for the crystallization of the material as the aluminosilicate used the polymer as a
template. The samples were then freeze-dried to remove the liquid portion, maintaining only the
precipitate which formed during crystallization. The samples then underwent calcination at 550
degrees Celsius for four hours using a muffle furnace to remove the polymer template. The

11
polymer was burned away, leaving only the zeolite-like aluminocilicate material with a void
interior. Results from Batches 4 and 5 are summarized in Table ?? in Results Section 3.2.
2.3.2 Spring Semester 2014 Methods
Based upon results from the batches synthesized during Fall Semester 2013, slight
modifications were made to the synthesis process in attempt to optimize the final zeolite-like
product. The procedure for synthesizing Batch 6 began with mixing 5 grams of fly ash with 75
milliliters of red mud (a combination of the liquid and sludge portions.) The samples were
placed in the microwave at 120 degrees Celsius for a slightly longer amount of time—2.5 hours
versus 2 hours—in attempt to extract more alumina and silica from the fly ash. Immediately
after being removed from the microwave, the samples were filtered, the liquid portion moved
into test tubes and left to react for one week. After one week, 1 gram of CTAB was added to
each of the samples. This varies from the Fall Semester 2013 procedure because here, the
polymer was added in solid form, as opposed to adding a polymer solution to the samples.
The samples were then placed in the Hot Block at 80 degrees Celsius for about 3 hours to
help the solid polymer dissolve. After the polymer dissolved, Samples 1 through 3 each received
3 milliliters of ethyl acetate in order to determine whether it has an effect on the final product.
Based on K.S. Hui and C.Y.H. Chao’s experiment of synthesizing MCM-41 from coal fly ash,
the addition of ethyl acetate promoted much higher specific surface area results than what was
found during this research experiment up to this point (Hui and Chao). A sulfuric acid solution
produced by mixing 25 milliliters of sulfuric acid with 50 milliliters of water was added to the
samples to adjust the pH level. Results from Fall Semester 2013 showed that heating the
samples while curing, versus leaving the samples at room temperature while curing, did not have

12
an effect on the final outcome. Therefore, the samples were left at room temperature for one
week to cure.
A seventh batch was synthesized using sodium hydroxide, instead of red mud, as the
alkalinity source. According to K.S. Hui and C.Y.H. Chao, the ideal mass ratio of silica to
alumina should be about 10:1 (Hui and Chao). It is believed that because the chemical
composition of red mud contains a considerable amount of alumina, this mass ratio of silica to
alumina could be different, and could play a significant role in the synthesis process. Since
sodium hydroxide has been used, and proven to be successful, in previous experiments to
synthesize zeolite-like material from coal fly ash, it was used to create Batch 7. The purpose of
this is to determine how large of an effect the mass ratio of silica to alumina has in the synthesis
process.
Synthesis of Batch 7 began by mixing 5 grams of fly ash with 50 milliliters of a 2
molarity sodium hydroxide (2M NaOH) solution. The samples were then placed in the
microwave for 2.5 hours at 120 degrees Celsius to accelerate the leaching process of alumina and
silica from the fly ash. Directly after taking the samples out of the microwave, they were
filtered, the liquid portions moved to test tubes and left to react for one week.
After Batches 6 and 7 were left to cure for one week, an aluminosilicate precipitate
formed in the test tubes. The aluminosilicate precipitate was captured using a vacuum filtering
process, and the liquid portion of the samples was discarded. The solid aluminosilicate was
placed in the oven at 105 degrees Celsius overnight to dry completely. Once dried, the samples
then underwent calcination—the samples were placed in a Muffle Furnace at 550 degrees
Celsius for four hours to burn away the polymer. After removing the polymer template, only the

13
aluminosilicate product with a void, porous interior remained. The samples were then ready for
surface area testing.

14
Chapter 3: Results and Discussion
3.1 Specific Surface Area Analysis
Table 3.1.1 summarizes the specific surface area results after synthesizing Batches 1 through
3.
Table 3.1.1. Specific Surface Area Results from Batches 1 through 3
Summary of Results Batches 1-3
Sample Number
Fly Ash (g)
Red Mud (mL)
Lime Sludge (mL)
Polymer
Solid-to-
Liquid Ratio
pH Curing Time
Sample Weight
(g)
Surface Area
(m^2)
Specific Surface
Area (m^2/g)
Batch 1
1 1 50 - - 1:50 12.71 4 0.6366 1.62 2.54
2 2 50 - - 1:25 12.82 4 1.2829 3.18 2.48
3 5 50 - - 1:10 12.87 4 1.7978 3.77 2.1
4 10 50 - - 1:5 12.88 4 2.2859 3.74 1.64
5 5 50 - - 1:10 12.93 LOST - - -
6 5 50 - - 1:10 12.95 9 1.2631 2.98 2.36
Batch 2
1 1 - 50 - 1:50 9.61 4 0.8309 2.19 2.64
2 2 - 50 - 1:25 9.79 4 1.6028 4.44 2.77
3 5 - 50 - 1:10 9.74 4 2.5451 6.37 2.5
4 10 - 50 - 1:5 9.65 4 1.85 5.23 2.83
5 5 - 50 - 1:10 9.72 9 2.4593 6.46 2.63
6 5 - 50 - 1:10 9.78 30 1.4436 3.66 2.54
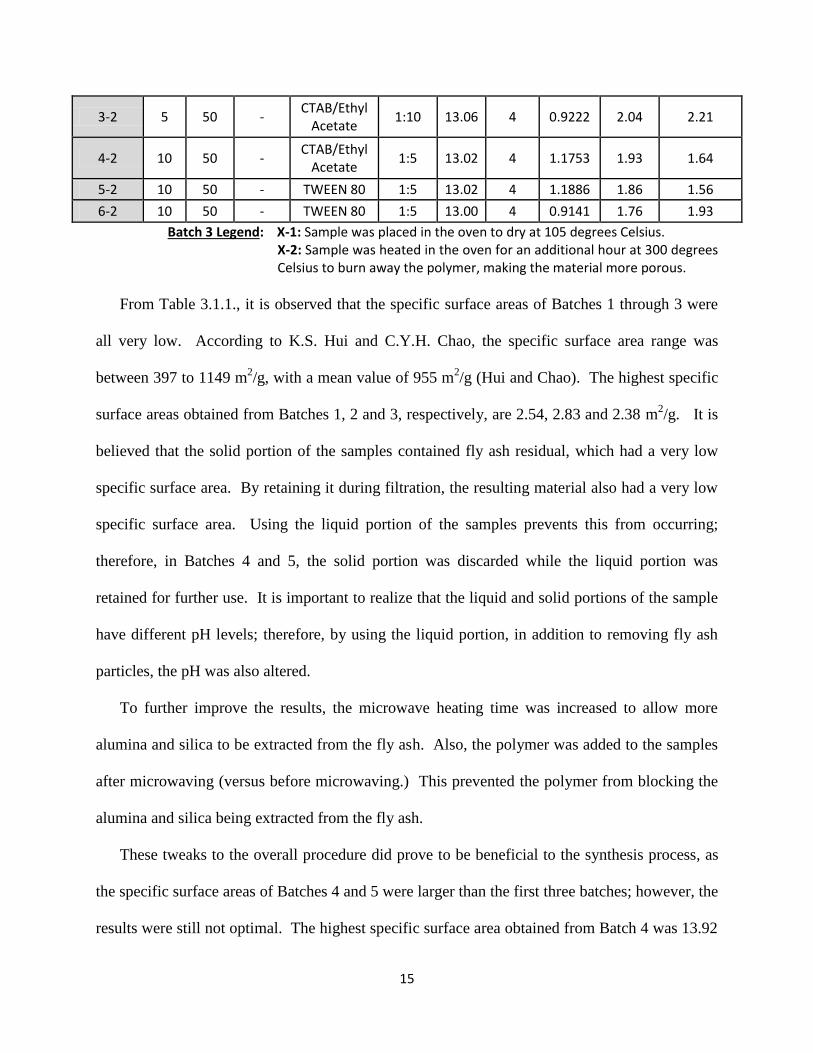
Batch 3
1-1 5 50 - CTAB/Ethyl
Acetate 1:10 12.84 4 0.9253 1.26 1.36
2-1 5 50 - TWEEN 80 1:10 13.00 4 1.6035 - -
3-1 5 50 - CTAB/Ethyl
Acetate 1:10 13.06 4 1.32 - -
4-1 10 50 - CTAB/Ethyl
Acetate 1:5 13.02 4 1.7408 - -
5-1 10 50 - TWEEN 80 1:5 13.02 4 1.6174 - -
6-1 10 50 - TWEEN 80 1:5 13.00 4 1.3467 1.15 0.85
1-2 5 50 - CTAB/Ethyl
Acetate 1:10 12.84 4 0.5009 1.19 2.38
2-2 5 50 - TWEEN 80 1:10 13.00 4 0.7549 - -
15
3-2 5 50 - CTAB/Ethyl
Acetate 1:10 13.06 4 0.9222 2.04 2.21
4-2 10 50 - CTAB/Ethyl
Acetate 1:5 13.02 4 1.1753 1.93 1.64
5-2 10 50 - TWEEN 80 1:5 13.02 4 1.1886 1.86 1.56
6-2 10 50 - TWEEN 80 1:5 13.00 4 0.9141 1.76 1.93
Batch 3 Legend: X-1: Sample was placed in the oven to dry at 105 degrees Celsius. X-2: Sample was heated in the oven for an additional hour at 300 degrees Celsius to burn away the polymer, making the material more porous.
From Table 3.1.1., it is observed that the specific surface areas of Batches 1 through 3 were
all very low. According to K.S. Hui and C.Y.H. Chao, the specific surface area range was
between 397 to 1149 m2/g, with a mean value of 955 m
2/g (Hui and Chao). The highest specific
surface areas obtained from Batches 1, 2 and 3, respectively, are 2.54, 2.83 and 2.38 m2/g. It is
believed that the solid portion of the samples contained fly ash residual, which had a very low
specific surface area. By retaining it during filtration, the resulting material also had a very low
specific surface area. Using the liquid portion of the samples prevents this from occurring;
therefore, in Batches 4 and 5, the solid portion was discarded while the liquid portion was
retained for further use. It is important to realize that the liquid and solid portions of the sample
have different pH levels; therefore, by using the liquid portion, in addition to removing fly ash
particles, the pH was also altered.
To further improve the results, the microwave heating time was increased to allow more
alumina and silica to be extracted from the fly ash. Also, the polymer was added to the samples
after microwaving (versus before microwaving.) This prevented the polymer from blocking the
alumina and silica being extracted from the fly ash.
These tweaks to the overall procedure did prove to be beneficial to the synthesis process, as
the specific surface areas of Batches 4 and 5 were larger than the first three batches; however, the
results were still not optimal. The highest specific surface area obtained from Batch 4 was 13.92

16
m2/g; from Batch 5, 4.31 m
2/g. Table 3.1.2. summarizes the specific surface area results from
Batch 4, while Table 3.1.3. displays results from Batch 5.
Table 3.1.2. Specific Surface Area Results from Batch 4
Summary of Results Batch 4
Sample #
Fly Ash (g)
Red Mud (mL)
1% CTAB
Solution (mL)
CTAB (g)
Sulfuric Acid (mL)
Modified pH
4-Day Curing
Time Temp (deg C)
Weight (g)
Specific Surface
Area (m2/g)
1 5 75 100 1 1 3.06 room 0.5919 4.78
2 5 75 100 1 0.75 6.52 80 0.4797 4.52
3 5 75 100 1 0.75 6.45 room 0.6801 -
4 5 75 100 1 1 3.4 room 0.7109 13.92
4 5 75 100 1 1.5 2.71 room 0.9386 -
4 5 75 100 1 0.75 6.25 room 0.5448 -
4 5 75 100 1 0.75 6.5 room 0.514 -
5 5 75 100 1 1.5 2.28 80 1.3221 -
5 5 75 100 1 0.75 6.12 80 0.5757 -
5 5 75 100 1 0.75 6.4 80 0.4145 -
5 5 75 100 1 1.5 3.15 80 0.7244 4.68
6 5 75 100 1 1.5 3.14 80 0.7222 -
*NOTE: Samples 4 and 5 had pH modified. Originally, did not add any sulfuric acid and no precipitate formed. Had to lower the pH in order to obtain better results. This explains why we have 4 different sample 4s and 4 different sample 5s.
Table 3.1.3. Specific Surface Area Results from Batch 5
Summary of Results Batch 5
Sample #
Fly Ash (g)
Red Mud (g)
FA to
RM Ratio
Furnace Temp
(deg C)
Red Mud (mL)
1% CTAB
Solution (mL)
CTAB (g)
Sulfuric Acid (mL)
Modified pH
4-Day Curing
Time Temp (deg C)
Weight (g)
Specific Surface
Area (m2/g)
1 5 5 1:1 550 75 100 1 0.5 8.2 80 0.4361 3.85
2 5 5 1:1 650 75 100 1 0.5 8.13 80 0.4759 -
3 5 5 1:1 900 75 100 1 1.5 3.45 80 0.4163 -
4 5 10 1:2 550 75 100 1 0.75 7.45 80 0.4777 4.31
5 5 20 1:4 550 75 100 1 0.9 6.23 80 0.6951 -
6 5 30 1:6 550 75 100 1 0.9 6.26 80 0.7259 -
17
From Tables 3.1.2 and 3.1.3, it can be noted that the four-day curing time temperature did not
appear to play a significant role on the final outcome; therefore, this variable was eliminated
while synthesizing new batches. In addition, according to Tables 3.1.1, 3.1.2 and 3.1.3, the
solid-to-liquid ratio of fly ash to red mud (or lime sludge) did not appear to play a significant role
in the overall synthesis process. Therefore, this too was no longer a variable of concern while
synthesizing new batches. It can also be seen that not all samples from Batches 4 and 5 were
tested for specific surface area. Due to the poor results of the samples which were tested, it was
expected that all samples would have about the same specific surface area. Therefore, to save
time, only a few of the samples were chosen to be tested.
To determine which variables to alter in attempt to obtain better results, previous experiments
which successfully produced zeolite-like material were studied, including K.S. Hui and C.Y.H.
Chao’s study on the synthesis of MCM-41 from coal fly ash (Hui and Chao). In this experiment,
ethyl acetate was added to the samples as a mild acid hydrolyser in addition to the polymer and
acid solutions. Their rationale for using ethyl acetate as a mild acid hydrolyser in synthesis is
that it was said to be an important improvement to the industrial scale production of M41S
materials. This experiment also used sodium hydroxide as the alkalinity source (instead of red
mud) and discussed the importance of having a silica-to-alumina mass ratio of 10:1 (ten times
more silica than alumina, on a mass basis) in the synthesis process. Red mud has a significant
amount of alumina in its composition, which could alter the 10:1 silica-to-alumina mass ratio.
This could explain why the results obtained in this experiment have not been as successful as
other experiments.
Batch 6 was synthesized using coal fly ash and red mud, while Batch 7 was produced with
coal fly ash and sodium hydroxide, all other variables held constant. The purpose of this was to

18
determine how large a role the 10:1 silica-to-alumina mass ratio plays in the synthesis process,
and whether it is feasible to use red mud as the alkalinity source. In each batch, half of the
samples (Samples 1 through 3) included the addition of ethyl acetate to determine its
significance. Table 3.1.4 summarizes the specific surface area results from Batches 6 and 7.
Table 3.1.4. Specific Surface Area Results from Batches 6 and 7
Batches 6 and 7 Specific Surface Area Results
Sample #
Fly Ash (g)
Red Mud (mL)
NaOH Solution
(mL)
CTAB (g)
Ethyl Acetate
(mL)
Modified pH
Sample Weight
(g)
Average Surface
Area (m2)
Specific Surface
Area (m2/g)
Batch 6
1 5 75 - 1 3 6.95 0.2431 23.31 95.89
2 5 75 - 1 3 5.36 0.1372 12.62 91.96
3 5 75 - 1 3 6.99 0.3047 18.02 59.12
4 5 75 - 1 0 6.19 0.2133 15.89 74.50
5 5 75 - 1 0 3.75 0.0908 1.86 20.52
6 5 75 - 1 0 7.03 0.1957 25.56 130.58
Batch 7
1 5 - 50 1 3 5.62 0.0307 4.56 148.37
2 5 - 50 1 3 6.41 0.0154 14.13 917.21
3 5 - 50 1 3 5.53 0.0197 24.28 1232.49
4 5 - 50 1 0 4.11 0.0286 18.54 648.15
5 5 - 50 1 0 6.72 0.0344 26.14 759.88
6 5 - 50 1 0 6.96 0.0248 24.54 989.52
From Table 3.1.4, it can be seen that the specific surface areas are much higher than what
has been achieved in Batches 1 through 5. The results suggest that while pH does play a minor
role in specific surface area strength, the mass ratio of silica-to-alumina appears to be a
significant factor. Table 3.1.4 also shows that the addition of ethyl acetate does not affect the
specific surface area results. From Batch 6, Sample 6 exhibited the highest specific surface area
of 130.58 m2/g; however, ethyl acetate was not added to this sample. Sample 3 of Batch 6 had a
specific surface area of 59.12 m2/g, which is significantly lower; however, ethyl acetate was

19
added to this sample. The addition of ethyl acetate does not seem to increase nor decrease the
specific surface area of the material; however, due to the varying pH levels of the samples in
Batches 6 and 7, the significance of ethyl acetate is truly unknown. To determine its effect, the
pH levels would have to be the same.
The results in Table 3.1.4 does suggest that the 10:1 mass ratio of silica-to-alumina plays a
major role in the synthesis process. Specific surface area results from Batch 7, which utilized
sodium hydroxide as the alkalinity source, were much higher than results from Batch 6, in which
red mud was used. From Batch 7, Sample 3 exhibited the highest specific surface area, which
was measured at 1232.49 m2/g.
Sample 1 from Batch 7 was found to have the lowest specific surface area of the batch, which
was measured at 148.37 m2/g. This is still higher than the highest specific surface area measured
from Batch 6 (which was 130.58 m2/g, as mentioned previously.) However, the large range of
specific surface area results in Batch 7 suggests that an error could exist. Sample 1 could have
been an outlier, as its specific surface area was significantly lower than the other samples in
Batch 7. In addition, Sample 1 was discolored—it contained a black tint—while all other
samples were white.
With the exception of using red mud versus sodium hydroxide as the alkalinity source, all
other variables were held constant while synthesizing Batches 6 and 7. As Batch 7 resulted in
noticeably higher specific surface areas, it can be concluded that the 10:1 mass ratio of silica-to-
alumina is a paramount factor in the synthesis of this zeolite-like material.

20
3.2 Characterization
3.2.1 Characterization Using an Inductively Coupled Plasma – Atomic Emission Spectrometer
To determine the mass ratio of silica-to-alumina present in the fly ash and red mud
solution after microwaving, a small portion of one of the samples from Batch 6 was
characterized using an Inductively Coupled Plasma – Atomic Emission Spectrometer (ICP-
AES.) The chemical composition of the fly ash and red mud solution is summarized in Table
3.2.1.1 (Noerpel).
Table 3.2.1.1. Composition of Fly Ash and Red Mud Solution Directly After
Microwaving
Composition of Fly Ash and Red Mud Solution After Microwaving (ppm)
1 2 3 4 5 6 Dilution Mean
Al 5,250.0 5,740.0 5,210.0 4,540.0 5,440.0 6,700.0 1000 5,480.0
Ba ND ND ND ND ND ND
As* 18.0 21.8 20.9 17.2 21.8 19.6 100 19.9
Ca ND ND ND ND ND ND
Fe ND ND ND ND ND ND
K 551.0 647.0 484.0 480.0 698.0 596.0 100 576.0
Mg ND ND ND ND ND ND
Mn ND ND ND ND ND ND
Na 11,300.0 11,700.0 12,300.0 10,400.0 9,700.0 12,300.0 1000 11,283.3
P 4.3 5.0 6.3 4.5 3.8 6.6 100 5.1
Pb* 1.5 1.3 1.7 1.0 1.4 0.9 100 1.3
S 3,160.0 3,410.0 3,260.0 2,640.0 2,840.0 3,440.0 1000 3,125.0
Se* 3.8 4.5 4.8 3.5 3.9 4.0 100 4.1
Ag ND ND ND ND ND ND
Si 54.8 55.2 51.9 40.6 51.9 53.0 100 51.2
* Below the range of the calibration curve
ND = Not Detected
As seen in Table 3.2.1.1, Barium, Calcium, Iron, Magnesium, Manganese, and Silver
were not detected in the material. Arsenic, Lead, and Selenium are marked as below the
detection limit, which means that the value fell below the lowest value used in the calibration
curve. It can also be seen that the equipment was run at two dilutions (100x and 1,000x) due to

21
the extensive amounts of Sodium, Aluminum and Sulfur. From Table 3.2.1.1, the average
amount of Aluminum in the fly ash and red mud solution is 5,480.0 parts per million, and the
average amount of Silicon is 51.2 parts per million. This corresponds to a silica-to-alumina ratio
of 1:107, which is extremely different from the silica-to-alumina ratio of 10:1 when using
sodium hydroxide. When sodium hydroxide is used as the alkalinity source, much more silica is
present. This suggests that the silica-to-alumina ratio is a paramount factor in the synthesis of
zeolite-like material.
3.2.2 Characterization Using Powder X-Ray Diffraction
To identify and characterize the material synthesized in order to determine whether it is
zeolite-like, Powder X-Ray Diffraction (XRD) was completed using the Rigaku MiniFlex 600.
Figure 3.2.2.1 shows the Rigaku MiniFlex 600.
Figure 3.2.2.1. Rigaku MiniFlex 600 for Powder XRD
XRD operates based on Bragg’s Law: , where is an integer, is the wavelength
of incident wave, is the distance between planes in the atomic lattice, and is the Bragg angle,
the angle between incident ray and the scattering planes. The equipment functions by rotating
Detector
Sample
X-Ray Source

22
the sample by and the detector by while the source remains constant. The Rigaku MiniFlex
600 uses the radiation Cu K-alpha, which has a wavelength of 0.15418 nm. By measuring the
intensity of scattered waves as a function of scattering angle, the diffraction pattern is obtained
which captures the existing constructive and destructive interferences. Constructive interference
corresponds to waves that are in phase; destructive interference, waves that are out of phase
(Fenter). When very strong intensities are observed in the diffraction pattern, this indicates that
the Bragg condition is satisfied, and constructive interference exists. Each crystalline solid has
its own distinctive diffraction pattern. The distance between planes in the atomic lattice, , is
characteristic for a given crystal and is based on the structure and various atoms present. This,
along with the relative intensity of the peaks given on the XRD plot, provides phase
identification which can be compared to other data to identify and characterize the material.
Five samples were analyzed using Powder XRD, including two samples from Batch 6
and three samples from Batch 7. Samples 1 and 4 from Batch 6 were tested to compare the
crystallography of the synthesized material using fly ash and red mud, with and without the
addition of ethyl acetate. Samples 2 and 5 from Batch 7 were tested to compare the
crystallography of the synthesized material using fly ash and sodium hydroxide, with and
without the addition of ethyl acetate. Sample 3 from Batch 7 was also tested because it had the
highest measured specific surface area; therefore, it was believed to contain some type of zeolite-
like material. These five samples are denoted by “Zeolites 1-5” in Figures 3.2.2.2—3.2.2.6,
although they may or may not actually contain zeolites.

23
Figure 3.2.2.2. XRD Plot of Zeolite 1: Fly Ash and Red Mud with the Addition of Ethyl Acetate
(Batch 6 Sample 1)
Figure 3.2.2.3. XRD Plot of Zeolite 2: Fly Ash and NaOH with the Addition of Ethyl Acetate
(Batch 7 Sample 2)
NOTE: This represents the sample with the highest measured specific surface area.
0
500
1000
1500
2000
0 10 20 30 40 50 60 70
Inte
nsi
ty
2θ
XRD Spectra for "Zeolite" 1 (Fly Ash & Red Mud with Ethyl Acetate)
0
1000
2000
3000
4000
5000
0 10 20 30 40 50 60 70
Inte
nsi
ty
2θ
XRD Spectra for "Zeolite" 2 (Fly Ash & NaOH with Ethyl Acetate)

24
Figure 3.2.2.4. XRD Plot of Zeolite 3: Fly Ash and NaOH with the Addition of Ethyl Acetate
(Batch 7 Sample 3)
Figure 3.2.2.5. XRD Plot of Zeolite 4: Fly Ash and Red Mud without the Addition of Ethyl
Acetate (Batch 6 Sample 4)
0
1000
2000
3000
4000
5000
6000
0 10 20 30 40 50 60 70
Inte
nsi
ty
2θ
XRD Spectra for "Zeolite" 3 (Fly Ash & NaOH with Ethyl Acetate)
0
1000
2000
3000
4000
5000
0 10 20 30 40 50 60 70
Inte
nsi
ty
2θ
XRD Spectra for "Zeolite" 4 (Fly Ash & Red Mud without Ethyl Acetate)

25
Figure 3.2.2.6. XRD Plot of Zeolite 5: Fly Ash and NaOH without the Addition of Ethyl Acetate
(Batch 7 Sample 5)
By observing Figures 3.2.2.2 and 3.2.2.5, it can be seen that the diffraction pattern of the
material synthesized from fly ash and red mud does not change with or without the addition of
ethyl acetate. Figures 3.2.2.3, 3.2.2.4 and 3.2.2.6 show that this is also true for the material
synthesized from fly ash and sodium hydroxide. This indicates that ethyl acetate does not effect
the crystallography of the synthesized material. From Figure 3.2.2.2 and 3.2.2.5, the broad peaks
in the background of the XRD plots indicate that “Zeolites” 1 and 4 each contain a non-
crystalline, amorphous stage, which is consistent with their specific surface area measurements
(95.89 and 74.50 m2/g, respectively.) This implies that “Zeolites” 1 and 4 may not actually be
zeolite-like.
However, the sharp, intense peak exhibited in Figures 3.2.2.3, 3.2.2.4 and 3.2.2.6
indicates the presence of some type of zeolite in the samples synthesized from fly ash and
sodium hydroxide, which is also consistent with their specific surface area measurements
0
1000
2000
3000
4000
5000
6000
7000
0 10 20 30 40 50 60 70
Inte
nsi
ty
2θ
XRD Spectra for "Zeolite" 5 (Fly Ash & NaOH without Ethyl Acetate)

26
(917.21, 1232.50 and 759.88 m2/g, respectively.) Figure 3.2.2.7 shows the XRD plot of an
MCM-41 zeolite material (Corma).
Figure 3.2.2.7. XRD Plot of MCM-41 Zeolite
By comparing the XRD plots of the Batch 7 samples in Figures 3.2.2.3, 3.2.2.4 and 3.2.2.6 with
the XRD plot in Figure 3.2.2.7, which represents a zeolite material, it can be observed that the
diffraction patterns behave similarly. This further suggests that some type of zeolite material
may exist in the fly ash and NaOH samples.

27
Chapter 4: Conclusions
Based on results from the seven different batches of zeolite-like material which were
created during this research project, several conclusions can be made to optimize the synthesis
process. After analyzing results from Batches 1 through 3, it was determined that the specific
surface area values were low due to the presence of the fly ash residual, which was believed to
have blocked the alumina and silica from properly forming an aluminosilicate, porous zeolite-
like material. When the fly ash alone was analyzed for its specific surface area, it was measured
at 1.56 m2/g, which is extremely low. By not removing the fly ash particles from the samples
after microwaving, the resulting material, too, had a very low specific surface area. Therefore,
instead of using the solid portion of the samples after microwaving and filtration, the liquid
portion was collected, which resulted in the crystallization of an aluminosilicate material with
higher a specific surface area. Due to the improved results, it can be concluded that the liquid
portion of the samples is more supportive of zeolite-like material growth.
Another conclusion made during this research project is that pH level plays an important
role in the synthesis process. When synthesizing Batch 4, sulfuric acid was added to the samples
to control pH levels from acidic to basic. Originally, no sulfuric acid solution was added to
Samples 4 and 5, which had initial pH levels of 10.89 and 11.25, respectively. After curing for
four days, no aluminosilicate precipitate formed; therefore, sulfuric acid was introduced to each
of these samples, and a precipitate then formed after four days of curing. This suggests that very
high, basic pH levels do not support zeolite-like material growth. Due to this conclusion,
samples in future batches had controlled pH levels from acidic to neutral. However, results from
synthesizing Batches 6 and 7 show that, although there does not appear to be a direct correlation
between pH and specific surface area, it can be observed that, generally, a neutral pH level

28
promotes a higher specific surface area than an acidic pH level. Young-HoonYeom, Sang-Sung
Nam, Seong-Bo Kim, and Kyu-Wan Lee’s study on The pH Effect on the Preparation of MFI
Type Ferrisilicate Zeolites suggests that alumina-rich zeolites crystallize preferably at a higher
mean pH; silica-rich zeolites, at a lower mean pH (Yeom, Nam, Kim and Lee). Therefore, it is
necessary to characterize the material to determine whether it contains more alumina or silica. In
this experiment, the fly ash and red mud used for synthesis both contain significant amounts of
alumina, suggesting for the production of an alumina-rich zeolite-like material, which
crystallizes preferably at a higher mean pH, according to Yeom, Nam, Kim and Lee (Yeom,
Nam, Kim and Lee). Therefore, in the synthesis of new batches, one should consider using a
neutral pH or slightly higher (about 7 or 8) during crystallization.
Results from synthesizing Batches 6 and 7 suggest that increasing the microwave heating
time to 2.5 hours corresponded to a higher specific surface area. However, the ideal microwave
heating time is still unknown. Results from Batches 6 and 7 also show that, although there is no
noticeable difference between samples containing or not containing ethyl acetate, the effect of
using ethyl acetate as a mild acid hydrolyser is unknown due to the varying pH levels amongst
samples.
According to K.S. Hui and C.Y.H. Chao, the mass ratio of silica-to-alumina plays an
important role in the synthesis of zeolite-like material (Hui and Chao). In their experiment,
using sodium hydroxide (instead of red mud) as the alkalinity source produced a silica-to-
alumina mass ratio of 10:1. This experiment attempts to utilize red mud as the alkalinity source,
which contains a significant amount of alumina in its composition. Using red mud as the
alkalinity source alters the 10:1 silica-to-alumina mass ratio, which could help explain why

29
specific surface area results for zeolite-like material synthesized in this experiment have been so
low.
Specific surface area values for Batch 7, which used sodium hydroxide as the alkalinity
source, were much higher than those measured for Batch 6, indicating that the silica-to-alumina
mass ratio, indeed, plays a significant role in the synthesis process of zeolite-like material. To
improve this experiment while still using red mud as the alkalinity source to extract alumina and
silica from the fly ash, the ratio of silica-to-alumina should be altered. In synthesizing a new
batch, one should consider adding a material containing a significant proportion of silica before
microwaving the samples. For example, Jong-Sung Yu proposed a method for recycling silica
waste produced from a silica etching process which involved the potential preparation of
microporous zeolite materials (Yu). If this recycling method could be applied to this research
project, it would not only potentially improve the synthesis process by adding a silica source, it
would also follow the “green” approach by helping to save valuable chemicals and reducing
chemical waste. However, one should be aware that the addition of recycled silica may alter the
synthesis process or the material produced. Therefore, analysis using X-Ray Diffraction (XRD)
should be done to determine the material’s composition, which will conclude whether the
material is zeolite-like. Also, Scanning Electron Microscopy (SEM) analysis should be done to
observe the structure of the synthesized material.
According to Georgiev, Bogdanov, Angelova, Markovska and Hristov, however, the type
and yield of synthesized zeolite depends primarily on the alkaline condition, and the SiO2/Al2O3
ratio of the starting fly ash. Therefore, the SiO2/Al2O3 ratio in the Conesville fly ash used in this
research project should be analyzed and compared with the ratio of SiO2/Al2O3 in other types of
fly ash which have successfully been utilized to synthesize FA zeolites. If the ratio in the

30
Conesville fly ash is inconsistent with other data, it may not be able to successfully transform
into a specific zeolite material (Georgiev, Bogdanov, Angelova, Markovska and Hristov).
Although current methods to synthesize zeolites have produced higher specific surface
areas, and therefore, better overall results, this experiment attempts to utilize materials which are
considered waste products (instead of pure reagents) to synthesize zeolite-like material. By
finding a way to transform waste products into functioning material, this study promotes a
“green” environment. This study also encourages a healthier environment by creating a
substance which can be used to reduce harmful air emissions, such as greenhouse and ozone-
depletion gases. In addition, this study stimulates economic benefits by reducing the costs of fly
ash disposal and gas emissions reduction. Results obtained from this study suggests that the
utilization of fly ash and red mud has great potential for further research to determine whether a
usable zeolite-like material can synthesized and, if applied, used by industry to reduce harmful
gas emissions.

31
Appendix
See attached Excel spreadsheet entitled A.1.

32
References
Cheng, Chin-Min. "Chemical Composition of Bauxite Residue and Coal Fly Ash." Message to
Natalie R. Sakian. 29 JAN 2014. E-mail.
Corma, A., M.S. Grande, V. Gonzalez-Alfaro, and A.V. Orchilles. "Cracking Activity and
Hydrothermal Stability of MCM-41 and Its Comparison with Amorphous Silica-Alumina
and a USY Zeolite."Journals of Catalysts. 1996.
Fenter, Paul A. "X-ray Reflectivity as a Probe of Mineral-Fluid Interfaces: A User Guide."
Argonne:
Georgiev, Dimitar, Bogdan Bogdanov, Krasimira Angelova, Irena Markovska, and Yancho
Hristov. "Synthetic Zeolites - Structure, Classification, Current Trends in Zeolite
Synthesis Review." Technical Studies. VII. 2009.
Gross-Lorgouilloux, Marion, Philippe Caullet, Michel Soulard, Joel Patarin, Edgar Moleiro, and
Isabelle Saude. "Conversion of Coal Fly Ashes into Faujasite Under Soft Temperature
and Pressure Conditions: Mechanisms of Crystallisation." Microporous and Mesoporous
Materials. 2010. <www.elsevier.com/locate/micromeso>.
Hui, K.S., and C.Y.H. Chao. "Synthesis of MCM-41 from coal fly ash by a green approach:
Influence of synthesis pH." Journal of Hazardous Materials B137. (2006): 1135-1148.
Print. www.elsevier.com/locate/jhazmat
Noerpel, Matt. "XRD and Characterization." Message to Natalie R. Sakian. 12 MAR 2014. E-
mail.
Noerpel, Matt. "XRD Results." Message to Natalie R. Sakian. 17 MAR 2014. E-mail.

33
Yeom, Young-Hoon, Sang-Sung Nam, Seong-Bo Kim, and Kyu-Wan Lee. "The pH Effect on
the Preparation of MFI Type Ferrisilicate Zeolites." Preparation of MFI Type
Ferrisilicate. 20, No. 7. Taejon 305-600, Korea: 1999.
Yu, Jong-Sung. "Method for recycling of silica waste and method for preparing nanoporous or
spherical materials." 2011. <http://www.google.com/patents/US20110315660>.