synthesis, physical characterisation and solution chemistry of
TRANSCRIPT
Synthesis, Physical
Characterisation and Solution Chemistry of
N-Acetyl-Cobalt(III)-Microperoxidase 8
-Desigan Sannasy-
A dissertation submitted to the Faculty of Science, University of the Witwatersrand,
Johannesburg, in fulfilment of the requirements for the degree of Master of Science.
March 2006

2
Declaration
I declare that this is my own unaided work. It is being submitted for the Degree of
Master of Science at the University of the Witwatersrand, Johannesburg. It has not been
submitted before for any degree or examination at any other university.
D. Sannasy March 2006
3
Abstract This dissertation describes the synthesis, physical characterisation and solution chemistry
of NAc-CoIIIMP8, a biomimetic model compound of vitamin B12a, synthesised from the
haemoctapeptide derived from horse heart cytochrome c. Peptic and tryptic digestion of
horse heart cytochrome c removes much of the globular protein encapsulating the iron
porphyrin prosthetic group. The resulting haemoctapeptide fragment retains residues 14
to 21 of the parent cytochrome (MP8) via thioether linkages to Cys-14 and Cys-17.
Reductive demetalation of MP8 yielded the metal free MP8. This was treated with
cobaltous acetate in an aerated aqueous solution to produce CoIIIMP8. CoIIIMP8 was
acetylated by treatment with acetic anhydride and yielded N-acetyl-Co(III)-
microperoxidase 8 (NAc-CoIIIMP8). It is well established that acetylation reduces
aggregation of these haempeptides. The starting materials and products of each step
during synthesis were characterised by UV-visible absorption spectroscopy, high
performance liquid chromatography (HPLC) and fast atom bombardment-mass
spectroscopy (FAB-MS). MP8 free base and Co(III)-MP8 were also analysed using
luminescence spectroscopy.
The molar extinction coefficients of NAcCoIII-MP8 in aqueous and ionic medium were
determined using inductively coupled plasma-optical emission spectroscopy (ICP-OES)
and UV-visible absorption spectroscopy. The extinction coefficient, e, of NAcCoIIIMP8
(? = 420 nm, pH 7.00, 25 ºC) in distilled water and 1.0 M NaClO 4 was 1.80 + 0.01 x 10⁵
M-1 cm-1 and 1.66 + 0.01 x 10⁵ M-1 cm-1, respectively. Beer’s law studies show that
NAc-CoIIIMP8 remains monomeric in aqueous solution up to concentrations of at least 35
µM.
The spectroscopic changes observed for NAc-CoIIIMP8 during the course of a
spectrophotometric titration are very similar to those observed for NAc-FeIIIMP8, with
both being consistent with six successive ionisations. By analogy with NAc-FeIIIMP8,
we attributed the first (pK1 = 2.0 + 0.3) to the coordination of the c-terminal carboxylate
group (Glu-21) of the appended polypeptide. The second acid range transition (pK2 = 2.8
4
+ 0.1) for NAcCoIIIMP8 involved the deprotonation of the cationic His-18 and
concomitant replacement of the c-terminal carboxylate by the neutral heterocyclic base.
The third and fourth pKa’s are attributed to the ionisation of the haem propanoic acid
groups (pK3 = 3.9 + 0.03) and (pK4 = 7.5 + 0.03). Ionisation of the cobalt-bound water
molecule above neutal pH was assigned to pK5 = 9.2 + 0.04. Finally, we attributed pK6
(12.1 + 0.03) to the ionisation of the coordinated histidine trans to the OH- to form the
histidinate complex (His--CoIII-OH-).
A principal aim of this work was to demonstrate that the kinetics and the thermodynamics
of the ligand substitution reactions of NAc-CoIIIMP8 can be studied
spectrophotometrically; a comprehensive investigation of these reactions will be
undertaken by othe rs. Towards this end the formation constants between NAc-CoIIIMP8
and N-methylimidazole and pyridine were determined. We observed the formation of a
bis-substituted complex in the reaction of NAc-CoIIIMP8 with the ligands, but only
mono-substitution with NAc-FeIIIMP8 and B12a. We attribute this first ligand binding to
the replacement of the axial water molecule, and the second replacement of the axial
histidine residue. The absence of the second reaction with NAc-FeIIIMP8 and B12a
suggest that the CoIII-N(His) bond in NAc-CoIIIMP8 is significantly weaker than the FeIII-
N(His) and CoIII-N(dimethylbenzimidazole) bond, respectively. When comparing the
formation constants of NAc-FeIIIMP8, NAc-CoIIIMP8 and B12a, we found that the value
of log K1 for NAc-CoIIIMP8 for these ligands is significantly higher than that reported for
NAc-FeIIIMP8 and B12a.
Kinetics studies of NAc-CoIIIMP8 with N-methylimidazole and methylamine were
investigated. The data obtained did not follow conventional pseudo-first order kinetics;
instead there was some evidence for biphasic kinetics. In the reaction of N-
methylimidazole with NAc-CoIIIMP8, we observed that the rate of reaction is virtually
independent of the concentration of the incoming ligand. The results can be explained if
the mechanism proceeds through a purely dissociative mechanism, i.e., if the rate of the
reaction is controlled by the rate at which, firstly, the water molecule dissociates from the
CoIII centre and, secondly, the histidine dissociates from the metal. The second order rate
5
constant, k2, could not be determined since the rate of reaction is independent of N-
methylimidazole concentration. In the reaction of methylamine with NAc-CoIIIMP8, we
observed that the rate of reaction is dependent on the concentration and participation of
the incoming ligand. We propose that the displacement of water and histidine by
methylamine involves an interchange mechanism (Id), where the bond forming and bond
breaking occur simultaneously, and thus the rate of reaction becomes dependent on the
concentration of the incoming ligand.
The results showed that the rate of reaction for methylamine with NAc-CoIIIMP8 was
faster than with N-methylimidazole. We attributed these differences in rate constants to
the size of the incoming ligands. N-methylimidazole is a secondary amine and is
relatively more bulky than methylamine which is a primary amine; therefore it is easier
for methylamine to attach to the metal centre compared to N-methylimidazole.
For comparison, the rate of reaction of B12a with N-methylimidazole and methylamine
was determined. The results show that the rate of the reaction between NAc-CoIIIMP8
and B12a with N-methylimidazole and methylamine are significantly different.
Furthermore, we observe only mono-substitution in B12a and bisubstitution in NAc-
CoIIIMP8. Overall, the results presented in this work do give a general indication on how
thermodynamically stable a CoIII ion is in a porphyrin ring and also to a very limited
extent show that a porphyrin does not confer the same kinetic lability on the CoIII ion as
the corrin ring.

6
This work in dedicated to God and my loving Family:
My Parents: Jason and Rani Sannasy
My Brother: Gregory
My Grandparents: Ma and Nine Daddy, Umma and Shinah
My Uncle: Vis
My Fiancé: Ying
Thanks to all of you for the love and support throughout the years.

7
Acknowledgements I wish to thank my supervisors and the following people for all their support during the
duration of this project.
Ø Prof Helder Marques and Dr Alvaro de Sousa, for all their assistance and
insight throughout the course of the project.
Ø Dr Winile Mavuso, for her constant advice and patience, invaluable help at the
beginning of this project.
Ø Prof Ewa Cukrowska and Mr. Ruphert Morena for their help with the ICP-
OES analysis.
Ø Mr. Tommy van der Merwe for his help with the FAB-MS analysis.
Ø Mr. Clint Manuel for all his help with the computer.
Ø The glassblowers, Mr. Steve Gannon and Mr. Barry Fairbrother for always
willing to help.
Ø Mr. Basil Chassoulas, for helping me with the HPLC instrument.
Ø Christopher Perry, Prethi Vashi, Leanne Knapton and Mabel Conyanis for
their outstanding enthusiasm and willingness to help.
I would like to thank the University of the Witwatersrand, the National Research
Foundation (NRF), SACTWU and the Ernst Eriksen Ethel Trust for all their financial
support. Last but definitely not least to my fiancé the lovely Miss Ying-Hsuan Wu,
without whose dedication and support this project would not have been possible.
8
Table of Contents
Preliminaries
Abstract 3
Acknowledgements 7
List of Figures 12
List of Tables 125
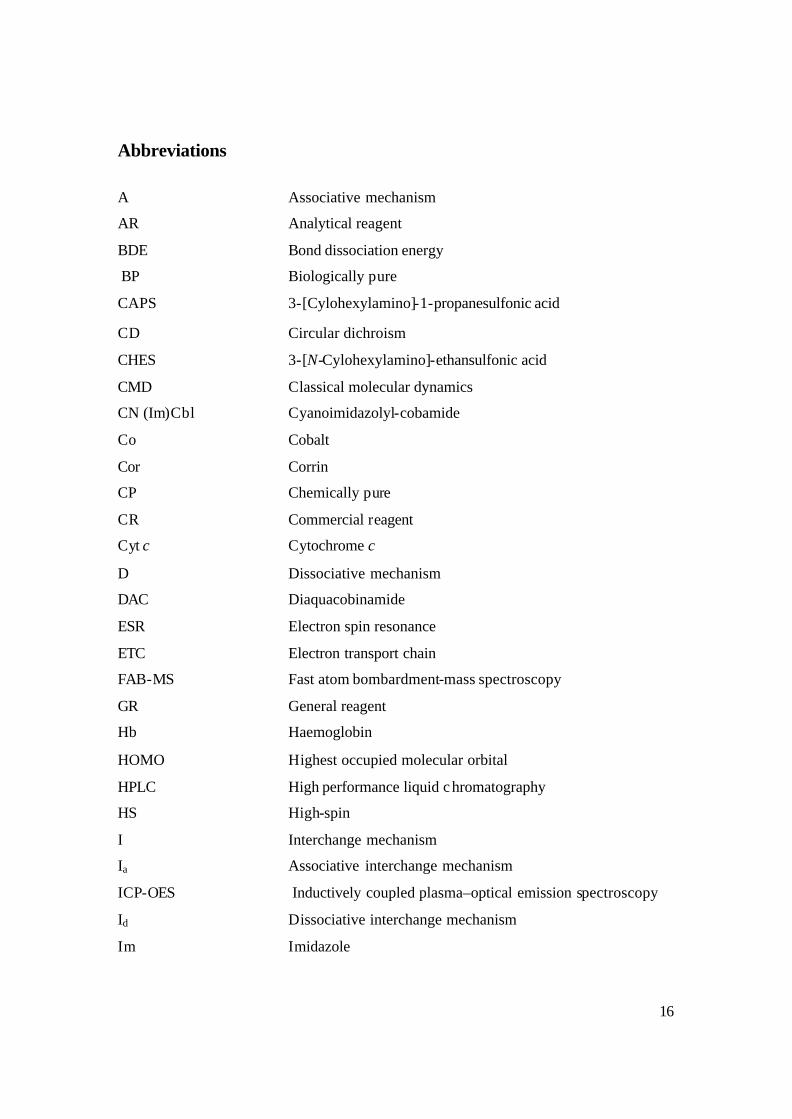
Abbreviations 16
Chapter 1 Introduction 1.1 Bioinorganic Chemistry 18
1.1.1 General Overview 18
1.1.2 Metal Ions in the Chemistry of Life 20
1.1.2.1 Aspects of the Chemistry of Iron: Properties and Special Characteristics 22
1.1.2.2 Aspects of the Chemistry of Cobalt: Redox and Magnetic Properties 25
1.2 Metalloproteins and their Significance 25
1.3 Porphyrins 29
1.3.1 Basic Structure 29
1.3.2 Iron Porphyrins 32
1.4 Haemproteins 32
1.4.1 The Cytochromes 33
1.4.2 The Peroxidases and Catalases 36
1.4.3 The Cytochromes P450 40
1.4.4 Haemoglobin (Hb) and Myoglobin (Mb) 44
1.5 The Microperoxidases (MPs) 46
1.5.1 Background 46
1.5.2 Preparation of Microperoxidases 47
1.5.3 Solution Behaviour of the Microperoxidases 49
1.5.3.1 Solutio n Structure 49
1.5.3.2 Aggregation in Aqueous Solution 50
1.5.3.3 Overcoming Aggregation 52
9
1.5.4 Haempeptide Acid Dissociation Constants 53
1.5.5 Ligand Binding Studies of Microperoxidases 53
1.5.6 Demetalation of Haempeptides 56
1.6 Cobalt Corrinoids: Basic Structure 56
1.7 Vitamin B12 57
1.7.1 Background 57
1.7.2 Structure of Vitamin B12a 58
1.7.3 Chemistry of Vitamin B12 and its derivatives: 60
Ligand Substitution and Kinetic Studies 60
1.8 Comparison of Porphyrin and Corrin 68
1.8.1 Structural and Functional 68
1.8.2 Chemical Properties 69
1.8.2.1 Spin-splitting energies 71
1.8.2.2 Thermodynamic stability 72
1.8.2.3 Geometries and the size of the ring cavities 73
1.8.2.4 Reduction Potential 74
1.8.2.5 Reorganisation energies 75
1.8.2.6 Bond dissociation energies 75
1.9 Scope and Objectives of the Research Project 76
Chapter 2 Materials and Methods 2.1 Materials 78
2.2 General Methods 80
2.2.1 pH Measurements 80
2.2.2 Buffers 80
2.2.3 Concentration and Desalting of Products 81
2.2.4 Gel Permeation Chromatography 81
2.3 Physical Techniques of Characterisation 82
2.3.1 High Performance Liquid Chromatography (HPLC ) 82
2.3.2 Fast Atom Bombardment – Mass Spectroscopy (FAB-MS) 83
2.3.3 Luminescence Spectroscopy 84
10
2.3.4 Determination of Extinction Coefficient using ICP-OES 84
2.4 Synthesis of products leading to the formation of NAc-CoIIIMP8 85
2.4.1 Preparation of FeIIIMP8 85
2.4.2 Synthesis of demetalated MP8 86
2.4.3 Synthesis of CoIIIMP8 87
2.4.4 Synthesis of NAc-CoIIIMP8 87
2.5 Investigating the Solution Chemistry of NAc-CoIIIMP8 88
2.5.1 Beer-Lambert Plot of NAc-CoIIIMP8 88
2.5.2 Data Analysis 89
2.5.3 Determination of Spectroscopic pKas of NAc-CoIIIMP8 89
2.5.4 Ligand Binding Studies of Selected N-Donor Ligands by NAc-CoIIIMP8 90
2.5.5 Kinetic Studies of Selected N-Donor Ligands by NAc-CoIIIMP8 91
2.5.6 Kinetic Studies of Selected N-Donor Ligands by B12a 92
Chapter 3 Results and Discussion 3.1 Synthesis and Characterisation of products leading to the
formation of NAc-CoIIIMP8 93
3.1.1 Preparation of FeIIIMP8 93
3.1.2 Synthesis of demetalated MP8 97
3.1.3 Synthesis of CoIIIMP8 102
3.1.4 Synthesis of NAc-CoIIIMP8 107
3.2 Solution Chemistry of NAc-CoIIIMP8 109
3.2.1 Determination of the Extinction Coefficients of NAc-CoIIIMP8 109
3.2.2 Beer-Lambert Behaviour of NAc-CoIIIMP8 110
3.2.3 Determination of Spectroscopic pKas of NAc-CoIIIMP8 112
3.2.4 Ligand Binding Studies of Selected N-Donor Ligands by NAc-CoIIIMP8 121
3.2.5 Kinetic Studies of the Reaction of Selected N -Donor Ligands
with NAc-CoIIIMP8 128
3.2.6 Kinetic Studies of Selected N-Donor Ligands by B12a 132
11
Chapter 4 Conclusions and Future Work 4.1 Conclusions 138
4.1.1 The synthesis and characterisation of products leading to the
formation of NAc-CoIIIMP8 138
4.1.2 Solution Chemistry of NAc-CoIIIMP8 139
4.2 Future Work 141
References 142
Appendices 154
Appendix A: HPLC Data 154
Appendix B: FAB-MS Data 155
Appendix C: Beer's Law Data 164
Appendix D: Spectroscopic pKa Data 166
Appendix E: Derivation of Rate Constant Equation for NAc-CoIIIMP8 169
12
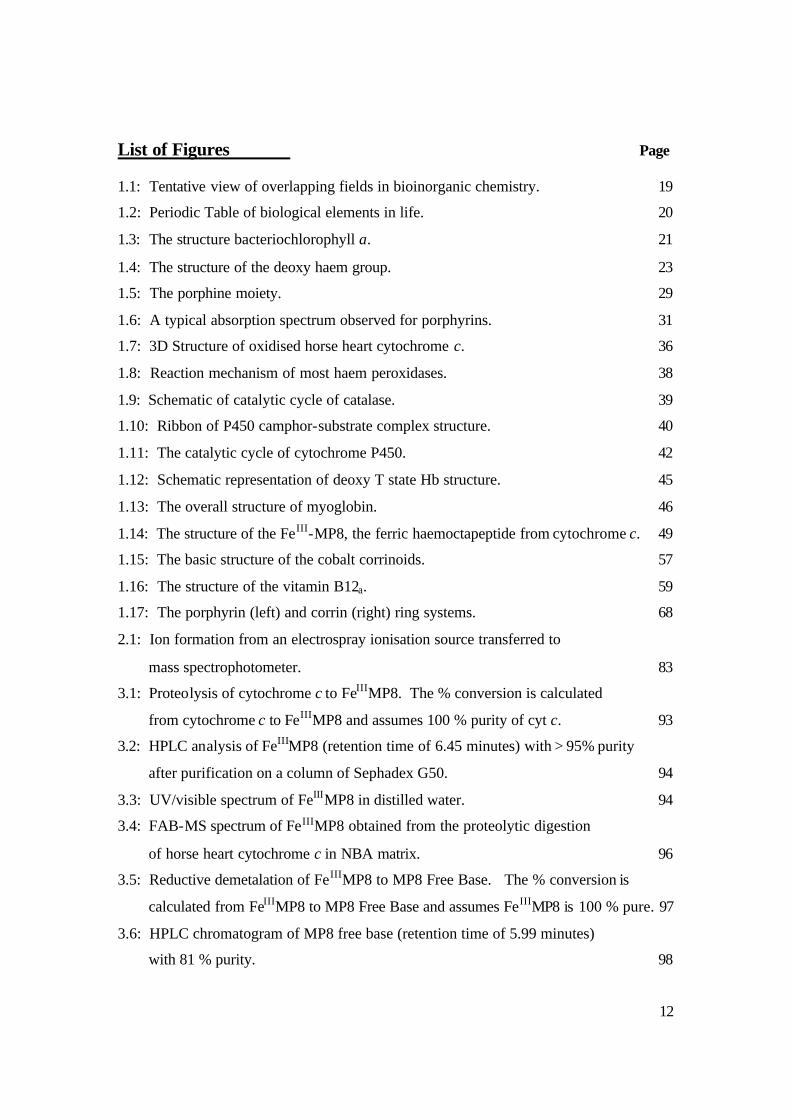
List of Figures Page 1.1: Tentative view of overlapping fields in bioinorganic chemistry. 19
1.2: Periodic Table of biological elements in life. 20
1.3: The structure bacteriochlorophyll a. 21
1.4: The structure of the deoxy haem group. 23
1.5: The porphine moiety. 29
1.6: A typical absorption spectrum observed for porphyrins. 31
1.7: 3D Structure of oxidised horse heart cytochrome c. 36
1.8: Reaction mechanism of most haem peroxidases. 38
1.9: Schematic of catalytic cycle of catalase. 39
1.10: Ribbon of P450 camphor-substrate complex structure. 40
1.11: The catalytic cycle of cytochrome P450. 42
1.12: Schematic representation of deoxy T state Hb structure. 45
1.13: The overall structure of myoglobin. 46
1.14: The structure of the FeIII-MP8, the ferric haemoctapeptide from cytochrome c. 49
1.15: The basic structure of the cobalt corrinoids. 57
1.16: The structure of the vitamin B12a. 59
1.17: The porphyrin (left) and corrin (right) ring systems. 68
2.1: Ion formation from an electrospray ionisation source transferred to
mass spectrophotometer. 83
3.1: Proteolysis of cytochrome c to FeIIIMP8. The % conversion is calculated
from cytochrome c to FeIIIMP8 and assumes 100 % purity of cyt c. 93
3.2: HPLC analysis of FeIIIMP8 (retention time of 6.45 minutes) with > 95% purity
after purification on a column of Sephadex G50. 94
3.3: UV/visible spectrum of FeIIIMP8 in distilled water. 94
3.4: FAB-MS spectrum of FeIIIMP8 obtained from the proteolytic digestion
of horse heart cytochrome c in NBA matrix. 96
3.5: Reductive demetalation of FeIIIMP8 to MP8 Free Base. The % conversion is
calculated from FeIIIMP8 to MP8 Free Base and assumes FeIIIMP8 is 100 % pure. 97
3.6: HPLC chromatogram of MP8 free base (retention time of 5.99 minutes)
with 81 % purity. 98
13
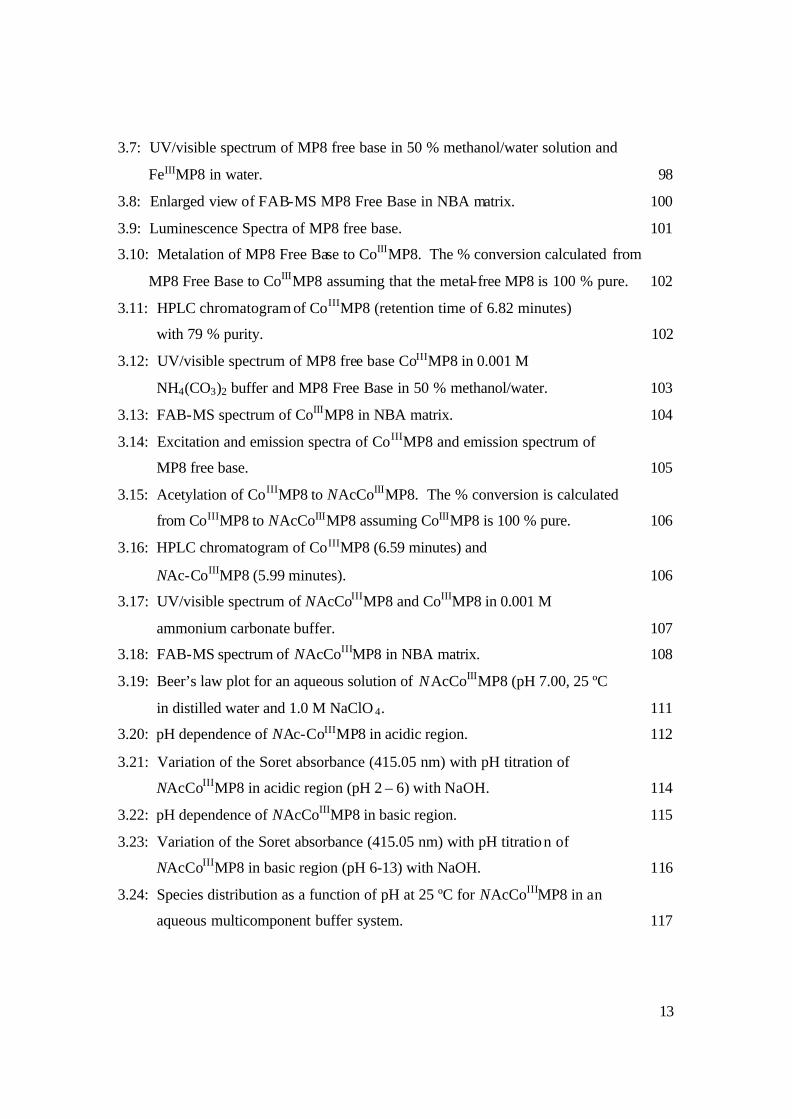
3.7: UV/visible spectrum of MP8 free base in 50 % methanol/water solution and
FeIIIMP8 in water. 98
3.8: Enlarged view of FAB-MS MP8 Free Base in NBA matrix. 100
3.9: Luminescence Spectra of MP8 free base. 101
3.10: Metalation of MP8 Free Base to CoIIIMP8. The % conversion calculated from
MP8 Free Base to CoIIIMP8 assuming that the metal-free MP8 is 100 % pure. 102
3.11: HPLC chromatogram of CoIIIMP8 (retention time of 6.82 minutes)
with 79 % purity. 102
3.12: UV/visible spectrum of MP8 free base CoIIIMP8 in 0.001 M
NH4(CO3)2 buffer and MP8 Free Base in 50 % methanol/water. 103
3.13: FAB-MS spectrum of CoIIIMP8 in NBA matrix. 104
3.14: Excitation and emission spectra of CoIIIMP8 and emission spectrum of
MP8 free base. 105
3.15: Acetylation of CoIIIMP8 to NAcCoIIIMP8. The % conversion is calculated
from CoIIIMP8 to NAcCoIIIMP8 assuming CoIIIMP8 is 100 % pure. 106
3.16: HPLC chromatogram of CoIIIMP8 (6.59 minutes) and
NAc-CoIIIMP8 (5.99 minutes). 106
3.17: UV/visible spectrum of NAcCoIIIMP8 and CoIIIMP8 in 0.001 M
ammonium carbonate buffer. 107
3.18: FAB-MS spectrum of NAcCoIIIMP8 in NBA matrix. 108
3.19: Beer’s law plot for an aqueous solution of NAcCoIIIMP8 (pH 7.00, 25 ºC
in distilled water and 1.0 M NaClO 4. 111
3.20: pH dependence of NAc-CoIIIMP8 in acidic region. 112
3.21: Variation of the Soret absorbance (415.05 nm) with pH titration of
NAcCoIIIMP8 in acidic region (pH 2 – 6) with NaOH. 114
3.22: pH dependence of NAcCoIIIMP8 in basic region. 115
3.23: Variation of the Soret absorbance (415.05 nm) with pH titration of
NAcCoIIIMP8 in basic region (pH 6-13) with NaOH. 116
3.24: Species distribution as a function of pH at 25 ºC for NAcCoIIIMP8 in an
aqueous multicomponent buffer system. 117
14
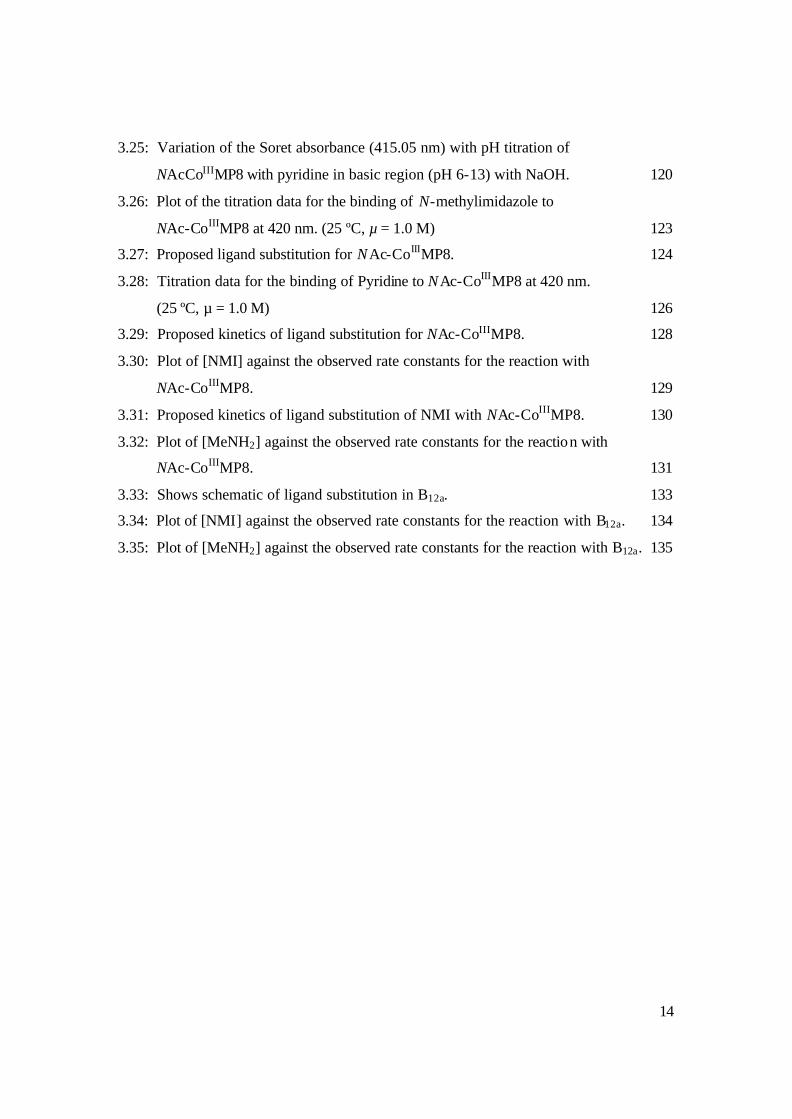
3.25: Variation of the Soret absorbance (415.05 nm) with pH titration of
NAcCoIIIMP8 with pyridine in basic region (pH 6-13) with NaOH. 120
3.26: Plot of the titration data for the binding of N-methylimidazole to
NAc-CoIIIMP8 at 420 nm. (25 ºC, µ = 1.0 M) 123
3.27: Proposed ligand substitution for NAc-CoIIIMP8. 124
3.28: Titration data for the binding of Pyridine to NAc-CoIIIMP8 at 420 nm.
(25 ºC, µ = 1.0 M) 126
3.29: Proposed kinetics of ligand substitution for NAc-CoIIIMP8. 128
3.30: Plot of [NMI] against the observed rate constants for the reaction with
NAc-CoIIIMP8. 129
3.31: Proposed kinetics of ligand substitution of NMI with NAc-CoIIIMP8. 130
3.32: Plot of [MeNH2] against the observed rate constants for the reaction with
NAc-CoIIIMP8. 131
3.33: Shows schematic of ligand substitution in B12a. 133
3.34: Plot of [NMI] against the observed rate constants for the reaction with B12a. 134
3.35: Plot of [MeNH2] against the observed rate constants for the reaction with B12a. 135
15
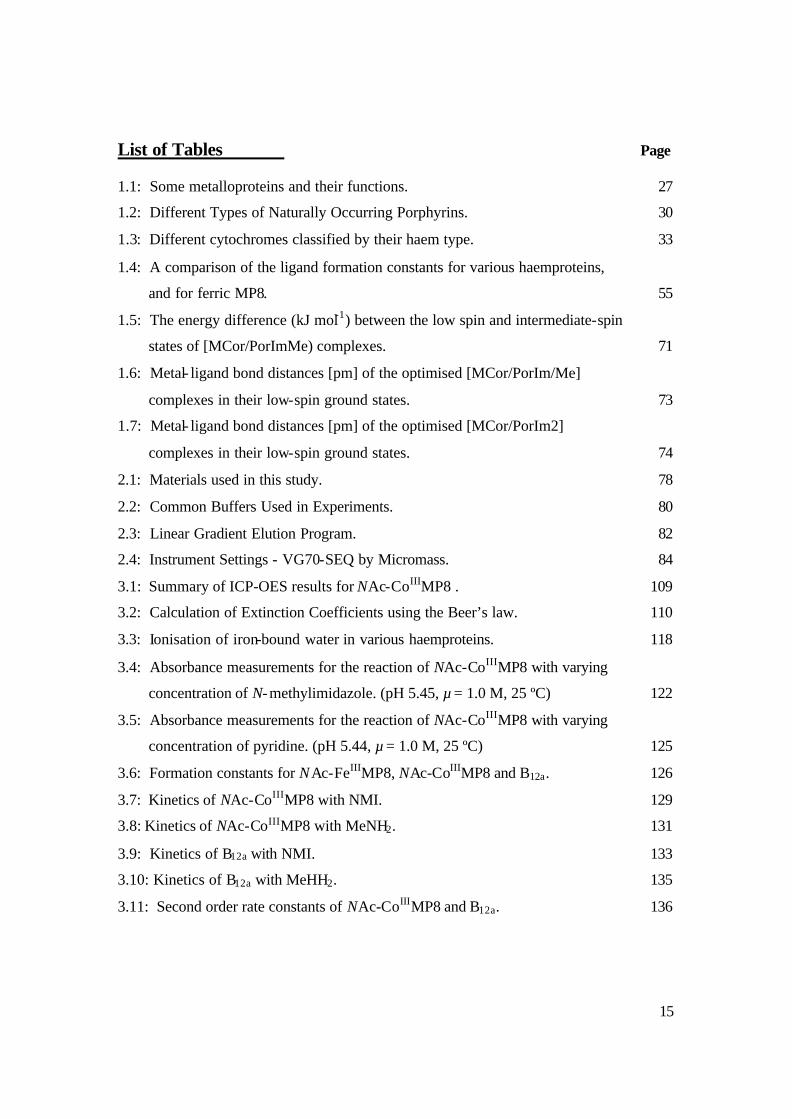
List of Tables Page 1.1: Some metalloproteins and their functions. 27
1.2: Different Types of Naturally Occurring Porphyrins. 30
1.3: Different cytochromes classified by their haem type. 33
1.4: A comparison of the ligand formation constants for various haemproteins,
and for ferric MP8. 55
1.5: The energy difference (kJ mol-1) between the low spin and intermediate-spin
states of [MCor/PorImMe) complexes. 71
1.6: Metal- ligand bond distances [pm] of the optimised [MCor/PorIm/Me]
complexes in their low-spin ground states. 73
1.7: Metal- ligand bond distances [pm] of the optimised [MCor/PorIm2]
complexes in their low-spin ground states. 74
2.1: Materials used in this study. 78
2.2: Common Buffers Used in Experiments. 80
2.3: Linear Gradient Elution Program. 82
2.4: Instrument Settings - VG70-SEQ by Micromass. 84
3.1: Summary of ICP-OES results for NAc-CoIIIMP8 . 109
3.2: Calculation of Extinction Coefficients using the Beer’s law. 110
3.3: Ionisation of iron-bound water in various haemproteins. 118
3.4: Absorbance measurements for the reaction of NAc-CoIIIMP8 with varying
concentration of N-methylimidazole. (pH 5.45, µ = 1.0 M, 25 ºC) 122
3.5: Absorbance measurements for the reaction of NAc-CoIIIMP8 with varying
concentration of pyridine. (pH 5.44, µ = 1.0 M, 25 ºC) 125
3.6: Formation constants for NAc-FeIIIMP8, NAc-CoIIIMP8 and B12a. 126
3.7: Kinetics of NAc-CoIIIMP8 with NMI. 129
3.8: Kinetics of NAc-CoIIIMP8 with MeNH2. 131
3.9: Kinetics of B12a with NMI. 133
3.10: Kinetics of B12a with MeHH2. 135
3.11: Second order rate constants of NAc-CoIIIMP8 and B12a. 136
16
Abbreviations A Associative mechanism
AR Analytical reagent
BDE Bond dissociation energy
BP Biologically pure
CAPS 3-[Cylohexylamino]-1-propanesulfonic acid
CD Circular dichroism
CHES 3-[N-Cylohexylamino]-ethansulfonic acid
CMD Classical molecular dynamics
CN (Im)Cbl Cyanoimidazolyl-cobamide
Co Cobalt
Cor Corrin
CP Chemically pure
CR Commercial reagent
Cyt c Cytochrome c
D Dissociative mechanism
DAC Diaquacobinamide
ESR Electron spin resonance
ETC Electron transport chain
FAB-MS Fast atom bombardment-mass spectroscopy
GR General reagent
Hb Haemoglobin
HOMO Highest occupied molecular orbital
HPLC High performance liquid chromatography
HS High-spin
I Interchange mechanism
Ia Associative interchange mechanism
ICP-OES Inductively coupled plasma–optical emission spectroscopy
Id Dissociative interchange mechanism
Im Imidazole
17
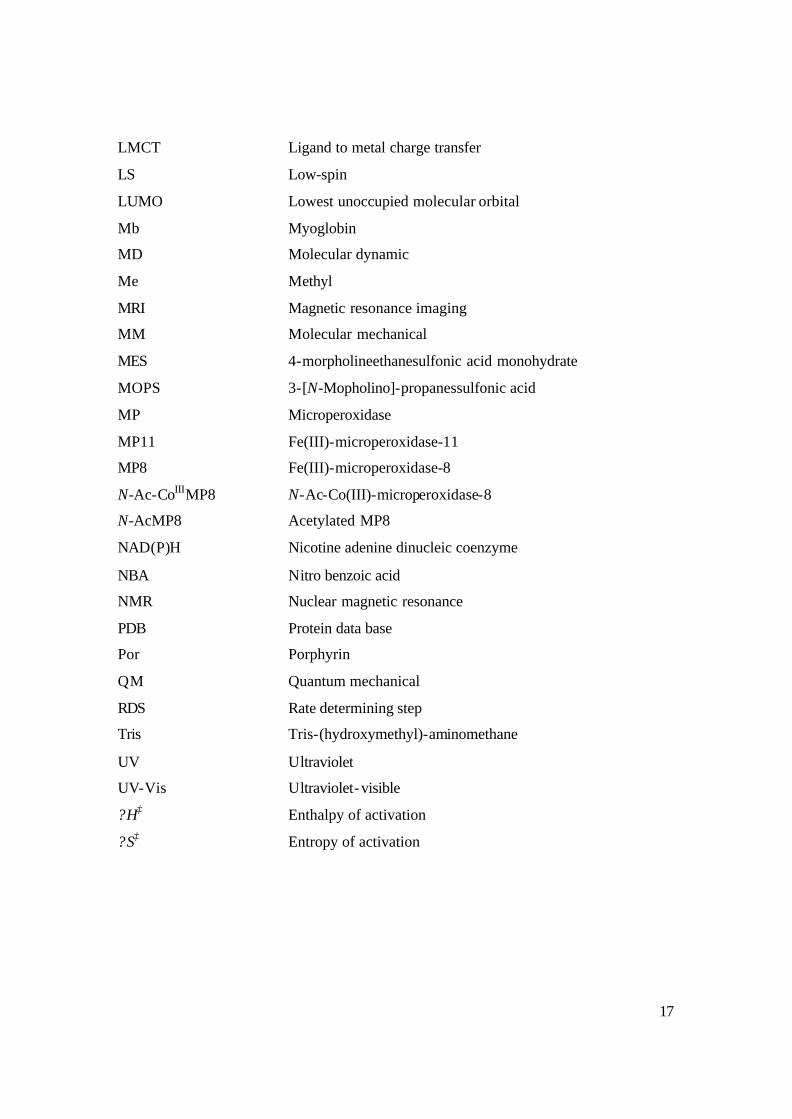
LMCT Ligand to metal charge transfer
LS Low-spin
LUMO Lowest unoccupied molecular orbital
Mb Myoglobin
MD Molecular dynamic
Me Methyl
MRI Magnetic resonance imaging
MM Molecular mechanical
MES
MOPS
4-morpholineethanesulfonic acid monohydrate
3-[N-Mopholino]-propanessulfonic acid
MP Microperoxidase
MP11 Fe(III)-microperoxidase-11
MP8 Fe(III)-microperoxidase-8
N-Ac-CoIIIMP8 N-Ac-Co(III)-microperoxidase-8
N-AcMP8 Acetylated MP8
NAD(P)H Nicotine adenine dinucleic coenzyme
NBA Nitro benzoic acid
NMR Nuclear magnetic resonance
PDB Protein data base
Por Porphyrin
QM Quantum mechanical
RDS Rate determining step
Tris Tris-(hydroxymethyl)-aminomethane
UV Ultraviolet
UV-Vis Ultraviolet-visible
?H‡ Enthalpy of activation
?S‡ Entropy of activation
18
Chapter 1 Introduction 1.1 Bioinorganic Chemistry
1.1.1 General Overview
Although bioinorganic chemistry is a relatively new field, reports on metals bound to
proteins and enzymes date way back into the nine teenth century and may be found in
earlier centuries if we replace the terms “proteins” and “enzymes” with “animal or plant
tissues”.1 Scientists by nature self-sort into groups and disciplines. The artificial division
of the study of chemical compounds into organic and inorganic chemistry has long been
established. Bioinorganic chemistry seems to contradict this artificial division. In the
early nineteenth century chemistry was still divided into “organic” chemistry, which
included only substances isolated from living organisms, and “inorganic” chemistry of
“dead matter”. This distinction became meaningless after Wöhlers’ synthesis of
“organic” urea from inorganic ammonium cyanate in 1828. Nowadays, organic
chemistry is defined as the chemistry of carbon compounds, especially of hydrocarbons
and their derivatives, with possible inclusion of certain heteroelements such as N, O or S
regardless of the origin of the material. 2
Bioinorganic or biological inorganic chemistry is the discipline dealing with the
interaction between inorganic substances and molecules of biological interest. It spans
many facets of other fields, since it involves the role, uptake, and fate of elements
essential for life, response of living organisms to toxic inorganic substances, the function
of metal-based drugs, the synthetic production of functional models, the production of
pharmaceutical contrast agents in medical applications, the development of theoretical
models, and so on. 3 Bioinorganic chemistry is a relatively new branch of chemistry and
only became an independent field after 1960.4 It is, however, a rapidly expanding
interdisciplinary field that has developed through contributions from chemical physics
(characterisation techniques), molecular biology (supply materials ), pharmacology (drug-
inorganic substance interactions), medicine (diagnostic aids and tumour therapy),
environmental and human toxicology (toxicity of inorganic compounds), crystallography
and spectroscopy (characterisation techniques) and chemistry (specifically bio-
19
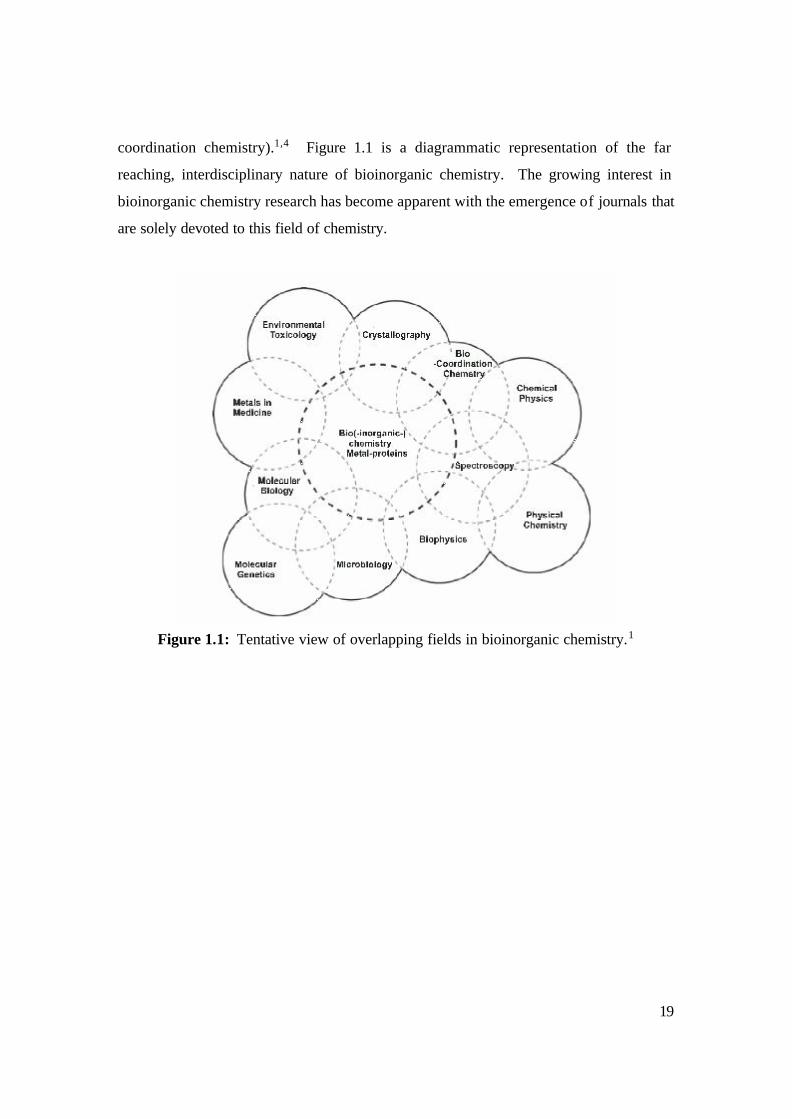
coordination chemistry).1,4 Figure 1.1 is a diagrammatic representation of the far
reaching, interdisciplinary nature of bioinorganic chemistry. The growing interest in
bioinorganic chemistry research has become apparent with the emergence of journals that
are solely devoted to this field of chemistry.
Figure 1.1: Tentative view of overlapping fields in bioinorganic chemistry.1
20
1.1.2 Metal Ions in the Chemistry of Life
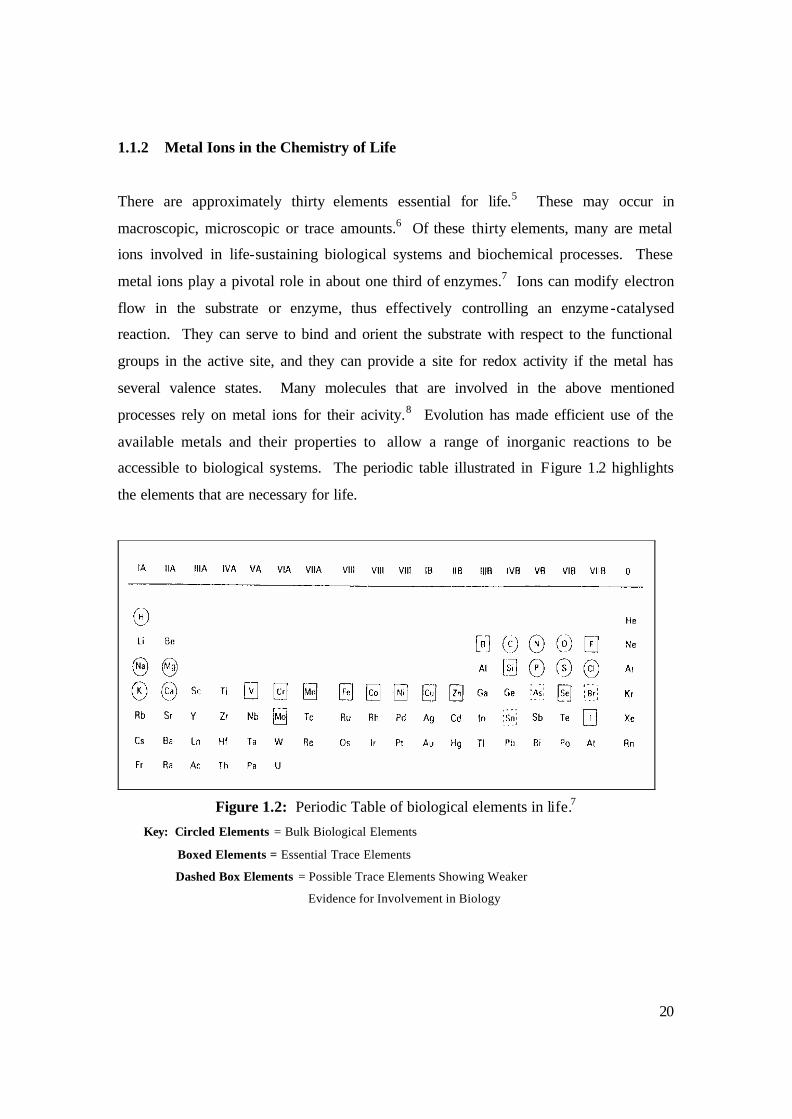
There are approximately thirty elements essential for life.5 These may occur in
macroscopic, microscopic or trace amounts.6 Of these thirty elements, many are metal
ions involved in life-sustaining biological systems and biochemical processes. These
metal ions play a pivotal role in about one third of enzymes.7 Ions can modify electron
flow in the substrate or enzyme, thus effectively controlling an enzyme-catalysed
reaction. They can serve to bind and orient the substrate with respect to the functional
groups in the active site, and they can provide a site for redox activity if the metal has
several valence states. Many molecules that are involved in the above mentioned
processes rely on metal ions for their acivity.8 Evolution has made efficient use of the
available metals and their properties to allow a range of inorganic reactions to be
accessible to biological systems. The periodic table illustrated in Figure 1.2 highlights
the elements that are necessary for life.
Figure 1.2: Periodic Table of biological elements in life.7
Key: Circled Elements = Bulk Biological Elements
Boxed Elements = Essential Trace Elements
Dashed Box Elements = Possible Trace Elements Showing Weaker
Evidence for Involvement in Biology
21
The term “essential” is given to an element that would cause severe, irreversible damage
if it were completely eliminated from the organism.4 Some elements such as As, Br, and
Sn have not been unequivocally determined to be essential since they are present in such
low concentrations that experiments are difficult to carry out. The normal concentration
range of essential metals is narrow and deficiencies or excesses of such metals cause
pathological changes in an organism.7
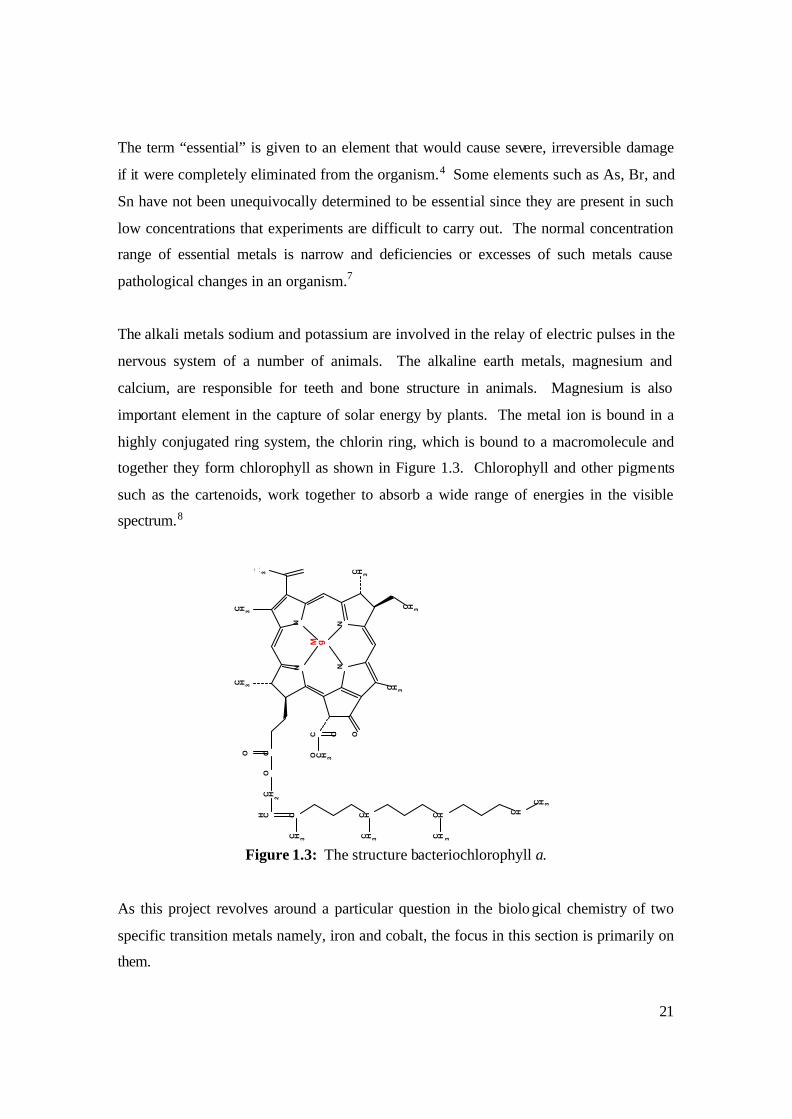
The alkali metals sodium and potassium are involved in the relay of electric pulses in the
nervous system of a number of animals. The alkaline earth metals, magnesium and
calcium, are responsible for teeth and bone structure in animals. Magnesium is also
important element in the capture of solar energy by plants. The metal ion is bound in a
highly conjugated ring system, the chlorin ring, which is bound to a macromolecule and
together they form chlorophyll as shown in Figure 1.3. Chlorophyll and other pigments
such as the cartenoids, work together to absorb a wide range of energies in the visible
spectrum.8
NN N
N
M g
C H 3
C H 3
C H 3
OC O
O C H 3
C H 3
OC H 3
C H 3
CO
OC H 2
H C CC H 3
C HC H 3
C HC H 3
C H
C H 3
Figure 1.3: The structure bacteriochlorophyll a.
As this project revolves around a particular question in the biological chemistry of two
specific transition metals namely, iron and cobalt, the focus in this section is primarily on
them.
22
1.1.2.1 Aspects of the Chemistry of Iron: Properties and Special Characteristics
Iron is the most abundant metal both in and on the Earth.9 As far as biology is concerned,
it is one of the most important metals in the first transition series as it is the transition
metal found in greatest abundance in biological systems. It constitutes one third of the
Earth’s mass and is present from crustal rocks, to ocean and river waters, and to the
organisms that exist in those environments.10, 11 The atmosphere as we know, abundant
in oxygen, has developed over billions of years from a reducing atmosphere that was too
hostile to support most living organisms. The only organisms that could exist were those
that could survive in an anaerobic environment. In this reducing atmosphere iron was
present in the ferrous state and was gradually oxidised to the ferric state as oxygen
became more prevalent. This increase in oxygen concentration was brought about the
blue-green algae and the photosynthetic bacteria.12
Ø Redox, Geometric and Magnetic Properties
The oxidation states of iron have been noted to range from -2 to +4, the most common
being FeII and FeIII in an aqueous environment.13 The change in atmospheric composition
as described above, has had a dramatic effect on the biology and biochemistry of iron due
to the different properties of the most common oxidation states of iron.
An interesting property of iron is its ability to be oxidised/reduced over a wide range of
potentials depending on its coordination environment. Redox potentials are an indication
of the relative stability of the oxidation state of iron in the presence of particular ligands.
Iron is found in the first row of transition metals in the periodic table. Since the valence
electrons are in the outer lying d orbitals, FeII is a d6 and FeIII is a d5 metal ion.14
There are a wide range of geometries adopted by both FeII and FeIII. The sizes of the
ferrous and ferric ions also affect the geometry of their complexes. The increase of
electrons in d orbitals as iron is reduced causes greater repulsion between those electrons,
23
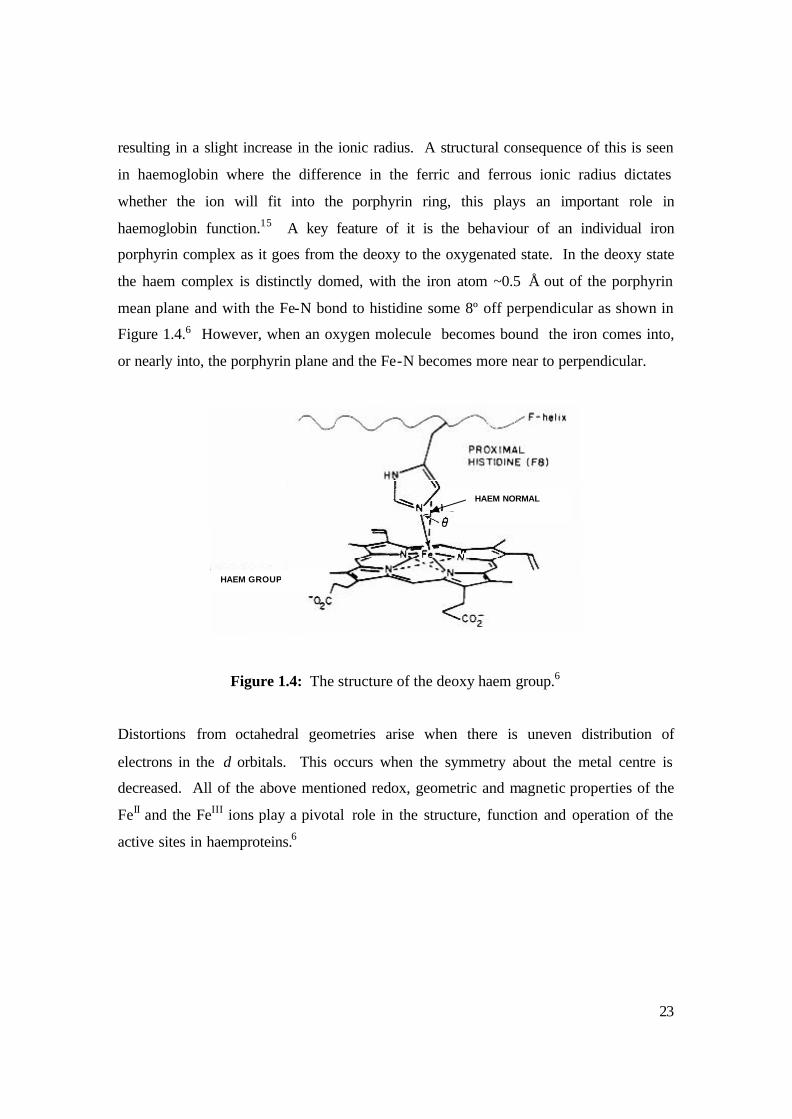
resulting in a slight increase in the ionic radius. A structural consequence of this is seen
in haemoglobin where the difference in the ferric and ferrous ionic radius dictates
whether the ion will fit into the porphyrin ring, this plays an important role in
haemoglobin function.15 A key feature of it is the behaviour of an individual iron
porphyrin complex as it goes from the deoxy to the oxygenated state. In the deoxy state
the haem complex is distinctly domed, with the iron atom ~0.5 Å out of the porphyrin
mean plane and with the Fe-N bond to histidine some 8º off perpendicular as shown in
Figure 1.4.6 However, when an oxygen molecule becomes bound the iron comes into,
or nearly into, the porphyrin plane and the Fe-N becomes more near to perpendicular.
Figure 1.4: The structure of the deoxy haem group.6
Distortions from octahedral geometries arise when there is uneven distribution of
electrons in the d orbitals. This occurs when the symmetry about the metal centre is
decreased. All of the above mentioned redox, geometric and magnetic properties of the
FeII and the FeIII ions play a pivotal role in the structure, function and operation of the
active sites in haemproteins.6
HAEM GROUP
HAEM NORMAL
24
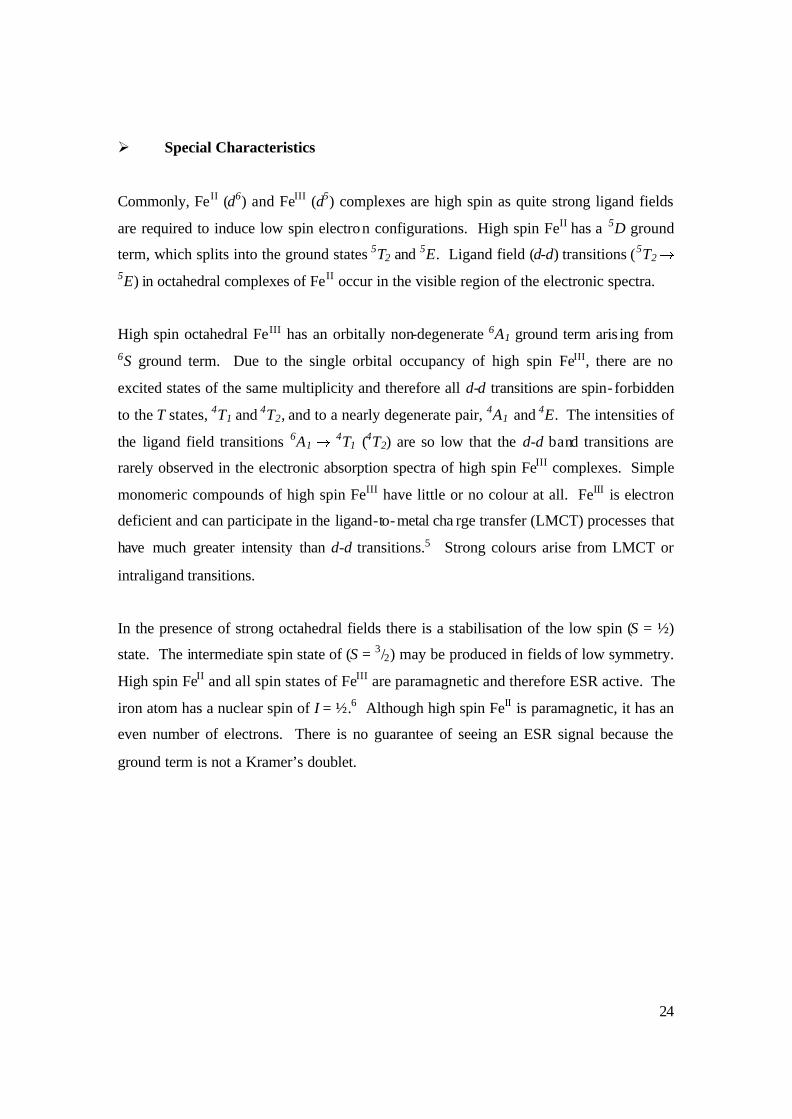
Ø Special Characteristics
Commonly, FeII (d6) and FeIII (d5) complexes are high spin as quite strong ligand fields
are required to induce low spin electron configurations. High spin FeII has a 5D ground
term, which splits into the ground states 5T2 and 5E. Ligand field (d-d) transitions (5T2 5E) in octahedral complexes of FeII occur in the visible region of the electronic spectra.
High spin octahedral FeIII has an orbitally non-degenerate 6A1 ground term aris ing from 6S ground term. Due to the single orbital occupancy of high spin FeIII, there are no
excited states of the same multiplicity and therefore all d-d transitions are spin- forbidden
to the T states, 4T1 and 4T2, and to a nearly degenerate pair, 4A1 and 4E. The intensities of
the ligand field transitions 6A1 4T1 (4T2) are so low that the d-d band transitions are
rarely observed in the electronic absorption spectra of high spin FeIII complexes. Simple
monomeric compounds of high spin FeIII have little or no colour at all. FeIII is electron
deficient and can participate in the ligand-to-metal cha rge transfer (LMCT) processes that
have much greater intensity than d-d transitions.5 Strong colours arise from LMCT or
intraligand transitions.
In the presence of strong octahedral fields there is a stabilisation of the low spin (S = ½)
state. The intermediate spin state of (S = 3/2) may be produced in fields of low symmetry.
High spin FeII and all spin states of FeIII are paramagnetic and therefore ESR active. The
iron atom has a nuclear spin of I = ½.6 Although high spin FeII is paramagnetic, it has an
even number of electrons. There is no guarantee of seeing an ESR signal because the
ground term is not a Kramer’s doublet.
25
1.1.2.2 Aspects of the Chemistry of Cobalt: Redox and Magnetic Properties
Cobalt is a first row transition metal and is found in oxidation states from +1 to +3.
CoIII is unstable in simple compounds but is much more stable in larger low spin
complexes.5 Typical geometries for cobalt range from tetrahedral to octahedral
throughout the range of oxidation states.14 The electronic structure of CoIII is low spin d6
except for very weak ligands such as the fluoride ion. 5 Thus, CoIII complexes are
diamagnetic in the ground state. CoIII complexes have characteristic electronic spectra
with bands in the visible region due to trans itions from the ground state (1A1g) to the
excited singlet states (1T1g and 1T2g) representing the d-d transitions.5 Due to its
diamagnetic electron configuration, CoIII is ESR inactive.
1.2 Metalloproteins and their Significance
Many transition elements have been found to serve as prosthetic groups (which are active
sites of proteins) or as co-factors in metal activated proteins.15 Numerous essential
biological functions require metal ions and most of these occur in metalloproteins. Metal
ions are critical to the function of many proteins, including stabilising their structure. In
fact, one third of all proteins are metalloproteins, using metal ions such as iron, copper,
zinc, molybdenum and vanadium.16 Metalloproteins are an important class of
biomolecules that play a central role in many biochemical processes, including
respiration, metabolism, nitrogen fixation, photosynthesis, nerve transduction, muscle
contraction, signal transduction, and protection against mutagenic agents. They also
serve as catalysts in a wide variety of reactions ranging from electron transfer to the
insertion of oxygen into carbon-hydrogen bonds. Thus, the role of the metal ions in
metalloproteins is two fold, as it serves both functional and structural roles.17, 18 In
performing these actions the metal can function alone, in a cluster or associated with
complex ring systems.18
26
Without the appropriate metal ion, a reaction catalysed by a particular metalloenzyme
would proceed very slowly if at all.19 The enzymes provide an arrangement of amino acid
side-chain functional groups which orient themselves to form an appropriate sized hole
(depending on the metal) to bind the metal. In addition, preferred groups on the enzyme
side chains further bind the required metal ion to increase stability. The optimal number
of such binding groups is chosen for the particular metal ion, together with an
environment of appropriate polarity in the binding site. Metal ions may be bound by
main-chain amino and carbonyl groups, but specific binding is achieved by the amino
acid side chains, particularly the carboxylate groups of aspartic and glutamic acid, and
the ring nitrogen atom of histidine. Other side chains that bind metal ions include
tryptophan (ring nitrogen), cysteine (thiol), methionine (thioether), serine, threonine,
tyrosine (hydroxyl groups), and asparagine and glutamine (carbonyl groups, less often
amino groups). There are no general set of rules that describe how a metal will behave in
an enzyme.20 In essence the function of the protein is to anchor, control and modify the
fundamental chemistry of the metal.
In recent years, the analysis and classification of metalloenzymes and metalloproteins at
the interface between chemistry and biology has accelerated. Although a variety of
spectroscopic techniques have been used for many years to probe the metal centres in
metal containing proteins, progress is particularly due to the recent developments in x-ray
diffraction methods, mass spectroscopy and NMR spectroscopy. Table 1.1 shows some
of the metalloproteins that have already been elucidated.
27
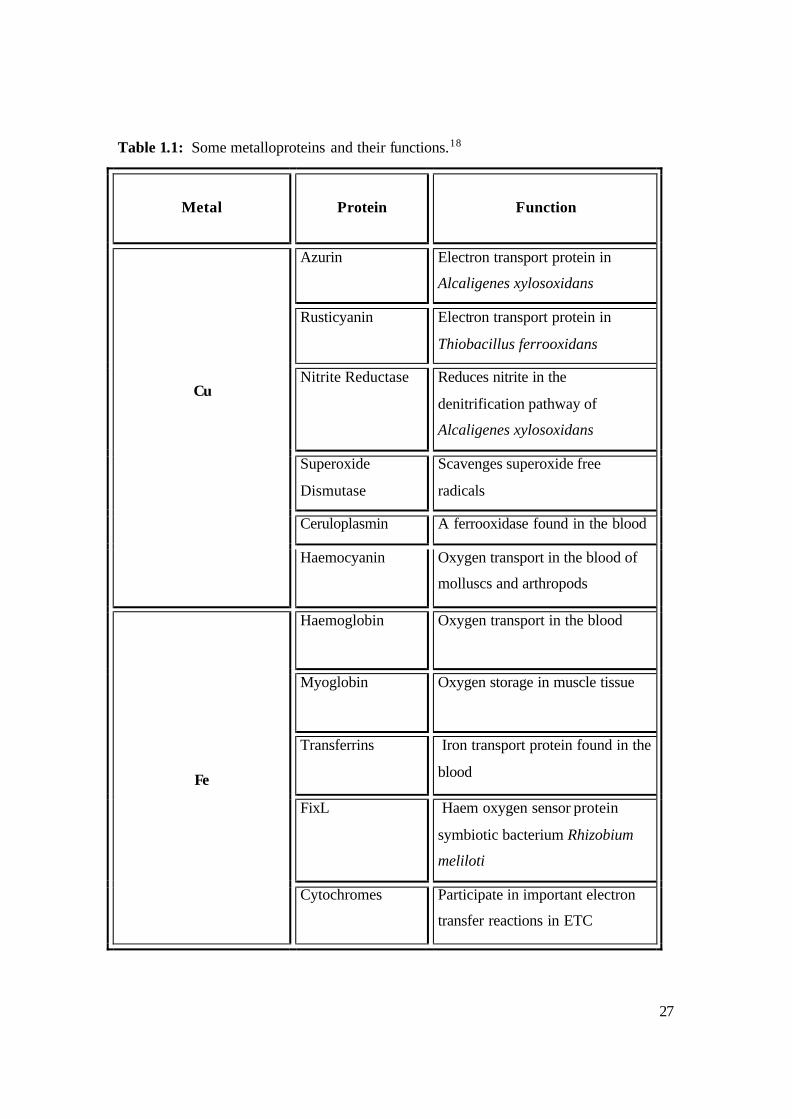
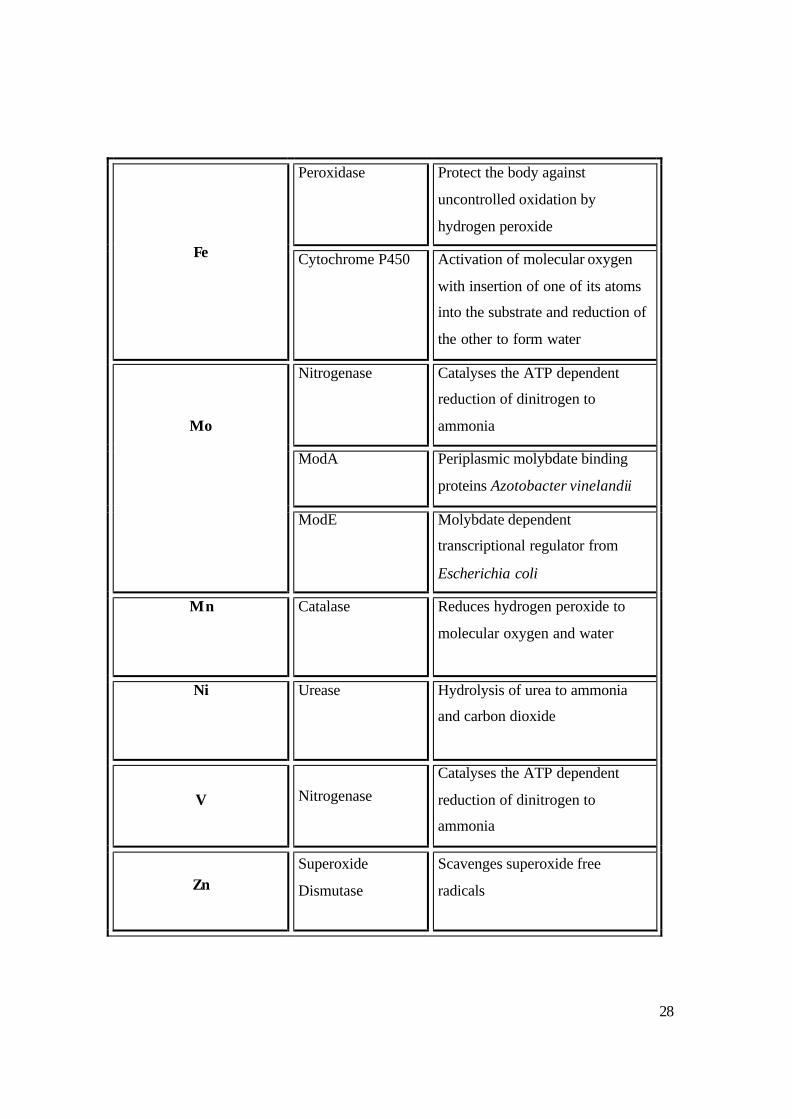
Table 1.1: Some metalloproteins and their functions.18
Metal
Protein
Function
Azurin Electron transport protein in
Alcaligenes xylosoxidans
Rusticyanin Electron transport protein in
Thiobacillus ferrooxidans
Nitrite Reductase Reduces nitrite in the
denitrification pathway of
Alcaligenes xylosoxidans
Superoxide
Dismutase
Scavenges superoxide free
radicals
Ceruloplasmin A ferrooxidase found in the blood
Cu
Haemocyanin
Oxygen transport in the blood of
molluscs and arthropods
Haemoglobin Oxygen transport in the blood
Myoglobin Oxygen storage in muscle tissue
Transferrins Iron transport protein found in the
blood
FixL Haem oxygen sensor protein
symbiotic bacterium Rhizobium
meliloti
Fe
Cytochromes
Participate in important electron
transfer reactions in ETC
28
Peroxidase
Protect the body against
uncontrolled oxidation by
hydrogen peroxide
Fe Cytochrome P450 Activation of molecular oxygen
with insertion of one of its atoms
into the substrate and reduction of
the other to form water
Nitrogenase Catalyses the ATP dependent
reduction of dinitrogen to
ammonia
ModA Periplasmic molybdate binding
proteins Azotobacter vinelandii
Mo
ModE Molybdate dependent
transcriptional regulator from
Escherichia coli
Mn Catalase Reduces hydrogen peroxide to
molecular oxygen and water
Ni
Urease
Hydrolysis of urea to ammonia
and carbon dioxide
V Nitrogenase Catalyses the ATP dependent
reduction of dinitrogen to
ammonia
Zn Superoxide
Dismutase
Scavenges superoxide free
radicals
29
1.3 Porphyrins
1.3.1 Basic Structure
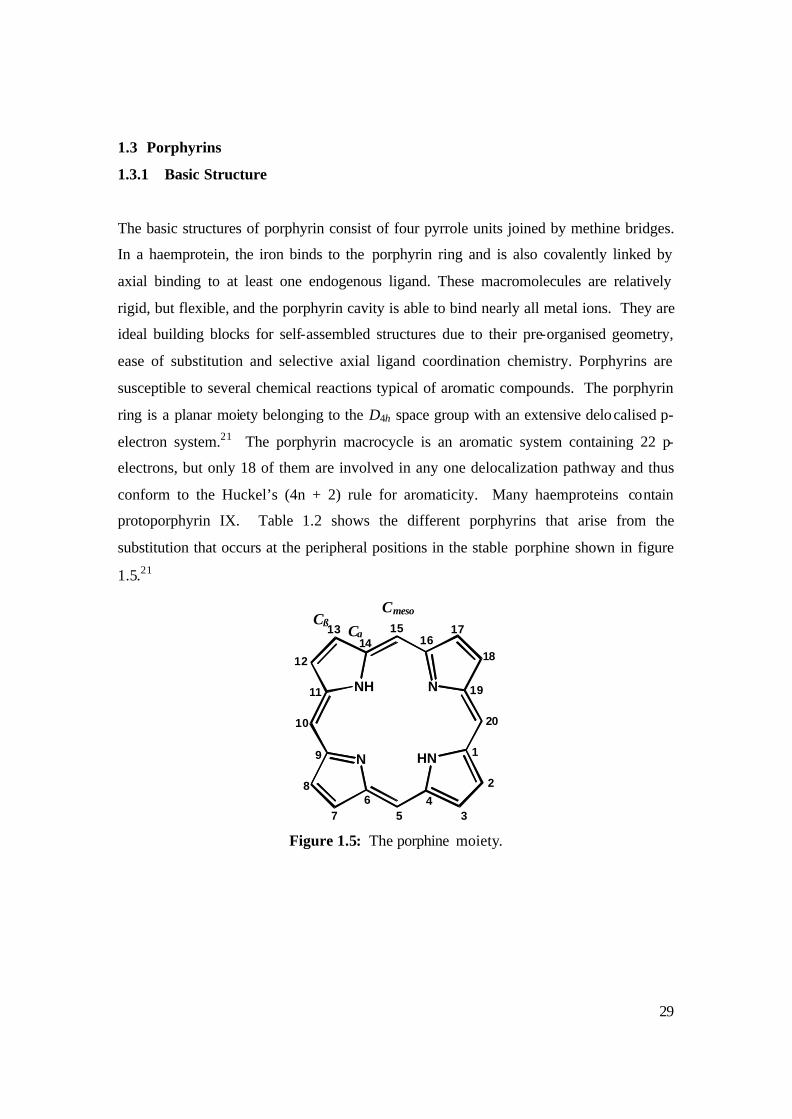
The basic structures of porphyrin consist of four pyrrole units joined by methine bridges.
In a haemprotein, the iron binds to the porphyrin ring and is also covalently linked by
axial binding to at least one endogenous ligand. These macromolecules are relatively
rigid, but flexible, and the porphyrin cavity is able to bind nearly all metal ions. They are
ideal building blocks for self-assembled structures due to their pre-organised geometry,
ease of substitution and selective axial ligand coordination chemistry. Porphyrins are
susceptible to several chemical reactions typical of aromatic compounds. The porphyrin
ring is a planar moiety belonging to the D4h space group with an extensive delocalised p-
electron system.21 The porphyrin macrocycle is an aromatic system containing 22 p-
electrons, but only 18 of them are involved in any one delocalization pathway and thus
conform to the Huckel’s (4n + 2) rule for aromaticity. Many haemproteins contain
protoporphyrin IX. Table 1.2 shows the different porphyrins that arise from the
substitution that occurs at the peripheral positions in the stable porphine shown in figure
1.5.21
N
NH N
HN 1
2
346
20
7
11
10
9
8
1413
12
1615 17
18
19
5 Figure 1.5: The porphine moiety.
Cmeso
Ca Cß
30
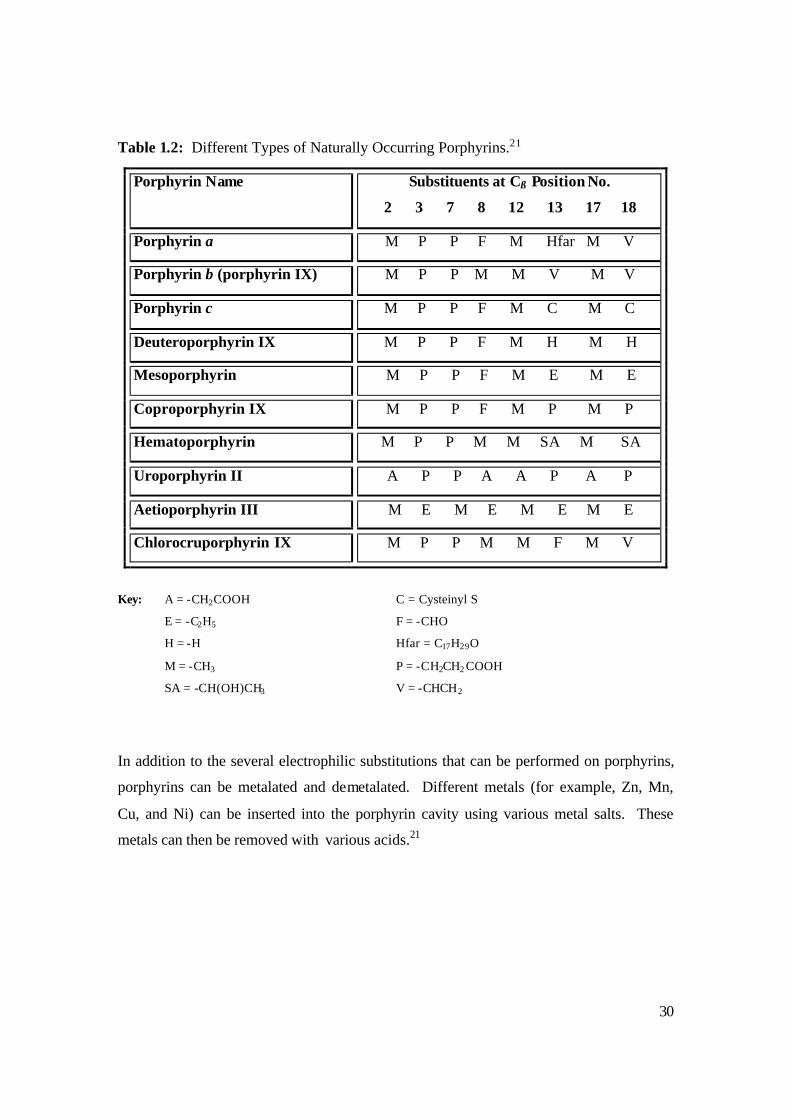
Table 1.2: Different Types of Naturally Occurring Porphyrins.21
Porphyrin Name Substituents at Cß Position No.
2 3 7 8 12 13 17 18
Porphyrin a M P P F M Hfar M V
Porphyrin b (porphyrin IX) M P P M M V M V
Porphyrin c M P P F M C M C
Deuteroporphyrin IX M P P F M H M H
Mesoporphyrin M P P F M E M E
Coproporphyrin IX M P P F M P M P
Hematoporphyrin M P P M M SA M SA
Uroporphyrin II A P P A A P A P
Aetioporphyrin III M E M E M E M E
Chlorocruporphyrin IX M P P M M F M V
Key: A = -CH2COOH C = Cysteinyl S
E = -C2H5 F = -CHO
H = -H Hfar = C17H29O
M = -CH3 P = -CH2CH2 COOH
SA = -CH(OH)CH3 V = -CHCH2
In addition to the several electrophilic substitutions that can be performed on porphyrins,
porphyrins can be metalated and demetalated. Different metals (for example, Zn, Mn,
Cu, and Ni) can be inserted into the porphyrin cavity using various metal salts. These
metals can then be removed with various acids.21
31
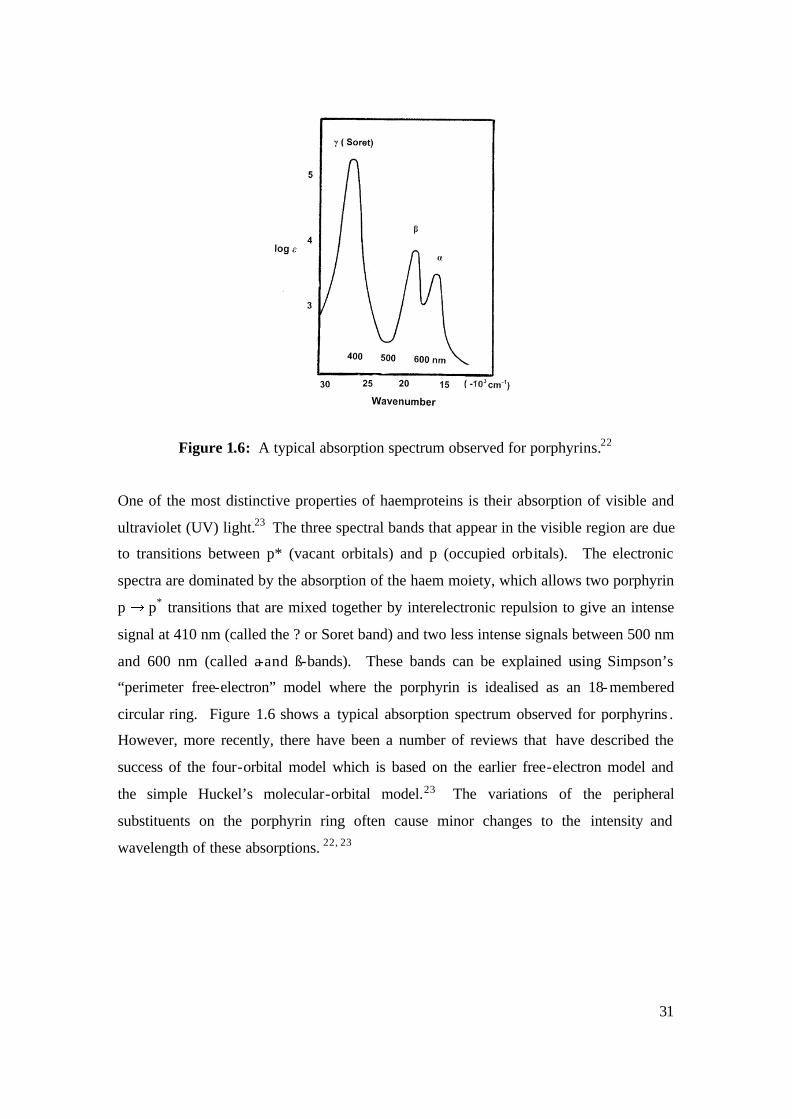
Figure 1.6: A typical absorption spectrum observed for porphyrins.22
One of the most distinctive properties of haemproteins is their absorption of visible and
ultraviolet (UV) light.23 The three spectral bands that appear in the visible region are due
to transitions between p* (vacant orbitals) and p (occupied orbitals). The electronic
spectra are dominated by the absorption of the haem moiety, which allows two porphyrin
p p* transitions that are mixed together by interelectronic repulsion to give an intense
signal at 410 nm (called the ? or Soret band) and two less intense signals between 500 nm
and 600 nm (called a-and ß-bands). These bands can be explained using Simpson’s
“perimeter free-electron” model where the porphyrin is idealised as an 18-membered
circular ring. Figure 1.6 shows a typical absorption spectrum observed for porphyrins .
However, more recently, there have been a number of reviews that have described the
success of the four-orbital model which is based on the earlier free-electron model and
the simple Huckel’s molecular-orbital model.23 The variations of the peripheral
substituents on the porphyrin ring often cause minor changes to the intensity and
wavelength of these absorptions. 22, 23
32
1.3.2 Iron Porphyrins
Iron porphyrins form the prosthetic group (active site) of the biologically important
haemproteins. These haemproteins are macromolecules that play very important roles in
various biological processes, which include oxygen transportation and storage in living
tissues (as in haemoglobin and myoglobin), the reduction of hydrogen peroxide (as in the
catalase and peroxidase enzymes), the reduction of oxygen (as in oxidases), the transport
of electrons (as in the cytochromes b and c in the electron transport chain), and the
oxygenation of organic substrates (as in cytochrome P-450). More specifically,
haemoglobin and myoglobin serve as reversible oxygen transfer proteins, oxidases and
peroxidases are involved in irreversible, covalent transformation of substrates, and the
cytochromes b and c function as reversible one -electron transfer agents. Even though
these haemproteins have diverse functions, all haemproteins possess a common prosthetic
group composed of an iron porphyrin complex. Although the remainder of the protein
plays a key role in modulation of their biological activity, there is evidence that the
biological function of the haemproteins is determined by the conformational and
electronic properties of the haem group , modulated by the protein.23
1.4 Haemproteins
Haemproteins (which contain iron porphyrins) are ubiquitous in nature and serve many
roles as mentioned above. They can be classified according to their biological function,
by haem iron coordination, by haem type, and further by sequence similarity. Studies
have showed that the hydrophobic interior, hydrogen bonding interactions, and polar and
non-polar interactions play an integral role in the correct folding around the haem.
Consequently, there has been much experimental and theoretical effort directed towards
the elucidation of the detailed nature of the haem group. Haemproteins are the only
proteins to have an intimate relationship between structure, spectra and function. Thus,
there exists a well-defined relationship between properties of the active site and the
function of the protein.24
33
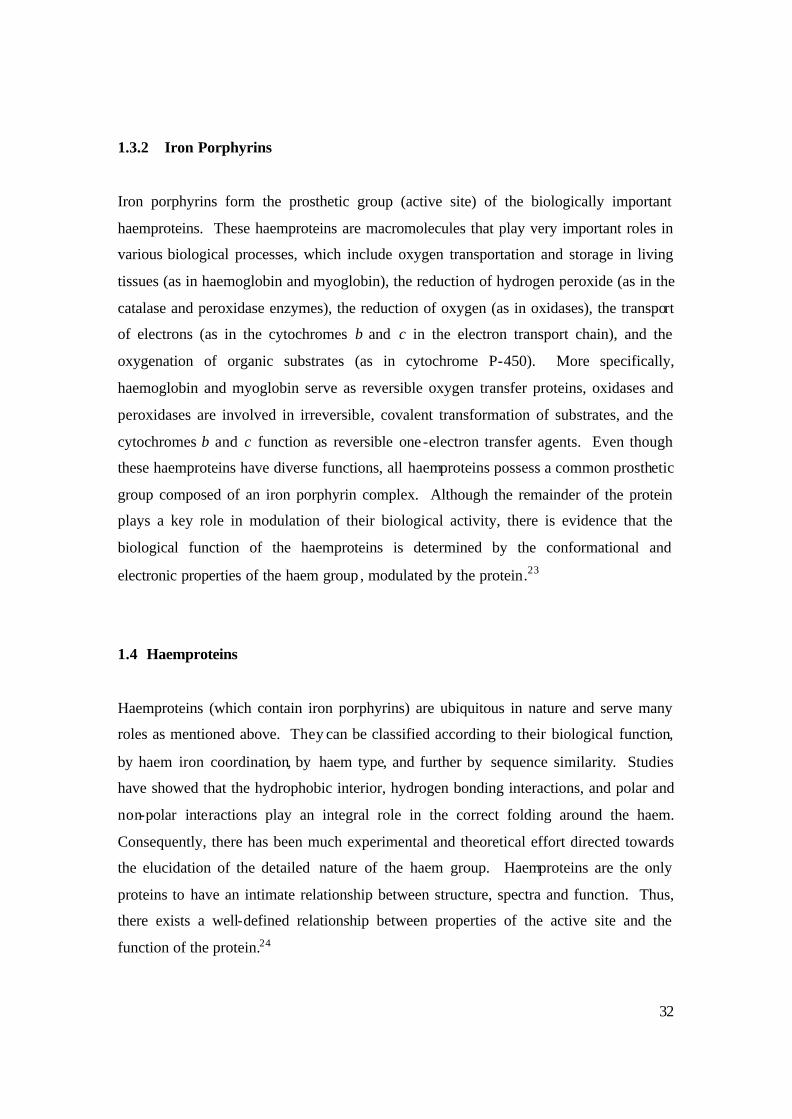
1.4.1 The Cytochromes
Cytochromes are haemproteins whose specific bio logical function is electron and/or
proton transfer by virtue of a reversible valency change of their haem iron.25 They are
known to play a major role as electron carriers in the electron transport chain (ETC).
Although this definition takes into account both biological and chemical features and is
wide enough to encompass both non-autoxidizable and autoxidizable cytochromes, it is
however too wide to include the catalase and peroxidase group of haemproteins. There
are however seven main groups of cytochromes that can be distinguished by their haem
type (see Table 1.3).26
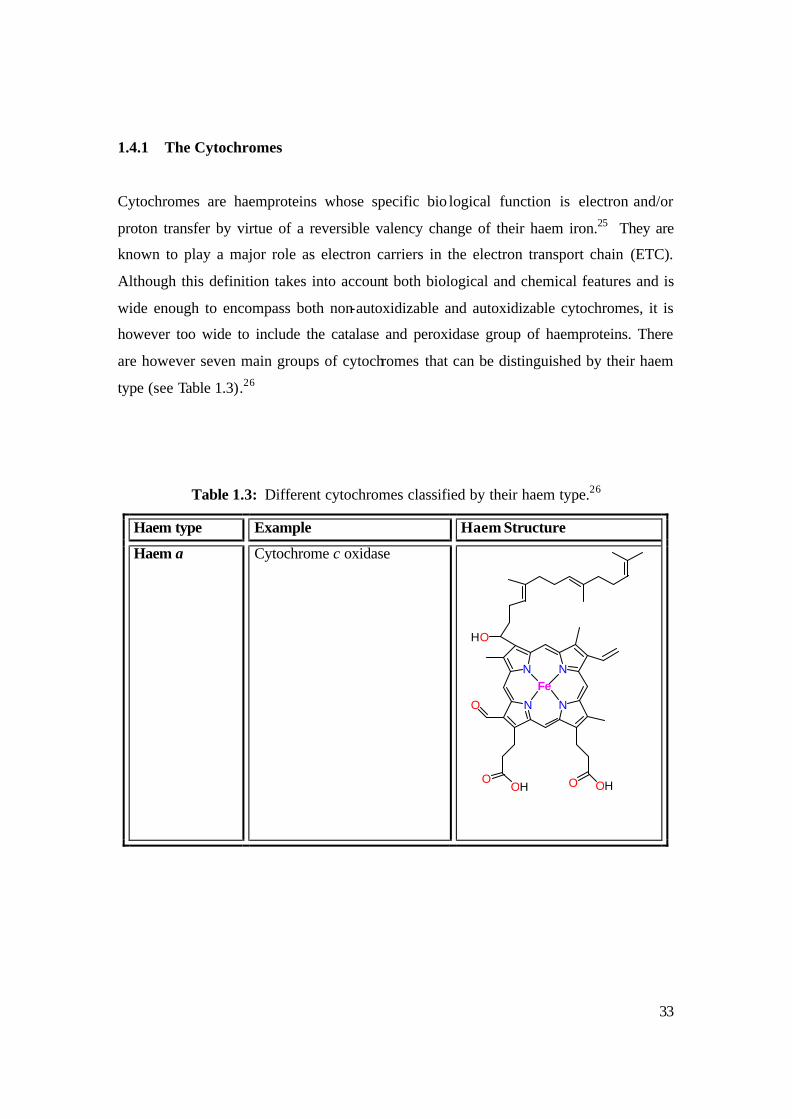
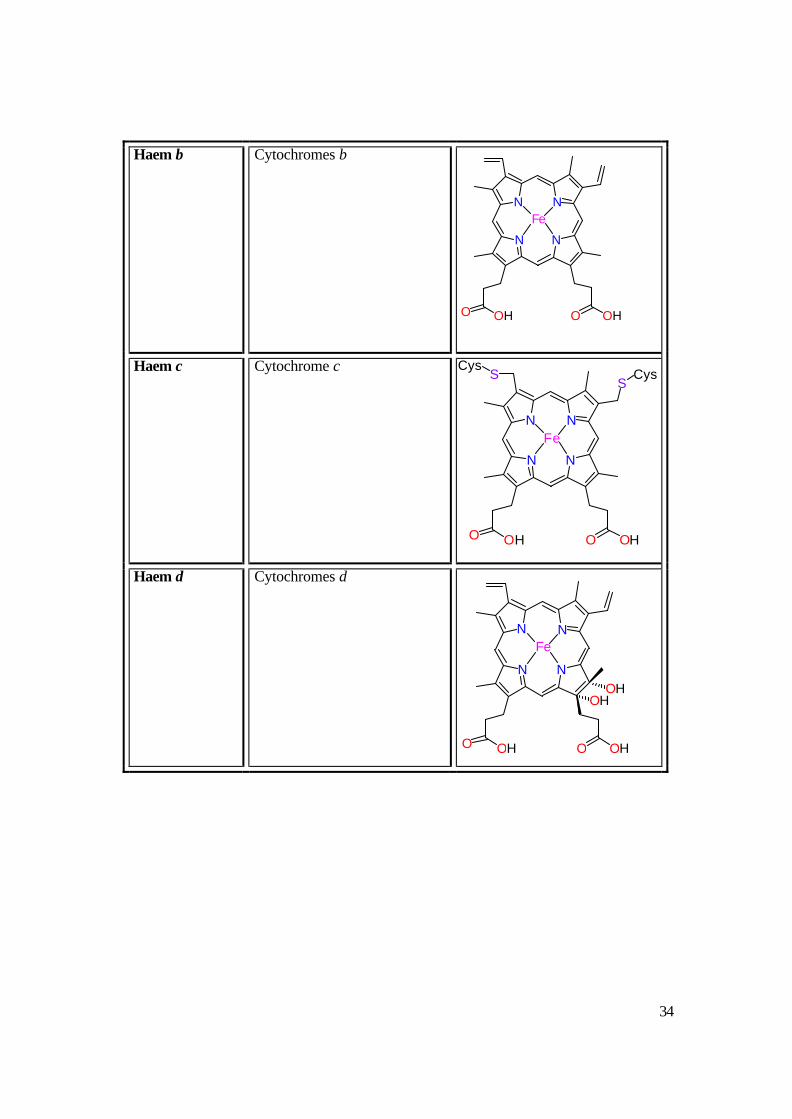
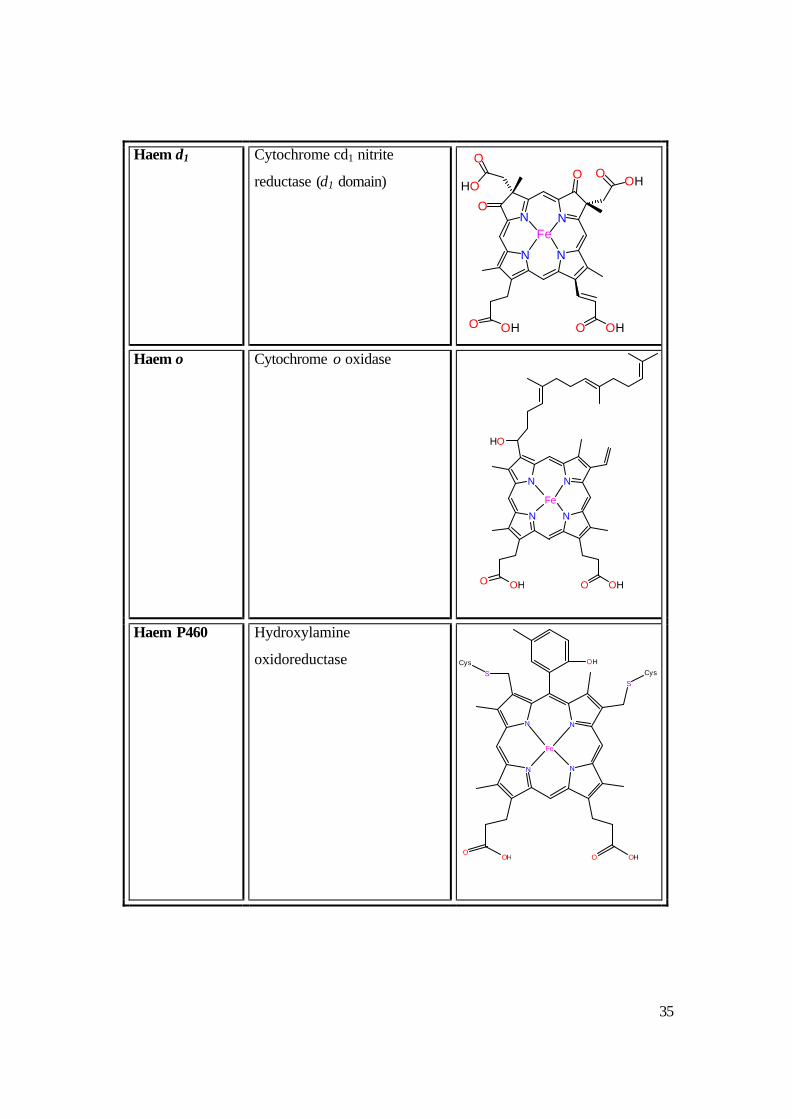
Table 1.3: Different cytochromes classified by their haem type.26
Haem type Example Haem Structure
Haem a Cytochrome c oxidase
N
N N
N
Fe
O OHOOH
HO
O
34
N
N N
N
Fe
O OHO OH
SS
CysCys
Haem b
Cytochromes b
Haem c
Cytochrome c
Haem d Cytochromes d
N
N N
N
Fe
O OHO OH
N
N N
N
Fe
O OHO OH
OHOH
35
Haem d1 Cytochrome cd1 nitrite
reductase (d1 domain)
Haem o Cytochrome o oxidase
Haem P460 Hydroxylamine
oxidoreductase
N
N N
N
Fe
O OHO OH
O
O
HO
OO
OH
N
N N
N
Fe
O OHO OH
HO
N
N N
N
Fe
O OHO
OH
SS
CysCys
OH
36
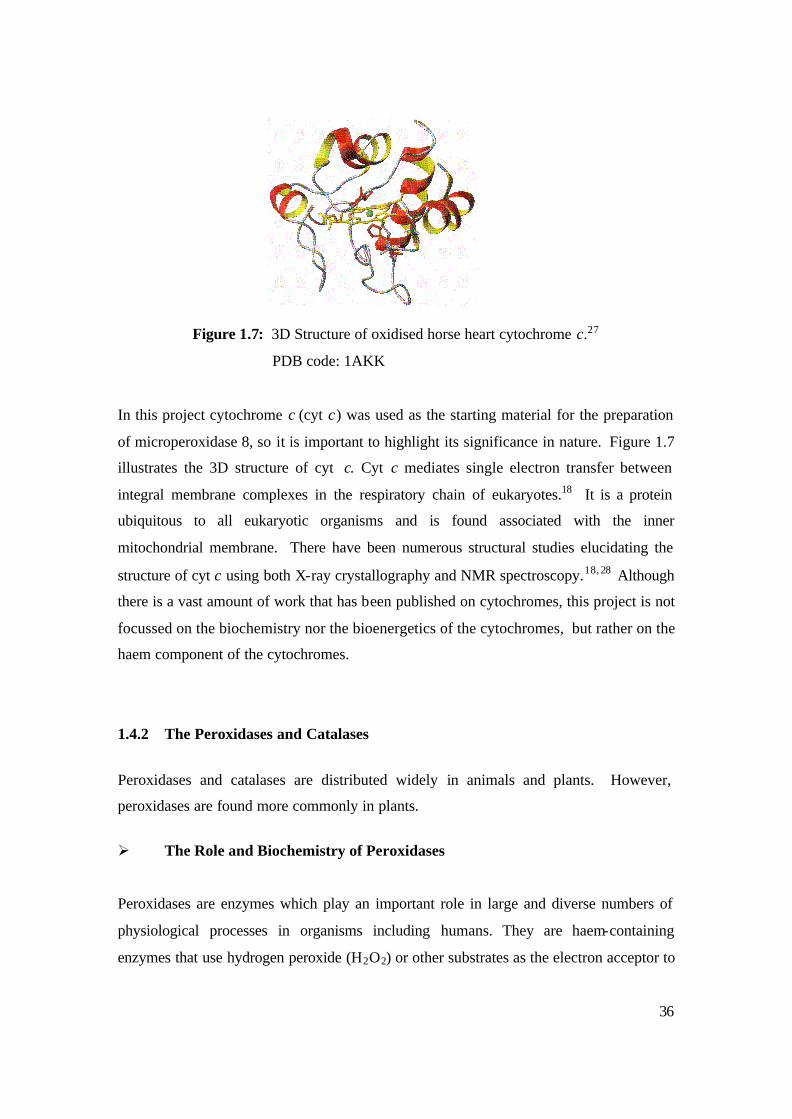
Figure 1.7: 3D Structure of oxidised horse heart cytochrome c.27
PDB code: 1AKK
In this project cytochrome c (cyt c) was used as the starting material for the preparation
of microperoxidase 8, so it is important to highlight its significance in nature. Figure 1.7
illustrates the 3D structure of cyt c. Cyt c mediates single electron transfer between
integral membrane complexes in the respiratory chain of eukaryotes.18 It is a protein
ubiquitous to all eukaryotic organisms and is found associated with the inner
mitochondrial membrane. There have been numerous structural studies elucidating the
structure of cyt c using both X-ray crystallography and NMR spectroscopy.18, 28 Although
there is a vast amount of work that has been published on cytochromes, this project is not
focussed on the biochemistry nor the bioenergetics of the cytochromes, but rather on the
haem component of the cytochromes.
1.4.2 The Peroxidases and Catalases
Peroxidases and catalases are distributed widely in animals and plants. However,
peroxidases are found more commonly in plants.
Ø The Role and Biochemistry of Peroxidases
Peroxidases are enzymes which play an important role in large and diverse numbers of
physiological processes in organisms including humans. They are haem-containing
enzymes that use hydrogen peroxide (H2O2) or other substrates as the electron acceptor to
37
catalyze a number of oxidative reactions. As such, they are classified as oxidoreductases.
Toxic molecules such as superoxide and hydroxyl radicals can be found in cells due to
the presence of oxygen. These are by-products of aerobic respiration. They are eliminated
by a number of enzymes present inside the cell. Superoxide, for example, is destroyed by
superoxide dismutase. The degradation, however, produces more hydrogen peroxide,
which is, in turn, destroyed by peroxidase. Peroxidases reduce H2O2 to water while
oxidizing a variety of substrates. Thus, peroxidases are oxidoreductases that use H2O2 as
electron acceptor for catalyzing different oxidative reactions. The overall reaction is as
follows:
ROOR' + electron donor (2e-) + 2H+ ? ROH + R'OH (1.1)
For many of these enzymes the optimal substrate is hydrogen peroxide, but others are
more active with organic hydroperoxides such as lipid peroxides. The nature of the
electron donor is very dependent on the structure of the enzyme. For example,
horseradish peroxidase can use a variety of organic compounds as electron donors and
acceptors. Horseradish peroxidase has a broad and accessible active site and many
compounds can reach the site of the reaction. For an enzyme such as cytochrome c
peroxidase, the compounds that donate electrons are very specific, because there is a very
closed active site. Cytochrome c peroxidase is used as a soluble, easily purified model for
cytochrome c oxidase. 4, 29
On the basis of sequence and structure similarity, haem-dependent peroxidases can be
separated into two families: the family of animal peroxidases and the family of plant,
fungal and bacterial peroxidases.30, 31
38
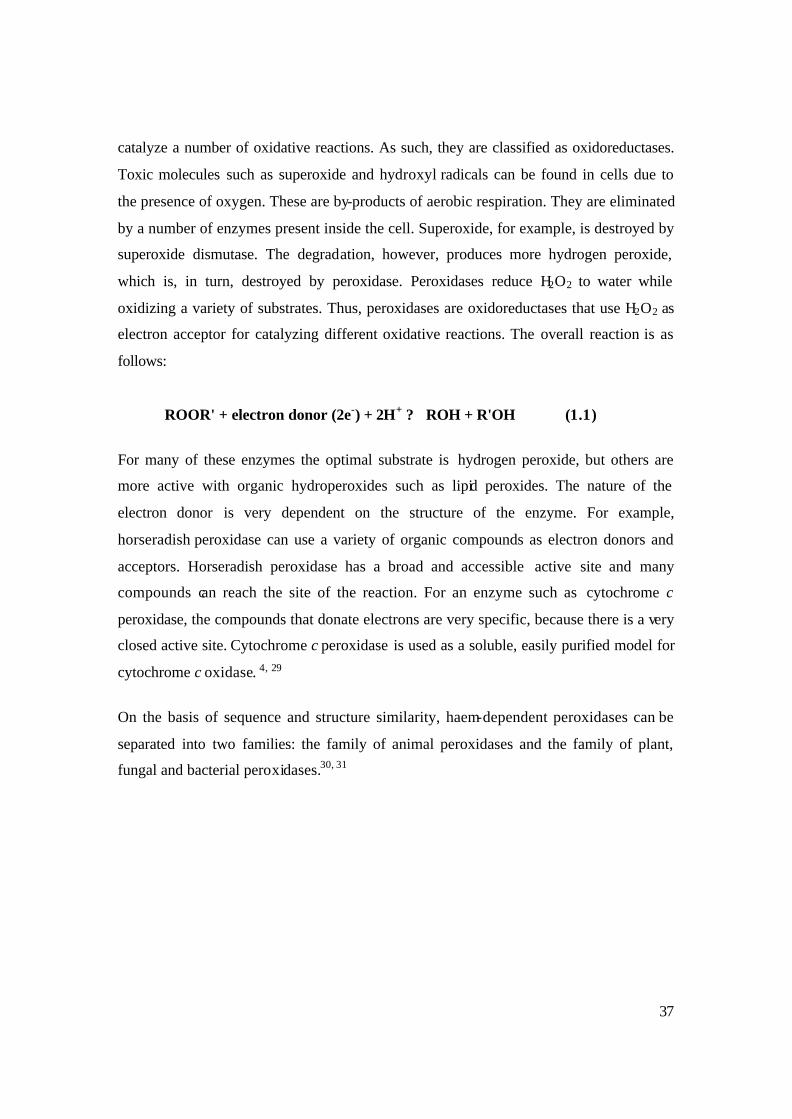
Figure 1.8: Reaction mechanism of most haem peroxidases.4, 29
In this mechanism, the enzyme reacts with one equivalent of H2O2 to give compound I, a
porphyrin cation radical containing FeIV. This is a two-electron oxidation/reduction
reaction where H2O2 is reduced to water and the enzyme is oxidised. One oxidising
equivalent resides on iron, giving the oxyferryl (FeIV=O) intermediate and the second
resides on the porphyrin which becomes a p–radical cation. Compound I then oxidises an
organic substrate to give a substrate radical (·AH). Compound I undergoes a second one--
electron oxidation reaction yielding compound II, which contains an oxyferryl centre
coordinated to a normal (dianionic) porphyrin ligand. Finally, compound II, is reduced
back to the native ferric state with concomitant one electron substrate reduction. The
overall charge on the resting state and compound I is +1, while compound II is
neutral.4, 29
AH + H + AH2
F e I I I
H N
N
R e s t i n g E n z y m e
F e I V
O
H N
N
I
+ F e I V
O
H N
N
I I
H O O H
H 2 O
A H + O H -
A H 2
39
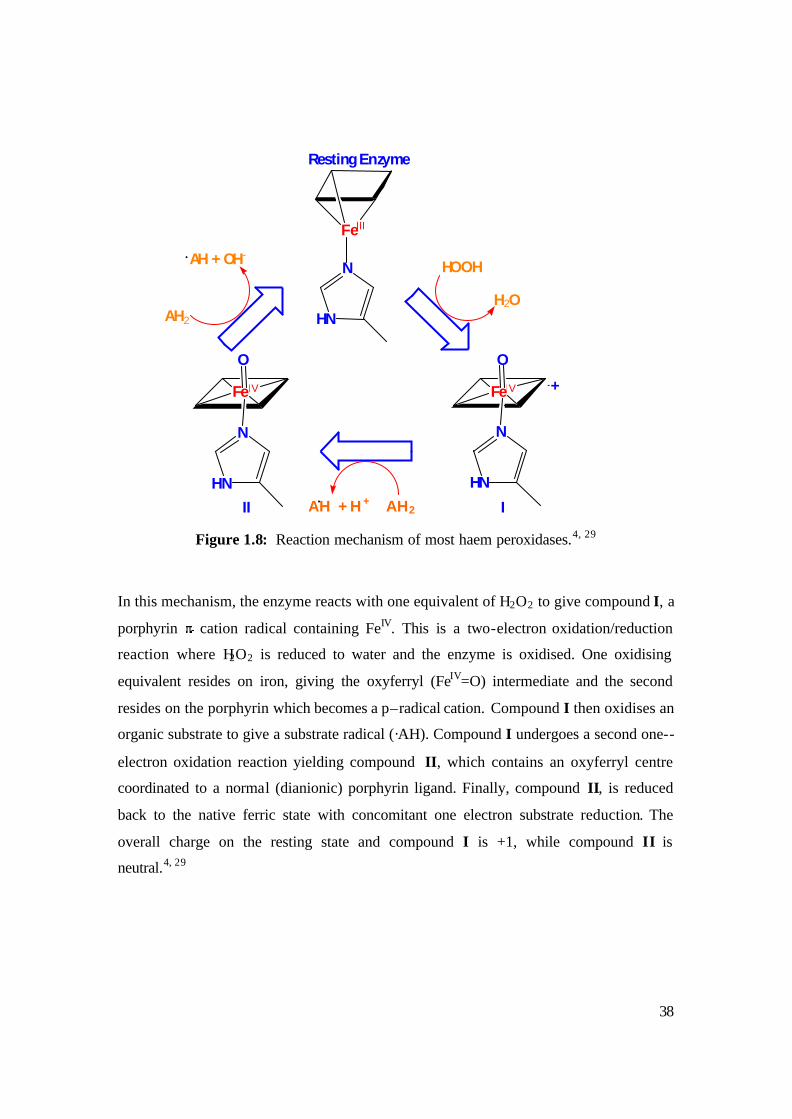
Ø The Role and Biochemistry of Catalases
Catalase is a haem-containing enzyme that catalyses reaction (1.2). The R represents
hydrogen, an alkyl or acyl group and the HQOH is a two electron donor. Catalases can
utilise hydrogen peroxide (H2O2) both as an electron acceptor and an electron donor
yielding molecular oxygen (O 2) and water in the disproportionation reaction (1.3).
ROOH + HQOH QO + ROH + H2O (1.2)
H2O2 + H2O2 2H2O + O2 (1.3)
The reaction cycle of the catalases begins with the high spin ferric (FeIII) state which
reacts with the molecule of peroxide to form compound I intermediate, a porphyrin p
cation radical containing FeI V. This is followed by oxidation of an electron donor which
returns compound I to the native resting state. Both the resting state and compound I of
catalase are neutral.
Figure 1.9: Schematic of catalytic cycle of Catalase.
Most catalases have haem b as the prosthetic group; however, a number of fungal and
bacterial catalases contain chlorin type haem (haem d).32-34 In all catalases the haem iron
F e I I I
O
R e s t i n g E n z y m e
F e I V
O
I
+
O
H O O H H 2 O
H O O H H2O + O 2
40
fifth (proximal) ligand is a Tyr residue; a His residue essential for catalysis is located on
the distal side of the haem. It is thought that its function is to deprotonate H2O2, which is
bound to H+ (on His) and HO2- (on FeIII). In all catalase structures, a water molecule
located close to the sixth coordination of the haem has been observed.35-38
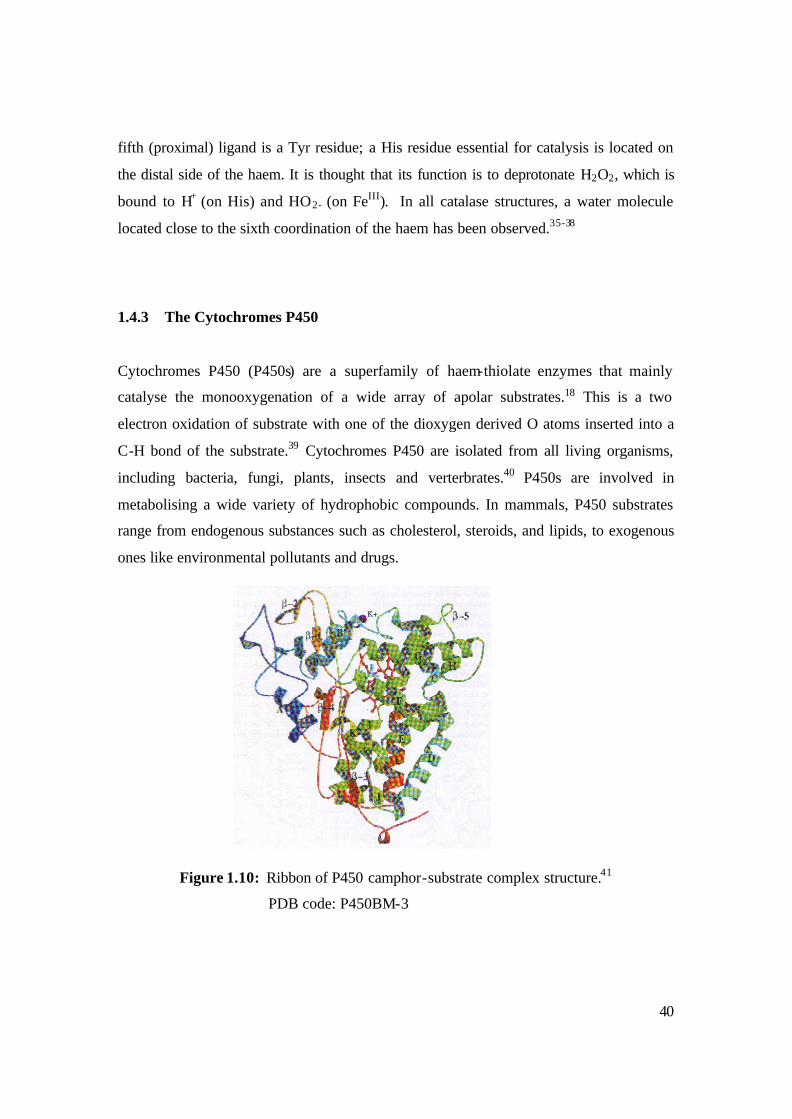
1.4.3 The Cytochromes P450
Cytochromes P450 (P450s) are a superfamily of haem-thiolate enzymes that mainly
catalyse the monooxygenation of a wide array of apolar substrates.18 This is a two
electron oxidation of substrate with one of the dioxygen derived O atoms inserted into a
C-H bond of the substrate.39 Cytochromes P450 are isolated from all living organisms,
including bacteria, fungi, plants, insects and verterbrates.40 P450s are involved in
metabolising a wide variety of hydrophobic compounds. In mammals, P450 substrates
range from endogenous substances such as cholesterol, steroids, and lipids, to exogenous
ones like environmental pollutants and drugs.
Figure 1.10: Ribbon of P450 camphor-substrate complex structure.41
PDB code: P450BM-3
41
Ø Physical Properties
The P450s are haemproteins that are made up of between 400 and 500 amino acids and
contain a single haem prosthetic group.42, 43 The distal axial ligand of this haem moiety is
formed by a cysteine residue. In the haem system, six- fold coordinated FeIII is generally
found to be LS and five- fold coordinated FeIII is found in the HS state.44 This is due to
the fact that the ionic radius is larger for HS FeIII than for LS45 and in the HS state the
FeIII moves out of the plane of the porphyrin ring as the central cavity is too small.
Furthermore, it was also thought that the five coordinate FeIII moves out of the porphyrin
cavity to maximise orbital overlap of the donor atom of the proximal ligand. The nature
of the axial haem ligands also has an important effect on the LS-HS balance. A strong
axial field will bring about a relatively large d-orbital splitting, favouring the LS state.
This can be seen in practice if one compares the UV absorption spectra of CO complexes
with haemoglobin (histidine axial ligand) and P450 (cysteine ligand). The axial ligand
field strength due to histidine is much stronger than that due to cysteine46 and
correspondingly the UV absorption band due to the d d transition in CO-hemoglobin
occurs at 420 nm, while that due to CO-P450 occurs at 450 nm.47
Ligand-free P450s exhibit a Soret absorption maximum in a UV spectrum at
approximately 420 nm. This is associated with the LS state of the FeIII. Spectral48, NMR49
and crystallographic50 data indicate that a water molecule forms a sixth axial ligand of the
FeIII in the substrate-free form, thus stabilising the LS state of the ion. The HS and LS
states are not independent, but exist in equilibrium. The differences in the absorption and
extinction coefficients between the two bands at 390 and 420 nm allow the equilibrium
constant between the spin states and hence the fraction of HS character to be determined.
The equilibrium between HS and LS is only one of a number of microequilibria which
must be considered in a full description of the substrate binding reaction.50-53 The
equilibrium between these states may be affected by many factors such as the pH of the
solution or changes in the conformation of the enzyme which alter the nature of the
binding of a ligand.
42
Ø Catalytic Cycle
The principal physiological role of the P450 superfamily of enzymes is that of a
monoxygenase. The catalytic reaction can be summarised as follows
RH + O2 + 2H+ + 2e - ROH + H2O (1.4)
where RH can be one of a large number of possible substrates.
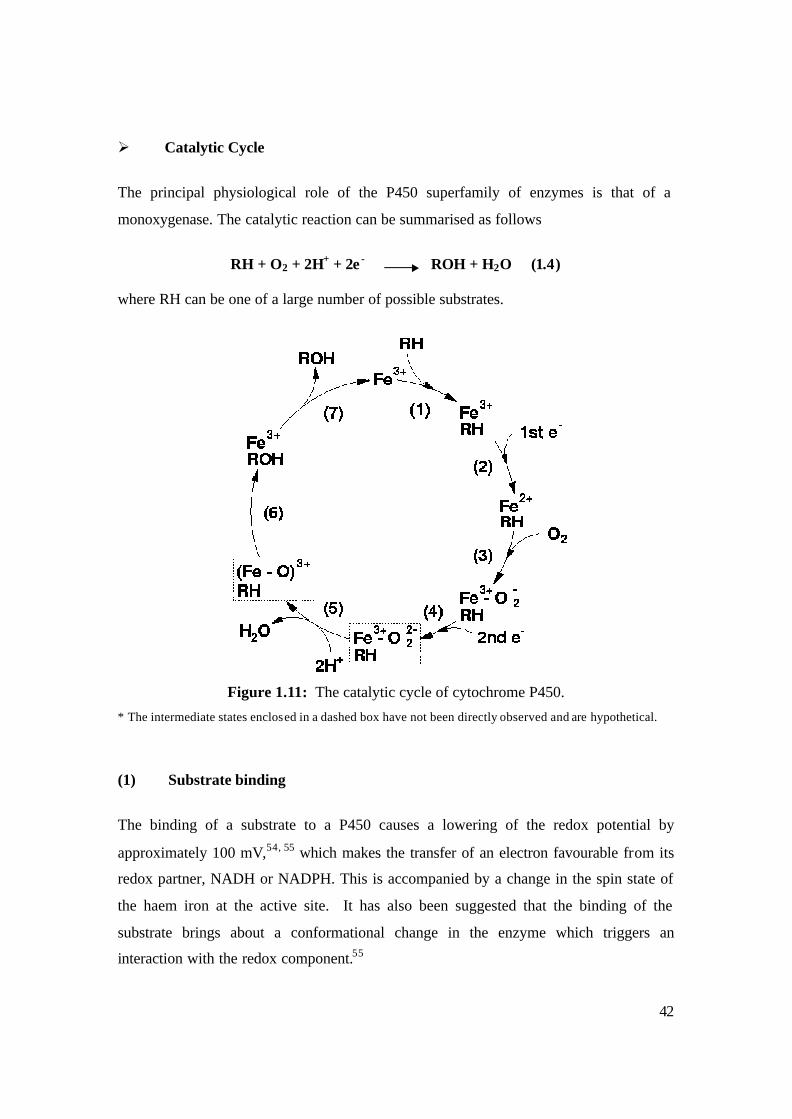
Figure 1.11: The catalytic cycle of cytochrome P450.
* The intermediate states enclosed in a dashed box have not been directly observed and are hypothetical.
(1) Substrate binding
The binding of a substrate to a P450 causes a lowering of the redox potential by
approximately 100 mV,54, 55 which makes the transfer of an electron favourable from its
redox partner, NADH or NADPH. This is accompanied by a change in the spin state of
the haem iron at the active site. It has also been suggested that the binding of the
substrate brings about a conformational change in the enzyme which triggers an
interaction with the redox component.55
43
(2) The first reduction
The next stage in the cycle is the reduction of the FeIII ion by an electron transferred from
NAD(P)H via an electron transfer chain.
(3) Oxygen binding
An O2 molecule binds rapidly to the FeII ion forming FeII + O2. There is evidence to
suggest that this complex then undergoes a slow conversion to a more stable complex
FeIII – O2-.56 A comparison between the bond energies of O2, O2
-, and O22- suggest that
the FeIII–O22- complex is the most favourable starting point for the next stage of the
reaction to occur.57
(4) Second reduction
A second reduction is required by the stoichiometry of the reaction. This has been
determined to be the rate-determining step of the reaction.58 However, evidence from
resonance Raman spectroscopy indicates the presence of a superoxide (O2-) complex.59
There is evidence to suggest that this complex then undergoes a slow conversion to a
more stable complex FeIII – O22-.56
(5) O2 Cleavage
The O22- reacts with two protons from the surrounding solvent, breaking the O-O bond,
forming water and leaving an (Fe-O)3+ complex.
(6) Product formation
The Fe-ligated O atom is transferred to the substrate forming a hydroxylated form of the
substrate.
(7) Product release
The product is released from the active site of the enzyme which returns to its initial
state.
44
The structures of the transitional states following processes (4) and (5) have never been
directly observed and are hypotheses based by analogy to other haemproteins and often
conflicting experimental evidence.
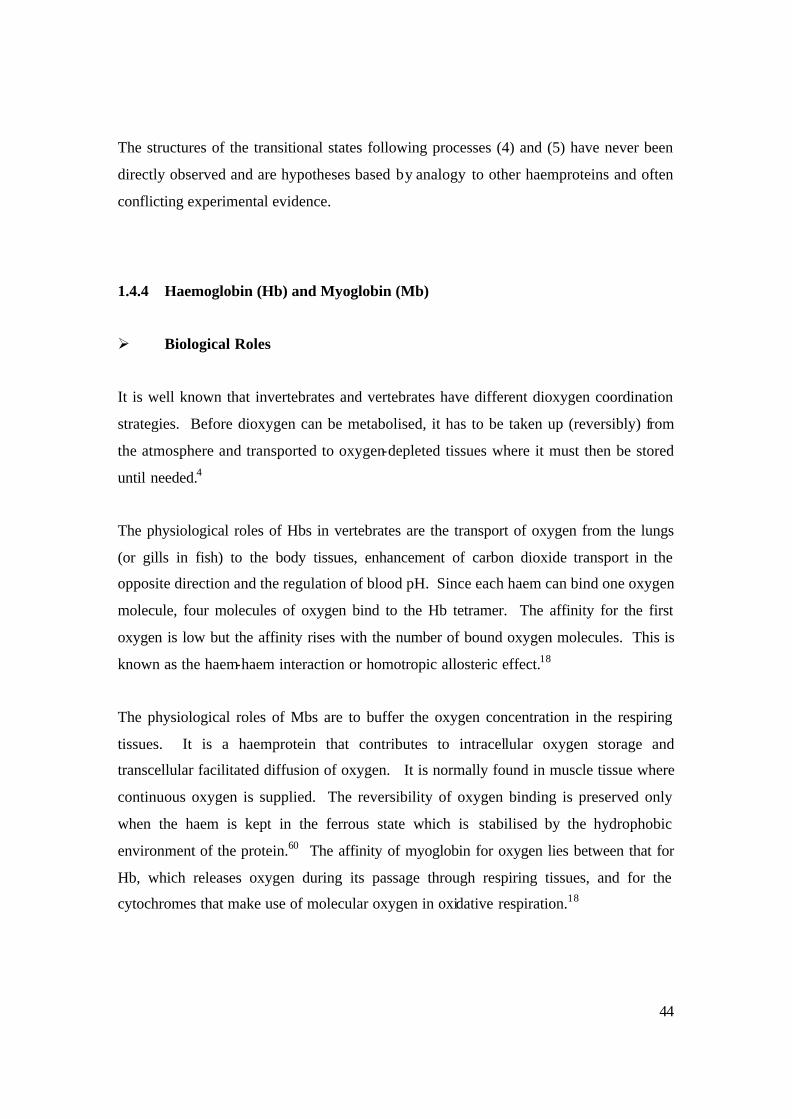
1.4.4 Haemoglobin (Hb) and Myoglobin (Mb)
Ø Biological Roles
It is well known that invertebrates and vertebrates have different dioxygen coordination
strategies. Before dioxygen can be metabolised, it has to be taken up (reversibly) from
the atmosphere and transported to oxygen-depleted tissues where it must then be stored
until needed.4
The physiological roles of Hbs in vertebrates are the transport of oxygen from the lungs
(or gills in fish) to the body tissues, enhancement of carbon dioxide transport in the
opposite direction and the regulation of blood pH. Since each haem can bind one oxygen
molecule, four molecules of oxygen bind to the Hb tetramer. The affinity for the first
oxygen is low but the affinity rises with the number of bound oxygen molecules. This is
known as the haem-haem interaction or homotropic allosteric effect.18
The physiological roles of Mbs are to buffer the oxygen concentration in the respiring
tissues. It is a haemprotein that contributes to intracellular oxygen storage and
transcellular facilitated diffusion of oxygen. It is normally found in muscle tissue where
continuous oxygen is supplied. The reversibility of oxygen binding is preserved only
when the haem is kept in the ferrous state which is stabilised by the hydrophobic
environment of the protein.60 The affinity of myoglobin for oxygen lies between that for
Hb, which releases oxygen during its passage through respiring tissues, and for the
cytochromes that make use of molecular oxygen in oxidative respiration.18
45
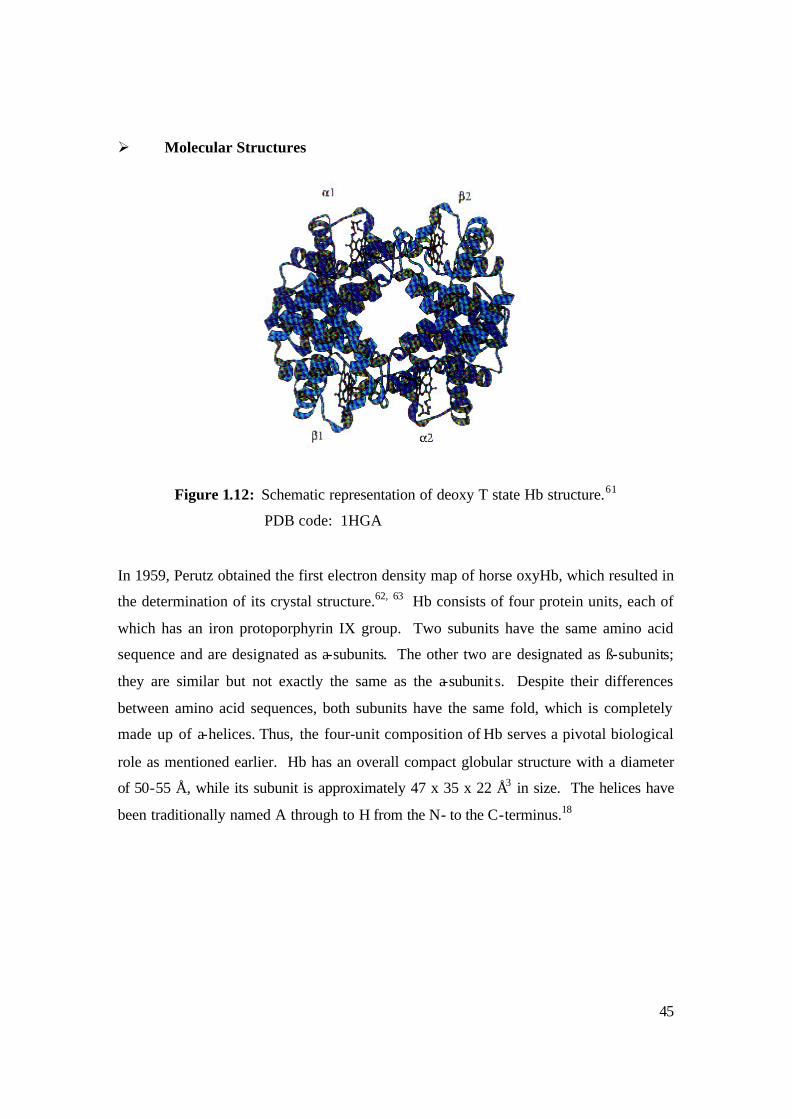
Ø Molecular Structures
Figure 1.12: Schematic representation of deoxy T state Hb structure.61
PDB code: 1HGA
In 1959, Perutz obtained the first electron density map of horse oxyHb, which resulted in
the determination of its crystal structure.62, 63 Hb consists of four protein units, each of
which has an iron protoporphyrin IX group. Two subunits have the same amino acid
sequence and are designated as a-subunits. The other two are designated as ß-subunits;
they are similar but not exactly the same as the a-subunit s. Despite their differences
between amino acid sequences, both subunits have the same fold, which is completely
made up of a-helices. Thus, the four-unit composition of Hb serves a pivotal biological
role as mentioned earlier. Hb has an overall compact globular structure with a diameter
of 50-55 Å, while its subunit is approximately 47 x 35 x 22 Å3 in size. The helices have
been traditionally named A through to H from the N- to the C-terminus.18

46
Figure 1.13: The overall structure of myoglobin.64
PDB code: 2MBW
In 1960, Sir John Kendrew and his co-workers published the first solved crystal structure
of Mb and consisted of a number of right-handed a-helices.65 It was the first protein
structure to be revealed at the atomic level. Mb consists of a single peptide chain
combined with an iron porphyrin. It comprises eight helices packed in the pattern tha t
leaves a pocket for haem. These helices are typically named from A to H. This helical
haem-binding domain is known as the globin fold. The tertiary structure of the protein is
kept intact by sulphide bridges, hydrogen bonds, van der Waals forces and ionic
interactions.66 The overall shape of the molecule is best described as an oblate ellipsoid
with dimensions 45 x 45 x 25 Å3.18
1.5 The Microperoxidases (MPs)
1.5.1 Background
One of the greatest challenges facing bioinorganic chemists and biochemists is
explaining how the protein controls and modifies the basic properties of the active site to
give rise to such wide-ranging functions.67 One method of doing this is to compare the
properties of protein- free porphyrins and the haemproteins. However, with this approach
come two main complications. The first is solubility limitations, where porphyrins like
haemin have limited solubility in aqueous and neutral solutions68 and tend to aggregate in
47
aqueous alkaline solutions.69 Thus work had to be performed in non-aqueous solvents70-
73 and detergents74, 75 to ensure a monomeric system. These non-aqueous solvent
conditions for studying the physical and chemical properties of haemproteins are
inadequate and are not physiologically relevant. The second complication is that many
haemproteins possess either one or two histidine residues as axial ligands of the metal
ion; these include Hb, Mb, peroxidases and the different cytochromes c, b, f and
cytochrome c oxidase.67 The addition of ligands like imidazole and its derivatives to
solutions of iron porphyrins almost always results in the formation of the bis- imidazole
complex with only transient existence of the mono - imidazole species because of the
thermodynamic drive from HS to LS.76, 77
Thus, the need arose to synthesise model haemproteins whose iron porphyrin active site
incorporated the ligand combination found in the protein itself. Various model
haempeptides with a variety of axial ligands were synthesised. These include (i)
haempeptides prepared by adding small mono-, di-, and tri-peptide groups to the
propanoic acid side chains or other suitably functionalised groups of the porphyrin; (ii)
synthetic haempeptide fragments in which the invariant Cys14-X15-X16-Cys17-His18
sequence of the cytochrome c is attached to the haem periphery and (iii) the range of
haempeptide fragments that may be obtained by treating cytochrome c with suitable
proteolytic enzymes.67 The haempeptides in (ii) and (iii) incorporate a His residue as an
axial ligand, and therefore afford the possibility of mixed ligation of the haem iron (i.e.
the formation of the mono- and bis-complexes together).67 However, the flexible ligand-
bearing side-chains attached to the porphyrin periphery has the tendency to dimerise and
form higher aggregates in solution.78
1.5.2 Preparation of Microperoxidases
Microperoxidases (MPs) are haem-based minenzymes that form a new generation of
biomimics. They consist of a haem c cofactor covalently bound to an oligopeptide,
which contains histidine, the axial ligand to the haem iron. It is obtained by controlled
48
proteolytic digestion of horse heart cytochrome c. It is an appealing model for
mimicking the structure and the function of the active site of haem-containing enzymes
since it retains an axial histidine ligand.79 The haempeptides provide an opportunity for
exploring aspects of the fundamental chemistry of an iron(III) porphyrin in which one of
the axial coordination sites of the metal ion is occupied by a His residue which is from
the parent protein and the other position contains a readily replaceable water molecule.67
This provides an opportunity for quantitatively studying in aqueous solution the
coordination chemistry of an iron porphyrin with a single accessible coordination site.80
Like many iron porphyrins, microperoxidase-8 is monomeric only at very low
concentrations in aqueous solution.81, 82
Although MP8 is commercially available, it is expensive. The hydrolysis of cytochrome
c was historically performed to help determine the structure of the parent protein.83-85
The first haempeptides that were isolated MP11 (residues 11-21), MP9 (residues 14-22)
and MP10 (residues 13-22).85-87 Further proteolysis resulted in the formation of MP8
(residues 14-21) and MP6 (residues 14-19).88, 89 The peptides are usually prepared by
digestion of ferric cytochrome c with appropriate enzymes (in this project for the
preparation of MP8, the enzymes trypsin and pepsin were used). This is then followed by
size-exclusion or ion exchange chromatographic techniques to separate the different MPs
(in this project we separated the different MPs using a Sephadex G-50 size exclusion
column). Analytical high performance liquid chromatography (HPLC) can be used to
purify MP preparations effectively. The products can be characterised or identified using
a multitude of characterization techniques including amino acid analysis90, FAB-MS,
liquid secondary ion mass spectrometry91, UV-vis spectrophotometry67 and NMR.92
Recently, there has been a considerable amount of work and development in the area of
biomimetic models for haemproteins. Most of the chemical and biochemical models
show catalytic activities closely related to the activities of the proteins they mimic. Thus,
metalloporphyrin models can act as oxygen binding and/or oxygen transport molecules;
they can transfer electrons, and also catalyse peroxidase and/or monoxygenase
49
reactions.80 The biomimetic modelling approach is the key to unlocking many facts and
theories that scientists dealing with proteins have encountered through the decades.
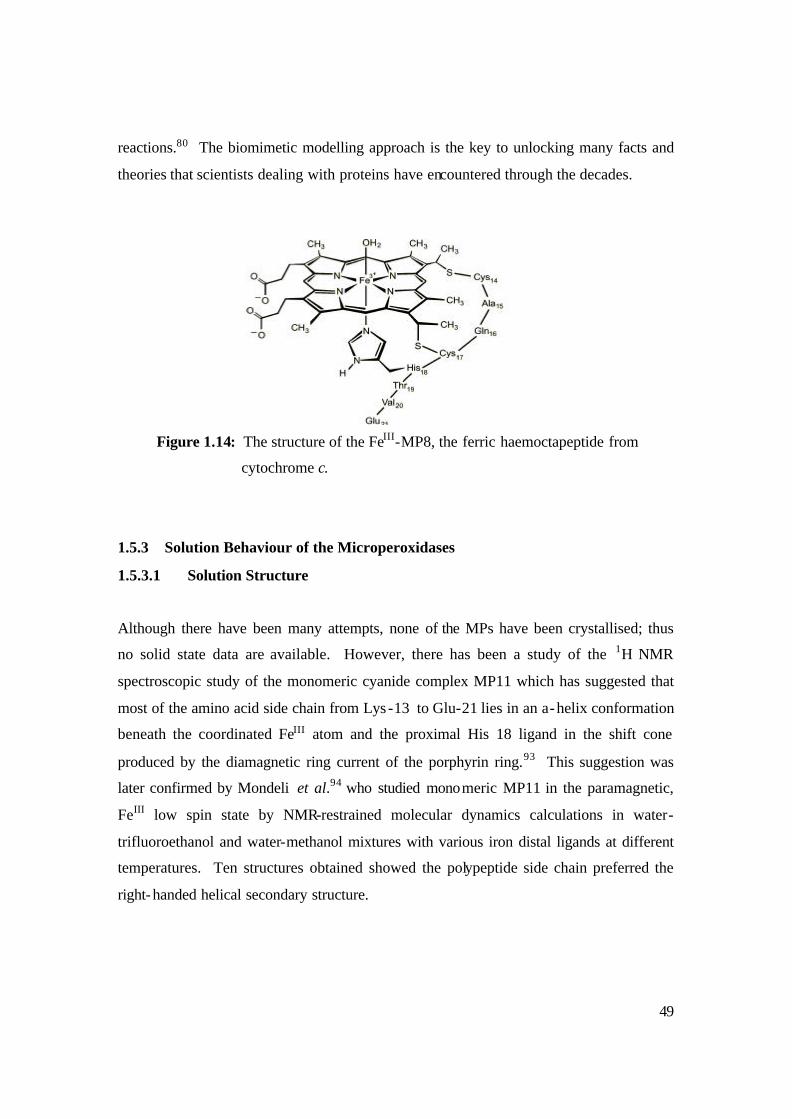
Figure 1.14: The structure of the FeIII-MP8, the ferric haemoctapeptide from
cytochrome c.
1.5.3 Solution Behaviour of the Microperoxidases
1.5.3.1 Solution Structure
Although there have been many attempts, none of the MPs have been crystallised; thus
no solid state data are available. However, there has been a study of the 1H NMR
spectroscopic study of the monomeric cyanide complex MP11 which has suggested that
most of the amino acid side chain from Lys -13 to Glu-21 lies in an a-helix conformation
beneath the coordinated FeIII atom and the proximal His 18 ligand in the shift cone
produced by the diamagnetic ring current of the porphyrin ring.93 This suggestion was
later confirmed by Mondeli et al.94 who studied monomeric MP11 in the paramagnetic,
FeIII low spin state by NMR-restrained molecular dynamics calculations in water-
trifluoroethanol and water-methanol mixtures with various iron distal ligands at different
temperatures. Ten structures obtained showed the polypeptide side chain preferred the
right-handed helical secondary structure.
50
In another study involving MP11 it was found that at low pH, His-18 becomes protonated
and does not coordinate FeIII. As the solution pH is raised His-18 is deprotonated and
coordinates FeIII with a pKa of 3.4 at 25 °C.95 In addition to this a second pKa of 5.8 was
found in the acid region which was attributed to the deprotonation and intermolecular
coordination of either the a-NH2 group of Val-11 or the e-NH2 group of Lys-13.95
However, more recently there were three pKas observed in the acidic region and the
neutral region for MP11 at 3.4, 5.8 and 7.6 at 20 °C, and attributed to the deprotonation
and intermolecular coordination of His-18, to the deprotonation and intermolecular
coordination of a-NH2 group of Val-11 and to the deprotonation and intermolecular
coordination of the e-NH2 group of Lys-13, respectively.96
Most studies reported on MP11 reveal a severe problem due to intermolecular
coordination and aggregation of the haempeptide, and compromised the findings.68
Similarly, physical studies on aqueous solutions of MP8 show its behaviour is also
complicated by the aggregation phenomena and the solutions of MP8 have been found to
deviate from Beer’s Law as a result of dimerisation at concentrations as low as 2 µM at
pH 7.00 at 25 °C91; since the intensity of the Qv band at 494 nm in the visible region of
the electronic spectra increased at the expense of the charge-transfer band at 622 nm,
which is indicative of the conversion of the high-spin aqua complex to the low spin
species, thus is was concluded that dimerisation by intermolecular coordination of a -NH2
group of the Cys-14 was likely. Supporting this evidence were the results obtained by
Urry and Pettegrew97 who used optical rotary dispersion (ORD), circular dichroism (CD),
and difference absorption spectroscopy with a range of solutions of MP8. It was found
that dimerisation of MP8 also involved p-p interactions between the haem groups.
1.5.3.2 Aggregation in Aqueous Solution
In 1955, Ehrenberg et al. demonstrated that at pH 8.7 the haempeptides became
extensively aggregated with an apparent molecular weight of 10 000.88 These workers
also showed that at pH 2.3, no such aggregation occurred and proposed that this was due
51
to the intermolecular coordination of a-NH2 group of the terminal Val-11 residue.
Furthermore, the addition of exogenous ligands such as His, ammonia and imidazole,
which compete for the distal coordination site was shown to disperse the aggregation.88,89
Further evidence for pH dependant aggregation phenomena of MP11 was confirmed by
Harbury and Loach89, who demonstrated that the aggregation was concentration
dependent. The authors also discovered that the acetylation of Val-11 and the e-NH2
group of Lys-13 eliminated aggregation, which suggested that the observed aggregation
was due to intermolecular coordination of the amino groups of the peptide chains.88, 89
In addition, further evidence that aggregation of MP11 in aqueous solution occurs due to
intermolecular coordination of the free amino groups of the polypeptide chains was
provided by magnetic studies90, 98-101, which all show that Fe(III) is low spin above pH 6.
Aron et al.102 studied the aggregation of MP8 (due to the intermolecular coordination of
the N-terminal Cys-14 residue ) qualitatively in aqueous and aqueous methanolic solutions
at pH 7.00 and 12.00 by observing deviations from Beer’s Law that occurs in the
concentration of MP8 increased. The workers proposed that the deviations could be
accounted for by a simple equilib rium between two monomers and a dimer.102 Similar
results were obtained by Baldwin et al.103 who demonstrated that MP9 is monomeric in
50% aqueous methanol solution up to a concentration of 35 µM. It was thought that
aggregation of MP9 occurred due to intermolecular coordination of Lys-22 to the FeIII
centre of an adjacent molecule.104
It has well been established that the aggregation of MP8 and MP11 aqueous solutions
occur due to non-covalent p- interactions between the distal faces of two or more
haempeptides.97, 105 Urry and coworkers97, 105 studied this second form of aggregation by
means of optical rotation, CD and absorbance spectroscopy, and demonstrated that
aggregation could be minimised by both dilution of the haempeptide and by elevated
temperatures. It was suggested that dimerisation of MP11 proceeds through a head-to-
tail alignment of the haem planes, whereas dimerisation in MP8 was thought to be
through the stacking of haems.
52
1.5.3.3 Overcoming Aggregation
Monomerisation in aqueous solution may be achieved by using alcohols or detergents to
disperse aggregates, or simply by using microperoxidase solution concentrations < 2 µM.
Although these techniques are commonly used to ensure that MPs remain monomeric in
solution, these conditions are far from ideal.68 It has long since been established that rate
constants, equilibrium constants, and other physical parameters measured in mixed
solvent systems usually depend on the permittivity of the medium; thus it becomes more
difficult to compare the results of the model studies in mixed solvent systems with data
obtained on studies of haemproteins in aqueous solution. Furthermore, the low
concentrations required to ensure monomeric conditions limit physical studies to UV-vis
spectroscopy using long pathlength cells.68
In 1959, Harbury and Loach106 reported that the acetylation of the a-NH2 group of the
terminal Val-11 residue and e-NH2 group of Lys-13 minimised aggregation of MP11 in
aqueous solution. Further evidence that acetylation of MP8 prevents aggregation was
provided by the ESR data collected by Yang and Sauer.107 A further suggestion by Wang
and Wart108 suggested that acetylation prevents intermolecular coordination in their
studies of MP8 using optical and resonance Raman spectroscopy. However good the
above results, they failed to provide conclusive evidence that acetylation prevents
aggregation.
The most comprehensive study that showed definitive evidence that acetylation of the
Cys-12 of the a-amino group of MP8 prevents aggregation was provided in a detailed
solution chemistry study by Marques and Munro.109 Marques and co-workers
demonstrated that acetylated MP8 (N-AcMP8) remains monomeric in aqueous solution at
concentrations below 3 × 10⁻⁵ M, with a self-association constant an order of magnitude
lower than that for MP8,102 showing evidence that the N-acetyl protecting group
diminishes intermolecular coordination. These results are in agreement with those of
Wang et al.110 who reported tha t N-AcMP8 forms aggregates above concentrations of 1 ×
10-5 M.
53
1.5.4 Haempeptide Acid Dissociation Constants
It has been well established that for all haempeptides for which the solution chemistry has
been investigated there are corresponding pH dependant electronic spectra. 91 However,
in most cases the pKas associated with these spectral changes are complicated by
formation of aggregates. In the study carried out by Marques and Munro109 who
investigated the solution chemistry of N-AcMP8 as a monomeric aqueous solution, N-
AcMP8 was found to undergo six spectroscopically observed pH dependant transitions.
The authors suggested that the first transition (pKa = 2.1) is due to the deprotonation of
the c-terminal carboxylic group, which subsequently displaces the proximal H2O ligand
of the bis-aqua complex. Furthermore, it is reported that the electronic spectra of these
two species show that both are predominantly high spin. The second transition occurs
when the pH is raised above 3.21, and is attributed to the deprotonation of the His-18
with subsequent binding to the lower axial coordination site of the ferric centre. The
electronic spectra of the third species suggest that it is predominantly high spin, but also
has some low spin character. The third and fourth pKas at 4.95 and 6.1, respectively, are
thought to be due to the deprotonation of the two propionic acid groups, with the first
also corresponding to the ionisation of the c-terminal carboxylic acid group of the peptide
chain. It is however probable that these two processes are closely overlapped and not
completely resolved. The pKa at 9.59 is attributed to ionisation of the water molecule
occupying the distal position, and the final pKa at 12.71 corresponds to the deprotonation
of the bound His-18 forming the histidinate complex (His-Fe(III)-OH-). The electronic
spectra show that Fe(III) in N-AcMP8 is predominantly in the S = 5/2 state at pH 7, while
the hydroxo complex at pH 10.5 is an equilibrium mixture of the S = 5/2 and S = ½ states.
Above pH 12.71, the ferric ion is predominantly in the low spin state.
1.5.5 Ligand Binding Studies of Microperoxidases
There have been many studies aimed at understanding the chemistry that occurs at the
active site of haemproteins, and to elucidate the effect of the protein on the chemistry of
the prosthetic group, a wide range of ligand binding studies have been performed on both
54
the native haemproteins and their corresponding model compounds. By comparing the
formation constants of a given ligand by a haemprotein and by a MP, it provides vital
information about the effect of the protein on the ligand binding properties of the iron
porphyrin.91 The model compound, in this case MP, serves as useful tool for the
prosthetic group of haemproteins such as haemoglobin, myoglobin and the peroxidases.
However, these model compounds have to be monomeric in solution. In these systems,
the lower distal His-18 ligand is retained as part of the amino acid side chain and the
upper axial ligand is a readily replaceable water molecule. This makes it possible for a
ligand substitution to be investigated for a wide variety of exogenous ligands. This
process is defined by Equation 1.5:
His-Fe-H2O + L His-Fe-L + H2O (1.5)
K = [His-Fe-L] / [His-Fe-H2O][L]
The nature of the distal ligand in haemproteins and MPs determines the spin states of the
complexes. Ligands that produce predominantly low spin complexes includes cyanide 100, 107, 111, 112 , imidazole and its derivatives100, 107, 110, 111, 113 -115, and pyridine and its
derivatives 82, 116. Weaker field ligands such as azide107, 111, 117, 118, and sulphite114 produce
complexes that are in spin equilibrium. Predominantly high spin complexes are formed
with weak field ligands such as cyanate119 and fluoride100, 107, 118 anions. Table 1.4 shows
a comparison of equilibrium constants for various ligands coordinated by MP8 and
various haemproteins. Krel, which is defined a Khaemprotein/KMP8, is generally much larger
for the anionic ligands than for neutral ones. The distal environments of most
haemoglobins and myoglobins contain the side chains of Val, Phe, and the distal His.
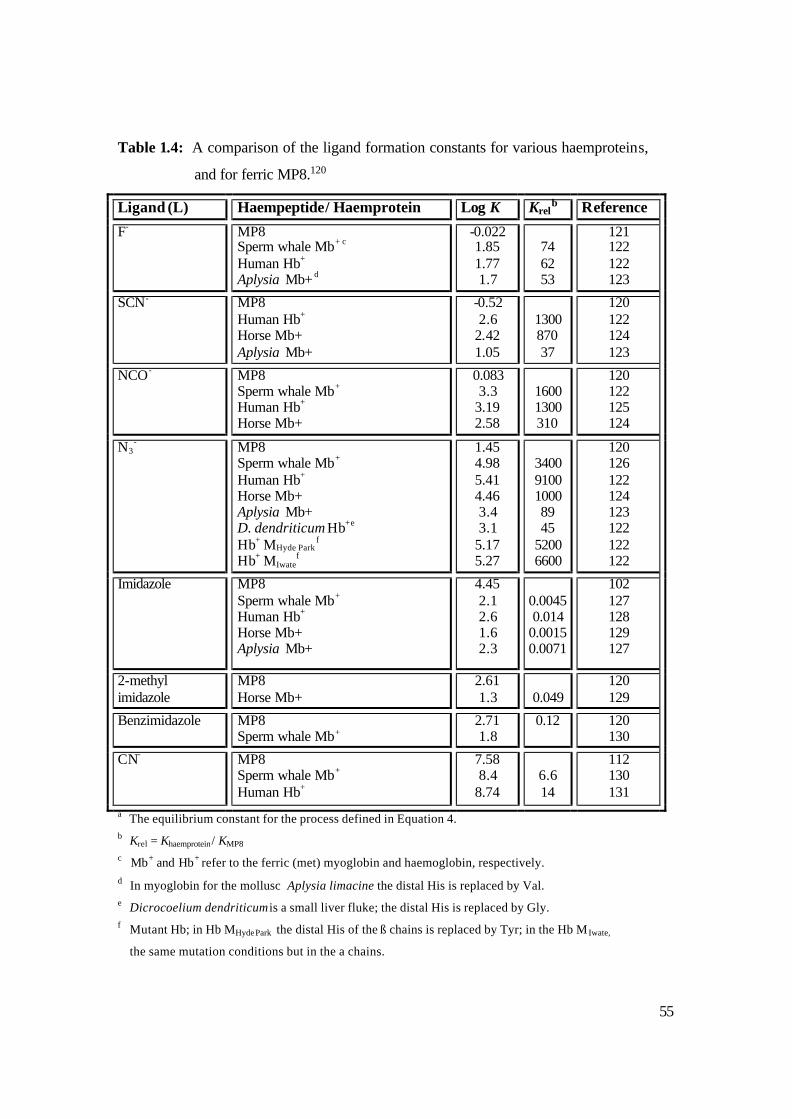
55
Table 1.4: A comparison of the ligand formation constants for various haemproteins,
and for ferric MP8.120
Ligand (L) Haempeptide/ Haemprotein Log K Krelb Reference
F- MP8 Sperm whale Mb+ c Human Hb+ Aplysia Mb+ d
-0.022 1.85 1.77 1.7
74 62 53
121 122 122 123
SCN- MP8 Human Hb+ Horse Mb+ Aplysia Mb+
-0.52 2.6
2.42 1.05
1300 870 37
120 122 124 123
NCO- MP8 Sperm whale Mb+ Human Hb+ Horse Mb+
0.083 3.3
3.19 2.58
1600 1300 310
120 122 125 124
N3- MP8
Sperm whale Mb+ Human Hb+ Horse Mb+ Aplysia Mb+ D. dendriticum Hb+ e
Hb+ MHyde Parkf
Hb+ MIwatef
1.45 4.98 5.41 4.46 3.4 3.1
5.17 5.27
3400 9100 1000 89 45
5200 6600
120 126 122 124 123 122 122 122
Imidazole MP8 Sperm whale Mb+ Human Hb+ Horse Mb+ Aplysia Mb+
4.45 2.1 2.6 1.6 2.3
0.0045 0.014
0.0015 0.0071
102 127 128 129 127
2-methyl imidazole
MP8 Horse Mb+
2.61 1.3
0.049
120 129
Benzimidazole MP8 Sperm whale Mb+
2.71 1.8
0.12 120 130
CN- MP8 Sperm whale Mb+ Human Hb+
7.58 8.4
8.74
6.6 14
112 130 131
a The equilibrium constant for the process defined in Equation 4. b Krel = Khaemprotein/ KMP8 c Mb+ and Hb+ refer to the ferric (met) myoglobin and haemoglobin, respectively. d In myoglobin for the mollusc Aplysia limacine the distal His is replaced by Val. e Dicrocoelium dendriticum is a small liver fluke; the distal His is replaced by Gly. f Mutant Hb; in Hb MHyde Park the distal His of the ß chains is replaced by Tyr; in the Hb M Iwate,
the same mutation conditions but in the a chains.
56
1.5.6 Demetalation of Haempeptides
In order to gain new insights into the structure and function of metalloproteins, the iron in
the iron porphyrins has been substituted with other metals. Iron has been substituted with
manganese in MP8.79, 80 In other studies iron has been substituted with copper, zinc,
manganese, nickel and cobalt in cytochrome c.132 There are three methods of iron
abstraction that have been reported. The first method involves removing the entire haem
moiety from the polypeptide chain and substituting it by another porphyrin containing the
desired metal.133 This route is both complicated and quite involved, with many steps.
The second method involves the removal of iron by treatment with hydrogen fluoride at
temperatures below 0 oC.80, 132 This path is hazardous and not user friendly as it involves
the use of hydrogen fluoride. The final and much safer method which was adopted
involved the removal of iron by reductive demetalation reported by Primus et al.79 In the
project the insertion of the cobalt ion is accomplished by refluxing the free base (metal-
free MP8) with cobaltous acetate which is followed by oxidation in air.
1.6 Cobalt Corrinoids : Basic Structure
Much of the chemistry discussed in this project revolves around the unique nature of the
corrin ring and why life has preserved this apparently evolutionary antique. The
corrinoids are a group of compounds containing four reduced pyrrole rings joined into a
macrocyclic ring by links between their a positions; three of these links are formed by a
one-carbon unit (methylidyne radicals) and the other by a direct (Ca-Ca bond). They
include various B12 vitamins, factors and derivatives based upon the corrin skeleton,
C19H22N4.134
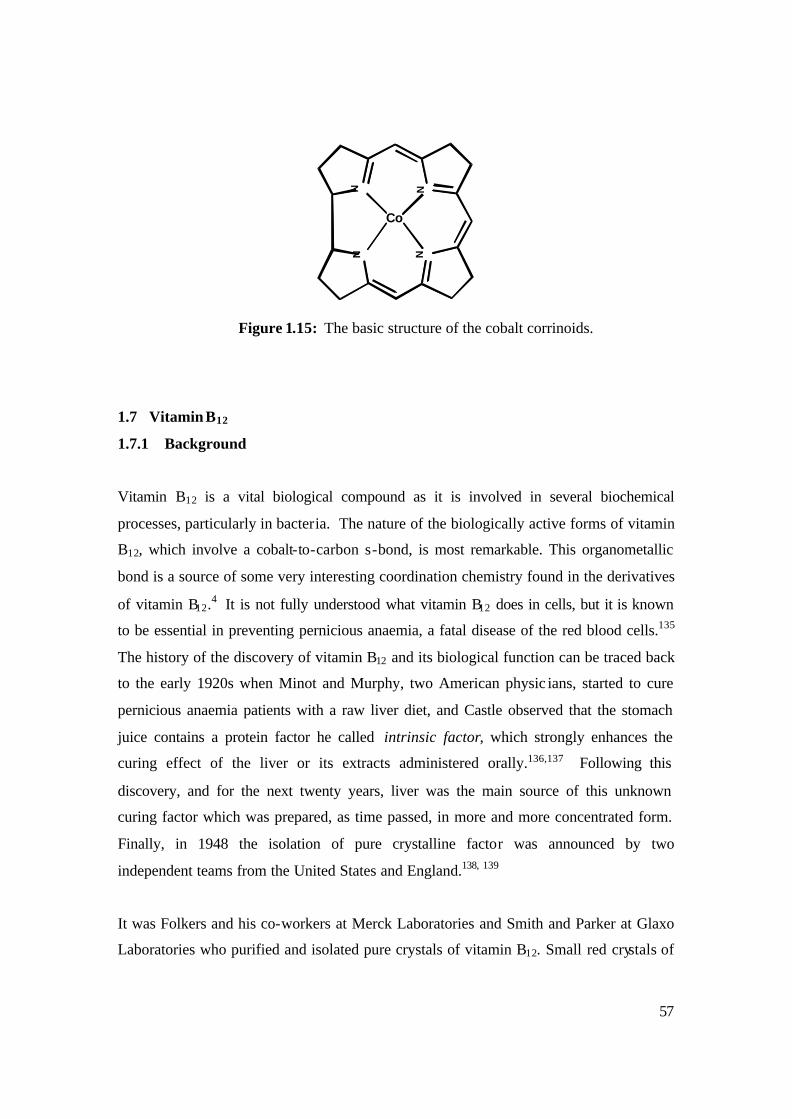
57
NN N
N
Co
Figure 1.15: The basic structure of the cobalt corrinoids.
1.7 Vitamin B12
1.7.1 Background
Vitamin B12 is a vital biological compound as it is involved in several biochemical
processes, particularly in bacteria. The nature of the biologically active forms of vitamin
B12, which involve a cobalt-to-carbon s-bond, is most remarkable. This organometallic
bond is a source of some very interesting coordination chemistry found in the derivatives
of vitamin B12.4 It is not fully understood what vitamin B12 does in cells, but it is known
to be essential in preventing pernicious anaemia, a fatal disease of the red blood cells.135
The history of the discovery of vitamin B12 and its biological function can be traced back
to the early 1920s when Minot and Murphy, two American physic ians, started to cure
pernicious anaemia patients with a raw liver diet, and Castle observed that the stomach
juice contains a protein factor he called intrinsic factor, which strongly enhances the
curing effect of the liver or its extracts administered orally.136,137 Following this
discovery, and for the next twenty years, liver was the main source of this unknown
curing factor which was prepared, as time passed, in more and more concentrated form.
Finally, in 1948 the isolation of pure crystalline factor was announced by two
independent teams from the United States and England.138, 139
It was Folkers and his co-workers at Merck Laboratories and Smith and Parker at Glaxo
Laboratories who purified and isolated pure crystals of vitamin B12. Small red crystals of
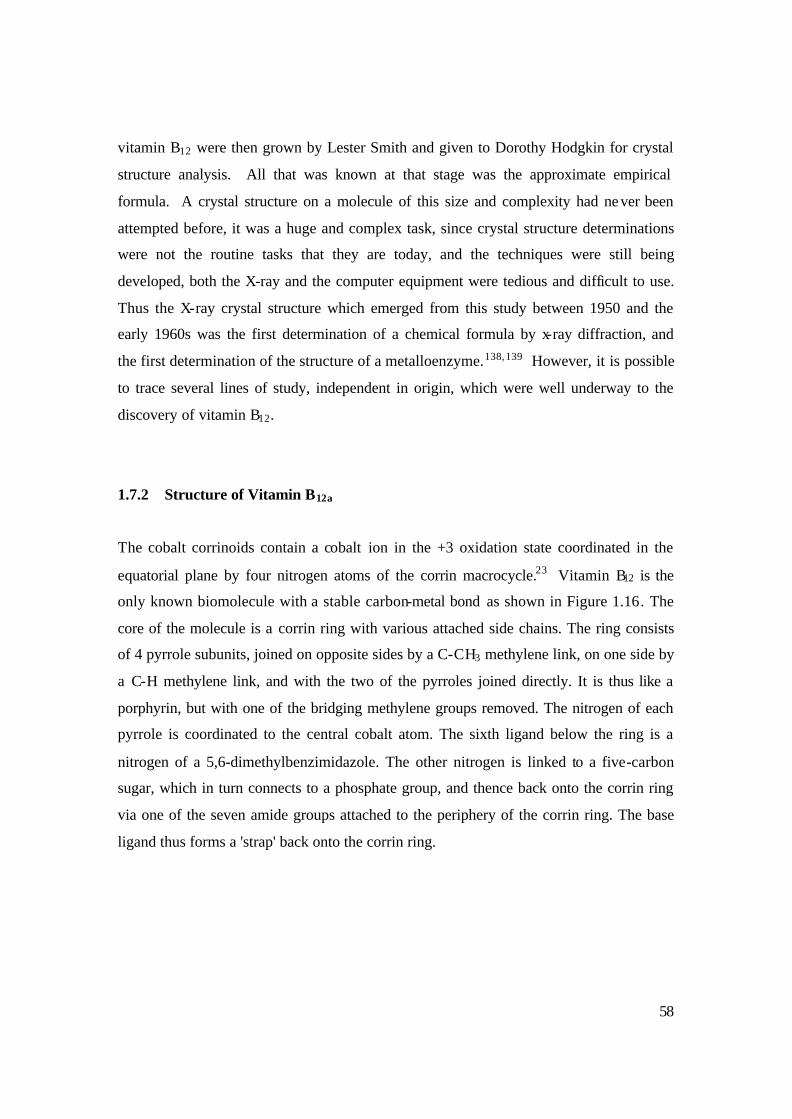
58
vitamin B12 were then grown by Lester Smith and given to Dorothy Hodgkin for crystal
structure analysis. All that was known at that stage was the approximate empirical
formula. A crystal structure on a molecule of this size and complexity had never been
attempted before, it was a huge and complex task, since crystal structure determinations
were not the routine tasks that they are today, and the techniques were still being
developed, both the X-ray and the computer equipment were tedious and difficult to use.
Thus the X-ray crystal structure which emerged from this study between 1950 and the
early 1960s was the first determination of a chemical formula by x-ray diffraction, and
the first determination of the structure of a metalloenzyme.138, 139 However, it is possible
to trace several lines of study, independent in origin, which were well underway to the
discovery of vitamin B12.
1.7.2 Structure of Vitamin B12a
The cobalt corrinoids contain a cobalt ion in the +3 oxidation state coordinated in the
equatorial plane by four nitrogen atoms of the corrin macrocycle.23 Vitamin B12 is the
only known biomolecule with a stable carbon-metal bond as shown in Figure 1.16. The
core of the molecule is a corrin ring with various attached side chains. The ring consists
of 4 pyrrole subunits, joined on opposite sides by a C-CH3 methylene link, on one side by
a C-H methylene link, and with the two of the pyrroles joined directly. It is thus like a
porphyrin, but with one of the bridging methylene groups removed. The nitrogen of each
pyrrole is coordinated to the central cobalt atom. The sixth ligand below the ring is a
nitrogen of a 5,6-dimethylbenzimidazole. The other nitrogen is linked to a five-carbon
sugar, which in turn connects to a phosphate group, and thence back onto the corrin ring
via one of the seven amide groups attached to the periphery of the corrin ring. The base
ligand thus forms a 'strap' back onto the corrin ring.
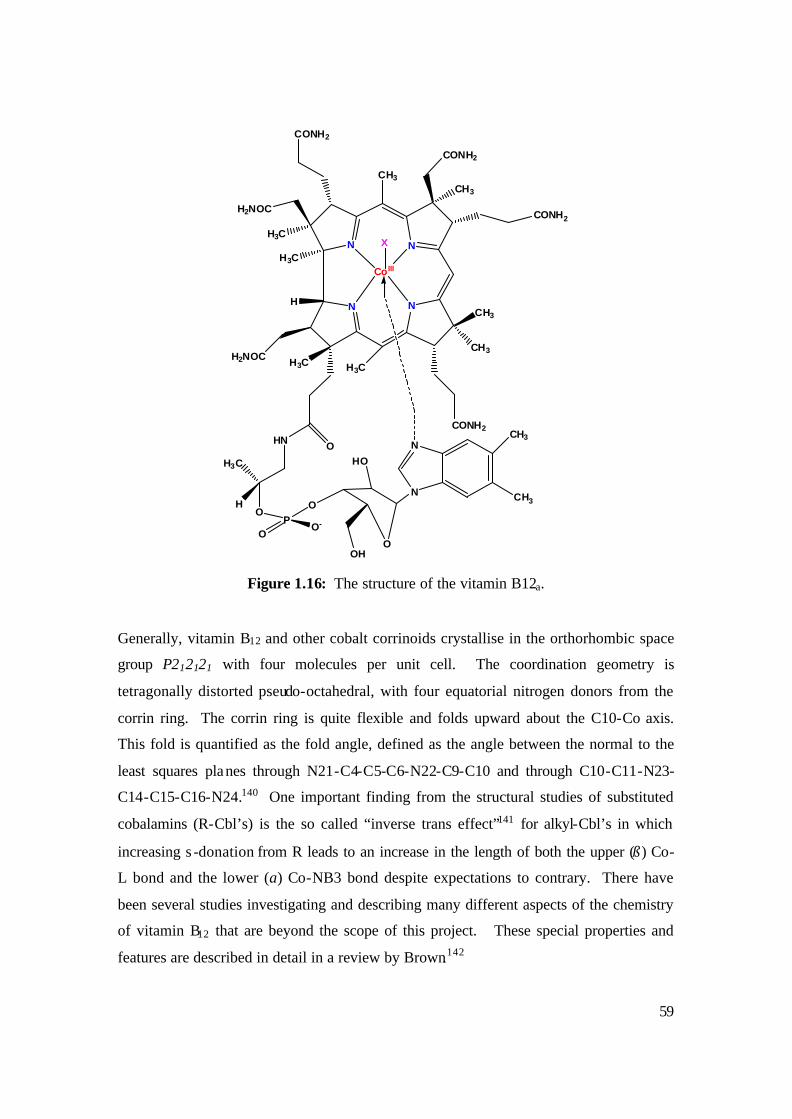
59
Figure 1.16: The structure of the vitamin B12a.
Generally, vitamin B12 and other cobalt corrinoids crystallise in the orthorhombic space
group P212121 with four molecules per unit cell. The coordination geometry is
tetragonally distorted pseudo-octahedral, with four equatorial nitrogen donors from the
corrin ring. The corrin ring is quite flexible and folds upward about the C10-Co axis.
This fold is quantified as the fold angle, defined as the angle between the normal to the
least squares planes through N21-C4-C5-C6-N22-C9-C10 and through C10-C11-N23-
C14-C15-C16-N24.140 One important finding from the structural studies of substituted
cobalamins (R-Cbl’s) is the so called “inverse trans effect”141 for alkyl-Cbl’s in which
increasing s -donation from R leads to an increase in the length of both the upper (ß) Co-
L bond and the lower (a) Co-NB3 bond despite expectations to contrary. There have
been several studies investigating and describing many different aspects of the chemistry
of vitamin B12 that are beyond the scope of this project. These special properties and
features are described in detail in a review by Brown.142
N
N N
N
Co III
CONH2
CH3
CH3
CH3
H3C
H3C
H3C
H
CH3
CONH2
CONH2
X
OHN
CONH2
H2NOC
H3C
HO
PO
O-
O
OOH
HO
N
N
CH3
CH3
H3CH2NOC
60
1.7.3 Chemistry of Vitamin B12 and its derivatives:
Ligand Substitution and Kinetic Studies
The inorganic chemistry of the cobalt corrinoids (derivatives of vitamin B12) is vital for
mankind’s existence and therefore attracts much attention. The kinetics of the reactions
of aquacobalamin (vitamin B12a) with imidazole, 4(5)-methyl imidazole, 2-methyl
imidazole, imidazole 4(5)- lactic acid, histamine and histidine were studied as a function
of pH at 25 oC, 1.0 M ionic strength (KCl) by UV-Vis spectrophotometry. 143 It was
found experimentally that the 2-methyl imidazole and the analogous 4-substituted
tautomers of asymmetrically substituted imidazoles, compared to imidazoles where
tautomerism was impossible (1-methyl imidazole, 1,5-dimethyl imidazole),
inconsequential (imidazole), or where the 5-substituted tautomer was the greatly
predominant species in solution (neutral histamine, anionic histidine), replaced H2O
insignificantly slowly due to the steric repulsion between the annular substituents and the
corrin ring. Thus it was concluded that the rate of substitution of H2O varies linearly
with the pKa of the incoming ligand. The positive deviation of imidazole itself from this
series was attributed to the possibility of its reaction through two annular coordination
sites. On the other hand, the negative deviation of 4(5)- lactic acid, cationic histamine and
neutral histidine from the linear relationship was attributed to the presence of two
tautomeric forms in solution and this provided the means of finding the equilibrium
constant, KT , for interconversion between these species.143
The thermodynamics of the coordination of imidazole and its derivatives by
aquacobalamin were also investigated.144 From the fits of the relevant equations to the
experimental data and from direct spectrophotometric titrations, it was shown that
coordination decreases the pKa of the imino group of the imidazoles from >14 to 10 due
to the polarization by the metal ion. Also, the pKas of the pendant amino acids of the
histamine and histidine decreased from 9.96 and 9.18 to 8.89 and 7.99, respectively, on
coordination. This was attributed to the destabilization of the conjugate acids by
coulombic repulsion with the residual charge at the metal centre.144
61
In another study, the activation parameters for the reaction of aquacobalamin with small
anionic and neutral ligands were determined.145 From the temperature dependence of the
rate constants, activation enthalpies and entropies were determined for the reaction of
aquacobalamin with SCN-, S2O32-, NO2
- and HSO3-. These parameters, as well as those
determined previously for CN-, HCN-, N3- and HN3, demonstrated that there are very
small differences that exist between most small anionic and neutral ligands in their
reaction with B12a. There were also exceptions, though; CN- and SO32- had small and
large values for ?H‡ and ?S‡, respectively. These effects were attributed to a possible
nucleophilic participation of these ligands in the transition state of the reaction. 145
Ligand substitution reactions of aquacobalamin with primary amines have also been
investigated.146 Enthalpies and entropies of activation were determined from the
temperature variation of the spectrophotometrically determined pH-independent rate
constants for the reaction of nine neutral primary amines with aquacobalamin in aqueous
solution. There were compensating changes in ?H‡ and ?S‡ for this series of ligands,
with ? H‡ decreasing from approximately 81 to 58 kJ mol-1 as ?S‡ decreased in parallel
from approximately 46 to -46 J K-1mol-1. It was also reported that there was no isokinetic
relationship for the series. Plots of ?H‡ and ?S‡ against pKa revealed that the ligands fall
into two distinct classes. Ligands in the first class have significantly larger ?H‡ and ?S‡
values than those in the second class. This was ascribed to ligands in the second class
interacting by hydrogen bonding to the acetamide side chains of the corrin ring thus
allowing their amino groups to be favorably orientated for interaction with the metal
ion.146
The rate determining step (RDS) for a purely dissociative process is the first step. Thus
the overall rate of the reaction should be sensitive to the nature of the leaving group (X),
but insensitive to the entering group (Y). Neither purely associative nor dissociative
mechanisms are generally found. The difference between Ia and Id is the degree of bond
formation to the entering ligand, Y. If bond making is more important in transition state 2
then the mechanism is Ia. Conversely, if bond breaking is more important then the
mechanism is Id.147
62
The kinetics of the reaction of aquacobalamin with azide anion and hydrazoic acid,
producing azidocobalamin, was investigated as a function of ligand concentration, pH,
temperature and pressure, by stopped-flow spectrophotometry.19 The pH dependant rate
constants and activation parameters were determined. However, after a concerted effort
to try and explain the data obtained, it was not possible to distinguish between a limited
dissociative and a dissociative interchange mechanism.148
The kinetics of the reaction of aquacobalamin with N-donor ligands, glycine and methyl
glycinate were investigated as a function of ligand concentration, pH and temperature at
constant ionic strength by conventional and stopped-flow spectrophotometry.149 The pH
profile for the reaction with glycine was bell-shaped; this demonstrated that B12a reacts
only with deprotonated ligand and that hydroxocobalamin is kinetically inert. At 25 oC, it
was reported that the ligands react at about the same rate, but the enthalpies and entropies
of activation determined for glycine and methyl glycinate showed that this was
coincidental and due to a compensating change in the two parameters.149
The kinetics of substitution of bound H2O in aquacobalamin by six different ligands,
namely hydroxylamine, methyl glycinate, pyridine, 4-methylpyridine, imidazole and
histamine were investigated as a function of ligand concentration and temperature by
stopped-flow spectrophotometry at constant ionic strength and pH.150 In all six cases the
observed pseudo-first-order rate constants for the ionization of bound H2O in B12a showed
saturation at high ligand concentrations after correcting for the protonation of the N-
donor ligand. It was shown that there was a compensating change in the ?H‡ and ?S‡
values of the saturating rate constant, ksat, but there was no general isokinetic relationship
for the ligands. It was concluded that the dependence of the value of the saturating rate
constant ksat, and specifically, the dependence of ?H‡ and ?S‡ for this rate constant, on the
entering ligand indicated that the rate-limiting step in the reaction was not unimolecular
release of H2O from B12a. The results were interpreted in terms of a dissociative
interchange mechanism with the nucleophilic participation of the ligand in the transition
state. The compensating effect was then explained on the basis of the extent of bond
formation between Co and the ligand in the transition state. Molecular mechanics
63
techniques and molecular volume calculations were used to show that the steric bulk of
ligands played an important role in controlling its rate of reaction at the metal centre.150
The position of hydroxide in the thermodynamic trans influence order of the cobalt
corrinoids were investigated.151 Diaquacobinamide (DAC) was prepared by reduction of
aquacyanocobinamide with zinc and oxidation using aqueous HCl. The macroscopic acid
dissociation constants pKCo1 and pKCo2 for coordinated H2O in DAC were found
spectrophotometrically to be 5.91 ± 0.04 and 10.30 ± 0.24 at 25 oC; from their
temperature dependence it was found that ?H = 45 ± 4 and 27 ± 2 kJ mol-1, and ?S = 40 ±
14 and –109 ± 8 J K -1 mol-1, for pKCo1 and pKCo2, respectively. The equilibrium constants
for the reaction of cobinamide with cyanide were determined in the pH range 8-12 at 25 oC, µ = 1.0 M (NaClO4). It was reported that two CN- ligands bind to
aquahydroxocobinamide and the pH dependence of the observed equilibrium constants
could be accounted for on the assumption that both dihydroxocobinamide and
hydroxocyanoamide were inert, while the equilibrium constants for the reaction of the
labile species aquahydroxocobamide and aquacyanocobamide with HCN were small
compared to those for the reaction with CN- anion. A fit of the data showed that the
macroscopic equilibrium constant, log ß2, for the reaction of 2 CN- with the two
diastereomers of aquahydroxocobinamide to produce dicyanocobiamide is 19.0 ± 0.1.
Thus the macroscopic log K for the binding of CN- to the two diastereomers of
aquahydroxocobinamide was 11 since log K for the binding of CN- to
aquacyanocobamide is 8. The equilibrium constants for the binding of azide, pyridine, N-
methylimidazole and 3-amino-1-propanol to aquahydroxocobinamide were determined at
25 oC, µ = 1.0 M (NaClO 4), pH 12. In these cases only a single ligand was bound; the
macroscopic log K values were N-methylimidazole, 6.06 ± 0.04; 3-amino-1-propanol,
4.66±0.04; pyridine, 4.19 ± 0.01; and azide, 3.45 ± 0.04. A comparison of these results
with others available showed that hydroxide was above water and 5,6-
dimethylbenzimidazole, but below cyanide, sulfite and alkyl ligands in the trans
influence order of the cobalt corrinoids.151
The kinetics of substitution of bound H2O in aquahydroxocobinamide by cyanide, azide,
pyridine and N-methylimidazole were investigated as a function of ligand concentration
64
and temperature by stopped- flow spectrophotometry at pH 12.0.152 The observed pseudo-
first-order rate constants showed the onset of saturation with ligand concentration for all
ligands. The relative insensitivity of rate on the identity of the incoming ligand suggests a
dissociative intimate mechanism. Furthermore, the observation that the saturation rate
constant, ksat (and the activation parameters ? H‡ and ?S‡ ), depended on the identity of the
ligands indicated that the incoming ligand participates in the transition state. This
allowed the mechanism of the reaction to be identified as a dissociative interchange.152
Further evidence for a dissociation interchange mechanism and factors controlling
reaction rates in ligand substitution reactions of aquacobalamin were determined.153 The
substitution of H2O in aquacobalamin by the anionic ligands I-, S2O32-, NO2
-, SCN - and
N3- were determined as a function of ligand concentration and temperature by stopped-
flow spectrophotometry at constant ionic strength and pH. The observed pseudo-first-
order rate constants saturated to a limiting value, ksat , at high ligand concentration which
is consistent with reactions proceeding through a dissociative activation pathway. The
value of ksat depended on the entering ligand and the activation parameters for ksat, ?H‡
and ?S‡, were directly correlated [? H‡ varied from 26 ± 1 (I-) to 83 ± 4 (N3-) kJ mol-1
while ?S‡ varied from –92 ± 4 (I-) to 94 ± 13 (N3-) J K -1 mol-1]. This is inconsistent with
a limiting dissociative (D) mechanism which requires ksat , and hence ?H‡ and ?S‡, to be
independent of the identity of the entering ligand. Thus the mechanism was found to be a
dissociative interchange (Id) mechanism. Furthermore, there was a direct correlation
between ? H‡ (and hence ?S‡) and the total Mulliken population of the donor atom of the
entering ligand, but there was no correlation between these activation parameters and the
cone angle subtended by the ligand at the metal atom. These results suggested that for
anionic ligands, in contrast with neutral N-donor ligands, electronic rather than steric
effects were primarily responsible for controlling reaction rates. It was also concluded
that for anionic ligands, which were capable of bonding through two different donor atom
types the reaction, occurred primarily through the donor atom with the higher electron
density.153

65
The ligand substitution reactions of coordinated H2O in aquacobalamin by OCN-, SCN-,
SeCN-, NO2-, S2O3
2- and N3- in NaNO3 medium were investigated.25 In the preceding
report,152 it was reported that the activation parameters for N-donor ligands investigated
did not correlate to the Mulliken population; the activation parameters for these species
correlated instead with the steric demands of the ligand at the metal ion. Thus it suggests
that the steric demands can override the electronic effects. According to recent studies, it
has now emerged that the re is a potential problem with these suggestions. To date the
ionic adjustor used in all these studies was KCl, because it is UV-transparent it allows
standard combination glass electrodes to be used for the measurement of pH, and little
spectroscopic evidence was found for the binding of Cl- to CoIII. Following this another
report has shown that at high chloride concentrations there is a significant retardation of
reaction rates which is attributed to the formation of the more substitution-inert chloro
complex. Although these findings do not invalidate the preceding conclusions reached
concerning the ligand substitution reactions of aquacobalamin, i.e. there is now a general
agreement that they proceed through an interchange mechanism under dissociative
activation, however it brings into question any conclusions based on the absolute values
of the rate constants and their activation parameters. In this study the previous
suggestions have been reconsidered concerning the identification of the reacting atom of
the entering ambidentate ligand. Attempts have been made to rationalize the nature of
the outer-sphere or precursor complex formed between aquacobalamin and the incoming
ligand. The second-order rate constants were corrected for pH effects, for the reactions
have been determined as a function of temperature, which lead to the calculation of the
activation parameters. The identity of the donor atom of the ambidentate ligands in the
rate determining processes, k II, was considered and the correlations found between
?H‡kII, the enthalpy of activation, and ?S‡
kII, the entropy of activation, respectively. It
was found that the Mulliken population on the donor atom, and the energy of the highest
occupied molecular orbital (HOMO) had a σ symmetry. The parameters ?H‡ kII were
strongly dependant on the HOMO energy, and more weakly dependant on the electron
density on the donor atom, while the converse was true for ?S‡ kII.154
66
It is surprising to notice that the CoIII in vitamin B12a shows unusual kinet ic lability. CoIII
is a classical example of a kinetically inert metal ion, which is largely due to the high
ligand field stabilization energy associated with its low spin d6 electron configuration. It
is now generally accepted that the ligand substitution reactions of vitamin B12a proceed
through a dissociative interchange mechanism (Id), despite earlier suggestions that the
mechanism is strictly dissociative (D).155 According to this study, the distinction between
a limiting D mechanism and an interchange Id mechanism for an octahedral complex lies
in one being to demonstrate directly or indirectly the existence of the five coordinate
intermediate. This distinction becomes possible when the pseudo first-order rate constant
shows saturation with the concentration of the incoming ligand. The kinetic results
obtained for vitamin B12a were surprising for two reasons. Firstly, not only is the CoIII
encapsulated by the small corrin ring (corrins, unlike porphyrins, have a direct linkage
between the A and D ring which results in a smaller macrocyclic cavity) but also the
substituents on the periphery of the corrin ring provide a formidable steric barrier to the
incoming ligand. However, an Id mechanism requires nucleophilic participation by the
incoming ligand in the transition state. Secondly, the reactions are surprisingly fast for
CoIII, which is the classical example of an inert transition metal ion. A comparison of
representative second-order rate constants for the substitution of H2O by ligands in CoIII
complexes with four N-donor equatorial ligands showed that the approximate lability
ratio of the metal ion towards substitution in corrin, porphyrin, cobaloxime and ammine
systems was 109 : 106 : 104 : 18. According to the findings this showed clear evidence for
a cis labilising effect of the corrin ring, which was a suggested to be a consequence of the
electronic properties of the cis ligand that have a direct and marked effect on the kinetics
of the ligand binding properties in the axial position. This paper aimed to address these
two questions. Firstly, investigate the ability of the corrin ring to perturb the properties
of the metal ion, thus usual inertness of the d6 CoIII had been modified by replacing the H
atom at C10 with an electron withdrawing group like a nitroso group. This compound
called 10-nitrosoaquacobalamin was then characterized by NMR and UV-vis
spectroscopy and by FAB-MS. Secondly, the steric bulk of the departing ligand was
increased by making it iodide. Following this, the kinetics of its substitution by three
representative ligands, N3-, S2O3
2- and imidazole were investigated, to determine whether
67
an increase in the bulk of the departing ligand was sufficient to switch from the Id to the
D mechanism. The pKa and activation parameters were determined and compared to B12a.
It was found that the electron withdrawing NO group deactivated the metal ion towards
ligand substitution, and that neither pyridine nor N3- caused a displacement of the
coordinated H2O, and it was concluded that either the reactions were very slow or the log
K had been decreased by at least 1 and 4 orders of magnitude for the coordination of
these two ligands, respectively. Hence, it was reported that the electronic structure of the
corrin ring could directly influence the axial ligand binding properties of the metal.155
Ligand substitution reactions of the vitamin B12 analog cyanoimidazolyl-cobamide, CN
(Im)Cbl, with cyanide were studied.156 Cyanide substitutes imidazole (Im) in the a-
position more slowly than it substitutes dimethylbenzimidazole in cyanocobalamin
(vitamin B12). The kinetics of displacement of Im by CN- showed saturation behaviour at
high cyanide concentration; the limiting rate constant was found to be 0.0264 s-1 at 25 °C
and is characterised by the activation parameters: ? H‡ = 111 + 6 JK-1 mol-1, ?V‡ = +9.3 +
0.3 cm-3 mol-1. These parameters are interpreted in terms of an Id mechanism. The
equilibrium constant for the reaction of CN(Im)Cbl with CN- was found to be 861 + 75
M-1, which is significantly less than that obtained for the reaction of cyanocobalamin with
CN- which was reported to be 0.99 + 0.05 M-1, which is about 0.9 pH units higher than
that obtained previously in the case of cyanocobalamin.156 According to the above
studies it seems that Co(III)’s lability is conferred on it by the corrin ring.
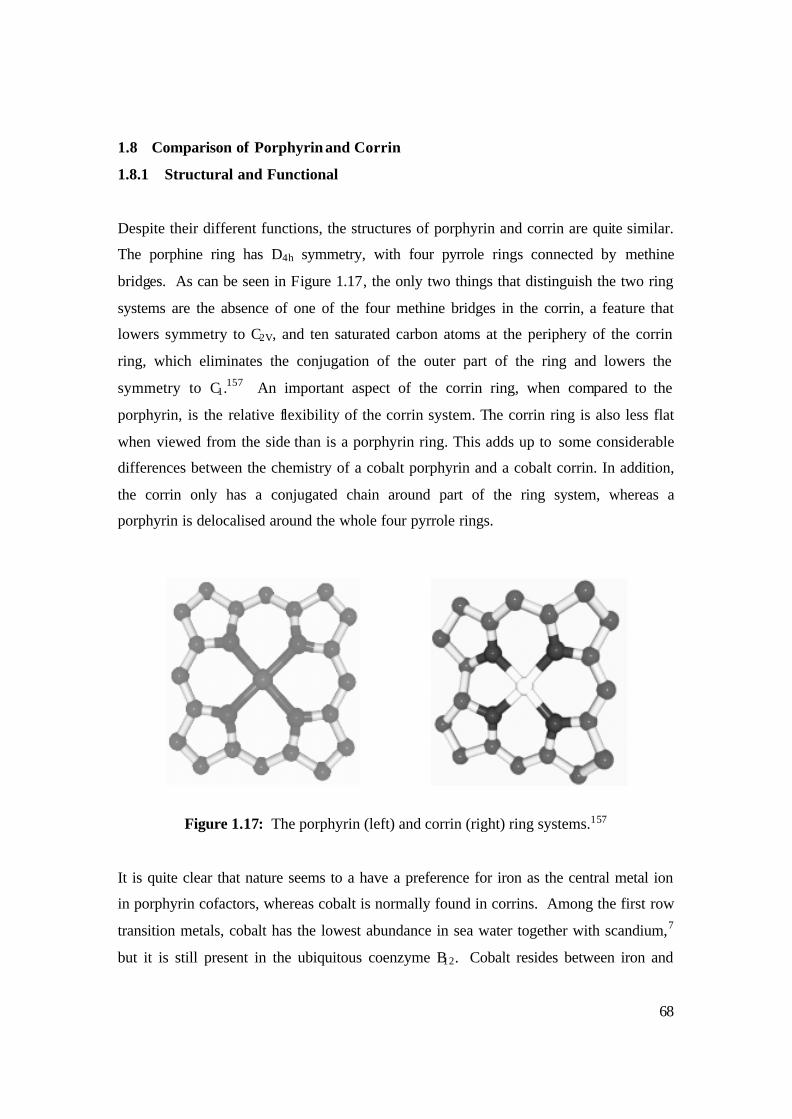
68
1.8 Comparison of Porphyrin and Corrin
1.8.1 Structural and Functional
Despite their different functions, the structures of porphyrin and corrin are quite similar.
The porphine ring has D4h symmetry, with four pyrrole rings connected by methine
bridges. As can be seen in Figure 1.17, the only two things that distinguish the two ring
systems are the absence of one of the four methine bridges in the corrin, a feature that
lowers symmetry to C2V, and ten saturated carbon atoms at the periphery of the corrin
ring, which eliminates the conjugation of the outer part of the ring and lowers the
symmetry to C1.157 An important aspect of the corrin ring, when compared to the
porphyrin, is the relative flexibility of the corrin system. The corrin ring is also less flat
when viewed from the side than is a porphyrin ring. This adds up to some considerable
differences between the chemistry of a cobalt porphyrin and a cobalt corrin. In addition,
the corrin only has a conjugated chain around part of the ring system, whereas a
porphyrin is delocalised around the whole four pyrrole rings.
Figure 1.17: The porphyrin (left) and corrin (right) ring systems.157
It is quite clear that nature seems to a have a preference for iron as the central metal ion
in porphyrin cofactors, whereas cobalt is normally found in corrins. Among the first row
transition metals, cobalt has the lowest abundance in sea water together with scandium,7
but it is still present in the ubiquitous coenzyme B12. Cobalt resides between iron and
69
nickel in the first row of the d-block. It has common oxidation states of +2 and +3, as
does iron, but cobalt may even be reduced to a formal oxidation number of +1 in vivo, a
property that iron does not possess.158 On the other hand, iron porphyrin complexes are
well known for their accessible high-valency states (formally Fe+4 and Fe+5); the first
plays an important role in the function of the haem oxidases such as P450 (see section
1.4.3).159
The corrins exist in nature in the form of cobalamins. The B12 coenzymes contain a
corrin ring with a d6 low-spin Co+3 ion in their octahedral resting states. In most
cobalamin-dependant enzymes, the imidazole side chain of the histidine residue
coordinates to the cobalt ion. In another group of enzymes, the cobalt binds to the
pendant dimethylbenzimidazole group of the coenzyme, the properties of which are quite
similar to those of an imidazole ligand.160 The second axial site is occupied by a methyl
or 5’-deoxyadenosyl group; these form an organometallic Co-C bond. This bond is
broken during the catalytic cycle to form either a five-coordinate Co+2 intermediate and
an adenosyl radical, or a four-coordinate Co+1 ion, where the imidazole ligand has
dissociated and the methyl group has been transferred to a nucleophilic substrate.161, 162
Haem enzymes show a larger variation in their axial ligands (His, Cys, Met, Tyr, Glu,
Asp, amino terminal, or exogenous ligands), depending on their function.162 The haem
group can be either five-coordinate with an open coordination site where a substrate
binds, or six-coordinate with one or more ligands from the protein. However, the most
common ligand is a histidine/imidazole group, as is present, for example, in myoglobin,
haemoglobin, peroxidases, haem oxygenase and most types of cytochromes.4
1.8.2 Chemical Properties
Recently, density functional calculations have been used to compare various geometric,
electronic and functional properties of iron and cobalt porphyrin and corrin species.157
The aim of the study was to investigate how the chemical properties of cobalt and iron, as
well as porphyrin and corrin, differ. Specifically, the authors wanted to understand why
70
cobalt is associated with corrins and iron with porphyrins in nature. This project aims to
further investigate this observation. The investigation was concentrated on one typical
reaction for each of the two coenzymes, namely, the breaking of the Co-C bond as it is a
typical reaction example of coenzyme B12 metabolism, and electron transfer as it is a
typical reaction of the haem-containing cytochromes.157
Others have addressed similar questions.7, 23, 163-165 These investigations suggested that
corrin was selected to fit the smaller CoIII ion.7, 23, 163 Others have emphasised the
flexibility of the corrin ring as an important factor in the labilisation of the Co-C bond.165,
166 Williams et al. have proposed that the low spin CoII is unique among the available
first-row transition metal ions to provide a stable direct one electron radical. 168 On the
other hand Pratt et al. have attributed the choice of cobalt to the low 3d to 4s/4p
promotion energy of CoII, which gives strong Co-C bonds, because the 3d orbitals are too
small to form strong covalent bonds with carbon.23, 163 Specifically, the mechano-
chemical trigger mechanism has been a major argument in favour of a specialised
functio n of corrin systems, based on release of strain energy during catalysis. However,
recent experimental170-173 and theoretical173, 174 results have indicated that such a
conformational change is unlikely to drive a catalytic reaction within corrins. Finally,
Rovira et al. compared the geometric and electronic structure of four-coordinate cobalt
complexes with the corrin and porphine by using theoretical calculations.167 The results
show that the excitation energy associated with dx2-y2 occupation is much higher in corrins
than in porphyrins.
Jensen and Ryde have carried out an extensive comparison of the properties of corrins
and porphyrins using density functional calculations.157 During recent years, such
methods have successfully been applied to the study of both iron porphyrin species175-187
and coenzyme B12 models.167, 174, 188-192 Theoretical methods have the advantage of being
cheap and fast while giving ‘pure’ results (well defined reactions in vacuum). On the
other hand, so lvation effects and free energies are hard to describe in a consistent way,
and the accuracy is limited. This investigation was focused on octahedral MII/III
complexes (where M is the metal) with two axial imidazole ligands (as a model of b and
c type cytochromes) or with one imidazole and one methyl ligand (as a model of
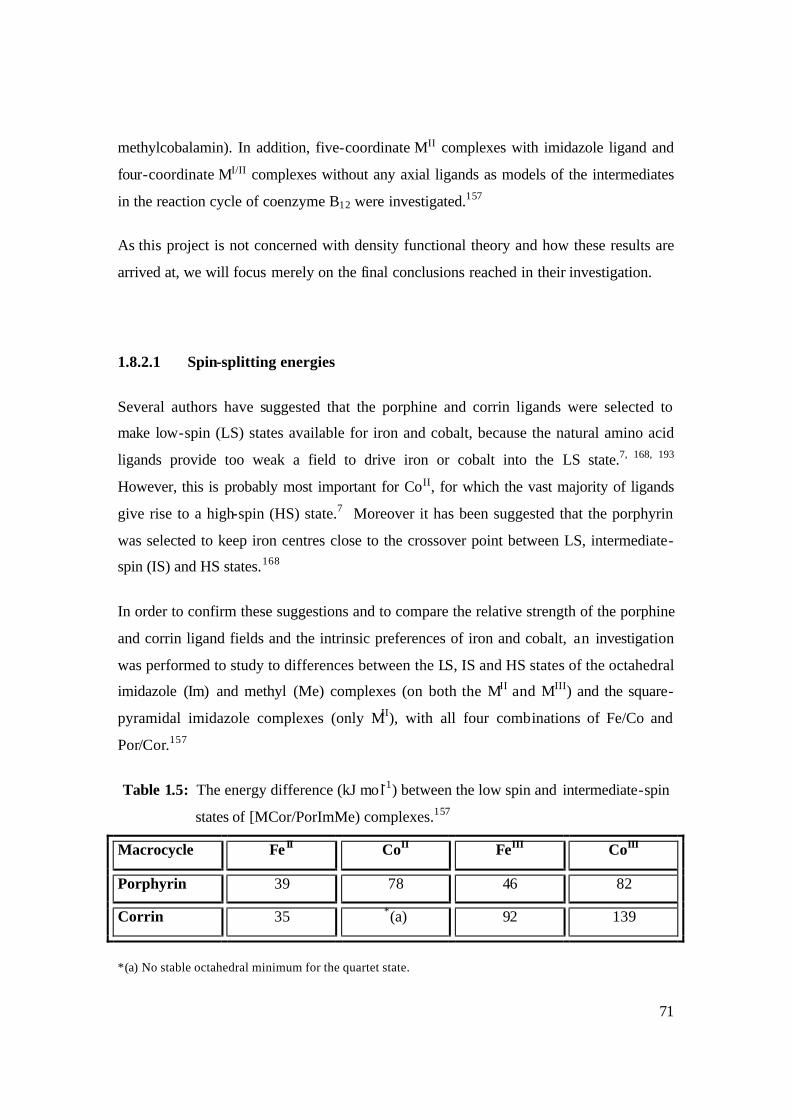
71
methylcobalamin). In addition, five-coordinate MII complexes with imidazole ligand and
four-coordinate MI/II complexes without any axial ligands as models of the intermediates
in the reaction cycle of coenzyme B12 were investigated.157
As this project is not concerned with density functional theory and how these results are
arrived at, we will focus merely on the final conclusions reached in their investigation.
1.8.2.1 Spin-splitting energies
Several authors have suggested that the porphine and corrin ligands were selected to
make low-spin (LS) states available for iron and cobalt, because the natural amino acid
ligands provide too weak a field to drive iron or cobalt into the LS state.7, 168, 193
However, this is probably most important for CoII, for which the vast majority of ligands
give rise to a high-spin (HS) state.7 Moreover it has been suggested that the porphyrin
was selected to keep iron centres close to the crossover point between LS, intermediate-
spin (IS) and HS states.168
In order to confirm these suggestions and to compare the relative strength of the porphine
and corrin ligand fields and the intrinsic preferences of iron and cobalt, an investigation
was performed to study to differences between the LS, IS and HS states of the octahedral
imidazole (Im) and methyl (Me) complexes (on both the MII and MIII) and the square-
pyramidal imidazole complexes (only MII), with all four combinations of Fe/Co and
Por/Cor.157
Table 1.5: The energy difference (kJ mol-1) between the low spin and intermediate-spin
states of [MCor/PorImMe) complexes.157
Macrocycle Fe II CoII FeIII CoIII
Porphyrin 39 78 46 82
Corrin 35 *(a) 92 139
*(a) No stable octahedral minimum for the quartet state.
72
It was found that only one octahedral Im/Me complex was stable in the HS state,
[Fe+2PorImMe]. All the other complexes lost the imidazole ligand during optimisation.
The same applies also to the IS [Co+2CorImMe] complex. It is important to note that CoII
has seven electrons and therefore does not have a sextet state comparable to the high state
quintet state of FeII. Thus, only the energy difference between the LS and IS states is
presented in table 1.5.157
For these octahedral Im/Me complexes, all combinations of metals and ring systems gave
rise to an LS ground state, in accordance with experimental results for the cobalt corrin
species.194 The IS states were 46-139 kJ mol-1 higher in energy for the MIII complexes.
The difference was approximately 40 kJ mol-1 larger for Co than for Fe and also about 50
kJ mol-1 larger for Cor than for Por. The results in this report confirmed that both Cor
and Por gave rise to strong fields and that Fe and Por produced complexes quite close to
the spin-crossover point.157 Although the splitting energies of four - and five-coordinate
complexes are reported and interesting, we will not mention the four -coordinate
complexes, as they are not relevant to our project. However, overall the spin-splitting
energy results indicated that cobalt and corrin favour the LS state, whereas Fe and
porphyrin produced a small splitting between the various states.
1.8.2.2 Thermodynamic stability
Considering the in vivo abundance of iron porphyrins and cobalt corrins, it is natural to
address the relative thermodynamic stability of these complexes. Stability considerations
may explain why iron forms biological complexes with porphyrin rather than corrin and
why the opposite is true in the case of cobalt. The results from the investigation
suggested that the thermodynamic stability favours the two native combinations of ions
and ring systems by 8-24 kJ mol-1 over the non-native combinations for all complexes,
except the MII with Im/Me complexes. Thus it was reported that there was some intrinsic
thermodynamic reason to choose the native combinations.157
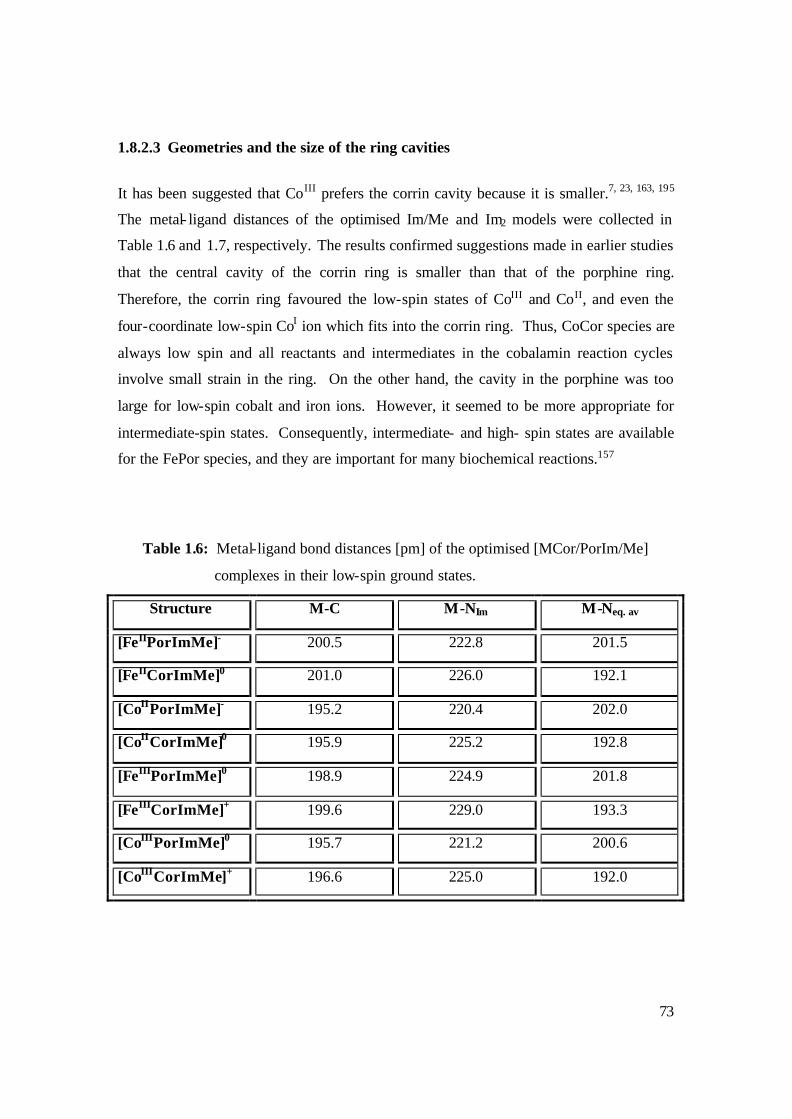
73
1.8.2.3 Geometries and the size of the ring cavities
It has been suggested that CoIII prefers the corrin cavity because it is smaller.7, 23, 163, 195
The metal- ligand distances of the optimised Im/Me and Im2 models were collected in
Table 1.6 and 1.7, respectively. The results confirmed suggestions made in earlier studies
that the central cavity of the corrin ring is smaller than that of the porphine ring.
Therefore, the corrin ring favoured the low-spin states of CoIII and CoII, and even the
four-coordinate low-spin CoI ion which fits into the corrin ring. Thus, CoCor species are
always low spin and all reactants and intermediates in the cobalamin reaction cycles
involve small strain in the ring. On the other hand, the cavity in the porphine was too
large for low-spin cobalt and iron ions. However, it seemed to be more appropriate for
intermediate-spin states. Consequently, intermediate- and high- spin states are available
for the FePor species, and they are important for many biochemical reactions.157
Table 1.6: Metal-ligand bond distances [pm] of the optimised [MCor/PorIm/Me]
complexes in their low-spin ground states.
Structure M-C M-NIm M-Neq. av
[FeIIPorImMe]- 200.5 222.8 201.5
[FeIICorImMe]0 201.0 226.0 192.1
[CoIIPorImMe]- 195.2 220.4 202.0
[CoIICorImMe]0 195.9 225.2 192.8
[FeIIIPorImMe]0 198.9 224.9 201.8
[FeIIICorImMe]+ 199.6 229.0 193.3
[CoIIIPorImMe]0 195.7 221.2 200.6
[CoIIICorImMe]+ 196.6 225.0 192.0
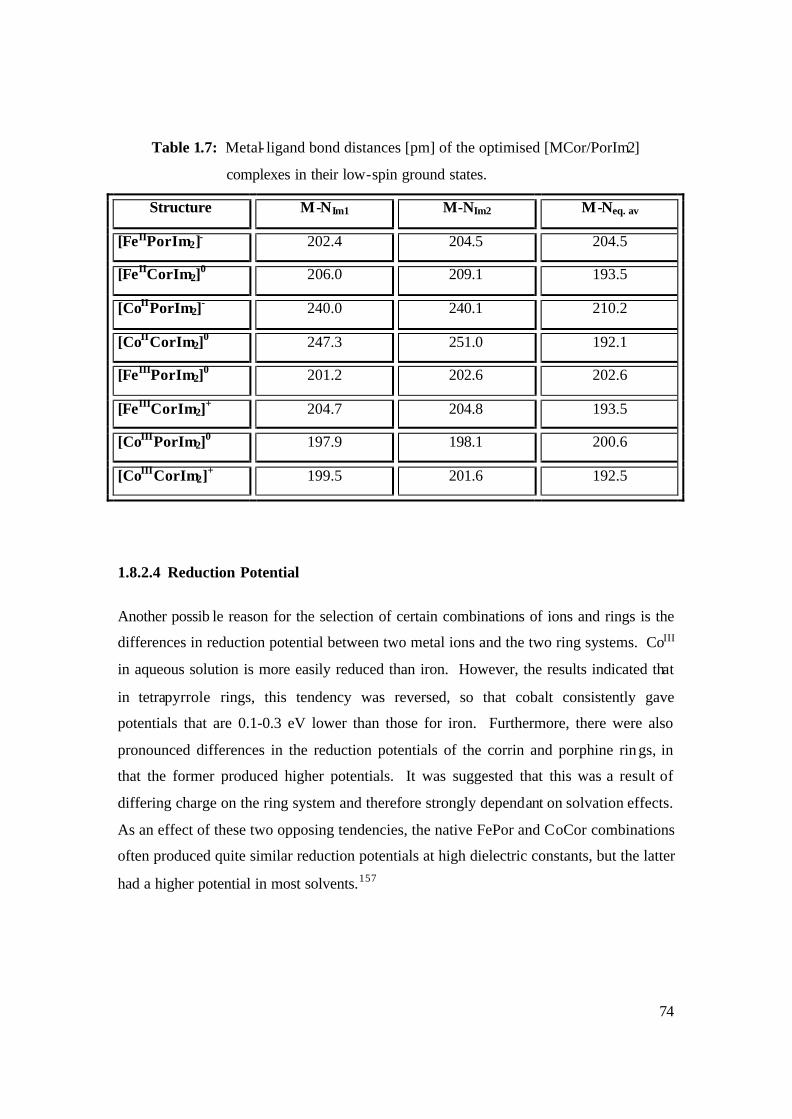
74
Table 1.7: Metal- ligand bond distances [pm] of the optimised [MCor/PorIm2]
complexes in their low-spin ground states.
Structure M-NIm1 M-NIm2 M-Neq. av
[FeIIPorIm2]- 202.4 204.5 204.5
[FeIICorIm2]0 206.0 209.1 193.5
[CoIIPorIm2]- 240.0 240.1 210.2
[CoIICorIm2]0 247.3 251.0 192.1
[FeIIIPorIm2]0 201.2 202.6 202.6
[FeIIICorIm2]+ 204.7 204.8 193.5
[CoIIIPorIm2]0 197.9 198.1 200.6
[CoIIICorIm2]+ 199.5 201.6 192.5
1.8.2.4 Reduction Potential
Another possib le reason for the selection of certain combinations of ions and rings is the
differences in reduction potential between two metal ions and the two ring systems. CoIII
in aqueous solution is more easily reduced than iron. However, the results indicated that
in tetrapyrrole rings, this tendency was reversed, so that cobalt consistently gave
potentials that are 0.1-0.3 eV lower than those for iron. Furthermore, there were also
pronounced differences in the reduction potentials of the corrin and porphine rin gs, in
that the former produced higher potentials. It was suggested that this was a result of
differing charge on the ring system and therefore strongly dependant on solvation effects.
As an effect of these two opposing tendencies, the native FePor and CoCor combinations
often produced quite similar reduction potentials at high dielectric constants, but the latter
had a higher potential in most solvents.157
75
1.8.2.5 Reorganisation energies
The octahedral [FeII/IIIPor/CorIm2] complexes produced much lower inner-sphere
reorganisation energies (8-9 kJ mol-1) than the corresponding CoII/III complexes (179-197
kJ mol-1). It was proposed that the reason for this was that the occupation of the dx2
orbital in the low-spin CoII (d7), leads to a large difference in the dis tances to the axial
ligands in the two oxidation states.157 Therefore, it was concluded that the CoII/III couple
is useless for electron-transfer reactions, whereas the octahedral FeII/III complexes (d5/6)
formed excellent electron carriers, also in comparison with other metal sites.157
1.8.2.6 Bond dissociation energies
The homolytic Co-C bond dissociation energy (BDE) for CoCor in coenzyme B12 was
investigated. Equation 1.6 shows a typical reaction for CoCor in coenzyme B12 and it is
the energy released in this equation we are determining.
[M IIICor/PorImMe] [M IICor/PorIm] + Me . (1.6)
Also the bond dissociation energy (BDE) of the hydrolysis of the six-coordinate Im/Me
complexes was investigated, and is shown in Equation 1.7.
[M IIICor/PorImMe] + H2O [M IIICor/PorImOH] + CH4 (1.7)
It was found that [Cor/PorImMe] had the largest homolytic Co-C BDE of the studied
complexes with a variation of 12 kJ mol-1. It was suggested that this is compensated by
the largest resistance towards hydrolysis. In addition, the cobalt complexes were more
stable towards hydrolysis than the iron complexes (by approximately 40 kJ mol-1). This
is thought to explain why cobalamins are employed in nature for organometallic
reactions.157
The work reported in this article answers many questions and gives several good
explanations for why iron is associated with porphine in nature whereas cobalt is
76
associated with corrin, and also why FePor species are used for electron transfer and
oxygen activation whereas CoCor species are involved in organometallic Co-C reactions
(methyl transfer and radical formation).157
1.9 Scope and Objectives of the Research Project
To date, the Bioinorganic Research Group at the University of the Witwatersrand has
done extensive research on the chemistry of haempeptides, particularly FeIII-
microperoxidase-8 (MP8) and FeIII-microperoxidase-11 (MP11). The group has also
done extensive research on the cobalt corrinoid derivative, Vitamin B12a. One of the
significant results is the demonstration that CoIII in cobalamins is labile. This project aims
to explore aspects of the chemistry of N-Ac-CoIII-microperoxidase-8, a model compound
in which Co(III) is coordinated in its equatorial plane by a porphyrin ligand and to
compare the results with the extensive data available for vitamin B12a and summarized
above.
The specific objectives of the project are:
Ø Synthesise MP8 using the standard methodology the Wits Bioinorganic
Research Group has developed.
Ø To remove FeIII from MP8 using the reductive demetalation procedure
adapted from Primus et al.79
Ø To insert Co(III) into the porphyrin by treating with cobaltous acetate; this is
followed by aerial oxidation.79
Ø Developing conditions where N-Ac-CoIIIMP8 is monomeric in solution. It has
been anticipated that at the very least protection of the peptide N-terminus by
acetylation will be required.
Ø Characterise the all the products leading to the synthesis of N-Ac-CoIIIMP8
using a battery of techniques like UV-visible spectroscopy, HPLC (High
Performance Liquid Chromatography), ICP-OES (Inductively Coupled
Plasma – Optical Emission Spectroscopy), Luminescence spectroscopy and
77
FAB-MS (Fast Atom Bombardment – Mass Spectroscopy).
Ø To describe the solution chemistry of N-Ac-CoIIIMP8 by determining the
behaviour of CoIII-MP8 as a function of pH and ionic strength.
Ø Determine the feasibility of studying the kinetics and thermodynamics of
ligand substitution reactions on CoIII ion.
This project will set the foundation for future work in understanding the unique chemistry
of the porphyrin and corrin. After determining the Beer’s Law behaviour and developing
conditions where N-Ac-CoIII-MP8 is monomeric in solution, we would then be able to
begin exploring, the hypothesis that the key to kinetic lability of CoIII in the corrin lies in
the corrin ligand itself, i.e.; the equatorial ligand imparts lability on the axial coordination
site of the metal ion. One way to test this hypothesis is to replace the equatorial
macrocycle whilst maintaining the axial coordination site constant. Towards this end, the
N-Ac-CoIII-MP8 fulfils these requirements:
Ø The metal is CoIII.
Ø The equatorial system features porphyrin rather than corrin.
Ø The axial ligand (His) is a close match, in so far as electronic effects go, to
the axial ligand in B12a (dimethylbenzimidazole).
Although it will take a long time until we fully understand these fundamental
evolutionary antiques, therein lies opportunity for endeavours where thermodynamics of
ligand coordination, kinetics of substitution processes, molecular modelling, reduction
and self-exchange reactions, catalytic studies and various other studies on the solution
chemistry of N-Ac-CoIIIMP8 can be unravelled and the results compared to the extensive
data available for the cobalt corrinoids. In the long term we should be in a better position
to explain the origin of the kinetic lability of CoIII in the corrins, and have a better idea
about the unique properties this ligand imparts on CoIII.
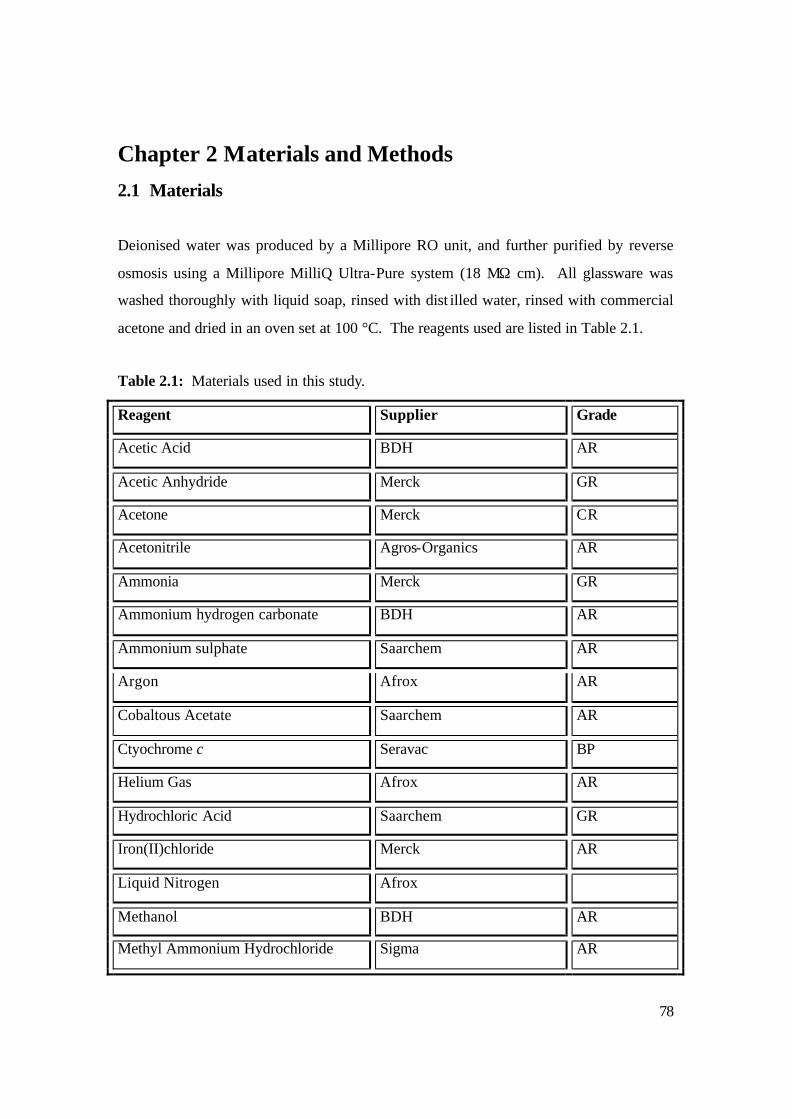
78
Chapter 2 Materials and Methods 2.1 Materials
Deionised water was produced by a Millipore RO unit, and further purified by reverse
osmosis using a Millipore MilliQ Ultra-Pure system (18 MΩ cm). All glassware was
washed thoroughly with liquid soap, rinsed with dist illed water, rinsed with commercial
acetone and dried in an oven set at 100 °C. The reagents used are listed in Table 2.1.
Table 2.1: Materials used in this study.
Reagent Supplier Grade
Acetic Acid BDH AR
Acetic Anhydride Merck GR
Acetone Merck CR
Acetonitrile Agros-Organics AR
Ammonia Merck GR
Ammonium hydrogen carbonate BDH AR
Ammonium sulphate Saarchem AR
Argon Afrox AR
Cobaltous Acetate Saarchem AR
Ctyochrome c Seravac BP
Helium Gas Afrox AR
Hydrochloric Acid Saarchem GR
Iron(II)chloride Merck AR
Liquid Nitrogen Afrox
Methanol BDH AR
Methyl Ammonium Hydrochloride Sigma AR
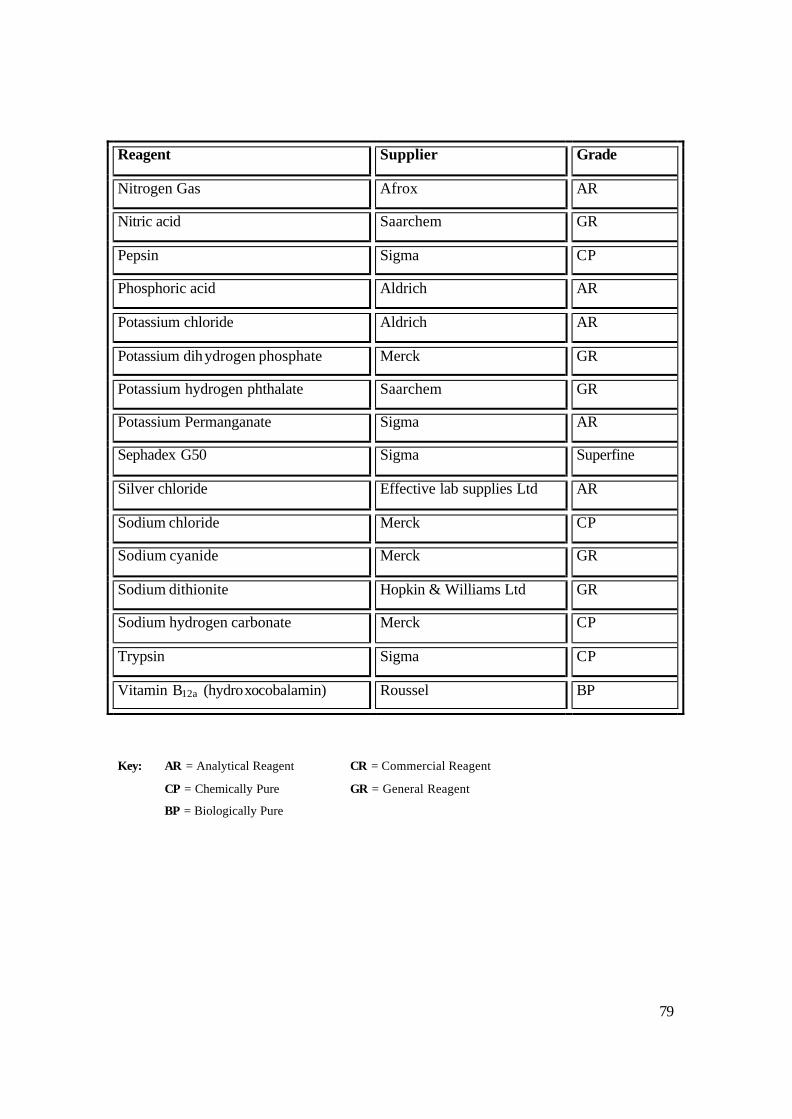
79
Reagent Supplier Grade
Nitrogen Gas Afrox AR
Nitric acid Saarchem GR
Pepsin Sigma CP
Phosphoric acid Aldrich AR
Potassium chloride Aldrich AR
Potassium dihydrogen phosphate Merck GR
Potassium hydrogen phthalate Saarchem GR
Potassium Permanganate Sigma AR
Sephadex G50 Sigma Superfine
Silver chloride Effective lab supplies Ltd AR
Sodium chloride Merck CP
Sodium cyanide Merck GR
Sodium dithionite Hopkin & Williams Ltd GR
Sodium hydrogen carbonate Merck CP
Trypsin Sigma CP
Vitamin B12a (hydroxocobalamin) Roussel BP
Key: AR = Analytical Reagent CR = Commercial Reagent
CP = Chemically Pure GR = General Reagent
BP = Biologically Pure
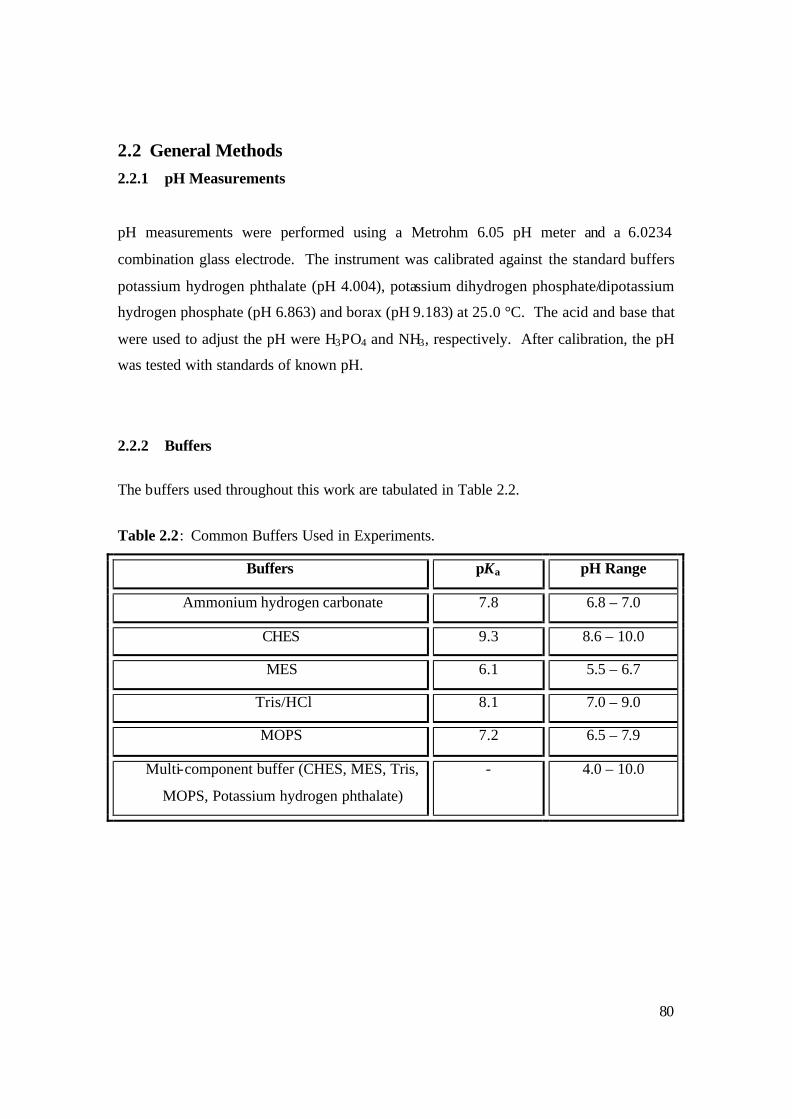
80
2.2 General Methods 2.2.1 pH Measurements
pH measurements were performed using a Metrohm 6.05 pH meter and a 6.0234
combination glass electrode. The instrument was calibrated against the standard buffers
potassium hydrogen phthalate (pH 4.004), potassium dihydrogen phosphate/dipotassium
hydrogen phosphate (pH 6.863) and borax (pH 9.183) at 25.0 °C. The acid and base that
were used to adjust the pH were H3PO4 and NH3, respectively. After calibration, the pH
was tested with standards of known pH.
2.2.2 Buffers
The buffers used throughout this work are tabulated in Table 2.2.
Table 2.2: Common Buffers Used in Experiments.
Buffers pKa pH Range
Ammonium hydrogen carbonate 7.8 6.8 – 7.0
CHES 9.3 8.6 – 10.0
MES 6.1 5.5 – 6.7
Tris/HCl 8.1 7.0 – 9.0
MOPS 7.2 6.5 – 7.9
Multi-component buffer (CHES, MES, Tris,
MOPS, Potassium hydrogen phthalate)
- 4.0 – 10.0
81
2.2.3 Concentration and Desalting of Products
The concentrating and desalting of the various products formed during the synthesis of
NAc-CoIIIMP8 was performed using a 50 ml Amicon stirred cell connected to a nitrogen
cylinder under ca. 70 psi pressure (0.45 µm, 45 mm). Each sample was concentrated by
allowing it to stir until a minimal volume of sample was left in the cell. When the
samples were desalted, additional deionised water was added to the concentrated sample
and the process repeated until all salts were removed. To test for the presence of salts,
0.5 ml of 0.1 M NaCl was added to the sample initially and the presence of chloride ions
in the eluent was monitored using AgNO3. It was assumed that if all chloride ions were
washed out then all other salts present were also washed out or were present in very
negligible concentrations. Desalting continued until the eluent test for Cl- ions was
negative.
2.2.4 Gel Permeation Chromatography
Gel permeation chromatography separates molecules on the basis of their size. The
smaller molecules enter pores (with specified size) in the solid phase, while the larger
molecules travel in the mobile phase and are eluted first. Sephadex G50 was used in a 3
x 40 cm column allowing small molecules (between 1 500-30 000 kDa) to pass through
the pores in the solid phase and the larger molecules (> 30 000 kDa) to travel in the
mobile phase. The resin was degassed before packing. After packing, the column was
equilibrated by passing (NH4)2CO3 (0.1 M) at a flow rate of 10 ml h-1 for at least 48 hrs.
A Watson-Marlow 101U peristaltic pump was used for elution and the fractions were
collected using an ISCO 1850 fraction collector.
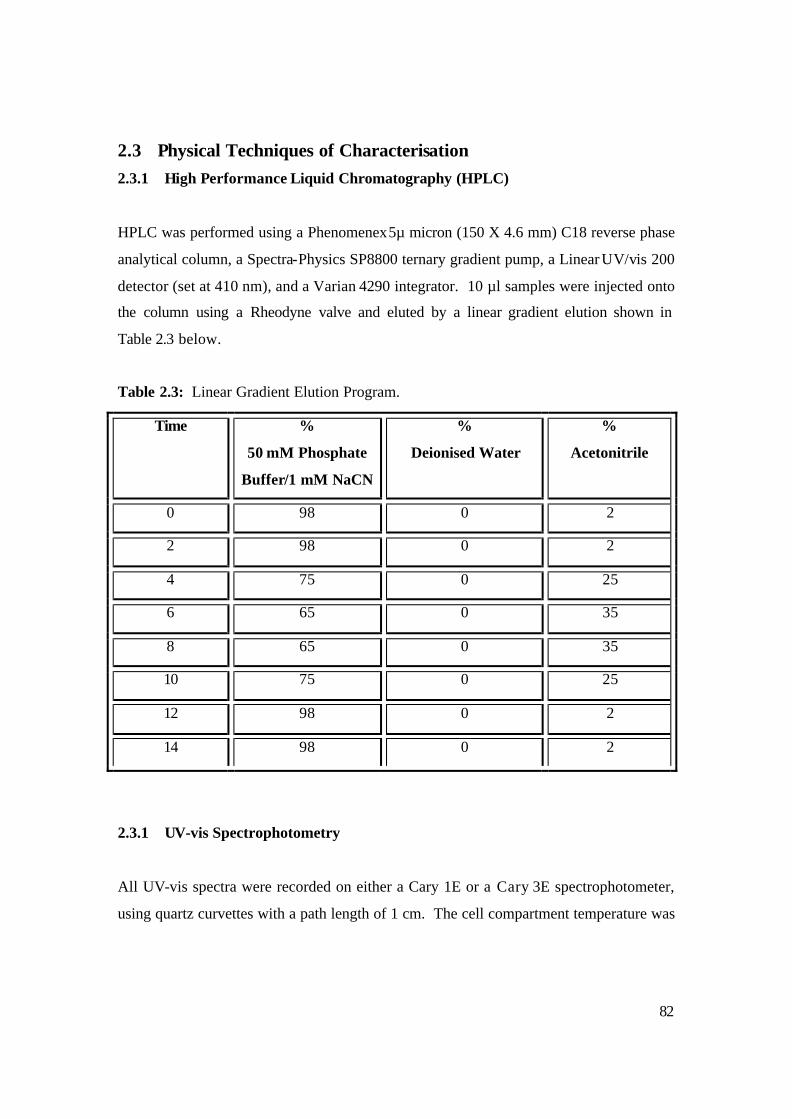
82
2.3 Physical Techniques of Characterisation 2.3.1 High Performance Liquid Chromatography (HPLC)
HPLC was performed using a Phenomenex 5µ micron (150 X 4.6 mm) C18 reverse phase
analytical column, a Spectra-Physics SP8800 ternary gradient pump, a Linear UV/vis 200
detector (set at 410 nm), and a Varian 4290 integrator. 10 µl samples were injected onto
the column using a Rheodyne valve and eluted by a linear gradient elution shown in
Table 2.3 below.
Table 2.3: Linear Gradient Elution Program.
Time %
50 mM Phosphate
Buffer/1 mM NaCN
%
Deionised Water
%
Acetonitrile
0 98 0 2
2 98 0 2
4 75 0 25
6 65 0 35
8 65 0 35
10 75 0 25
12 98 0 2
14 98 0 2
2.3.1 UV-vis Spectrophotometry
All UV-vis spectra were recorded on either a Cary 1E or a Cary 3E spectrophotometer,
using quartz curvettes with a path length of 1 cm. The cell compartment temperature was
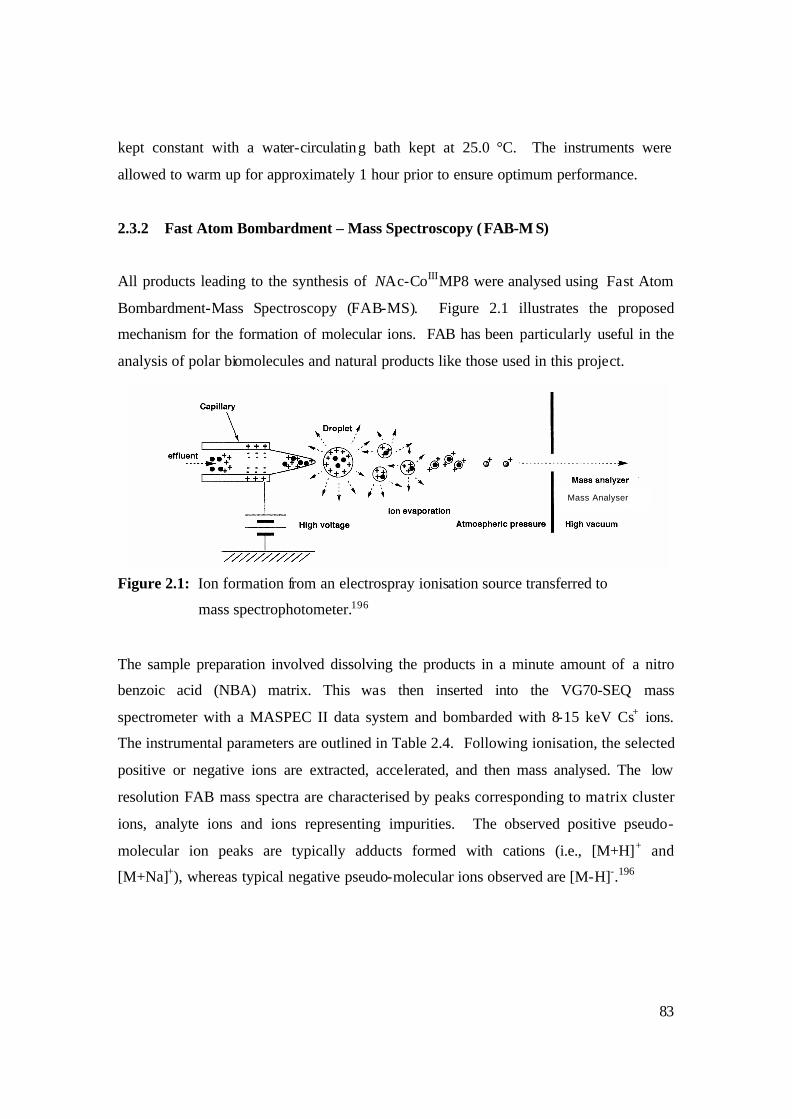
83
kept constant with a water-circulating bath kept at 25.0 °C. The instruments were
allowed to warm up for approximately 1 hour prior to ensure optimum performance.
2.3.2 Fast Atom Bombardment – Mass Spectroscopy ( FAB-M S)
All products leading to the synthesis of NAc-CoIIIMP8 were analysed using Fast Atom
Bombardment-Mass Spectroscopy (FAB-MS). Figure 2.1 illustrates the proposed
mechanism for the formation of molecular ions. FAB has been particularly useful in the
analysis of polar biomolecules and natural products like those used in this project.
Figure 2.1: Ion formation from an electrospray ionisation source transferred to
mass spectrophotometer.196
The sample preparation involved dissolving the products in a minute amount of a nitro
benzoic acid (NBA) matrix. This was then inserted into the VG70-SEQ mass
spectrometer with a MASPEC II data system and bombarded with 8-15 keV Cs+ ions.
The instrumental parameters are outlined in Table 2.4. Following ionisation, the selected
positive or negative ions are extracted, accelerated, and then mass analysed. The low
resolution FAB mass spectra are characterised by peaks corresponding to matrix cluster
ions, analyte ions and ions representing impurities. The observed positive pseudo-
molecular ion peaks are typically adducts formed with cations (i.e., [M+H]+ and
[M+Na]+), whereas typical negative pseudo-molecular ions observed are [M-H]-.196
Mass Analyser
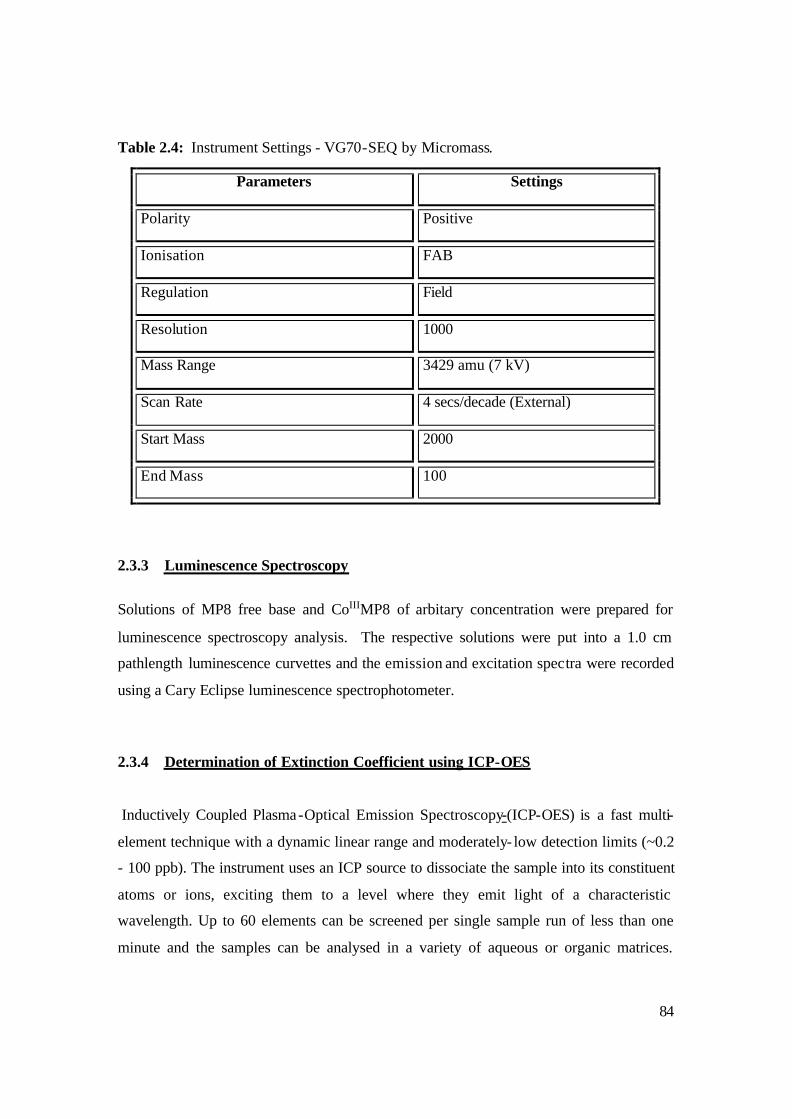
84
Table 2.4: Instrument Settings - VG70-SEQ by Micromass.
Parameters Settings
Polarity Positive
Ionisation FAB
Regulation Field
Resolution 1000
Mass Range 3429 amu (7 kV)
Scan Rate 4 secs/decade (External)
Start Mass 2000
End Mass 100
2.3.3 Luminescence Spectroscopy
Solutions of MP8 free base and CoIIIMP8 of arbitary concentration were prepared for
luminescence spectroscopy analysis. The respective solutions were put into a 1.0 cm
pathlength luminescence curvettes and the emission and excitation spectra were recorded
using a Cary Eclipse luminescence spectrophotometer.
2.3.4 Determination of Extinction Coefficient using ICP-OES
Inductively Coupled Plasma-Optical Emission Spectroscopy-(ICP-OES) is a fast multi-
element technique with a dynamic linear range and moderately- low detection limits (~0.2
- 100 ppb). The instrument uses an ICP source to dissociate the sample into its constituent
atoms or ions, exciting them to a level where they emit light of a characteristic
wavelength. Up to 60 elements can be screened per single sample run of less than one
minute and the samples can be analysed in a variety of aqueous or organic matrices.
85
There is less chemical interference than with Fast Atom Absorption Spectroscopy
(FAAS), but some spectral interference is possible and there are some element
limitations.196
In this project a Spectro-Ciros ICP-OES instrument was employed for the determination
of extinction coefficient of N-AcCoIIIMP8. It is assumed that the amount of cobalt
detected is proportional to the concentration of N-AcCoIIIMP8 once a blank correction is
taken into account. NAc-CoIIIMP8 was accurately weighed out using a six figure
Sartorius CP2P balance and transferred quantitatively into a 25 ml A grade volumetric
flask kept at 25.0 °C, which was then filled to the mark with distilled water. A set of
calibration standards are prepared using a 10 ppm Spectro-multielement stock solution.
The calibrating solutions are sprayed into the plasma and standard curves obtained. The
samples are then sprayed into plasma and the average concentration of cobalt determined
using data from calibration standards and appropriate dilution factors.
2.4 Synthesis of products leading to the formation of NAc-CoIIIMP8
2.4.1 Preparation of Fe IIIMP8
The synthesis of FeIIIMP8 was carried out according to the procedure developed by
Munro and Marques109 with some modifications and is based on the preparation of ferric
MP8 described by Aron and co-workers.102 Ferric horse heart cytochrome c (300 mg)
was treated with pepsin (15 mg; activity: 3200 units/mg) in 0.1 M phosphate buffer (10
ml) at pH 2.1 and at 35.0 °C. The reaction mixture was incubated for 1 hr, after which a
further 15 mg of pepsin was added. The pH was adjusted to 2.1, and the solution was left
for a further 3 hrs. The pH was then raised to 4 with concentrated NH4OH, at which
point the precipitation of MP11 was visible. Solid (NH4)2SO4 was added to the stirred
suspension on ice, until no more could be dissolved; saturated (NH4)2SO4 solution was
then added dropwise. The reaction mixture was centrifuged for 45 min at 7000-8000
rpm. The supernatant was decanted, and the MP11 pellet was dissolved in ca. 10 ml
deionised water. Concentrated NH4OH was then added to adjust the pH to 8.5 at 35.0 °C.
Trypsin (15 mg; activity: 12700 units/mg) was then added and the solution was incubated
86
overnight under gentle stirring. MP8 was precipitated by lowering the pH to 3.5 with
dilute H3PO4. (NH4)2SO4 was added as before, and the reaction mixture was centrifuged
for 45 min at 7000-8000 rpm. The supernatant was decanted and the MP8 pellet was
dissolved in 5 ml of deionised water, with dilute NH4OH to ensure complete dissolution
of MP8. The pH was readjusted to 7.00, desalted, and washed using an Amicon stirred
cell.
2.4.2 Synthesis of demetalated MP8
The demetalation procedure was adapted from a previously published method developed
by Primus and co-workers for the synthesis of MnIIIMP8.79 During the process, care was
taken to avoid direct exposure to light. The reaction was carried out using a vacuum line
connected to an Edwards RV12 vacuum pump and an argon cylinder. While the stopcock
between the argon line and the reaction vessel was open the following reactants were
added to the reaction vessel: FeIIIMP8 (10.00 mg, 6.64 µmol); 10.00 ml glacial acetic
acid; 166 µl concentrated HCl. The stopcock to the argon line was closed and the
reaction mixture frozen with liquid nitrogen. After ensuring that the reactants were
thoroughly frozen, the stopcock between the vacuum line and the reaction vessel was
open for ca. 2-3 minutes and then closed. A Dewar flask containing liquid nitrogen was
then removed from under the reaction vessel and the contents were allowed to thaw at
room temperature. After the reactants completely thawed, the stopcock to the argon line
was opened for about 30 seconds and closed again. The reaction mixture was allowed to
undergo two more freeze-thaw cycles followed by purging with argon. After the final
freeze-thaw cycle and after the reaction mixture had completely thawed, the reaction
vessel was covered in aluminium foil ensuring that the reaction mixture was not exposed
to white light. Using a spatula and an argon saturated powder funnel, iron(II)chloride
(10.00 mg, 80.16 µmol, 12.07 equiv.) was added to the reaction mixture and was stirred
with a magnetic stirrer for about 1 hour at room temperature, resulting in a change of
color from red to purple. The foil- covered product was frozen in liquid nitrogen and
stored in a freezer set at –60 oC. The solvent was removed under reduced pressure on a
vacuum line attached to an Acatel vacuum pump. The residue was dissolved in deionised
87
water and immediately re-evapourated in order to completely remove residual HCl. This
washing was repeated twice and the final residue was solubilised in 5 ml of 50 mM
NH4HCO3 (pH 8.00) and desalted with a Sepak C18 cartridge. The demetalated MP8
obtained was then lyophilised using a Virtis-UnitrapII freeze dryer.
2.4.3 Synthesis of CoIIIMP8
The metalation procedure was adopted from a previously published method developed by
Primus and co-workers for the synthesis of MnIIIMP8.79 Demetalated MP8 was dissolved
in 2 ml of water and allowed to reflux in a paraffin oil bath set at 95.0 °C. Cobaltous
acetate (2.33 mmol, 2.33 M) was dissolved in 1 ml methanol was prepared before hand.
12 µl cobaltous acetate solution was then added to the reaction mixture containing
demetalated MP8 (4.82 µmol). The reaction mixture was allowed to reflux for 3 hours.
After the refluxing process the sample could be exposed to white light. The product was
then loaded onto the Sepak cartridge and washed with copious amounts of water to
remove salts and once all salts were removed the product was eluted with a 1:1
acetonitrile:water solution. The volume of the metalated product obtained was decreased
using an Amicon stirred cell and then lyophilised.
2.4.4 Synthesis of NAc-CoIIIMP8
The acetylation procedure was adopted from a previously published method developed
by Marques and co-workers for the synthesis of NAc-MP8.109 This involved the
preparation of a 50 ml of 0.4 M carbonate buffer at pH 9.30. 6 mg of lyophilized
CoIIIMP8 was transferred into a round-bottomed flask. To this 20 ml of the carbonate
buffer was added to dissolve the CoIIIMP8. To aid dissolution approximately 500 µl of a
1 mM (NH4)2CO3 was added. A 1000 molar excess of acetic anhydride was used to
acetylate CoIIIMP8 (it was assumed that there was a 100% conversion from cytochrome c
to MP8). The CoIIIMP8/carbonate solution was cooled to approximately 3.0 °C, and
acetic anhydride was slowly pippetted into the reaction flask. Care was taken not to
88
allow the reaction to become too vigorous. The reaction flask was allowed to stand for 5
min at 3.0 °C after completely adding acetic anhydride. The temperature was set up to
35.0 °C and the solution was allowed to heat at the rate of the bath and allowed to remain
35.0 °C for 3 hours. Finally, the solution was purified and desalted an Amicon cell to
ensure that all carbonate and acetate species were removed. The final product obtained
was then lyophilised.
2.5 Investigating the Solution Chemistry of NAc-CoIIIMP8
2.5.1 Beer-Lambert Plot of NAc-CoIIIMP8
A concentrated stock solution of NAc-CoIIIMP8 was prepared in distilled water. Small
increments of stock NAc-CoIIIMP8 solution were added to a 1.0 cm pathlength curvette
that contained distilled water. The absorbance at 415.05 nm at 25.0 °C for each increment
was recorded using a Cary 3E spectrophotometer. After the absorbance reached 2.0
AUFS, 200 µl of the final 1.0 cm pathlength curvette mixture was transferred to a 0.1 cm
pathlength curvette. Similarly, small increments of stock NAc-CoIIIMP8 solution were
added to the 0.1 cm pathlength curvette. The absorbance at 415.05 nm at 25.0 °C for each
increment was again recorded using a Cary 3E spectrophotometer. A Beer-Lambert plot
of NAc-CoIIIMP8 in 1.0 M NaOCl4 was determined using the same methods.
It became clear that there was a discrepancy between the absorbance of solutions in the
1.0 cm and the 0.1 cm pathlength curvettes, as far as the absorbance of the same solution;
when corrected for different pathlengths, was different. We suspect (but have not
proved) that this discrepancy arises from the scaling of the curvettes in the housing of the
spectrometer that give pathlengths that are, in effect, different to the actual pathlength of
the curvette. To correct for this, a solution of arbitrary concentration of KMnO4 was
prepared; 100 µl of the KMnO4 solution was added to a 1.0 cm pathlength curvette
containing 1900 µl distilled water. The solution was mixed carefully using a glass rod.
The absorbance at 337.9 nm at 25.0 °C was recorded using a Cary 3E spectrophotometer.
This process was then repeated a further four times. 200 µl of each of the five solutions
89
from the 1.0 cm pathlength curvettes were transferred to 0.1 cm pathlength curvette and
the absorbance for each of the solutions were recorded at 337.9 nm at 25.0 °C using a
Cary 3E spectrophotometer. The mean correction factor for when transferring from the
1.0 cm to 0.1 cm pathlength curvette was then calculated. Finally the all data collected
were corrected accordingly.
2.5.2 Data Analysis
All results were analysed with the computer programme CurveFit197, which employs a
Newton-Raphson procedure.
2.5.3 Determination of Spectroscopic pKas of NAc-CoIIIMP8
The titration procedure for the determination of spectroscopic pKas of NAc-CoIIIMP8 was
adopted from a previously published method developed by Munro and co-workers109 for
the synthesis of NAc-FeIIIMP8. Spectroscopic pKas were determined by titrating 40 ml of
a 8.01 µM stock solution of NAc-CoIIIMP8 in a multi-component buffer system
containing 1.0 mM each of potassium hydrogen phthalate, MES, MOPS and CHES, and
10 mM Tris as the non-coordinating buffers at a total ionic strength of 0.1 M (KCl used
as an ionic adjuster) in a thermostated cell at 25.0 °C. The pH was adjusted from pH 5.5
to 13 for the basic region and from 1.9 to 6.3 for the acid region by diffusion of small
volumes of concentrated HCl or NaOH into the solution from drawn out glass capillaries.
At each pH, 5 ml of the solution was pumped (using a Watson-Marlow 101U peristaltic
pump ) into a thermostated 2.0 cm pathlength curvette in a Cary 3E spectrophotometer
and the absorbance at 415.05 nm was recorded before returning the sample to the
continuously stirred reaction mixture. The absorbance at 415.05 nm was recorded as a
function of solution pH.
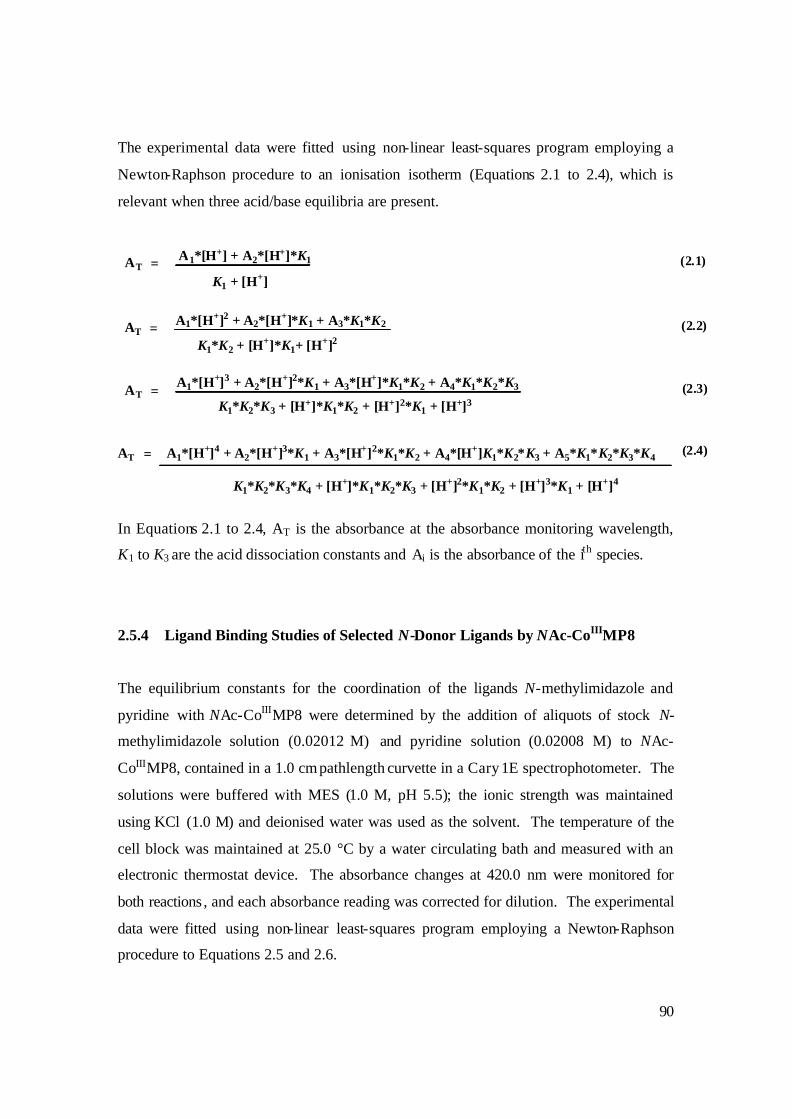
90
The experimental data were fitted using non-linear least-squares program employing a
Newton-Raphson procedure to an ionisation isotherm (Equations 2.1 to 2.4), which is
relevant when three acid/base equilibria are present.
AT =A1*[H+]3 + A2*[H+]2*K1 + A3*[H+]*K1*K2 + A4*K1*K2*K3
K1*K2*K3 + [H+]*K1*K2 + [H+]2*K1 + [H+]3(2.3)
AT = A1*[H+] + A2*[H+]*K1
K1 + [H+](2.1)
AT = A1*[H+]2 + A2*[H+]*K1 + A3*K1*K2
K1*K2 + [H+]*K1+ [H+]2(2.2)
AT = A1*[H+]4 + A2*[H+]3*K1 + A3*[H+]2*K1*K2 + A4*[H+]K1*K2*K3 + A5*K1*K2*K3*K4
K1*K2*K3*K4 + [H+]*K1*K2*K3 + [H+]2*K1*K2 + [H+]3*K1 + [H+]4
(2.4)
In Equations 2.1 to 2.4, AT is the absorbance at the absorbance monitoring wavelength,
K1 to K3 are the acid dissociation constants and Ai is the absorbance of the ith species.
2.5.4 Ligand Binding Studies of Selected N-Donor Ligands by NAc-CoIIIMP8
The equilibrium constants for the coordination of the ligands N-methylimidazole and
pyridine with NAc-CoIIIMP8 were determined by the addition of aliquots of stock N-
methylimidazole solution (0.02012 M) and pyridine solution (0.02008 M) to NAc-
CoIIIMP8, contained in a 1.0 cm pathlength curvette in a Cary 1E spectrophotometer. The
solutions were buffered with MES (1.0 M, pH 5.5); the ionic strength was maintained
using KCl (1.0 M) and deionised water was used as the solvent. The temperature of the
cell block was maintained at 25.0 °C by a water circulating bath and measured with an
electronic thermostat device. The absorbance changes at 420.0 nm were monitored for
both reactions , and each absorbance reading was corrected for dilution. The experimental
data were fitted using non-linear least-squares program employing a Newton-Raphson
procedure to Equations 2.5 and 2.6.
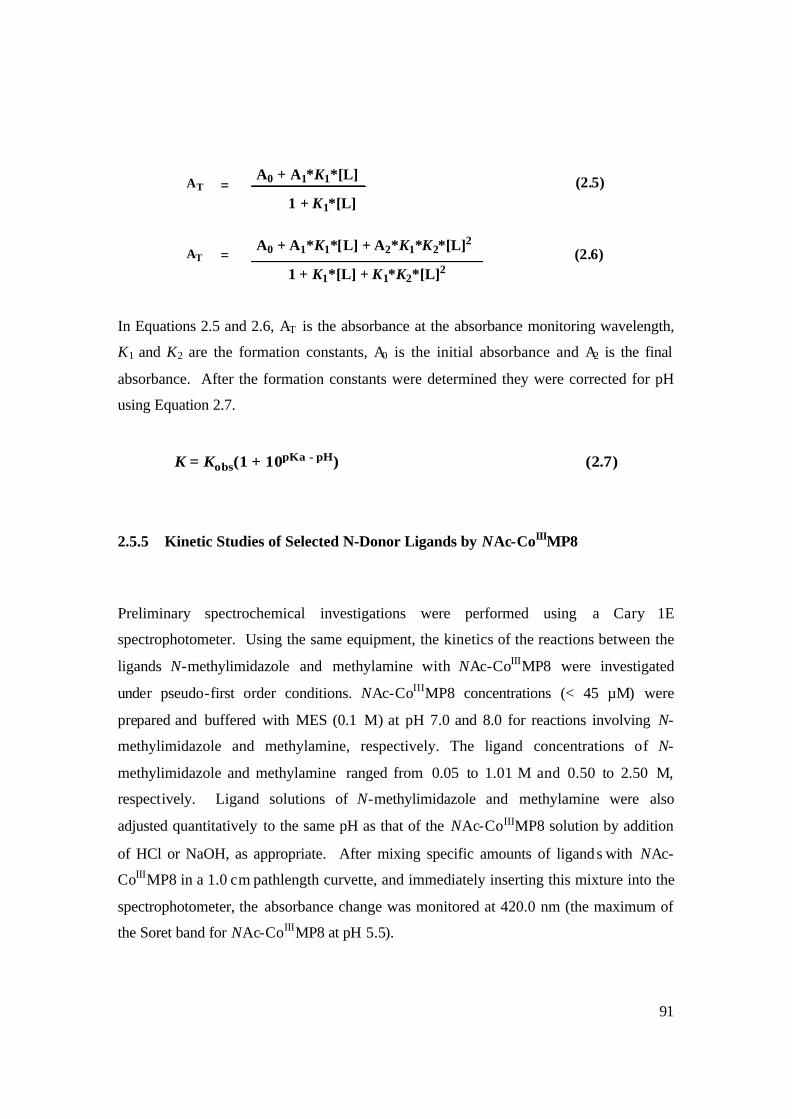
91
A0 + A1*K1*[L] + A2*K1*K2*[L]2AT =
1 + K1*[L] + K1*K2*[L]2(2.6)
A0 + A1*K1*[L]AT =
1 + K1*[L](2.5)
In Equations 2.5 and 2.6, AT is the absorbance at the absorbance monitoring wavelength,
K1 and K2 are the formation constants, A0 is the initial absorbance and A2 is the final
absorbance. After the formation constants were determined they were corrected for pH
using Equation 2.7.
K = Kobs(1 + 10pKa - pH) (2.7)
2.5.5 Kinetic Studies of Selected N-Donor Ligands by NAc-CoIIIMP8
Preliminary spectrochemical investigations were performed using a Cary 1E
spectrophotometer. Using the same equipment, the kinetics of the reactions between the
ligands N-methylimidazole and methylamine with NAc-CoIIIMP8 were investigated
under pseudo-first order conditions. NAc-CoIIIMP8 concentrations (< 45 µM) were
prepared and buffered with MES (0.1 M) at pH 7.0 and 8.0 for reactions involving N-
methylimidazole and methylamine, respectively. The ligand concentrations of N-
methylimidazole and methylamine ranged from 0.05 to 1.01 M and 0.50 to 2.50 M,
respectively. Ligand solutions of N-methylimidazole and methylamine were also
adjusted quantitatively to the same pH as that of the NAc-CoIIIMP8 solution by addition
of HCl or NaOH, as appropriate. After mixing specific amounts of ligands with NAc-
CoIIIMP8 in a 1.0 cm pathlength curvette, and immediately inserting this mixture into the
spectrophotometer, the absorbance change was monitored at 420.0 nm (the maximum of
the Soret band for NAc-CoIIIMP8 at pH 5.5).
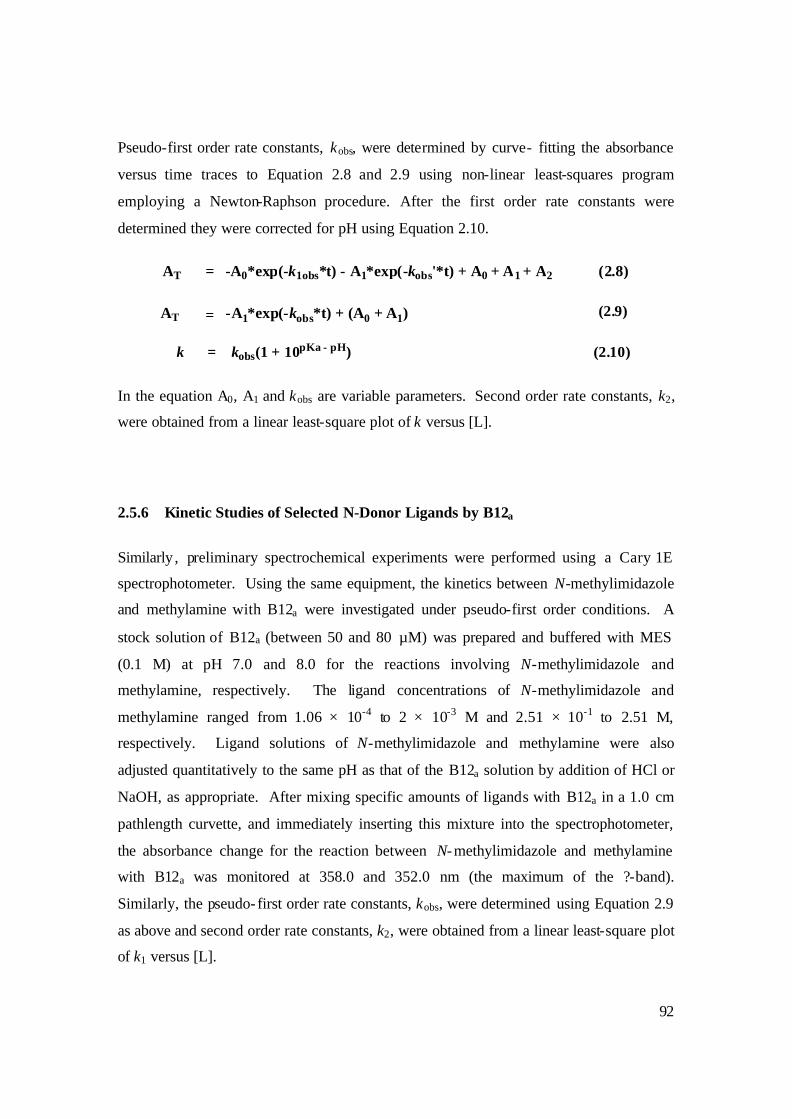
92
Pseudo-first order rate constants, kobs, were determined by curve- fitting the absorbance
versus time traces to Equation 2.8 and 2.9 using non-linear least-squares program
employing a Newton-Raphson procedure. After the first order rate constants were
determined they were corrected for pH using Equation 2.10.
k = kobs(1 + 10pKa - pH) (2.10)
AT = -A0*exp(-k1obs*t) - A1*exp(-kobs'*t) + A0 + A1 + A2 (2.8)
-A1*exp(-kobs*t) + (A0 + A1)AT = (2.9)
In the equation A0, A1 and kobs are variable parameters. Second order rate constants, k2,
were obtained from a linear least-square plot of k versus [L].
2.5.6 Kinetic Studies of Selected N-Donor Ligands by B12a
Similarly , preliminary spectrochemical experiments were performed using a Cary 1E
spectrophotometer. Using the same equipment, the kinetics between N-methylimidazole
and methylamine with B12a were investigated under pseudo-first order conditions. A
stock solution of B12a (between 50 and 80 µM) was prepared and buffered with MES
(0.1 M) at pH 7.0 and 8.0 for the reactions involving N-methylimidazole and
methylamine, respectively. The ligand concentrations of N-methylimidazole and
methylamine ranged from 1.06 × 10⁻⁴ to 2 × 10⁻³ M and 2.51 × 10⁻¹ to 2.51 M,
respectively. Ligand solutions of N-methylimidazole and methylamine were also
adjusted quantitatively to the same pH as that of the B12a solution by addition of HCl or
NaOH, as appropriate. After mixing specific amounts of ligands with B12a in a 1.0 cm
pathlength curvette, and immediately inserting this mixture into the spectrophotometer,
the absorbance change for the reaction between N-methylimidazole and methylamine
with B12a was monitored at 358.0 and 352.0 nm (the maximum of the ?-band).
Similarly, the pseudo- first order rate constants, kobs, were determined using Equation 2.9
as above and second order rate constants, k2, were obtained from a linear least-square plot
of k1 versus [L].
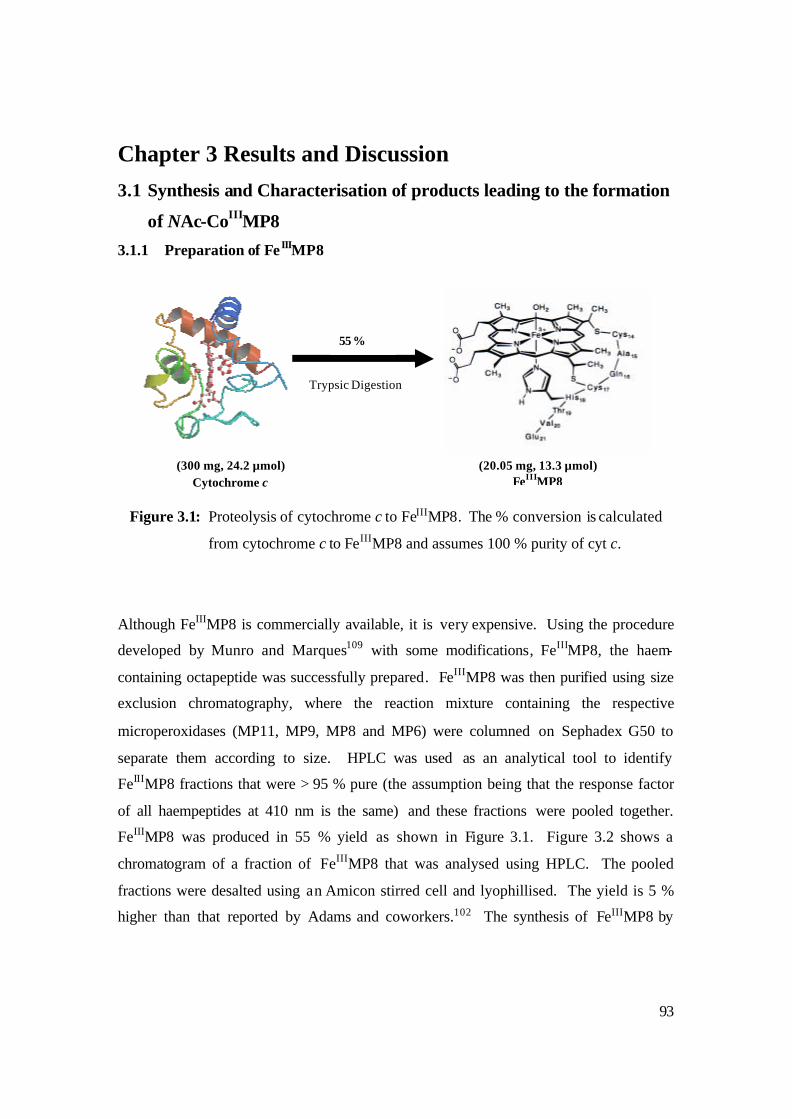
93
Chapter 3 Results and Discussion 3.1 Synthesis and Characterisation of products leading to the formation
of NAc-CoIIIMP8
3.1.1 Preparation of Fe IIIMP8
Figure 3.1: Proteolysis of cytochrome c to FeIIIMP8. The % conversion is calculated
from cytochrome c to FeIIIMP8 and assumes 100 % purity of cyt c.
Although FeIIIMP8 is commercially available, it is very expensive. Using the procedure
developed by Munro and Marques109 with some modifications, FeIIIMP8, the haem-
containing octapeptide was successfully prepared. FeIIIMP8 was then purified using size
exclusion chromatography, where the reaction mixture containing the respective
microperoxidases (MP11, MP9, MP8 and MP6) were columned on Sephadex G50 to
separate them according to size. HPLC was used as an analytical tool to identify
FeIIIMP8 fractions that were > 95 % pure (the assumption being that the response factor
of all haempeptides at 410 nm is the same) and these fractions were pooled together.
FeIIIMP8 was produced in 55 % yield as shown in Figure 3.1. Figure 3.2 shows a
chromatogram of a fraction of FeIIIMP8 that was analysed using HPLC. The pooled
fractions were desalted using an Amicon stirred cell and lyophillised. The yield is 5 %
higher than that reported by Adams and coworkers.102 The synthesis of FeIIIMP8 by
(300 mg, 24.2 µmol) Cytochrome c
(20.05 mg, 13.3 µmol) FeIIIMP8
55 %
Trypsic Digestion

94
peptic and trypsic digestion of cytochrome c was performed several times with
reproducible yields.
Figure 3.2: HPLC analysis of FeIIIMP8 (retention time of 6.45 minutes) with
> 95% purity after purification on a column of Sephadex G50.
Figure 3.3: UV/visible spectrum of FeIIIMP8 in distilled water.
6 7
MP8
0.0
0.3
0.6
0.9
1.2
1.5
300 350 400 450 500 550 600 650 700
Wavelength / nm
Abs
orba
nce
0.00
0.03
0.06
0.09
450 500 550 600 650 700
Qv
Qo
CT1 CT2
B
N
Time (Min)
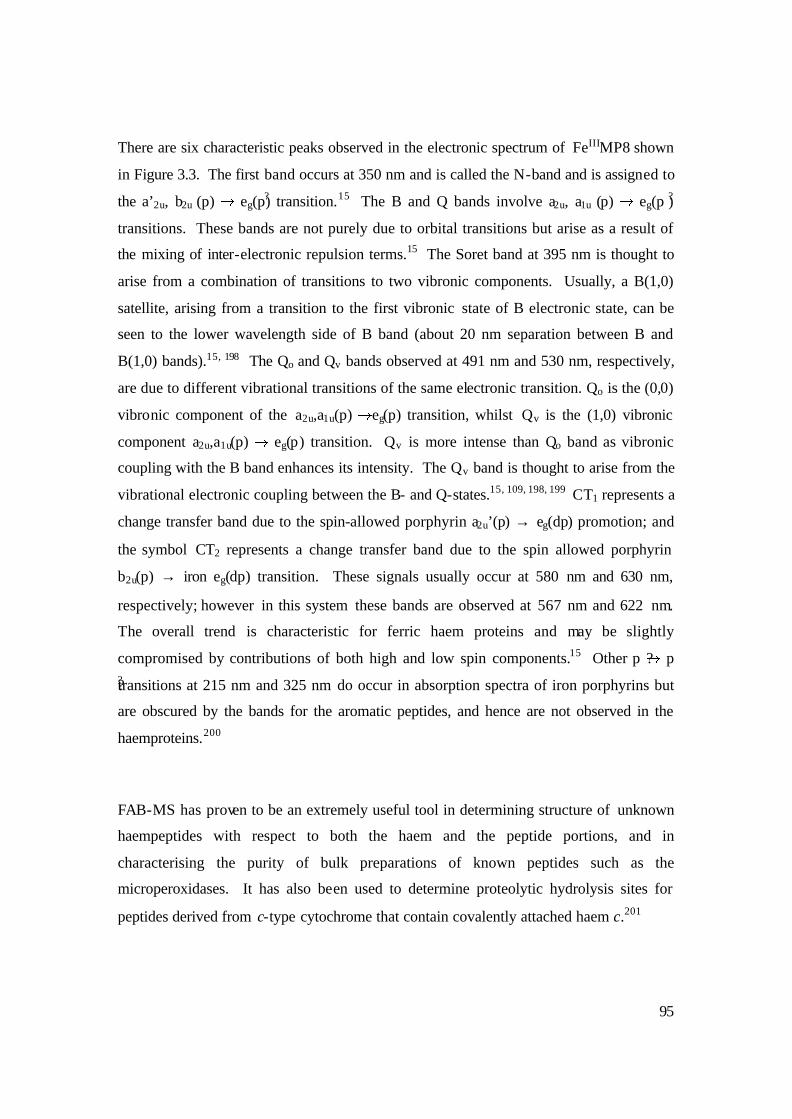
95
There are six characteristic peaks observed in the electronic spectrum of FeIIIMP8 shown
in Figure 3.3. The first band occurs at 350 nm and is called the N-band and is assigned to
the a’2u, b2u (p) eg(p?) transition.15 The B and Q bands involve a2u, a1u (p) eg(p ?)
transitions. These bands are not purely due to orbital transitions but arise as a result of
the mixing of inter-electronic repulsion terms.15 The Soret band at 395 nm is thought to
arise from a combination of transitions to two vibronic components. Usually, a B(1,0)
satellite, arising from a transition to the first vibronic state of B electronic state, can be
seen to the lower wavelength side of B band (about 20 nm separation between B and
B(1,0) bands).15, 198 The Qo and Qv bands observed at 491 nm and 530 nm, respectively,
are due to different vibrational transitions of the same electronic transition. Qo is the (0,0)
vibronic component of the a2u,a1u(p) eg(p) transition, whilst Qv is the (1,0) vibronic
component a2u,a1u(p) eg(p) transition. Qv is more intense than Qo band as vibronic
coupling with the B band enhances its intensity. The Qv band is thought to arise from the
vibrational electronic coupling between the B- and Q-states.15, 109, 198, 199 CT1 represents a
change transfer band due to the spin-allowed porphyrin a2u’(p) → eg(dp) promotion; and
the symbol CT2 represents a change transfer band due to the spin allowed porphyrin
b2u(p) → iron eg(dp) transition. These signals usually occur at 580 nm and 630 nm,
respectively; however in this system these bands are observed at 567 nm and 622 nm.
The overall trend is characteristic for ferric haem proteins and may be slightly
compromised by contributions of both high and low spin components.15 Other p ? p
??transitions at 215 nm and 325 nm do occur in absorption spectra of iron porphyrins but
are obscured by the bands for the aromatic peptides, and hence are not observed in the
haemproteins.200
FAB-MS has proven to be an extremely useful tool in determining structure of unknown
haempeptides with respect to both the haem and the peptide portions, and in
characterising the purity of bulk preparations of known peptides such as the
microperoxidases. It has also been used to determine proteolytic hydrolysis sites for
peptides derived from c-type cytochrome that contain covalently attached haem c.201
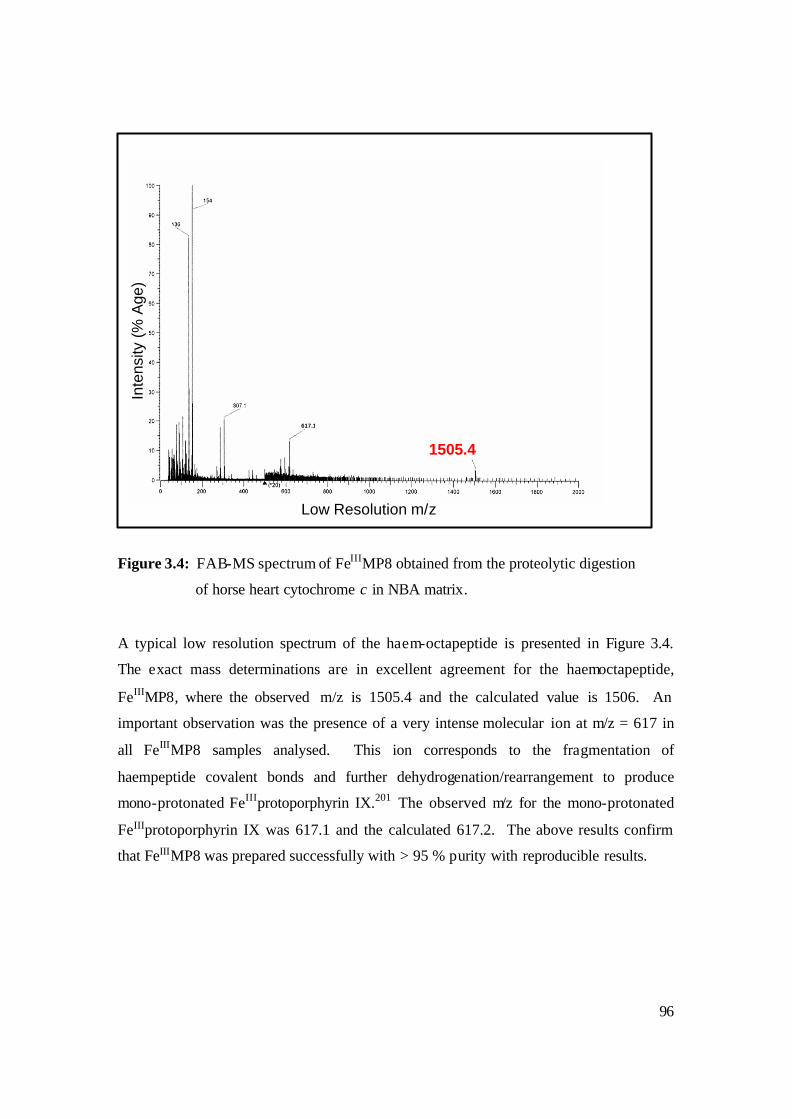
96
Figure 3.4: FAB-MS spectrum of FeIIIMP8 obtained from the proteolytic digestion
of horse heart cytochrome c in NBA matrix.
A typical low resolution spectrum of the haem-octapeptide is presented in Figure 3.4.
The exact mass determinations are in excellent agreement for the haemoctapeptide,
FeIIIMP8, where the observed m/z is 1505.4 and the calculated value is 1506. An
important observation was the presence of a very intense molecular ion at m/z = 617 in
all FeIIIMP8 samples analysed. This ion corresponds to the fragmentation of
haempeptide covalent bonds and further dehydrogenation/rearrangement to produce
mono-protonated FeIIIprotoporphyrin IX.201 The observed m/z for the mono-protonated
FeIIIprotoporphyrin IX was 617.1 and the calculated 617.2. The above results confirm
that FeIIIMP8 was prepared successfully with > 95 % purity with reproducible results.
Low Resolution m/z
Inte
nsity
(%
Age
)
617.1
1505.4
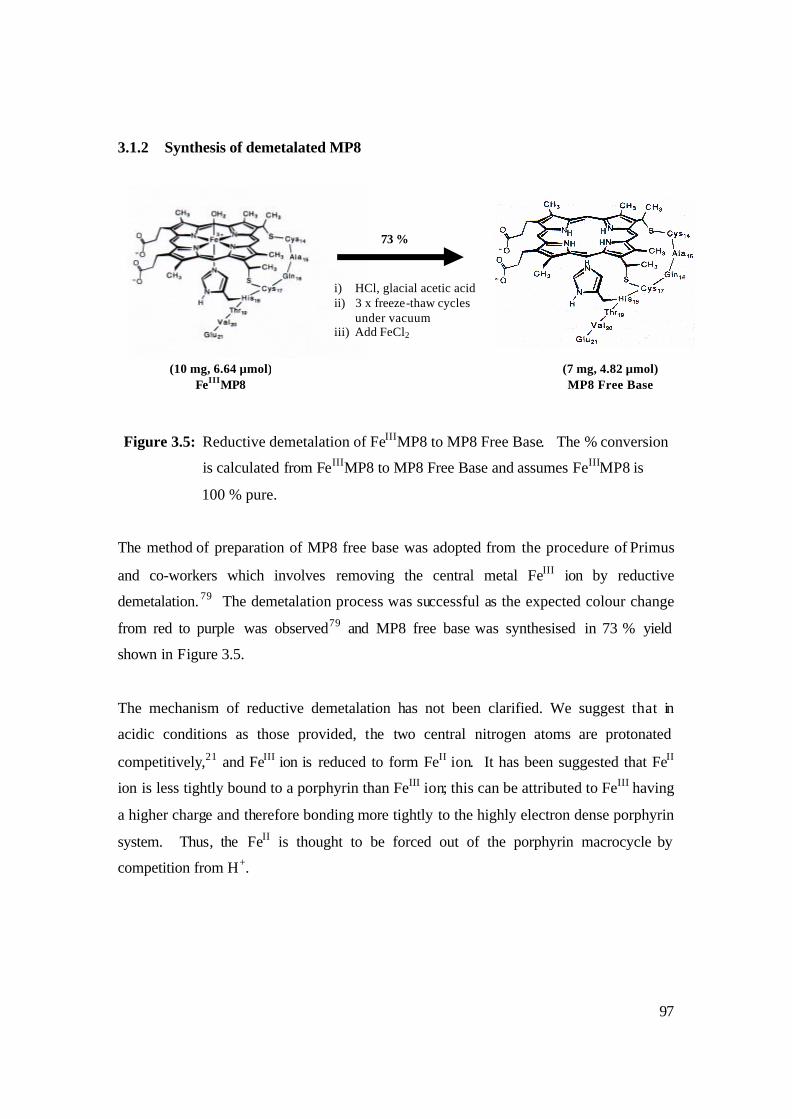
97
3.1.2 Synthesis of demetalated MP8
Figure 3.5: Reductive demetalation of FeIIIMP8 to MP8 Free Base. The % conversion
is calculated from FeIIIMP8 to MP8 Free Base and assumes FeIIIMP8 is
100 % pure.
The method of preparation of MP8 free base was adopted from the procedure of Primus
and co-workers which involves removing the central metal FeIII ion by reductive
demetalation. 79 The demetalation process was successful as the expected colour change
from red to purple was observed79 and MP8 free base was synthesised in 73 % yield
shown in Figure 3.5.
The mechanism of reductive demetalation has not been clarified. We suggest that in
acidic conditions as those provided, the two central nitrogen atoms are protonated
competitively,21 and FeIII ion is reduced to form FeII ion. It has been suggested that FeII
ion is less tightly bound to a porphyrin than FeIII ion; this can be attributed to FeIII having
a higher charge and therefore bonding more tightly to the highly electron dense porphyrin
system. Thus, the FeII is thought to be forced out of the porphyrin macrocycle by
competition from H+.
(10 mg, 6.64 µmol) FeIIIMP8
(7 mg, 4.82 µmol) MP8 Free Base
73 %
i) HCl, glacial acetic acid ii) 3 x freeze-thaw cycles under vacuum iii) Add FeCl2
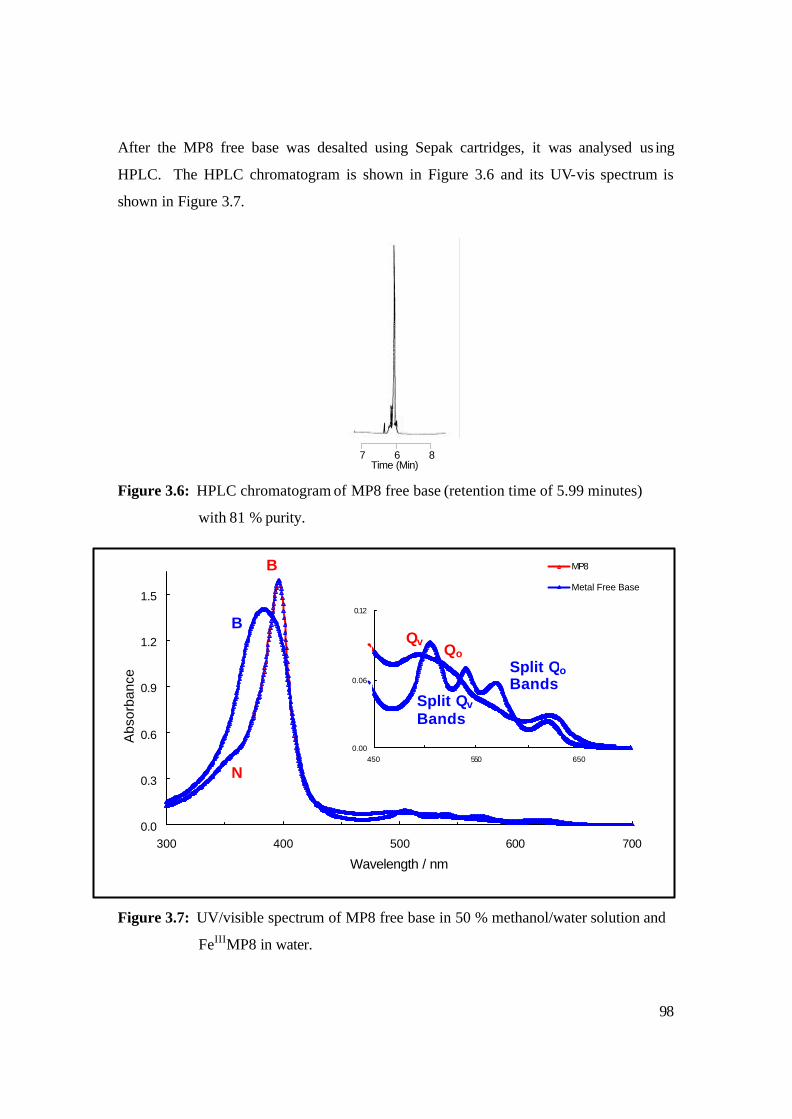
98
After the MP8 free base was desalted using Sepak cartridges, it was analysed us ing
HPLC. The HPLC chromatogram is shown in Figure 3.6 and its UV-vis spectrum is
shown in Figure 3.7.
Figure 3.6: HPLC chromatogram of MP8 free base (retention time of 5.99 minutes)
with 81 % purity.
Figure 3.7: UV/visible spectrum of MP8 free base in 50 % methanol/water solution and
FeIIIMP8 in water.
0.0
0.3
0.6
0.9
1.2
1.5
300 400 500 600 700
Wavelength / nm
Abs
orba
nce
MP8
Metal Free Base
0.00
0.06
0.12
450 550 650
B
B Qv
Qo
Split Qv Bands
Split Qo Bands
N
7 6 8 Time (Min)
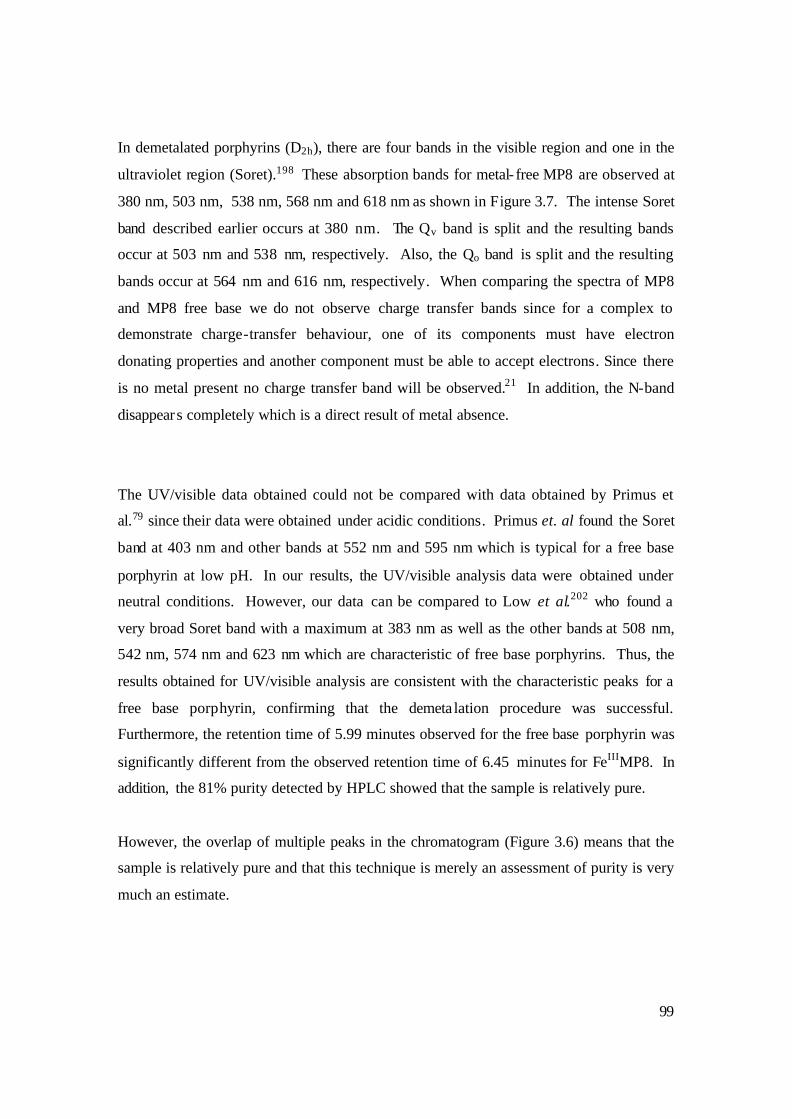
99
In demetalated porphyrins (D2h), there are four bands in the visible region and one in the
ultraviolet region (Soret).198 These absorption bands for metal- free MP8 are observed at
380 nm, 503 nm, 538 nm, 568 nm and 618 nm as shown in Figure 3.7. The intense Soret
band described earlier occurs at 380 nm. The Qv band is split and the resulting bands
occur at 503 nm and 538 nm, respectively. Also, the Qo band is split and the resulting
bands occur at 564 nm and 616 nm, respectively. When comparing the spectra of MP8
and MP8 free base we do not observe charge transfer bands since for a complex to
demonstrate charge-transfer behaviour, one of its components must have electron
donating properties and another component must be able to accept electrons. Since there
is no metal present no charge transfer band will be observed.21 In addition, the N-band
disappears completely which is a direct result of metal absence.
The UV/visible data obtained could not be compared with data obtained by Primus et
al.79 since their data were obtained under acidic conditions. Primus et. al found the Soret
band at 403 nm and other bands at 552 nm and 595 nm which is typical for a free base
porphyrin at low pH. In our results, the UV/visible analysis data were obtained under
neutral conditions. However, our data can be compared to Low et al.202 who found a
very broad Soret band with a maximum at 383 nm as well as the other bands at 508 nm,
542 nm, 574 nm and 623 nm which are characteristic of free base porphyrins. Thus, the
results obtained for UV/visible analysis are consistent with the characteristic peaks for a
free base porphyrin, confirming that the demeta lation procedure was successful.
Furthermore, the retention time of 5.99 minutes observed for the free base porphyrin was
significantly different from the observed retention time of 6.45 minutes for FeIIIMP8. In
addition, the 81% purity detected by HPLC showed that the sample is relatively pure.
However, the overlap of multiple peaks in the chromatogram (Figure 3.6) means that the
sample is relatively pure and that this technique is merely an assessment of purity is very
much an estimate.
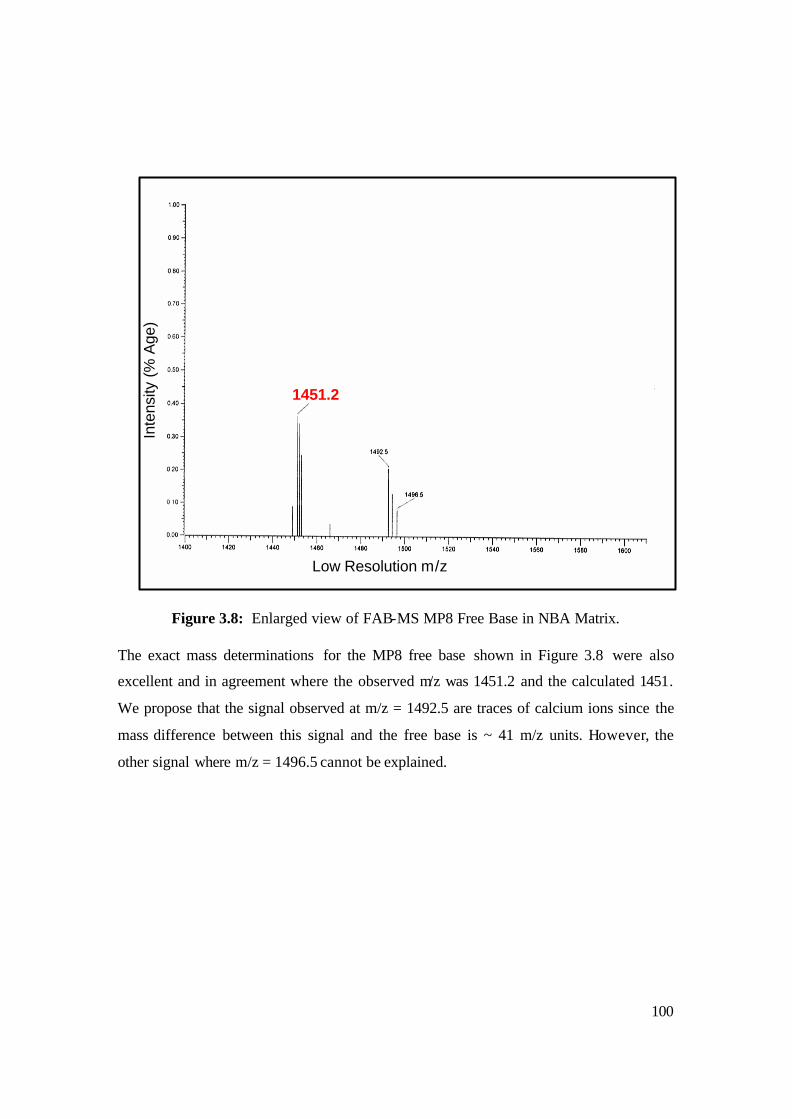
100
Figure 3.8: Enlarged view of FAB-MS MP8 Free Base in NBA Matrix.
The exact mass determinations for the MP8 free base shown in Figure 3.8 were also
excellent and in agreement where the observed m/z was 1451.2 and the calculated 1451.
We propose that the signal observed at m/z = 1492.5 are traces of calcium ions since the
mass difference between this signal and the free base is ~ 41 m/z units. However, the
other signal where m/z = 1496.5 cannot be explained.
Low Resolution m/z
Inte
nsity
(%
Age
)
1451.2
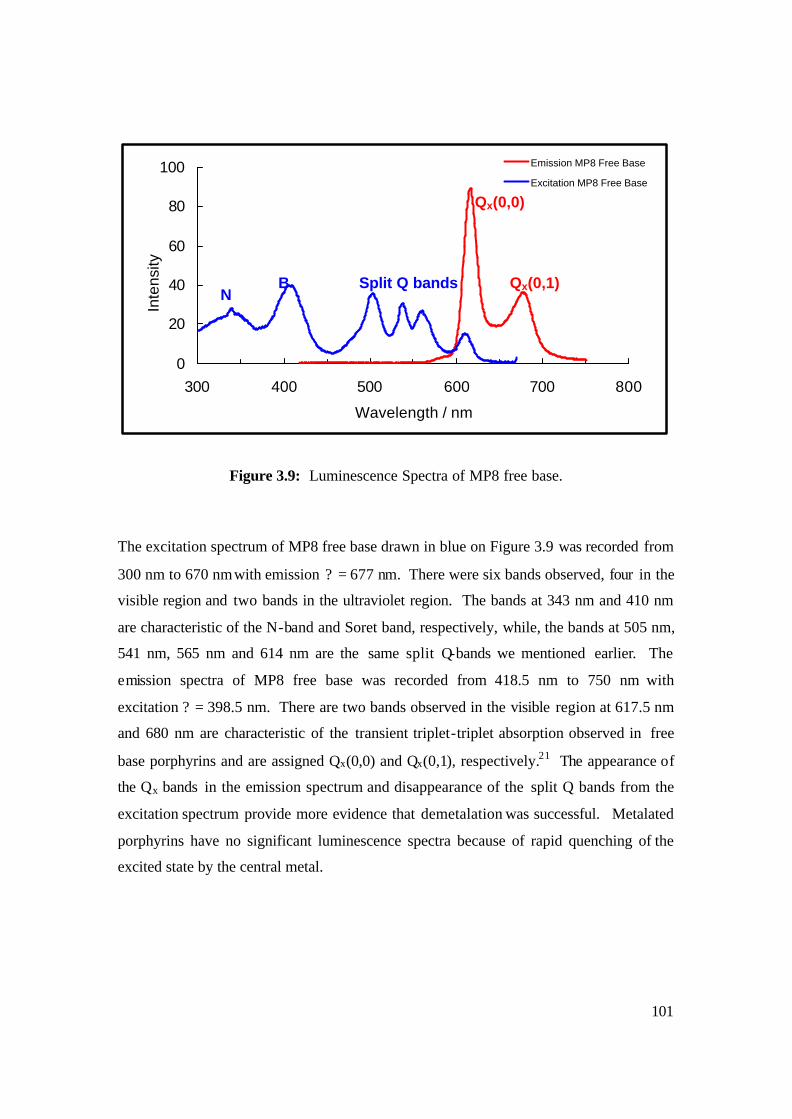
101
0
20
40
60
80
100
300 400 500 600 700 800
Wavelength / nm
Inte
nsity
Emission MP8 Free Base
Excitation MP8 Free Base
Figure 3.9: Luminescence Spectra of MP8 free base.
The excitation spectrum of MP8 free base drawn in blue on Figure 3.9 was recorded from
300 nm to 670 nm with emission ? = 677 nm. There were six bands observed, four in the
visible region and two bands in the ultraviolet region. The bands at 343 nm and 410 nm
are characteristic of the N-band and Soret band, respectively, while, the bands at 505 nm,
541 nm, 565 nm and 614 nm are the same split Q-bands we mentioned earlier. The
emission spectra of MP8 free base was recorded from 418.5 nm to 750 nm with
excitation ? = 398.5 nm. There are two bands observed in the visible region at 617.5 nm
and 680 nm are characteristic of the transient triplet-triplet absorption observed in free
base porphyrins and are assigned Qx(0,0) and Qx(0,1), respectively.21 The appearance of
the Qx bands in the emission spectrum and disappearance of the split Q bands from the
excitation spectrum provide more evidence that demetalation was successful. Metalated
porphyrins have no significant luminescence spectra because of rapid quenching of the
excited state by the central metal.
N B Split Q bands
Qx(0,0)
Qx(0,1)
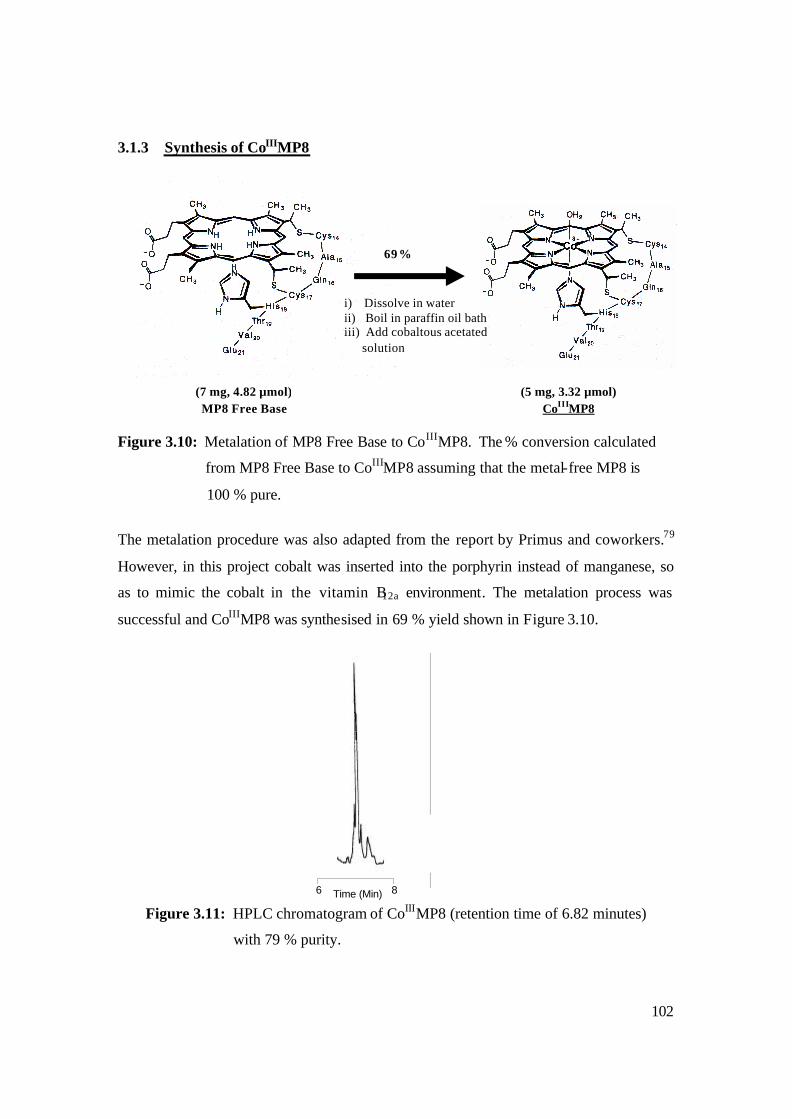
102
3.1.3 Synthesis of CoIIIMP8
Figure 3.10: Metalation of MP8 Free Base to CoIIIMP8. The % conversion calculated
from MP8 Free Base to CoIIIMP8 assuming that the metal-free MP8 is
100 % pure.
The metalation procedure was also adapted from the report by Primus and coworkers.79
However, in this project cobalt was inserted into the porphyrin instead of manganese, so
as to mimic the cobalt in the vitamin B12a environment. The metalation process was
successful and CoIIIMP8 was synthesised in 69 % yield shown in Figure 3.10.
Figure 3.11: HPLC chromatogram of CoIIIMP8 (retention time of 6.82 minutes)
with 79 % purity.
(7 mg, 4.82 µmol) MP8 Free Base
(5 mg, 3.32 µmol) CoIIIMP8
69 %
i) Dissolve in water ii) Boil in paraffin oil bath iii) Add cobaltous acetated solution
6 8
Time (Min)
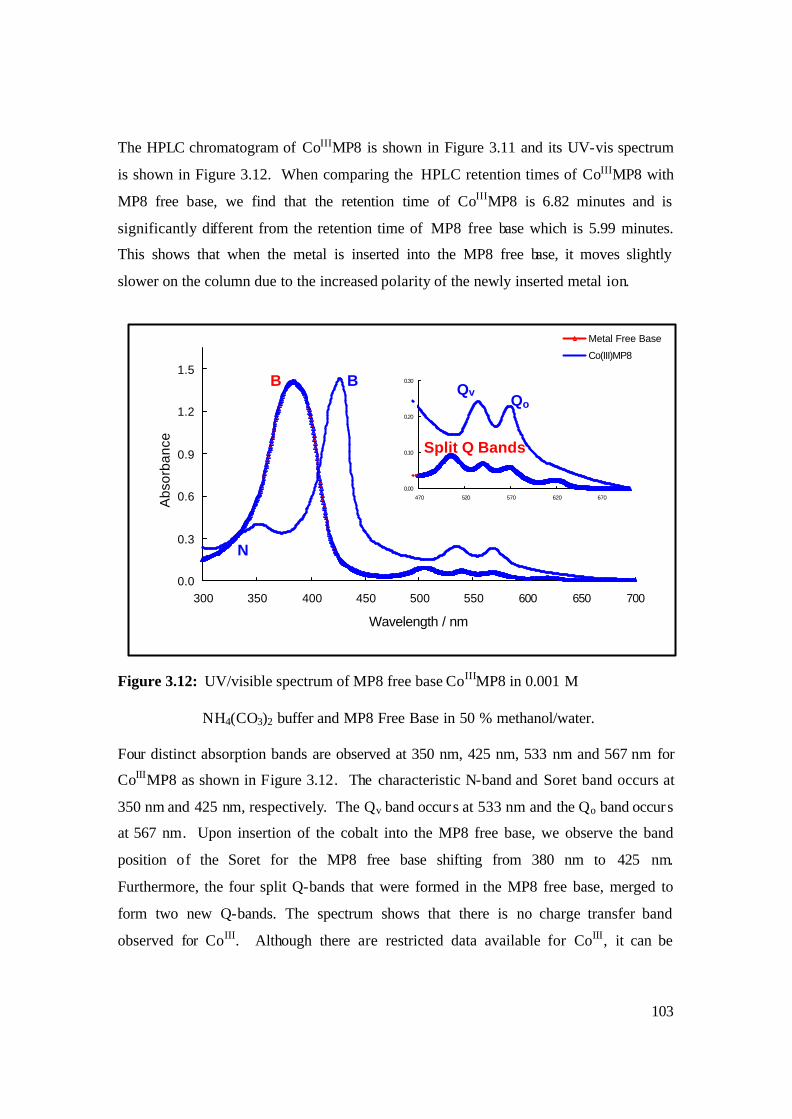
103
The HPLC chromatogram of CoIIIMP8 is shown in Figure 3.11 and its UV-vis spectrum
is shown in Figure 3.12. When comparing the HPLC retention times of CoIIIMP8 with
MP8 free base, we find that the retention time of CoIIIMP8 is 6.82 minutes and is
significantly different from the retention time of MP8 free base which is 5.99 minutes.
This shows that when the metal is inserted into the MP8 free base, it moves slightly
slower on the column due to the increased polarity of the newly inserted metal ion.
Figure 3.12: UV/visible spectrum of MP8 free base CoIIIMP8 in 0.001 M
NH4(CO3)2 buffer and MP8 Free Base in 50 % methanol/water.
Four distinct absorption bands are observed at 350 nm, 425 nm, 533 nm and 567 nm for
CoIIIMP8 as shown in Figure 3.12. The characteristic N-band and Soret band occurs at
350 nm and 425 nm, respectively. The Qv band occurs at 533 nm and the Qo band occurs
at 567 nm. Upon insertion of the cobalt into the MP8 free base, we observe the band
position of the Soret for the MP8 free base shifting from 380 nm to 425 nm.
Furthermore, the four split Q-bands that were formed in the MP8 free base, merged to
form two new Q-bands. The spectrum shows that there is no charge transfer band
observed for CoIII. Although there are restricted data available for CoIII, it can be
0.0
0.3
0.6
0.9
1.2
1.5
300 350 400 450 500 550 600 650 700
Wavelength / nm
Abs
orba
nce
Metal Free Base
Co(III)MP8
0.00
0.10
0.20
0.30
470 520 570 620 670
B B
Split Q Bands
Qv Qo
N
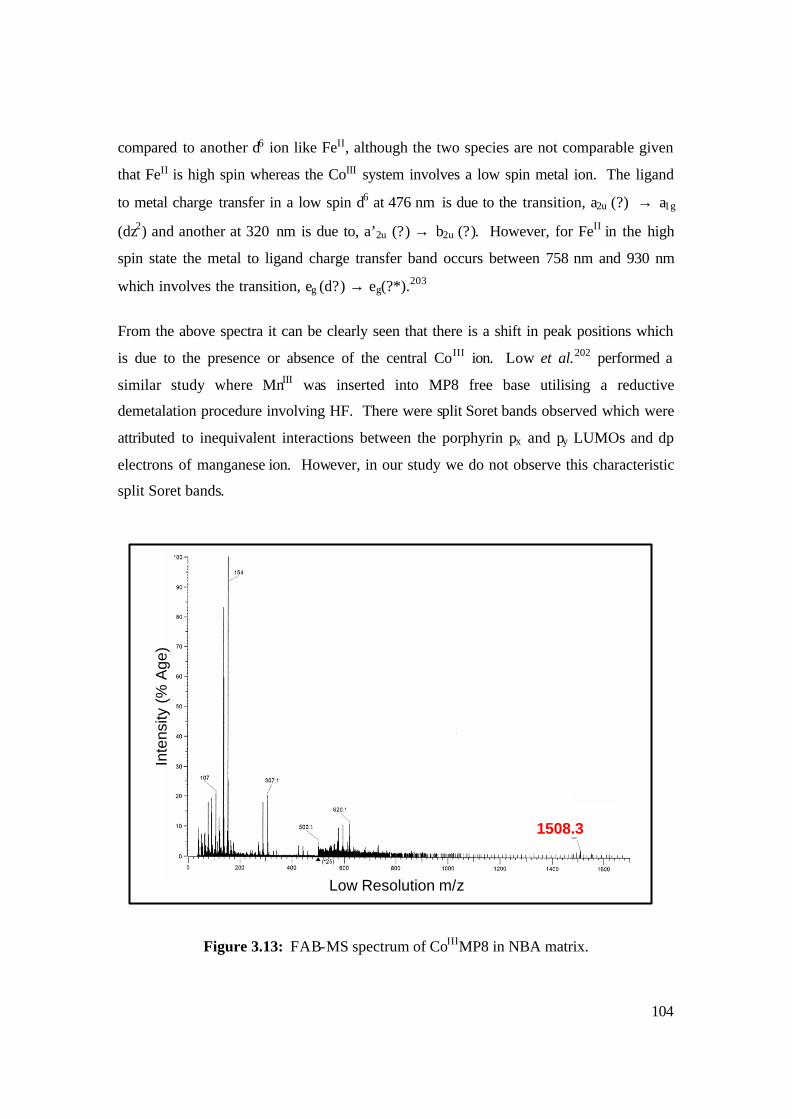
104
compared to another d6 ion like FeII, although the two species are not comparable given
that FeII is high spin whereas the CoIII system involves a low spin metal ion. The ligand
to metal charge transfer in a low spin d6 at 476 nm is due to the transition, a2u (?) → a1g
(dz2) and another at 320 nm is due to, a’2u (?) → b2u (?). However, for FeII in the high
spin state the metal to ligand charge transfer band occurs between 758 nm and 930 nm
which involves the transition, eg (d?) → eg(?*).203
From the above spectra it can be clearly seen that there is a shift in peak positions which
is due to the presence or absence of the central CoIII ion. Low et al.202 performed a
similar study where MnIII was inserted into MP8 free base utilising a reductive
demetalation procedure involving HF. There were split Soret bands observed which were
attributed to inequivalent interactions between the porphyrin px and py LUMOs and dp
electrons of manganese ion. However, in our study we do not observe this characteristic
split Soret bands.
Figure 3.13: FAB-MS spectrum of CoIIIMP8 in NBA matrix.
Low Resolution m/z
Inte
nsity
(%
Age
)
1508.3
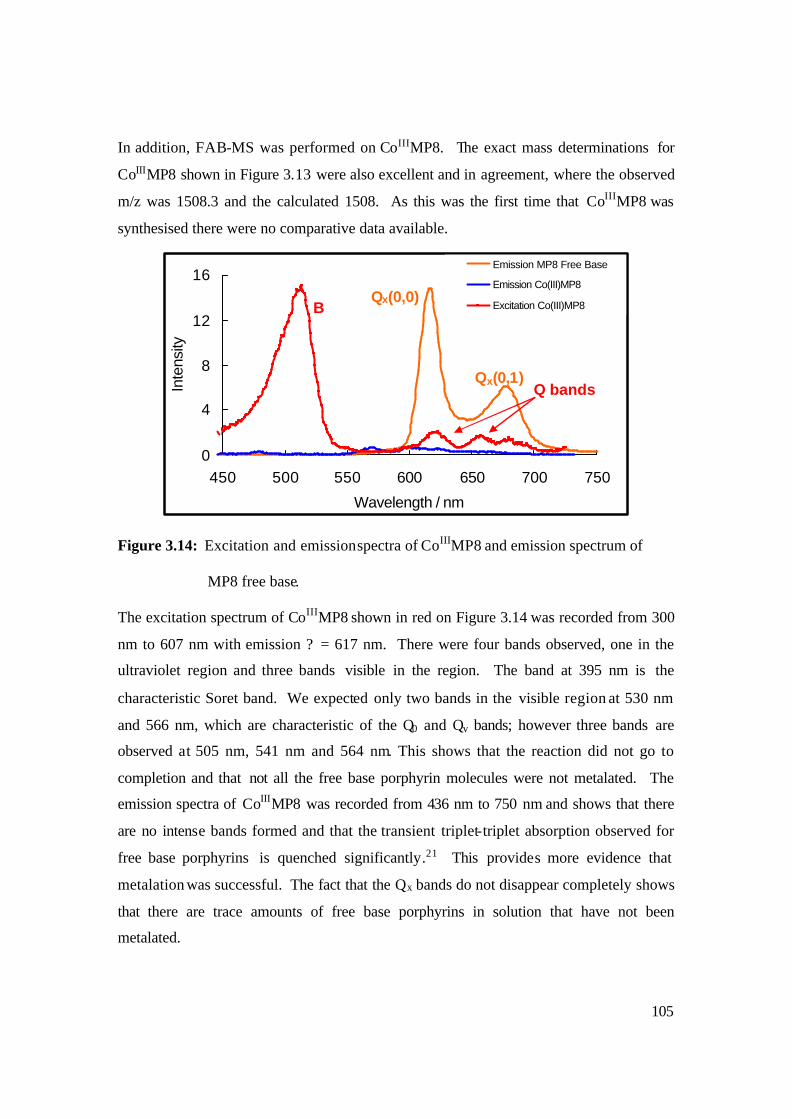
105
In addition, FAB-MS was performed on CoIIIMP8. The exact mass determinations for
CoIIIMP8 shown in Figure 3.13 were also excellent and in agreement, where the observed
m/z was 1508.3 and the calculated 1508. As this was the first time that CoIIIMP8 was
synthesised there were no comparative data available.
0
4
8
12
16
450 500 550 600 650 700 750
Wavelength / nm
Inte
nsity
Emission MP8 Free Base
Emission Co(III)MP8
Excitation Co(III)MP8
Figure 3.14: Excitation and emission spectra of CoIIIMP8 and emission spectrum of
MP8 free base.
The excitation spectrum of CoIIIMP8 shown in red on Figure 3.14 was recorded from 300
nm to 607 nm with emission ? = 617 nm. There were four bands observed, one in the
ultraviolet region and three bands visible in the region. The band at 395 nm is the
characteristic Soret band. We expected only two bands in the visible region at 530 nm
and 566 nm, which are characteristic of the Q0 and Qv bands; however three bands are
observed at 505 nm, 541 nm and 564 nm. This shows that the reaction did not go to
completion and that not all the free base porphyrin molecules were not metalated. The
emission spectra of CoIIIMP8 was recorded from 436 nm to 750 nm and shows that there
are no intense bands formed and that the transient triplet-triplet absorption observed for
free base porphyrins is quenched significantly.21 This provides more evidence that
metalation was successful. The fact that the Qx bands do not disappear completely shows
that there are trace amounts of free base porphyrins in solution that have not been
metalated.
B
Q bands
Qx(0,0)
Qx(0,1)
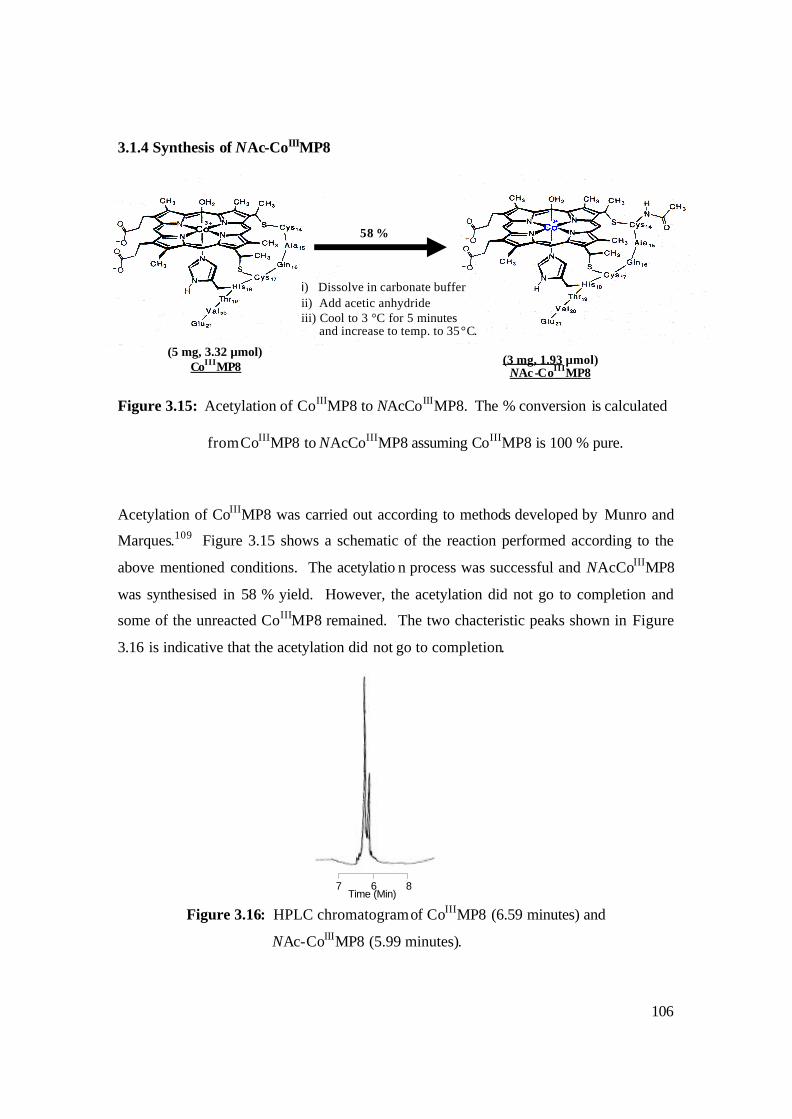
106
3.1.4 Synthesis of NAc-CoIIIMP8
Figure 3.15: Acetylation of CoIIIMP8 to NAcCoIIIMP8. The % conversion is calculated
from CoIIIMP8 to NAcCoIIIMP8 assuming CoIIIMP8 is 100 % pure.
Acetylation of CoIIIMP8 was carried out according to methods developed by Munro and
Marques.109 Figure 3.15 shows a schematic of the reaction performed according to the
above mentioned conditions. The acetylatio n process was successful and NAcCoIIIMP8
was synthesised in 58 % yield. However, the acetylation did not go to completion and
some of the unreacted CoIIIMP8 remained. The two chacteristic peaks shown in Figure
3.16 is indicative that the acetylation did not go to completion.
Figure 3.16: HPLC chromatogram of CoIIIMP8 (6.59 minutes) and
NAc-CoIIIMP8 (5.99 minutes).
i) Dissolve in carbonate buffer ii) Add acetic anhydride iii) Cool to 3 °C for 5 minutes and increase to temp. to 35 °C.
(5 mg, 3.32 µmol) CoIIIMP8 (3 mg, 1.93 µmol)
NAc -CoIIIMP8
58 %
7 6 8 Time (Min)
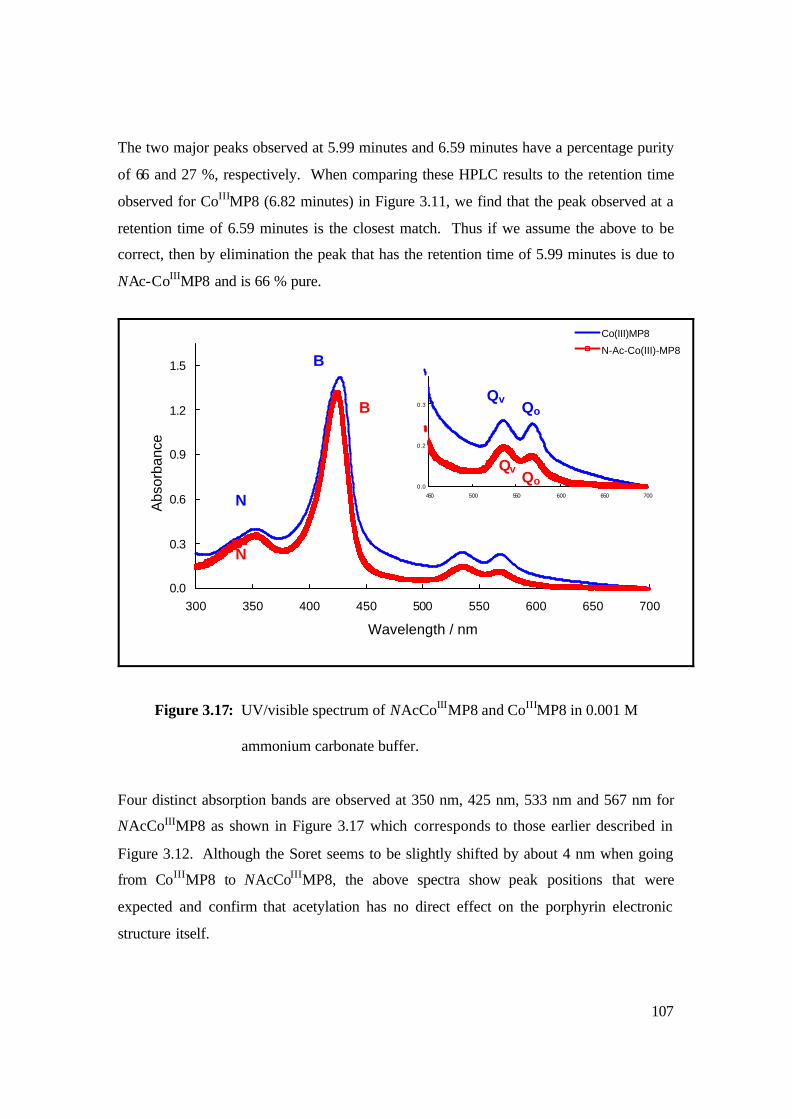
107
The two major peaks observed at 5.99 minutes and 6.59 minutes have a percentage purity
of 66 and 27 %, respectively. When comparing these HPLC results to the retention time
observed for CoIIIMP8 (6.82 minutes) in Figure 3.11, we find that the peak observed at a
retention time of 6.59 minutes is the closest match. Thus if we assume the above to be
correct, then by elimination the peak that has the retention time of 5.99 minutes is due to
NAc-CoIIIMP8 and is 66 % pure.
0.0
0.3
0.6
0.9
1.2
1.5
300 350 400 450 500 550 600 650 700
Wavelength / nm
Abs
orba
nce
Co(III)MP8
N-Ac-Co(III)-MP8
Figure 3.17: UV/visible spectrum of NAcCoIIIMP8 and CoIIIMP8 in 0.001 M
ammonium carbonate buffer.
Four distinct absorption bands are observed at 350 nm, 425 nm, 533 nm and 567 nm for
NAcCoIIIMP8 as shown in Figure 3.17 which corresponds to those earlier described in
Figure 3.12. Although the Soret seems to be slightly shifted by about 4 nm when going
from CoIIIMP8 to NAcCoIIIMP8, the above spectra show peak positions that were
expected and confirm that acetylation has no direct effect on the porphyrin electronic
structure itself.
0.0
0.2
0.3
450 500 550 600 650 700N
N
B
B Qv
Qv Qo
Qo
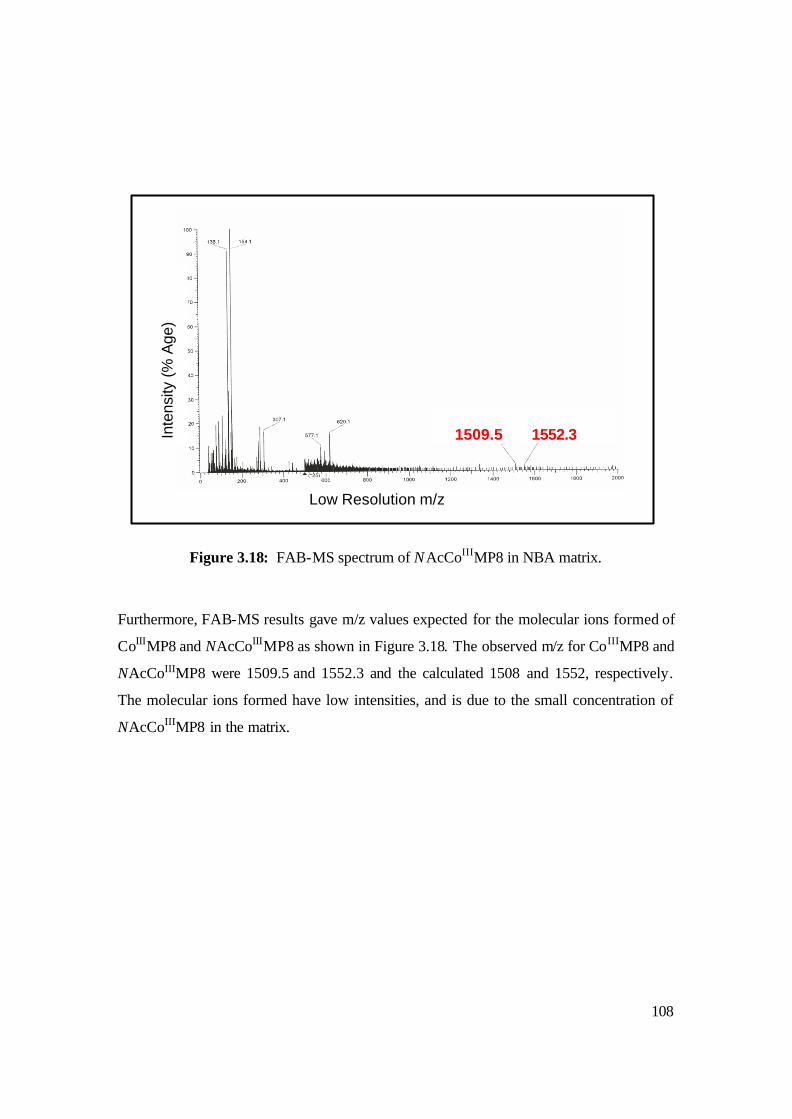
108
Figure 3.18: FAB-MS spectrum of NAcCoIIIMP8 in NBA matrix.
Furthermore, FAB-MS results gave m/z values expected for the molecular ions formed of
CoIIIMP8 and NAcCoIIIMP8 as shown in Figure 3.18. The observed m/z for CoIIIMP8 and
NAcCoIIIMP8 were 1509.5 and 1552.3 and the calculated 1508 and 1552, respectively.
The molecular ions formed have low intensities, and is due to the small concentration of
NAcCoIIIMP8 in the matrix.
Low Resolution m/z
Inte
nsity
(%
Age
)
1509.5 1552.3
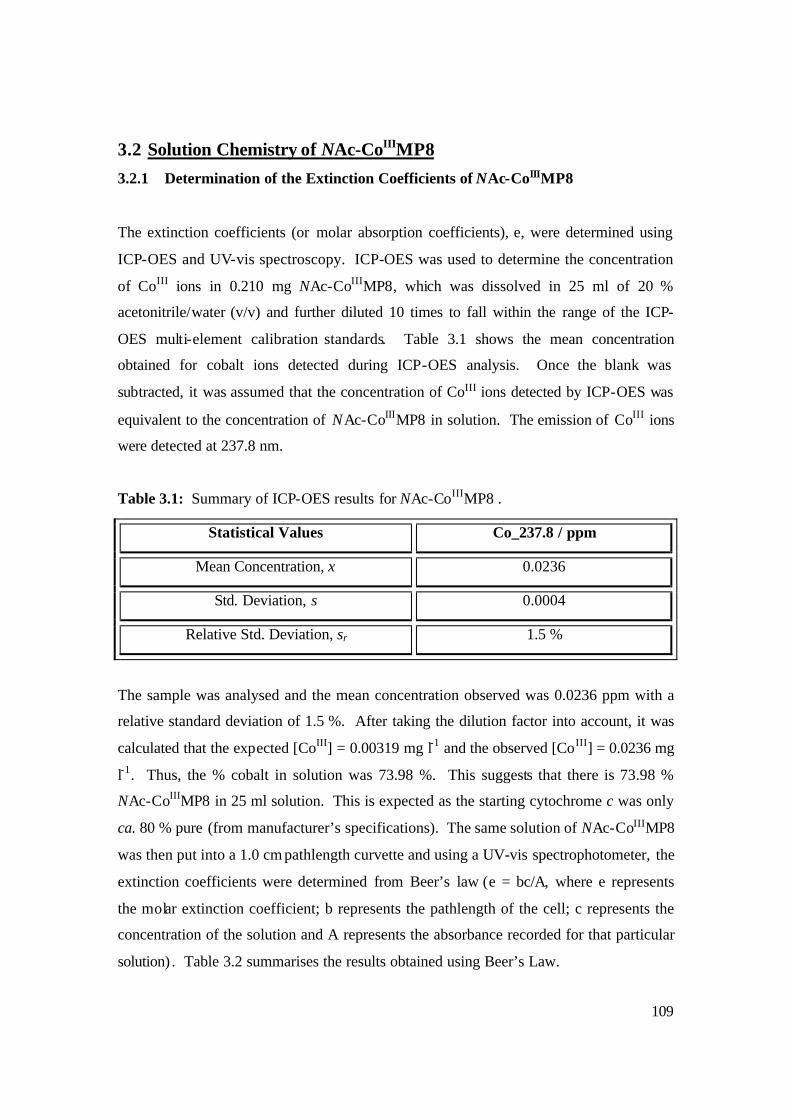
109
3.2 Solution Chemistry of NAc-CoIIIMP8
3.2.1 Determination of the Extinction Coefficients of NAc-CoIIIMP8
The extinction coefficients (or molar absorption coefficients), e, were determined using
ICP-OES and UV-vis spectroscopy. ICP-OES was used to determine the concentration
of CoIII ions in 0.210 mg NAc-CoIIIMP8, which was dissolved in 25 ml of 20 %
acetonitrile/water (v/v) and further diluted 10 times to fall within the range of the ICP-
OES multi-element calibration standards. Table 3.1 shows the mean concentration
obtained for cobalt ions detected during ICP-OES analysis. Once the blank was
subtracted, it was assumed that the concentration of CoIII ions detected by ICP-OES was
equivalent to the concentration of NAc-CoIIIMP8 in solution. The emission of CoIII ions
were detected at 237.8 nm.
Table 3.1: Summary of ICP-OES results for NAc-CoIIIMP8 .
Statistical Values Co_237.8 / ppm
Mean Concentration, x 0.0236
Std. Deviation, s 0.0004
Relative Std. Deviation, sr 1.5 %
The sample was analysed and the mean concentration observed was 0.0236 ppm with a
relative standard deviation of 1.5 %. After taking the dilution factor into account, it was
calculated that the expected [CoIII] = 0.00319 mg l-1 and the observed [CoIII] = 0.0236 mg
l-1. Thus, the % cobalt in solution was 73.98 %. This suggests that there is 73.98 %
NAc-CoIIIMP8 in 25 ml solution. This is expected as the starting cytochrome c was only
ca. 80 % pure (from manufacturer’s specifications). The same solution of NAc-CoIIIMP8
was then put into a 1.0 cm pathlength curvette and using a UV-vis spectrophotometer, the
extinction coefficients were determined from Beer’s law (e = bc/A, where e represents
the molar extinction coefficient; b represents the pathlength of the cell; c represents the
concentration of the solution and A represents the absorbance recorded for that particular
solution) . Table 3.2 summarises the results obtained using Beer’s Law.
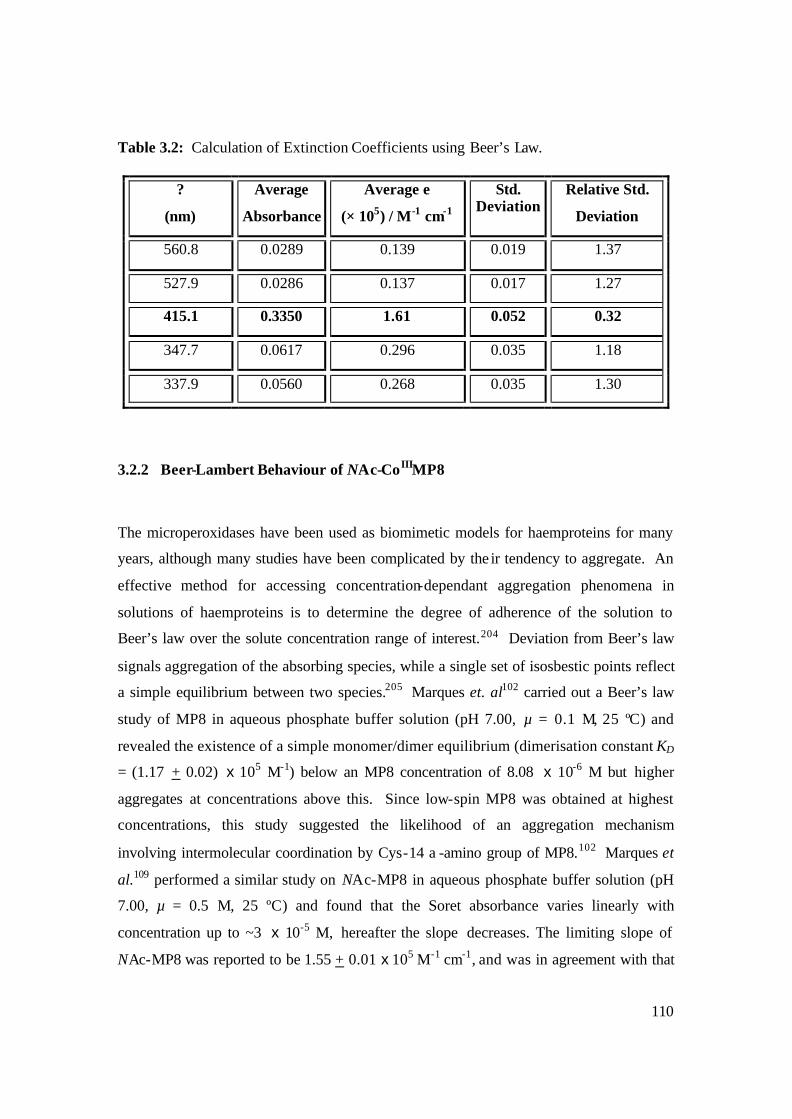
110
Table 3.2: Calculation of Extinction Coefficients using Beer’s Law.
3.2.2 Beer-Lambert Behaviour of NAc-CoIIIMP8
The microperoxidases have been used as biomimetic models for haemproteins for many
years, although many studies have been complicated by the ir tendency to aggregate. An
effective method for accessing concentration-dependant aggregation phenomena in
solutions of haemproteins is to determine the degree of adherence of the solution to
Beer’s law over the solute concentration range of interest.204 Deviation from Beer’s law
signals aggregation of the absorbing species, while a single set of isosbestic points reflect
a simple equilibrium between two species.205 Marques et. al102 carried out a Beer’s law
study of MP8 in aqueous phosphate buffer solution (pH 7.00, µ = 0.1 M, 25 ºC) and
revealed the existence of a simple monomer/dimer equilibrium (dimerisation constant KD
= (1.17 + 0.02) x 105 M-1) below an MP8 concentration of 8.08 x 10⁻⁶ M but higher
aggregates at concentrations above this. Since low-spin MP8 was obtained at highest
concentrations, this study suggested the likelihood of an aggregation mechanism
involving intermolecular coordination by Cys-14 a -amino group of MP8.102 Marques et
al.109 performed a similar study on NAc-MP8 in aqueous phosphate buffer solution (pH
7.00, µ = 0.5 M, 25 ºC) and found that the Soret absorbance varies linearly with
concentration up to ~3 x 10⁻⁵ M, hereafter the slope decreases. The limiting slope of
NAc-MP8 was reported to be 1.55 + 0.01 x 10⁵ M-1 cm-1, and was in agreement with that
?
(nm)
Average
Absorbance
Average e
(× 105) / M-1 cm-1
Std. Deviation
Relative Std.
Deviation
560.8 0.0289 0.139 0.019 1.37
527.9 0.0286 0.137 0.017 1.27
415.1 0.3350 1.61 0.052 0.32
347.7 0.0617 0.296 0.035 1.18
337.9 0.0560 0.268 0.035 1.30
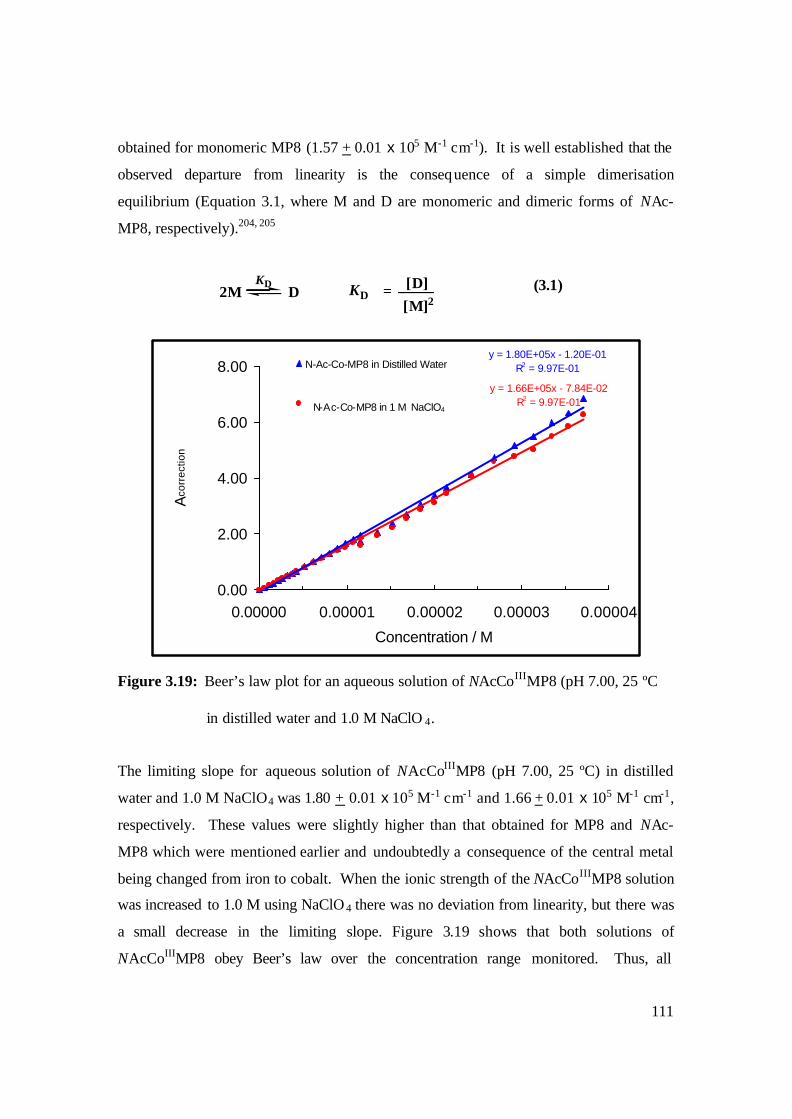
111
obtained for monomeric MP8 (1.57 + 0.01 x 10⁵ M-1 cm-1). It is well established that the
observed departure from linearity is the consequence of a simple dimerisation
equilibrium (Equation 3.1, where M and D are monomeric and dimeric forms of NAc-
MP8, respectively).204, 205
Figure 3.19: Beer’s law plot for an aqueous solution of NAcCoIIIMP8 (pH 7.00, 25 ºC
in distilled water and 1.0 M NaClO 4.
The limiting slope for aqueous solution of NAcCoIIIMP8 (pH 7.00, 25 ºC) in distilled
water and 1.0 M NaClO4 was 1.80 + 0.01 x 10⁵ M-1 cm-1 and 1.66 + 0.01 x 10⁵ M-1 cm-1,
respectively. These values were slightly higher than that obtained for MP8 and NAc-
MP8 which were mentioned earlier and undoubtedly a consequence of the central metal
being changed from iron to cobalt. When the ionic strength of the NAcCoIIIMP8 solution
was increased to 1.0 M using NaClO 4 there was no deviation from linearity, but there was
a small decrease in the limiting slope. Figure 3.19 shows that both solutions of
NAcCoIIIMP8 obey Beer’s law over the concentration range monitored. Thus, all
y = 1.66E+05x - 7.84E-02R2 = 9.97E-01
y = 1.80E+05x - 1.20E-01R2 = 9.97E-01
0.00
2.00
4.00
6.00
8.00
0.00000 0.00001 0.00002 0.00003 0.00004
Concentration / M
Aco
rrec
tion
N-Ac-Co-MP8 in Distilled Water
N-Ac-Co-MP8 in 1M NaClO4
2M D KD = [D][M]2
KD 3.1(3.1)
N-Ac-Co-MP8 in 1 M NaClO4
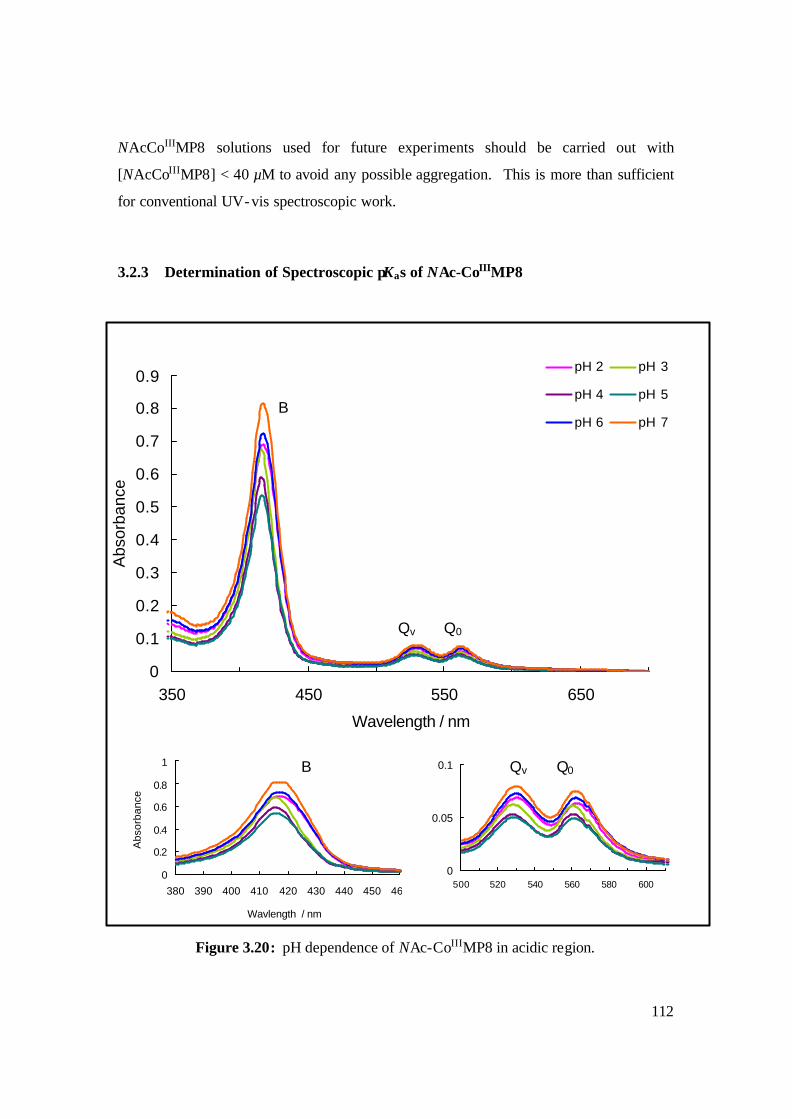
112
0
0.05
0.1
500 520 540 560 580 600
NAcCoIIIMP8 solutions used for future experiments should be carried out with
[NAcCoIIIMP8] < 40 µM to avoid any possible aggregation. This is more than sufficient
for conventional UV-vis spectroscopic work.
3.2.3 Determination of Spectroscopic pKas of NAc-CoIIIMP8
Figure 3.20: pH dependence of NAc-CoIIIMP8 in acidic region.
B Qv Q0
0
0.2
0.4
0.6
0.8
1
380 390 400 410 420 430 440 450 460
Wavlength / nm
Abs
orba
nce
0
0.1
0.2
0.3
0.4
0.5
0.6
0.7
0.8
0.9
350 450 550 650
Wavelength / nm
Abs
orba
nce
pH 2 pH 3
pH 4 pH 5
pH 6 pH 7
0
0.05
0.1
500 520 540 560 580 600
B
Qv Q0
Qv Q0 B
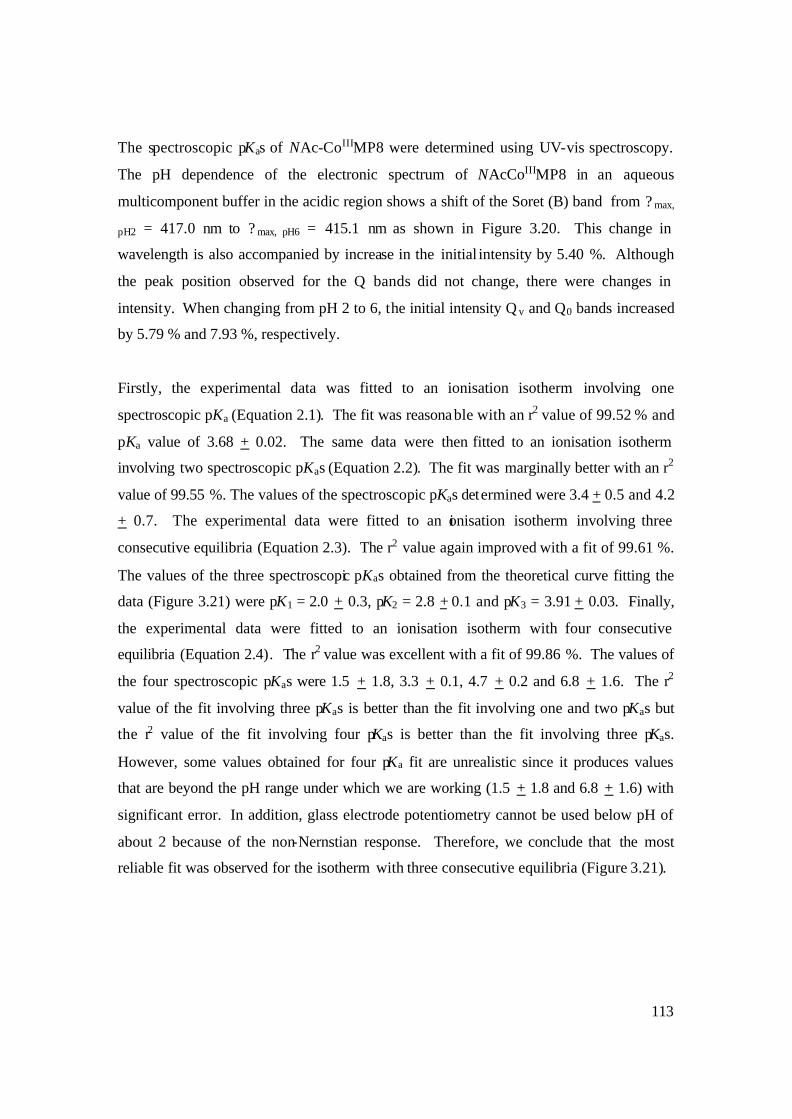
113
The spectroscopic pKas of NAc-CoIIIMP8 were determined using UV-vis spectroscopy.
The pH dependence of the electronic spectrum of NAcCoIIIMP8 in an aqueous
multicomponent buffer in the acidic region shows a shift of the Soret (B) band from ?max,
pH2 = 417.0 nm to ?max, pH6 = 415.1 nm as shown in Figure 3.20. This change in
wavelength is also accompanied by increase in the initial intensity by 5.40 %. Although
the peak position observed for the Q bands did not change, there were changes in
intensity. When changing from pH 2 to 6, the initial intensity Q v and Q0 bands increased
by 5.79 % and 7.93 %, respectively.
Firstly, the experimental data was fitted to an ionisation isotherm involving one
spectroscopic pKa (Equation 2.1). The fit was reasonable with an r2 value of 99.52 % and
pKa value of 3.68 + 0.02. The same data were then fitted to an ionisation isotherm
involving two spectroscopic pKas (Equation 2.2). The fit was marginally better with an r2
value of 99.55 %. The values of the spectroscopic pKas determined were 3.4 + 0.5 and 4.2
+ 0.7. The experimental data were fitted to an ionisation isotherm involving three
consecutive equilibria (Equation 2.3). The r2 value again improved with a fit of 99.61 %.
The values of the three spectroscopic pKas obtained from the theoretical curve fitting the
data (Figure 3.21) were pK1 = 2.0 + 0.3, pK2 = 2.8 + 0.1 and pK3 = 3.91 + 0.03. Finally,
the experimental data were fitted to an ionisation isotherm with four consecutive
equilibria (Equation 2.4). The r2 value was excellent with a fit of 99.86 %. The values of
the four spectroscopic pKas were 1.5 + 1.8, 3.3 + 0.1, 4.7 + 0.2 and 6.8 + 1.6. The r2
value of the fit involving three pKas is better than the fit involving one and two pKas but
the r2 value of the fit involving four pKas is better than the fit involving three pKas.
However, some values obtained for four pKa fit are unrealistic since it produces values
that are beyond the pH range under which we are working (1.5 + 1.8 and 6.8 + 1.6) with
significant error. In addition, glass electrode potentiometry cannot be used below pH of
about 2 because of the non-Nernstian response. Therefore, we conclude that the most
reliable fit was observed for the isotherm with three consecutive equilibria (Figure 3.21).
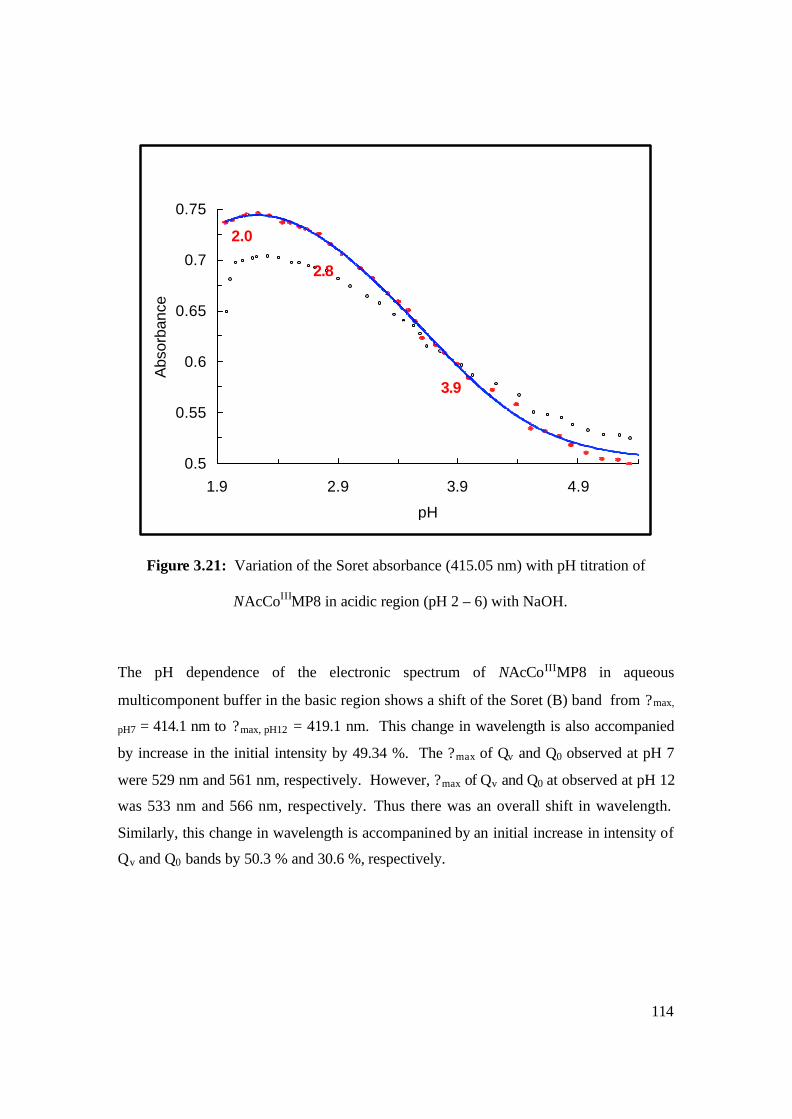
114
0.5
0.55
0.6
0.65
0.7
0.75
1.9 2.9 3.9 4.9
pH
Abs
orba
nce
Figure 3.21: Variation of the Soret absorbance (415.05 nm) with pH titration of
NAcCoIIIMP8 in acidic region (pH 2 – 6) with NaOH.
The pH dependence of the electronic spectrum of NAcCoIIIMP8 in aqueous
multicomponent buffer in the basic region shows a shift of the Soret (B) band from ?max,
pH7 = 414.1 nm to ?max, pH12 = 419.1 nm. This change in wavelength is also accompanied
by increase in the initial intensity by 49.34 %. The ?max of Qv and Q0 observed at pH 7
were 529 nm and 561 nm, respectively. However, ?max of Qv and Q0 at observed at pH 12
was 533 nm and 566 nm, respectively. Thus there was an overall shift in wavelength.
Similarly, this change in wavelength is accompanined by an initial increase in intensity of
Qv and Q0 bands by 50.3 % and 30.6 %, respectively.
2.0
2.8
3.9
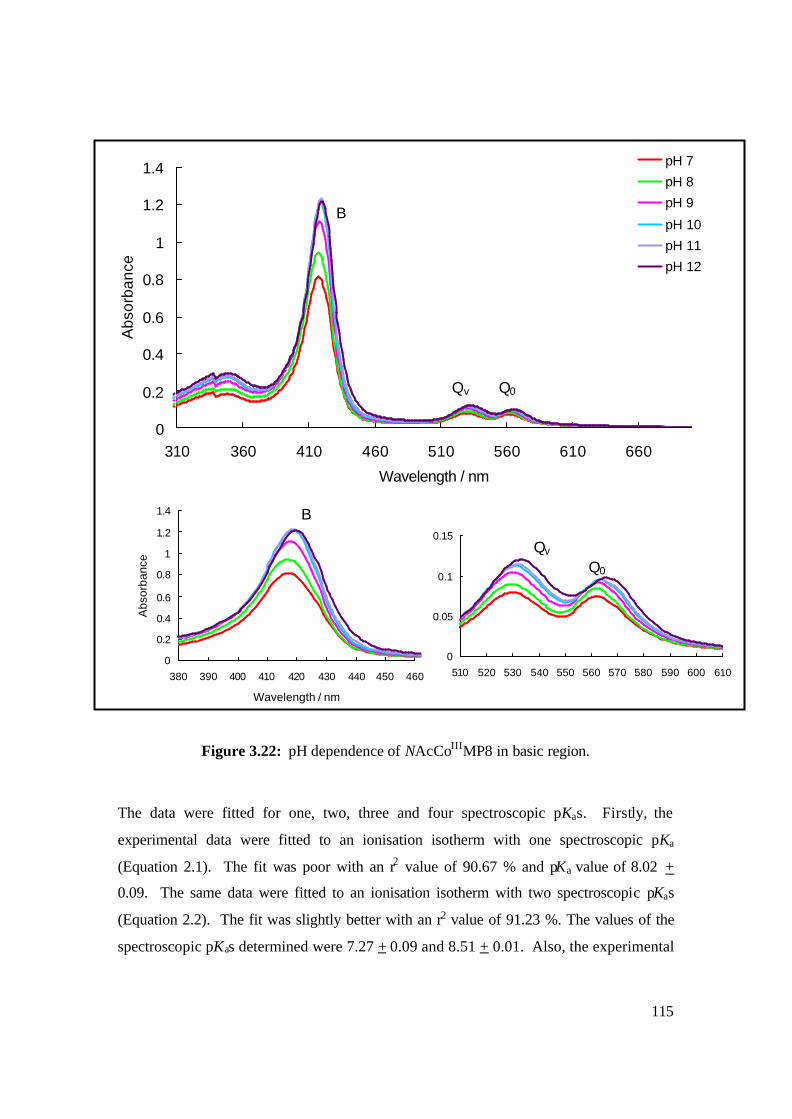
115
Figure 3.22: pH dependence of NAcCoIIIMP8 in basic region.
The data were fitted for one, two, three and four spectroscopic pKas. Firstly, the
experimental data were fitted to an ionisation isotherm with one spectroscopic pKa
(Equation 2.1). The fit was poor with an r2 value of 90.67 % and pKa value of 8.02 +
0.09. The same data were fitted to an ionisation isotherm with two spectroscopic pKas
(Equation 2.2). The fit was slightly better with an r2 value of 91.23 %. The values of the
spectroscopic pKas determined were 7.27 + 0.09 and 8.51 + 0.01. Also, the experimental
0
0.2
0.4
0.6
0.8
1
1.2
1.4
380 390 400 410 420 430 440 450 460
Wavelength / nm
Abs
orba
nce
0
0.05
0.1
0.15
510 520 530 540 550 560 570 580 590 600 610
0
0.2
0.4
0.6
0.8
1
1.2
1.4
310 360 410 460 510 560 610 660
Wavelength / nm
Abs
orba
nce
pH 7
pH 8
pH 9
pH 10
pH 11
pH 12
Qv Q0
Qv Q0
B
B
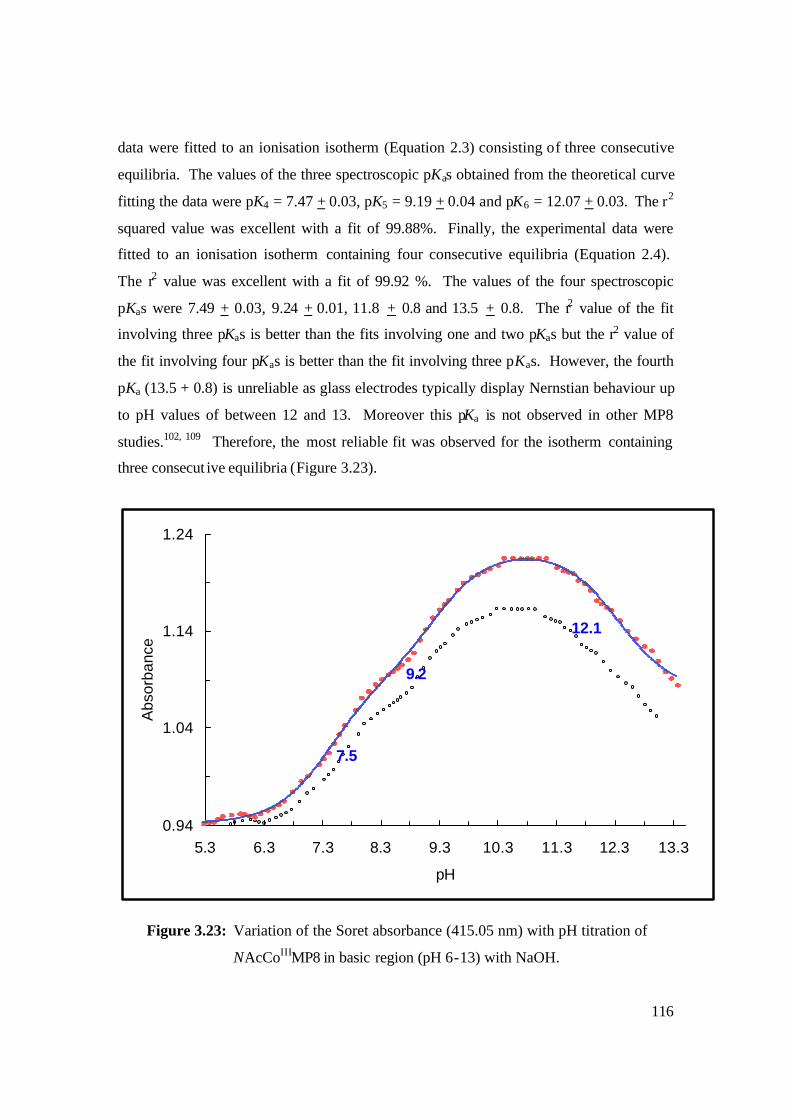
116
data were fitted to an ionisation isotherm (Equation 2.3) consisting of three consecutive
equilibria. The values of the three spectroscopic pKas obtained from the theoretical curve
fitting the data were pK4 = 7.47 + 0.03, pK5 = 9.19 + 0.04 and pK6 = 12.07 + 0.03. The r2
squared value was excellent with a fit of 99.88%. Finally, the experimental data were
fitted to an ionisation isotherm containing four consecutive equilibria (Equation 2.4).
The r2 value was excellent with a fit of 99.92 %. The values of the four spectroscopic
pKas were 7.49 + 0.03, 9.24 + 0.01, 11.8 + 0.8 and 13.5 + 0.8. The r2 value of the fit
involving three pKas is better than the fits involving one and two pKas but the r2 value of
the fit involving four pKas is better than the fit involving three pKas. However, the fourth
pKa (13.5 + 0.8) is unreliable as glass electrodes typically display Nernstian behaviour up
to pH values of between 12 and 13. Moreover this pKa is not observed in other MP8
studies.102, 109 Therefore, the most reliable fit was observed for the isotherm containing
three consecut ive equilibria (Figure 3.23).
0.94
1.04
1.14
1.24
5.3 6.3 7.3 8.3 9.3 10.3 11.3 12.3 13.3
pH
Abs
orba
nce
Figure 3.23: Variation of the Soret absorbance (415.05 nm) with pH titration of
NAcCoIIIMP8 in basic region (pH 6-13) with NaOH.
7.5
9.2
12.1
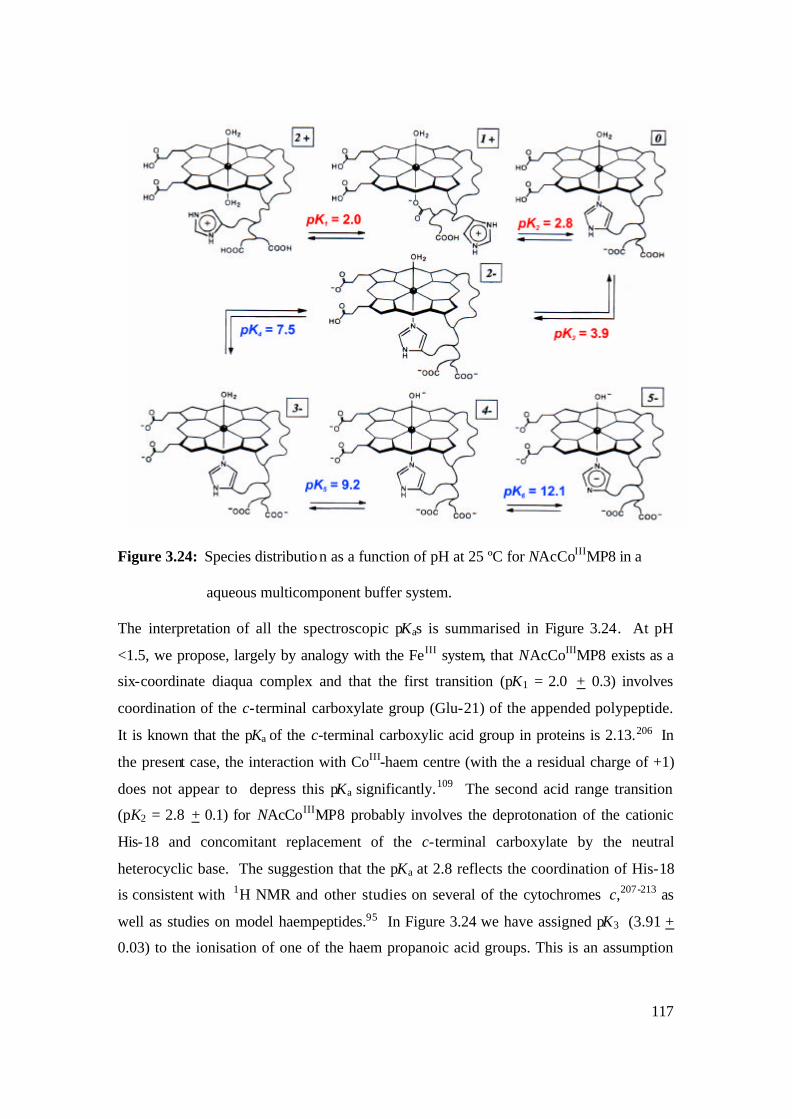
117
Figure 3.24: Species distribution as a function of pH at 25 ºC for NAcCoIIIMP8 in a
aqueous multicomponent buffer system.
The interpretation of all the spectroscopic pKas is summarised in Figure 3.24. At pH
<1.5, we propose, largely by analogy with the FeIII system, that NAcCoIIIMP8 exists as a
six-coordinate diaqua complex and that the first transition (pK1 = 2.0 + 0.3) involves
coordination of the c-terminal carboxylate group (Glu-21) of the appended polypeptide.
It is known that the pKa of the c-terminal carboxylic acid group in proteins is 2.13.206 In
the present case, the interaction with CoIII-haem centre (with the a residual charge of +1)
does not appear to depress this pKa significantly.109 The second acid range transition
(pK2 = 2.8 + 0.1) for NAcCoIIIMP8 probably involves the deprotonation of the cationic
His-18 and concomitant replacement of the c-terminal carboxylate by the neutral
heterocyclic base. The suggestion that the pKa at 2.8 reflects the coordination of His-18
is consistent with 1H NMR and other studies on several of the cytochromes c,207-213 as
well as studies on model haempeptides.95 In Figure 3.24 we have assigned pK3 (3.91 +
0.03) to the ionisation of one of the haem propanoic acid groups. This is an assumption
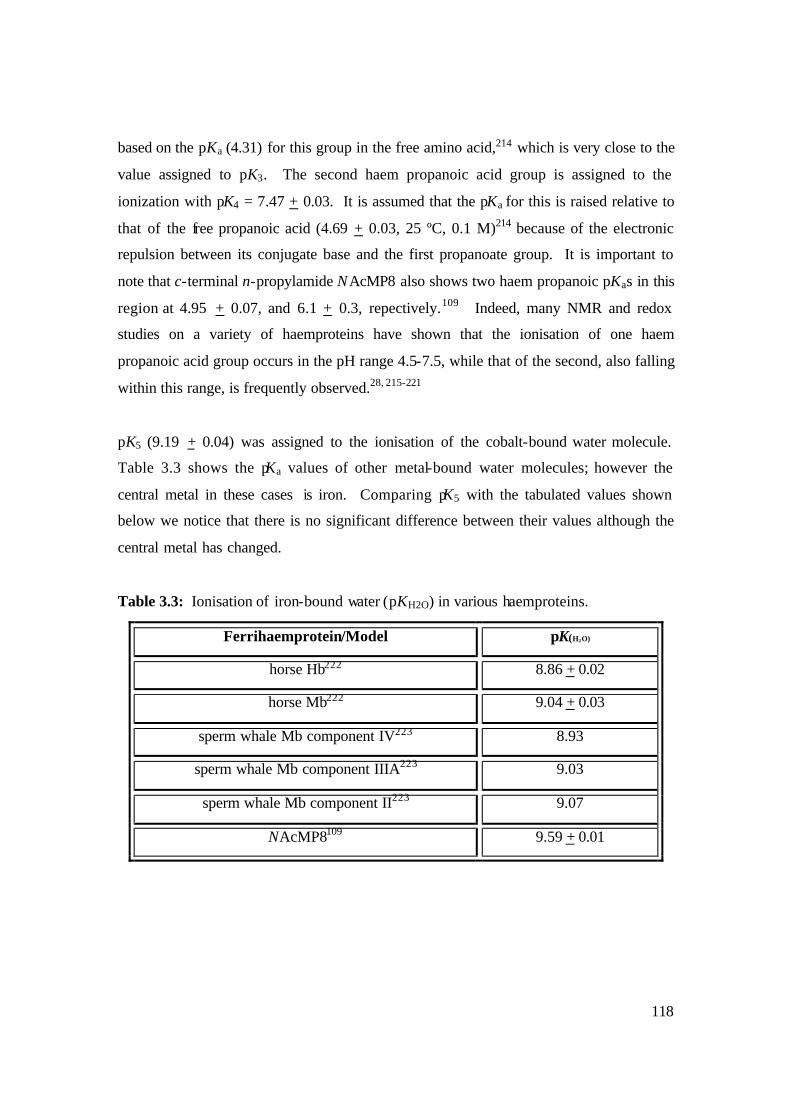
118
based on the pKa (4.31) for this group in the free amino acid,214 which is very close to the
value assigned to pK3. The second haem propanoic acid group is assigned to the
ionization with pK4 = 7.47 + 0.03. It is assumed that the pKa for this is raised relative to
that of the free propanoic acid (4.69 + 0.03, 25 ºC, 0.1 M)214 because of the electronic
repulsion between its conjugate base and the first propanoate group. It is important to
note that c-terminal n-propylamide NAcMP8 also shows two haem propanoic pKas in this
region at 4.95 + 0.07, and 6.1 + 0.3, repectively.109 Indeed, many NMR and redox
studies on a variety of haemproteins have shown that the ionisation of one haem
propanoic acid group occurs in the pH range 4.5-7.5, while that of the second, also falling
within this range, is frequently observed.28, 215-221
pK5 (9.19 + 0.04) was assigned to the ionisation of the cobalt-bound water molecule.
Table 3.3 shows the pKa values of other metal-bound water molecules; however the
central metal in these cases is iron. Comparing pK5 with the tabulated values shown
below we notice that there is no significant difference between their values although the
central metal has changed.
Table 3.3: Ionisation of iron-bound water (pKH2O) in various haemproteins.
Ferrihaemprotein/Model pK(H2O)
horse Hb222 8.86 + 0.02
horse Mb222 9.04 + 0.03
sperm whale Mb component IV223 8.93
sperm whale Mb component IIIA223 9.03
sperm whale Mb component II223 9.07
NAcMP8109 9.59 + 0.01
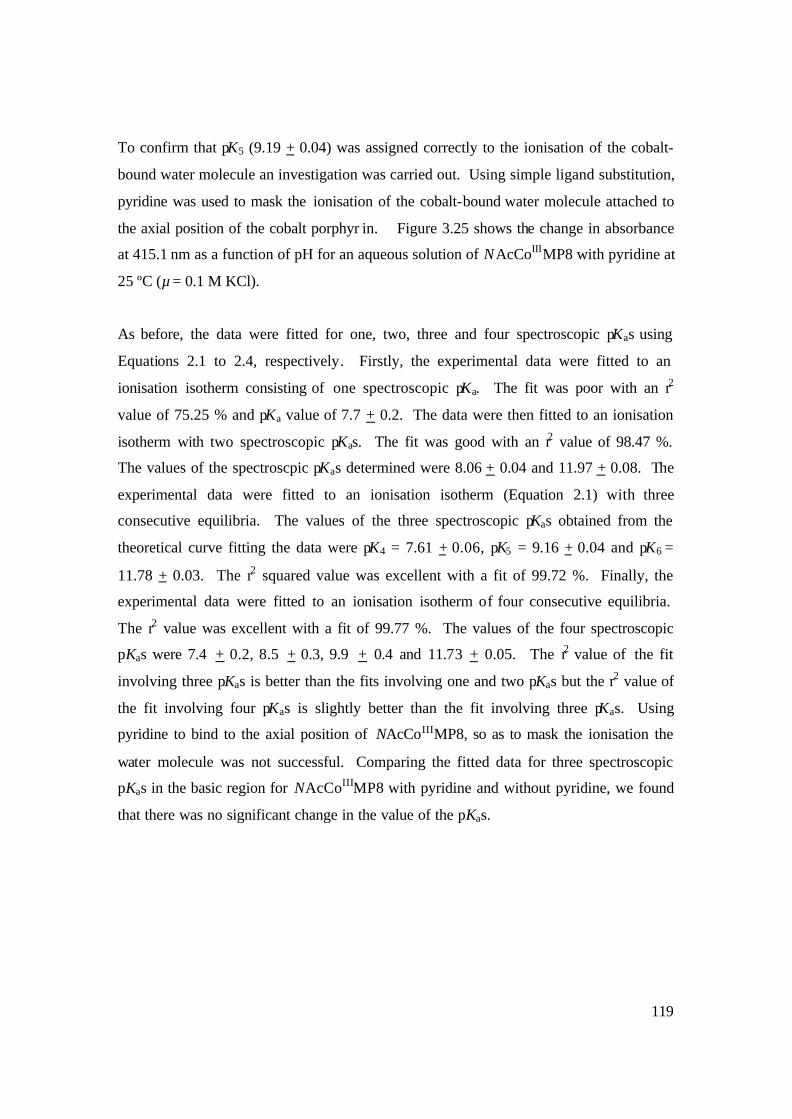
119
To confirm that pK5 (9.19 + 0.04) was assigned correctly to the ionisation of the cobalt-
bound water molecule an investigation was carried out. Using simple ligand substitution,
pyridine was used to mask the ionisation of the cobalt-bound water molecule attached to
the axial position of the cobalt porphyr in. Figure 3.25 shows the change in absorbance
at 415.1 nm as a function of pH for an aqueous solution of NAcCoIIIMP8 with pyridine at
25 ºC (µ = 0.1 M KCl).
As before, the data were fitted for one, two, three and four spectroscopic pKas using
Equations 2.1 to 2.4, respectively. Firstly, the experimental data were fitted to an
ionisation isotherm consisting of one spectroscopic pKa. The fit was poor with an r2
value of 75.25 % and pKa value of 7.7 + 0.2. The data were then fitted to an ionisation
isotherm with two spectroscopic pKas. The fit was good with an r2 value of 98.47 %.
The values of the spectroscpic pKas determined were 8.06 + 0.04 and 11.97 + 0.08. The
experimental data were fitted to an ionisation isotherm (Equation 2.1) with three
consecutive equilibria. The values of the three spectroscopic pKas obtained from the
theoretical curve fitting the data were pK4 = 7.61 + 0.06, pK5 = 9.16 + 0.04 and pK6 =
11.78 + 0.03. The r2 squared value was excellent with a fit of 99.72 %. Finally, the
experimental data were fitted to an ionisation isotherm of four consecutive equilibria.
The r2 value was excellent with a fit of 99.77 %. The values of the four spectroscopic
pKas were 7.4 + 0.2, 8.5 + 0.3, 9.9 + 0.4 and 11.73 + 0.05. The r2 value of the fit
involving three pKas is better than the fits involving one and two pKas but the r2 value of
the fit involving four pKas is slightly better than the fit involving three pKas. Using
pyridine to bind to the axial position of NAcCoIIIMP8, so as to mask the ionisation the
water molecule was not successful. Comparing the fitted data for three spectroscopic
pKas in the basic region for NAcCoIIIMP8 with pyridine and without pyridine, we found
that there was no significant change in the value of the pKas.
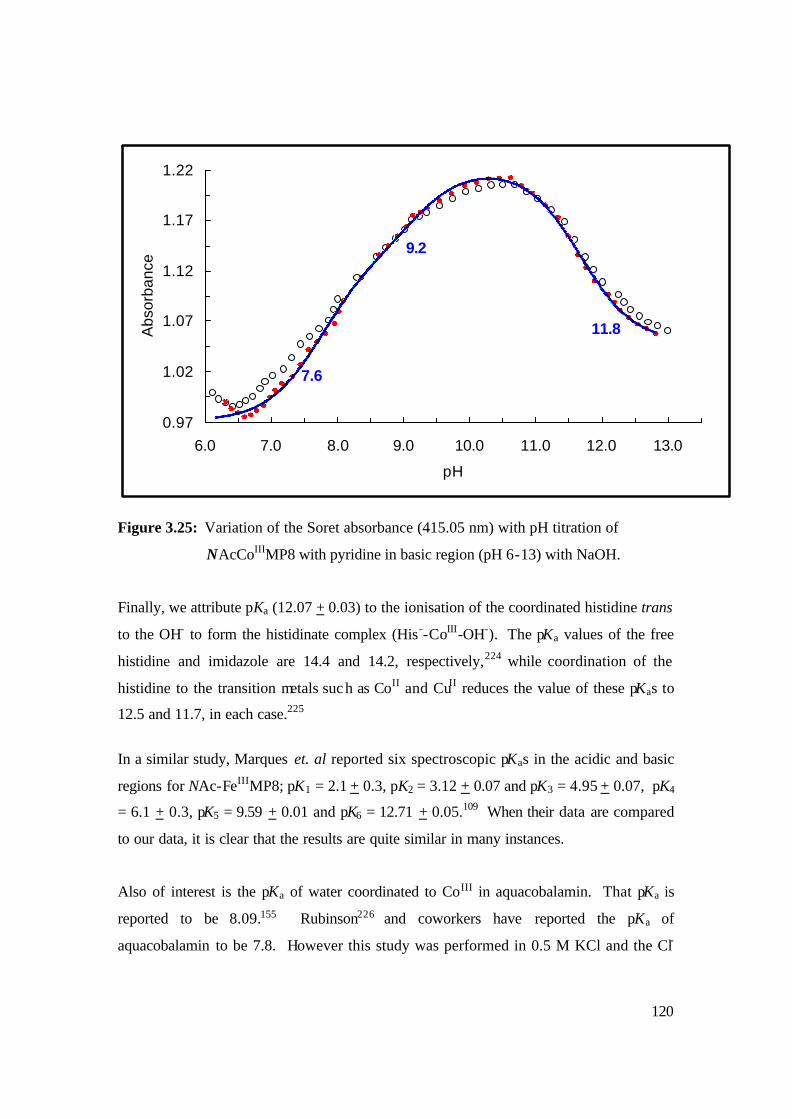
120
0.97
1.02
1.07
1.12
1.17
1.22
6.0 7.0 8.0 9.0 10.0 11.0 12.0 13.0
pH
Abs
orba
nce
Figure 3.25: Variation of the Soret absorbance (415.05 nm) with pH titration of
NAcCoIIIMP8 with pyridine in basic region (pH 6-13) with NaOH.
Finally, we attribute pKa (12.07 + 0.03) to the ionisation of the coordinated histidine trans
to the OH- to form the histidinate complex (His--CoIII-OH-). The pKa values of the free
histidine and imidazole are 14.4 and 14.2, respectively,224 while coordination of the
histidine to the transition metals suc h as CoII and CuII reduces the value of these pKas to
12.5 and 11.7, in each case.225
In a similar study, Marques et. al reported six spectroscopic pKas in the acidic and basic
regions for NAc-FeIIIMP8; pK1 = 2.1 + 0.3, pK2 = 3.12 + 0.07 and pK3 = 4.95 + 0.07, pK4
= 6.1 + 0.3, pK5 = 9.59 + 0.01 and pK6 = 12.71 + 0.05.109 When their data are compared
to our data, it is clear that the results are quite similar in many instances.
Also of interest is the pKa of water coordinated to CoIII in aquacobalamin. That pKa is
reported to be 8.09.155 Rubinson226 and coworkers have reported the pKa of
aquacobalamin to be 7.8. However this study was performed in 0.5 M KCl and the Cl-
7.6
11.8
9.2
121
ion may coordinate to the cobalt centre and affect results. Although the authors have
suggested that the electrolyte has no effec t on electrochemical potentials used in their
work. We have decided to use the pKa value of 8.09 for comparative purposes. The
ionisation of the metal-bound water molecule for NAcCoIIIMP8 and aquacobalamin
differs by 1.1 pH units. This difference is significant and may be attributed to the
environmental surroundings of the central cobalt ion, namely the porphine and corrin
macrocyclic environments.
It has been well established that the corrin cavity for cobalamin is much smaller than the
porphyrin cavity in microperoxidase.7, 23, 163, 167, 195 Although the formal charge of cobalt
in the porphyrin is +3, the actual charge of the metal depends on the extent the ligands
donate electron density to the electron deficient cobalt centre. Now, if we assume to a
first approximation that the electronic properties of histidine (in NAcCoIIIMP8) and
dimethylbenzimidazole (in B12a) have the same s donor/p acceptor abilities toward the
cobalt centre, then the only variable is the difference in the donor ability of corrin and
porphine macrocycles. In cobalt corrinoids like B12a, CoIII centre is in close proximity to
the electron rich corrin macrocycle and becomes more electron rich. This leads to a
decrease the electron density on the coordinated water molecule and consequently
increases the ionisation of the axial water molecule (high Ka) and small pKa values. In
NAcCoIIIMP8, the CoIII centre is not in close proximity to the electron rich porphine
macrocycle (due to the cavity being larger and more rigid) and does not significantly
change the electron density on the coordinated water molecule. This results in smaller
ionisation constants being observed (larger pKa values). Hence, the results show that the
corrin moiety is a better electron donor toward CoIII, than the porphine moiety.
3.2.4 Ligand Binding Studies of Selected N-Donor Ligands by NAc-CoIIIMP8
Solutions of NAc-CoIIIMP8 in the presence of varying concentrations of ligand were
allowed to equilibrate overnight in a water bath where the temperature was maintained at
25.0 + 0.1 ºC. Since CoIII in NAc-CoIIIMP8 is likely to be inert, the ligand had at least 16
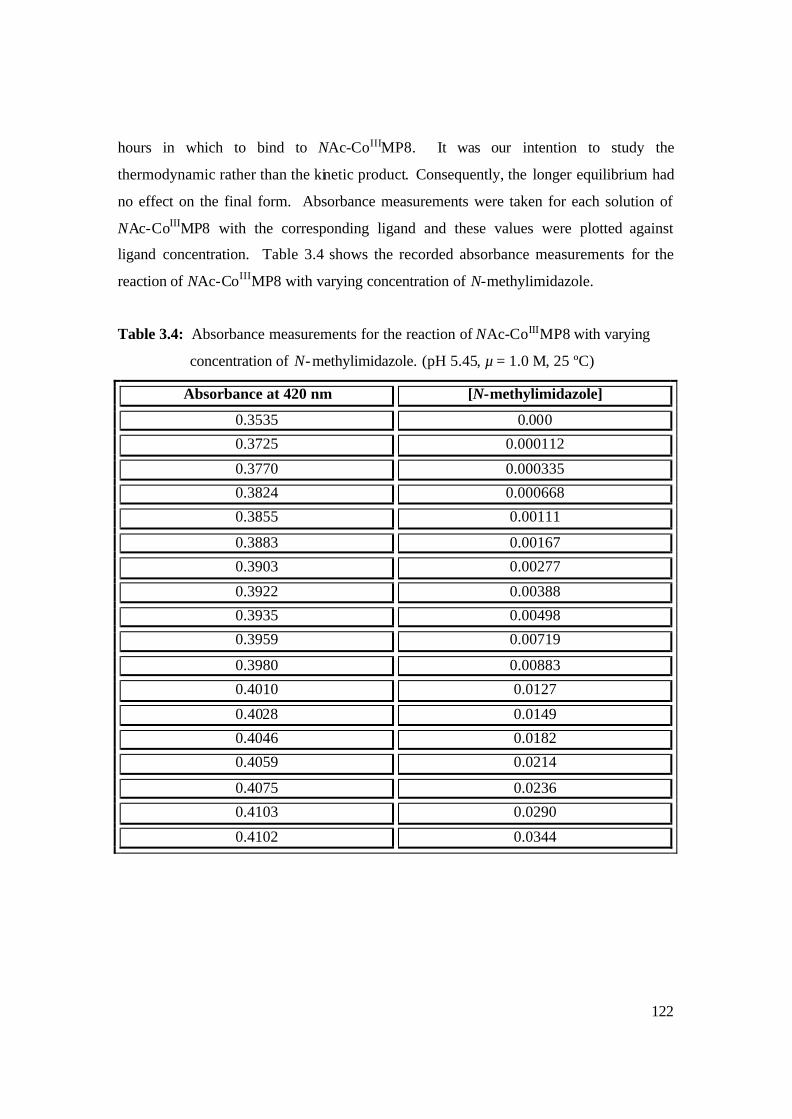
122
hours in which to bind to NAc-CoIIIMP8. It was our intention to study the
thermodynamic rather than the kinetic product. Consequently, the longer equilibrium had
no effect on the final form. Absorbance measurements were taken for each solution of
NAc-CoIIIMP8 with the corresponding ligand and these values were plotted against
ligand concentration. Table 3.4 shows the recorded absorbance measurements for the
reaction of NAc-CoIIIMP8 with varying concentration of N-methylimidazole.
Table 3.4: Absorbance measurements for the reaction of NAc-CoIIIMP8 with varying
concentration of N-methylimidazole. (pH 5.45, µ = 1.0 M, 25 ºC)
Absorbance at 420 nm [N-methylimidazole]
0.3535 0.000
0.3725 0.000112
0.3770 0.000335
0.3824 0.000668
0.3855 0.00111
0.3883 0.00167
0.3903 0.00277
0.3922 0.00388
0.3935 0.00498
0.3959 0.00719
0.3980 0.00883
0.4010 0.0127
0.4028 0.0149
0.4046 0.0182
0.4059 0.0214
0.4075 0.0236
0.4103 0.0290
0.4102 0.0344
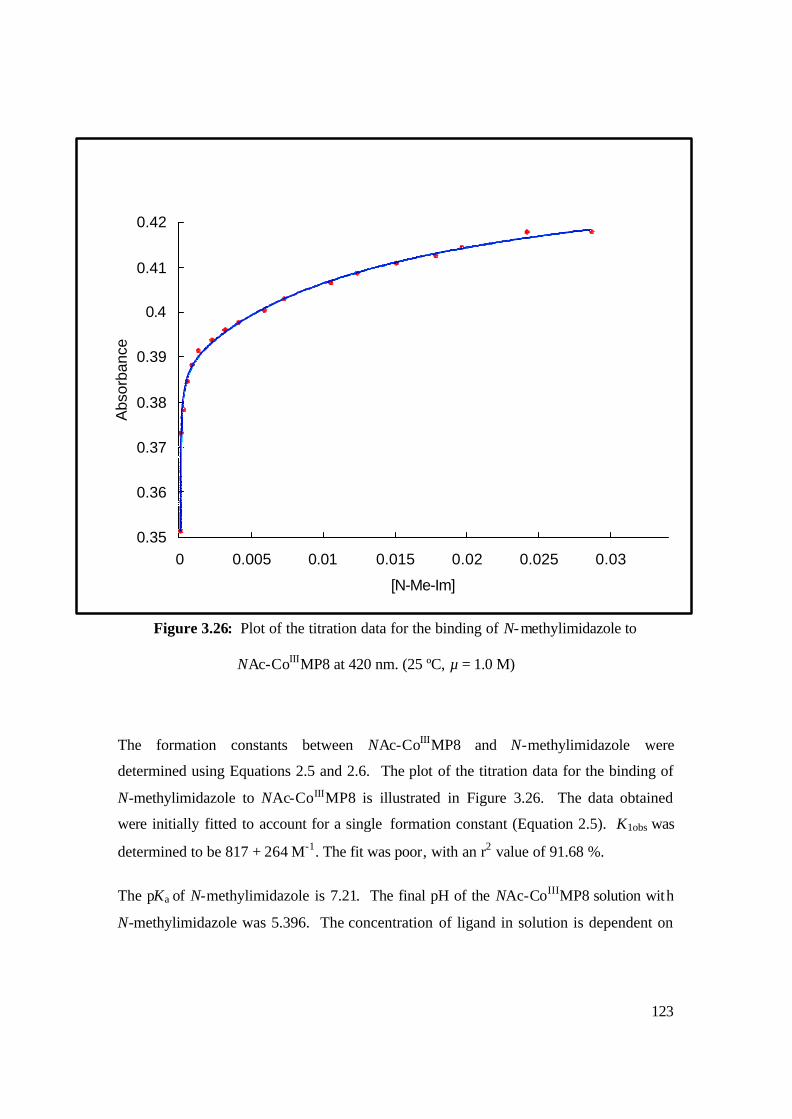
123
Figure 3.26: Plot of the titration data for the binding of N-methylimidazole to
NAc-CoIIIMP8 at 420 nm. (25 ºC, µ = 1.0 M)
The formation constants between NAc-CoIIIMP8 and N-methylimidazole were
determined using Equations 2.5 and 2.6. The plot of the titration data for the binding of
N-methylimidazole to NAc-CoIIIMP8 is illustrated in Figure 3.26. The data obtained
were initially fitted to account for a single formation constant (Equation 2.5). K1obs was
determined to be 817 + 264 M-1. The fit was poor, with an r2 value of 91.68 %.
The pKa of N-methylimidazole is 7.21. The final pH of the NAc-CoIIIMP8 solution with
N-methylimidazole was 5.396. The concentration of ligand in solution is dependent on
0.35
0.36
0.37
0.38
0.39
0.4
0.41
0.42
0 0.005 0.01 0.015 0.02 0.025 0.03
[N-Me-Im]
Abs
orba
nce
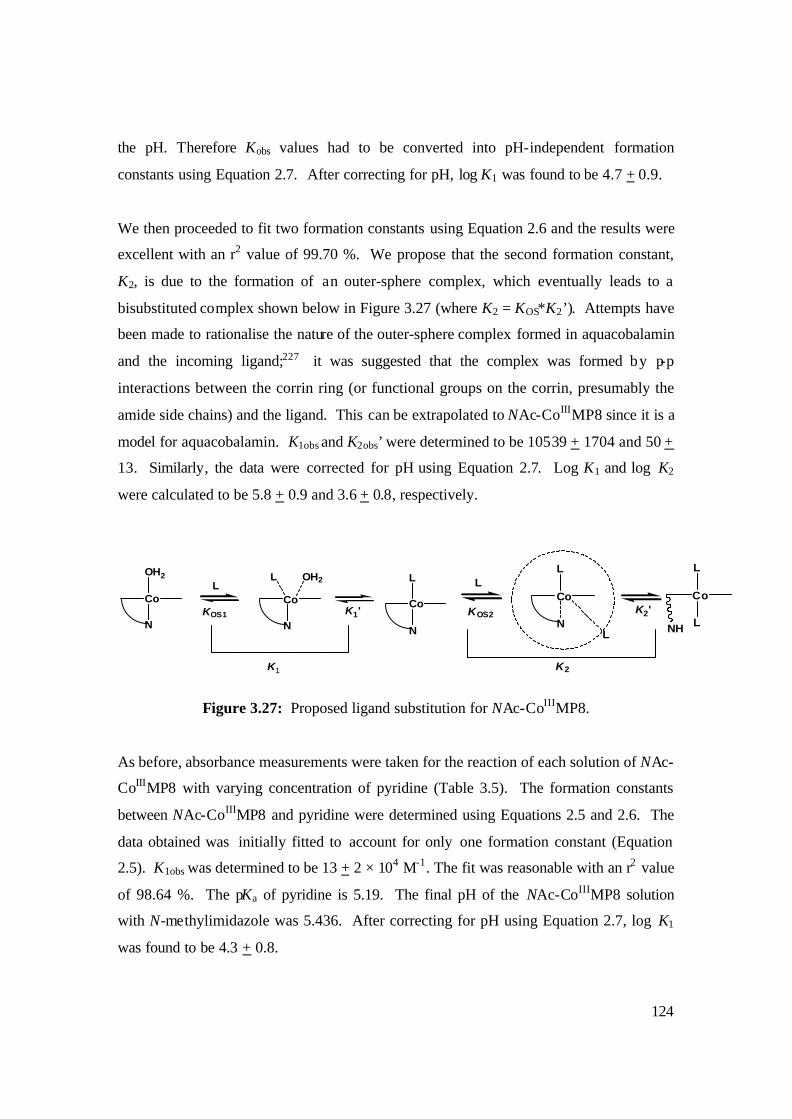
124
the pH. Therefore Kobs values had to be converted into pH-independent formation
constants using Equation 2.7. After correcting for pH, log K1 was found to be 4.7 + 0.9.
We then proceeded to fit two formation constants using Equation 2.6 and the results were
excellent with an r2 value of 99.70 %. We propose that the second formation constant,
K2, is due to the formation of an outer-sphere complex, which eventually leads to a
bisubstituted complex shown below in Figure 3.27 (where K2 = KOS*K2’). Attempts have
been made to rationalise the nature of the outer-sphere complex formed in aquacobalamin
and the incoming ligand;227 it was suggested that the complex was formed by p-p
interactions between the corrin ring (or functional groups on the corrin, presumably the
amide side chains) and the ligand. This can be extrapolated to NAc-CoIIIMP8 since it is a
model for aquacobalamin. K1obs and K2obs’ were determined to be 10539 + 1704 and 50 +
13. Similarly, the data were corrected for pH using Equation 2.7. Log K1 and log K2
were calculated to be 5.8 + 0.9 and 3.6 + 0.8, respectively.
Figure 3.27: Proposed ligand substitution for NAc-CoIIIMP8.
As before, absorbance measurements were taken for the reaction of each solution of NAc-
CoIIIMP8 with varying concentration of pyridine (Table 3.5). The formation constants
between NAc-CoIIIMP8 and pyridine were determined using Equations 2.5 and 2.6. The
data obtained was initially fitted to account for only one formation constant (Equation
2.5). K1obs was determined to be 13 + 2 × 10⁴ M-1. The fit was reasonable with an r2 value
of 98.64 %. The pKa of pyridine is 5.19. The final pH of the NAc-CoIIIMP8 solution
with N-methylimidazole was 5.436. After correcting for pH using Equation 2.7, log K1
was found to be 4.3 + 0.8.
Co
OH2
N
LCo
N
L OH2
KOS1 K1'Co
N
L
K1
LCo
N
L
KOS2
L
Co
NH
L
LK2'
K2
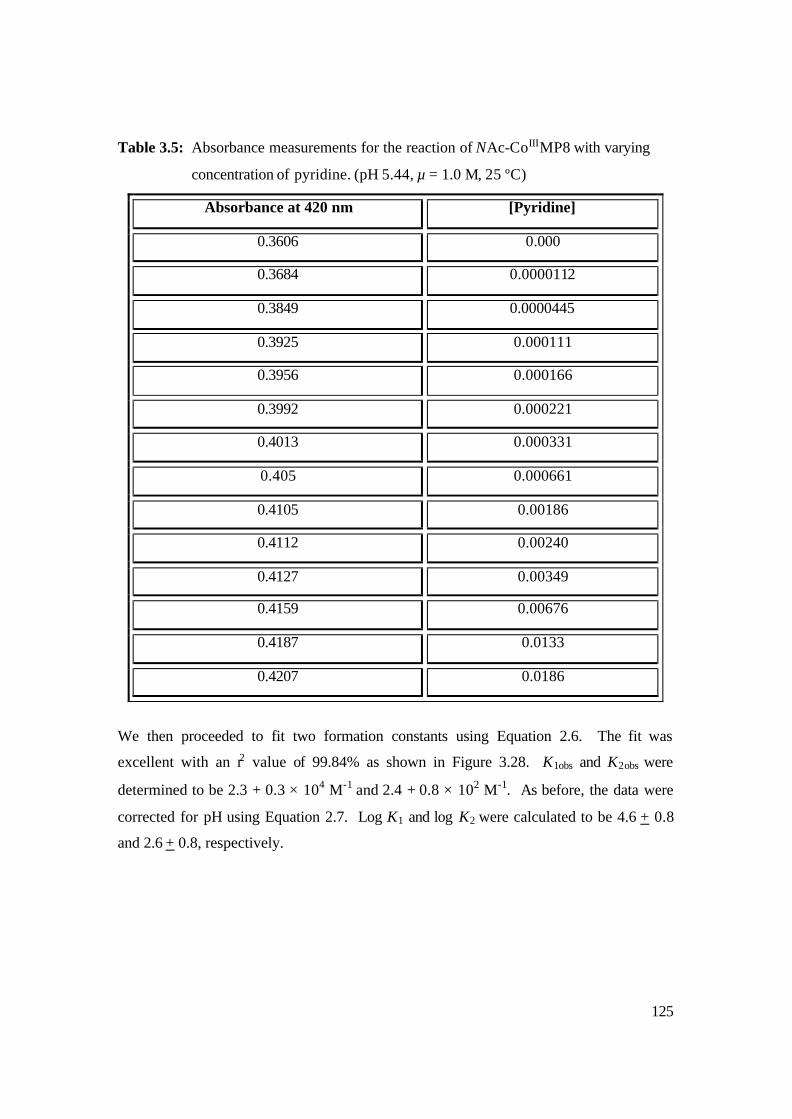
125
Table 3.5: Absorbance measurements for the reaction of NAc-CoIIIMP8 with varying
concentration of pyridine. (pH 5.44, µ = 1.0 M, 25 ºC)
Absorbance at 420 nm [Pyridine]
0.3606 0.000
0.3684 0.0000112
0.3849 0.0000445
0.3925 0.000111
0.3956 0.000166
0.3992 0.000221
0.4013 0.000331
0.405 0.000661
0.4105 0.00186
0.4112 0.00240
0.4127 0.00349
0.4159 0.00676
0.4187 0.0133
0.4207 0.0186
We then proceeded to fit two formation constants using Equation 2.6. The fit was
excellent with an r2 value of 99.84% as shown in Figure 3.28. K1obs and K2obs were
determined to be 2.3 + 0.3 × 10⁴ M-1 and 2.4 + 0.8 × 10² M-1. As before, the data were
corrected for pH using Equation 2.7. Log K1 and log K2 were calculated to be 4.6 + 0.8
and 2.6 + 0.8, respectively.
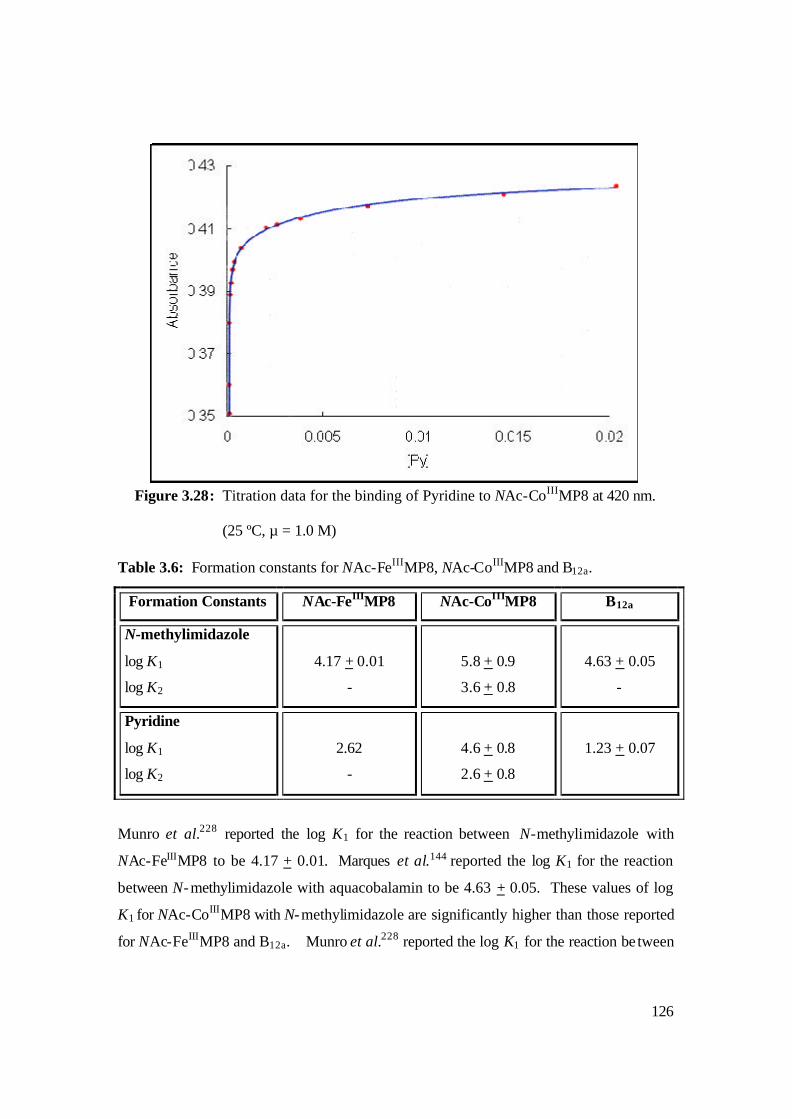
126
Figure 3.28: Titration data for the binding of Pyridine to NAc-CoIIIMP8 at 420 nm.
(25 ºC, µ = 1.0 M)
Table 3.6: Formation constants for NAc-FeIIIMP8, NAc-CoIIIMP8 and B12a.
Formation Constants NAc-FeIIIMP8 NAc-CoIIIMP8 B12a
N-methylimidazole
log K1
log K2
4.17 + 0.01
-
5.8 + 0.9
3.6 + 0.8
4.63 + 0.05
-
Pyridine
log K1
log K2
2.62
-
4.6 + 0.8
2.6 + 0.8
1.23 + 0.07
Munro et al.228 reported the log K1 for the reaction between N-methylimidazole with
NAc-FeIIIMP8 to be 4.17 + 0.01. Marques et al.144 reported the log K1 for the reaction
between N-methylimidazole with aquacobalamin to be 4.63 + 0.05. These values of log
K1 for NAc-CoIIIMP8 with N-methylimidazole are significantly higher than those reported
for NAc-FeIIIMP8 and B12a. Munro et al.228 reported the log K1 for the reaction be tween
127
pyridine with NAc-FeIIIMP8 to be 2.62. Knapton et al.229 reported the log K1 for the
reaction between pyridine with aquacobalamin to be 1.23 + 0.07. Similarly, the values of
log K1 for NAc-CoIIIMP8 with pyridine are significantly higher than those reported for
NAc-FeIIIMP8 and B12a.
Although log K2 is not reported in the above studies, the formation of a bis-complex is
well established in MP8 chemistry. Munro and coworkers found that in their ligand
binding studies of NAc-FeIIIMP8 with pyridine and other amines, there were multiple
equilibria observed.228 They also observed that there was a clear relationship between the
basicity of the incoming ligand (as measured by its pKa) and the log K for the binding of
that ligand by NAc-FeIIIMP8. Thus, the affinity of the ligand toward Fe(III) in an iron
porphyrin parallels its affinity toward the proton. This was evident for primary amines
and pyridines. A similar observation was made by Pratt et al.230 In B12 chemistry
precedents also exist for substitution of axial base by an exogenous ligand.229 Marques
and coworkers have made an outstanding contribution and have performed numerous
studies on aquacobalamin with a variety of ligands which all show that only the axial
base was replaced and that ligand substitution proceeds through a dissociative
interchange mechanism.143-146, 148-155
In Table 3.6 we see that the value of formation constants formed between the selected
ligands and NAc-CoIIIMP8 are higher than those formed for NAc-FeIIIMP8 and B12a. It
has already been established that the porphyrin cavity is larger and less flexible than the
corrin cavity and that the Co(III) ion is smaller than Fe(III) ion. 7, 23 In NAc-CoIIIMP8 we
have a small Co(III) ion in a large porphyrin cavity. This results in weaker bonds being
formed between cobalt and the porphyrin and the axial and proximal residues with the
metal centre (due to longer bond distances). This consequently leads to bis-substutution
in NAc-CoIIIMP8. However, in NAc-FeIIIMP8 and B12a we observe only mono-
substitution, which strongly suggests that the Co(III)-His bond in NAc-CoIIIMP8 is
weaker than the same bond in B12a and the Fe(III)-His bond in NAc-FeIIIMP8. This result
is unexpected and clearly merits further, and more detailed investigation. It was not the
principal focus of this investigation which was merely to show that investigations are
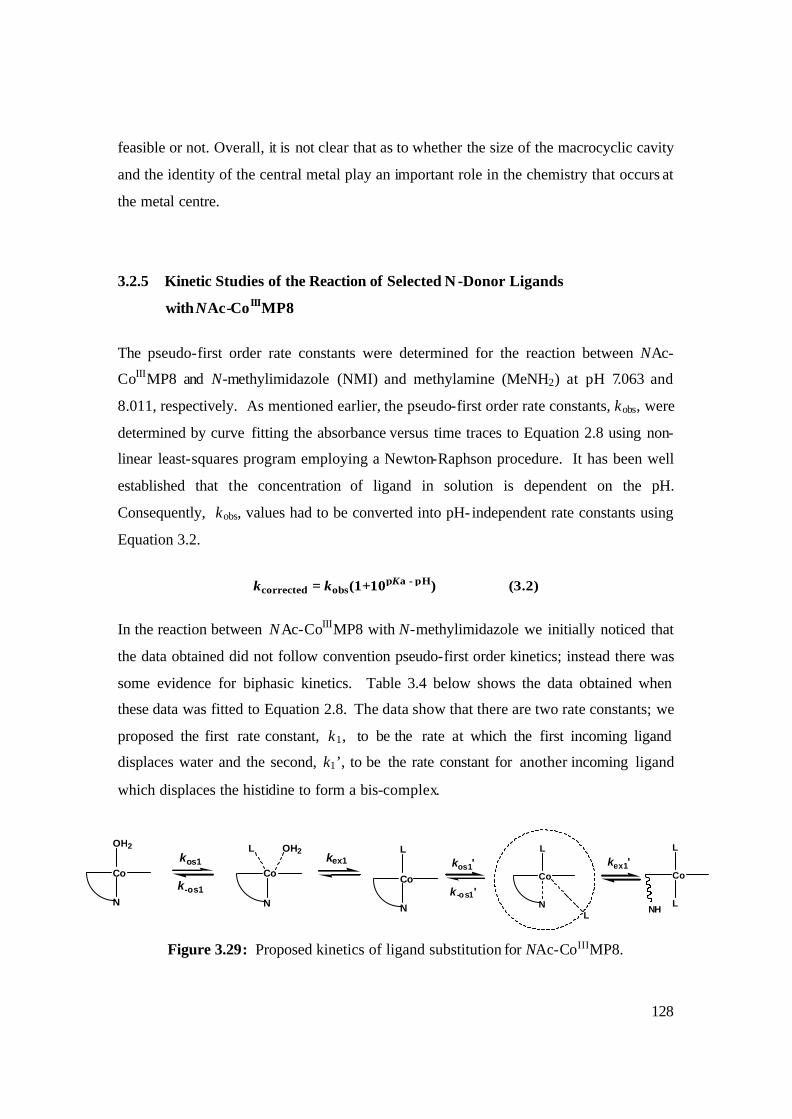
128
feasible or not. Overall, it is not clear that as to whether the size of the macrocyclic cavity
and the identity of the central metal play an important role in the chemistry that occurs at
the metal centre.
3.2.5 Kinetic Studies of the Reaction of Selected N -Donor Ligands
with NAc-CoIIIMP8
The pseudo-first order rate constants were determined for the reaction between NAc-
CoIIIMP8 and N-methylimidazole (NMI) and methylamine (MeNH2) at pH 7.063 and
8.011, respectively. As mentioned earlier, the pseudo-first order rate constants, kobs, were
determined by curve fitting the absorbance versus time traces to Equation 2.8 using non-
linear least-squares program employing a Newton-Raphson procedure. It has been well
established that the concentration of ligand in solution is dependent on the pH.
Consequently, kobs, values had to be converted into pH- independent rate constants using
Equation 3.2.
kcorrected = kobs(1+10pKa - pH) (3.2)
In the reaction between NAc-CoIIIMP8 with N-methylimidazole we initially noticed that
the data obtained did not follow convention pseudo-first order kinetics; instead there was
some evidence for biphasic kinetics. Table 3.4 below shows the data obtained when
these data was fitted to Equation 2.8. The data show that there are two rate constants; we
proposed the first rate constant, k1, to be the rate at which the first incoming ligand
displaces water and the second, k1’, to be the rate constant for another incoming ligand
which displaces the histidine to form a bis-complex.
Figure 3.29: Proposed kinetics of ligand substitution for NAc-CoIIIMP8.
Co
OH2
N
kos1Co
N
L OH2
Co
N
L
k-os1
kex1
Co
N
L
L
Co
NH
L
L
kos1'
k-os1'
kex1'
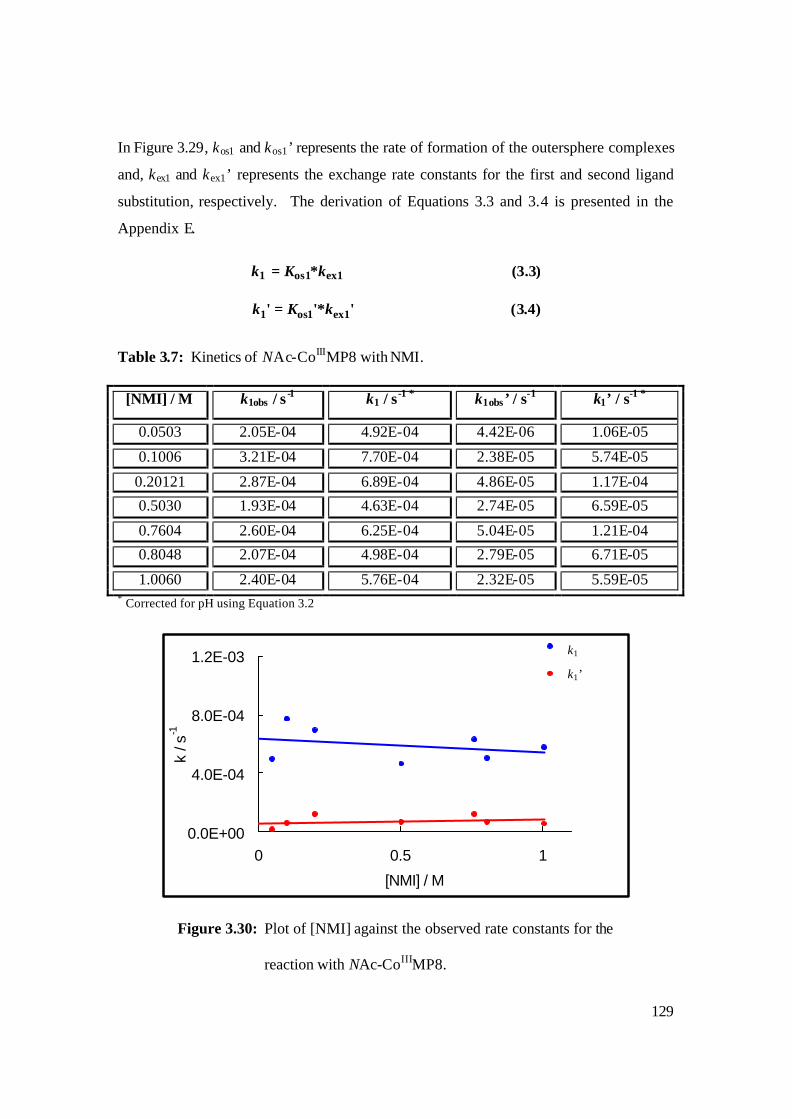
129
In Figure 3.29, kos1 and kos1’ represents the rate of formation of the outersphere complexes
and, kex1 and kex1’ represents the exchange rate constants for the first and second ligand
substitution, respectively. The derivation of Equations 3.3 and 3.4 is presented in the
Appendix E.
k1 = Kos1*kex1 (3.3)
k1' = Kos1'*kex1' (3.4)
Table 3.7: Kinetics of NAc-CoIIIMP8 with NMI.
* Corrected for pH using Equation 3.2
0.0E+00
4.0E-04
8.0E-04
1.2E-03
0 0.5 1
[NMI] / M
k / s
-1
k1
k1'
Figure 3.30: Plot of [NMI] against the observed rate constants for the
reaction with NAc-CoIIIMP8.
[NMI] / M k1obs / s -1 k1 / s-1 * k1obs’ / s-1 k1’ / s-1 *
0.0503 2.05E-04 4.92E-04 4.42E-06 1.06E-05
0.1006 3.21E-04 7.70E-04 2.38E-05 5.74E-05
0.20121 2.87E-04 6.89E-04 4.86E-05 1.17E-04
0.5030 1.93E-04 4.63E-04 2.74E-05 6.59E-05
0.7604 2.60E-04 6.25E-04 5.04E-05 1.21E-04
0.8048 2.07E-04 4.98E-04 2.79E-05 6.71E-05
1.0060 2.40E-04 5.76E-04 2.32E-05 5.59E-05
k1
k1’
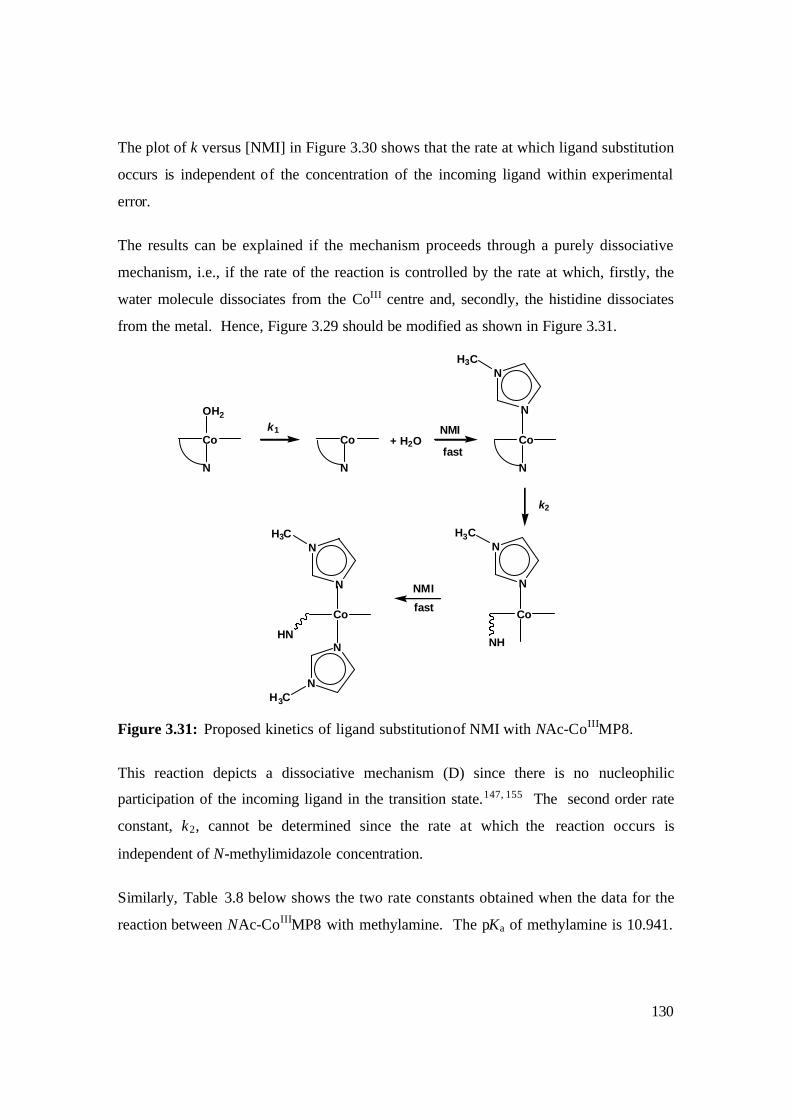
130
The plot of k versus [NMI] in Figure 3.30 shows that the rate at which ligand substitution
occurs is independent of the concentration of the incoming ligand within experimental
error.
The results can be explained if the mechanism proceeds through a purely dissociative
mechanism, i.e., if the rate of the reaction is controlled by the rate at which, firstly, the
water molecule dissociates from the CoIII centre and, secondly, the histidine dissociates
from the metal. Hence, Figure 3.29 should be modified as shown in Figure 3.31.
Figure 3.31: Proposed kinetics of ligand substitution of NMI with NAc-CoIIIMP8.
This reaction depicts a dissociative mechanism (D) since there is no nucleophilic
participation of the incoming ligand in the transition state.147, 155 The second order rate
constant, k2, cannot be determined since the rate at which the reaction occurs is
independent of N-methylimidazole concentration.
Similarly, Table 3.8 below shows the two rate constants obtained when the data for the
reaction between NAc-CoIIIMP8 with methylamine. The pKa of methylamine is 10.941.
Co
OH2
N
k1Co + H2O
N
NMI
fastCo
N
N
N
H3C
Co
N
N
H3C
NH
k2
Co
N
N
H3C
N
N
H3C
NMI
fast
HN
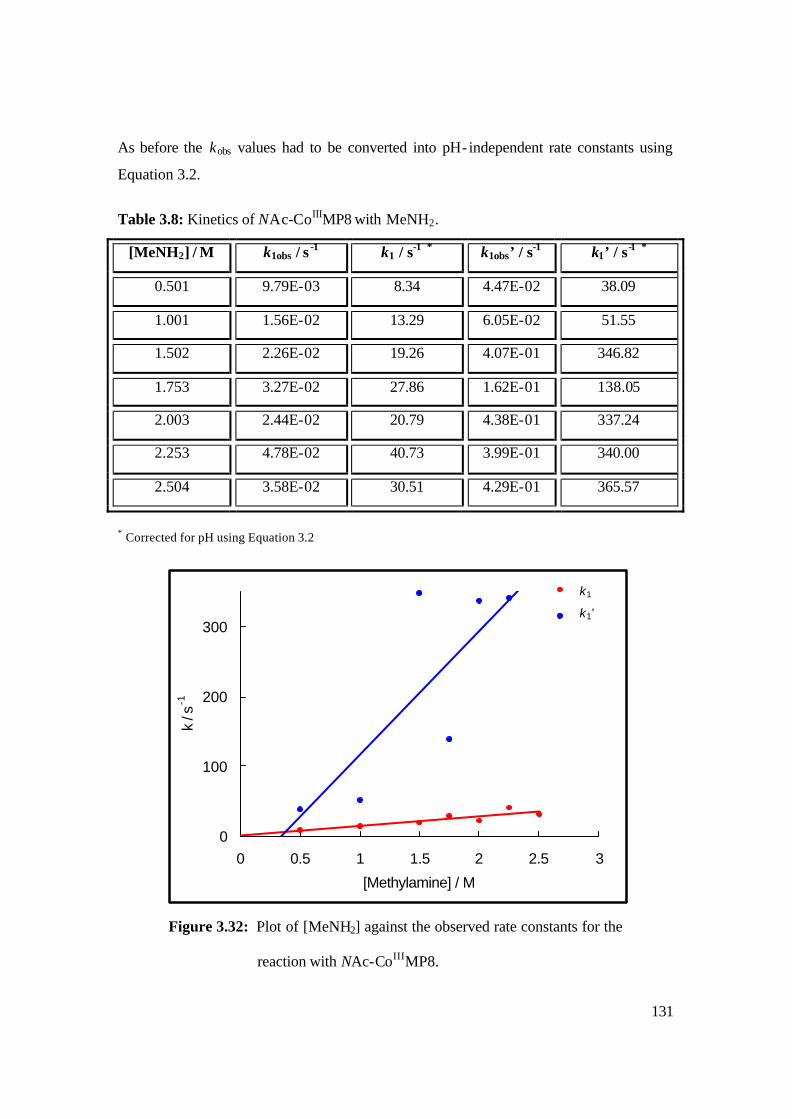
131
0
100
200
300
0 0.5 1 1.5 2 2.5 3
[Methylamine] / M
k / s
-1
k1
k1'
As before the kobs values had to be converted into pH- independent rate constants using
Equation 3.2.
Table 3.8: Kinetics of NAc-CoIIIMP8 with MeNH2.
[MeNH2] / M k1obs / s -1 k1 / s-1 * k1obs’ / s-1 k1’ / s-1 *
0.501 9.79E-03 8.34 4.47E-02 38.09
1.001 1.56E-02 13.29 6.05E-02 51.55
1.502 2.26E-02 19.26 4.07E-01 346.82
1.753 3.27E-02 27.86 1.62E-01 138.05
2.003 2.44E-02 20.79 4.38E-01 337.24
2.253 4.78E-02 40.73 3.99E-01 340.00
2.504 3.58E-02 30.51 4.29E-01 365.57
* Corrected for pH using Equation 3.2
Figure 3.32: Plot of [MeNH2] against the observed rate constants for the
reaction with NAc-CoIIIMP8.
k1
k1’
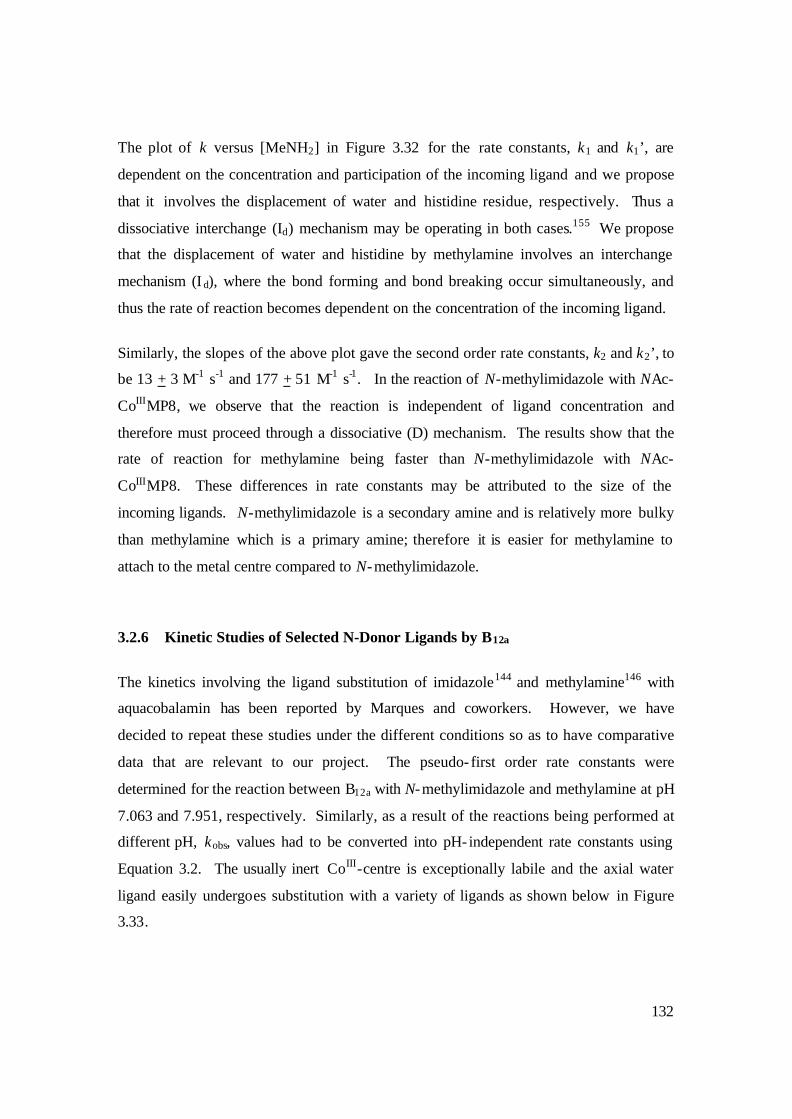
132
The plot of k versus [MeNH2] in Figure 3.32 for the rate constants, k1 and k1’, are
dependent on the concentration and participation of the incoming ligand and we propose
that it involves the displacement of water and histidine residue, respectively. Thus a
dissociative interchange (Id) mechanism may be operating in both cases.155 We propose
that the displacement of water and histidine by methylamine involves an interchange
mechanism (I d), where the bond forming and bond breaking occur simultaneously, and
thus the rate of reaction becomes dependent on the concentration of the incoming ligand.
Similarly, the slopes of the above plot gave the second order rate constants, k2 and k2’, to
be 13 + 3 M-1 s-1 and 177 + 51 M-1 s-1. In the reaction of N-methylimidazole with NAc-
CoIIIMP8, we observe that the reaction is independent of ligand concentration and
therefore must proceed through a dissociative (D) mechanism. The results show that the
rate of reaction for methylamine being faster than N-methylimidazole with NAc-
CoIIIMP8. These differences in rate constants may be attributed to the size of the
incoming ligands. N-methylimidazole is a secondary amine and is relatively more bulky
than methylamine which is a primary amine; therefore it is easier for methylamine to
attach to the metal centre compared to N-methylimidazole.
3.2.6 Kinetic Studies of Selected N-Donor Ligands by B12a
The kinetics involving the ligand substitution of imidazole144 and methylamine146 with
aquacobalamin has been reported by Marques and coworkers. However, we have
decided to repeat these studies under the different conditions so as to have comparative
data that are relevant to our project. The pseudo- first order rate constants were
determined for the reaction between B12a with N-methylimidazole and methylamine at pH
7.063 and 7.951, respectively. Similarly, as a result of the reactions being performed at
different pH, kobs, values had to be converted into pH- independent rate constants using
Equation 3.2. The usually inert CoIII-centre is exceptionally labile and the axial water
ligand easily undergoes substitution with a variety of ligands as shown below in Figure
3.33.
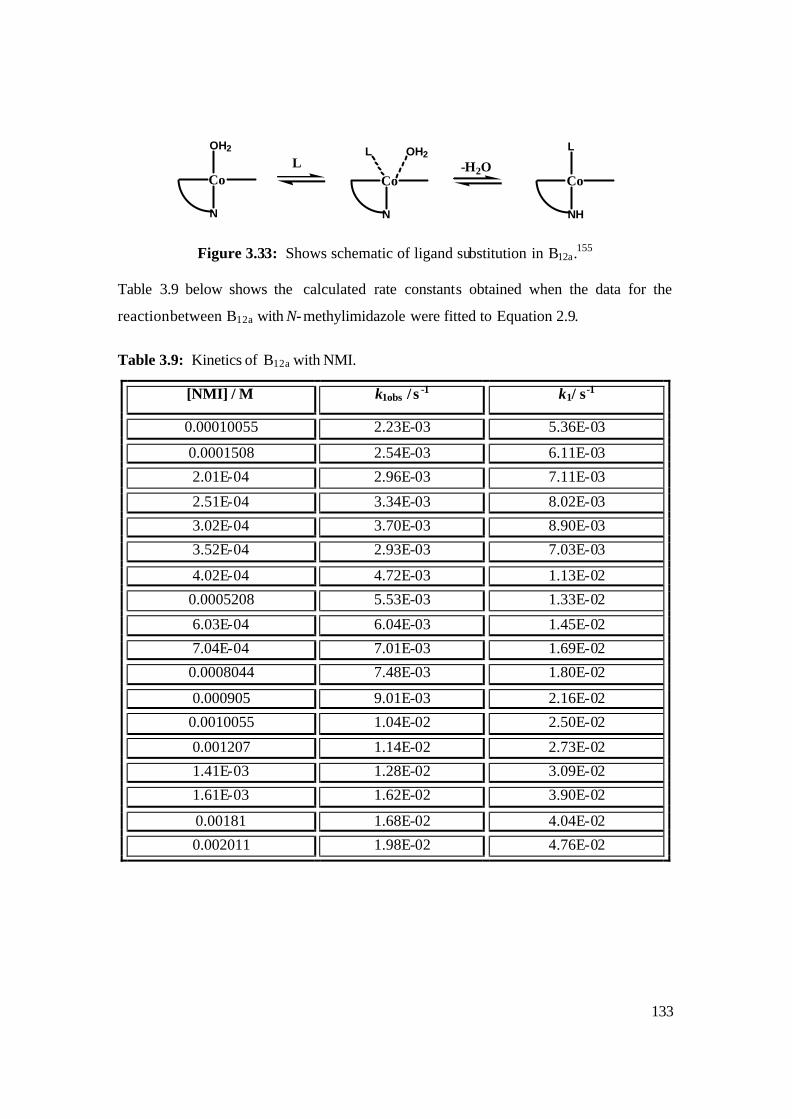
133
Co
OH2
N
LCo
N
L OH2
Co
NH
L
-H2O
Figure 3.33: Shows schematic of ligand substitution in B12a.155
Table 3.9 below shows the calculated rate constants obtained when the data for the
reaction between B12a with N-methylimidazole were fitted to Equation 2.9.
Table 3.9: Kinetics of B12a with NMI.
[NMI] / M k1obs / s -1 k1/ s-1
0.00010055 2.23E-03 5.36E-03
0.0001508 2.54E-03 6.11E-03
2.01E-04 2.96E-03 7.11E-03
2.51E-04 3.34E-03 8.02E-03
3.02E-04 3.70E-03 8.90E-03
3.52E-04 2.93E-03 7.03E-03
4.02E-04 4.72E-03 1.13E-02
0.0005208 5.53E-03 1.33E-02
6.03E-04 6.04E-03 1.45E-02
7.04E-04 7.01E-03 1.69E-02
0.0008044 7.48E-03 1.80E-02
0.000905 9.01E-03 2.16E-02
0.0010055 1.04E-02 2.50E-02
0.001207 1.14E-02 2.73E-02
1.41E-03 1.28E-02 3.09E-02
1.61E-03 1.62E-02 3.90E-02
0.00181 1.68E-02 4.04E-02
0.002011 1.98E-02 4.76E-02
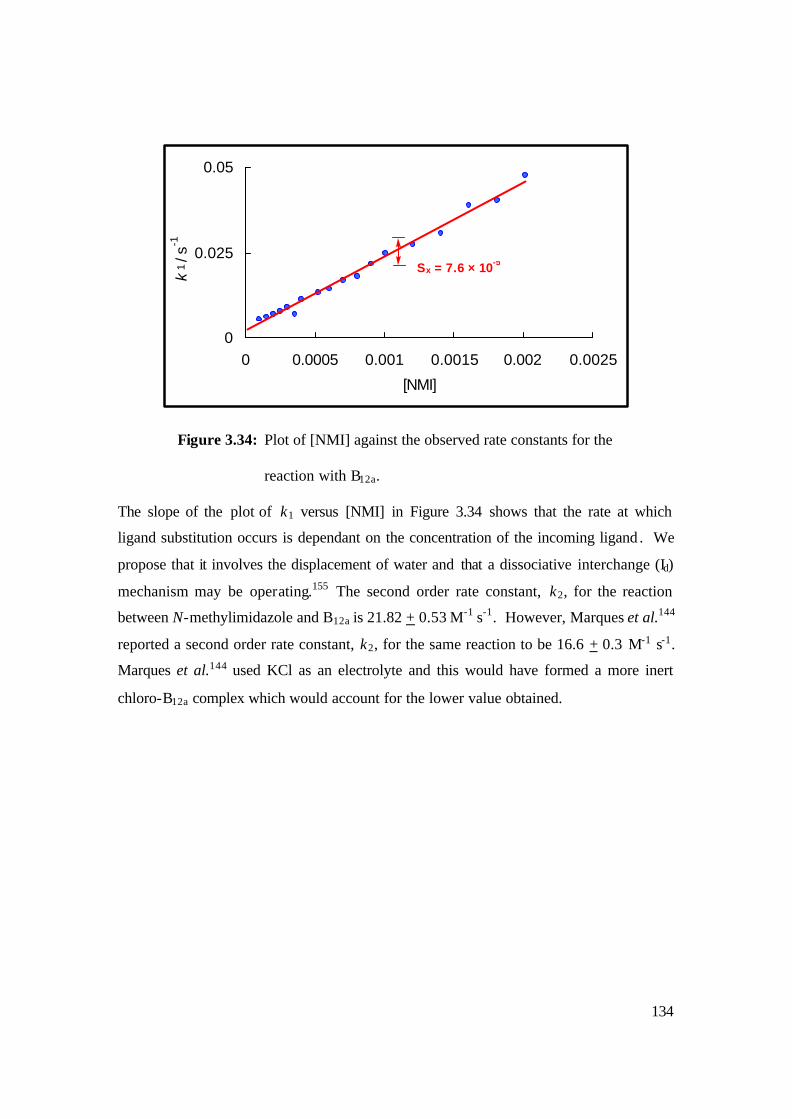
134
0
0.025
0.05
0 0.0005 0.001 0.0015 0.002 0.0025
[NMI]
k1 / s
-1
Figure 3.34: Plot of [NMI] against the observed rate constants for the
reaction with B12a.
The slope of the plot of k1 versus [NMI] in Figure 3.34 shows that the rate at which
ligand substitution occurs is dependant on the concentration of the incoming ligand . We
propose that it involves the displacement of water and that a dissociative interchange (Id)
mechanism may be operating.155 The second order rate constant, k2, for the reaction
between N-methylimidazole and B12a is 21.82 + 0.53 M-1 s-1. However, Marques et al.144
reported a second order rate constant, k2, for the same reaction to be 16.6 + 0.3 M-1 s-1.
Marques et al.144 used KCl as an electrolyte and this would have formed a more inert
chloro-B12a complex which would account for the lower value obtained.
Sx = 7.6 × 10⁻⁵
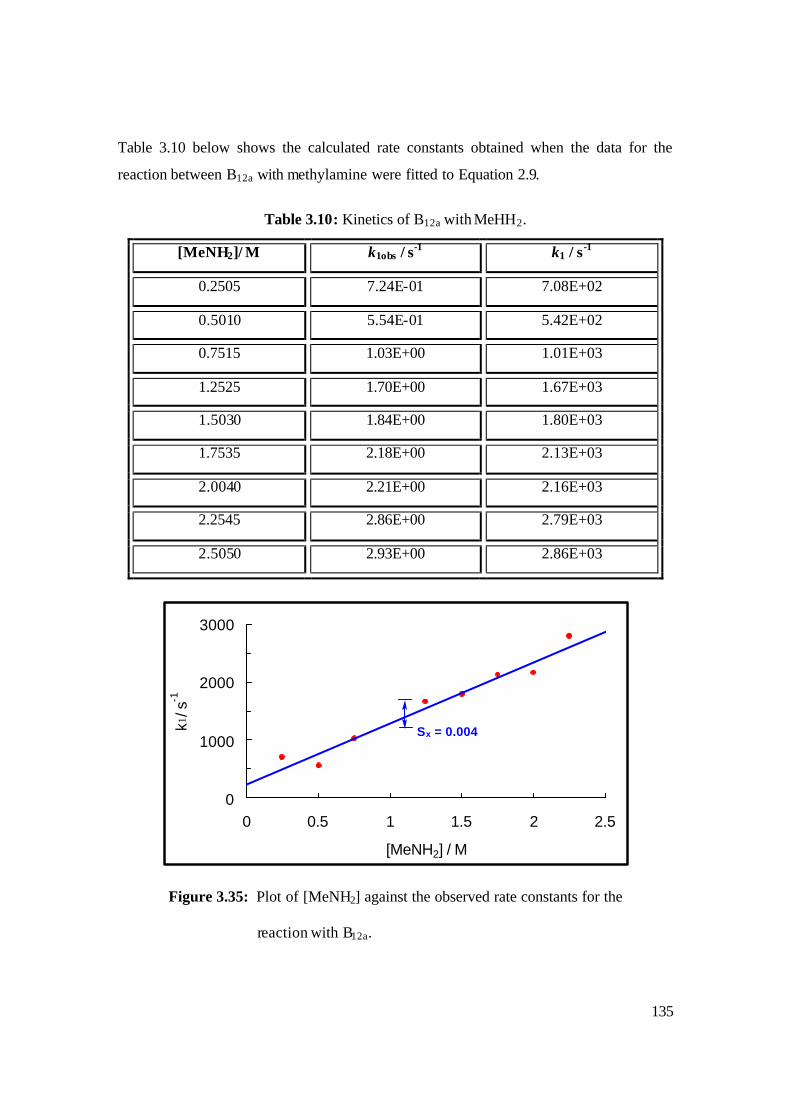
135
Table 3.10 below shows the calculated rate constants obtained when the data for the
reaction between B12a with methylamine were fitted to Equation 2.9.
Table 3.10: Kinetics of B12a with MeHH2.
[MeNH2]/ M k1obs / s-1 k1 / s-1
0.2505 7.24E-01 7.08E+02
0.5010 5.54E-01 5.42E+02
0.7515 1.03E+00 1.01E+03
1.2525 1.70E+00 1.67E+03
1.5030 1.84E+00 1.80E+03
1.7535 2.18E+00 2.13E+03
2.0040 2.21E+00 2.16E+03
2.2545 2.86E+00 2.79E+03
2.5050 2.93E+00 2.86E+03
0
1000
2000
3000
0 0.5 1 1.5 2 2.5
[MeNH2] / M
k1/ s
-1
Figure 3.35: Plot of [MeNH2] against the observed rate constants for the
reaction with B12a.
Sx = 0.004

136
The slope of the plot of k1 versus [MeNH2] in Figure 3.34 shows that the rate at which
ligand substitution occurs is dependant on the concentration of the incoming ligand .
Similarly, we propose that it involves the displacement of water and that a dissociative
interchange (Id) mechanism may be operating.155 The second order rate constant, k2, for
the reaction between methylamine and B12a is 1.052 + 0.071 × 10³ M-1 s-1. In a similar
study Marques et al.146 reported the second order rate constant for the same reaction to be
0.927 + 0.0022.
Table 3.11: Second order rate constants of NAc-CoIIIMP8 and B12a.
Ligand Second order rate
constant for
NAc-CoIIIMP8 / M -1 s-1
Second order rate
constant for
B12a / M-1 s-1
NMI
MeNH2
-
-
k2 = 1.32 + 0.3 × 10⁴
k2’ = 177 + 51
k2 = 16.6 (a)
k2 = 21.82 + 0.53
k2 = 9.27 × 10⁻¹ (b)
k2 = 1.052 + 0.071 ×10³
a – data obtained from reference 144
b – data obtained from reference 146
Table 3.11 shows that in the reaction of NAc-CoIIIMP8 with N-methylimidazole and
methylamine, two ligand substitutions are observed. In both reactions, we propose that
the first rate constant is due to the substitution of the axial water molecule and the second
due to the substitution of the proximal histidine residue giving rise to the formation of a
bis-complex. Also when comparing the second order rate constants of both ligands with
NAc-CoIIIMP8, we observe that the rate of substitution of methylamine is significantly
faster than N-methylimidazole. This may be attributed to the relative size of the ligands
as mentioned earlier. In addition, the reaction of NAc-FeIIIMP8 with N-methylimidazole
is independent of ligand concentration which suggests a dissociative mechanism. While
137
the reaction of NAc-FeIIIMP8 with methylamine the rate of ligand substitution is
dependant on ligand concentration (suggests Ia mechanism).
Although the observed reaction rates of B12a with N-methylimidazole compare very well
with literature, the observed reaction rate of B12a with methylamine do not. The results
show that the rate of the reaction between NAc-CoIIIMP8 and B12a with N-
methylimidazole and methylamine are significantly different. Overall it is clear that the
solution chemistry of NAc-CoIIIMP8 is complex and does not mimic the chemistry of
NAc-FeIIIMP8 nor B12a due to bisubstitution of the cobalt centre.
138
Chapter 4 Conclusions and Future Work 4.1 Conclusions
4.1.1 The synthesis and characterisation of products leading to the
formation of NAc-CoIIIMP8
In this project we synthesised NAc-CoIIIMP8 in an attempt to develop a model system to
probe the chemistry of vitamin B12a. All products formed during the synthesis of NAc-
CoIIIMP8 were characterised using HPLC, UV-vis spectroscopy and FAB-MS with good
results, where appropriate, that compared well with literature values.
We used the procedure developed by Munro and Marques with some modifications to
synthesise FeIIIMP8.109 The synthesis of FeIIIMP8 was successfully performed in 55 %
yield. The removal of the central FeIII ion from FeIIIMP8 was successfully accomplished
by a process known as reductive demetalation.79 MP8 free base was successfully
synthesised in 73 % yield. The MP8 free base was further analysed using luminescence
spectroscopy and characteristic triplet-triplet absorption band was observed on the
emission spectrum. This provided further evidence that the reductive demetalation
procedure was successful. CoIII was successfully inserted into the empty porphyrin
cavity of the MP8 free base using a procedure which was also adopted from the report by
Primus and coworkers.79 CoIIIMP8 was synthesised in 69 % yield. CoIIIMP8 was further
analysed using luminescence spectroscopy, however, the characteristic triplet-triplet
absorption band was not observed on the emission spectrum. The quenching of the
triplet-triplet absorption band provided more evidence that remetalation was successful.
Finally, acetylation of CoIIIMP8 was carried out according to methods developed by
Munro and Marques.109 NAc-CoIIIMP8 was synthe sised in 58 % yield. Even if the
acetylation step was done very early in the study, better yields would not have been
obtained, since this would acetylate the nitrogen of the histidine residue instead of Cys-14
residue. The overall yield from FeIIIMP8 to was calculated to be 29 %.
139
4.1.2 Solution Chemistry of NAc-CoIIIMP8
We have used UV-vis spectroscopy to fully characterise the solution chemistry of
monomeric NAc-CoIIIMP8 over the pH range. Beer’s law studies shows that NAc-
CoIIIMP8 remains monomeric in aqueous solution up to concentrations of at least 35 µM.
The extinction coefficient, e, of NAcCoIIIMP8 (pH 7.00, 25 ºC) in distilled water and 1.0
M NaClO 4 was 1.80 + 0.01 x 10⁵ M-1 cm-1 and 1.66 + 0.01 x 10⁵ M-1 cm-1, respectively.
The spectroscopic changes observed for NAc-CoIIIMP8 during the course of
spectrophotometric titration are very similar to those observed for NAc-FeIIIMP8,109 with
both being consistent with six successive ionisations. At pH <1.5, we propose that
NAcCoIIIMP8 exists as a six-coordinate diaqua complex. By analogy with NAc-
FeIIIMP8, we attribute the first (pK1 = 2.0 + 0.3) involves coordination of the c-terminal
carboxylate group (Glu-21) of the appended polypeptide. The second acid range
transition (pK2 = 2.8 + 0.1) for NAcCoIIIMP8 probably involves the deprotonation of the
cationic His-18 and concomitant replacement of the c-terminal carboxylate by the neutral
heterocyclic base. We have assigned pK3 (3.9 + 0.03) to the ionisation of one of the
haem propanoic acid groups. The second haem propanoic acid group is assigned to the
ionization with pK4 = 7.47 + 0.03 and pK5 (9.19 + 0.04) was assigned to the ionisation of
the cobalt-bound water molecule. Finally, we attribute pK6 (12.07 + 0.03) to the
ionisation of the coordinated histidine trans to the OH- to form the histidinate complex
(His--CoIII-OH-).
To further delineate the solution chemistry of NAc-CoIIIMP8, its reaction with selected
N-donor ligands was studied by monitoring the dependence of the absorbance at the Soret
wavelength on the added ligand concentration. The formation constants between NAc-
CoIIIMP8 and N-methylimidazole and pyridine were determined successfully. When
comparing the formation constants of NAc-FeIIIMP8, NAc-CoIIIMP8 and B12a, we found
that the value of log K1 for NAc-CoIIIMP8 is significantly higher than that reported for
NAc-FeIIIMP8 and B12a. In addition, we observed the formation of a bi-substituted
complex in the reaction of NAc-CoIIIMP8 with the selected N-donor ligands, and only
140
mono-substituted with NAc-FeIIIMP8 and B12a. This strongly suggests that the Co(III)-
His bond in NAc-CoIIIMP8 is weaker than the same bond in B12a and the Fe(III)-His bond
in NAc-FeIIIMP8.
In the reaction between NAc-CoIIIMP8 with N-methylimidazole and methylamine we
initially noticed that the data obtained did not follow convention pseudo- first order
kinetics; instead there was some evidence for biphasic kinetics. In the reaction of N-
methylimidazole with NAc-CoIIIMP8, the results can be explained if the mechanism
proceeds through a purely dissociative mechanism, i.e., if the rate of the reaction is
controlled by the rate at which, firstly, the water molecule dissociates from the CoIII
centre and, secondly, the histidine dissociates from the metal. The second order rate
constant, k2, cannot be determined since the rate of reaction is independent of N-
methylimidazole concentration. In the reaction of methylamine with NAc-CoIIIMP8, the
rate constants are dependent on the concentration and participation of the incoming
ligand and we propose that it involves the displacement of water and histidine residue,
respectively. The results suggest that a dissociative interchange (Id) mechanism may be
operating.155 We propose that the displacement of water and histidine by methylamine
involves an interchange mechanism (Id), where the bond forming and bond breaking
occur simultaneously, and thus the rate of reaction becomes dependant on the
concentration of the incoming ligand.
Overall, the results show that the rate of reaction for methylamine with NAc-CoIIIMP8
being faster than N-methylimidazole. As mentioned earlier, these differences in rate
constants may be attributed to the size of the incoming ligands. The rate of reaction of
B12a with N-methylimidazole and methylamine was also determined. Although the
observed reaction rates of B12a with N-methylimidazole compare very well with
literature, the observed reaction rate of B12a with methylamine do not. The results show
that the rate of the reaction between NAc-CoIIIMP8 and B12a with methylamine is
significantly different.
141
The results obtained from the Beer’s law studies and pKa determinations of NAc-
CoIIIMP8 are in excellent agreement with similar studies performed with NAc-FeIIIMP8.
However, it is clear that the ligand substitution and kinetic studies of NAc-CoIIIMP8 is
complicated due to the formation of a bis-complex. The results presented in this work
do give a general indication on how thermodynamically stable a CoIII ion is in a
porphyrin ring and also to a very limited extent show that a porphyrin does not confer the
same kinetic lability on the CoIII ion as the corrin ring.
4.2 Future Work
This work is sets the foundation for future endevours where much more in depth studies
of thermodynamics of ligand coordination, kinetics of substitution processes, molecular
modeling, reduction and self-exchange reactions, catalytic studies and various other
studies on the solution chemistry of N-Ac-Co(III)MP8 can be unraveled.
142
References
1. Beinert, H., J. Biol. Chem., 2002, 277, 37967.
2. Bertini, I., Rosate, A., Proc. Natl. Acad. Sci., U. S. A., 100, 7, 3601.
3. Williams, R. J. P., Coord. Chem. Rev., 1990, 100, 573.
4. Kaim, W.; Schwederski, B., Bioinorganic Chemistry: Inorganic Elements in the
Chemistry of Life, John Wiley and Sons, New York, 1991, Chapters 1 - 4, 7, 8, 10.
5. Cotton, F. A.; Wilkinson, G., Advanced Inorganic Chemistry, 5th Edition, John
Wiley and Sons, New York, 1988, Chapters 18, 20 and 30.
6. Cotton, F. A.; Wilkinson, G., Basic Inorganic Chemistry, 5th Edition, John Wiley
and Sons, New York, 1987, Chapters 18 and 31.
7. Frausto da Silva, J. J. R.; Williams, R. J. P., The Biological Chemistry of Elements,
1991, Claredon Press, Oxford.
8. Huheey, J. E., Inorganic Chemistry, 3rd Edition, Harper and Row, New York, 1983,
Chapters 23 and 31.
9. Thiel, E. C.; Raymond, K. N., Bioinorganic Chemistry, University Science Books,
California, 1994, Chapter 1.
10. Martin, H.; Gordon, R. M., Deep Sea Res., 1988, 35, 177.
11. Fox, L. L., Geochim. Cosmochim. Acta, 1988, 52, 771.
12. Aisen, P., Iron, Biochemistry and Medicine, 2nd Edition, Academic Press, London,
1980, Chapter 3.
13. Spiro, T. G., Proteins of Iron Metabolism, Grune and Stratton, New York, 1977,
23.
14. Shriver, D. F.; Atkins, P. W.; Langford, C. H., Inorganic Chemistry, Oxford
University Press, 1994, p. 246.
15. Mankinen, M. W; Churg, A. K., in Iron Porphyrins, Part 1; Lever, A. B. P., Gray,
H. B., Eds.; Addison–Wesley Publishing Company, Inc.: Reading, M. A., 1983, pp.
141-235.
16. Silver, J. B. L.; Morrison, I. E. G.; Barnard, P. W. C., Inorg. Chim. Acta, 1983, 78,
205.
143
17. Wrigglesworth, J. M.; Baum, H., Iron Porphyrins in Biochemistry and Medicine,
Academic Press London, 1980, pp. 45-67.
18. Messerschmidt, A.; Huber, R.; Poulos, T.; Wieghardt, K., Handbook of
Metalloproteins, John Wiley and Sons, Volume 1, 2001.
19. Glusker, J. R.; Katz, A. K.; Bock, C. W., The Rigaku Journal, 1999, 16, 2.
20. Glusker, J. R., Adv. Protein Chem., 1991, 42, 1.
21. Smith, K. M., Porphyrins and Metalloporphyrins, Elserivier Publishing Co., 1975,
pp. 1-200 and 672.
22. Ochiai, E., Bioinorganic Chemistry, Allyn and Bacon Inc., 1977, Chapters 1, 5, 6
and 12.
23. Pratt, J. M., B12, Volumes 1-2, Dolphin, D., Ed; Wiley, New York, 1982.
24. Pratt, J. M., Techniques and Topics in Bioinorganic Chemistry, (Ed. McAuliffe, C.
A.), Macmillan Press Ltd., London, 1971, pp. 109-204.
25. Lemberg, R.; Barrett, J., Cytochromes, Academic Press, New York, 1973.
26. Nomenclature Committee of the International Union of Biochemistry (NCIUB)
Nomenclature of electron transfer proteins. Recommendations 1989. Eur. J.
Biochem., 1991, 200, 599.
27. Banci, L.; Bertini, K. L.; Gray, H. B.; Luchinat, C.; Reddig, T.; Rosato, A.; Turano,
P., Biochemistry, 1997, 36, 9867.
28. Pettigrew, G. W.; Moore, G. R., Cytochrome c – Biological Aspects, Springer-
Verlag, Berlin, 1987.
29. Levis, D. F. V., Cytochromes P450: Structure, Function and Mechanism, Taylor
and Francis, London, 1996.
30. Egawa, T.; Ogura, T.; Makino, R.; Ishimura, Y.; Kitagawa. T., J. Biol. Chem.,
1991, 266, 10246.
31. Dawson, J.H., Science, 1988, 240, 433.
32. Jacob, G.S.; Orme Johnson, W.H., Biochemistry, 1979, 18, 2975.
33. Goldberg, I.; Hochman, A., Arch. Biochem. Biophys., 1989, 268, 124.
34. Chiu, J.T.; Loewen, P.C.; Switala, J.; Gennis, R.B.; Timkovich, R., J. Am. Chem.
Soc., 1989, 111, 7046.
144
35. Fita, I.; Silva, A.M.; Murthy, M.R.N., Rossmann, M.G., Acta Crystallogr., 1986,
B42, 497.
36. Murshudov, G.N.; Melik Adamya n, W.R.; Grebenko, A.I.; Barynin, V.V.; Vagin,
A.A.; Vainshtein, B.K.; Dauter, Z.; Wilson, K.S., FEBS Lett., 1992, 312, 127.
37. Gouet, P.; Jouve, H.M.; Dideberg, O. J. Mol. Biol., 1995, 249, 933.
38. Bravo, J.; Verdaguer, N.; Tormo, J.; Betzel, C.; Switala, J.; Loewen, P.C.; Fita, I.,
Structure , 1995, 3, 491.
39. Ortiz, P. R., Cytochrome P450 Structure – Mechanism and Biochemistry, 1986,
Plenum Press, New York and London, pp. 217-71.
40. Nelson, D. R.; Koymans, L.; Kamataki, T.; Stegeman, J. J.; Feyereisen, R.;
Waxman, D. J.; Waterman, M. R.; Gotoh, O.; Estabrook, R. W.; Gunsalus, I. C.;
Nebert, D. W., Pharmacogenetics, 1996, 6, 1.
41. Haserman, C. A.; Ravichandran, K. G.; Peterson, J. A.; Deseinhofer, J., J.Biol.
Chem., 1994, 236, 1169.
42. Omura, T.; Sato, R., J. Biol. Chem.,1964, 239, 2370.
43. Omura, T.; Sato, R., J. Biol. Chem.,1964, 239, 2378.
44. Champion, P. M.; Stallard, B. R.; Wagner, G. C; Gunsalus, I. C., J. Am. Chem.
Soc., 1982, 104, 5469.
45. Shannon, R. D.; Prewitt, C. T., Acta Cryst., B26, 1970, 1046.
46. Shimura, Y., Bulletin of the Chemical Society of Japan, 1988, 61, 693.
47. Hill, H. A. O.; Röder, A.; Williams, R. J. P., Structure and Bonding, 1970, 8, 123.
48. McMurry, T. J.; Groves, J. T., Cytochrome P-450, Plenum Press, 1986, New York,
pp. 1-28.
49. Groves, J. T.; Watanabe, Y., J. Am. Chem. Soc., 1988, 110, 8433.
50. Poulos, T. L.; Finzel, B. C.; Howard, A. J., Biochemistry, 1986, 25, 5314.
51. Schenkman, J. B.; Sligar, S. G.; Cinti. D. L., Pharmacology and Therapeutics,
1981, 12, 43.
52. Schenkman, J. B.; Kupfer, D., Hepatic Cytochrome P-450 Monoxygenase System,
Permagon, Oxford, 1982.
53. Sligar, S. G.; Murray, R. I., Cytochrome P450 and other bacterial P450 enzymes,
Plenum, New York, 1986, pp. 429-503.
145
54. Ruckpaul, K.; Rein, H.; Blank, J. Frontiers in Biotransformation, 1989, 1, 1.
55. Veitch, N. C.; Williams, R. J. P., Frontiers in Biotransformation, 1992, 7, 279.
56. Archakov, A. I.; Buchmanova, G. I., Cytochrome P-450 and Active Oxygen. Taylor
and Francis, London, 1990.
57. Welinder, K.G., Curr. Opin. Struct. Biol., 1992, 2, 388.
58. Imai, Y.; Sato, R.; Iyanagi, T., Biochemistry, 1977, 82, 1237.
59. Kimura, S.; IkedaSaito, M., Proteins, 1992, 3, 113.
60. Suzuki, T.; Imai, K., Cell. Mol. Life Sci., 1998, 54, 979.
61. Kraulis, K., J. Appl. Crystallogr., 1991, 21, 946.
62. Perutz, M. F.; Rossmann M. G.; Cullis, A. F.; Muirhead, H.; Will, G.; North, A. C.
J., Nature, 1960, 185, 416.
63. Perutz, M. F.; J. Mol. Biol., 1965, 13, 646.
64. Scott, E. E.; Paster, E. V.; Olson, J. S., J. Biol. Chem., 2000, 275, 27129.
65. Kendrew, J. C.; Dickerson, R. E.; Strandberg, B. E.; Hart, R. G.; Davies, D. R.;
Philips, D. C.; Shore, V. C., Nature, 1960, 185, 422.
66. West, E.; Todd, W.; Mason, H. S.; Van Bruggen, T. J., Textbook of Biochemistry,
1975, 4th Edition.
67. Hughes, M. N., Comprehensive Coordination chemistry, Vol. 4, 1987, Pergamon
Press, Oxford, pp. 614-617.
68. Marques, H. M.; Shongwe, M. S.; Munro, O. Q.; Egan, T. J., S. Afr. J. Chem., 1997,
50, 166.
69. Shack, J.; Clark, W. M., J. Biol. Chem., 1947, 171, 143.
70. Dunford, H. B.; Stillman, J. S., Coord. Chem. Rev., 1976, 19, 187.
71. Maehly, M. C.; Akeson, A., Acta. Chem. Scand., 1958, 12, 1259.
72. Davies, T. H., Biochim. Biophys. Acta., 1973, 329, 108.
73. Hodgkinson, J.; Jordan, R. B., J. Am. Chem. Soc., 1973, 95, 763.
74. Stein, T. P.; Plane, R. A., J. Am. Chem. Soc., 1969, 91, 607.
75. Simplicio, J.; Schwenzer, K., Biochemistry, 1973, 12, 1923.
76. Hambright, P.; Chock, P. B., K., J. Inorg. Nucl. Chem., 1975, 37, 2363.
77. Walker, F. A.; Lo, M.; Ree, M. T., J. Am. Chem. Soc., 1976, 98, 5552.
146
78. Marques, H. M.; Munro, O. Q.; Crawcour, M. L., Inorg. Chim., Acta., 1992, 196,
221.
79. Primus, J.; Marelle, G. B.; Mandon, D.; Boeren, S.; Veeger, C.; Weiss, R.; Rietjens,
I. M. C. M., J. Biol. Inorg. Chem., 1999, 4, 274.
80. Momenteau, B.; Rougee, M.; Loock, B., Eur. J. Biochem., 1976, 71, 63.
81. Primus, J.; Marelle, G. B.; Mandon, D.; Boeren, S.; Veeger, C.; Weiss, R.; Rietjens,
I. M. C. M., J. Biol. Inorg. Chem., 2002, 7, 7.
82. Marques, H. M.; Munro, O. Q.; Munro, T.; de Wet, M.; Vashi, P. R., Inorg. Chem.,
1999, 38, 2312.
83. Tsou, C. L., Nature, 1949, 164, 1134.
84. Tsou, C. L., Biochem. J., 1951, 49, 362.
85. Tsou, C. L., Biochem. J., 1951, 49, 367.
86. Tuppy, H.; Bodo, G., Montash. Chem., 1954, 85, 1182.
87. Tuppy, H.; Paleus, S., Acta Chem. Scand., 1955, 9, 353.
88. Ehrenberg, A.; Theorell, H., Acta Chem. Scand., 1955, 9, 1193.
89. Harbury, H. A.; Loach, P. A., J. Biol. Chem., 1960, 235, 3640.
90. Peterson, J.; Silver, J.; Wilson, M. T.; Morrison, I. E. G., J. Inorg. Biochem., 1980,
13, 75.
91. Adams, P. A.; Baldwin, D. A.; Marques, H. M., in Scott, R. A.; Mauk, A. G.(Eds.),
Cytochrome c: A Multidisciplinary Approach, University Science Books, Sausalito,
California, 1996, pp. 635-692.
92. Carraway, A. D.; Burkhalter, R. S.; Timkovich, R.; Perterson, J., J. Inorg.
Biochem., 1993, 52, 201.
93. Kimura, K.; Peterson, J.; Wilson, M. T.; Cookson, D. J.; Williams, R. J. P., Inorg.
Biochem., 1981, 15, 11.
94. Mondeli, R.; Scaglioni, L.; Mazzini, S.; Bolis, G.; Ranghino, G., Magn. Reson.
Chem., 2000, 38, 229.
95. Paleus, S.; Ehrenberg, A.; Tuppy, H., Acta Chem. Scand., 1955, 9, 365.
96. Wilson, M. T.; Ranson, R. J.; Masiakowski, P.; Czarnecka, E.; Brunori, M.; Eur. J.
Biochem., 1977, 77, 193.
97. Urry, D. W.; Pettegrew, J. W., J. Am. Chem. Soc., 1967, 89, 5276.
147
98. Nassif, R.; Baumgartner, C. P.; Sellers, M.; May, L., Naturforsch., 1976, 31C, 232.
99. Jehanli, A .M. T.; Stotter, D. A.; Wilson, M. T., Eur. J. Biochem ., 1976, 71, 613.
100. Nassif, R.; Baumgartner, C. P.; Sellers, M.; May, L., Eur. J. Biochem ., 1974, 46,
625.
101. DerVartanian, D. V., Biochim. Biophys. Res. Commun., 1970, 41, 932.
102. Aron, J. A.; Baldwin, D. A.; Marques, H. M.; Pratt, J. M.; Adams, P. A., J. Inorg.
Biochem., 1986, 27, 227.
103. Baldwin, D. A.; Marques, H. M.; Mabuya, M. B., S. Afr. J. Chem., 1987, 40, 103.
104. Arutyunyan, A. M.; Surkov, S. A.; Luchkov, V. A.; Lysko, A. I.; Mironov, A. F.;
Rumyantseva, V. S.; Evstigneeva, R. P., Mol. Biol. (Moscow), 1986, 20, 502.
105. Urry, D. W., J. Am. Chem. Soc., 1967, 89, 4190.
106. Harbury, H. A.; Loach, P. A., Proc. Natl. Acad. Sci., U. S. A.,1959, 45, 1344.
107. Yang, E. K.; Sauer, K., in Electron Transport and Oxygen Utilisation (Ed.: Chien,
H.), Elsevier, New York, 1982.
108. Wang, J.-S.; Van Wart, H. E., J. Phys. Chem., 1989, 93, 7925.
109. Munro, O. Q.; Marques, H. M., Inorg. Chem., 1996, 35, 3752.
110. Wang, J.-S.; Van Wart, H. E.; Tsai, A.-L.; Heldt, J.; Palmer, G., J. Biol. Chem.,
1992, 267, 15310.
111. Owens, J. W.; O’Connor, C. J.; Kassner, R. J., Inorg. Chim. Acta., 1988, 151, 107.
112. Marques, H. M.; Baldwin, D. A.; Pratt, J. M., J. Inorg. Biochem., 1987, 29, 77.
113. Baldwin, D. A.; Marques, H. M.; Pratt, J. M., J. Inorg. Biochem., 1986, 27, 245.
114. Marques, H. M., PhD Thesis, University of the Witwatersrand (Johannesburg),
1986.
115. Harbury, H. A.; Cronin, J. R.; Fanger, M. W.; Hettinger, T. P.; Murphy, A. J.;
Myer, Y. P.; Vinogradov, S. N., Proc. Natl. Acad. Sci., U. S. A., 1965, 54, 1658.
116. Hamza, M. S. A.; Pratt, J. M., J. Chem. Soc. Dalton. Trans., 1993, 1647.
117. Blumenthal, D. C.; Kassner, R. J., J. Biol. Chem., 1979, 254, 9617.
118. Hamilton, G. H.; Owens, J. W.; O’Connor, C. J.; Kassner, R. J., Inorg. Chim. Acta.,
1984, 93, 55.
119. Jain, A.; Kassner, R. J., J. Biol. Chem., 1984, 259, 10309.
120. Perry, C. B., PhD Thesis, University of the Witwatersrand (Johannesburg), 2004.
148
121. Huang, Y.-P.; Kassner, R. J., J. Biol. Chem., 1981, 256, 5327.
122. Antonini, E.; Brunori, M., in Haemoglobin and Myoglobin in Their Reactions with
Ligands, Elsevier, Amsterdam, 1971.
123. Giacometti, G. M.; Ascenzi, P.; Bolognesi, M.; Brunori, M., J. Mol. Biol., 1981,
146, 353.
124. Sono, M.; Asakura, T., J. Biol. Chem., 1976, 251, 2664.
125. Scheler, W., Biochem. Z., 1969, 332, 542.
126. Makino, R.; Yamazaki, I., Arch. Biochem. Biophys., 1973, 157, 356.
127. Bolognesi, M.; Ascenzi, P.; Giacometti, G. M.; Brunori, M.; Cannillo, E.; Merli,
A., J. Mol. Biol., 1982, 158, 305.
128. Uchida, H.; Heystec, J.; Klapper, M. H., J. Biol. Chem., 1971, 246, 2031.
129. Eaton, D. R.; Wilkins, R. G., J. Biol. Chem., 1978, 253, 908.
130. Hughes, M. N., in Comprehensive Coordination Chemistry, Vol 4 (Ed.: Wilkinson,
G.), Pergamon Press, Oxford, 1987, p. 614.
131. Anusiem, A. C.; Beetlestone, J. G.; Irvine, D. H., J. Chem. Soc. A, 1966, 357.
132. Erecinska, M.; Vanderkooi, J. M., Methods Enzymol., 1978, 53, 165.
133. Gray, H. B., Inorg. Chem., 1989, 28, 2074.
134. Schneider, Z.; Stroinski, A., Comprehensive B12: Chemistry, biochemistry,
nutrition, ecology and medicine, Walter de Gruyter and Company, 1987, pp. 7-10.
135. Golding, B. T.; Chem. Brit., 1990, 26, 950.
136. Minot, C. R.; Murphy, W. P., J. Am. Med. Ass., 1926, 87, 470.
137. Castle, W. B., Am. J. Med. Sci., 1929, 178, 764.
138. Rickes, E. L.; Brink, N. G., Koniuszy, F. R.; Wood, T. R.; Folkers, K., Science,
1948, 107, 396.
139. Smith, E. L.; Parker, L. F., Biochem. J., 1948, 43, 8.
140. Brink-Shoemaker, C.; Cruickshank, D. W. J..; Hodgkin, D. C.; Kamper, J.; Pilling,
D., Proc. R. Soc. London, Ser. A, 1964, 278, 1.
141. DeRidder, D. J. A.; Zangrando, E.; Büergi, H. –B., J. Mol. Struct., 1996, 374, 63.
142. Brown, K. L., Chem. Rev., 2005, 105, 2075.
143. Marques, H. M.; Egan, T. J.; Marsh, J. H.; Mellor, J. R.; Munro, O. Q., Inorg.
Chim. Acta, 1989, 166, 249.
149
144. Marques, H. M.; Egan, T. J.; Marsh, J. H.; Mellor, J. R.; Munro, O. Q., Inorg.
Chim. Acta, 1990, 170, 259.
145. Marques, H. M., J. Chem. Soc., Dalton Trans., 1991, 339.
146. Marques, H. M., J. Chem. Soc., Dalton Trans., 1991, 1437.
147. http://chemweb.stanford.edu/winter2004/chem151/Handouts/lecture17.pdf. Last
accessed on 21 Nov 2005 12:32:32 GMT by athena.wits.ac.za
148. Marques, H. M.; Breet, E. L. J.; Prinsloo, F. F., J. Chem. Soc., Dalton Trans., 1991,
2941.
149. Marques, H. M., S. Afr. J. Chem., 1991, 44, 114.
150. Marques, H. M.; Bradley, J. C.; Campbell L.A., J. Chem. Soc., Dalton Trans.,
1992, 2019.
151. Marques, H. M.; Bradley, J. C.; Brown, K. L.; Brooks, H., Inorg. Chim. Acta, 1993,
209, 161.
152. Marques, H. M.; Bradley, J. C.; Brown, K. L.; Brooks, H., J. Chem. Soc., Dalton
Trans., 1993, 3475.
153. Marques, H. M.; Munro, O. Q.; Cumming, B. M.; de Nysschen, C., J. Chem. Soc.,
Dalton Trans., 1994, 297.
154. Marques, H. M.; Knapton, L., J. Chem. Soc. Dalton Trans., 1997, 3827.
155. Marques, H. M.; Knapton, L.; Zou, X.; Brown, K. L., J. Chem. Soc., Dalton Trans.,
2002, 3195.
156. Hamza, M. S. A.; Zou, X.; Banka, R.; Brown, K. L.; van Eldik, R., Dalton Trans.,
2005, 782.
157. Jensen, K. P.; Ryde, U., Chem. Bio. Chem., 2003, 4, 413.
158. Wirt, M. D.; Sagi, I.; Chen, E.; Frisbie, S. M.; Lee, R.; Chance, M. R., J. Am.
Chem. Soc., 1991, 113, 5299.
159. Scheidt, W. R.; Reed, C. A., Chem. Rev., 1981, 81, 543.
160. Suko, R. K.; Poppe, L.; Rétey, J.; Finke, R. G., Bioorg. Chem., 1999, 27, 451.
161. Glusker, J. P., Vitam. Horm., 1995, 50, 1.
162. Wirt, M. D.; Sagi, I.; Chance, M. R., J. Biophys., 1992, 63, 412.
163. Pratt, J. M., Pure Appl. Chem., 1993, 65, 1513.
164. Stolzenberg, A. M.; Stershic, M. T., J. Am. Chem. Soc., 1988, 110, 6391.
150
165. Geno, M. K.; Halpern, J., J. Am. Chem. Soc., 1987, 109, 1238.
166. Lippard, S. J.; Berg, J. M., Principles of Bioinorganic Chemistry, University
Science Books, Mill Valley, California, 1994, p. 343.
167. Rovira, C.; Kunc, K.; Hutter, J.; Parrinello, M., Inorg. Chem., 2001, 40, 11.
168. Williams, R. J. P., J. Mol. Catal., 1985, 30, 1.
169. Murakami, Y.; Aoyama, Y.; Tokunaga, K., J. Am. Chem. Soc., 1980, 102, 6736.
170. Scheuring, E.; Padmakumar, R.; Banerjee, R.; Chance, M. R., J. Am. Chem. Soc.,
1997, 119, 12192.
171. Dong, S.; Padmakumar, R.; Banerjee, R.; Spiro, T. G., J. Am. Chem. Soc., 1996,
118, 9182.
172. Dong, S.; Padmakumar, R.; Banerjee, R.; Spiro, T. G., J. Am. Chem. Soc., 1999,
121, 7063.
173. Sirovatka, J. M.; Rappé, A. K.; Finke, R. G., Inorg. Chim. Acta., 2000, 545, 300.
174. Jensen, K. P.; Ryde, U., J. Mol. Str., Theochem, 2002, 585, 239.
175. Rohmer, M.-M., Chem. Phys. Lett., 1985, 116, 44.
176. Edwards, W. D.; Weiner, B.; Zerner, M. C., J. Am. Chem. Soc., 1986, 116, 2196.
177. Choe, Y. K-.; Hashimoto, T.; Nakano, H.; Hirao, K., Chem. Phys. Lett., 1998, 295,
380.
178. Choe, Y. K-.; Nakajima, T.; Hirao, K.; Lindh, R., J. Chem. Phys., 1999, 111, 3837.
179. Spiro, T. G.; Kozlowski, P. M.; Zgierski, M. Z., J. Raman Spectrosc., 1998, 29,
869.
180. Kozlowski, P. M.; Spiro, T. G.; Bérces, A.; Zgierski, M. Z., J. Chem. Phys. B,
1998, 102, 2603.
181. Seno, Y.; Kameda, N.; Otsuka, J., J. Chem. Phys., 1980, 72, 6048.
182. Obara, S.; Kashiwagi, H., J. Chem. Phys., 1982, 77, 3155.
183. Yamamoto, S.; Teraoka, J.; Kashiwagi, H., J. Chem. Phys., 1988, 88, 303.
184. Matsuzawa, N.; Ata, M.; Dixon, D. A.; J. Chem. Phys., 1995, 99, 7698.
185. Rovira, C.; Kunc, K.; Hutter, J.; Bollone, P.; Parinello, M., J. Chem. Phys., 1997,
101, 8914.
186. Sigfridsson, E.; Ryde, U., J. Biol. Inorg. Chem., 1999, 4, 99.
187. Sigfridsson, E.; Olsson, M. H. M.; Ryde, U., J. Chem. Phys. B, 2001, 105, 5546.
151
188. Andruniow, T.; Zgierski, M. Z.; Kozlowski, P. M., J. Chem. Phys. B, 2000, 104,
10921.
189. Andrunio w, T.; Zgierski, M. Z.; Kozlowski, P. M., Chem. Phys. Lett., 2000, 331,
509.
190. Jensen, K. P.; Sauer, S. P. A.; Liljefors, T.; Norrby, P. -O., Organometallics, 2001,
20, 550.
191. Dölker, N.; Maseras, F.; Lledos, A., J. Chem. Phys. B, 2001, 105, 7564.
192. Andruniow, T.; Zgierski, M. Z.; Kozlowski, P. M., J. Am. Chem. Soc., 2001, 123,
2679.
193. Ludwig, M. L.; Matthews, R. G., Annu. Rev. Biochem., 1997, 66, 269.
194. Holm, R. H.; Kennepohl, P.; Solomon, E. I., Chem. Rev., 1996, 96, 2239.
195. Eschenmoser, A.; Angew. Chem., 1988, 100, 5.
196. Mano, N.; Goto, J., Anal. Sciences, 2003, 19, 3.
197. Perry, C. B., CurveFit, a computer programme for non- linear least-squares fitting
using the Marquard algorithm, University of the Witwatersrand , Johannesburg,
South Africa, 1998.
198. Owens, J. W.; O’Connor, C. J., Coord. Chem. Rev., 1988, 84, 1.
199. Loew, G. H., ., in Iron Porphyrins, Part 1; Lever, A. B. P., Gray, H. B., Eds.;
Addison–Wesley Publishing Company, Inc.: Reading, M. A., 1983, pp. 1-87.
200. Moore, G. R.; Pettigrew, G. W., Cytochromes c: Evolutionary, Structural and
Physiochemical Aspects, Springer-Verlag, Berlin, 1990.
201. Carraway, A. D.; Burkhalter, R. S.; Timkovich, R.; Peterson, J., J. Inorg. Biochem.,
1993, 52, 201.
202. Low, D. W.; Abedin, S.; Yang, G.; Winkler; J. R.,Gray, H. B., Inorg. Chem. 1998,
37, 1841.
203. Lever, A. B. P., Inorganic Electronic Spectroscopy, Elserivier, Amsterdam, 1968,
p. 249.
204. White, W. I., in The Porphyrins, Dolphin, D., Ed.; Academic Press, New York,
1978, Volume 5, Chapter 7.
205. Pasternack, R. F.; Huber, P. R.; Boyd, P.; Engasser, G.; Francesconi, L.; Gibbs, E.;
Fasella, P.; Venturo, G. C.; de Hinds, L. C., J. Am Chem. Soc., 1972, 94, 4511.
152
206. Handbook of Chemistry and Physics, 55th Edition, Weast, R. C., Ed., Chemical
Rubber Co.: Cleveland, 1974, pp. D126-9.
207. Cohen, J. S.; Hayes, M. B.; J. Biol. Chem., 1974, 249, 5472.
208. Cohen, J. S.; Fisher, W. R.; Schechter, A. N., J. Biol. Chem., 1974, 249, 1113.
209. Moore, G. R.; Williams, R. J. P., Eur. J. Biochem., 1980, 103, 513.
210. Moore, G. R.; Williams, R. J. P., Eur. J. Biochem., 1980, 103, 523.
211. Moore, G. R.; Pettigrew, G. W.; Pitt, R. C.; Williams, R. J. P., Biochim. Biophys.
Acta, 1980, 590, 261.
212. Boeri, E.; Ehrenberg, A.; Paul, K. G.; Theorell, H., Biochim. Biophys. Acta, 1953,
12, 273.
213. Babul, J.; Stellwagen, E., Biochemistry, 1972, 11, 1195.
214. Smith, R. M. ; Martell, A. E., Critical Stability Constants, Plenum Press, New York,
1986, Volume 6, Second Supplement, p. 302.
215. Lommen, A.; Ratsma, A.; Bijlsma, N.; Canters, G. W.; Van Wielink, J. E.; Frank,
J.; Van Beeumen, J., Eur. J. Biochem., 1990, 192, 653.
216. Moore, G. R.; Williams, R. J. P.; Peterson, J.; Thomson, A. J.; Mathews, F. S.;
Biochim. Biophys. Acta, 1985, 829, 83.
217. La Mar, G. N.; Jackson, J. T.; Dugad, L. B.; Cusanovich, M. A.; Bartsch, R. G., J.
Biol. Chem., 1990, 265, 16173.
218. Costa, H. S.; Santos, H.; Tur ner, D. L.; Xavier, A. V., Eur. J. Biochem., 1992, 208,
457.
219. Keller, R.; Groundinsky, O.; Wüthrich, K., Biochim. Biophys. Acta, 1976, 427, 497.
220. Goldsack, D. E.; Eberlein, W. S.; Alberty, R. A., J. Biol. Chem., 1966, 241, 2653.
221. Marques, H. M., Inorg. Chem., 1990, 29, 1597.
222. George, P.; Hanania, G. I. H., Biochem. J., 1953, 55, 236.
223. George, P.; Hanania, G. I. H., Biochem. J., 1952, 52, 517.
224. Yagil, G., Tetrahedron, 1967, 23, 2855.
225. Martin, R. B., Proc. Natl. Acad. Sci., USA, 1974, 71, 4346.
226. Rubinson, K. A.; Parekh, H. V.; Itabashi, E.; Mark, H. B., Inorganic Chemistry,
1983, 22, 458.
227. Prinsloo, F. F.; Meier, M.; van Eldik, R., Inorg. Chem., 1994, 33, 900.
153
228. Marques, H. M.; Munro, O. Q.; Munro, T.; de Wet, M.; Vashi, P. R., Inorg. Chem.,
1999, 38, 2312.
229. Knapton, L., PhD Thesis, University of the Witwatersrand (Johannesburg), 2005.
230. Byfield, M. P.; Hamza, M. S. A.; Pratt, J. M., J. Chem. Soc., Dalton Trans., 1993,
1647.
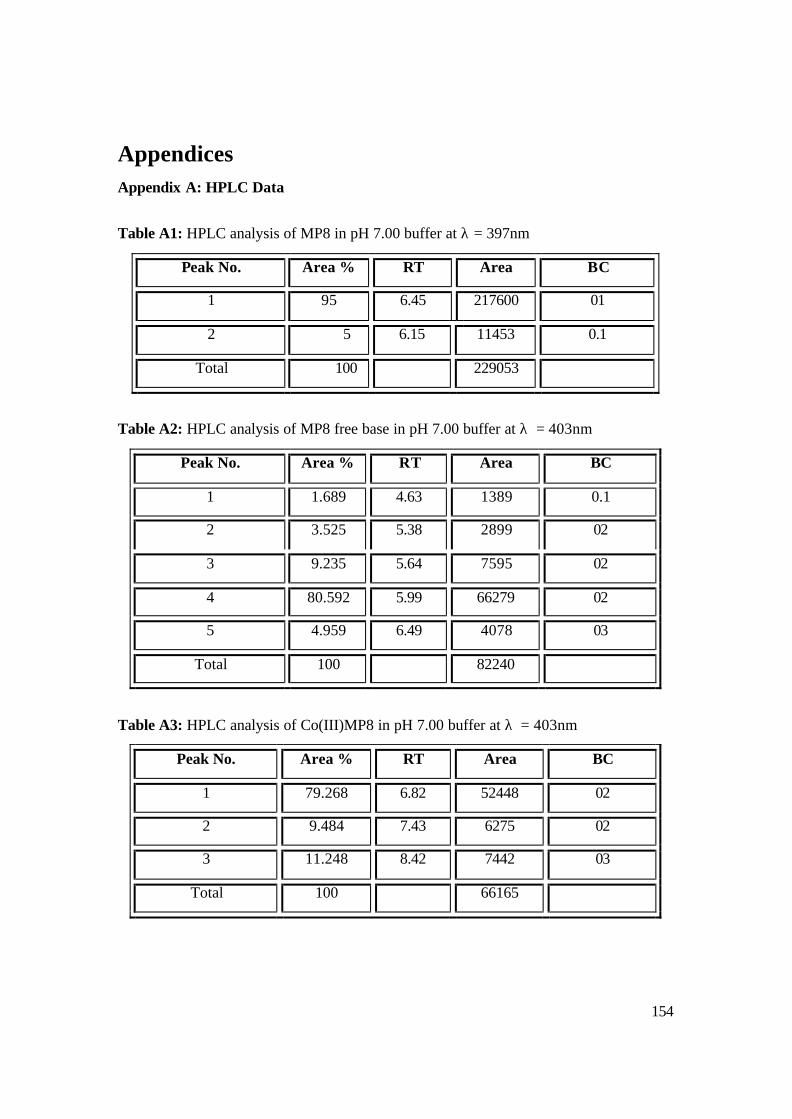
154
Appendices Appendix A: HPLC Data
Table A1: HPLC analysis of MP8 in pH 7.00 buffer at λ = 397nm
Peak No. Area % RT Area BC
1 95 6.45 217600 01
2 5 6.15 11453 0.1
Total 100 229053
Table A2: HPLC analysis of MP8 free base in pH 7.00 buffer at λ = 403nm
Peak No. Area % RT Area BC
1 1.689 4.63 1389 0.1
2 3.525 5.38 2899 02
3 9.235 5.64 7595 02
4 80.592 5.99 66279 02
5 4.959 6.49 4078 03
Total 100 82240
Table A3: HPLC analysis of Co(III)MP8 in pH 7.00 buffer at λ = 403nm
Peak No. Area % RT Area BC
1 79.268 6.82 52448 02
2 9.484 7.43 6275 02
3 11.248 8.42 7442 03
Total 100 66165
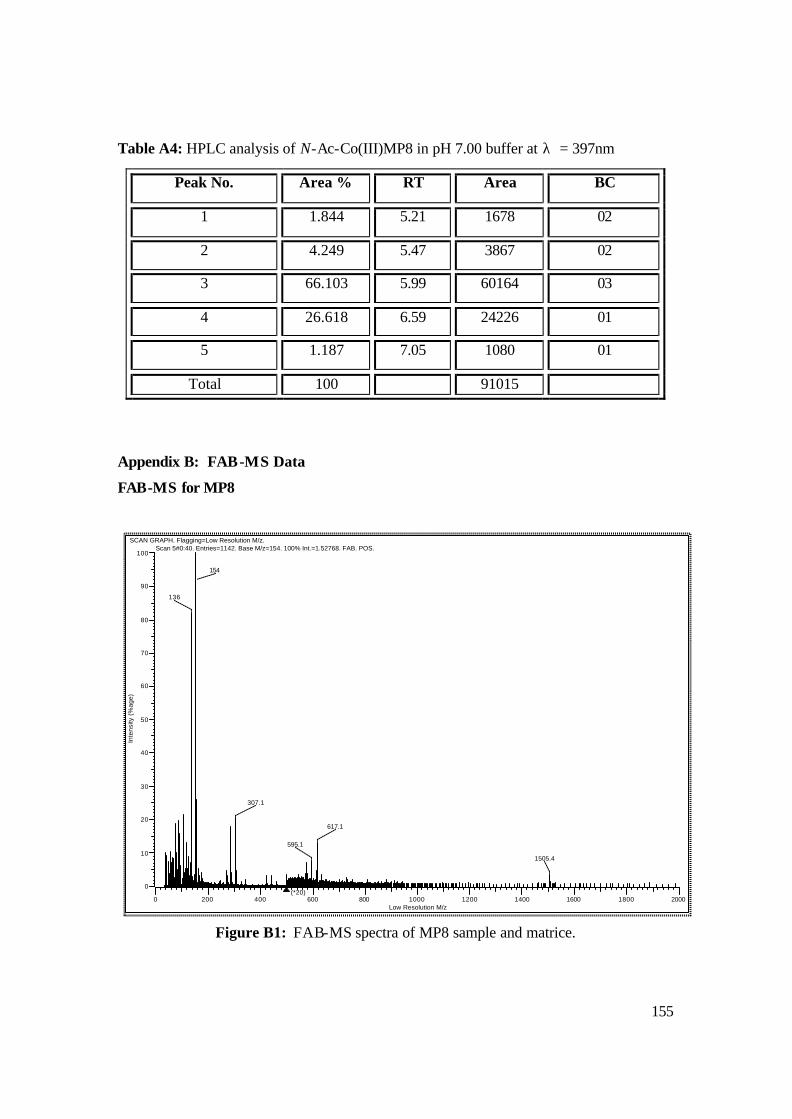
155
SCAN GRAPH. Flagging=Low Resolution M/z. Scan 5#0:40. Entries=1142. Base M/z=154. 100% Int.=1.52768. FAB. POS.
Low Resolution M/z0 200 400 600 800 1000 1200 1400 1600 1800 2000
Inte
nsity
(%
age)
0
10
20
30
40
50
60
70
80
90
100
136
154
307.1
595.1
617.1
1505.4
(*20)
Table A4: HPLC analysis of N-Ac-Co(III)MP8 in pH 7.00 buffer at λ = 397nm
Peak No. Area % RT Area BC
1 1.844 5.21 1678 02
2 4.249 5.47 3867 02
3 66.103 5.99 60164 03
4 26.618 6.59 24226 01
5 1.187 7.05 1080 01
Total 100 91015
Appendix B: FAB-MS Data
FAB-MS for MP8
Figure B1: FAB-MS spectra of MP8 sample and matrice.
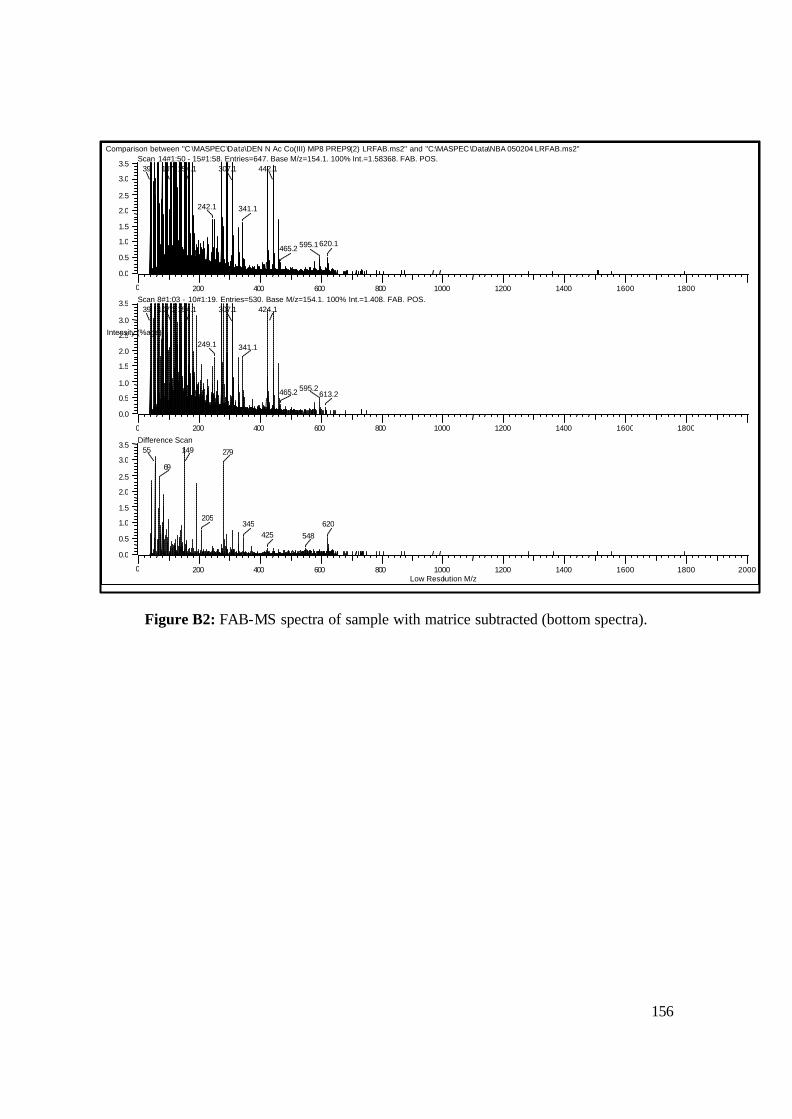
156
Figure B2: FAB-MS spectra of sample with matrice subtracted (bottom spectra).
Comparison between "C:\MASPEC\Data\DEN N Ac Co(III) MP8 PREP9(2) LRFAB.ms2" and "C:\MASPEC\Data\NBA 050204 LRFAB.ms2" Scan 14#1:50 - 15#1:58. Entries=647. Base M/z=154.1. 100% Int.=1.58368. FAB. POS.
Scan 8#1:03 - 10#1:19. Entries=530. Base M/z=154.1. 100% Int.=1.408. FAB. POS.
Difference Scan
Low Resolution M/z
0 200 400 600 800 1000 1200 1400 1600 1800
0 200 400 600 800 1000 1200 1400 1600 1800
0 200 400 600 800 1000 1200 1400 1600 1800 2000
Intensity (%age)
0.0 0.5 1.0 1.5 2.0 2.5 3.0 3.5
0.0 0.5 1.0 1.5 2.0 2.5 3.0 3.5
0.0 0.5 1.0 1.5 2.0 2.5 3.0 3.5
39 107 154.1
242.1
307.1
341.1
442.1
465.2 595.1 620.1
39 107.1 154.1
249.1
307.1
341.1
424.1
465.2 595.2 613.2
55 69
149
205
279
345 425 548
620
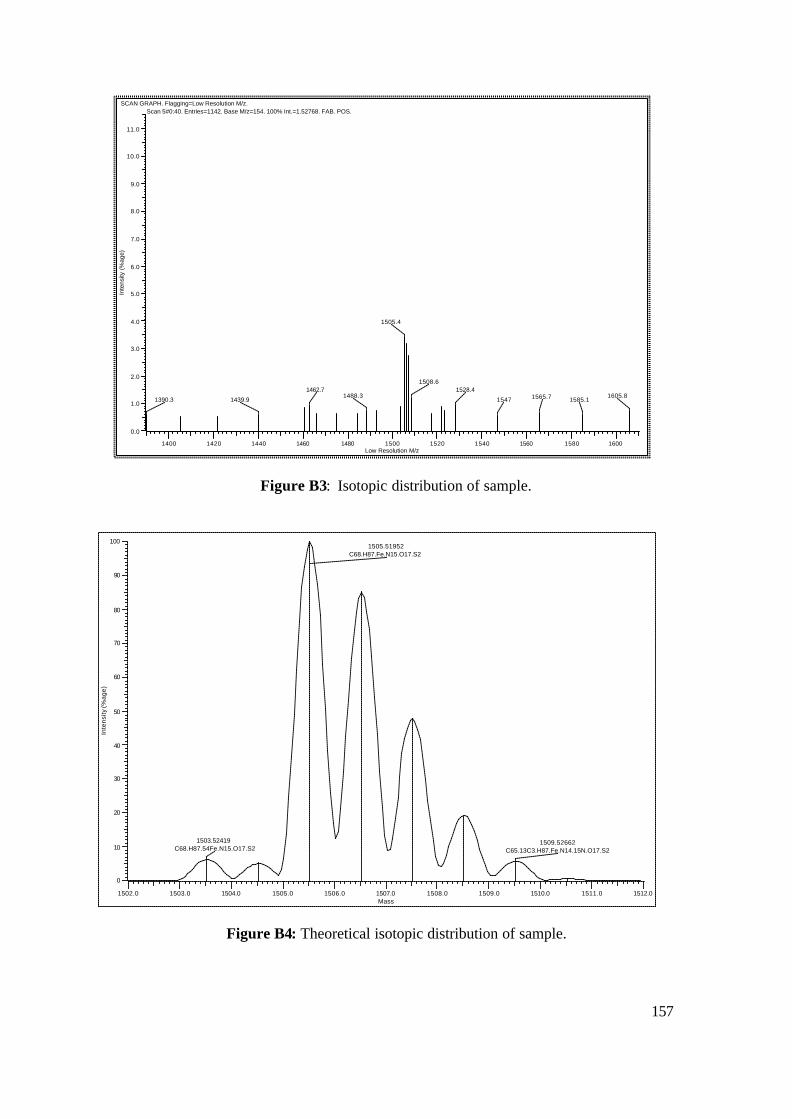
157
SCAN GRAPH. Flagging=Low Resolution M/z. Scan 5#0:40. Entries=1142. Base M/z=154. 100% Int.=1.52768. FAB. POS.
Low Resolution M/z1400 1420 1440 1460 1480 1500 1520 1540 1560 1580 1600
Inte
nsity
(%
age)
0.0
1.0
2.0
3.0
4.0
5.0
6.0
7.0
8.0
9.0
10.0
11.0
1390.3 1439.9
1462.71488.3
1505.4
1508.61528.4
1547 1565.7 1585.11605.8
Figure B3: Isotopic distribution of sample.
Mass1502.0 1503.0 1504.0 1505.0 1506.0 1507.0 1508.0 1509.0 1510.0 1511.0 1512.0
Inte
nsity
(%ag
e)
0
10
20
30
40
50
60
70
80
90
100
1503.52419C68.H87.54Fe.N15.O17.S2
1505.51952C68.H87.Fe.N15.O17.S2
1509.52662C65.13C3.H87.Fe.N14.15N.O17.S2
Figure B4: Theoretical isotopic distribution of sample.
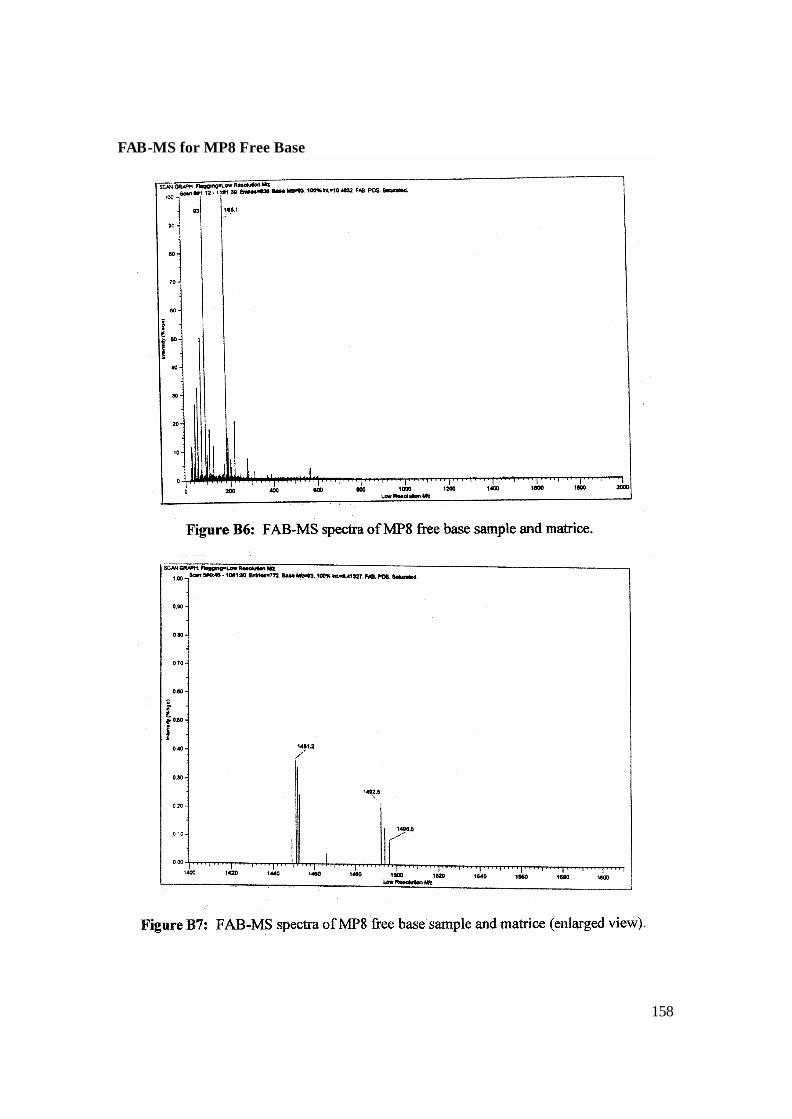
158
FAB-MS for MP8 Free Base
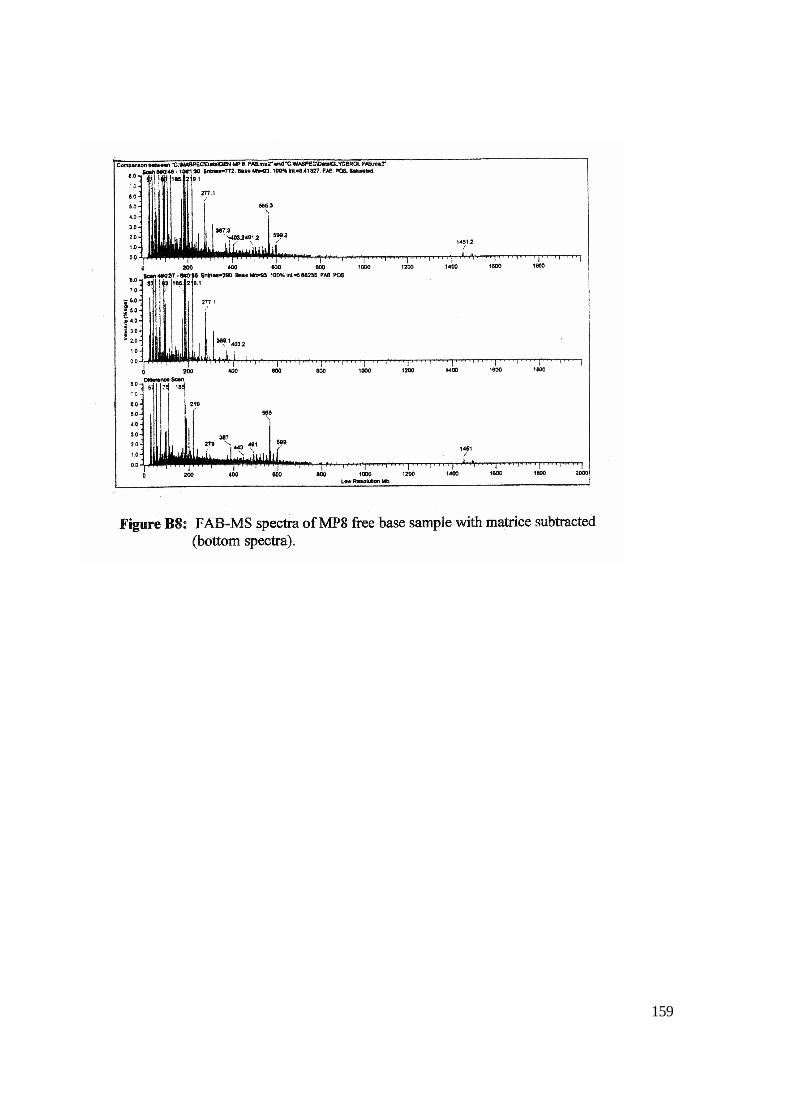
159
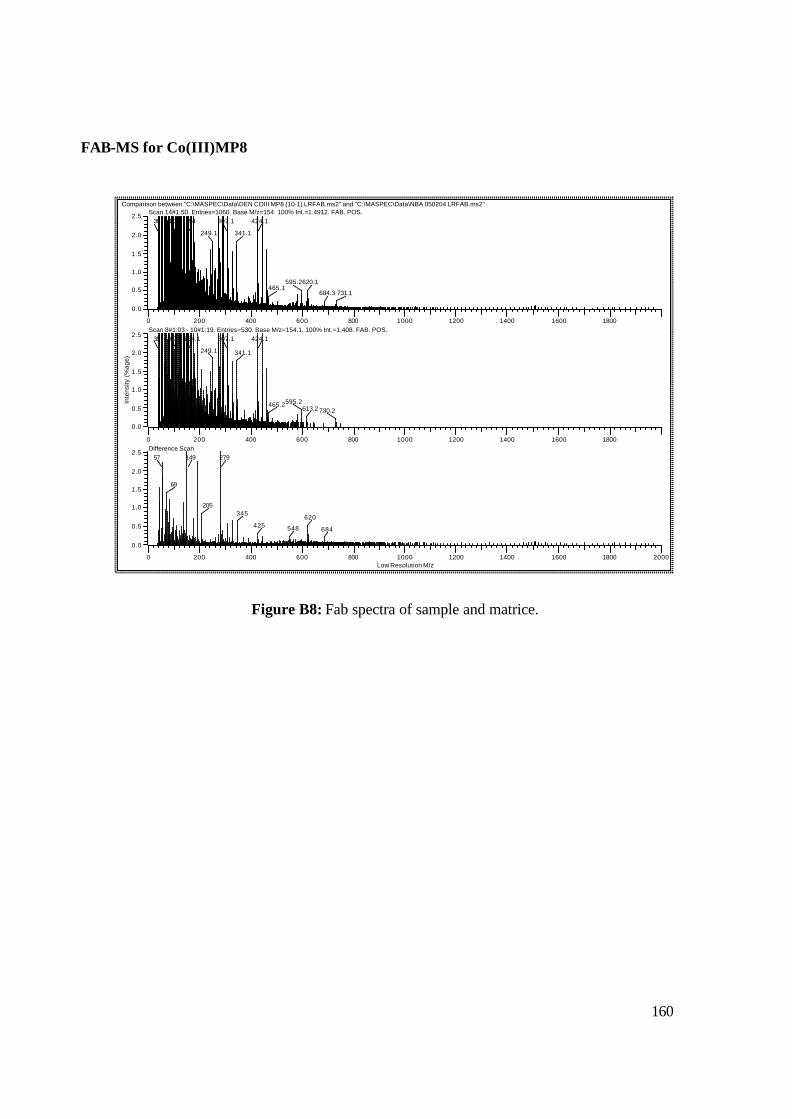
160
Comparison between "C:\MASPEC\Data\DEN COIII MP8 (10-1) LRFAB.ms2" and "C:\MASPEC\Data\NBA 050204 LRFAB.ms2"Scan 14#1:50. Entries=1060. Base M/z=154. 100% Int.=1.4912. FAB. POS.
Scan 8#1:03 - 10#1:19. Entries=530. Base M/z=154.1. 100% Int.=1.408. FAB. POS.
Difference Scan
Low Resolution M/z
0 200 400 600 800 1000 1200 1400 1600 1800
0 200 400 600 800 1000 1200 1400 1600 1800
0 200 400 600 800 1000 1200 1400 1600 1800 2000
Inte
nsity
(%
age)
0.0
0.5
1.0
1.5
2.0
2.5
0.0
0.5
1.0
1.5
2.0
2.5
0.0
0.5
1.0
1.5
2.0
2.5
39 107 154
249.1
307.1
341.1
424.1
465.1595.2620.1
684.3 731.1
39 107.1 154.1
249.1
307.1
341.1
424.1
465.2595.2613.2 730.2
57
69
149
205
279
345
425 548
620
684
FAB-MS for Co(III)MP8
Figure B8: Fab spectra of sample and matrice.
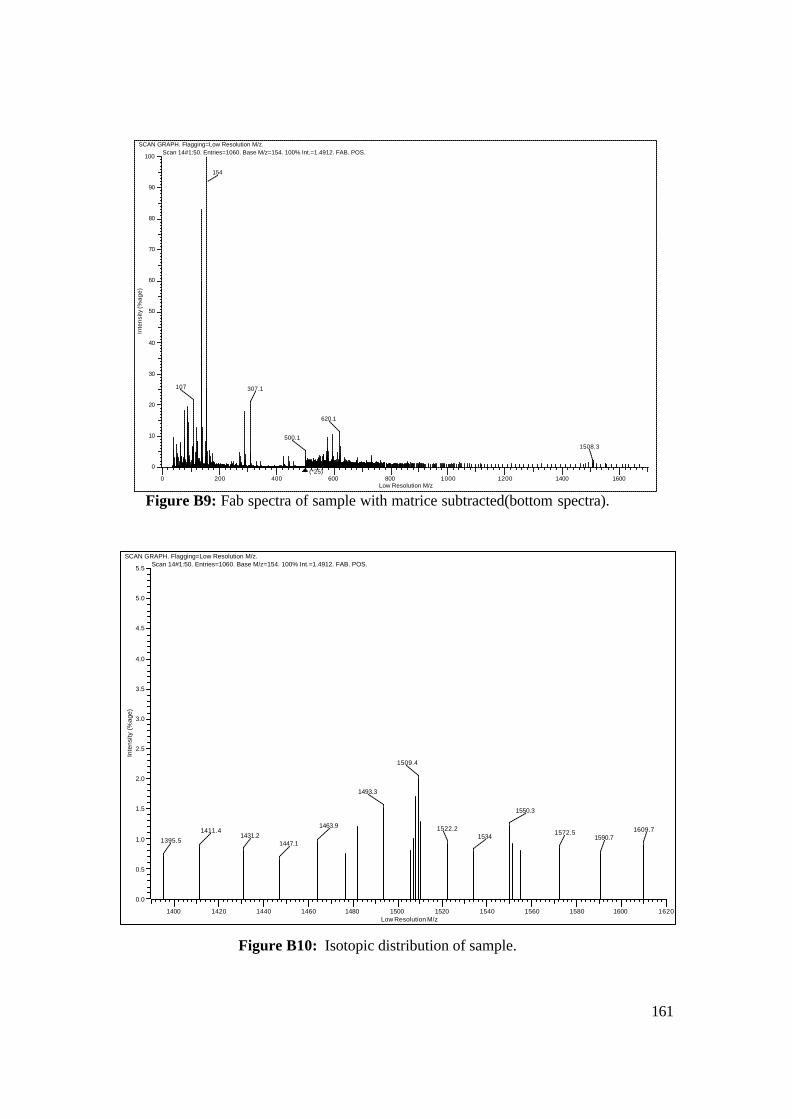
161
SCAN GRAPH. Flagging=Low Resolution M/z. Scan 14#1:50. Entries=1060. Base M/z=154. 100% Int.=1.4912. FAB. POS.
Low Resolution M/z1400 1420 1440 1460 1480 1500 1520 1540 1560 1580 1600 1620
Inte
nsity
(%
age)
0.0
0.5
1.0
1.5
2.0
2.5
3.0
3.5
4.0
4.5
5.0
5.5
1395.5
1411.41431.2
1447.1
1463.9
1493.3
1509.4
1522.21534
1550.3
1572.51590.7
1609.7
SCAN GRAPH. Flagging=Low Resolution M/z. Scan 14#1:50. Entries=1060. Base M/z=154. 100% Int.=1.4912. FAB. POS.
Low Resolution M/z0 200 400 600 800 1000 1200 1400 1600
Inte
nsity
(%ag
e)
0
10
20
30
40
50
60
70
80
90
100
107
154
307.1
500.1
620.1
1508.3
(*25)
Figure B9: Fab spectra of sample with matrice subtracted(bottom spectra).
Figure B10: Isotopic distribution of sample.
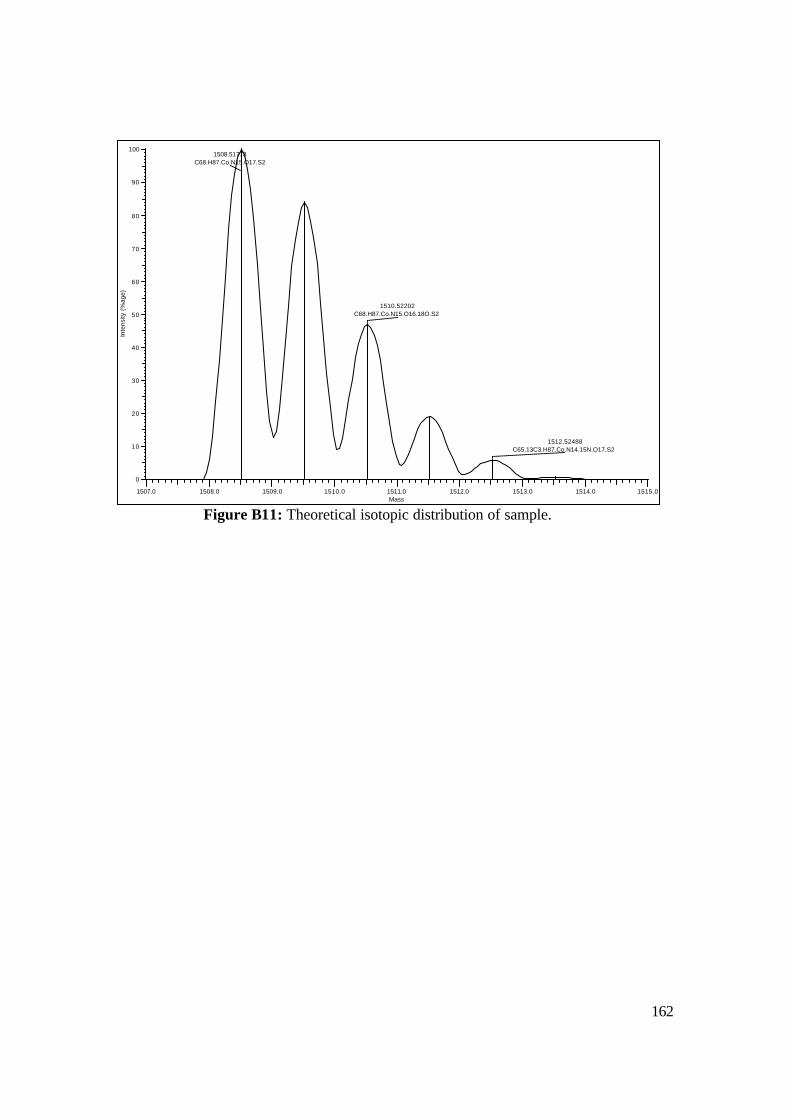
162
Mass1507.0 1508.0 1509.0 1510.0 1511.0 1512.0 1513.0 1514.0 1515.0
Inte
nsity
(%
age)
0
10
20
30
40
50
60
70
80
90
1001508.51778
C68.H87.Co.N15.O17.S2
1510.52202C68.H87.Co.N15.O16.18O.S2
1512.52488C65.13C3.H87.Co.N14.15N.O17.S2
Figure B11: Theoretical isotopic distribution of sample.
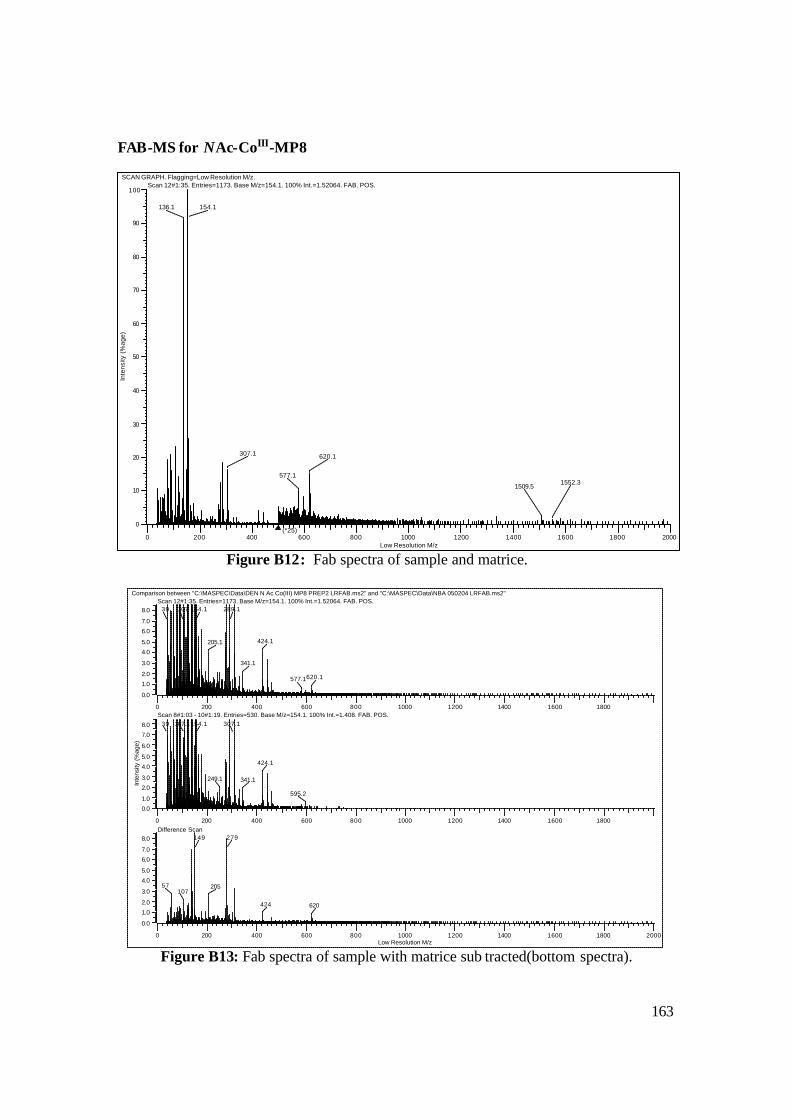
163
FAB-MS for NAc-CoIII-MP8
SCAN GRAPH. Flagging=Low Resolution M/z. Scan 12#1:35. Entries=1173. Base M/z=154.1. 100% Int.=1.52064. FAB. POS.
Low Resolution M/z0 200 400 600 800 1000 1200 1400 1600 1800 2000
Inte
nsity
(%
age)
0
10
20
30
40
50
60
70
80
90
100
136.1 154.1
307.1
577.1
620.1
1509.51552.3
(*25)
Figure B12: Fab spectra of sample and matrice.
Comparison between "C:\MASPEC\Data\DEN N Ac Co(III) MP8 PREP2 LRFAB.ms2" and "C:\MASPEC\Data\NBA 050204 LRFAB.ms2"
Scan 12#1:35. Entries=1173. Base M/z=154.1. 100% Int.=1.52064. FAB. POS.
Scan 8#1:03 - 10#1:19. Entries=530. Base M/z=154.1. 100% Int.=1.408. FAB. POS.
Difference Scan
Low Resolution M/z
0 200 400 600 800 1000 1200 1400 1600 1800
0 200 400 600 800 1000 1200 1400 1600 1800
0 200 400 600 800 1000 1200 1400 1600 1800 2000
Inte
nsity
(%
age)
0.0
1.0
2.0
3.0
4.0
5.0
6.0
7.0
8.0
0.0
1.0
2.0
3.0
4.0
5.0
6.0
7.0
8.0
0.0
1.0
2.0
3.0
4.0
5.0
6.0
7.0
8.0
39 107 154.1
205.1
289.1
341.1
424.1
577.1620.1
39 107.1 154.1
249.1
307.1
341.1
424.1
595.2
57107
149
205
279
424 620
Figure B13: Fab spectra of sample with matrice sub tracted(bottom spectra).
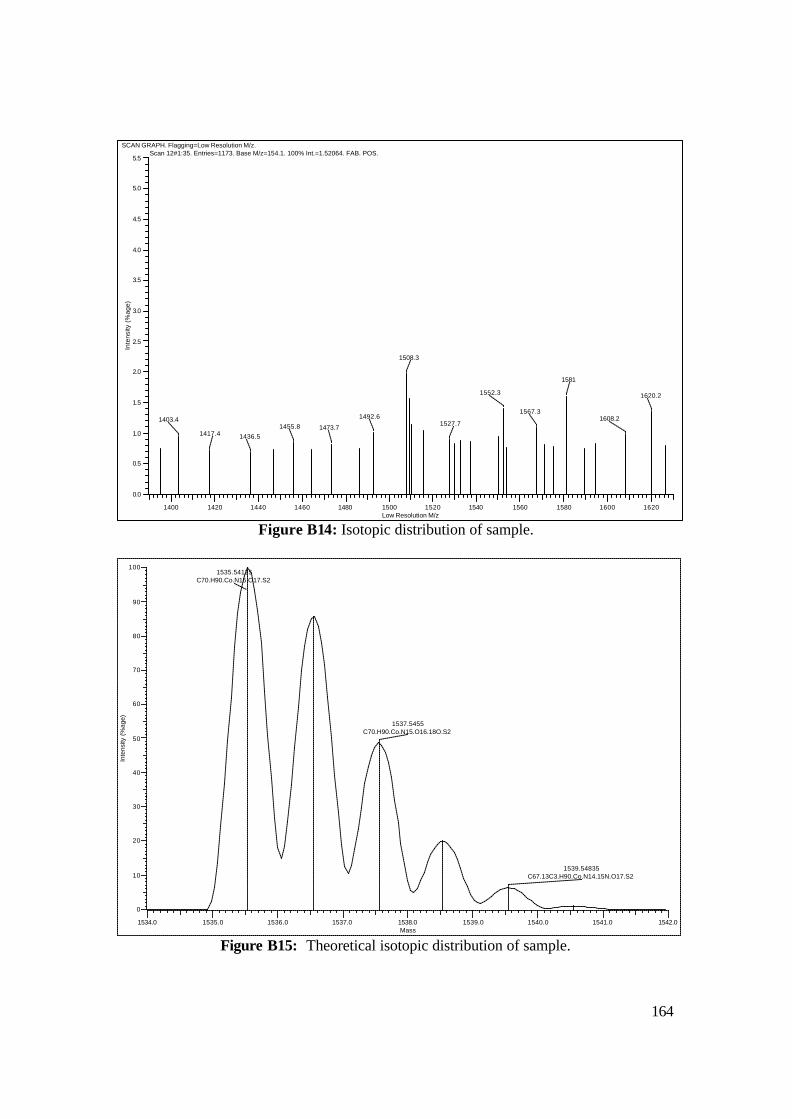
164
SCAN GRAPH. Flagging=Low Resolution M/z. Scan 12#1:35. Entries=1173. Base M/z=154.1. 100% Int.=1.52064. FAB. POS.
Low Resolution M/z1400 1420 1440 1460 1480 1500 1520 1540 1560 1580 1600 1620
Inte
nsity
(%
age)
0.0
0.5
1.0
1.5
2.0
2.5
3.0
3.5
4.0
4.5
5.0
5.5
1403.4
1417.4 1436.5
1455.8 1473.7
1492.6
1508.3
1527.7
1552.3
1567.3
1581
1608.2
1620.2
Figure B14: Isotopic distribution of sample.
Mass1534.0 1535.0 1536.0 1537.0 1538.0 1539.0 1540.0 1541.0 1542.0
Inte
nsity
(%
age)
0
10
20
30
40
50
60
70
80
90
1001535.54125
C70.H90.Co.N15.O17.S2
1537.5455C70.H90.Co.N15.O16.18O.S2
1539.54835C67.13C3.H90.Co.N14.15N.O17.S2
Figure B15: Theoretical isotopic distribution of sample.
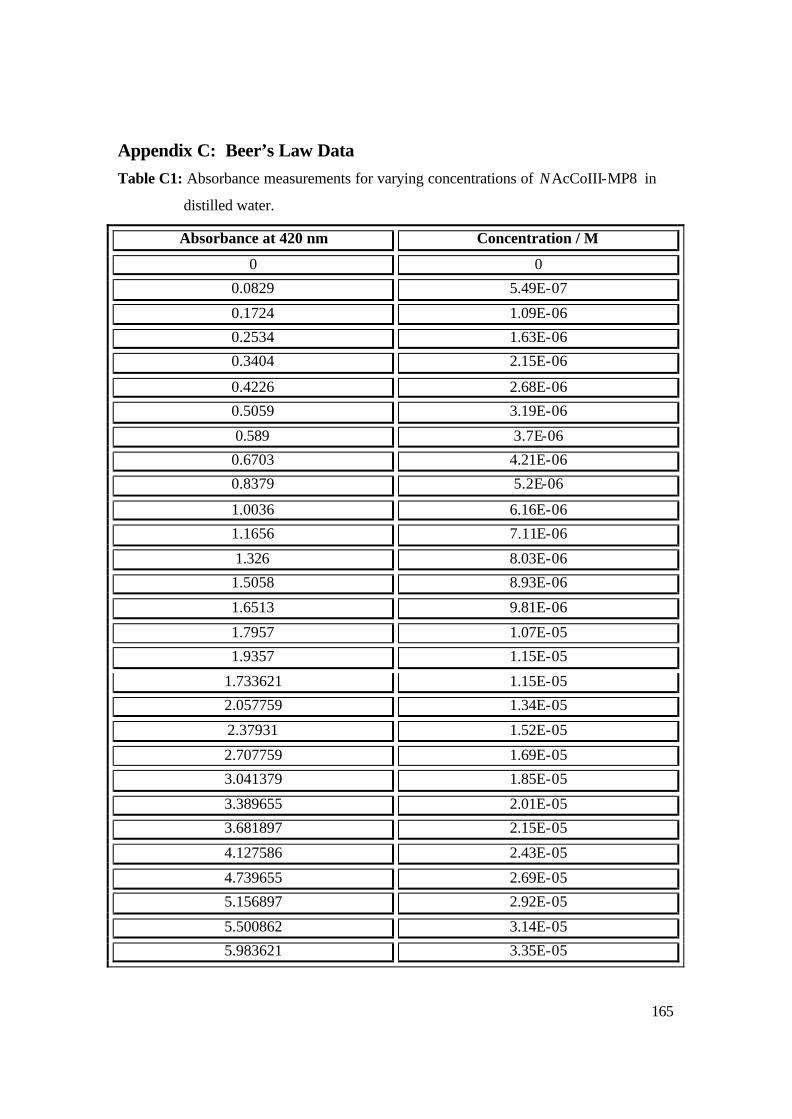
165
Appendix C: Beer’s Law Data Table C1: Absorbance measurements for varying concentrations of NAcCoIII-MP8 in
distilled water.
Absorbance at 420 nm Concentration / M
0 0
0.0829 5.49E-07
0.1724 1.09E-06
0.2534 1.63E-06
0.3404 2.15E-06
0.4226 2.68E-06
0.5059 3.19E-06
0.589 3.7E-06
0.6703 4.21E-06
0.8379 5.2E-06
1.0036 6.16E-06
1.1656 7.11E-06
1.326 8.03E-06
1.5058 8.93E-06
1.6513 9.81E-06
1.7957 1.07E-05
1.9357 1.15E-05
1.733621 1.15E-05
2.057759 1.34E-05
2.37931 1.52E-05
2.707759 1.69E-05
3.041379 1.85E-05
3.389655 2.01E-05
3.681897 2.15E-05
4.127586 2.43E-05
4.739655 2.69E-05
5.156897 2.92E-05
5.500862 3.14E-05
5.983621 3.35E-05
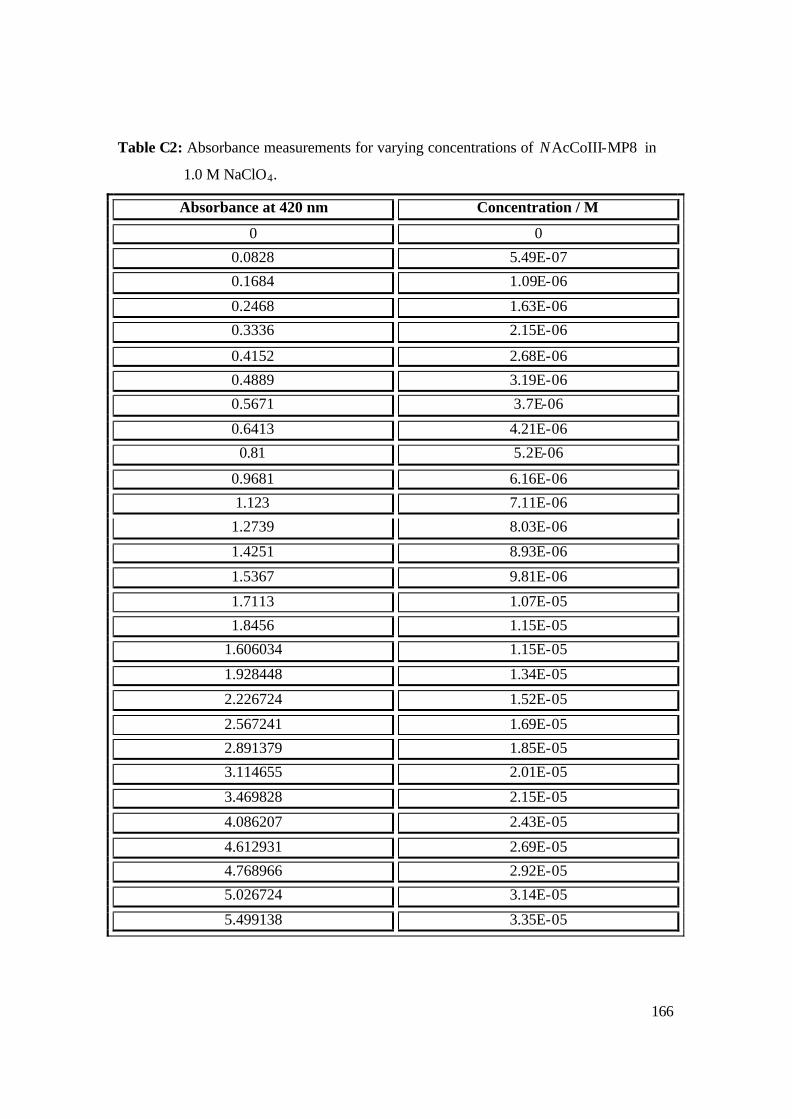
166
Table C2: Absorbance measurements for varying concentrations of NAcCoIII-MP8 in
1.0 M NaClO4.
Absorbance at 420 nm Concentration / M
0 0
0.0828 5.49E-07
0.1684 1.09E-06
0.2468 1.63E-06
0.3336 2.15E-06
0.4152 2.68E-06
0.4889 3.19E-06
0.5671 3.7E-06
0.6413 4.21E-06
0.81 5.2E-06
0.9681 6.16E-06
1.123 7.11E-06
1.2739 8.03E-06
1.4251 8.93E-06
1.5367 9.81E-06
1.7113 1.07E-05
1.8456 1.15E-05
1.606034 1.15E-05
1.928448 1.34E-05
2.226724 1.52E-05
2.567241 1.69E-05
2.891379 1.85E-05
3.114655 2.01E-05
3.469828 2.15E-05
4.086207 2.43E-05
4.612931 2.69E-05
4.768966 2.92E-05
5.026724 3.14E-05
5.499138 3.35E-05
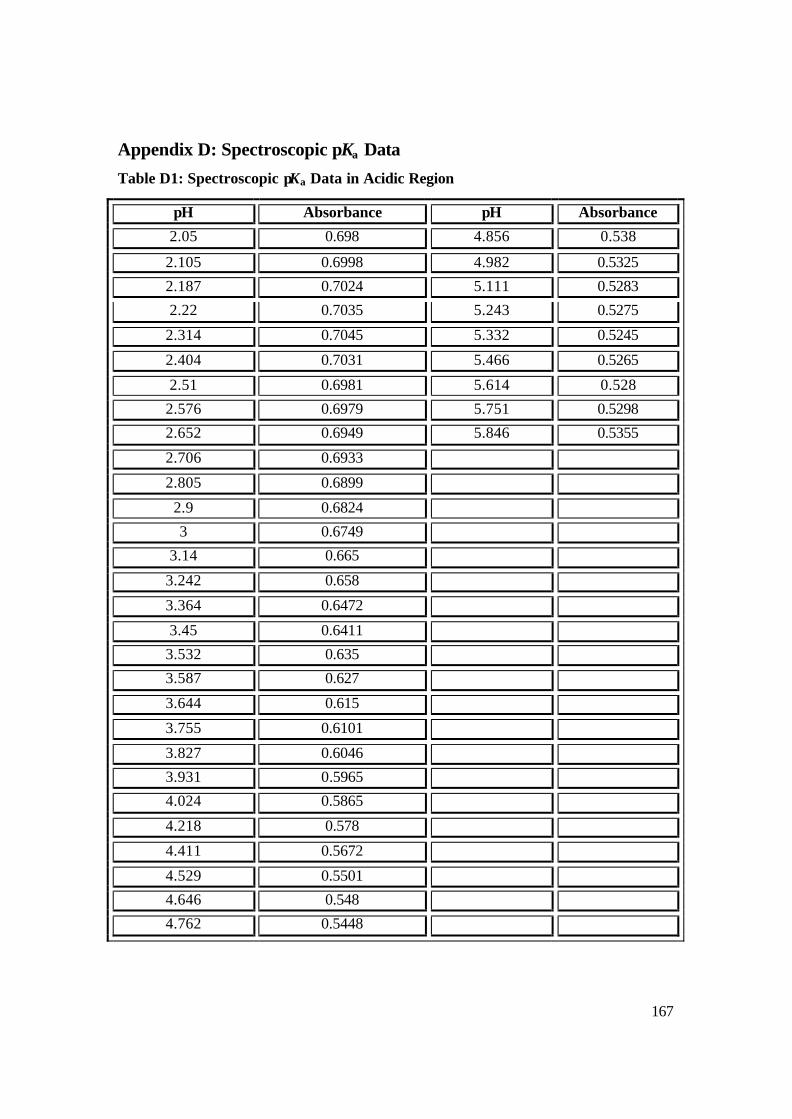
167
Appendix D: Spectroscopic pKa Data
Table D1: Spectroscopic pKa Data in Acidic Region
pH Absorbance pH Absorbance
2.05 0.698 4.856 0.538
2.105 0.6998 4.982 0.5325
2.187 0.7024 5.111 0.5283
2.22 0.7035 5.243 0.5275
2.314 0.7045 5.332 0.5245
2.404 0.7031 5.466 0.5265
2.51 0.6981 5.614 0.528
2.576 0.6979 5.751 0.5298
2.652 0.6949 5.846 0.5355
2.706 0.6933
2.805 0.6899
2.9 0.6824
3 0.6749
3.14 0.665
3.242 0.658
3.364 0.6472
3.45 0.6411
3.532 0.635
3.587 0.627
3.644 0.615
3.755 0.6101
3.827 0.6046
3.931 0.5965
4.024 0.5865
4.218 0.578
4.411 0.5672
4.529 0.5501
4.646 0.548
4.762 0.5448
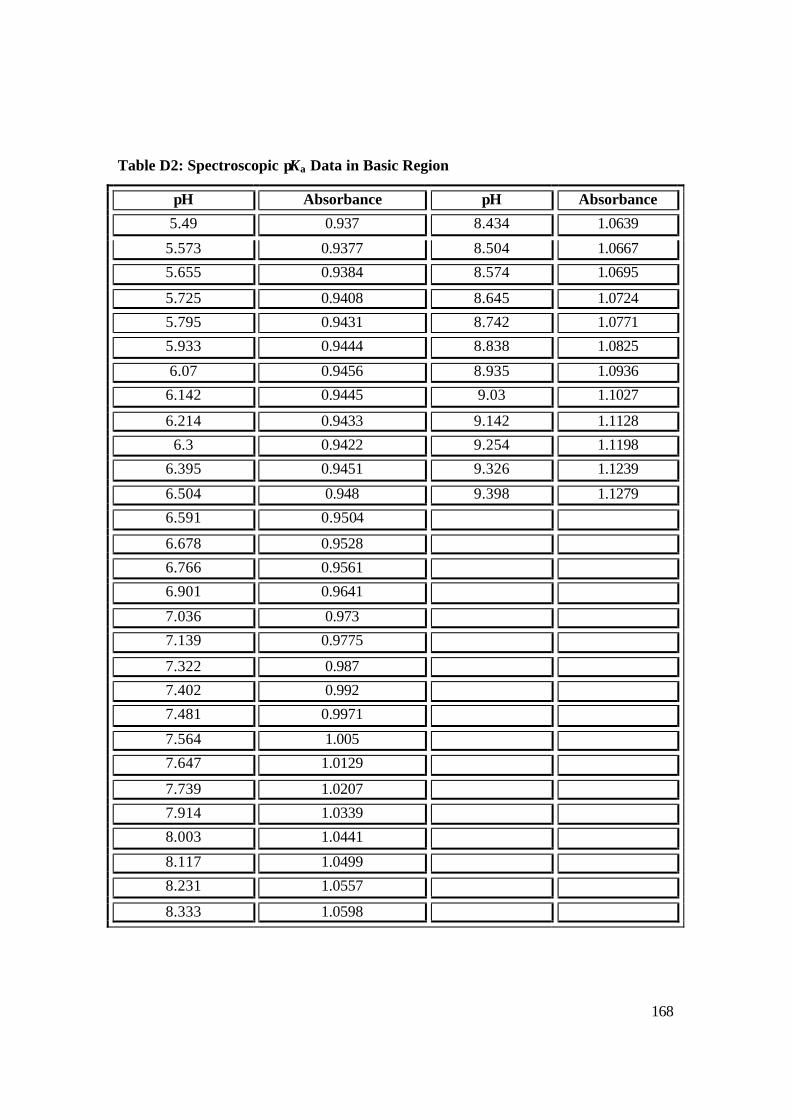
168
Table D2: Spectroscopic pKa Data in Basic Region
pH Absorbance pH Absorbance
5.49 0.937 8.434 1.0639
5.573 0.9377 8.504 1.0667
5.655 0.9384 8.574 1.0695
5.725 0.9408 8.645 1.0724
5.795 0.9431 8.742 1.0771
5.933 0.9444 8.838 1.0825
6.07 0.9456 8.935 1.0936
6.142 0.9445 9.03 1.1027
6.214 0.9433 9.142 1.1128
6.3 0.9422 9.254 1.1198
6.395 0.9451 9.326 1.1239
6.504 0.948 9.398 1.1279
6.591 0.9504
6.678 0.9528
6.766 0.9561
6.901 0.9641
7.036 0.973
7.139 0.9775
7.322 0.987
7.402 0.992
7.481 0.9971
7.564 1.005
7.647 1.0129
7.739 1.0207
7.914 1.0339
8.003 1.0441
8.117 1.0499
8.231 1.0557
8.333 1.0598
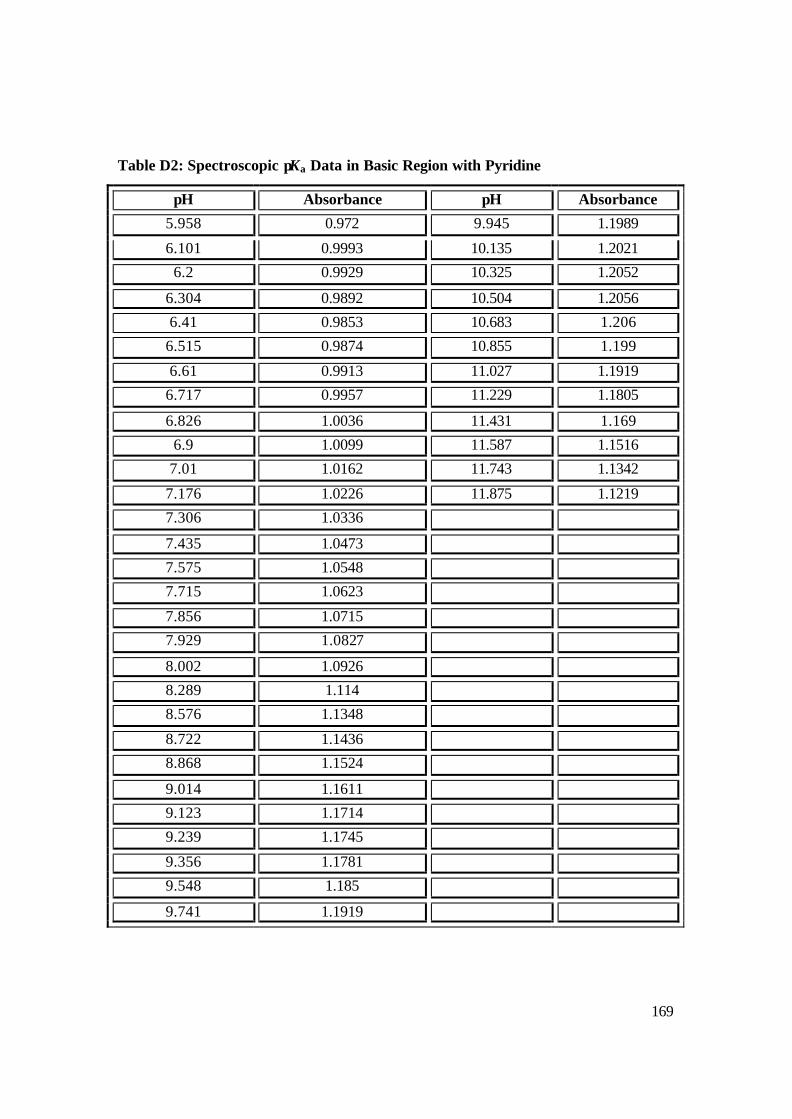
169
Table D2: Spectroscopic pKa Data in Basic Region with Pyridine
pH Absorbance pH Absorbance
5.958 0.972 9.945 1.1989
6.101 0.9993 10.135 1.2021
6.2 0.9929 10.325 1.2052
6.304 0.9892 10.504 1.2056
6.41 0.9853 10.683 1.206
6.515 0.9874 10.855 1.199
6.61 0.9913 11.027 1.1919
6.717 0.9957 11.229 1.1805
6.826 1.0036 11.431 1.169
6.9 1.0099 11.587 1.1516
7.01 1.0162 11.743 1.1342
7.176 1.0226 11.875 1.1219
7.306 1.0336
7.435 1.0473
7.575 1.0548
7.715 1.0623
7.856 1.0715
7.929 1.0827
8.002 1.0926
8.289 1.114
8.576 1.1348
8.722 1.1436
8.868 1.1524
9.014 1.1611
9.123 1.1714
9.239 1.1745
9.356 1.1781
9.548 1.185
9.741 1.1919
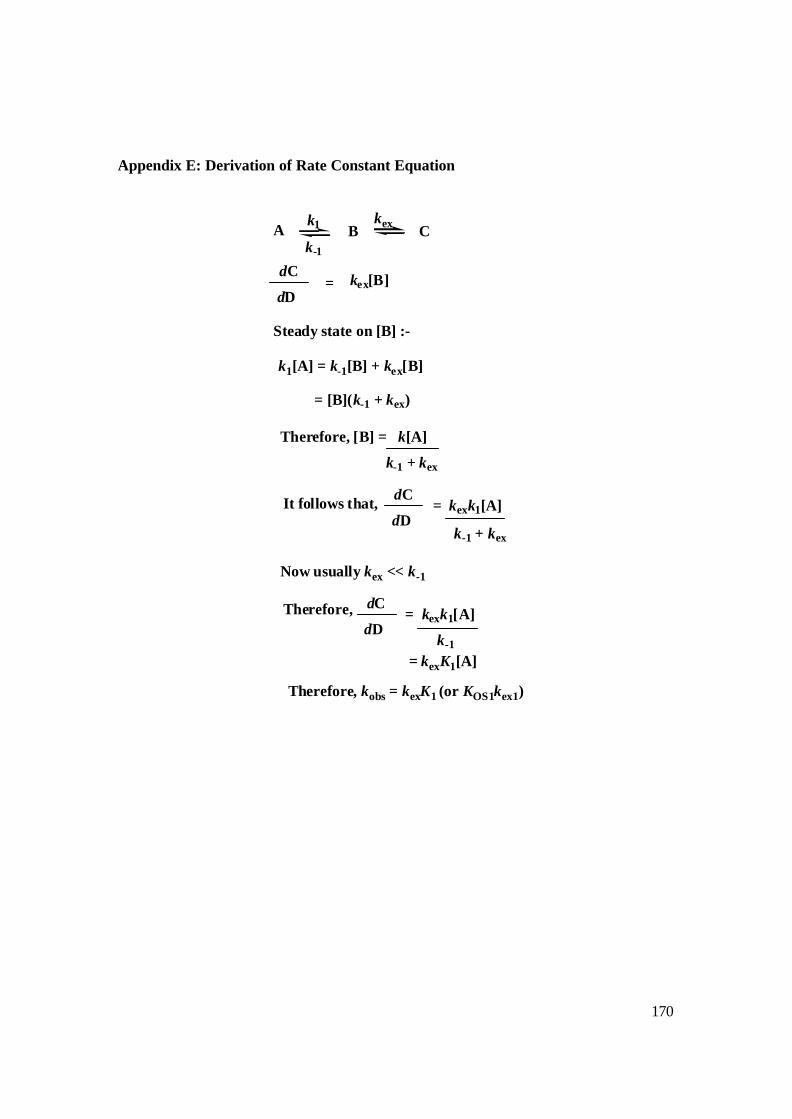
170
Appendix E: Derivation of Rate Constant Equation
A B Ck1
k-1
kex
dC
dD= kex[B]
Steady state on [B] :-
k1[A] = k-1[B] + kex[B]
= [B](k-1 + kex)
Therefore, [B] = k[A]
k-1 + kex
It follows that, dC
dD= kexk1[A]
k-1 + kex
Now usually kex << k-1
Therefore, dC
dD= kexk1[A]
k-1
= kexK1[A]
Therefore, kobs = kexK1 (or KOS1kex1)

171