synthetic organic dust control®
TRANSCRIPT
EK35®Synthetic Organic Dust Control®
Environmental Data
Midwest Industrial Supply, Inc.1101 3rd Street SoutheastCanton, Ohio 44707www.midwestind.comT744 © 2017 Midwest Industrial Supply, Inc.
Tel 330.456.3121Fax 330.456.3247Toll Free 1.800.321.0699
Environmental Perspective
Midwest Industrial Supply, Inc. is committed to providing comprehensive and relevant environmental information about our products. Working with various testing laboratories and regulatory organizations enables us to provide unbiased environmental and toxicity data that we use to develop the best dust control and stabilization programs for our customers.
Choosing the right product for an application is more that picking the product with good or sufficient dust control efficiency. It means evaluating the application and understanding all the needs of the customer including environmentally sensitive areas, regulatory constraints, aesthetics, customer preferences, operational or process concerns, and climate. Understanding the environmental and toxicity data and relating it to typical applications and site-specific needs is an important aspect of what Midwest does when working with our customers.
The conclusion of the information presented herein is that all testing shows EK35®, when applied properly, will not negatively impact soil quality. Aquatic toxicity testing of EK35 shows a range of toxicity from practically non-toxic to moderately toxic depending on the species and the exposure time. This information is critical in determining the suitability of EK35 for an application. EK35 was developed for and is recommended for industrial applications where aquatic exposure is not an issue. Generic risk assessment will not replace a conscientious site-specific evaluation, but the data used in this perspective is a necessary component for all risk assessments.
The US EPA Environmental Technology Verification (ETV) Program protocol for Dust Suppression Products evaluated bulk constituents as well as aquatic toxicity on EK35. The purpose of the program was to verify the level of dust control (particulate matter, PM, control efficiency) of EK35 and accumulate environmental data. The US EPA protocol did not allow for commentary on the environmental data.
The US EPA does however have regulatory guidelines that enable us to assess the potential impact of EK35 on the environment. The test results used for this Environmental Impact Perspective can be found in Appendix A and B of the US EPA ETV report on EK35 or on the Midwest Website.
1. Tri-State Laboratories, Chemical Analysis, July 20022. ABC Laboratories, Various Species Toxicity, September 20023. ABC Laboratories, Rainbow Trout Toxicity, September 2003
Chemically, EK35 is a patent pending synthetic fluid. It is produced by a reaction of specific purified chemical feedstock that is treated via extreme heat, pressure and catalyst during hydrocracking, hydrotreating and hydroisomerization to create a synthetic iso-alkane. Further formulating and blending with naturally occurring rosins impart the rheological and cohesive properties unique to EK35. EK35 is a non-aqueous liquid that is not water soluble or dilutable.
Application rates vary with soil type and properties and the desired end result of the project. EK35 is applied topically to the surface of the road with specially designed applicator trucks. Typical application rates range from 0.09 gal / yd2 to 0.30 gal / yd2. For purposes of this environmental impact analysis the application used in calculations was 0.45 gal / yd2, the same total application as that used in the dust control efficiency analysis at Fort Leonard Wood in October 2003.
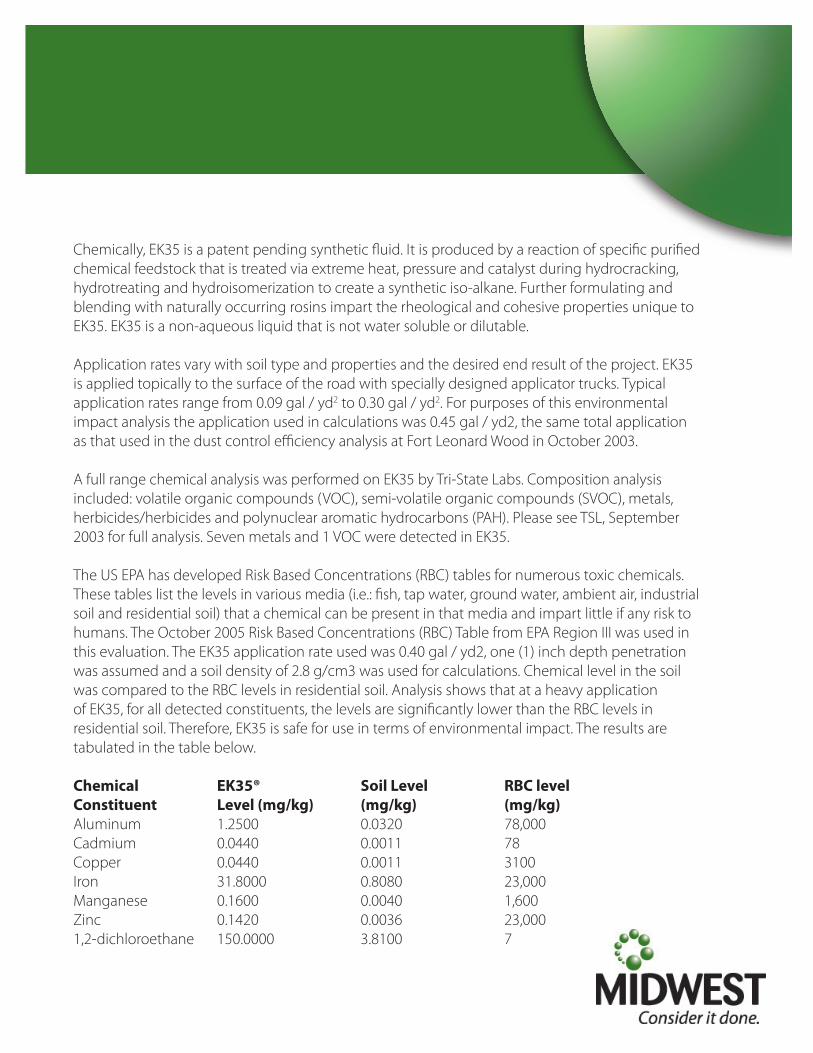
A full range chemical analysis was performed on EK35 by Tri-State Labs. Composition analysis included: volatile organic compounds (VOC), semi-volatile organic compounds (SVOC), metals, herbicides/herbicides and polynuclear aromatic hydrocarbons (PAH). Please see TSL, September 2003 for full analysis. Seven metals and 1 VOC were detected in EK35.
The US EPA has developed Risk Based Concentrations (RBC) tables for numerous toxic chemicals. These tables list the levels in various media (i.e.: fish, tap water, ground water, ambient air, industrial soil and residential soil) that a chemical can be present in that media and impart little if any risk to humans. The October 2005 Risk Based Concentrations (RBC) Table from EPA Region III was used in this evaluation. The EK35 application rate used was 0.40 gal / yd2, one (1) inch depth penetration was assumed and a soil density of 2.8 g/cm3 was used for calculations. Chemical level in the soil was compared to the RBC levels in residential soil. Analysis shows that at a heavy application of EK35, for all detected constituents, the levels are significantly lower than the RBC levels in residential soil. Therefore, EK35 is safe for use in terms of environmental impact. The results are tabulated in the table below.
Chemical EK35® Soil Level RBC levelConstituent Level (mg/kg) (mg/kg) (mg/kg)Aluminum 1.2500 0.0320 78,000Cadmium 0.0440 0.0011 78Copper 0.0440 0.0011 3100Iron 31.8000 0.8080 23,000Manganese 0.1600 0.0040 1,600Zinc 0.1420 0.0036 23,0001,2-dichloroethane 150.0000 3.8100 7
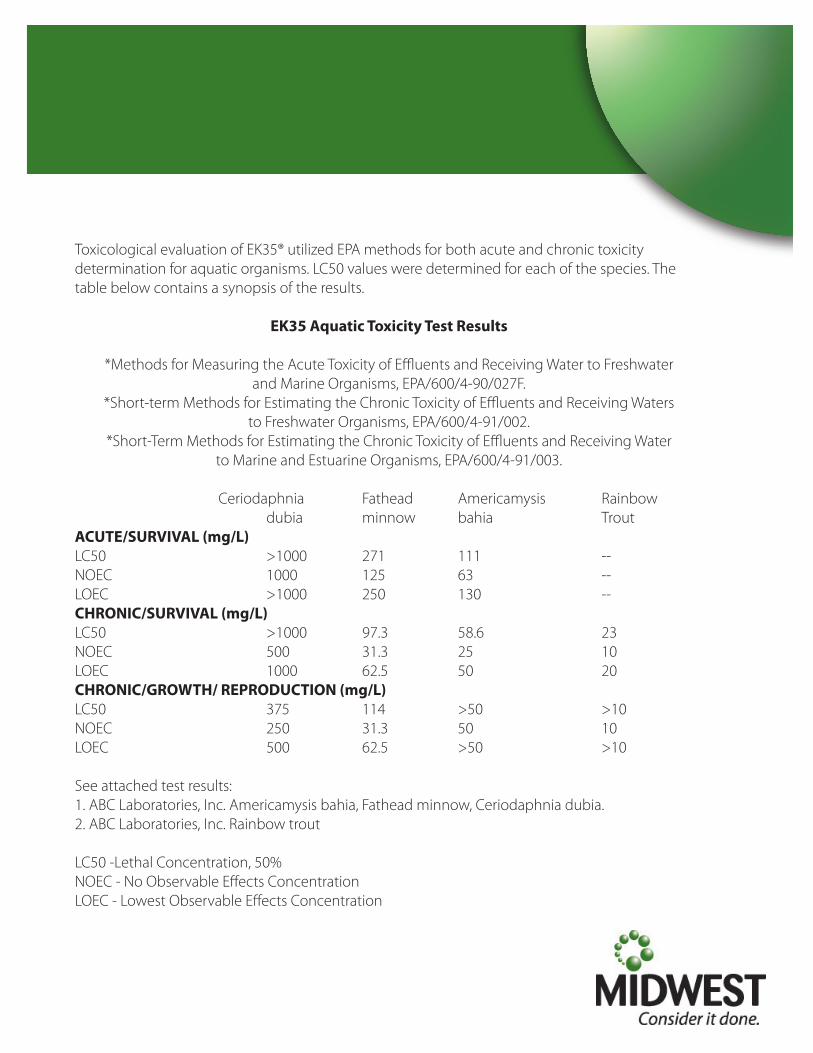
Toxicological evaluation of EK35® utilized EPA methods for both acute and chronic toxicity determination for aquatic organisms. LC50 values were determined for each of the species. The table below contains a synopsis of the results.
EK35 Aquatic Toxicity Test Results
*Methods for Measuring the Acute Toxicity of Effluents and Receiving Water to Freshwaterand Marine Organisms, EPA/600/4-90/027F.
*Short-term Methods for Estimating the Chronic Toxicity of Effluents and Receiving Watersto Freshwater Organisms, EPA/600/4-91/002.
*Short-Term Methods for Estimating the Chronic Toxicity of Effluents and Receiving Waterto Marine and Estuarine Organisms, EPA/600/4-91/003.
Ceriodaphnia Fathead Americamysis Rainbow dubia minnow bahia TroutACUTE/SURVIVAL (mg/L)LC50 >1000 271 111 --NOEC 1000 125 63 --LOEC >1000 250 130 --CHRONIC/SURVIVAL (mg/L)LC50 >1000 97.3 58.6 23NOEC 500 31.3 25 10LOEC 1000 62.5 50 20CHRONIC/GROWTH/ REPRODUCTION (mg/L)LC50 375 114 >50 >10NOEC 250 31.3 50 10LOEC 500 62.5 >50 >10
See attached test results:1. ABC Laboratories, Inc. Americamysis bahia, Fathead minnow, Ceriodaphnia dubia.2. ABC Laboratories, Inc. Rainbow trout
LC50 -Lethal Concentration, 50%NOEC - No Observable Effects ConcentrationLOEC - Lowest Observable Effects Concentration
The LC50 level is the lethal concentration of the chemical under test that kills 50% of the test organisms in the specified amount of time. According to the EPA-540- 9-85-006, suggested toxicity criteria for materials are listed in the table below.
LC50 (mg/L) Category Description <0.1 Very highly toxic 0.1 – 1 Highly toxic 1 – 10 Moderately toxic 10 –100 Slightly toxic >100 Practically non-toxic
Comparison of the EPA guidelines to the LC50 of EK35 show a range of toxicity from practically non-toxic to moderately toxic depending on the species and the exposure time. In conclusion, all testing shows EK35, when applied properly, will not negatively impact soil quality. Aquatic toxicity testing of EK35 shows a range of toxicity from practically non-toxic to moderately toxic depending on the species and the exposure time. This information is critical in determining the suitability of EK35 for an application. EK35 was developed for and is recommended for industrial applications where aquatic exposure is not an issue. Generic risk assessment will not replace a conscientious site-specific evaluation, but the data used in this perspective is a necessary component for all risk assessments.
EPA/600/R-05/128 January 2006
Environmental Technology Verification
Dust Suppressant Products
Midwest Industrial Supply, Inc.’s EK35
Prepared by
Midwest Research Institute RTI International
Under a Cooperative Agreement with U.S. Environmental Protection Agency

TECHNOLOGY TYPE: DUST SUPPRESSANT
APPLICATION: CONTROL OF DUST ON UNPAVED ROADS
TECHNOLOGY NAME: EK35
COMPANY: MIDWEST INDUSTRIAL SUPPLY, INC. ADDRESS: 1101 3rd STEET SE
CANTON, OH 44707 PHONE: 800-321-0699 FAX: 330-456-3247
WEB SITE: http://www.midwestind.com/ E-MAIL: [email protected]
THE ENVIRONMENTAL TECHNOLOGY VERIFICATION PROGRAM
U.S. Environmental Protection Agency
ETV Joint Verification Statement
The U.S. Environmental Protection Agency (EPA) has created the Environmental Technology Verification (ETV) Program to facilitate the deployment of innovative or improved environmental technologies through performance verification and dissemination of information. The goal of the ETV Program is to further environmental protection by accelerating the acceptance and use of improved and cost-effective technologies. ETV seeks to achieve this goal by providing high-quality, peer-reviewed data on technology performance to those involved in the design, distribution, financing, permitting, purchase, and use of environmental technologies.
ETV works in partnership with recognized standards and testing organizations; stakeholder groups, which consist of buyers, vendor organizations, permitters, and other interested parties; and with the full participation of individual technology developers. The program evaluates the performance of innovative technologies by developing test plans that are responsive to the needs of stakeholders, conducting field or laboratory tests (as appropriate), collecting and analyzing data, and preparing peer-reviewed reports. All evaluations are conducted in accordance with rigorous quality assurance (QA) protocols to ensure that data of known and adequate quality are generated and that the results are defensible.
The Air Pollution Control Technology (APCT) Verification Center, a center under the ETV Program, is operated by Research Triangle Institute (RTI) in cooperation with EPA’s National Risk Management Research Laboratory. The APCT Center has evaluated the performance of a dust suppressant product for control of dust on an unpaved road.
i
ETV TEST DESCRIPTION
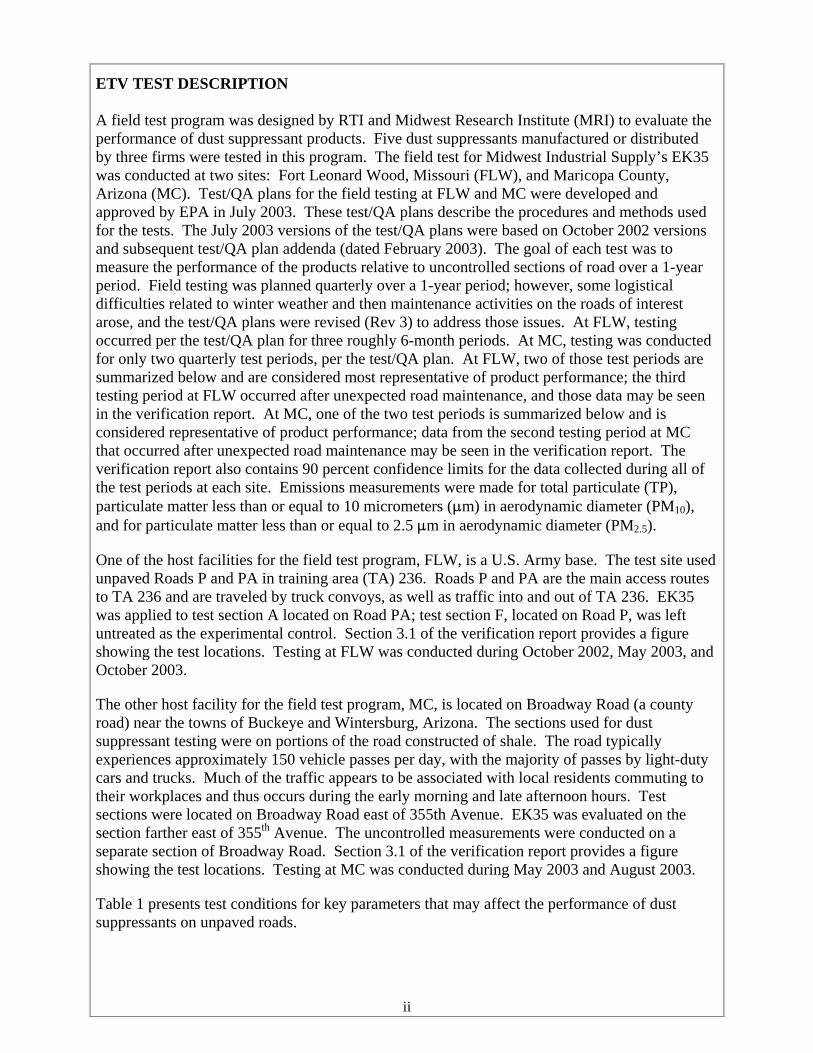
A field test program was designed by RTI and Midwest Research Institute (MRI) to evaluate the performance of dust suppressant products. Five dust suppressants manufactured or distributed by three firms were tested in this program. The field test for Midwest Industrial Supply’s EK35 was conducted at two sites: Fort Leonard Wood, Missouri (FLW), and Maricopa County, Arizona (MC). Test/QA plans for the field testing at FLW and MC were developed and approved by EPA in July 2003. These test/QA plans describe the procedures and methods used for the tests. The July 2003 versions of the test/QA plans were based on October 2002 versions and subsequent test/QA plan addenda (dated February 2003). The goal of each test was to measure the performance of the products relative to uncontrolled sections of road over a 1-year period. Field testing was planned quarterly over a 1-year period; however, some logistical difficulties related to winter weather and then maintenance activities on the roads of interest arose, and the test/QA plans were revised (Rev 3) to address those issues. At FLW, testing occurred per the test/QA plan for three roughly 6-month periods. At MC, testing was conducted for only two quarterly test periods, per the test/QA plan. At FLW, two of those test periods are summarized below and are considered most representative of product performance; the third testing period at FLW occurred after unexpected road maintenance, and those data may be seen in the verification report. At MC, one of the two test periods is summarized below and is considered representative of product performance; data from the second testing period at MC that occurred after unexpected road maintenance may be seen in the verification report. The verification report also contains 90 percent confidence limits for the data collected during all of the test periods at each site. Emissions measurements were made for total particulate (TP), particulate matter less than or equal to 10 micrometers (:m) in aerodynamic diameter (PM10), and for particulate matter less than or equal to 2.5 :m in aerodynamic diameter (PM2.5).
One of the host facilities for the field test program, FLW, is a U.S. Army base. The test site used unpaved Roads P and PA in training area (TA) 236. Roads P and PA are the main access routes to TA 236 and are traveled by truck convoys, as well as traffic into and out of TA 236. EK35 was applied to test section A located on Road PA; test section F, located on Road P, was left untreated as the experimental control. Section 3.1 of the verification report provides a figure showing the test locations. Testing at FLW was conducted during October 2002, May 2003, and October 2003.
The other host facility for the field test program, MC, is located on Broadway Road (a county road) near the towns of Buckeye and Wintersburg, Arizona. The sections used for dust suppressant testing were on portions of the road constructed of shale. The road typically experiences approximately 150 vehicle passes per day, with the majority of passes by light-duty cars and trucks. Much of the traffic appears to be associated with local residents commuting to their workplaces and thus occurs during the early morning and late afternoon hours. Test sections were located on Broadway Road east of 355th Avenue. EK35 was evaluated on the section farther east of 355th Avenue. The uncontrolled measurements were conducted on a separate section of Broadway Road. Section 3.1 of the verification report provides a figure showing the test locations. Testing at MC was conducted during May 2003 and August 2003.
Table 1 presents test conditions for key parameters that may affect the performance of dust suppressants on unpaved roads.
ii
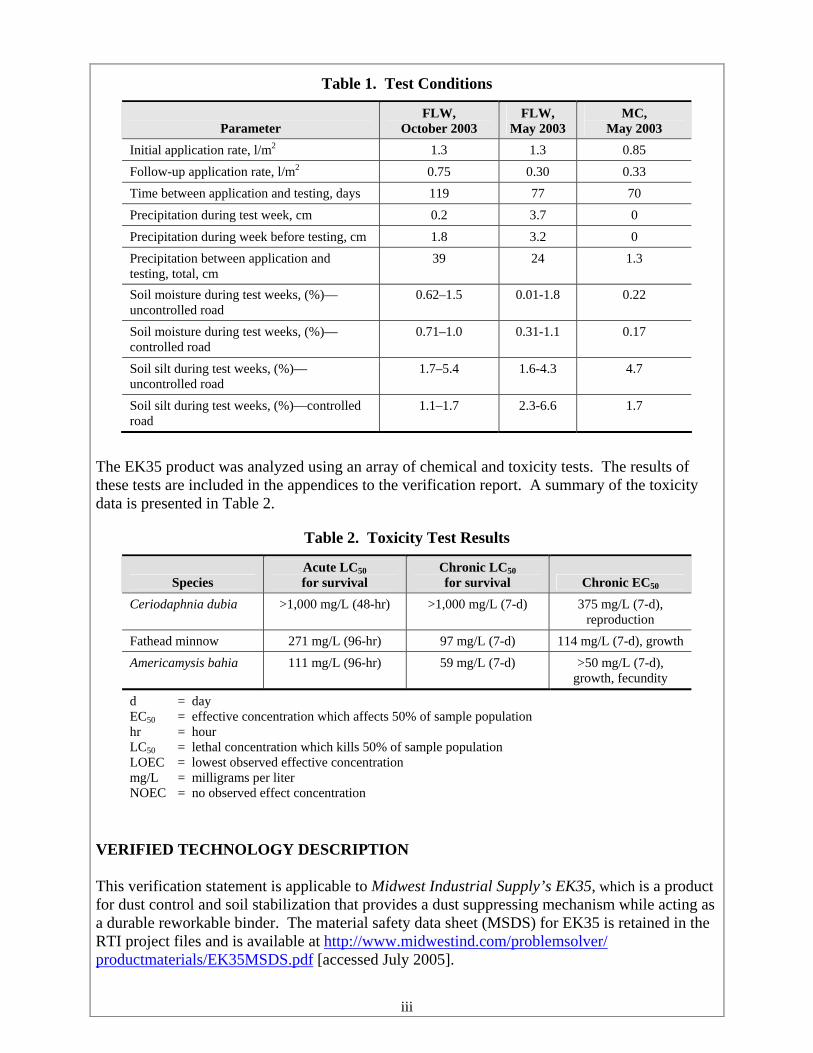
Table 1. Test Conditions
Parameter FLW,
October 2003 FLW,
May 2003 MC,
May 2003 Initial application rate, l/m2 1.3 1.3 0.85 Follow-up application rate, l/m2 0.75 0.30 0.33 Time between application and testing, days 119 77 70 Precipitation during test week, cm 0.2 3.7 0 Precipitation during week before testing, cm 1.8 3.2 0 Precipitation between application and testing, total, cm
39 24 1.3
Soil moisture during test weeks, (%)— uncontrolled road
0.62–1.5 0.01-1.8 0.22
Soil moisture during test weeks, (%)— controlled road
0.71–1.0 0.31-1.1 0.17
Soil silt during test weeks, (%)— uncontrolled road
1.7–5.4 1.6-4.3 4.7
Soil silt during test weeks, (%)—controlled road
1.1–1.7 2.3-6.6 1.7
The EK35 product was analyzed using an array of chemical and toxicity tests. The results of these tests are included in the appendices to the verification report. A summary of the toxicity data is presented in Table 2.
Table 2. Toxicity Test Results
Species Acute LC50 for survival
Chronic LC50 for survival Chronic EC50
Ceriodaphnia dubia >1,000 mg/L (48-hr) >1,000 mg/L (7-d) 375 mg/L (7-d), reproduction
Fathead minnow 271 mg/L (96-hr) 97 mg/L (7-d) 114 mg/L (7-d), growth Americamysis bahia 111 mg/L (96-hr) 59 mg/L (7-d) >50 mg/L (7-d),
growth, fecundity
d = day EC50 = effective concentration which affects 50% of sample population hr = hourLC50 = lethal concentration which kills 50% of sample populationLOEC = lowest observed effective concentrationmg/L = milligrams per liter NOEC = no observed effect concentration
VERIFIED TECHNOLOGY DESCRIPTION
This verification statement is applicable to Midwest Industrial Supply’s EK35, which is a product for dust control and soil stabilization that provides a dust suppressing mechanism while acting as a durable reworkable binder. The material safety data sheet (MSDS) for EK35 is retained in the RTI project files and is available at http://www.midwestind.com/problemsolver/ productmaterials/EK35MSDS.pdf [accessed July 2005].
iii
VERIFICATION OF PERFORMANCE
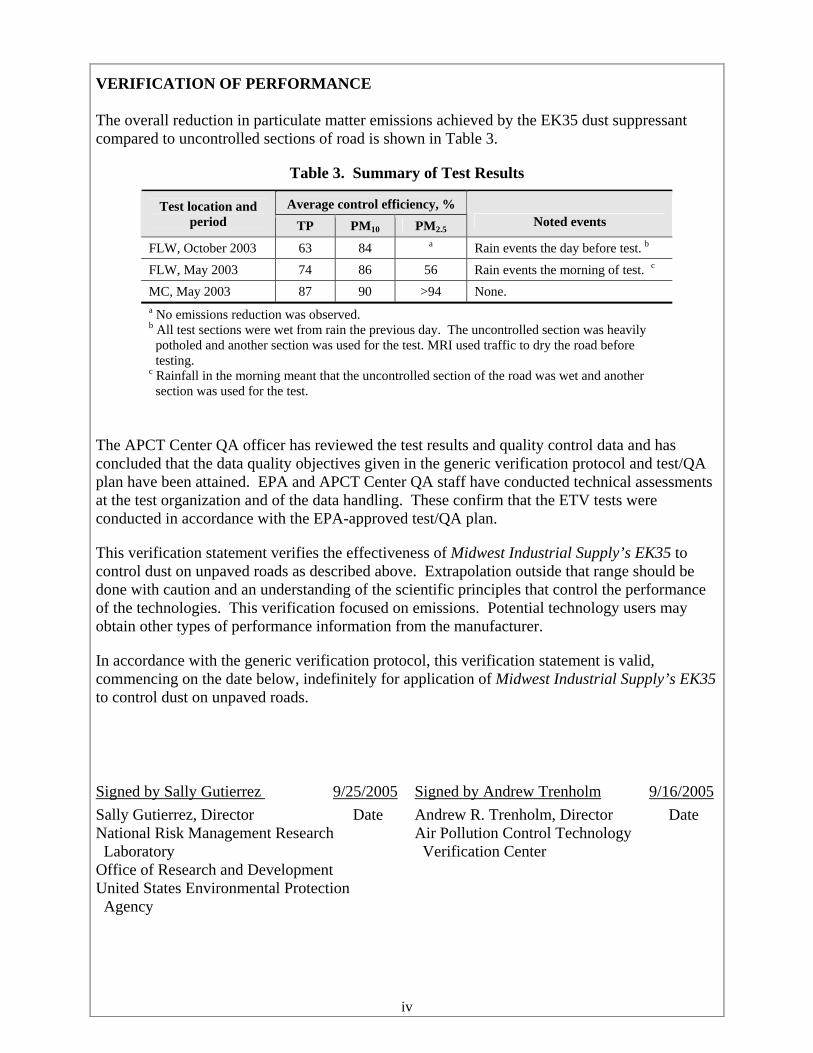
The overall reduction in particulate matter emissions achieved by the EK35 dust suppressant compared to uncontrolled sections of road is shown in Table 3.
Table 3. Summary of Test Results
Test location and Average control efficiency, % Noted events period TP PM10 PM2.5
FLW, October 2003 63 84 a Rain events the day before test. b
FLW, May 2003 74 86 56 Rain events the morning of test. c
MC, May 2003 87 90 >94 None. a No emissions reduction was observed. b All test sections were wet from rain the previous day. The uncontrolled section was heavily
potholed and another section was used for the test. MRI used traffic to dry the road before testing.
c Rainfall in the morning meant that the uncontrolled section of the road was wet and another section was used for the test.
The APCT Center QA officer has reviewed the test results and quality control data and has concluded that the data quality objectives given in the generic verification protocol and test/QA plan have been attained. EPA and APCT Center QA staff have conducted technical assessments at the test organization and of the data handling. These confirm that the ETV tests were conducted in accordance with the EPA-approved test/QA plan.
This verification statement verifies the effectiveness of Midwest Industrial Supply’s EK35 to control dust on unpaved roads as described above. Extrapolation outside that range should be done with caution and an understanding of the scientific principles that control the performance of the technologies. This verification focused on emissions. Potential technology users may obtain other types of performance information from the manufacturer.
In accordance with the generic verification protocol, this verification statement is valid, commencing on the date below, indefinitely for application of Midwest Industrial Supply’s EK35 to control dust on unpaved roads.
Signed by Sally Gutierrez 9/25/2005 Signed by Andrew Trenholm 9/16/2005 Sally Gutierrez, Director Date National Risk Management Research Laboratory
Office of Research and Development United States Environmental Protection
Andrew R. Trenholm, Director Air Pollution Control Technology Verification Center
Date
Agency
iv
Environmental Technology Verification
Dust Suppressant Products
Midwest Industrial Supply, Inc.’s EK35
Prepared by:
RTI International Midwest Research Institute
EPA Cooperative Agreement No. CR829434-01-1 RTI Project No. 09309
EPA Project Manager: Michael Kosusko
National Risk Management Research Laboratory Air Pollution Prevention and Control Division
Office of Research and Development U.S. Environmental Protection Agency
Research Triangle Park, NC 27711
September 2005
Environmental Technology Verification Report Dust Suppressant Products: EK35
Notice
RTI International* (RTI) and Midwest Research Institute (MRI) prepared this document with funding from RTI’s Cooperative Agreement No. CR829434-01-1 with the U.S. Environmental Protection Agency (EPA). Mention of corporation names, trade names, or commercial products does not constitute endorsement or recommendation for use of specific products.
* RTI International is a trade name of Research Triangle Institute.
vi
Environmental Technology Verification Report Dust Suppressant Products: EK35
Acknowledgments
The authors acknowledge the support of all of those who helped plan and conduct the verification activities. In particular, we would like to thank Michael Kosusko, U.S. Environmental Protection Agency’s (EPA’s) project manager, and Paul Groff, EPA’s quality assurance manager, both of EPA’s National Risk Management Research Laboratory in Research Triangle Park, North Carolina. We would also like to acknowledge the assistance and participation of Joe Proffitt and staff at Fort Leonard Wood, Eric Mayer and staff at Maricopa County, and of all the Midwest Industrial Supply, Inc., personnel who supported the test effort. Funding for this verification effort was provided from multiple sources, including EPA’s Environmental Technology Verification Program, U.S. Army Corps of Engineers, and Midwest Industrial Supply, Inc. (the participating vendor).
For more information on EK35 dust suppressant, contact:
Mr. Todd Hawkins Midwest Industrial Supply, Inc. 1101 3rd Street SE Canton, Ohio 44707 Telephone: (800) 321-0699 Fax: (330) 456-3247 Email: [email protected] Web site: http://www.midwestind.com/
A draft report with additional information on environmental and toxicological analysis conducted by the Civil Engineering Research Foundation (CERF) may be obtained from Midwest Industrial Supply, Inc.
For more information on verification testing of dust suppressant and soil stabilization products, contact:
Ms. Debbie Franke RTI International P.O. Box 12194 Research Triangle Park, North Carolina 27709-2194 Telephone: (919) 541-6826 Email: [email protected] Web site: http://etv.rti.org/apct/index.html
vii
Environmental Technology Verification Report Dust Suppressant Products: EK35
Abstract
Dust suppressant products used to control particulate emissions from unpaved roads are among the technologies evaluated by the Air Pollution Control Technology (APCT) Verification Center, part of the U.S. Environmental Protection Agency’s Environmental Technology Verification (ETV) Program. The critical performance factor for dust suppressant verification is the dust control efficiency (CE). CE was evaluated in terms of total particulate (TP), particulate matter less than or equal to 10 micrometers (µm) in aerodynamic diameter (PM10), and particulate matter less than or equal to 2.5 micrometers (µm) in aerodynamic diameter (PM2.5).
Midwest Industrial Supply, Inc., submitted the EK35 dust suppressant to the APCT Center for testing. The test and quality assurance (QA) plans, prepared in accordance with the Generic Verification Protocol (GVP), addressed the site-specific issues associated with these verification tests. The 1-year testing was conducted at two sites: Fort Leonard Wood, Missouri, and Maricopa County, Arizona. Testing at Fort Leonard Wood was conducted during October 2002, May 2003, and October 2003. Testing at Maricopa County was conducted during May 2003 and August 2003. This verification report summarizes the results of the 1-year test. The verified CE will be based on all tests at each site, as specified in the test/QA plan. Test conditions were measured and documented.
viii
Environmental Technology Verification Report Dust Suppressant Products: EK35
Table of Contents
Section Page
Notice............................................................................................................................................. vi
Acknowledgments......................................................................................................................... vii
Abstract ........................................................................................................................................ viii
List of Figures ................................................................................................................................. x
List of Tables .................................................................................................................................. x
List of Acronyms and Abbreviations............................................................................................. xi
1.0 Introduction............................................................................................................................ 1
2.0 Summary and Discussion of Results...................................................................................... 2 2.1 Verification Results ...................................................................................................... 22.2 Laboratory Toxicity Test Results ................................................................................. 5 2.3 Discussion of QA/QC ................................................................................................... 5 2.4 Deviations from Test Plan ............................................................................................ 6
3.0 Test Conditions ...................................................................................................................... 9 3.1 General Test Site Conditions ........................................................................................ 9
3.1.1 Traffic ............................................................................................................. 11 3.1.2 Area Climatic Conditions ............................................................................... 12 3.1.3 Background Particulate Concentration ........................................................... 15
3.2 Application of Dust Suppressant ................................................................................ 16 3.3 Conditions During Dust Suppressant Test Runs......................................................... 19
4.0 References............................................................................................................................ 21
Appendix A – Environmental Testing Results ........................................................................... A-1
Appendix B – Chemical Testing Results .................................................................................... B-1
Appendix C – Method 24 Results............................................................................................... C-1
ix
Environmental Technology Verification Report Dust Suppressant Products: EK35
List of Figures
1 Test locations at FLW. .......................................................................................................... 10 2 Test locations at MC.............................................................................................................. 11 3 Application of EK35 product at FLW................................................................................... 18 4 Application of EK35 product at MC. .................................................................................... 18
List of Tables
1 Summary of Test Results for EK35 (No Road Maintenance)................................................. 3 2 Summary of Test Results for EK35 (After Road Maintenance Occurred) ............................. 4 3 DQOs versus Final Control Efficiency Variability for EK35 ................................................. 6 4 Summary of Test Event Deviations for FLW.......................................................................... 6 5 Summary of Test Event Deviations for MC............................................................................ 7 6 Weekly Weather for FLW..................................................................................................... 127 Weekly Weather for Buckeye, Arizona ................................................................................ 14 8 Summary of Precipitation for All Test Periods at FLW and MC.......................................... 15 9 Measured Background PM Concentrations at FLW ............................................................. 15 10 Estimated Background Contribution to Sampler Catch at FLW Compared to Mean
Blank Filter Data................................................................................................................... 16 11 Background Concentration Measurements at Palo Verde, Arizona...................................... 16 12 Application History ............................................................................................................... 17 13 Test Run Parameters.............................................................................................................. 19 14 Road Surface Properties ........................................................................................................ 21
x
Environmental Technology Verification Report Dust Suppressant Products: EK35
List of Acronyms and Abbreviations
ADEQ Arizona Department of Environmental Quality ADT average daily traffic ANOVA analysis of variance APCT air pollution control technology AZMET Arizona Meteorological Network BOD biological oxygen demand CE control efficiency cfm cubic feet per minute CI confidence interval cm centimeters COD chemical oxygen demand DQO data quality objective DPW Directorate of Public Works EC50 effective concentration, 50 percent EPA U.S. Environmental Protection Agency ETV environmental technology verification FLW Fort Leonard Wood, Missouri ft feet g grams g/mL grams per milliliter gal gallons GPS global positioning system GVP generic verification protocol hi-vol high volume in. inches km kilometer l or L liters lb pounds LC50 lethal concentration, 50 percent LOEC lowest observed effective concentration lpm liters per minute µg micrograms µm micrometer m meters MC Maricopa County, Arizona mg milligrams min minutes ml milliliters mph miles per hour MRI Midwest Research Institute MSDS material safety data sheet NA not applicable NOEC no observed effect concentration PM particulate matter
xi
Environmental Technology Verification Report Dust Suppressant Products: EK35
PM10 particulate matter equal to or less than 10 µm in aerodynamic diameter PM2.5 particulate matter equal to or less than 2.5 µm in aerodynamic diameter QA quality assurance QC quality control RSD relative standard deviation RTI RTI International s seconds TA training area TCLP toxicity characteristic leaching procedure TP total particulate WAF water accommodated fractions yd yard
xii
Environmental Technology Verification Report Dust Suppressant Products: EK35
1.0 Introduction
The objective of the Air Pollution Control Technology (APCT) Verification Center, part of the U.S. Environmental Protection Agency’s (EPA’s) Environmental Technology Verification (ETV) Program, is to verify, with high data quality, the performance of air pollution control technologies. One such set of air pollution control technologies consists of products used to control dust emissions from unpaved roads. Dust suppressant products are, in general, designed to alter the roadway by lightly cementing the particles together or by forming a surface that attracts and retains moisture. Control of dust emissions from unpaved roads is of increasing interest, particularly related to attainment of the ambient particulate matter (PM) standard. EPA issued a new ambient standard for PM in 1997 that specifies new air quality levels for particulate matter less than or equal to 2.5 micrometer (:m) in aerodynamic diameter (PM2.5).1
The APCT Center’s verification of dust suppression products started with a preliminary 3-month testing program at Fort Leonard Wood, Missouri (FLW). The objective of this preliminary test program was to develop a cost-effective technique to measure the relative performance of dust suppressant products. The more common, but resource intensive, exposure profiling method to measure fugitive dust was compared to a mobile dust sampler. It was concluded that the mobile dust sampler could be used for future testing. A total of seven dust suppressant products were evaluated in the preliminary testing. Seven reports documenting the performance of these products were finalized in November 2002.2
After completion of the preliminary study, a 1-year field test program was designed by RTI and Midwest Research Institute (MRI) to evaluate the performance of dust suppressant products. Five dust suppressants manufactured or distributed by three firms were tested in this program. One of those dust suppressants was EK35, developed by Midwest Industrial Supply, Inc. EK35 is a product for dust control and soil stabilization that acts as a durable reworkable binder. The material safety data sheet (MSDS) for EK35 is retained in the RTI project files and is available on Midwest Industrial Supply’s Web site (http://www.midwestind. com/problemsolver/productmaterials/EK35MSDS.pdf) [accessed July 2005].
The field test program for EK35 was conducted at two sites: FLW and Maricopa County, Arizona (MC). Testing was conducted at two different sites to account for differences in climate and soil types. In July 2003, test and quality assurance (QA) plans for the field testing at FLW and MC were developed and approved by EPA.3,4 The July 2003 versions of each test/QA plan were based on an October 2002 version and a subsequent test/QA plan addendum (dated February 19, 2003, for FLW, and February 10, 2003, for MC). These test/QA plans describe the procedures and methods used for the tests. The goal of each test was to measure the performance of the products relative to uncontrolled sections of road over a 1-year period. Field testing was planned quarterly over a 1-year period; however, some logistical difficulties related to the weather and maintenance activities on the roads of interest arose, and the test/QA plans were modified (Rev 3) to address those issues. At FLW, test periods occurred per the test/QA plan for three roughly 6-month periods, during October 2002, May 2003, and October 2003. At MC, testing was conducted per the test/QA plans for only two quarterly test periods, during May
1
Environmental Technology Verification Report Dust Suppressant Products: EK35
2003 and August 2003. Emissions measurements were made for total particulate (TP), particulate matter less than or equal to 10 :m in aerodynamic diameter (PM10), and for PM2.5.
This report contains only summary information and data from the 1-year test program, as well as the verification statement related to the dust control efficiency (CE) measured for EK35 during testing at FLW and MC. Complete documentation of the test results is provided in a separate test report5 for FLW and MC and a data quality audit report.6 Those reports include the raw test data from product testing and supplemental testing, equipment calibration results, and QA and quality control (QC) activities and results. Complete documentation of QA/QC activities and results, raw test data, and equipment calibration results are retained in MRI’s files for 7 years.
The results of the tests are summarized and discussed in Section 2. The conditions in which the tests were conducted are presented in Section 3, and references are presented in Section 4.
2.0 Summary and Discussion of Results
Verification tests were conducted over a 1-year period on Midwest Industrial Supply’s EK35 dust suppressant as applied to unpaved roads at FLW and MC. Original plans called for testing to occur on a quarterly basis; however, one quarterly test was abandoned due to persistently unfavorable wintertime weather at FLW. In addition, at MC, the original test site (Lower Buckeye Road) was disturbed after the original treatment. As a result, a 6-month (rather than 1-year) verification study was conducted with quarterly measurements at a second site (Broadway Road) in MC.
The mobile dust sampling system used in this test program provides quantitative information on relative emissions levels. The mobile system consists of a high-volume (hi-vol) PM10 cyclone combined with a PM2.5 cyclone. The sampler inlet sits above the densest portion of the dust plume, immediately behind the test vehicle. In this location, the sampler collects PM that is truly airborne. The hi-vol sampler is operated with a nozzle matched to the test vehicle’s travel speed to best approximate isokinetic sampling. The test plans provide additional details on the construction and operation of the mobile sampler.
The results of the quarterly tests are summarized in Section 2.1. The results of laboratory toxicity tests on the product are included in Section 2.2. The results of QC checks performed during these quarterly tests are summarized in Section 2.3. Deviations from the test plans are discussed in Section 2.4.
2.1 Verification Results
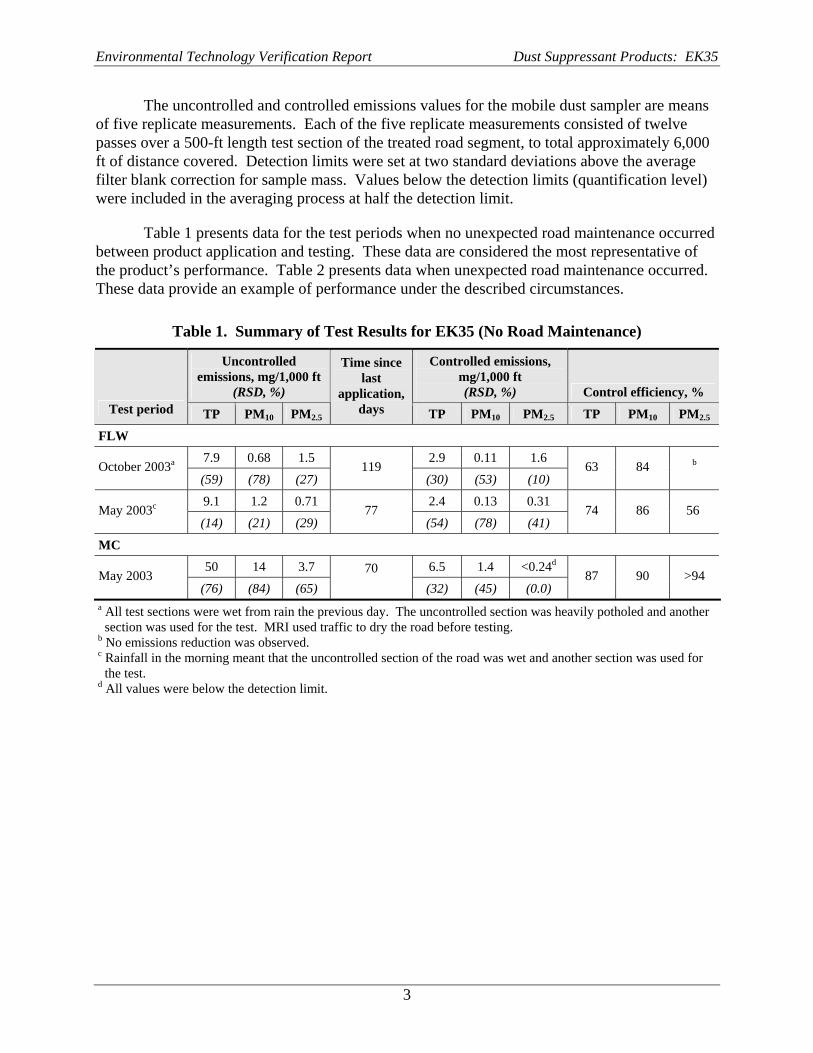
Tables 1 and 2 present summary statistics for results from each test period. The mobile sampler provides a test result in terms of particulate mass collected per distance traveled [milligrams per 1,000 feet (mg/1,000 ft)]. The tables show the number of days after product application, the mean controlled and uncontrolled emissions values, and the resulting CEs. The relative standard deviation (RSD) for the emissions values is shown in parentheses.
2
Environmental Technology Verification Report Dust Suppressant Products: EK35
The uncontrolled and controlled emissions values for the mobile dust sampler are means of five replicate measurements. Each of the five replicate measurements consisted of twelve passes over a 500-ft length test section of the treated road segment, to total approximately 6,000 ft of distance covered. Detection limits were set at two standard deviations above the average filter blank correction for sample mass. Values below the detection limits (quantification level) were included in the averaging process at half the detection limit.
Table 1 presents data for the test periods when no unexpected road maintenance occurred between product application and testing. These data are considered the most representative of the product’s performance. Table 2 presents data when unexpected road maintenance occurred. These data provide an example of performance under the described circumstances.
Table 1. Summary of Test Results for EK35 (No Road Maintenance)
Test period
Uncontrolled emissions, mg/1,000 ft
(RSD, %)
Time since last
application, days
Controlled emissions, mg/1,000 ft (RSD, %) Control efficiency, %
TP PM10 PM2.5 TP PM10 PM2.5 TP PM10 PM2.5
FLW
October 2003a 7.9 0.68 1.5 119
2.9 0.11 1.6 63 84 b
(59) (78) (27) (30) (53) (10)
May 2003c 9.1 1.2 0.71 77
2.4 0.13 0.31 74 86 56
(14) (21) (29) (54) (78) (41)
MC
May 2003 50 14 3.7 70 6.5 1.4 <0.24d
87 90 >94 (76) (84) (65) (32) (45) (0.0)
a All test sections were wet from rain the previous day. The uncontrolled section was heavily potholed and another section was used for the test. MRI used traffic to dry the road before testing.
b No emissions reduction was observed. c Rainfall in the morning meant that the uncontrolled section of the road was wet and another section was used for
the test. d All values were below the detection limit.
3
Environmental Technology Verification Report Dust Suppressant Products: EK35
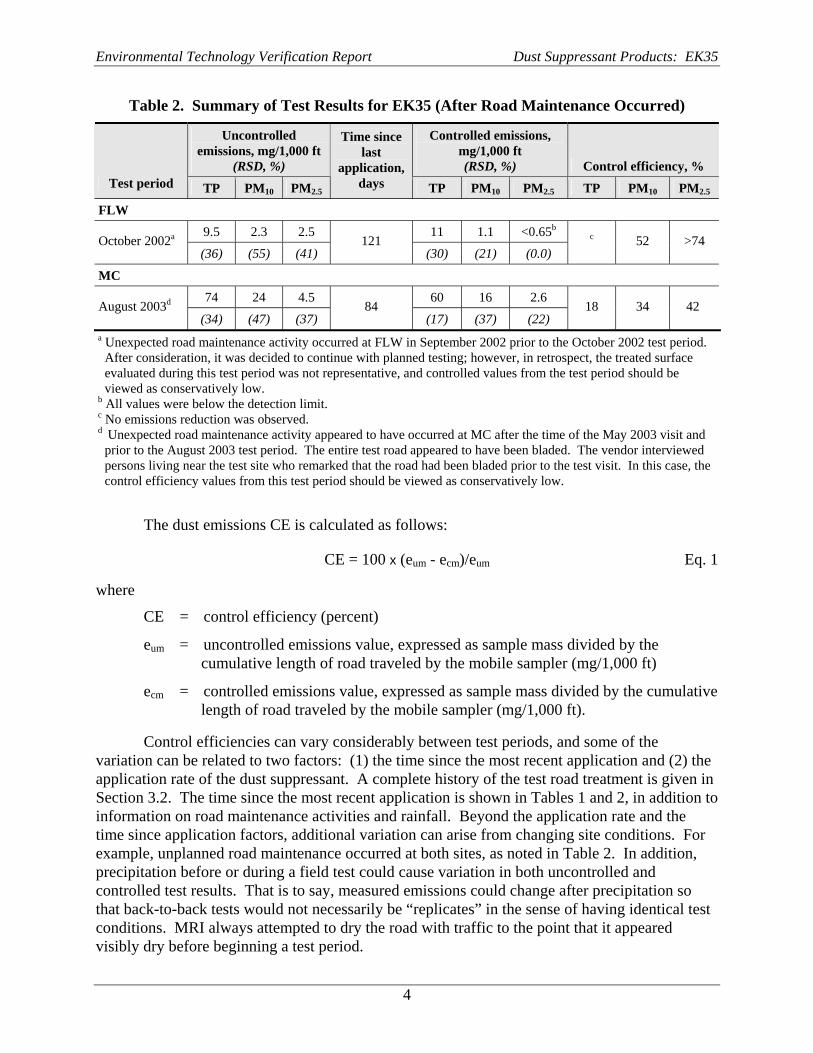
Table 2. Summary of Test Results for EK35 (After Road Maintenance Occurred)
Test period
Uncontrolled emissions, mg/1,000 ft
(RSD, %)
Time since last
application, days
Controlled emissions, mg/1,000 ft (RSD, %) Control efficiency, %
TP PM10 PM2.5 TP PM10 PM2.5 TP PM10 PM2.5
FLW
October 2002a 9.5 2.3 2.5 121
11 1.1 <0.65b c 52 >74
(36) (55) (41) (30) (21) (0.0)
MC
August 2003d 74 24 4.5 84
60 16 2.6 18 34 42
(34) (47) (37) (17) (37) (22) a Unexpected road maintenance activity occurred at FLW in September 2002 prior to the October 2002 test period.
After consideration, it was decided to continue with planned testing; however, in retrospect, the treated surface evaluated during this test period was not representative, and controlled values from the test period should be viewed as conservatively low.
b All values were below the detection limit. c No emissions reduction was observed. d Unexpected road maintenance activity appeared to have occurred at MC after the time of the May 2003 visit and
prior to the August 2003 test period. The entire test road appeared to have been bladed. The vendor interviewed persons living near the test site who remarked that the road had been bladed prior to the test visit. In this case, the control efficiency values from this test period should be viewed as conservatively low.
The dust emissions CE is calculated as follows:
CE = 100 x (eum - ecm)/eum Eq. 1
where
CE = control efficiency (percent)
eum = uncontrolled emissions value, expressed as sample mass divided by the cumulative length of road traveled by the mobile sampler (mg/1,000 ft)
ecm = controlled emissions value, expressed as sample mass divided by the cumulative length of road traveled by the mobile sampler (mg/1,000 ft).
Control efficiencies can vary considerably between test periods, and some of the variation can be related to two factors: (1) the time since the most recent application and (2) the application rate of the dust suppressant. A complete history of the test road treatment is given in Section 3.2. The time since the most recent application is shown in Tables 1 and 2, in addition to information on road maintenance activities and rainfall. Beyond the application rate and the time since application factors, additional variation can arise from changing site conditions. For example, unplanned road maintenance occurred at both sites, as noted in Table 2. In addition, precipitation before or during a field test could cause variation in both uncontrolled and controlled test results. That is to say, measured emissions could change after precipitation so that back-to-back tests would not necessarily be “replicates” in the sense of having identical test conditions. MRI always attempted to dry the road with traffic to the point that it appeared visibly dry before beginning a test period.
4
Environmental Technology Verification Report Dust Suppressant Products: EK35
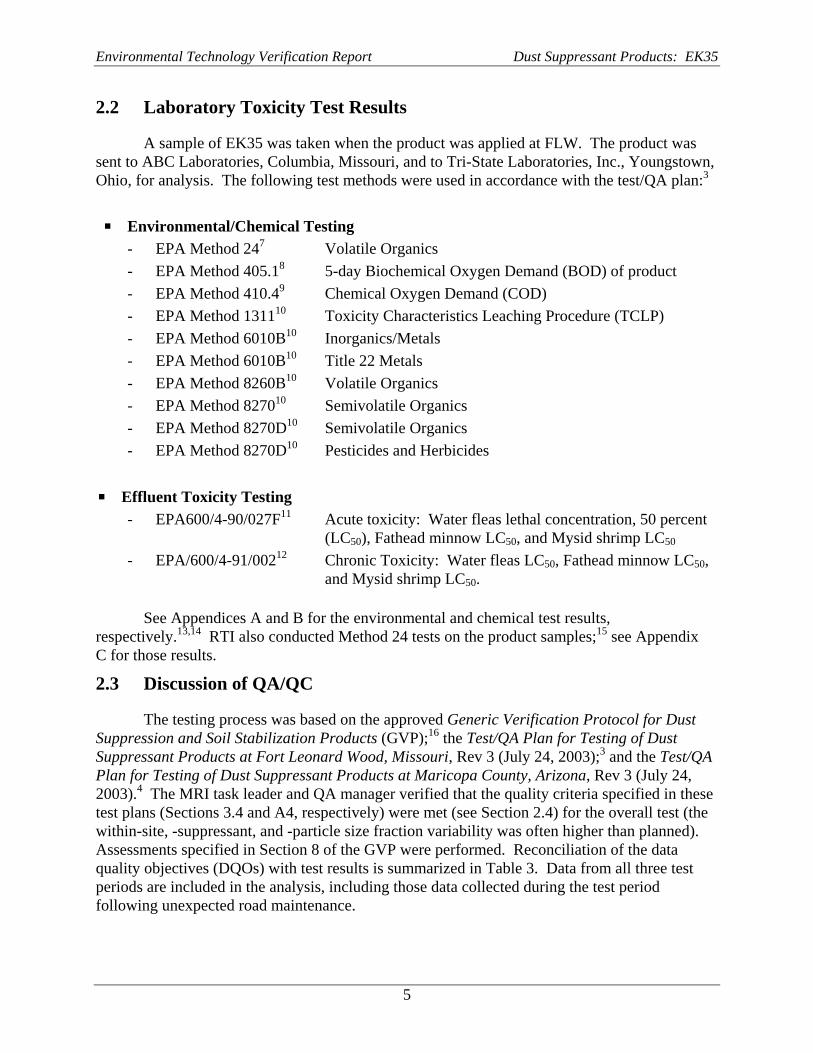
2.2 Laboratory Toxicity Test Results
A sample of EK35 was taken when the product was applied at FLW. The product was sent to ABC Laboratories, Columbia, Missouri, and to Tri-State Laboratories, Inc., Youngstown, Ohio, for analysis. The following test methods were used in accordance with the test/QA plan:3
� Environmental/Chemical Testing - EPA Method 247 Volatile Organics - EPA Method 405.18 5-day Biochemical Oxygen Demand (BOD) of product - EPA Method 410.49 Chemical Oxygen Demand (COD) - EPA Method 131110 Toxicity Characteristics Leaching Procedure (TCLP) - EPA Method 6010B10 Inorganics/Metals - EPA Method 6010B10 Title 22 Metals - EPA Method 8260B10 Volatile Organics - EPA Method 827010 Semivolatile Organics - EPA Method 8270D10 Semivolatile Organics - EPA Method 8270D10 Pesticides and Herbicides
� Effluent Toxicity Testing - EPA600/4-90/027F11 Acute toxicity: Water fleas lethal concentration, 50 percent
(LC50), Fathead minnow LC50, and Mysid shrimp LC50
- EPA/600/4-91/00212 Chronic Toxicity: Water fleas LC50, Fathead minnow LC50, and Mysid shrimp LC50.
See Appendices A and B for the environmental and chemical test results, respectively.13,14 RTI also conducted Method 24 tests on the product samples;15 see Appendix C for those results.
2.3 Discussion of QA/QC
The testing process was based on the approved Generic Verification Protocol for Dust Suppression and Soil Stabilization Products (GVP);16 the Test/QA Plan for Testing of Dust Suppressant Products at Fort Leonard Wood, Missouri, Rev 3 (July 24, 2003);3 and the Test/QA Plan for Testing of Dust Suppressant Products at Maricopa County, Arizona, Rev 3 (July 24, 2003).4 The MRI task leader and QA manager verified that the quality criteria specified in these test plans (Sections 3.4 and A4, respectively) were met (see Section 2.4) for the overall test (the within-site, -suppressant, and -particle size fraction variability was often higher than planned). Assessments specified in Section 8 of the GVP were performed. Reconciliation of the data quality objectives (DQOs) with test results is summarized in Table 3. Data from all three test periods are included in the analysis, including those data collected during the test period following unexpected road maintenance.
5
Environmental Technology Verification Report Dust Suppressant Products: EK35
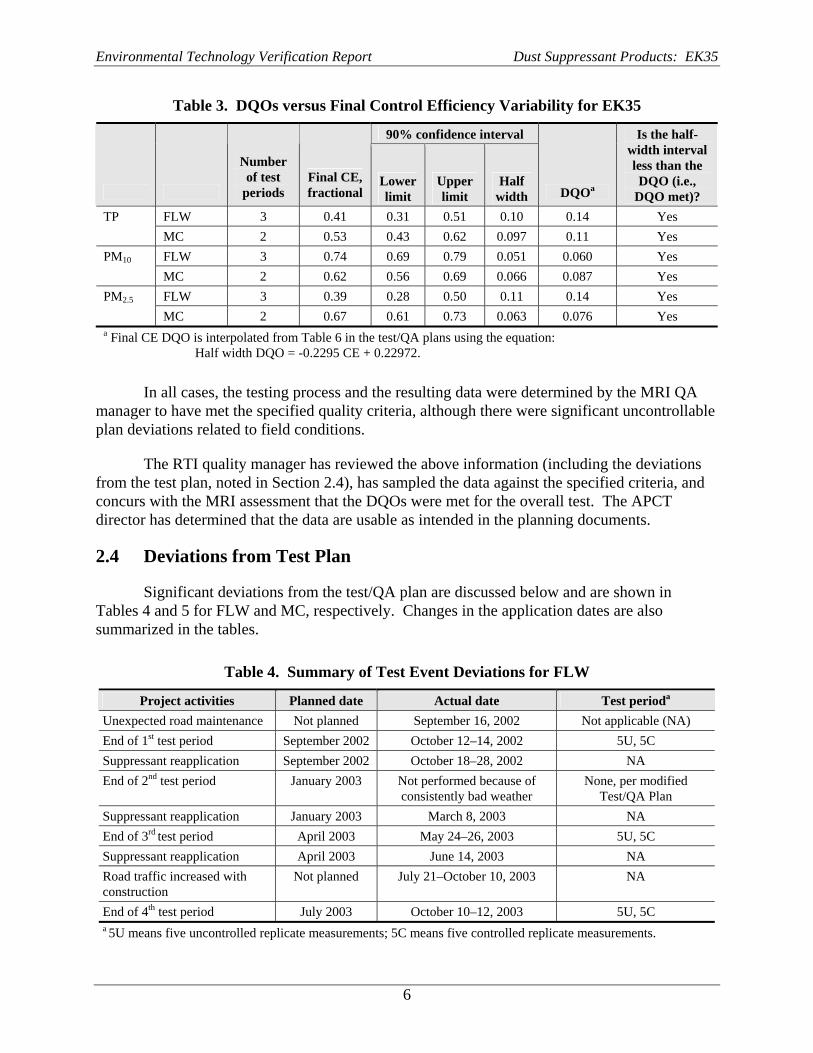
Table 3. DQOs versus Final Control Efficiency Variability for EK35
90% confidence interval Is the half-
Number of test
periods Final CE, fractional
Lower limit
Upper limit
Half width DQOa
width interval less than the DQO (i.e.,
DQO met)? TP FLW 3 0.41 0.31 0.51 0.10 0.14 Yes
MC 2 0.53 0.43 0.62 0.097 0.11 Yes PM10 FLW 3 0.74 0.69 0.79 0.051 0.060 Yes
MC 2 0.62 0.56 0.69 0.066 0.087 Yes PM2.5 FLW 3 0.39 0.28 0.50 0.11 0.14 Yes
MC 2 0.67 0.61 0.73 0.063 0.076 Yes a Final CE DQO is interpolated from Table 6 in the test/QA plans using the equation:
Half width DQO = -0.2295 CE + 0.22972.
In all cases, the testing process and the resulting data were determined by the MRI QA manager to have met the specified quality criteria, although there were significant uncontrollable plan deviations related to field conditions.
The RTI quality manager has reviewed the above information (including the deviations from the test plan, noted in Section 2.4), has sampled the data against the specified criteria, and concurs with the MRI assessment that the DQOs were met for the overall test. The APCT director has determined that the data are usable as intended in the planning documents.
2.4 Deviations from Test Plan
Significant deviations from the test/QA plan are discussed below and are shown in Tables 4 and 5 for FLW and MC, respectively. Changes in the application dates are also summarized in the tables.
Table 4. Summary of Test Event Deviations for FLW
Project activities Planned date Actual date Test perioda
Unexpected road maintenance Not planned September 16, 2002 Not applicable (NA) End of 1st test period September 2002 October 12–14, 2002 5U, 5C Suppressant reapplication September 2002 October 18–28, 2002 NA End of 2nd test period January 2003 Not performed because of
consistently bad weather None, per modified
Test/QA Plan Suppressant reapplication January 2003 March 8, 2003 NA End of 3rd test period April 2003 May 24–26, 2003 5U, 5C Suppressant reapplication April 2003 June 14, 2003 NA Road traffic increased with construction
Not planned July 21–October 10, 2003 NA
End of 4th test period July 2003 October 10–12, 2003 5U, 5C a 5U means five uncontrolled replicate measurements; 5C means five controlled replicate measurements.
6
Environmental Technology Verification Report Dust Suppressant Products: EK35
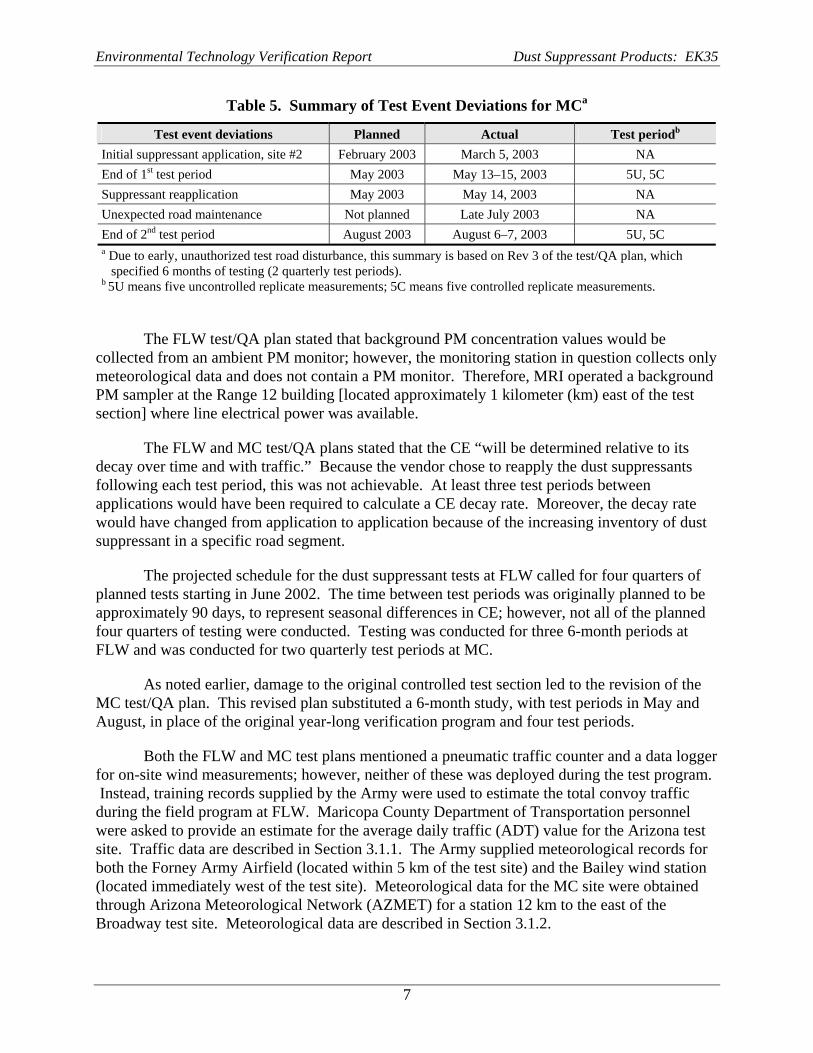
Table 5. Summary of Test Event Deviations for MCa
Test event deviations Planned Actual Test periodb
Initial suppressant application, site #2 February 2003 March 5, 2003 NA End of 1st test period May 2003 May 13–15, 2003 5U, 5C Suppressant reapplication May 2003 May 14, 2003 NA Unexpected road maintenance Not planned Late July 2003 NA End of 2nd test period August 2003 August 6–7, 2003 5U, 5C a Due to early, unauthorized test road disturbance, this summary is based on Rev 3 of the test/QA plan, which
specified 6 months of testing (2 quarterly test periods). b 5U means five uncontrolled replicate measurements; 5C means five controlled replicate measurements.
The FLW test/QA plan stated that background PM concentration values would be collected from an ambient PM monitor; however, the monitoring station in question collects only meteorological data and does not contain a PM monitor. Therefore, MRI operated a background PM sampler at the Range 12 building [located approximately 1 kilometer (km) east of the test section] where line electrical power was available.
The FLW and MC test/QA plans stated that the CE “will be determined relative to its decay over time and with traffic.” Because the vendor chose to reapply the dust suppressants following each test period, this was not achievable. At least three test periods between applications would have been required to calculate a CE decay rate. Moreover, the decay rate would have changed from application to application because of the increasing inventory of dust suppressant in a specific road segment.
The projected schedule for the dust suppressant tests at FLW called for four quarters of planned tests starting in June 2002. The time between test periods was originally planned to be approximately 90 days, to represent seasonal differences in CE; however, not all of the planned four quarters of testing were conducted. Testing was conducted for three 6-month periods at FLW and was conducted for two quarterly test periods at MC.
As noted earlier, damage to the original controlled test section led to the revision of the MC test/QA plan. This revised plan substituted a 6-month study, with test periods in May and August, in place of the original year-long verification program and four test periods.
Both the FLW and MC test plans mentioned a pneumatic traffic counter and a data logger for on-site wind measurements; however, neither of these was deployed during the test program. Instead, training records supplied by the Army were used to estimate the total convoy traffic during the field program at FLW. Maricopa County Department of Transportation personnel were asked to provide an estimate for the average daily traffic (ADT) value for the Arizona test site. Traffic data are described in Section 3.1.1. The Army supplied meteorological records for both the Forney Army Airfield (located within 5 km of the test site) and the Bailey wind station (located immediately west of the test site). Meteorological data for the MC site were obtained through Arizona Meteorological Network (AZMET) for a station 12 km to the east of the Broadway test site. Meteorological data are described in Section 3.1.2.
7
Environmental Technology Verification Report Dust Suppressant Products: EK35
Deviations during the individual test periods at FLW and in MC are discussed in the following paragraphs.
October 2002 Test Period at FLW. Both the field tests and the reporting of results occurred later than originally called for in the test/QA plan. The delay in testing was directly due to the unexpected road maintenance during the week of September 16, 2002, which occurred at the request of a Directorate of Public Works (DPW) contractor. This action required a delay of approximately 2 weeks to assess the extent to which the treated surface had been affected and whether testing of the surface would produce results useful to the program. Based on anecdotal information from the grader operator as well as photographs of the surface, it was determined that the surface had been covered with loose material (pulled from the side of the road). Subsequent discussions between DPW, the product vendors, RTI, and MRI led to general agreement to continue with conducting a first test in October 2002.
January 2003 Test Period at FLW. As noted above, persistently unfavorable winter weather during January and February 2003 forced the abandonment of the second quarterly test.
May 2003 Test Period at FLW. During the field audit conducted on May 26, 2003, it was determined that the PM2.5 background monitor operated at a flow of approximately 9 liters per minute (lpm) [0.32 cubic feet per minute (cfm)] rather than the target of 16.7 lpm (0.59 cfm). Because the background concentration was used only to estimate the maximum contribution that ambient PM levels could contribute to the mass collected by the mobile sampler, the contribution for PM2.5 was conservatively estimated using the PM10 background level. This point is discussed further in Section 3.1.
Another deviation concerned the location of the uncontrolled test section during the May 26, 2003, tests. On that day, a portion of uncontrolled test section (Section F in the test plan) was still damp from rain during the morning of May 25. For that reason, an uncontrolled 150-m (500-ft) section farther west along the same road was substituted.
October 2003 Test Period at FLW. Both the field tests and the reporting of results occurred later than originally called for in the test/QA plan. The delay in testing was due to rainfall over Labor Day weekend. Testing was rescheduled for Columbus Day weekend. No quarterly test report was prepared pending preparation of the final report.
Rainfall on the day before MRI’s arrival left all sections damp. In addition, the uncontrolled test site (Section F) was so heavily potholed that the mobile sampler could not be safely operated at the designated vehicle speed. Uncontrolled tests were moved to an untreated section of the same road to the west that exhibited better drainage than Section F. As noted earlier, MRI used traffic to dry the road before beginning a test period.
May 2003 Test Period at MC. The speedometer on the test vehicle was inoperative because of a fuse problem. For that reason, vehicle speed was monitored using a new handheld global positioning system (GPS) unit. The GPS readings were checked against a rental car’s speedometer and were found to agree within 2 mph at 25 and 35 miles per hour (mph).
8
Environmental Technology Verification Report Dust Suppressant Products: EK35
A filter used on test run CKO-131 did not pass initial audit during the tare weighing, but was not reweighed as required by MRI SOP-8403.
August 2003 Test Period at MC. No quarterly report was prepared for this test period, pending preparation of the final report. Test speeds were monitored using the same handheld GPS as used during the May 2003 tests. Some unexpected road maintenance appeared to have occurred since the time of the May 2003 visit. The entire test road in MC appeared to have been bladed. The vendor interviewed persons living near the test site who remarked that the road had been bladed prior to the test visit.
3.0 Test Conditions
3.1 General Test Site Conditions
The test/QA plans for FLW and MC document the sites and road sections used during dust suppressant testing.
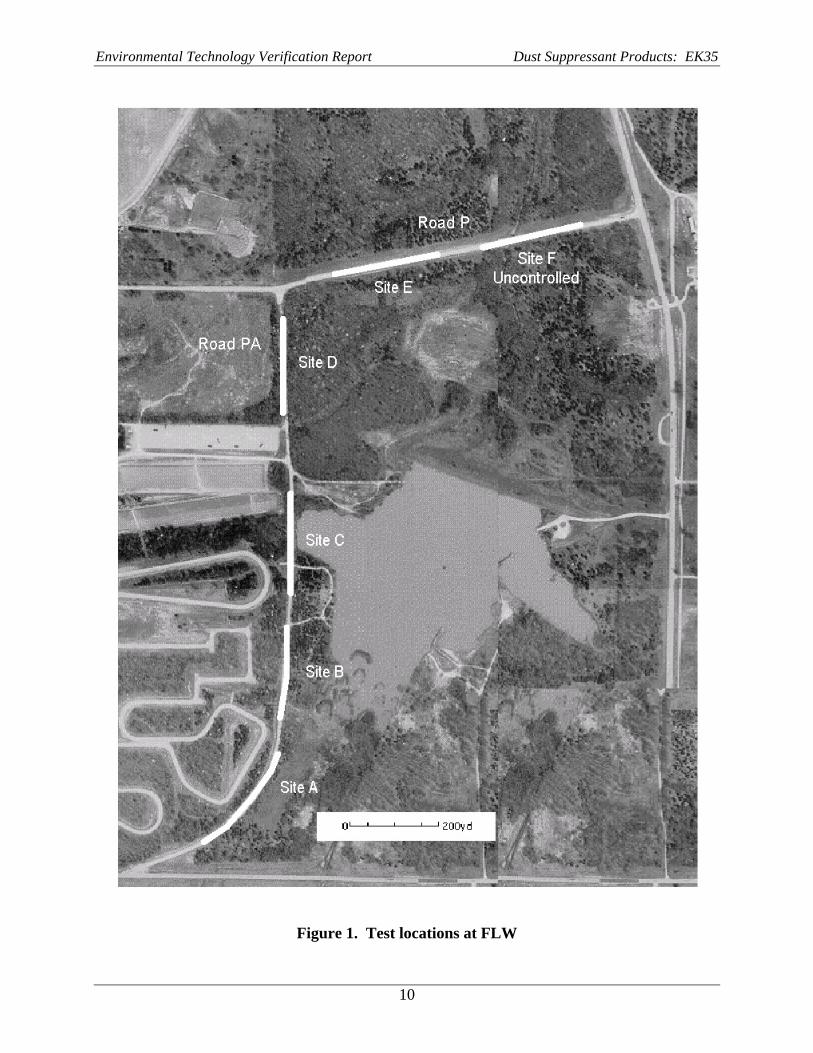
One of the host facilities for the field test program, FLW, is a U.S. Army base. The test site at FLW used unpaved Roads P and PA in training area (TA) 236. Roads P and PA are the main access routes to TA 236 and are traveled by truck convoys, as well as traffic into and out of TA 236. Test sections A, B, C, and D are located on Road PA, while test section E is located along Road P. EK35 was applied to test section A. Other products tested during this program were applied to the other test sections. The sixth test section (F), also located on Road P, was left untreated as the experimental control. The EK35 product was tested on a curved section of road, which would have subjected the treated road surface to greater shear stress. Figure 1 shows the test locations at FLW.3
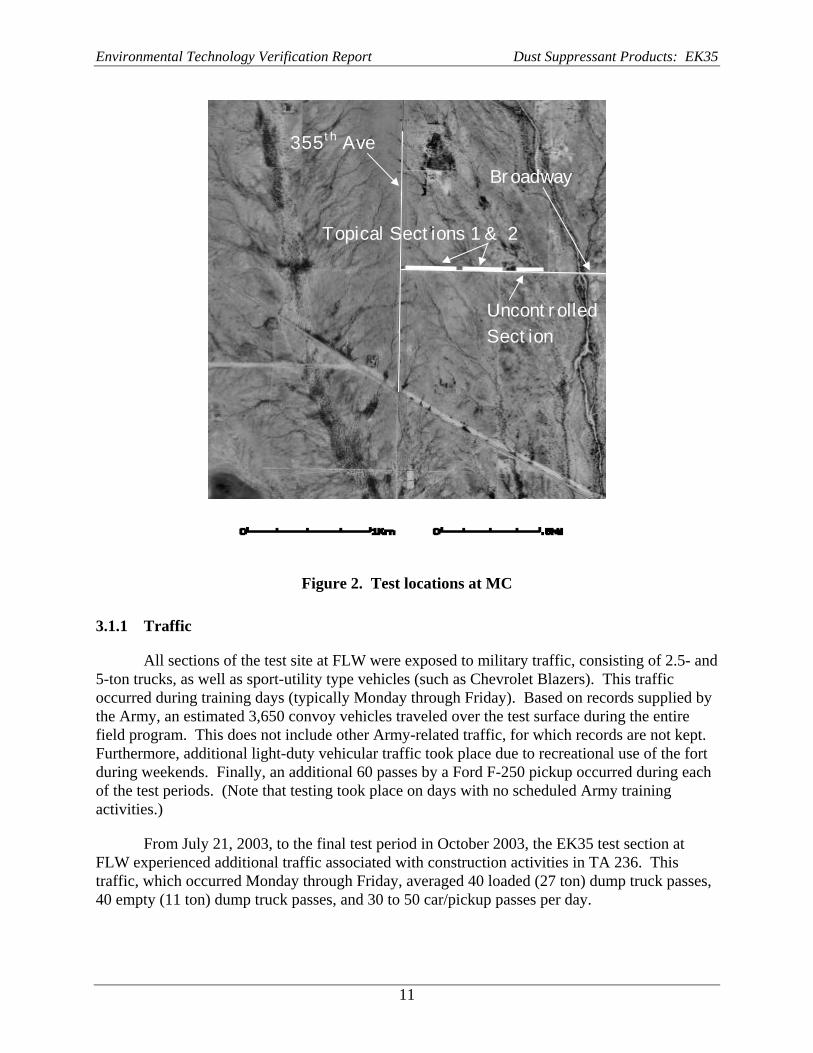
The other host facility for the field test program, MC, is located on Broadway Road (a county road) near the towns of Buckeye and Wintersburg, Arizona. The sections used for dust suppressant testing were on portions of the road constructed of shale. The road typically experiences approximately 150 vehicle passes per day, with the majority of passes by light-duty cars and trucks. Much of the traffic appears to be associated with local residents commuting to their workplaces and thus occurs during the early morning and late afternoon hours. Test sections were located on Broadway Road east of 355thAvenue. EK35 was evaluated on the section farther east of 355th Avenue. The uncontrolled measurements were conducted on a separate section of Broadway Road. Figure 2 shows the test locations at MC.4
9
Environmental Technology Verification Report Dust Suppressant Products: EK35
Figure 1. Test locations at FLW
10
Environmental Technology Verification Report Dust Suppressant Products: EK35
Broadway
Topical Sections 1 & 2
Uncontrolled Section
355th Ave
Figure 2. Test locations at MC
3.1.1 Traffic
All sections of the test site at FLW were exposed to military traffic, consisting of 2.5- and 5-ton trucks, as well as sport-utility type vehicles (such as Chevrolet Blazers). This traffic occurred during training days (typically Monday through Friday). Based on records supplied by the Army, an estimated 3,650 convoy vehicles traveled over the test surface during the entire field program. This does not include other Army-related traffic, for which records are not kept. Furthermore, additional light-duty vehicular traffic took place due to recreational use of the fort during weekends. Finally, an additional 60 passes by a Ford F-250 pickup occurred during each of the test periods. (Note that testing took place on days with no scheduled Army training activities.)
From July 21, 2003, to the final test period in October 2003, the EK35 test section at FLW experienced additional traffic associated with construction activities in TA 236. This traffic, which occurred Monday through Friday, averaged 40 loaded (27 ton) dump truck passes, 40 empty (11 ton) dump truck passes, and 30 to 50 car/pickup passes per day.
11
Environmental Technology Verification Report Dust Suppressant Products: EK35
The Arizona test section was exposed to the naturally occurring traffic along Broadway Road in MC. Traffic consisted mostly of light-duty vehicles such as cars and pickups, with a few passes by school buses during weekdays. Based on the county’s plans to pave the road in the future, an approximate value of 200 ADT can be applied to the test section. (The ADT level was measured at 247 in March 2004, approximately 7 months after the conclusion of the field measurements.) An additional 60 to 120 passes by a Ford F-150 pickup occurred during each of the test periods.
3.1.2 Area Climatic Conditions
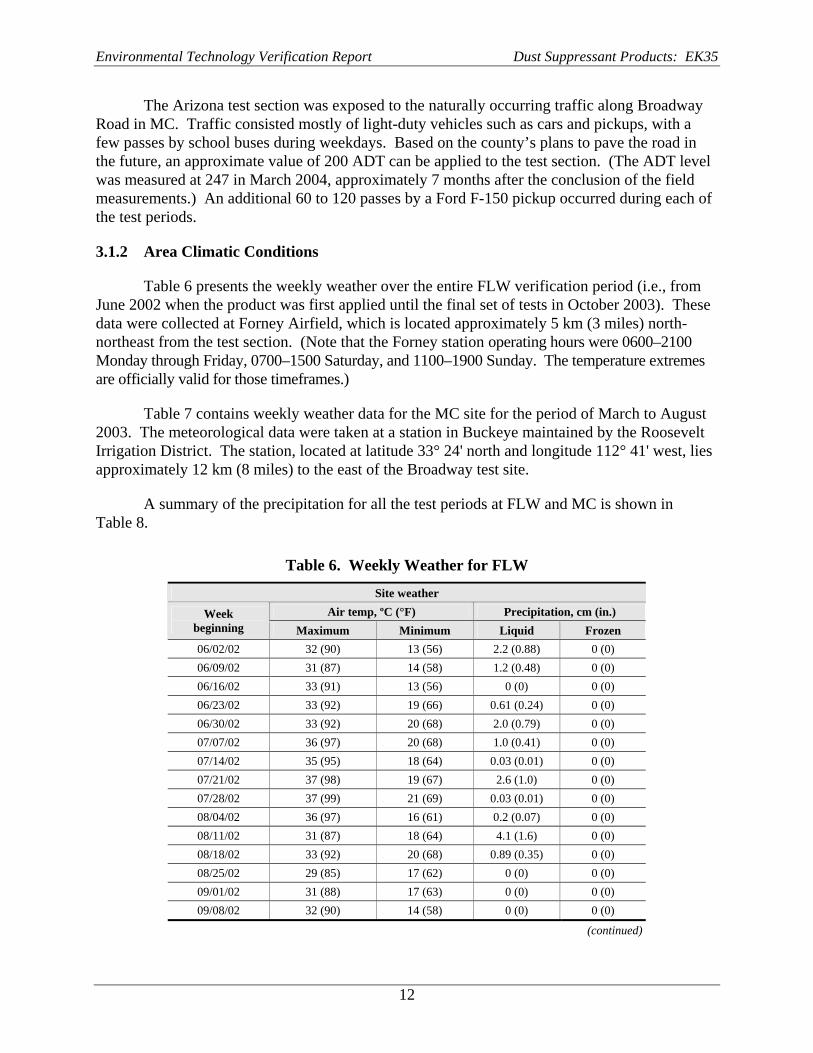
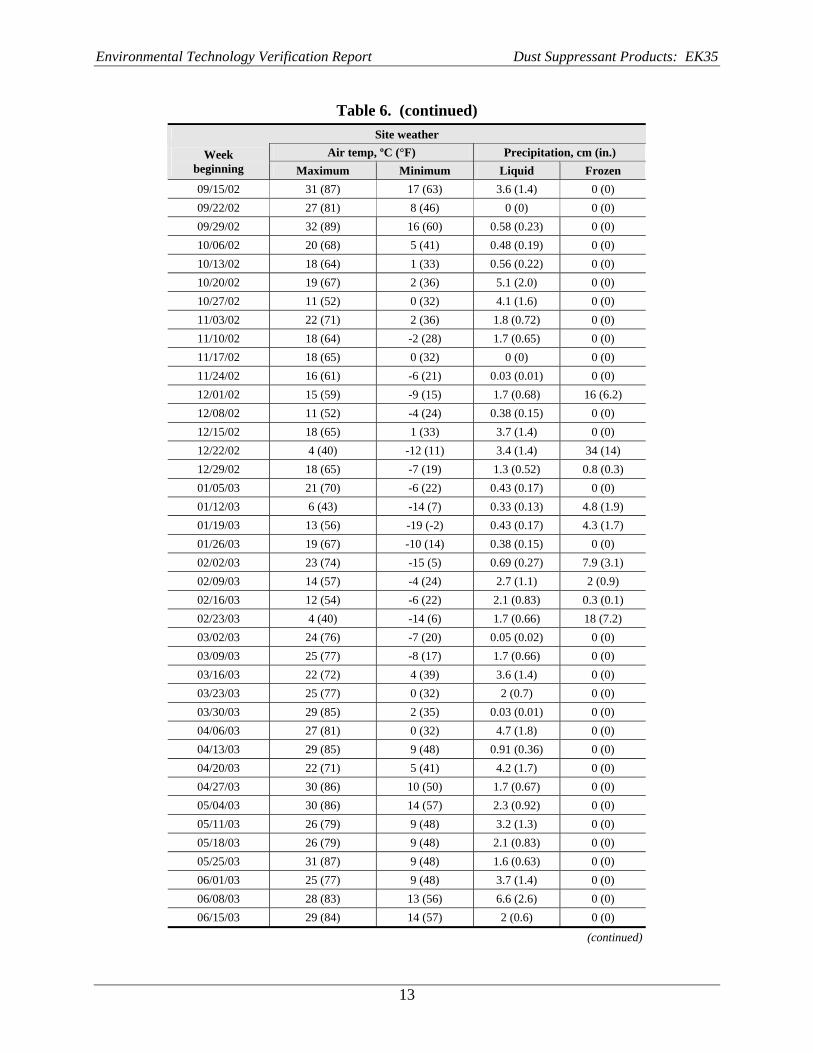
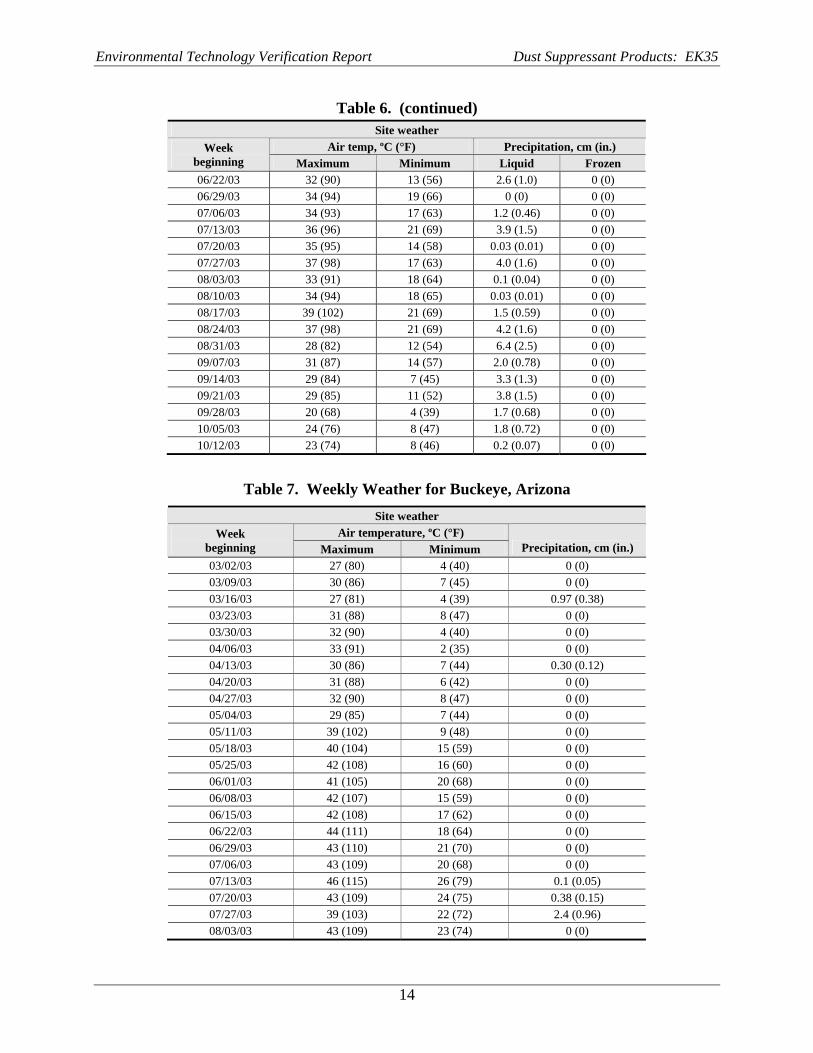
Table 6 presents the weekly weather over the entire FLW verification period (i.e., from June 2002 when the product was first applied until the final set of tests in October 2003). These data were collected at Forney Airfield, which is located approximately 5 km (3 miles) north-northeast from the test section. (Note that the Forney station operating hours were 0600–2100 Monday through Friday, 0700–1500 Saturday, and 1100–1900 Sunday. The temperature extremes are officially valid for those timeframes.)
Table 7 contains weekly weather data for the MC site for the period of March to August 2003. The meteorological data were taken at a station in Buckeye maintained by the Roosevelt Irrigation District. The station, located at latitude 33° 24' north and longitude 112° 41' west, lies approximately 12 km (8 miles) to the east of the Broadway test site.
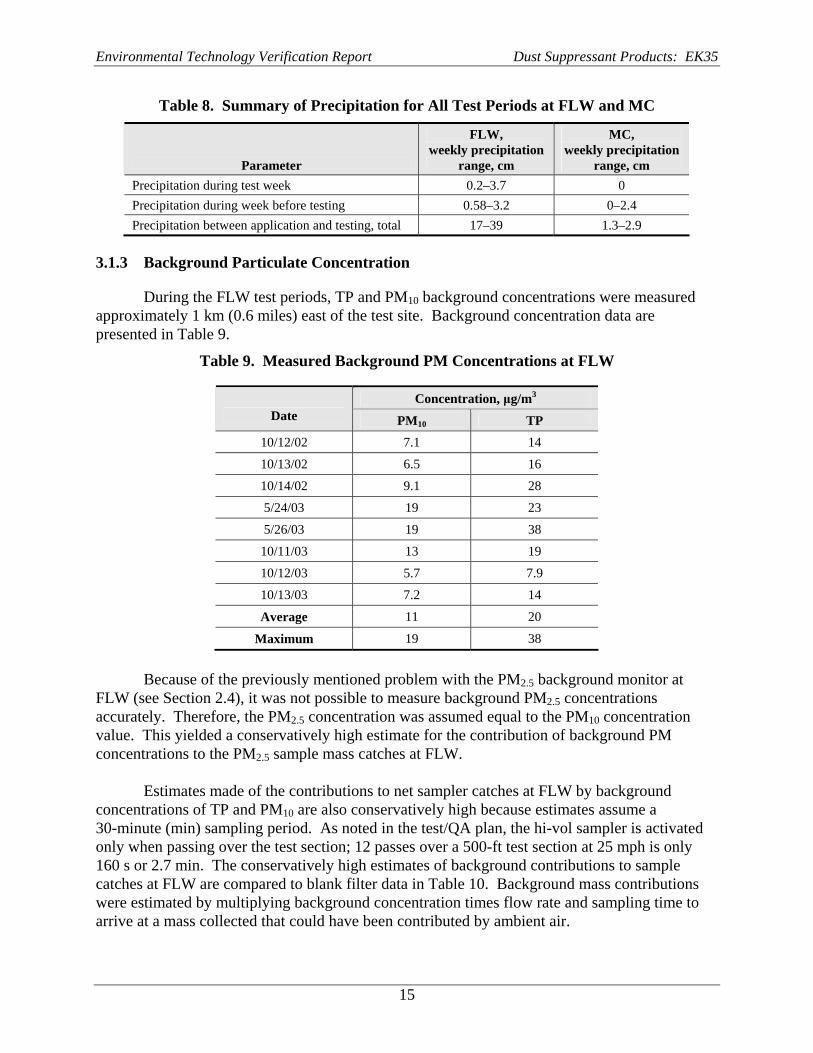
A summary of the precipitation for all the test periods at FLW and MC is shown in Table 8.
Table 6. Weekly Weather for FLW
Site weather Air temp, ºC (°F) Precipitation, cm (in.) Week
beginning Maximum Minimum Liquid Frozen 06/02/02 32 (90) 13 (56) 2.2 (0.88) 0 (0) 06/09/02 31 (87) 14 (58) 1.2 (0.48) 0 (0) 06/16/02 33 (91) 13 (56) 0 (0) 0 (0) 06/23/02 33 (92) 19 (66) 0.61 (0.24) 0 (0) 06/30/02 33 (92) 20 (68) 2.0 (0.79) 0 (0) 07/07/02 36 (97) 20 (68) 1.0 (0.41) 0 (0) 07/14/02 35 (95) 18 (64) 0.03 (0.01) 0 (0) 07/21/02 37 (98) 19 (67) 2.6 (1.0) 0 (0) 07/28/02 37 (99) 21 (69) 0.03 (0.01) 0 (0) 08/04/02 36 (97) 16 (61) 0.2 (0.07) 0 (0) 08/11/02 31 (87) 18 (64) 4.1 (1.6) 0 (0) 08/18/02 33 (92) 20 (68) 0.89 (0.35) 0 (0) 08/25/02 29 (85) 17 (62) 0 (0) 0 (0) 09/01/02 31 (88) 17 (63) 0 (0) 0 (0) 09/08/02 32 (90) 14 (58) 0 (0) 0 (0)
(continued)
12
Environmental Technology Verification Report Dust Suppressant Products: EK35
Table 6. (continued) Site weather
Air temp, ºC (°F) Precipitation, cm (in.) Week beginning Maximum Minimum Liquid Frozen 09/15/02 31 (87) 17 (63) 3.6 (1.4) 0 (0) 09/22/02 27 (81) 8 (46) 0 (0) 0 (0) 09/29/02 32 (89) 16 (60) 0.58 (0.23) 0 (0) 10/06/02 20 (68) 5 (41) 0.48 (0.19) 0 (0) 10/13/02 18 (64) 1 (33) 0.56 (0.22) 0 (0) 10/20/02 19 (67) 2 (36) 5.1 (2.0) 0 (0) 10/27/02 11 (52) 0 (32) 4.1 (1.6) 0 (0) 11/03/02 22 (71) 2 (36) 1.8 (0.72) 0 (0) 11/10/02 18 (64) -2 (28) 1.7 (0.65) 0 (0) 11/17/02 18 (65) 0 (32) 0 (0) 0 (0) 11/24/02 16 (61) -6 (21) 0.03 (0.01) 0 (0) 12/01/02 15 (59) -9 (15) 1.7 (0.68) 16 (6.2) 12/08/02 11 (52) -4 (24) 0.38 (0.15) 0 (0) 12/15/02 18 (65) 1 (33) 3.7 (1.4) 0 (0) 12/22/02 4 (40) -12 (11) 3.4 (1.4) 34 (14) 12/29/02 18 (65) -7 (19) 1.3 (0.52) 0.8 (0.3) 01/05/03 21 (70) -6 (22) 0.43 (0.17) 0 (0) 01/12/03 6 (43) -14 (7) 0.33 (0.13) 4.8 (1.9) 01/19/03 13 (56) -19 (-2) 0.43 (0.17) 4.3 (1.7) 01/26/03 19 (67) -10 (14) 0.38 (0.15) 0 (0) 02/02/03 23 (74) -15 (5) 0.69 (0.27) 7.9 (3.1) 02/09/03 14 (57) -4 (24) 2.7 (1.1) 2 (0.9) 02/16/03 12 (54) -6 (22) 2.1 (0.83) 0.3 (0.1) 02/23/03 4 (40) -14 (6) 1.7 (0.66) 18 (7.2) 03/02/03 24 (76) -7 (20) 0.05 (0.02) 0 (0) 03/09/03 25 (77) -8 (17) 1.7 (0.66) 0 (0) 03/16/03 22 (72) 4 (39) 3.6 (1.4) 0 (0) 03/23/03 25 (77) 0 (32) 2 (0.7) 0 (0) 03/30/03 29 (85) 2 (35) 0.03 (0.01) 0 (0) 04/06/03 27 (81) 0 (32) 4.7 (1.8) 0 (0) 04/13/03 29 (85) 9 (48) 0.91 (0.36) 0 (0) 04/20/03 22 (71) 5 (41) 4.2 (1.7) 0 (0) 04/27/03 30 (86) 10 (50) 1.7 (0.67) 0 (0) 05/04/03 30 (86) 14 (57) 2.3 (0.92) 0 (0) 05/11/03 26 (79) 9 (48) 3.2 (1.3) 0 (0) 05/18/03 26 (79) 9 (48) 2.1 (0.83) 0 (0) 05/25/03 31 (87) 9 (48) 1.6 (0.63) 0 (0) 06/01/03 25 (77) 9 (48) 3.7 (1.4) 0 (0) 06/08/03 28 (83) 13 (56) 6.6 (2.6) 0 (0) 06/15/03 29 (84) 14 (57) 2 (0.6) 0 (0)
(continued)
13
Environmental Technology Verification Report Dust Suppressant Products: EK35
Table 6. (continued) Site weather
Air temp, ºC (°F) Precipitation, cm (in.) Week beginning Maximum Minimum Liquid Frozen 06/22/03 32 (90) 13 (56) 2.6 (1.0) 0 (0) 06/29/03 34 (94) 19 (66) 0 (0) 0 (0) 07/06/03 34 (93) 17 (63) 1.2 (0.46) 0 (0) 07/13/03 36 (96) 21 (69) 3.9 (1.5) 0 (0) 07/20/03 35 (95) 14 (58) 0.03 (0.01) 0 (0) 07/27/03 37 (98) 17 (63) 4.0 (1.6) 0 (0) 08/03/03 33 (91) 18 (64) 0.1 (0.04) 0 (0) 08/10/03 34 (94) 18 (65) 0.03 (0.01) 0 (0) 08/17/03 39 (102) 21 (69) 1.5 (0.59) 0 (0) 08/24/03 37 (98) 21 (69) 4.2 (1.6) 0 (0) 08/31/03 28 (82) 12 (54) 6.4 (2.5) 0 (0) 09/07/03 31 (87) 14 (57) 2.0 (0.78) 0 (0) 09/14/03 29 (84) 7 (45) 3.3 (1.3) 0 (0) 09/21/03 29 (85) 11 (52) 3.8 (1.5) 0 (0) 09/28/03 20 (68) 4 (39) 1.7 (0.68) 0 (0) 10/05/03 24 (76) 8 (47) 1.8 (0.72) 0 (0) 10/12/03 23 (74) 8 (46) 0.2 (0.07) 0 (0)
Table 7. Weekly Weather for Buckeye, Arizona Site weather
Air temperature, ºC (°F) Week beginning Maximum Minimum Precipitation, cm (in.) 03/02/03 27 (80) 4 (40) 0 (0) 03/09/03 30 (86) 7 (45) 0 (0) 03/16/03 27 (81) 4 (39) 0.97 (0.38) 03/23/03 31 (88) 8 (47) 0 (0) 03/30/03 32 (90) 4 (40) 0 (0) 04/06/03 33 (91) 2 (35) 0 (0) 04/13/03 30 (86) 7 (44) 0.30 (0.12) 04/20/03 31 (88) 6 (42) 0 (0) 04/27/03 32 (90) 8 (47) 0 (0) 05/04/03 29 (85) 7 (44) 0 (0) 05/11/03 39 (102) 9 (48) 0 (0) 05/18/03 40 (104) 15 (59) 0 (0) 05/25/03 42 (108) 16 (60) 0 (0) 06/01/03 41 (105) 20 (68) 0 (0) 06/08/03 42 (107) 15 (59) 0 (0) 06/15/03 42 (108) 17 (62) 0 (0) 06/22/03 44 (111) 18 (64) 0 (0) 06/29/03 43 (110) 21 (70) 0 (0) 07/06/03 43 (109) 20 (68) 0 (0) 07/13/03 46 (115) 26 (79) 0.1 (0.05) 07/20/03 43 (109) 24 (75) 0.38 (0.15) 07/27/03 39 (103) 22 (72) 2.4 (0.96) 08/03/03 43 (109) 23 (74) 0 (0)
14
Environmental Technology Verification Report Dust Suppressant Products: EK35
Table 8. Summary of Precipitation for All Test Periods at FLW and MC
Parameter
FLW, weekly precipitation
range, cm
MC, weekly precipitation
range, cm Precipitation during test week 0.2–3.7 0 Precipitation during week before testing 0.58–3.2 0–2.4 Precipitation between application and testing, total 17–39 1.3–2.9
3.1.3 Background Particulate Concentration
During the FLW test periods, TP and PM10 background concentrations were measured approximately 1 km (0.6 miles) east of the test site. Background concentration data are presented in Table 9.
Table 9. Measured Background PM Concentrations at FLW
Date Concentration, μg/m3
PM10 TP 10/12/02 7.1 14
10/13/02 6.5 16
10/14/02 9.1 28
5/24/03 19 23
5/26/03 19 38
10/11/03 13 19
10/12/03 5.7 7.9
10/13/03 7.2 14
Average 11 20
Maximum 19 38
Because of the previously mentioned problem with the PM2.5 background monitor at FLW (see Section 2.4), it was not possible to measure background PM2.5 concentrations accurately. Therefore, the PM2.5 concentration was assumed equal to the PM10 concentration value. This yielded a conservatively high estimate for the contribution of background PM concentrations to the PM2.5 sample mass catches at FLW.
Estimates made of the contributions to net sampler catches at FLW by background concentrations of TP and PM10 are also conservatively high because estimates assume a 30-minute (min) sampling period. As noted in the test/QA plan, the hi-vol sampler is activated only when passing over the test section; 12 passes over a 500-ft test section at 25 mph is only 160 s or 2.7 min. The conservatively high estimates of background contributions to sample catches at FLW are compared to blank filter data in Table 10. Background mass contributions were estimated by multiplying background concentration times flow rate and sampling time to arrive at a mass collected that could have been contributed by ambient air.
15
Environmental Technology Verification Report Dust Suppressant Products: EK35
Table 10. Estimated Background Contribution to Sampler Catch at FLW Compared to Mean Blank Filter Data
Weight, mg TP PM10 PM2.5
Average estimated background contribution 0.67 0.37 0.0055 Average blank filter weight 2.5 2.2 0.029
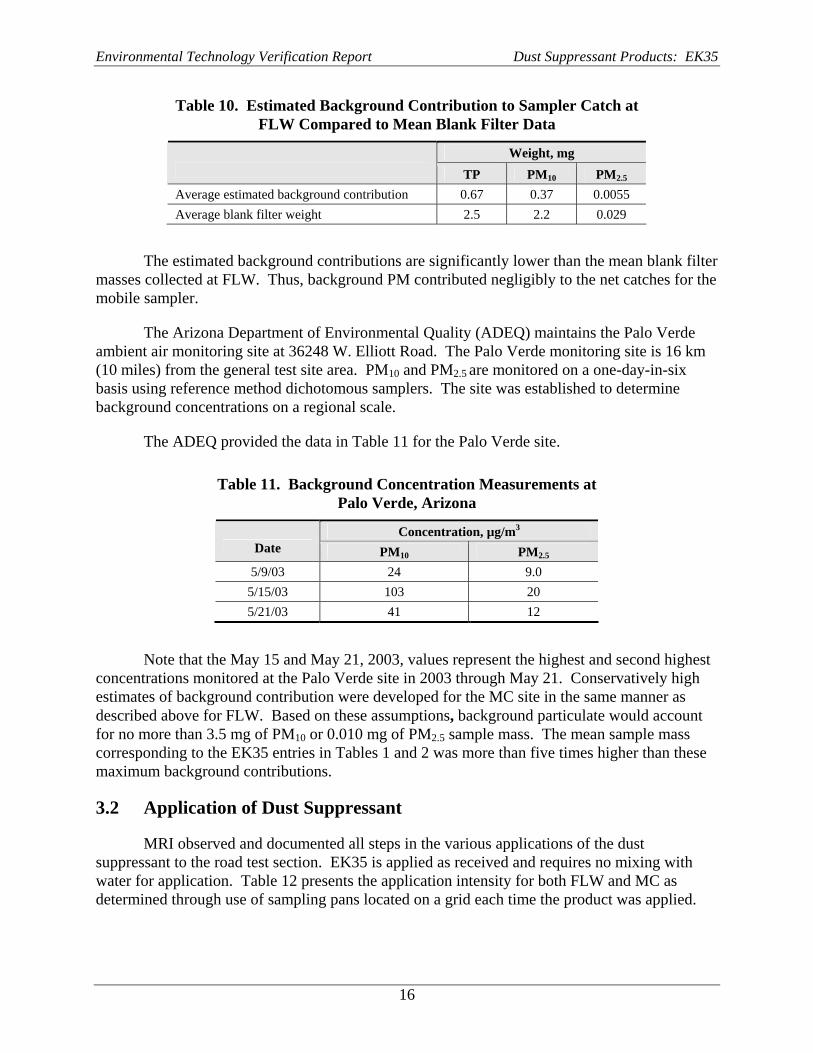
The estimated background contributions are significantly lower than the mean blank filter masses collected at FLW. Thus, background PM contributed negligibly to the net catches for the mobile sampler.
The Arizona Department of Environmental Quality (ADEQ) maintains the Palo Verde ambient air monitoring site at 36248 W. Elliott Road. The Palo Verde monitoring site is 16 km (10 miles) from the general test site area. PM10 and PM2.5 are monitored on a one-day-in-six basis using reference method dichotomous samplers. The site was established to determine background concentrations on a regional scale.
The ADEQ provided the data in Table 11 for the Palo Verde site.
Table 11. Background Concentration Measurements at Palo Verde, Arizona
Date Concentration, µg/m3
PM10 PM2.5
5/9/03 24 9.0 5/15/03 103 20 5/21/03 41 12
Note that the May 15 and May 21, 2003, values represent the highest and second highest concentrations monitored at the Palo Verde site in 2003 through May 21. Conservatively high estimates of background contribution were developed for the MC site in the same manner as described above for FLW. Based on these assumptions, background particulate would account for no more than 3.5 mg of PM10 or 0.010 mg of PM2.5 sample mass. The mean sample mass corresponding to the EK35 entries in Tables 1 and 2 was more than five times higher than these maximum background contributions.
3.2 Application of Dust Suppressant
MRI observed and documented all steps in the various applications of the dust suppressant to the road test section. EK35 is applied as received and requires no mixing with water for application. Table 12 presents the application intensity for both FLW and MC as determined through use of sampling pans located on a grid each time the product was applied.
16
Environmental Technology Verification Report Dust Suppressant Products: EK35
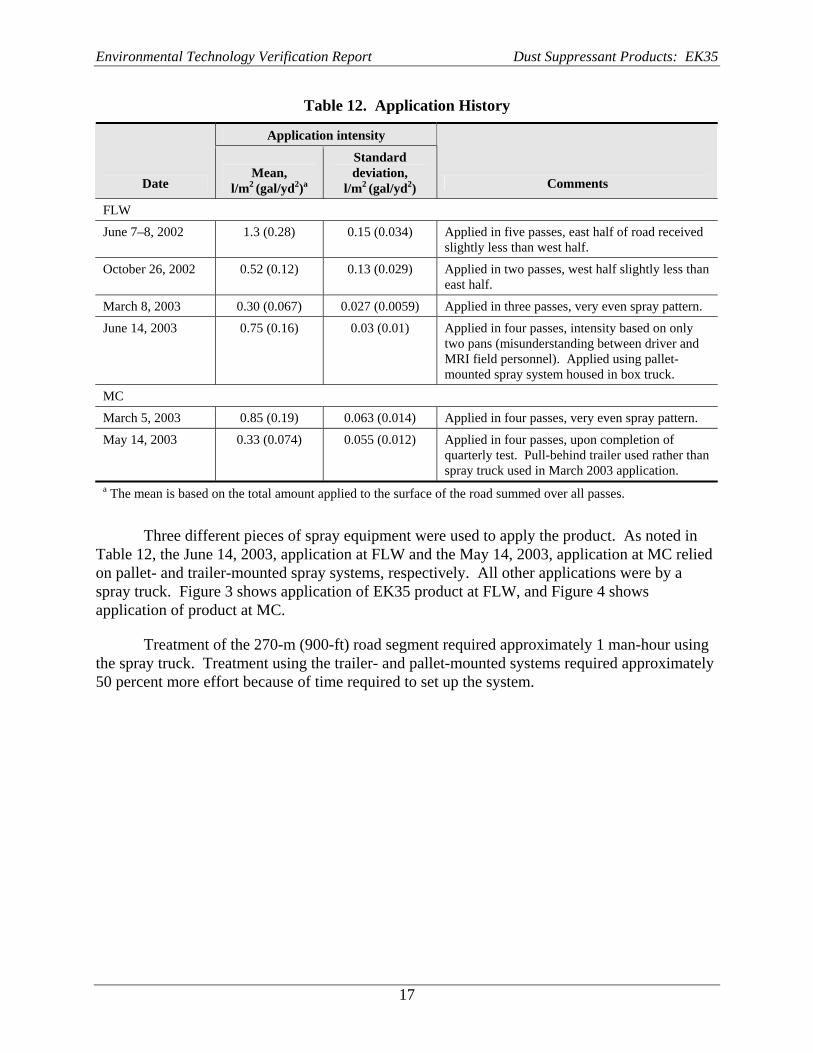
Table 12. Application History
Date
Application intensity
CommentsMean,
l/m2 (gal/yd2)a
Standard deviation,
l/m2 (gal/yd2) FLW
June 7–8, 2002 1.3 (0.28) 0.15 (0.034) Applied in five passes, east half of road received slightly less than west half.
October 26, 2002 0.52 (0.12) 0.13 (0.029) Applied in two passes, west half slightly less than east half.
March 8, 2003 0.30 (0.067) 0.027 (0.0059) Applied in three passes, very even spray pattern.
June 14, 2003 0.75 (0.16) 0.03 (0.01) Applied in four passes, intensity based on only two pans (misunderstanding between driver and MRI field personnel). Applied using pallet-mounted spray system housed in box truck.
MC
March 5, 2003 0.85 (0.19) 0.063 (0.014) Applied in four passes, very even spray pattern.
May 14, 2003 0.33 (0.074) 0.055 (0.012) Applied in four passes, upon completion of quarterly test. Pull-behind trailer used rather than spray truck used in March 2003 application.
a The mean is based on the total amount applied to the surface of the road summed over all passes.
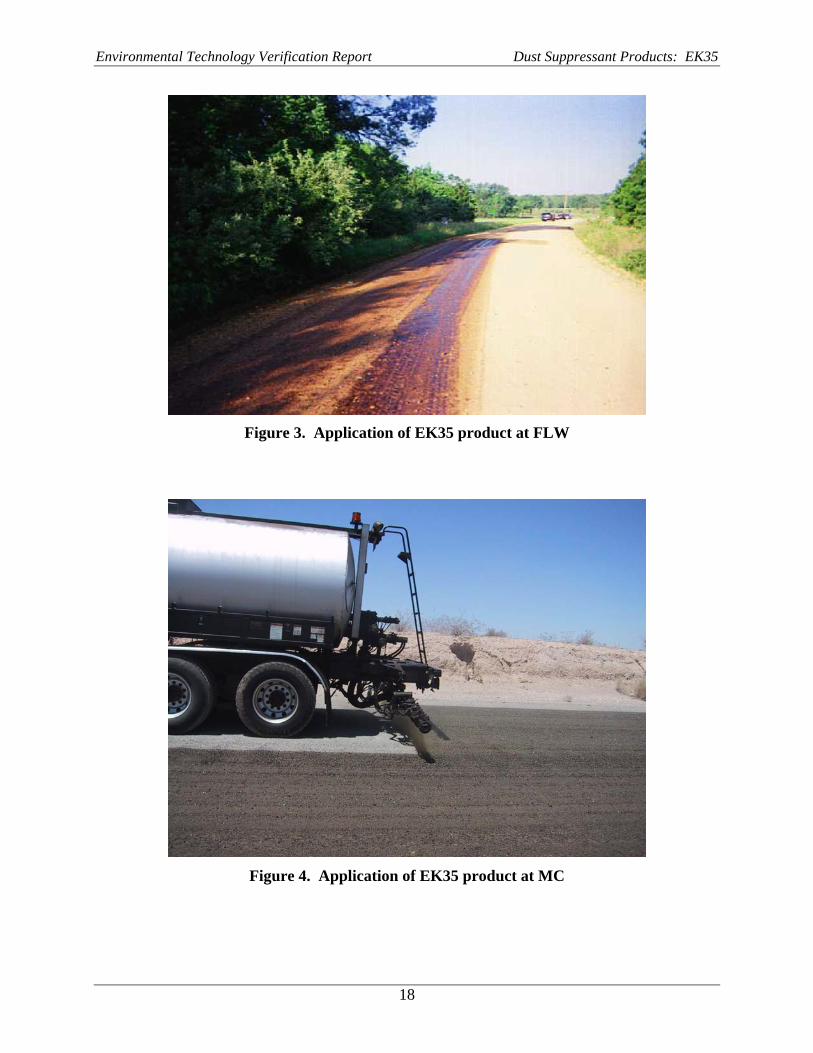
Three different pieces of spray equipment were used to apply the product. As noted in Table 12, the June 14, 2003, application at FLW and the May 14, 2003, application at MC relied on pallet- and trailer-mounted spray systems, respectively. All other applications were by a spray truck. Figure 3 shows application of EK35 product at FLW, and Figure 4 shows application of product at MC.
Treatment of the 270-m (900-ft) road segment required approximately 1 man-hour using the spray truck. Treatment using the trailer- and pallet-mounted systems required approximately 50 percent more effort because of time required to set up the system.
17
Environmental Technology Verification Report Dust Suppressant Products: EK35
Figure 3. Application of EK35 product at FLW
Figure 4. Application of EK35 product at MC
18
Environmental Technology Verification Report Dust Suppressant Products: EK35
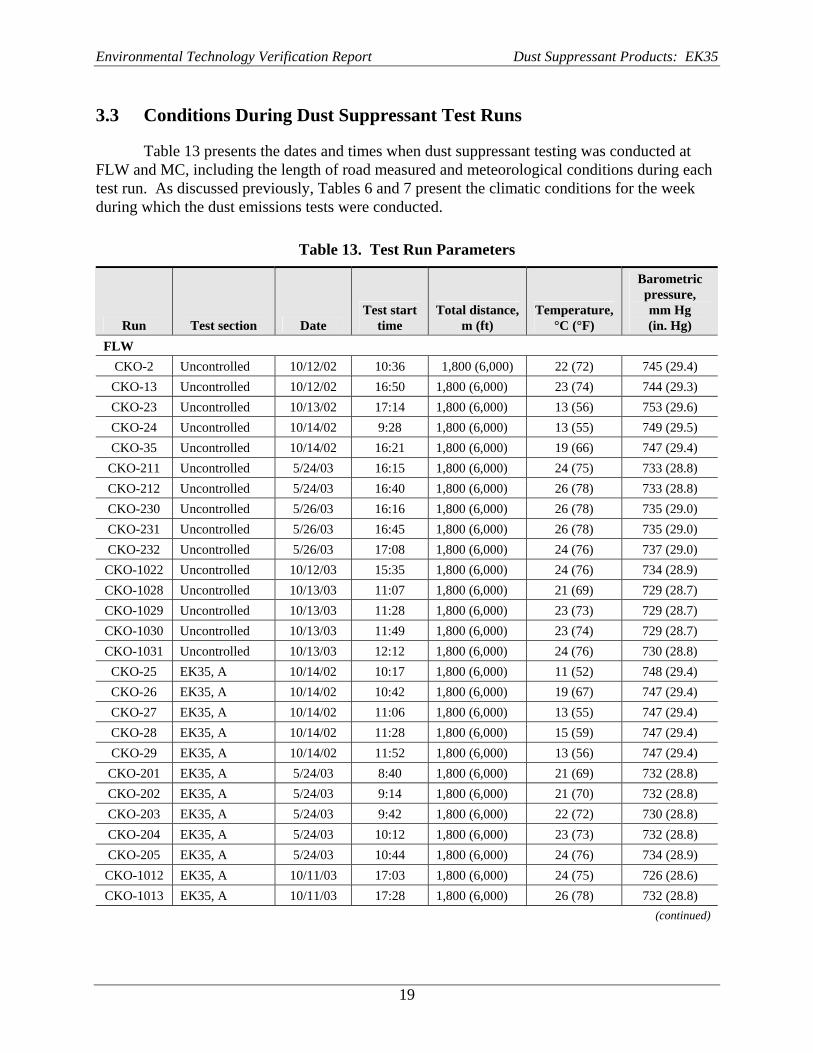
3.3 Conditions During Dust Suppressant Test Runs
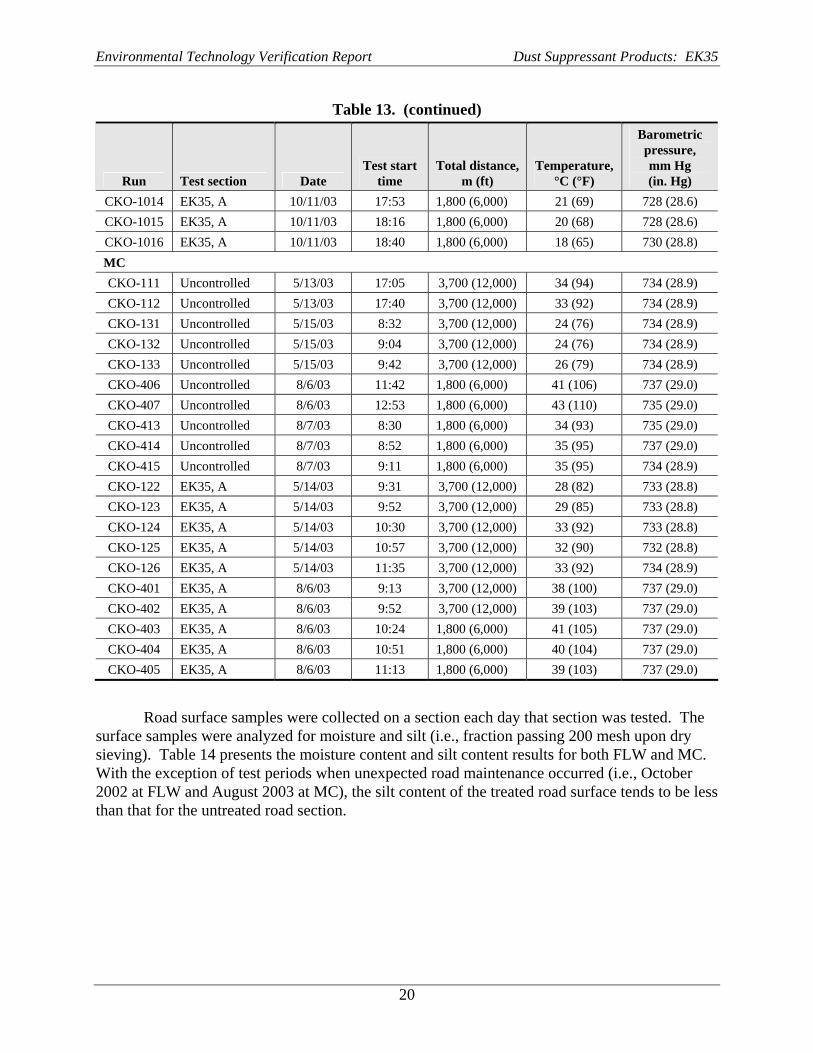
Table 13 presents the dates and times when dust suppressant testing was conducted at FLW and MC, including the length of road measured and meteorological conditions during each test run. As discussed previously, Tables 6 and 7 present the climatic conditions for the week during which the dust emissions tests were conducted.
Table 13. Test Run Parameters
Run Test section Date Test start
time Total distance,
m (ft) Temperature,
°C (°F)
Barometric pressure, mm Hg (in. Hg)
FLW CKO-2 Uncontrolled 10/12/02 10:36 1,800 (6,000) 22 (72) 745 (29.4) CKO-13 Uncontrolled 10/12/02 16:50 1,800 (6,000) 23 (74) 744 (29.3) CKO-23 Uncontrolled 10/13/02 17:14 1,800 (6,000) 13 (56) 753 (29.6) CKO-24 Uncontrolled 10/14/02 9:28 1,800 (6,000) 13 (55) 749 (29.5) CKO-35 Uncontrolled 10/14/02 16:21 1,800 (6,000) 19 (66) 747 (29.4)
CKO-211 Uncontrolled 5/24/03 16:15 1,800 (6,000) 24 (75) 733 (28.8) CKO-212 Uncontrolled 5/24/03 16:40 1,800 (6,000) 26 (78) 733 (28.8) CKO-230 Uncontrolled 5/26/03 16:16 1,800 (6,000) 26 (78) 735 (29.0) CKO-231 Uncontrolled 5/26/03 16:45 1,800 (6,000) 26 (78) 735 (29.0) CKO-232 Uncontrolled 5/26/03 17:08 1,800 (6,000) 24 (76) 737 (29.0) CKO-1022 Uncontrolled 10/12/03 15:35 1,800 (6,000) 24 (76) 734 (28.9) CKO-1028 Uncontrolled 10/13/03 11:07 1,800 (6,000) 21 (69) 729 (28.7) CKO-1029 Uncontrolled 10/13/03 11:28 1,800 (6,000) 23 (73) 729 (28.7) CKO-1030 Uncontrolled 10/13/03 11:49 1,800 (6,000) 23 (74) 729 (28.7) CKO-1031 Uncontrolled 10/13/03 12:12 1,800 (6,000) 24 (76) 730 (28.8) CKO-25 EK35, A 10/14/02 10:17 1,800 (6,000) 11 (52) 748 (29.4) CKO-26 EK35, A 10/14/02 10:42 1,800 (6,000) 19 (67) 747 (29.4) CKO-27 EK35, A 10/14/02 11:06 1,800 (6,000) 13 (55) 747 (29.4) CKO-28 EK35, A 10/14/02 11:28 1,800 (6,000) 15 (59) 747 (29.4) CKO-29 EK35, A 10/14/02 11:52 1,800 (6,000) 13 (56) 747 (29.4)
CKO-201 EK35, A 5/24/03 8:40 1,800 (6,000) 21 (69) 732 (28.8) CKO-202 EK35, A 5/24/03 9:14 1,800 (6,000) 21 (70) 732 (28.8) CKO-203 EK35, A 5/24/03 9:42 1,800 (6,000) 22 (72) 730 (28.8) CKO-204 EK35, A 5/24/03 10:12 1,800 (6,000) 23 (73) 732 (28.8) CKO-205 EK35, A 5/24/03 10:44 1,800 (6,000) 24 (76) 734 (28.9) CKO-1012 EK35, A 10/11/03 17:03 1,800 (6,000) 24 (75) 726 (28.6) CKO-1013 EK35, A 10/11/03 17:28 1,800 (6,000) 26 (78) 732 (28.8)
(continued)
19
Environmental Technology Verification Report Dust Suppressant Products: EK35
Table 13. (continued)
Run Test section Date Test start
time Total distance,
m (ft) Temperature,
°C (°F)
Barometric pressure, mm Hg (in. Hg)
CKO-1014 EK35, A 10/11/03 17:53 1,800 (6,000) 21 (69) 728 (28.6) CKO-1015 EK35, A 10/11/03 18:16 1,800 (6,000) 20 (68) 728 (28.6) CKO-1016 EK35, A 10/11/03 18:40 1,800 (6,000) 18 (65) 730 (28.8) MC CKO-111 Uncontrolled 5/13/03 17:05 3,700 (12,000) 34 (94) 734 (28.9) CKO-112 Uncontrolled 5/13/03 17:40 3,700 (12,000) 33 (92) 734 (28.9) CKO-131 Uncontrolled 5/15/03 8:32 3,700 (12,000) 24 (76) 734 (28.9) CKO-132 Uncontrolled 5/15/03 9:04 3,700 (12,000) 24 (76) 734 (28.9) CKO-133 Uncontrolled 5/15/03 9:42 3,700 (12,000) 26 (79) 734 (28.9) CKO-406 Uncontrolled 8/6/03 11:42 1,800 (6,000) 41 (106) 737 (29.0) CKO-407 Uncontrolled 8/6/03 12:53 1,800 (6,000) 43 (110) 735 (29.0) CKO-413 Uncontrolled 8/7/03 8:30 1,800 (6,000) 34 (93) 735 (29.0) CKO-414 Uncontrolled 8/7/03 8:52 1,800 (6,000) 35 (95) 737 (29.0) CKO-415 Uncontrolled 8/7/03 9:11 1,800 (6,000) 35 (95) 734 (28.9) CKO-122 EK35, A 5/14/03 9:31 3,700 (12,000) 28 (82) 733 (28.8) CKO-123 EK35, A 5/14/03 9:52 3,700 (12,000) 29 (85) 733 (28.8) CKO-124 EK35, A 5/14/03 10:30 3,700 (12,000) 33 (92) 733 (28.8) CKO-125 EK35, A 5/14/03 10:57 3,700 (12,000) 32 (90) 732 (28.8) CKO-126 EK35, A 5/14/03 11:35 3,700 (12,000) 33 (92) 734 (28.9) CKO-401 EK35, A 8/6/03 9:13 3,700 (12,000) 38 (100) 737 (29.0) CKO-402 EK35, A 8/6/03 9:52 3,700 (12,000) 39 (103) 737 (29.0) CKO-403 EK35, A 8/6/03 10:24 1,800 (6,000) 41 (105) 737 (29.0) CKO-404 EK35, A 8/6/03 10:51 1,800 (6,000) 40 (104) 737 (29.0) CKO-405 EK35, A 8/6/03 11:13 1,800 (6,000) 39 (103) 737 (29.0)
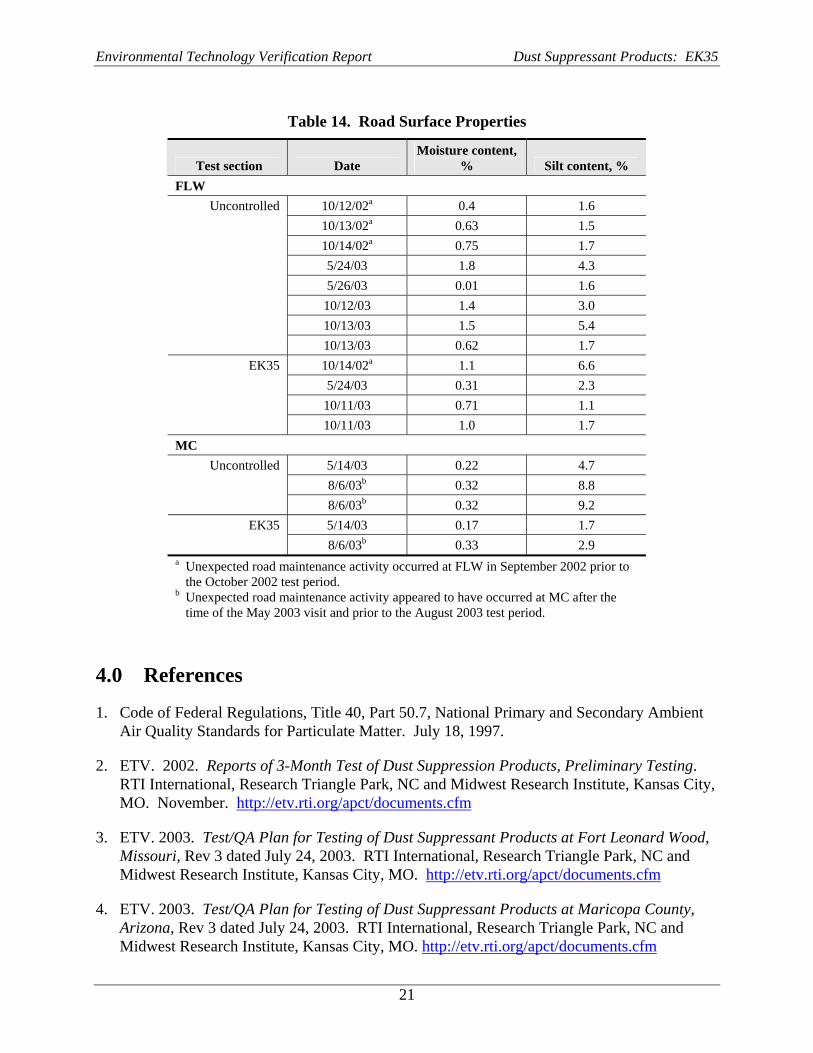
Road surface samples were collected on a section each day that section was tested. The surface samples were analyzed for moisture and silt (i.e., fraction passing 200 mesh upon dry sieving). Table 14 presents the moisture content and silt content results for both FLW and MC. With the exception of test periods when unexpected road maintenance occurred (i.e., October 2002 at FLW and August 2003 at MC), the silt content of the treated road surface tends to be less than that for the untreated road section.
20
Environmental Technology Verification Report Dust Suppressant Products: EK35
Table 14. Road Surface Properties
Test section Date Moisture content,
% Silt content, % FLW
Uncontrolled 10/12/02a 0.4 1.6 10/13/02a 0.63 1.5 10/14/02a 0.75 1.7 5/24/03 1.8 4.3 5/26/03 0.01 1.6 10/12/03 1.4 3.0 10/13/03 1.5 5.4 10/13/03 0.62 1.7
EK35 10/14/02a 1.1 6.6 5/24/03 0.31 2.3 10/11/03 0.71 1.1 10/11/03 1.0 1.7
MC Uncontrolled 5/14/03 0.22 4.7
8/6/03b 0.32 8.8 8/6/03b 0.32 9.2
EK35 5/14/03 0.17 1.7 8/6/03b 0.33 2.9
a Unexpected road maintenance activity occurred at FLW in September 2002 prior to the October 2002 test period.
b Unexpected road maintenance activity appeared to have occurred at MC after the time of the May 2003 visit and prior to the August 2003 test period.
4.0 References
1. Code of Federal Regulations, Title 40, Part 50.7, National Primary and Secondary Ambient Air Quality Standards for Particulate Matter. July 18, 1997.
2. ETV. 2002. Reports of 3-Month Test of Dust Suppression Products, Preliminary Testing. RTI International, Research Triangle Park, NC and Midwest Research Institute, Kansas City, MO. November. http://etv.rti.org/apct/documents.cfm
3. ETV. 2003. Test/QA Plan for Testing of Dust Suppressant Products at Fort Leonard Wood, Missouri, Rev 3 dated July 24, 2003. RTI International, Research Triangle Park, NC and Midwest Research Institute, Kansas City, MO. http://etv.rti.org/apct/documents.cfm
4. ETV. 2003. Test/QA Plan for Testing of Dust Suppressant Products at Maricopa County, Arizona, Rev 3 dated July 24, 2003. RTI International, Research Triangle Park, NC and Midwest Research Institute, Kansas City, MO. http://etv.rti.org/apct/documents.cfm
21
Environmental Technology Verification Report Dust Suppressant Products: EK35
5. MRI. 2005. Test Report for EK35, Section A at Fort Leonard Wood, Missouri, and East Section at Maricopa County, Arizona. Midwest Research Institute, Kansas City, MO. Report may be obtained from RTI International.
6. MRI. 2005. Audit of Data from Testing of Dust Suppressant Products at Fort Leonard Wood, Missouri and Maricopa County, Arizona. Midwest Research Institute, Kansas City, MO. Report may be obtained from RTI International.
7. U.S. EPA (Environmental Protection Agency). 2000. Test Method 24, Determination of Volatile Matter Content, Water Content, Density, Volume Solids, and Weight Solids of Surface Coatings. Office of Solid Waste. Washington, DC.
8. U.S. EPA (Environmental Protection Agency). 2000. Test Method 405.1, Standard Operating Procedure for the Analysis of Biochemical Oxygen Demand in Water. Region 5. Chicago, IL.
9. U.S. EPA (Environmental Protection Agency). 1993. Methods for Chemical Analysis of Water and Wastes. EPA/600/4-79/020. Cincinnati, OH. (Includes EPA Method 410.4, Chemical Oxygen Demand.)
10. U.S. EPA (Environmental Protection Agency). 1998. SW-846, Test Methods for Evaluating Solid Waste, Physical/Chemical Methods. Office of Solid Waste. Washington, DC. (Includes the following tests: Method 1311, TCLP - Toxicity Characteristics Leaching Procedure; Method 6010 - Inorganics by ICP; Method 8260 - VOCs by GC/MS; and Method 8270 -SVOCs by GC/MS.)
11. U.S. EPA (Environmental Protection Agency). 1993. Methods for Measuring the Acute Toxicity of Effluents and Receiving Waters to Freshwater and Marine Organisms. EPA/600/4-90/027.
12. U.S. EPA (Environmental Protection Agency). 1994. Short-Term Methods for Estimating the Chronic Toxicity of Effluents and Receiving Water to Freshwater Organisms. EPA/491/002.
13. ABC Laboratories, Inc. 2002. Acute and Chronic Toxicity of Dust Suppression Products A, B, E, Perma-Zyme 11X, and Soil Sement Engineered Formula to Ceriodaphnia dubia, Fathead Minnow (Pimephales promelas), and Americamysis bahia. Columbia, Missouri. September.
14. Tri-State Laboratories, Inc. 2002. Laboratory Analysis Report. Youngstown, Ohio. July. Report may be obtained from RTI International.
15. Peterson, M. 2002. “Laboratory analysis report for dust suppressants.” E-mail and attachments from M. Peterson, RTI, to D. Franke, RTI. November 18, 2002.
16. ETV. 2004. Generic Verification Protocol for Dust Suppression and Soil Stabilization Products. RTI International, Research Triangle Park, NC.
22
Environmental Technology Verification Report Dust Suppressant Products: EK35
Appendix A
Environmental Testing Results
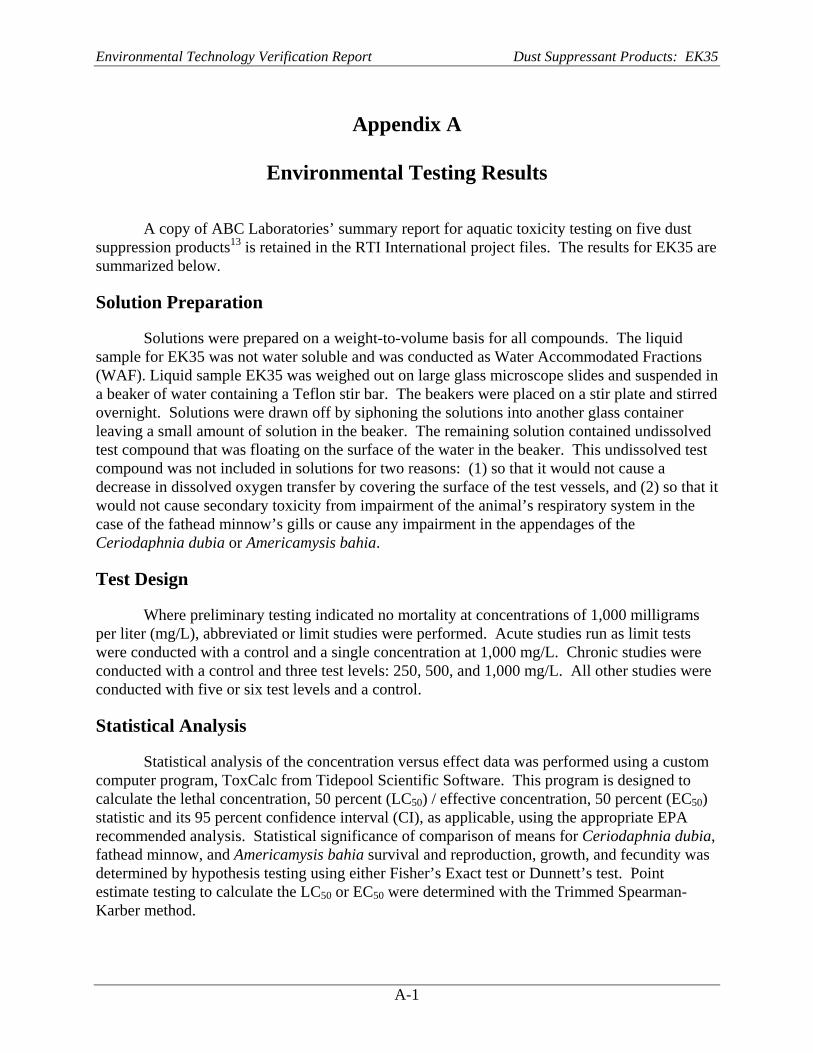
A copy of ABC Laboratories’ summary report for aquatic toxicity testing on five dust suppression products13 is retained in the RTI International project files. The results for EK35 are summarized below.
Solution Preparation
Solutions were prepared on a weight-to-volume basis for all compounds. The liquid sample for EK35 was not water soluble and was conducted as Water Accommodated Fractions (WAF). Liquid sample EK35 was weighed out on large glass microscope slides and suspended in a beaker of water containing a Teflon stir bar. The beakers were placed on a stir plate and stirred overnight. Solutions were drawn off by siphoning the solutions into another glass container leaving a small amount of solution in the beaker. The remaining solution contained undissolved test compound that was floating on the surface of the water in the beaker. This undissolved test compound was not included in solutions for two reasons: (1) so that it would not cause a decrease in dissolved oxygen transfer by covering the surface of the test vessels, and (2) so that it would not cause secondary toxicity from impairment of the animal’s respiratory system in the case of the fathead minnow’s gills or cause any impairment in the appendages of the Ceriodaphnia dubia or Americamysis bahia.
Test Design
Where preliminary testing indicated no mortality at concentrations of 1,000 milligrams per liter (mg/L), abbreviated or limit studies were performed. Acute studies run as limit tests were conducted with a control and a single concentration at 1,000 mg/L. Chronic studies were conducted with a control and three test levels: 250, 500, and 1,000 mg/L. All other studies were conducted with five or six test levels and a control.
Statistical Analysis
Statistical analysis of the concentration versus effect data was performed using a custom computer program, ToxCalc from Tidepool Scientific Software. This program is designed to calculate the lethal concentration, 50 percent (LC50) / effective concentration, 50 percent (EC50) statistic and its 95 percent confidence interval (CI), as applicable, using the appropriate EPA recommended analysis. Statistical significance of comparison of means for Ceriodaphnia dubia, fathead minnow, and Americamysis bahia survival and reproduction, growth, and fecundity was determined by hypothesis testing using either Fisher’s Exact test or Dunnett’s test. Point estimate testing to calculate the LC50 or EC50 were determined with the Trimmed Spearman-Karber method.
A-1
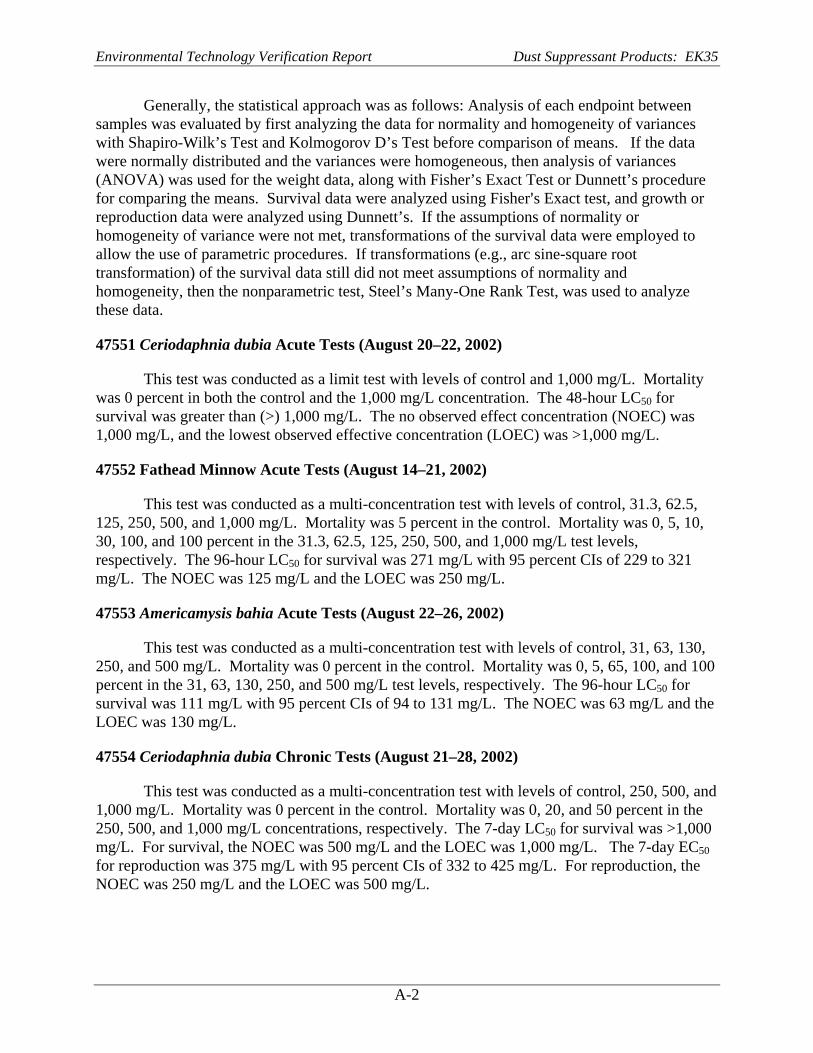
Environmental Technology Verification Report Dust Suppressant Products: EK35
Generally, the statistical approach was as follows: Analysis of each endpoint between samples was evaluated by first analyzing the data for normality and homogeneity of variances with Shapiro-Wilk’s Test and Kolmogorov D’s Test before comparison of means. If the data were normally distributed and the variances were homogeneous, then analysis of variances (ANOVA) was used for the weight data, along with Fisher’s Exact Test or Dunnett’s procedure for comparing the means. Survival data were analyzed using Fisher=s Exact test, and growth or reproduction data were analyzed using Dunnett’s. If the assumptions of normality or homogeneity of variance were not met, transformations of the survival data were employed to allow the use of parametric procedures. If transformations (e.g., arc sine-square root transformation) of the survival data still did not meet assumptions of normality and homogeneity, then the nonparametric test, Steel’s Many-One Rank Test, was used to analyze these data.
47551 Ceriodaphnia dubia Acute Tests (August 20–22, 2002)
This test was conducted as a limit test with levels of control and 1,000 mg/L. Mortality was 0 percent in both the control and the 1,000 mg/L concentration. The 48-hour LC50 for survival was greater than (>) 1,000 mg/L. The no observed effect concentration (NOEC) was 1,000 mg/L, and the lowest observed effective concentration (LOEC) was >1,000 mg/L.
47552 Fathead Minnow Acute Tests (August 14–21, 2002)
This test was conducted as a multi-concentration test with levels of control, 31.3, 62.5, 125, 250, 500, and 1,000 mg/L. Mortality was 5 percent in the control. Mortality was 0, 5, 10, 30, 100, and 100 percent in the 31.3, 62.5, 125, 250, 500, and 1,000 mg/L test levels, respectively. The 96-hour LC50 for survival was 271 mg/L with 95 percent CIs of 229 to 321 mg/L. The NOEC was 125 mg/L and the LOEC was 250 mg/L.
47553 Americamysis bahia Acute Tests (August 22–26, 2002)
This test was conducted as a multi-concentration test with levels of control, 31, 63, 130, 250, and 500 mg/L. Mortality was 0 percent in the control. Mortality was 0, 5, 65, 100, and 100 percent in the 31, 63, 130, 250, and 500 mg/L test levels, respectively. The 96-hour LC50 for survival was 111 mg/L with 95 percent CIs of 94 to 131 mg/L. The NOEC was 63 mg/L and the LOEC was 130 mg/L.
47554 Ceriodaphnia dubia Chronic Tests (August 21–28, 2002)
This test was conducted as a multi-concentration test with levels of control, 250, 500, and 1,000 mg/L. Mortality was 0 percent in the control. Mortality was 0, 20, and 50 percent in the 250, 500, and 1,000 mg/L concentrations, respectively. The 7-day LC50 for survival was >1,000 mg/L. For survival, the NOEC was 500 mg/L and the LOEC was 1,000 mg/L. The 7-day EC50 for reproduction was 375 mg/L with 95 percent CIs of 332 to 425 mg/L. For reproduction, the NOEC was 250 mg/L and the LOEC was 500 mg/L.
A-2
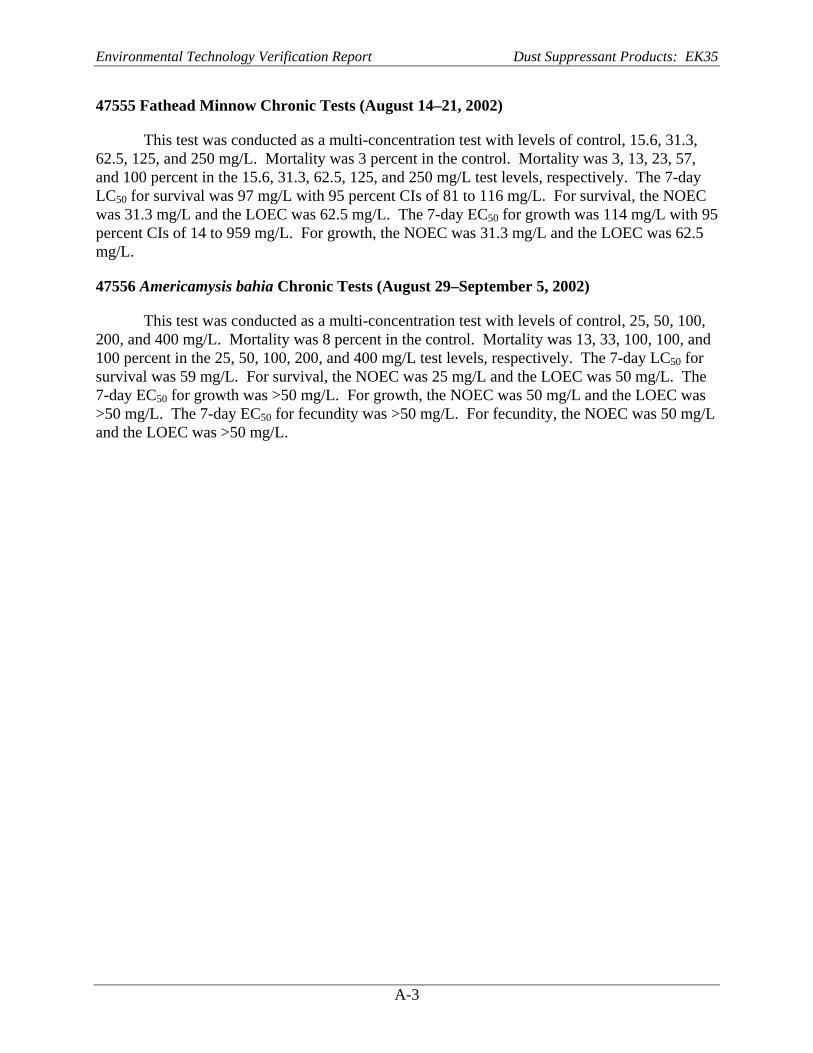
Environmental Technology Verification Report Dust Suppressant Products: EK35
47555 Fathead Minnow Chronic Tests (August 14–21, 2002)
This test was conducted as a multi-concentration test with levels of control, 15.6, 31.3, 62.5, 125, and 250 mg/L. Mortality was 3 percent in the control. Mortality was 3, 13, 23, 57, and 100 percent in the 15.6, 31.3, 62.5, 125, and 250 mg/L test levels, respectively. The 7-day LC50 for survival was 97 mg/L with 95 percent CIs of 81 to 116 mg/L. For survival, the NOEC was 31.3 mg/L and the LOEC was 62.5 mg/L. The 7-day EC50 for growth was 114 mg/L with 95 percent CIs of 14 to 959 mg/L. For growth, the NOEC was 31.3 mg/L and the LOEC was 62.5 mg/L.
47556 Americamysis bahia Chronic Tests (August 29–September 5, 2002)
This test was conducted as a multi-concentration test with levels of control, 25, 50, 100, 200, and 400 mg/L. Mortality was 8 percent in the control. Mortality was 13, 33, 100, 100, and 100 percent in the 25, 50, 100, 200, and 400 mg/L test levels, respectively. The 7-day LC50 for survival was 59 mg/L. For survival, the NOEC was 25 mg/L and the LOEC was 50 mg/L. The 7-day EC50 for growth was >50 mg/L. For growth, the NOEC was 50 mg/L and the LOEC was >50 mg/L. The 7-day EC50 for fecundity was >50 mg/L. For fecundity, the NOEC was 50 mg/L and the LOEC was >50 mg/L.
A-3
Environmental Technology Verification Report Dust Suppressant Products: EK35
Appendix B
Chemical Testing Results
Tri-State Laboratories’ analysis report of five dust suppression products14 is retained in the RTI International project files. The results for EK35 are included on the pages that follow.
B-1
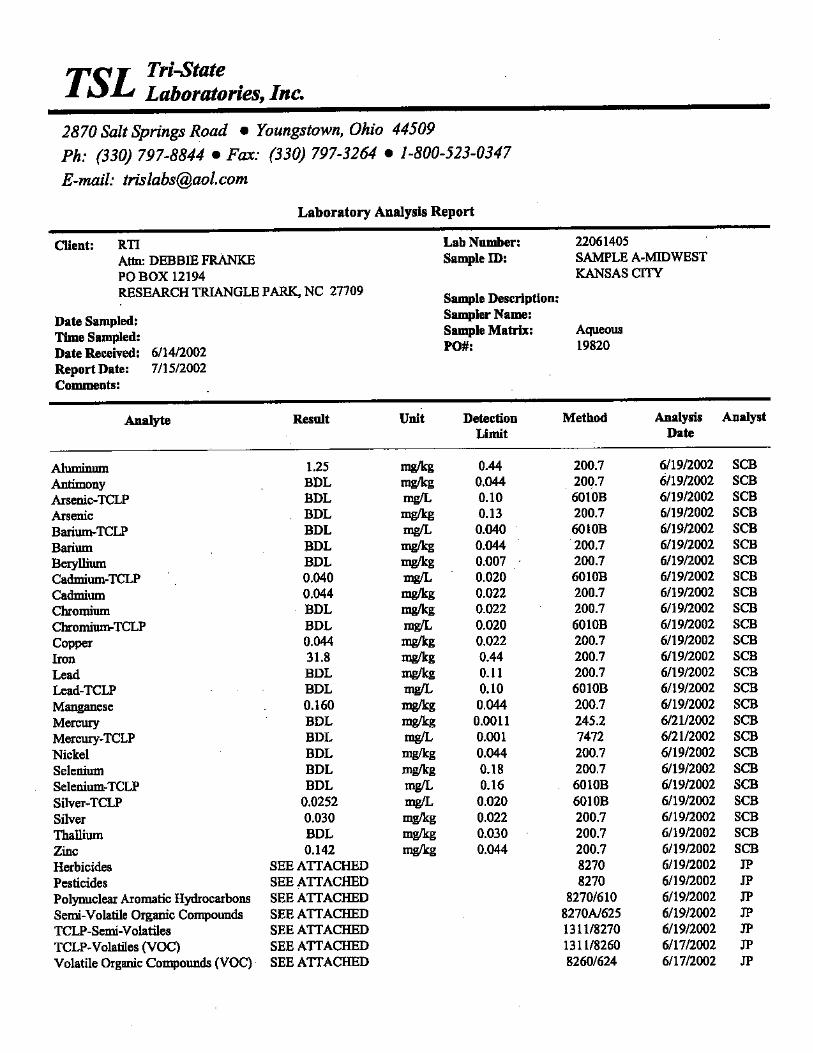

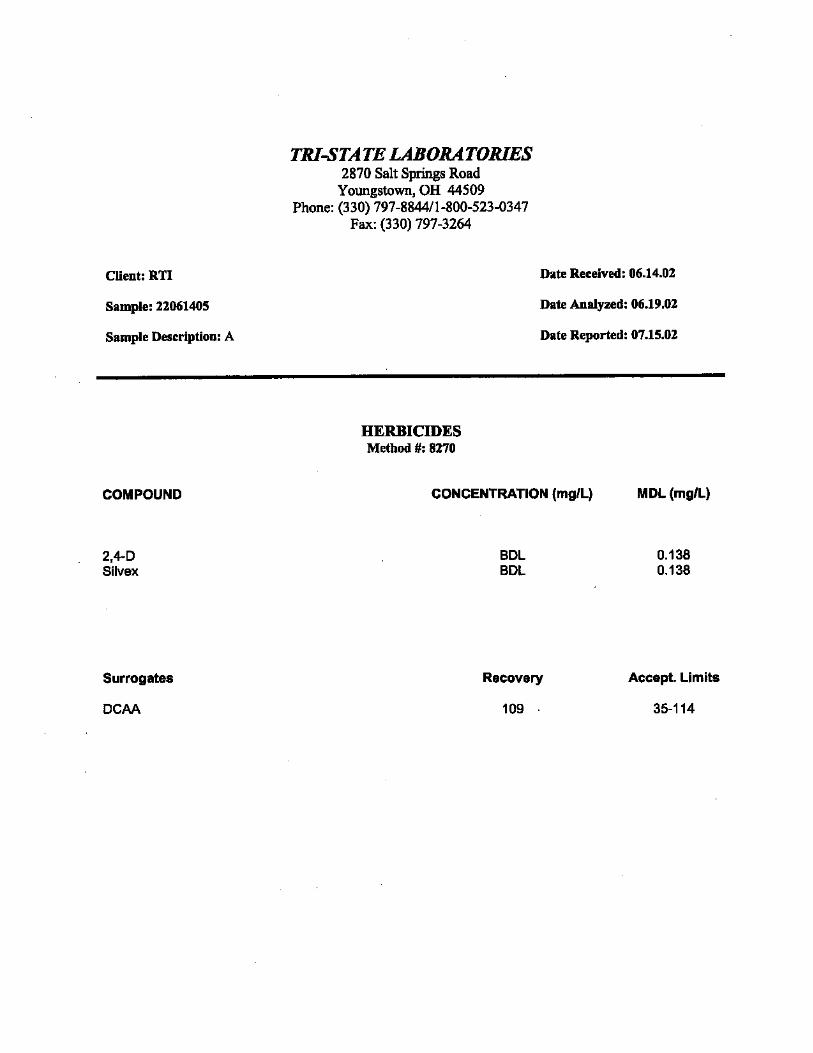
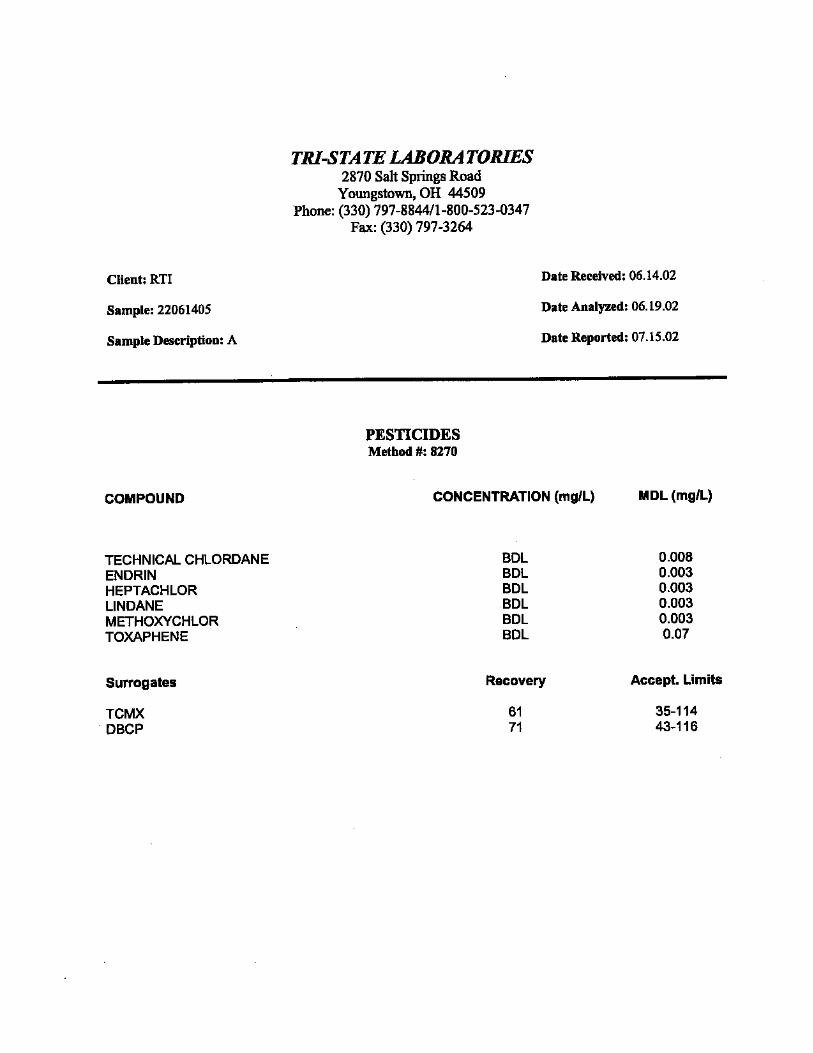
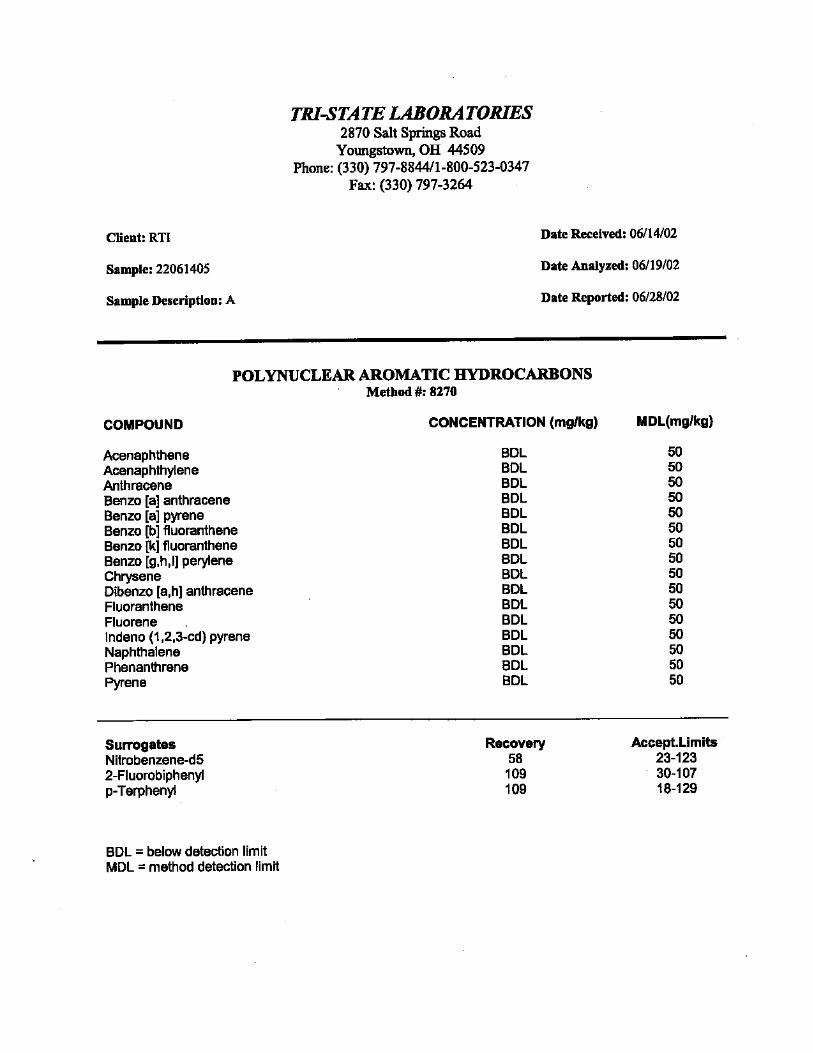
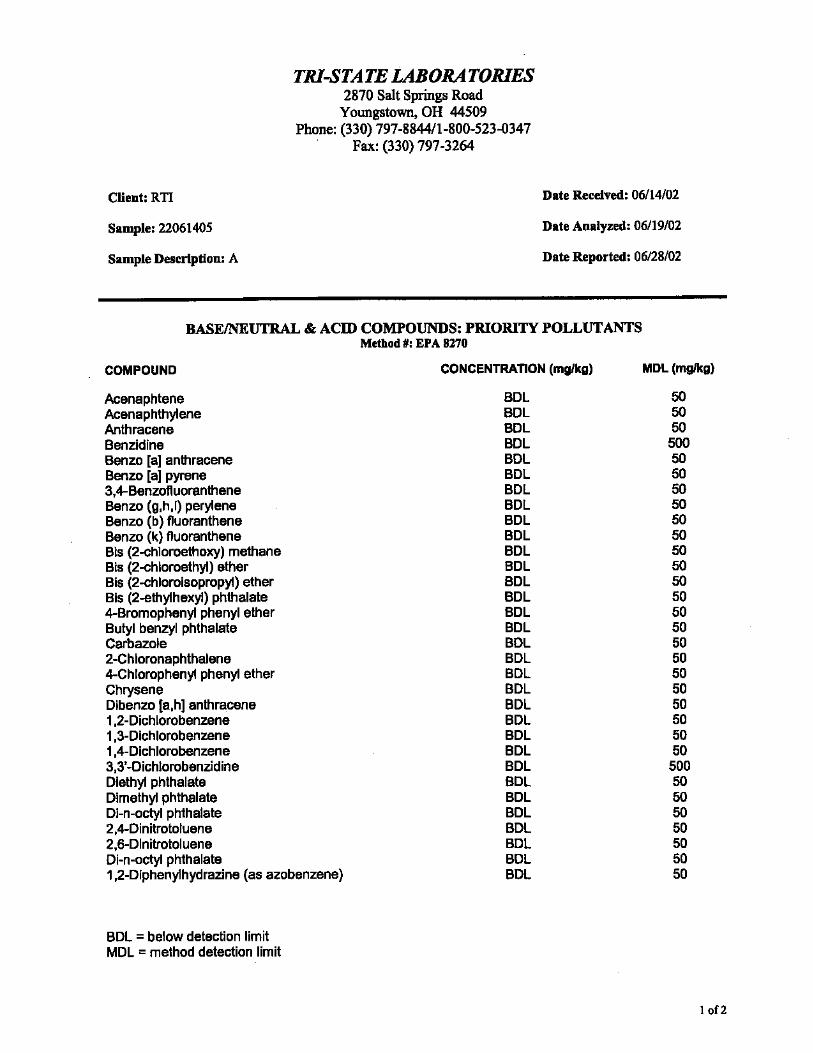
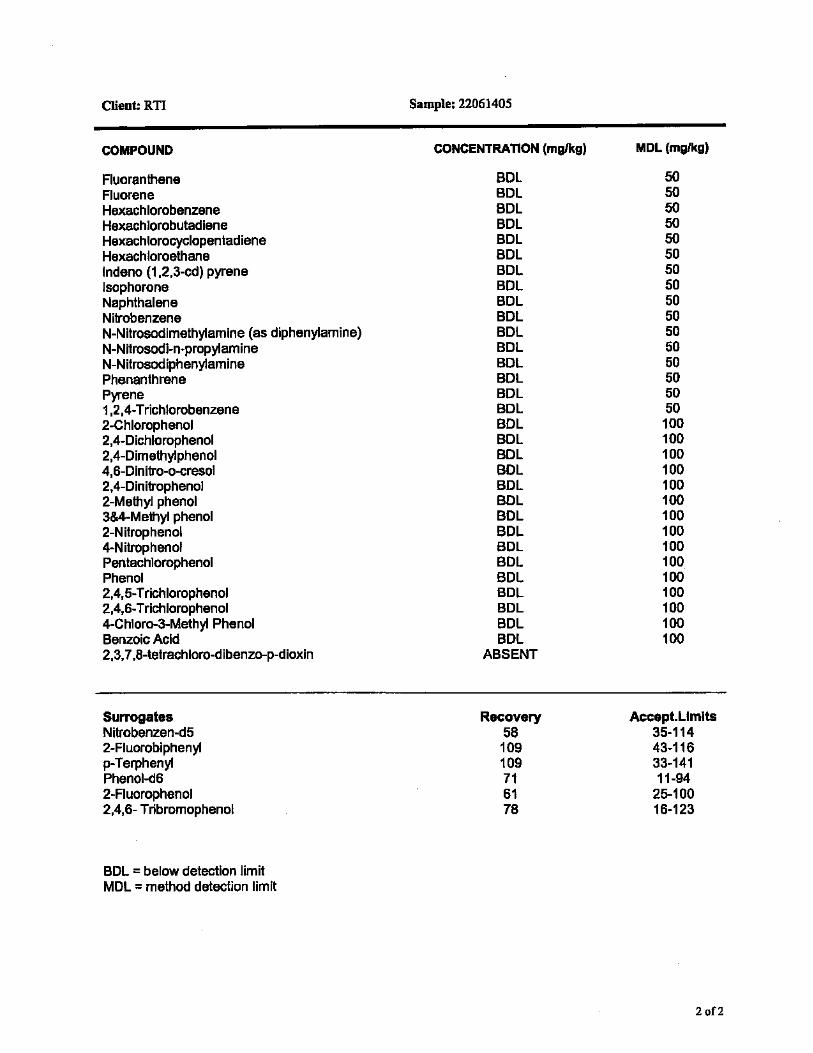
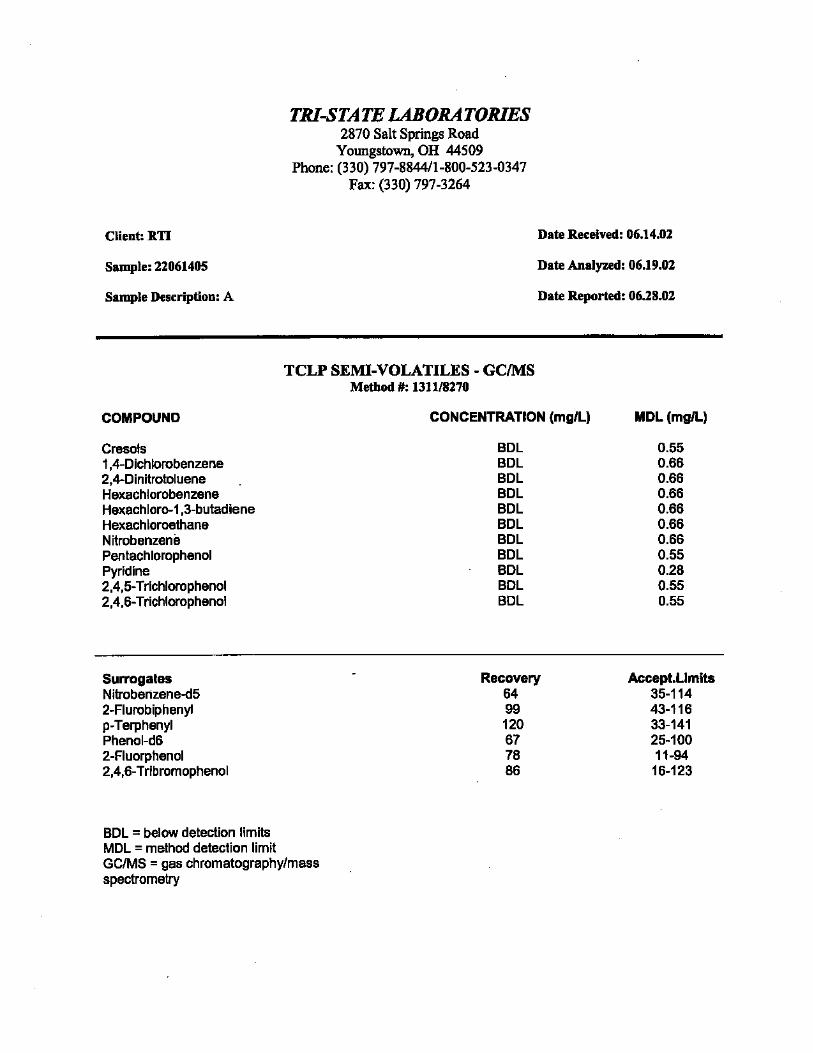
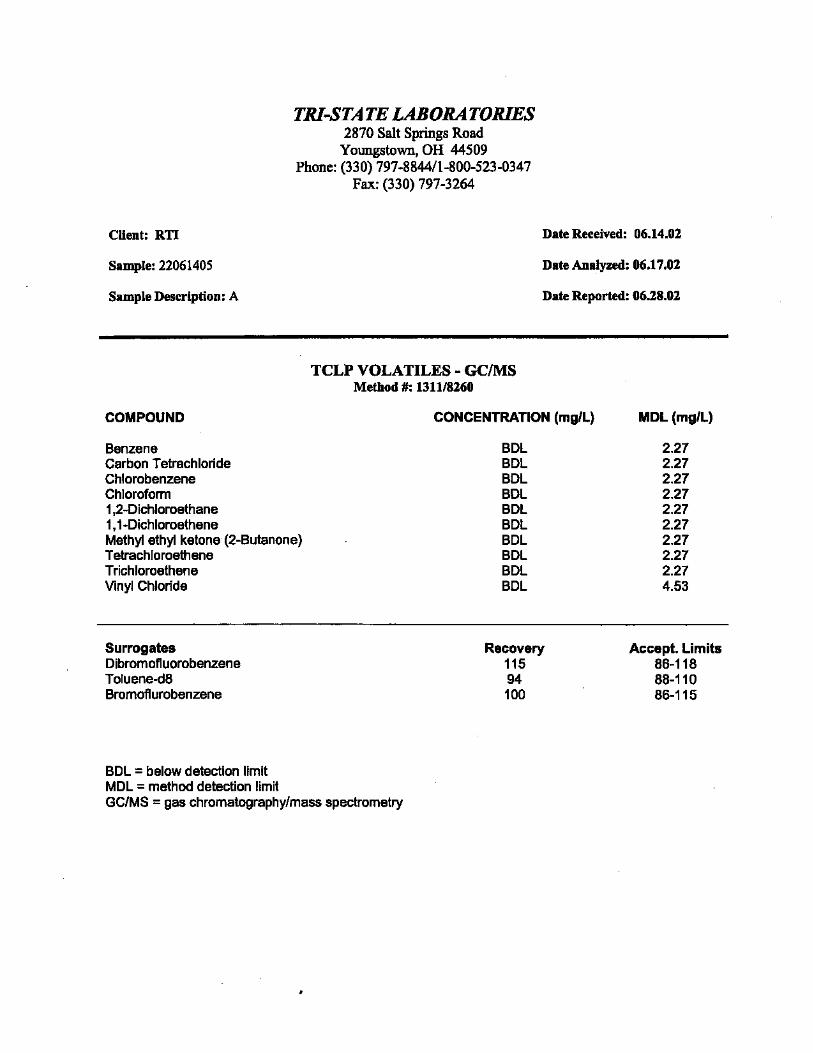
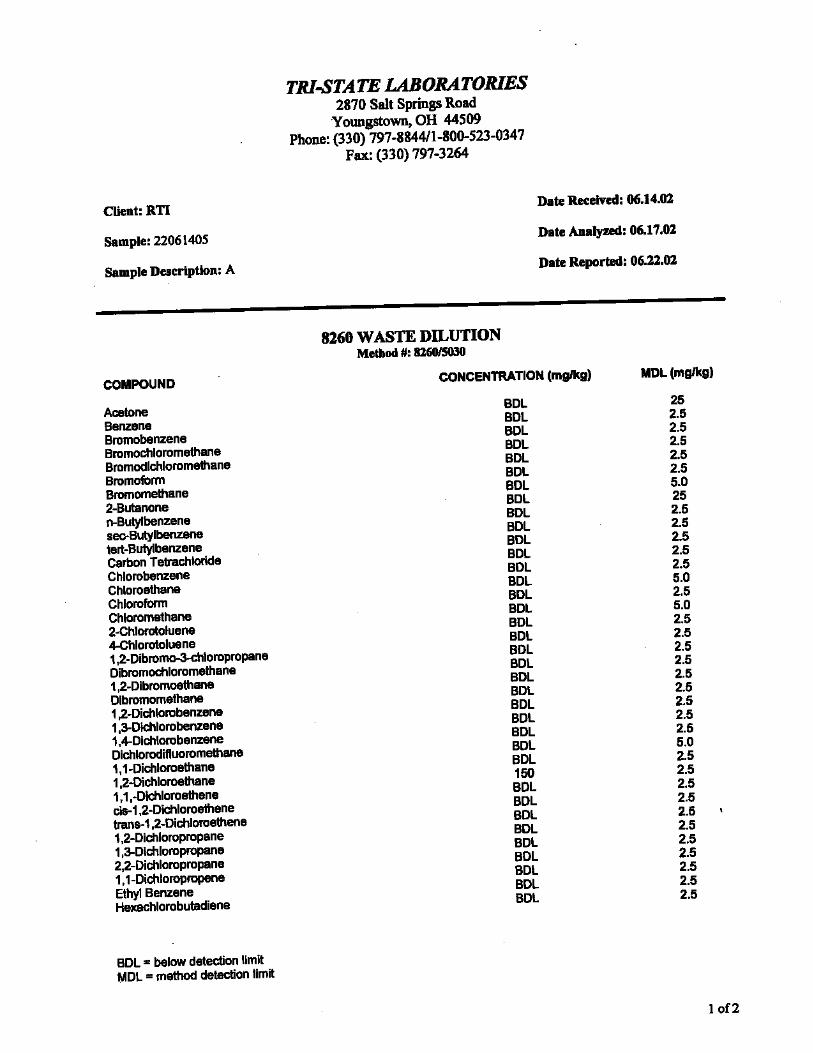
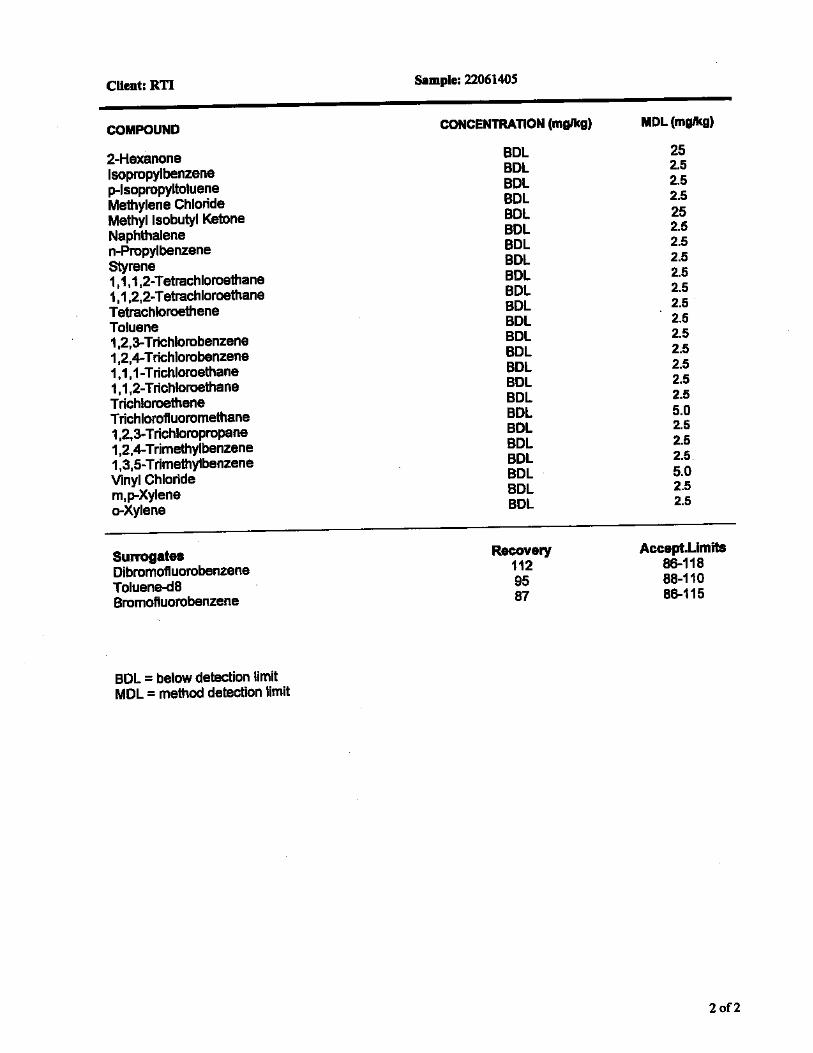
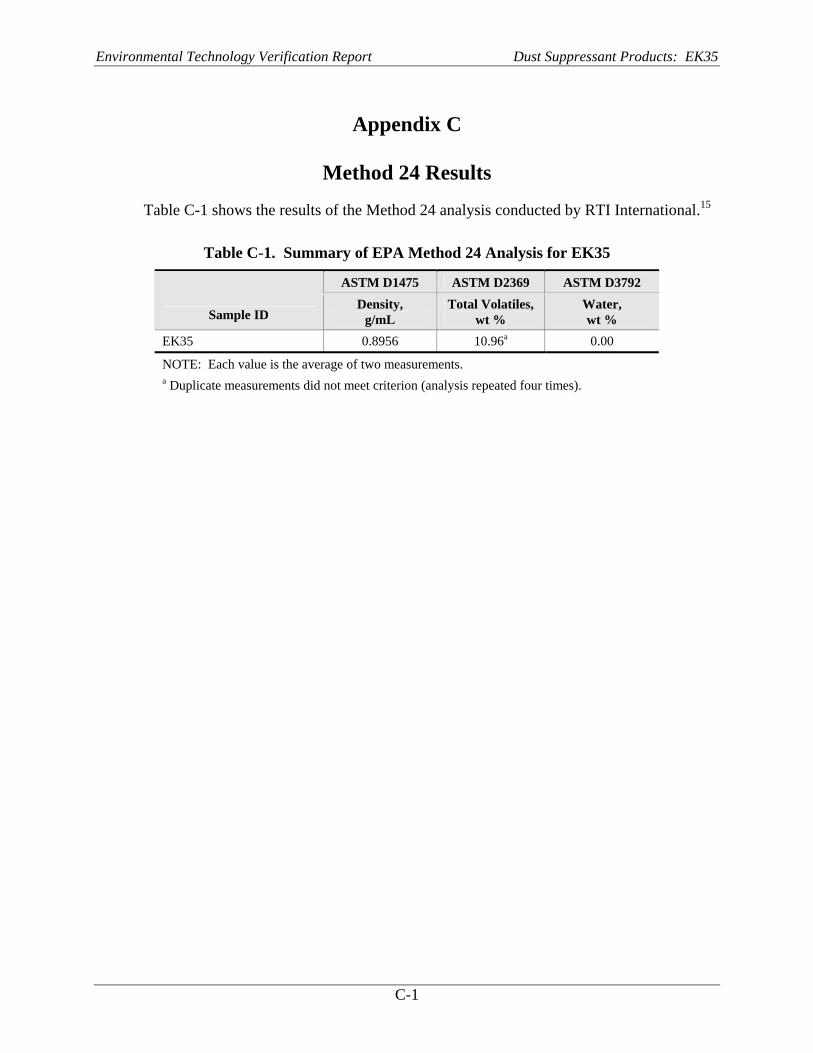
Environmental Technology Verification Report Dust Suppressant Products: EK35
Appendix C
Method 24 Results
Table C-1 shows the results of the Method 24 analysis conducted by RTI International.15
Table C-1. Summary of EPA Method 24 Analysis for EK35
Sample ID
ASTM D1475 ASTM D2369 ASTM D3792 Density,
g/mL Total Volatiles,
wt % Water, wt %
EK35 0.8956 10.96a 0.00
NOTE: Each value is the average of two measurements. a Duplicate measurements did not meet criterion (analysis repeated four times).
C-1