synthetic seismograms adjusted to constant-displacement spectra … · spectra so that the spectral...
TRANSCRIPT

13th World Conference on Earthquake Engineering Vancouver, B.C., Canada
August 1-6, 2004 Paper No. 2777
SYNTHETIC SEISMOGRAMS ADJUSTED TO CONSTANT-DISPLACEMENT SPECTRA FOR DESIGN OF
UTAH STATE CAPITOL BUILDING SEISMIC RENOVATION
JEFFREY R. KEATON1
SUMMARY The Utah State Capitol Building in Salt Lake City is located on the footwall block less than 1 km east of the Salt Lake City segment of the Wasatch fault. Few normal-faulting strong-motion recordings are available for use in engineering design, so the Composite Source Model was used to develop fault-parallel, fault-normal, and vertical seismograms for earthquakes of Mw 7.0 and 7.3, taken to be equivalent to the BSE-1 and BSE-2 motions. Probabilistic uniform-hazard acceleration response spectra for exceedance probabilities of 50, 10, and 2 percent in 50 years were developed by others for design of the seismic renovation of the Utah State Capitol Building. The acceleration response spectra were converted to displacement response spectra based on a single-degree-of-freedom oscillator in circular motion. At a period of approximately 1 s the spectral displacements plotted on nearly straight lines with slopes of 4.8 and 9.2 cm/s for the fault-parallel and fault-normal components of the BSE-1 motion, and slopes of 13.1 and 25.1 cm/s for the BSE-2 motion. The spectral displacements at a period of 4 s were 27 and 41 cm for the fault-parallel and fault-normal BSE-1 motion and 73 and 112 cm for the BSE-2 motion. Adjustments were made in the displacement spectra so that the spectral displacements became constant at periods of 2.1 to 2.3 s, and the acceleration response was recalculated. The maximum spectral displacements were 20 and 25 cm for the fault-parallel and fault-normal components of the BSE-1 motion, and 52 and 65 cm for the BSE-2 motion. The Composite Source Model produced very high short-period motions in part because the model treats all geologic materials as linear. Therefore, adjustments were made to the Fourier amplitude spectra of the acceleration time history records to bring the acceleration response close to the constant-displacement response spectra.
INTRODUCTION Seismic renovation of the Utah State Capitol is being undertaken by the State of Utah under the direction of the Office of the State Architect. AMEC was retained to evaluate earthquake ground motions and develop acceleration time-history records for use in design. This evaluation was part of a broader
1 AMEC Earth & Environmental, Inc., 1290 North Hancock Street, Suite 102, Anaheim, CA 92807 USA

geotechnical investigation that included surface and subsurface geophysics, borings, laboratory testing, and engineering analyses. The ground motion evaluation consisted of two parts: A probabilistic seismic hazard assessment and development of acceleration time-history records. The probabilistic seismic hazard assessment was conducted by Geomatrix Consultants under subcontract to AMEC. The results of the Geomatrix assessment were used in developing the design ground motions. The Wasatch Front region, including the Utah State Capitol Building site, is located in a seismically active area dominated by normal faults. Few normal-faulting earthquakes have been recorded by strong-motion instruments, and fewer still exhibit ground motion in the range of engineering significance. Therefore, synthetic seismograms for use in the design of the seismic renovation were generated using a Composite Source Model developed by Professors Yuehua Zeng and John Anderson at the University of Nevada-Reno. Dr. Anderson served as a consultant to AMEC on this project.
SEISMIC SOURCES The Utah State Capitol is located in a seismically active area with numerous faults, as shown on Figure 1. A variety of seismic sources were included in the probabilistic seismic hazard analysis conducted by Geomatrix. Many of the sources contribute to the seismic hazard at the site, but the dominant source is the Salt Lake City segment of the Wasatch fault zone. The Warm Springs fault is located less than 1 km west of the Utah State Capitol, as shown on Figure 1. Black [4] summarized previous geologic interpretations and presented the results of an extensive trenching program that exposed traces of the Salt Lake City segment of Wasatch fault zone south of Little Cottonwood Canyon in Salt Lake Valley. They concluded that the average time between surface-faulting earthquakes has been about 1,350 years during the past 6,000 years. They also determined that the time since the last surface-faulting earthquake on the Salt Lake City segment of the Wasatch fault zone was about 1,300 years. Surface-faulting earthquakes on the Salt Lake City segment of the Wasatch fault zone are considered to be in the range of moment magnitude (Mw) 6.7 to 7.3. A reasonably likely magnitude is expected to be Mw 7.0, whereas the maximum magnitude is considered to be Mw 7.3 (Wong [9]).
SITE CHARACTERIZATION The shear-wave velocity profile of a site is an important element in estimating the dynamic response to earthquake shaking. A number of borings have been drilled at the Utah State Capitol Building site, as described in the geotechnical investigation report. One of the borings extended to a depth of nearly 350 feet. Bedrock formations were not encountered in any of the borings. Geophysical surveys conducted at the site include downhole compression- and shear-wave velocity measurements, conventional surface refraction seismic surveys, spectral analysis of surface waves (SASW) surveys, and refraction microtremor (ReMi) surveys. Results of geophysical surveys varied over a considerable range. The refraction microtremor survey results appeared to be the most reasonable in comparison to the subsurface geology. The shear-wave velocity profile for the upper 500 feet of the soil under the site that was used in the ground-motion evaluation is presented on Figure 2A. Geologic information from scattered water wells was used in conjunction with on-site geotechnical borings and geophysical survey results to project a depth to bedrock under the site of approximately 600 feet, although the depth might be as great as 900 feet.
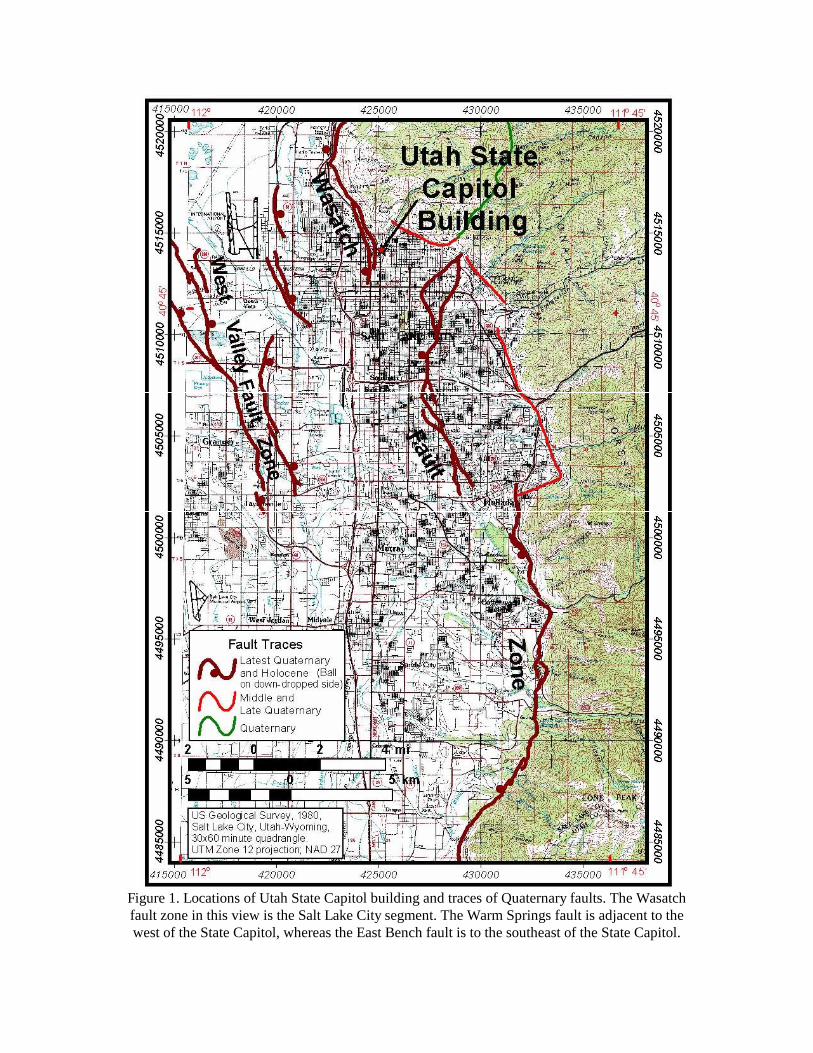
Figure 1. Locations of Utah State Capitol building and traces of Quaternary faults. The Wasatch fault zone in this view is the Salt Lake City segment. The Warm Springs fault is adjacent to the west of the State Capitol, whereas the East Bench fault is to the southeast of the State Capitol.

The Composite Source Model requires the velocity structure to significant depth. The general velocity structure used for the Utah State Capitol ground motion evaluation was provided by Dr. James Pechmann at the University of Utah Seismograph Stations, and is shown on Figure 2B. The uppermost velocity structure shown on Figure 2B matches the site-specific shear-wave velocity profile shown on Figure 2A.
Figure 2. A) Shear-wave velocity profile in the upper 500 feet of the Utah State Capitol site.
Lacustrine-alluvial gravel and old alluvial fan profiles are modified from Wong [9]. B) General velocity structure of the Wasatch Front region, provided by Dr. James Pechmann.
DEISGN RESPONSE SPECTRA The probabilistic seismic hazard assessment conducted by Geomatrix produced acceler-ation response spectra for three risk conditions (Figure 3). The lower-level risk condition has a 50% exceedance probability in 50 years. The intermediate risk condition has a 10% exceedance probability in 50 years, and is equivalent to a design earth-quake called Basic Safety Earthquake-1, or BSE-1, in Prestandard and Commentary for the Seismic Rehabilitation of Buildings (FEMA 356). The higher-level risk condition has a 2% exceedance probability in 50 years, and is equivalent to a design earthquake called Basic Safety Earthquake-2, or BSE-2, in FEMA 356. Geomatrix produced 5%-damped acceleration response spectra for the three risk conditions up to a period of 4 s for horizontal components and 0.5 s for vertical the components of BSE-1 and BSE-2. Vertical spectral acceleration for the lower-level earthquake (LLE) was taken to be 2/3 of the LLE horizontal spectral acceleration. The concern was raised in a project meeting regarding spectral accelerations traditionally being predicted on the basis that ground motion achieved a condition of constant velocity, instead of constant displacement, with increasing period. Consequently, the equivalent spectral displacements were calculated for the horizontal acceleration response spectra shown on Figure 3 using the conventional 5% damped single-degree-of-freedom oscillator in circular motion. Spectral displacements as a function of period are presented on Figure 4. For the BSE-2 fault-normal motion, it can be seen that the spectral displacement is increasing linearly beyond a period of about 1 s, and it is about 1 m at a period of 3.5 s.
A B
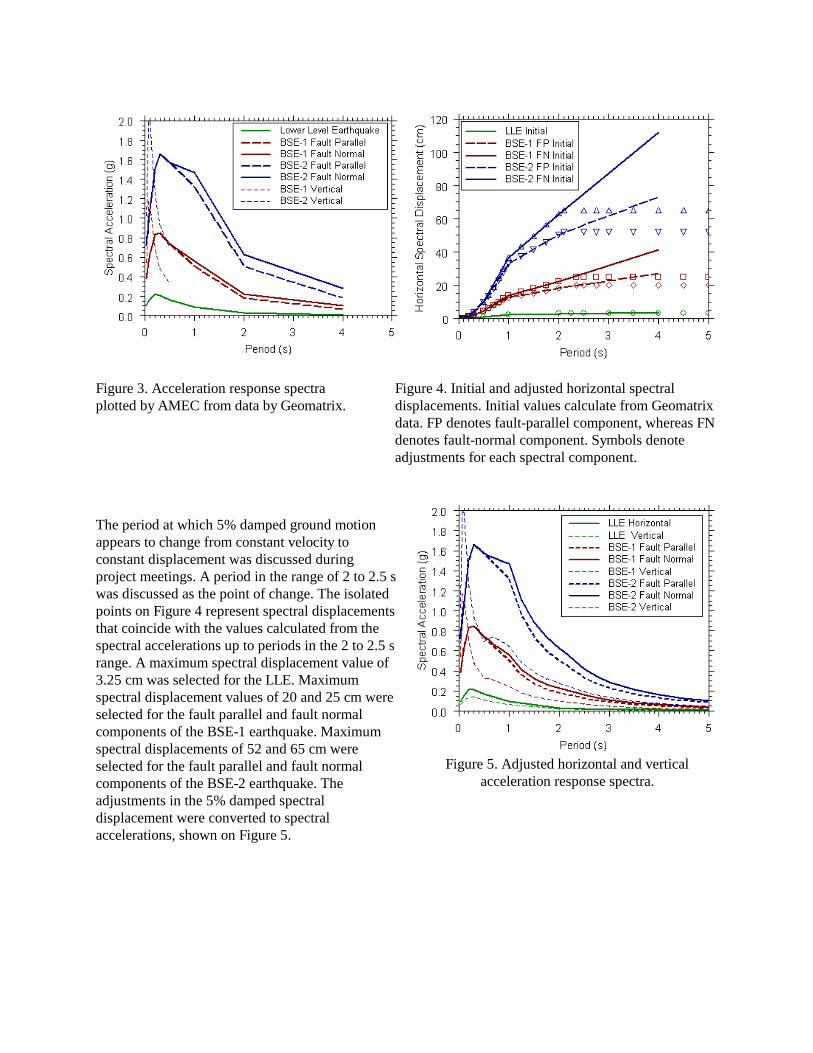
Figure 3. Acceleration response spectra plotted by AMEC from data by Geomatrix.
Figure 4. Initial and adjusted horizontal spectral displacements. Initial values calculate from Geomatrix data. FP denotes fault-parallel component, whereas FN denotes fault-normal component. Symbols denote adjustments for each spectral component.
The period at which 5% damped ground motion appears to change from constant velocity to constant displacement was discussed during project meetings. A period in the range of 2 to 2.5 s was discussed as the point of change. The isolated points on Figure 4 represent spectral displacements that coincide with the values calculated from the spectral accelerations up to periods in the 2 to 2.5 s range. A maximum spectral displacement value of 3.25 cm was selected for the LLE. Maximum spectral displacement values of 20 and 25 cm were selected for the fault parallel and fault normal components of the BSE-1 earthquake. Maximum spectral displacements of 52 and 65 cm were selected for the fault parallel and fault normal components of the BSE-2 earthquake. The adjustments in the 5% damped spectral displacement were converted to spectral accelerations, shown on Figure 5.
Figure 5. Adjusted horizontal and vertical acceleration response spectra.
ACCELERATION TIME HISTORIES Introduction Two basic methods are available to produce acceleration time histories for use in engineering analysis and design: 1) obtain recordings of suitable historical earthquakes and adjust them for the characteristics of the particular situation, 2) generate synthetic recordings that have appropriate characteristics for the particular situation. Few historical normal-faulting earthquakes have been recorded by strong-motion instruments, and fewer still have been recorded by instruments located close to the source. Consequently, few normal-faulting earthquake recordings exist that have engineering significance. One of the few recordings is the Matahina Dam record of the 1987 Edgecumbe, New Zealand, earthquake (March 2, 1987, Mw 6.5, recorded at an epicentral distance of 21 km). Synthetic earthquake seismograms can be generated in two general ways: 1) a band-limited white noise generator, or 2) a model based on the physics of fault rupture. The Composite Source Model is based on the physics of fault rupture and generates realistic seismograms, which take into account source-to-site geometry, rupture directivity, fault-rupture rake, and site-specific seismic velocity structure. Composite Source Model The Composite Source Model provides a useful alternative to scaling earthquake records for engineering application. The Composite Source Model produces synthetic acceleration-time histories based on rupture along a multiplanar fault with specified dimensions and orientation. Part of the input for the Composite Source Model is the compression- and shear-wave velocity for the site. Depending on the level of detail known about a site where the synthetic seismogram might be used for design, the site conditions can be reflected accurately. The composite source model also allows the orientation of the two horizontal components of the seismogram to be specified. For the Utah State Capitol project, the two horizontal components were parallel and perpendicular to the fault generating the ground motion. The Composite Source Model consists of a fault with a specific location and finite dimensions. The dimensions of the fault must be consistent with earthquake magnitude and seismic moment. Asperities on the fault plane are modeled as circular features, the number and radius of which are constrained by seismic moment. It is the randomly distributed asperities that produce the variability in the frequency content of the synthetic seismograms. The hypocenter of the earthquake can be assigned at any point on the fault. The sense of slip on the fault is modeled by the rake of subevents, which generates pulses of energy as the constant-velocity rupture front passes the center of each asperity. For purely normal-slip faults, subevent rake is -90º. The duration of each subevent is controlled by asperity radius and stress drop. The time function of each subevent is transferred to a geographically located site using synthetic Green’s functions for a flat-layered medium. The seismograms from all of the subevents are superimposed to produce the synthetic seismogram for the earthquake. A ray scattering effect is also included in the model. The Composite Source Model has been used successfully to simulate reverse-slip and strike-slip earthquakes (Anderson [2]; Zeng [10]; Su [7, 8]). The results of these simulations have demonstrated that the synthetic seismograms generated with the Composite Source Model are highly realistic, both in appearance in the time domain and in reproducing spectral amplitudes over the entire range of frequencies (Anderson [1]). Keaton [5] demonstrated that the Composite Source Model also could be used to generate realistic synthetic seismograms for normal-slip earthquakes. Key input parameters used in the Composite Source Model are listed in Table 1. The geometry of the Salt Lake City segment of the Wasatch fault zone used in the Model is shown on Figure 6. The Warm Springs
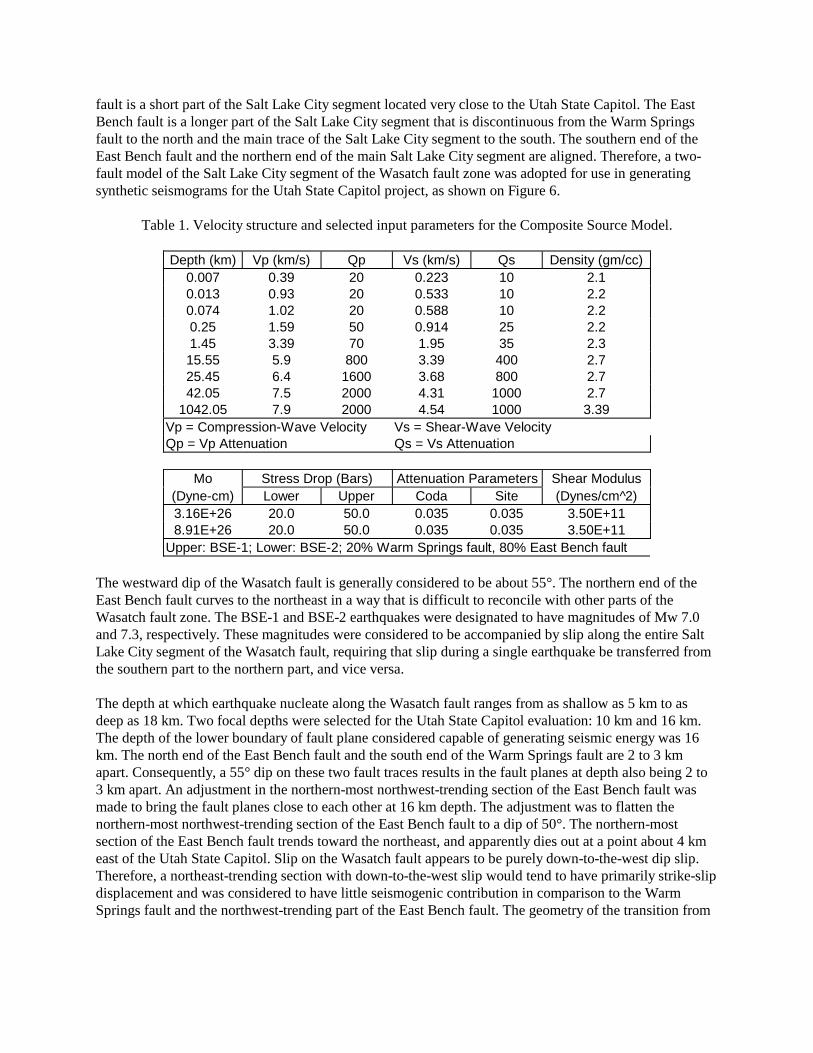
fault is a short part of the Salt Lake City segment located very close to the Utah State Capitol. The East Bench fault is a longer part of the Salt Lake City segment that is discontinuous from the Warm Springs fault to the north and the main trace of the Salt Lake City segment to the south. The southern end of the East Bench fault and the northern end of the main Salt Lake City segment are aligned. Therefore, a two-fault model of the Salt Lake City segment of the Wasatch fault zone was adopted for use in generating synthetic seismograms for the Utah State Capitol project, as shown on Figure 6.
Table 1. Velocity structure and selected input parameters for the Composite Source Model.
Depth (km) Vp (km/s) Qp Vs (km/s) Qs Density (gm/cc) 0.007 0.39 20 0.223 10 2.1 0.013 0.93 20 0.533 10 2.2 0.074 1.02 20 0.588 10 2.2 0.25 1.59 50 0.914 25 2.2 1.45 3.39 70 1.95 35 2.3 15.55 5.9 800 3.39 400 2.7 25.45 6.4 1600 3.68 800 2.7 42.05 7.5 2000 4.31 1000 2.7
1042.05 7.9 2000 4.54 1000 3.39 Vp = Compression-Wave Velocity Vs = Shear-Wave Velocity Qp = Vp Attenuation Qs = Vs Attenuation
Mo Stress Drop (Bars) Attenuation Parameters Shear Modulus
(Dyne-cm) Lower Upper Coda Site (Dynes/cm^2) 3.16E+26 20.0 50.0 0.035 0.035 3.50E+11 8.91E+26 20.0 50.0 0.035 0.035 3.50E+11
Upper: BSE-1; Lower: BSE-2; 20% Warm Springs fault, 80% East Bench fault
The westward dip of the Wasatch fault is generally considered to be about 55°. The northern end of the East Bench fault curves to the northeast in a way that is difficult to reconcile with other parts of the Wasatch fault zone. The BSE-1 and BSE-2 earthquakes were designated to have magnitudes of Mw 7.0 and 7.3, respectively. These magnitudes were considered to be accompanied by slip along the entire Salt Lake City segment of the Wasatch fault, requiring that slip during a single earthquake be transferred from the southern part to the northern part, and vice versa. The depth at which earthquake nucleate along the Wasatch fault ranges from as shallow as 5 km to as deep as 18 km. Two focal depths were selected for the Utah State Capitol evaluation: 10 km and 16 km. The depth of the lower boundary of fault plane considered capable of generating seismic energy was 16 km. The north end of the East Bench fault and the south end of the Warm Springs fault are 2 to 3 km apart. Consequently, a 55° dip on these two fault traces results in the fault planes at depth also being 2 to 3 km apart. An adjustment in the northern-most northwest-trending section of the East Bench fault was made to bring the fault planes close to each other at 16 km depth. The adjustment was to flatten the northern-most northwest-trending section of the East Bench fault to a dip of 50°. The northern-most section of the East Bench fault trends toward the northeast, and apparently dies out at a point about 4 km east of the Utah State Capitol. Slip on the Wasatch fault appears to be purely down-to-the-west dip slip. Therefore, a northeast-trending section with down-to-the-west slip would tend to have primarily strike-slip displacement and was considered to have little seismogenic contribution in comparison to the Warm Springs fault and the northwest-trending part of the East Bench fault. The geometry of the transition from

the Warm Springs fault to the East Bench fault required that slip in modeled earthquakes be transferred from one fault to the other. The ‘epicenters’ or ‘foci’ of the transfer earthquakes are indicated on Figure 6. A fault rupture velocity of 2.7 to 3.0 km/s was used to calculate the time at which slip should be transferred from one fault plane to the other. Three sets of epicenters or foci were used in the Composite Source Model. Each set of earthquakes consisted of a shallow (10 km) and a deep (16 km) focus. The northern epicenters were located on the Warm Springs fault very close to directly southwest of the Utah State Capitol. The middle epicenters were located approximately southwest of the south end of the East Bench fault. The south epicenters were located in the southern part of Salt Lake Valley, near the south end of the fault that was considered to rupture in the modeled earthquake. The combined fault length for the modeled earthquake was 38.45 km, with 20% on the Warm Springs fault and 80% on
Figure 6. Geometry of the Salt Lake City segment of the Wasatch fault zone for use in the Composite Source Model for the Utah State Capitol building ground motion.
the East Bench fault and the Salt Lake City segment. The seismic moment for the BSE-1 (Mw 7.0) earthquake was 3.162 x 1026 dyne-cm, whereas the seismic moment for the BSE-2 (Mw 7.3) earthquake was 8.913 x 1026 dyne-cm. These seismic moments correspond to average displacements of 120 cm for Mw 7.0 and 339 cm for Mw 7.3 on a fault plane that is 19.53 km wide (16 km maximum depth, dipping at 55°). Time Histories and Response Spectra The Matahina Dam Record D of the 1987 Edgecumbe earthquake was used as the best available normal-faulting earthquake record. Its amplitude was scaled, as described in the next section, to match reasonably closely the design acceleration response spectra for the LLE, BSE-1, and BSE-2. All other time histories used to develop ground motion for design of the seismic renovation of the Utah State Capitol were generated by the Composite Source Model, as described above.

The Matahina Dam Record D of the 1987 Edgecumbe earthquake was digitized, corrected, and filtered by the New Zealand Institute of Geological and Nuclear Sciences as acceleration, velocity, and displacement at a time step of 0.02 s (Record A87085D2.V2A). The two horizontal components were oriented along azimuths of 083° and 353°, which are oblique to the general pattern of surface faulting. The seismograms generated by the Composite Source Model consist of acceleration, velocity, and displacement at a time step of 0.02 s. The two horizontal components were oriented along azimuths of 340° and 250°, which are parallel and perpendicular to the Warm Springs fault trace of the Wasatch fault near the Utah State Capitol Building site. Acceleration response spectra were calculated from acceleration time history records using a damping factor of 5%. Elements of the planned seismic renovation, notably base isolation elements, have higher damping factors. However, only 5% damped response was calculated for a single degree of freedom oscillator in circular motion for three reasons: 1) the site-specific design response spectra calculated by Geomatrix Consultants were for 5% damping, 2) comparison of ground motion typically is indexed to 5% damping, and 3) structural analysis programs used by engineers designing the seismic renovation elements routinely convert 5% damped motion to the desired damping level. Spectral Adjustments The Composite Source Model treats geologic materials as linear. Consequently, very large motions were predicted at very short periods. Near-fault recordings of historical earthquakes do not show such large short-period motions. Therefore, the acceleration time history records produced by the Composite Source Model were adjusted to bring their acceleration response spectra relatively close to the design response spectra. The adjustment was done using the procedure described by Keaton [6].
TIME HISTORY RECORDS Acceleration time history records and associated acceleration response spectra were needed for structural analysis conducted by Reaveley Engineers in Salt Lake City and Forell-Ellsessor Engineers in San Francisco. Three sets of records were produced for the LLE, whereas seven sets were produced for both BSE-1 and BSE-2. The Matahina Dam Record D (MATD) time history was adjusted to produce acceleration response spectra that matched reasonably well the response spectra for each of the three levels of design earthquake. The Composite Source Model was used to generate all other time histories. Designations of earthquakes produced by the Composite Source Model use a five-character string, such as N2277, M2171, and S2172. The first character in these designations indicates the position of the epicenter along the fault (N for north, S for south, and M for middle). The other characters in these designations indicates the depth of the hypocenter and number of realization using different seed numbers for the random-number generator in the Composite Source Model. The remaining sections of this paper pertain to the LLE, BSE 1, and BSE 2. The following figures display representative ground motion consisting of one set of acceleration time history records for each level of design earthquake and the corresponding scaled acceleration response spectra. The acceleration response spectra were calculated to periods of 10 s, but the figures show the spectra only up to a period of 5 s. The design acceleration response spectra are shown on each of the figures for reference. Lower Level Earthquake Acceleration time histories for earthquake MATD scaled to the LLE spectra are shown on Figure 7, whereas the corresponding acceleration response spectra are shown on Figure 8.

-80
-60
-40
-200
20
40
60
80
0 5 10 15 20 25 30 35 40
Time (s)
Acc
eler
atio
n (c
m/s
/s)
-80-60-40-20
020406080
0 5 10 15 20 25 30 35 40
Time (s)
Acc
eler
atio
n (c
m/s
/s)
-80-60-40
-200
2040
6080
0 5 10 15 20 25 30 35 40
Time (s)
Acc
eler
atio
n (c
m/s
/s)
Figure 7. Acceleration time histories for MATD scaled to LLE response spectra.
Upper record is 083º azimuth, middle record is 353º azimuth, lower record is vertical.
0.00
0.05
0.10
0.15
0.20
0.25
0 1 2 3 4 5
Period (s)
Spe
ctra
l Acc
eler
atio
n (g
)
Sa1
Sa2
Sav
Target Sah
Target Sav
Figure 8. Acceleration response spectra for MATD scaled to LLE.
Sa1 is 083º azimuth, Sa2 is 353º azimuth, Sav is vertical.

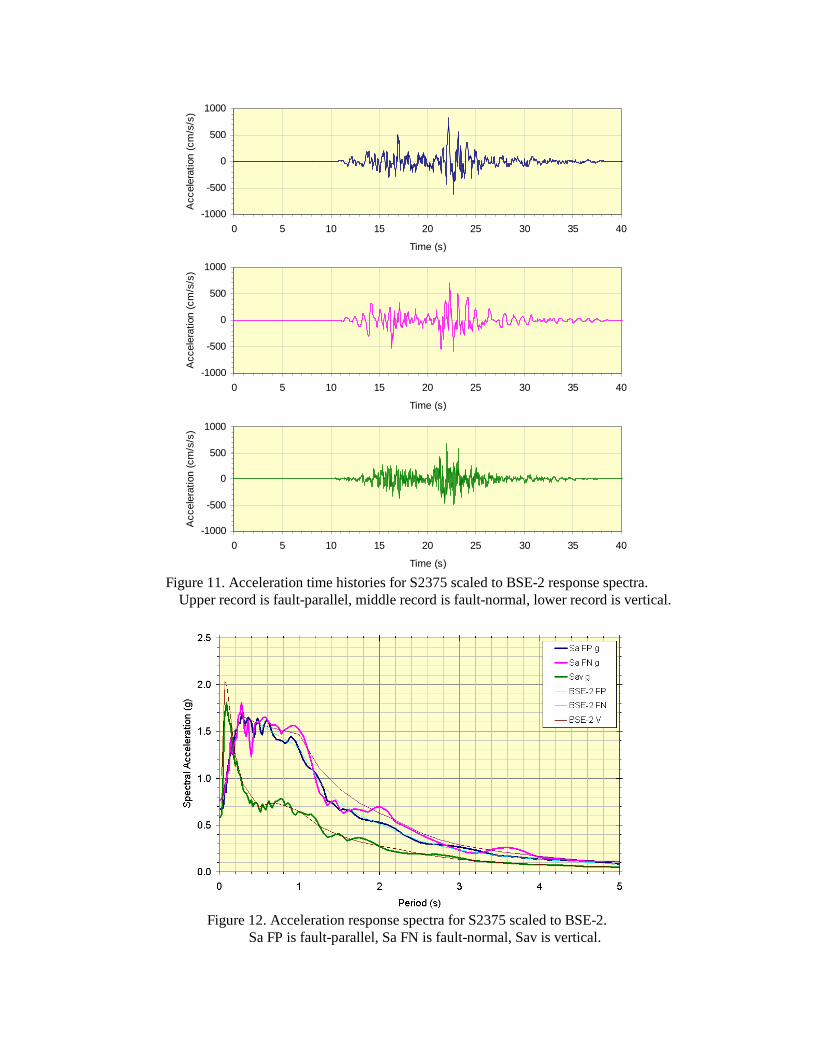
Basic Safety Earthquake 1 The acceleration time histories for earthquake M2171 scaled to the BSE-1 design earthquake are shown on Figure 9, whereas the corresponding acceleration response spectra are shown on Figure 10. Basic Safety Earthquake 2 The acceleration time histories for earthquake S2375 scaled to the BSE-2 design earthquake are shown on Figure 11, whereas the corresponding acceleration response spectra are shown on Figure 12.
SUMMARY AND CONCLUSIONS A constant-spectral displacement approach was adopted for development of seismograms for use in design of the Utah State Capitol seismic renovation. Few normal-faulting earthquake recordings suitable for use in engineering design are available. Therefore, the Composite Source Model was used to generate realistic seismograms for earthquakes on the Salt Lake City segment of the Wasatch fault located less than 1 km west of the site. The Composite Source Model treats all geologic materials as linear, and produced very high short-period motions. Adjustments were made to Fourier amplitude spectra to bring acceleration response spectra close to the target design spectra, and inverse Fourier transforms were computed to produce adjusted seismograms. The Composite Source Model appears to be a valuable tool for earthquake engineering.
REFERENCES 1. Anderson, John G., 1997, Seismic energy and stress-drop parameters for a composite source model:
Bulletin of the Seismological Society of America, v. 87, no. 1, p. 85-96. 2. Anderson, John G., and Yu, G., 1996, Predictability of Strong Motions from the Northridge,
California, Earthquake: Bulletin of the Seismological Society of America, v. 86, no. 1B, p. S100-S114
3. ASCE, 2000, Prestandard and commentary for the seismic rehabilitation of buildings: prepared by
American Society of Civil Engineers for Federal Emergency Management Agency, FEMA 356, various pagination.
4. Black, Bill D., Lund, William R. Schwartz, David P., Gill, Harold E., and Mayes, Bea H., 1996,
Paleoseismic investigation on the Salt Lake City segment of the Wasatch fault zone at the South Fork Dry Creek and Dry Gulch sites, Salt Lake County, Utah: Utah Geological Survey Special Study 92, 22 p.
5. Keaton, Jeffrey, R., 2000, Synthetic seismograms for normal-faulting earthquakes using the
Composite Source Model: Earthquake Engineering Research Institute Professional Fellowship Report for 1999, 94 p.
6. Keaton, J.R., Zeng, Y., and Anderson, J.A., 2000, Procedures for scaling earthquake records to
match acceleration response spectra for engineering design: Proceedings of the Sixth International Conference on Seismic Zonation, Earthquake Engineering Research Institute, Oakland, CA, CD-ROM Paper 00130.pdf, 5 p.

-400-300-200-100
0100200300400
0 5 10 15 20 25 30 35 40
Time (s)
Acc
eler
atio
n (c
m/s
/s)
-400-300-200-100
0100200300400
0 5 10 15 20 25 30 35 40
Time (s)
Acc
eler
atio
n (c
m/s
/s)
-400-300-200-100
0100200300400
0 5 10 15 20 25 30 35 40
Time (s)
Acc
eler
atio
n (c
m/s
/s)
Figure 9. Acceleration time histories for M2171 scaled to BSE-1 response spectra.
Upper record is fault-parallel, middle record is fault-normal, lower record is vertical.
Figure 10. Acceleration response spectra for M2171 scaled to BSE-1.
Sa FP is fault-parallel, Sa FN is fault-normal, Sav is vertical.
-1000
-500
0
500
1000
0 5 10 15 20 25 30 35 40
Time (s)
Acc
eler
atio
n (c
m/s
/s)
-1000
-500
0
500
1000
0 5 10 15 20 25 30 35 40
Time (s)
Acc
eler
atio
n (c
m/s
/s)
-1000
-500
0
500
1000
0 5 10 15 20 25 30 35 40
Time (s)
Acc
eler
atio
n (c
m/s
/s)
Figure 11. Acceleration time histories for S2375 scaled to BSE-2 response spectra.
Upper record is fault-parallel, middle record is fault-normal, lower record is vertical.
Figure 12. Acceleration response spectra for S2375 scaled to BSE-2.
Sa FP is fault-parallel, Sa FN is fault-normal, Sav is vertical.

7. Su, Feng, Zeng, Yuehua, and Anderson, John G., 1994a, Simulation of Landers earthquake strong motion using a composite source model (abstract): Seismological Research Letters, v. 65, p. 52.
8. Su, Feng, Zeng, Yuehua, and Anderson, John G., 1994b, Simulation of the Loma Prieta earthquake
strong ground motion using a composite source model (abstract): 1994 Fall Meeting, American Geophysical Union, p. 448.
9. Wong, Ivan, Silva, Walter, Olig, Susan, Thomas, Patricia, Wright, Douglas, Ashland, Francis,
Gregor, Nick, Pechmann, James, Dober, Mark, Christenson, Gary, and Gerth, Robyn, 2002, Earthquake scenario and probabilistic ground shaking maps for the Salt Lake City, Utah, metropolitan area: Utah Geological Survey Miscellaneous Publication 02-5, 50 p.
10. Zeng, Yuehua, and Anderson, John G., 1996, A composite source model of the 1994 Northridge
earthquake using genetic algorithms: Bulletin of the Seismological Society of America, v. 86, p. S71-S83.