system concepts for invasive pressure monitoring
TRANSCRIPT
Chapter28 Reed M. Gardner
System Concepts for Invasive Pressure Monitoring
155. Gardner RM. System Concepts for Invasive Pressure In CRITICAL CARE Taylor 1 Robert R.
Monitoring. pages 303-310 Chapter 28 Edited by Joseph M. Ci vetta 1 Robert W. Kirby. J .B. Lippincott Inc Publishers. 1988.
Philidelphia 1 PA
Invasive pressure monitoring is now routinely performed at the patient's bedside, incorporating technology more advanced than that which, formerly, only specialized cardiac catheterization laboratories used. The monitoring enables the clinician to better understand the relation between the pressure and blood flow in the patient's cardiovascular system. However, every measuring system has the capability of producing false information. Constant vigilance and understanding of the system are currently the best prescription for ensuring acquisition of high-quality pressure monitoring information.
INVASIVE BLOOD PRESSURE MEASUREMENT
Arterial blood pressure can be measured by both invasive and non-invasive means. However, central venous pressure (CVP), pulmonary artery (PA), and pulmonary artery occlusion pressure (PAOP), at present, can only be measured by invasive means.
The invasive measurement of blood pressure allows for continuous and accurate assessment of blood pressures. Continuous pressure measurement permits detection of dangerous hemodynamic events and provides the information necessary to initiate and titrate patient therapy. Nevertheless, invasive pressure monitoring provides valuable information only when it is obtained accurately with correct technique.
This chapter describes only the technical aspects of invasive monitoring. Details about catheter insertion techniques (see Chaps. 26 and 27) and their associated complications,
physiologic measurements for clinical understanding, and managing patient-related problems are discussed in other chapters of Critical Care.
EQUIPMENT
The components of an invasive blood pressure monitoring system for critically ill patients are shown in Figure 28-1. 1•2
The components known as the "plumbing system" ( 1-7 in the figure) must always be sterile because they come in direct contact with the patient's blood. Usually these components are disposable items and are often discarded after 48 to 72 hours to minimize the risks of infection. The other components (8-11 ) in the system are used for processing and displaying pressure waveforms and obtaining derived hemodynamic parameters, and they will be briefly described.
CATHETER. Arterial and pulmonary artery catheters provide access to the patient's blood vessels to monitor intravascular pressure and to provide a site for samples for blood gas analysis and other tests.
STOPCOCK NUMBER I. This stopcock is used as a sampling site for withdrawing blood for analysis. When filling the plumbing system with fluid , precautions must be taken to be sure all central switching cavities of the stopcock are filled and that all entrapped air bubbles are removed. Because stopcocks are particularly vulnerable sources of patient contamination, stopcocks should be handled with extreme care; ports not in active use should be covered with sterile caps and the open ports should never be touched.
303

304 MONITORING: WHAT IS HELPFUL AND WHAT IS NOT
PRESSURE TUBING. The catheter and stopcock are normally attached to the flush device and transducer by noncompliant pressure tubing. To optimize the dynamic response of the plumbing system, long lengths of tubing should be avoided.
STOPCOCK NUMBER 2. The stopcock is usually put in place to allow disconnection of the flush device and transducer from the patient when the patient is moved or during initial filling of the system with fluid.
CONTINUOUS FLUSH DEVICE. The continuous flush device is used to fill the pressure monitoring system initially and helps prevent blood clotting in the catheter by continuously flushing fluid through the· system at a rate of from 1 to 3 mllhi.
TRANSDUCER DOME. Disposable diaphragm domes have come into common use in recent years. These domes provide isolation between the transducer and the patient and permit rapid reuse of the transducer without resterilization. However, if the diaphragm domes are not properly coupled to the pressure transducer, severe waveform distortion can occur.
PRESSURE TRANSDUCER. Available in a variety of sizes and shapes, pressure transducers are usually resistive devices that convert the movement of their sensing diaphragm into an electrical signal. Recently standards for blood pressure transducers have been developed by the Association for the Advancement of Medical Instrumentation (AAMI) and adopted by the American National Standards Institute (ANSI).3·4 These standards should greatly simplify transducer selection and will eventually allow the same transducer to be used interchangeably with any monitor. Several excellent quality disposable pressure transducers are now available. 5
They are smaller, have better technical qualities, and can better withstand the rigors of clinical use than the outdated reusable transducers.
FIG. 28-1. The 11 components used to monitor blood pressure directly are nearly the same independent of whether the catheter is in an artery (radial, brachial, or femoral) or in the pulmonary artery. The size of the transducer and plumbing components were enlarged for illustration purposes. (Adapted from Gardner RM, Hollingsworth KW: Optimizing ECG and pressure monitoring. Crit Care Med 1986; 14:651)
AMPLIFIER SYSTEM. The output voltage required to drive an oscilloscope or strip recorder is provided by an amplifier system inserted between the transducer and display. Transducer excitation is provided either from a direct current (DC) or alternating current (AC) source at a voltage of 4 to 8 volts RMS. Most amplifier systems include low pass filters that filter out unwanted high frequency signals. Pressure amplifier frequency response should be "flat," from 0 to 50 Hz to avoid pressure waveform distortion.1·2
OSCILLOSCOPE. Pressure waveforms are best visualized on a calibrated oscilloscope.
PROCESSOR/DIGITAL DISPLAY. Digital displays provide a simple method for presenting quantitative data from the pressure waveform. They are found on most modem pressure monitoring equipment. Systolic, diastolic, and mean pressure are derived from the pressure waveforms.
RECORDER. Frequently strip chart recorders are used to document dynamic response characteristics, respiratory variations in pulmonary artery pressures, and aberrant rhythms and pressure waveforms.
EQUIPMENT SET-UP
Zeroing the Transducer
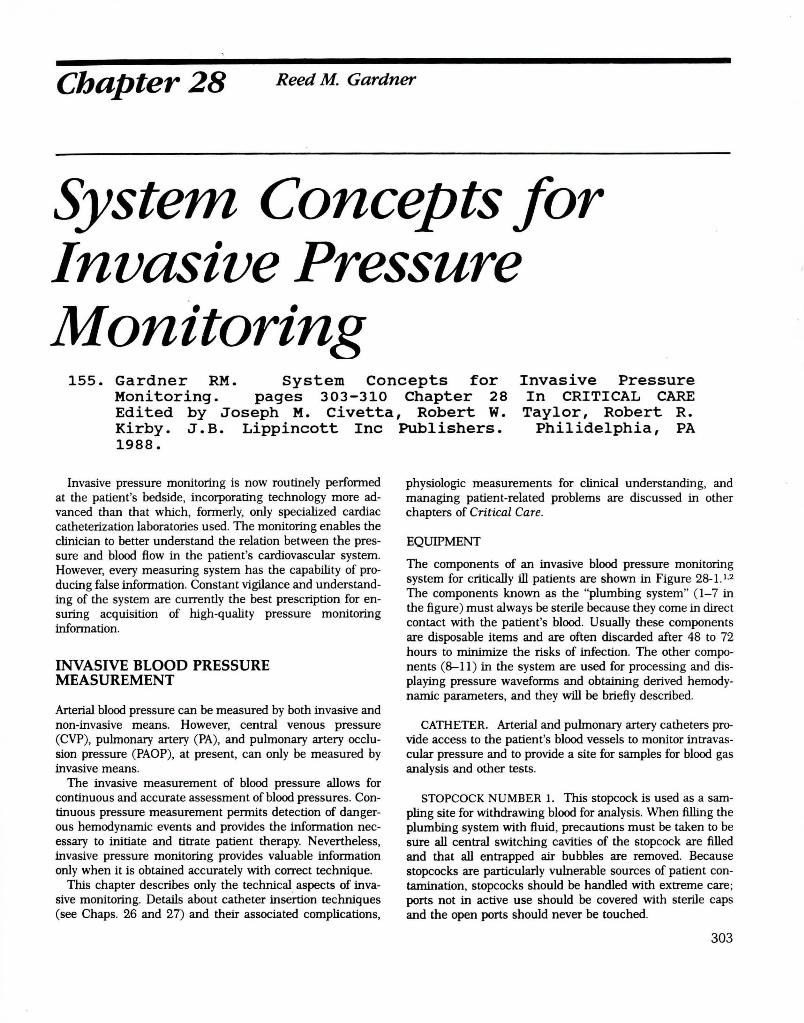
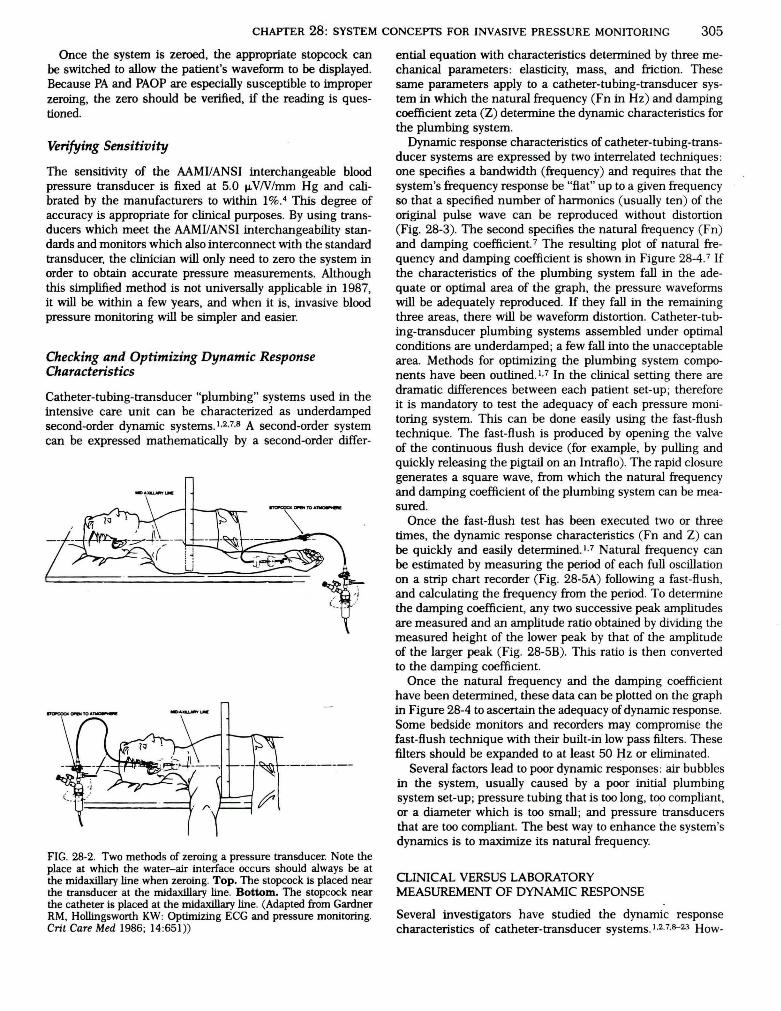
The accuracy of blood pressure readings depends on establishing an accurate reference point from which all subsequent measurements are made. The patient's midaxillary line (right heart level) is the reference point most commonly used. The zeroing process is used to compensate for offset caused by hydrostatic pressure differences, or offset in the pressure transducer, amplifier, oscilloscope, recorder, and digital displays. Zeroing is accomplished by opening an appropriate stopcock to atmosphere and aligning the resulting fluid-air interface with the midaxillary reference point. 1·2·6 Figure 28-2 shows two methods which can be used to zero the transducer.l.2
CHAPTER 28: SYSTEM CONCEPTS FOR INVASIVE PRESSURE MONITORING 305
Once the system is zeroed, the appropriate stopcock can be switched to allow the patient's waveform to be displayed. Because PA and PAOP are especially susceptible to improper zeroing, the zero should be verified, if the reading is questioned.
Verifying Sensitivity
The sensitivity of the AAMIIANSI interchangeable blood pressure transducer is fixed at 5.0 11-VN/mm Hg and calibrated by the manufacturers to within 1%.4 This degree of accuracy is appropriate for clinical purposes. By using transducers which meet the AAMIIANSI interchangeability standards and monitors which also interconnect with the standard transducer, the clinician will only need to zero the system in order to obtain accurate pressure measurements. Although this simplified method is not universally applicable in 1987, it will be within a few years, and when it is, invasive blood pressure monitoring will be simpler and easier.
Checking and Optimizing Dynamic Response Characteristics
Catheter-tubing-transducer "plumbing" systems used in the intensive care unit can be characterized as underdamped second-order dynamic systems.1•2•7•8 A second-order system can be expressed mathematically by a second-order differ-
FIG. 28-2. Two methods of zeroing a pressure transducer. Note the place at which the water-air interface occurs should always be at the midaxillary line when zeroing. Top. The stopcock is placed near the transducer at the midaxillary line. Bottom. The stopcock near the catheter is placed at the midaxillary line. (Adapted from Gardner RM, Hollingsworth KW: Optimizing ECG and pressure monitoring. Crit Care Med 1986; 14 :651))
ential equation with characteristics determined by three mechanical parameters: elasticity, mass, and friction. These same parameters apply to a catheter-tubing-transducer system in which the natural frequency (Fn in Hz) and damping coefficient zeta (Z) determine the dynamic characteristics for the plumbing system.
Dynamic response characteristics of catheter-tubing-transducer systems are expressed by two interrelated techniques: one specifies a bandwidth (frequency) and requires that the system's frequency response be "flat" up to a given frequency so that a specified number of harmonics (usually ten) of the original pulse wave can be reproduced without distortion (Fig. 28-3). The second specifies the natural frequency (Fn) and damping coefficient. 7 The resulting plot of natural frequency and damping coefficient is shown in Figure 28-4. 7 If the characteristics of the plumbing system fall in the adequate or optimal area of the graph, the pressure waveforms will be adequately reproduced. If they fall in the remaining three areas, there will be waveform distortion. Catheter-tubing-transducer plumbing systems assembled under optimal conditions are underdamped; a few fall into the unacceptable area. Methods for optimizing the plumbing system components have been outlined.1•7 In the clinical setting there are dramatic differences between each patient set-up; therefore it is mandatory to test the adequacy of each pressure monitoring system. This can be done easily using the fast-flush technique. The fast-flush is produced by opening the valve of the continuous flush device (for example, by pulling and quickly releasing the pigtail on an lntraflo). The rapid closure generates a square wave, from which the natural frequency and damping coefficient of the plumbing system can be measured.
Once the fast-flush test has been executed two or three times, the dynamic response characteristics (Fn and Z) can be quickly and easily determined.1•7 Natural frequency can be estimated by measuring the period of each full oscillation on a strip chart recorder (Fig. 28-5A) following a fast-flush , and calculating the frequency from the period. To determine the damping coefficient, any two successive peak amplitudes are measured and an amplitude ratio obtained by dividing the measured height of the lower peak by that of the amplitude of the larger peak (Fig. 28-5B). This ratio is then converted to the damping coefficient.
Once the natural frequency and the damping coefficient have been determined, these data can be plotted on the graph in Figure 28-4 to ascertain the adequacy of dynamic response. Some bedside monitors and recorders may compromise the fast-flush technique with their built-in low pass filters . These filters should be expanded to at least 50 Hz or eliminated.
Several factors lead to poor dynamic responses: air bubbles in the system, usually caused by a poor initial plumbing system set-up; pressure tubing that is too long, too compliant, or a diameter which is too small; and pressure ' transducers that are too compliant. The best way to enhance the system's dynamics is to maximize its natural frequency.
CLINICAL VERSUS LABORATORY MEASUREMENT OF DYNAMIC RESPONSE
Several investigators have studied the dynamic response characteristics of catheter-transducer systems.1.2.7.S--23 How-

306 MONITORING: WHAT IS HELPFUL AND WHAT IS NOT
FIG. 28-3. Family of frequency versus amplitude ratio plots for five different damping coefficients (Zeta) and two different natural frequencies, 10 and 20 Hz. A damping coefficient of 0.1 occurs if the system is very underdamped, while a damping coefficient of 2 occurs when a system is overdamped. The dashed line shows the ideal or "flat" frequency versus amplitude response. Note that the response of the system with a 10-Hz natural frequency can be brought closer to the ideal "flat" response if the damping coefficient is between 0.5 and 0. 7. However, by increasing the natural frequency to 20 Hz, the range of damping coefficients can be widened still further and give nearly the same "flat" frequency response.
I. 2
1.1
.I
. 2
.3
~-----~.4 . 2 .s
.e .I ·' oo:--~-:--'-7.:"--7.;---:~--:7----:-L:~~::::::::::...J-,_-_-_-_-.J.. --------.J::
!5 10 1:1 20 2!5 30 3!5 40 4!5 50
FREQUENCY CHZ>
FIG. 28-4. Plot shows the range of damping coefficient (Zeta) and natural frequencies outlining the regions that indicate the type distortion of the pressure wave. See Figure 28-5 for examples.

CHAPTER 28: SYSTEM CONCEPTS FOR INVASIVE PRESSURE MONITORING 307 HR•I2 i!P/dt•I400~MC F'n • J..5 Hz ZETA • 1-04 CIIIICliiW. 1111\IEFORiol ... .... A 8
IIIII IIIII
U7 '--·~ D
Fn • 15Hz ZETA • 0.15 fll- 15Hz ZETA- o.eo .... .... c 0
IIIII IIIII
fll• 24Hz ZETA • 0.15 IIIII
E
IIIII
FIG. 28-5. Arterial pressure waveforms recorded with different pressure monitoring systems. Patient heart rate is 92 with a maximum dp/dt of 1400 mm Hglsec. Panel A. The original patient waveform as it might be recorded with a catheter tipped pressure transducer. The systolic pressure is 118 mm Hg, diastolic is 55 mm Hg, and mean pressure is 81 mm Hg. Panel B. The same patient's arterial pressure waveform recorded with an "overdamped" plumbing system. Zeta is 1.04 and Fn is 3.5 Hz. Note the "fast flush" signal (upper left) returns slowly to the patient waveform. Systolic pressure is underestimated at 106 mm Hg, diastolic pressure is overestimated at 59 mm Hg, but mean ressure is unchanged at 81 mm Hg. Panel C. An "underdamped" condition with a low damping coeffi· cient of 0.15 and a natural frequency of 15Hz. After the "fast flush ," the pressure waveform oscillates rapidly and returns to the original waveform shape quickly. Systolic pressure is overestimated at 128 mm Hg, diastolic is nearly the same as the original at 54 mm Hg, and the mean pressure is unchanged at 81 mm Hg. Panel D. Same as in Panel C, but now a damping device has been inserted and adjusted.1·7 The waveform is optimally damped with a damping coefficient of 0.60 and a natural frequency of 15 Hz. Panel E. An "underdamped" condition but with high natural fre. quency of 24 Hz. Note the pressure waveform is only slightly distorted and the pressures are close to the true pressures.
ever, all of these studies were performed in the laboratory and not extended to the clinical setting. A recent study has determined the dynamic response fidelity of catheter-transducer systems in the laboratory and the clinical setting.24
The results of this study indicate that the simpler the mechanical plumbing set-up of a pressure monitoring system, the higher its fidelity.24 The more complex the system, that is, the greater the number of components within the system, the greater the susceptibility of that system to giving a degraded dynamic performance. Lack of tubing and absence of the membrane dome-transducer diaphragm coupling minimized the chances of air bubble entrapment. Chances for set-up error were also minimized with simpler systems.
The dynamic response characteristics of a system that uses
compliant catheters or tubing, or that contains air bubbles have large volume displacement. Systems that use long narrow catheters (such as the pulmonary artery catheter), or have long lengths of small-diameter pressure tubing, are not desirable because Fn will decrease and zeta will increase. Conversely, if the catheters and tubing are noncompliant and short, with large diameters and no air bubbles, then the Fn will increase and zeta will decrease.
Figure 28-6 illustrates the effects of tubing length and air bubbles entrapped in the system. As the volume displacement (Vd) increases, there is a decrease in Fn and an increase in damping coefficient. The magnitude of the change is multiplied for systems with long catheters or tubing (pulmonary artery catheter and radial catheter with 72-inch tubing). For the short radial arterial catheter, the effect of tubing length is also apparent. Increasing the tubing from 12 to 72 inches with no air bubbles in the system reduces the Fn from 39 to 23 Hz. For a pulmonary artery catheter system without pressure tubing, the effect of increasing air bubble size (Vd) on the system is shown. Note in every case that the operating point moves upward and to the left. Despite what is taught in some centers, adding air to the transducer to "damp" the pressure waveform is not a good idea.
The use of extension tubing for PA lines was found to be especially detrimental to the system's response. The adverse effects of long tubing are compounded because of the long length of the PA catheter. The use of extension tubing, which affords greater freedom of mobility from the transducer to the catheter, seems to be contraindicated.
This same study found that each clinical catheter-tubingtransducer system must have its dynamic response verified at frequent intervals.24 There can be a vast difference in fidelity between the ideal laboratory setting and the clinical setting, where the system is subject to changes over time, human assembly error, repeated blood sample withdrawal, and air entrapment. The fast-flush method of determining the dynamic response characteristics is a simple, rapid, and safe testing modality that can be easily incorporated clinically.1·2·7 By performing the fast-flush testing on each clinical system, the adequacy of dynamic response can be verified and optimized if necessary. If a fast-flush testing produces dynamic response characteristics that are inadequate, the user can take the opportunity to trouble-shoot the system (i .e., remove excessive tubing length, purge air bubbles, reattach membrane dome according to protocol) until acceptable characteristics are obtained.
SELECITNG BLOOD PRESSURE TRANSDUCERS
The objective of the recently published AAMI/ANSI blood pressure transducer standards was to provide labeling and performance requirements, testing methodology, and terminology to help ensure that health care professionals are supplied with safe, accurate blood pressure transducers that could be used interchangeably with any monitor.4 Unfortunately a connector change or a conversion cable adapter alone may not be sufficient to allow interchangeability with standardized transducers. To provide interchangeability the monitor must use the AAMUANSI standard connector; have an excitation voltage between 4 and 8 volts RMS in the fre-

308 MONITORING: WHAT IS HELPFUL AND WHAT IS NOT
A • ~ 2" 20GA +12" 1. L • ~ 2" 20GA +72"
P • 7FR PUUt ARTEJn' NO lUBE
0
FRalJENCY OIZ>
quency range of DC (0) to 5000 Hz; be able to accept a transducer imbalance in the range of ± 75 mm Hg; supply an excitation voltage and accept transducers with an excitation impedance of greater than 200 ohms; be based on a transducer sensitivity of 5 tLVN/mm Hg; and maintain accuracy when used with a transducer that has a signal impedance of less than 3000 ohms.
To ensure that the monitor has these capabilities, it is recommended that the monitor's specifications be carefully analyzed or that the monitor manufacturer be asked about any limitations which would prevent the use or accuracy of the MMUANSI standard for interchangeable blood pressure transducers.
Requirements of the AAMIIANSI Interchangeability Standard
Environmental Performance: The transducer should be able to operate at temperatures between 15°C and 40°C.
Mechanical Requirements: Operate over a pressure range of - 30 to + 300 mm Hg, and not be damaged by overpressure of -400 to +4000 mm Hg. Luer-Lok or Linden fittings should meet the ANSI standard ''Performance Standard for Medical Luer Taper Fittings."
Electrical Performance: Transducer excitation should be within 4 to 8 volts RMS in the frequency range of DC (0) to 5000 Hz. The transducer excitation impedance should be greater than 200 ohms over this same frequency range. The transducer signal impedance should be less than 3000 ohms over the same frequency range. The transducer sensitivity should be 5 tJ-VN/mm Hg ± 1% under specified conditions. The linearity and hysteresis shall be within ± 2% of the pressure reading or ± 1 mm Hg, whichever is greater.
Safety Requirements: The transducer shall maintain electrical isolation between the fluid column and the case, to prevent unsafe electrical current leakage into the patient. The transducer must withstand five repeated discharges of a defibrillator.
Q ;:: ~
~ ii: I
• 1
.2
.3
... • 5 .e .7 .a .II
so
FIG. 28-6. Plot of natural frequency versus damping coefficient for two arterial and one pulmonary artery pressure monitoring system shows the effect of inserting small bubbles into the transducer dome. The volumes (Vd) of air inserted in microliters are shown near the marks on the curves. The curves were generated using the modeling techniques of Taylor et al. 23 Results are presented for short radial catheters (Deseret 2") with 12" (Index A) and 72" (Index L) of pressure tubing . The results from a pulmonary artery catheter system without extension tubing are shown as Index P. Note that for all situations the operating point moves upward and to the left with the addition of air into the system. The best condition is always when NO air is in the system.
Instruction Manual: In addition to these performance criteria the instruction manual for the transducers should contain the following information:
Information, cautions, and warnings about storage, use handling, and sterilization of the transducer; also the names and addresses of acceptable customer service facilities. The "shock" that the transducer can withstand and still meet the standards requirements. The "volume displacement" of the transducer and attached accessories. Volume displacement is one of the most important determinants of dynamic response. The warm-up drift one might expect. The changes in zero and sensitivity with temperature change over the range of 1s•c to 4o•c. The light sensitivity of the transducer, since some of the newer disposable transducers are also light sensitive (Fig. 28-7).
COMPLICATIONS OF INVASIVE PRESSURE MONITORING
The three most important risks associated with vascular cannulation and direct blood pressure monitoring are air embolism, thrombosis, and infection.
AIR EMBOLISM
Air embolism is the introduction of air into the circulatory system. Air insufflation can occur in a variety of ways into either the venous or arterial portion of the circulation. Venous air embolism may reduce or stop the flow of blood through the heart or may cause neurologic complications. The exact amount of venous air which is fatal to adults is not known, but it is estimated to be between 300 and 1600 ml.22 The rate of air injection into the venous circulation is of primary importance. Death appears to be due to the right ventricle compressing the air rather than pumping blood.
The mechanism for arterial air embolism is different. Air entering the left side of the heart passes quickly into the aorta. Then, depending on the position of the patient, the air

CHAPTER 28: SYSTEM CONCEPTS FOR INVASIVE PRESSURE MONITORING · 309
UTAH MEDICAL
~FLUSH
FIG. 28-7. Photograph of a disposable transducer shows its small size and rugged construction characteristics.
may flow into the coronary and/or the cerebral arteries.22 Air entering these vessels then obstructs the flow of blood to areas supplied by these vessels. In dogs, small amounts of air in the range of 0.05 to 1 ml injected into the coronary circulation have been fatal. 22 Air embolism is best prevented by using continuous flush systems and keeping the plumbing systems closed. 22·25
lHROMBOSIS
Thrombosis can be caused by an invasive catheter, but it is an infrequent complication of arterial or pulmonary artery catheterization. Embolization of clots formed on a catheter can be flushed retrograde into the central circulation from radial arterial cannulation sites. To minimize thrombus formation, continuous flush systems have been developed to
· keep catheters patent and prevent the need to use syringes to flush catheters. 25•26 In recent years pulmonary artery catheters have had heparin-bonding added to their surface in an attempt to minimize thrombus formation, although no longterm data are available to demonstrate an effect. 27
INFECTION
Although invasive pressure monitoring provides valuable monitoring information, it can also result in bacteremia due
to contamination of catheters, stopcocks, pressure transducers, and flush solutions.~2 Early pressure transducers were reusable, and when they were not properly sterilized, they caused epidemics of bacteremia.28 As a result, sterile diaphragm disposable domes were developed. These diaphragm domes did not eliminate the bacteremias and resulted in poor system dynamic response. The Centers for Disease Control now recommends changing domes and other disposable components every 48 hours.31 Several recent studies, however, have supported extended use of the disposable components.29·30·32 To prevent contamination of pressure monitoring systems and the patients to whom they are attached, the sterility of the monitoring plumbing system must be maintained.
SIGNAL AMPLIFICATION, PROCESSING, AND DISPLAY
Once the pressure signal has been transmitted to the transducer, the bedside monitor operates on that signal. Most monitors display the heart rate and systolic, diastolic, and mean pressure with a digital display. During a recent evaluation of bedside monitors it was found that applying the same pressure waveforms to each of three monitors gave different results. 33 In addition none of the monitors recognized and rejected the following artifact conditions: zeroing the transducer, fast-flushing of the system, and drawing blood from the patient. These conditions occur several times a day during normal patient care and result in false alarms and erroneous trend data logging. 33
To help eliminate these problems, new algorithms are being developed for bedside pressure monitors. Preliminary testing has shown that these enhanced algorithms produce dramatic improvements in the bedside monitor's ability to evaluate pressure waveforms in the clinical setting. 34 According to the study,
Present monitoring systems allow far too much artifactual data to reach the monitor's display, trend buffer, and alarm logic.
The enhanced pressure artifact rejection algorithm eliminates most of the false alarms caused by zeroing, flushing, and blood drawing.
The trend displays of the new algorithm are more representative of actual patient conditions.
Data sent from the bedside monitor to the computerized patient data management system is more valid and thus patient data management computer systems can be programmed to automatically acquire patient data.
Algorithms for enhancing the quality of data derived from pulmonary artery pressure waveforms have recently been developed and applied. 35
REFERENCES
1. Gardner RM, Hollingsworth KW: Optimizing ECG and pressure monitoring. Crit Care Med 1986; 14:651
2. Gardner RM : Hemodynamic monitoring: From catheter to display. Acute Care (in press)
3. Gardner RM, Kutik M (co-chairmen): American national stan-

310 MONITORING: WHAT IS HELPFUL AND WHAT IS NOT
dard for blood pressure transducers. General. Association for the Advancement of Medical Instrumentation/American National Standards Institute 1986, Arlington, VA
4. Gardner RM, Kutik M (co-chairmen): American national standard for interchangeability and performance of resistive bridge type blood pressure transducers. Association for the Advancement of Medical Instrumentation/American National Standards Institute 1986, Arlington, VA
5. Disposable pressure transducers. Health Devices, September 1984; 13:268. ECRI, Plymouth Meeting, PA
6. Geddes LA: The signficance of a reference in the direct measurement of blood pressure. Med Instrum 1986; 20:331
7. Gardner RM : Direct blood pressure measurement-Dynamic response requirements. Anesthesiology 1981 ; 54:227
8. Geddes LA: The direct and indirect measurement of blood pressure. Chicago, Year Book Medical Publishers, 1970
9. Hansen AT: Pressure Measurement in the Human Organism. Acta Physiol Scand 1949; 19(Suppl 68): 1
10. Hansen AT, Warburg E: The theory for elastic liquid containing membrane manometers. Acta Physiol Scand 1949; 19(Suppl 65): 306
11 . Fry DL: Physiologic recording by modem instruments with particular reference to pressure recording. Physiol Rev 1960; 40:753
12. Wood EH, Sutterer WF: Strain-gauge manometers : Application to recording of intravascular and intracardiac pressures. In Glasser 0 (ed): Medical Physics, Vol 3, p 641. Chicago, Year Book Publishers, 1960
13. Crul JF : Measurement of arterial pressure. Acta Anaesthesiol Scand 1962; 6(Suppl XI): 135
14. Shapiro G, Krovetz W: Damped and undamped frequency responses of underdamped catheter-manometer systems. Am Heart 1 1970; 80:226
15. McCutcheon EP, Evans JM, Stanifer RR: Direct blood pressure measurement: Gadgets versus progress. Anesth Analg 1972; 51 :746
16. Fox F, Morrow DH, Kacher EJ , Gilleland TH II : Laboratory evaluation of pressure transducer domes containing a diaphragm. Anesth Analg 1978; 57:67
17. Shinozaki T, Deane RS, Mazuzan JE: The dynamic response of liquid-filled catheter system for direct measurement of blood pressure. Anesthesiology 1980; 53:498
18. Gardner RM: Blood pressure monitoring: Sharing common elements, problems. IEEE-EMB Magazine 1982; 1:28
19. Boutros A, AlbertS: Effect of the dynamic response of transducer tubing system on accuracy of direct pressure measurement in patients. Crit Care Med 1983; 11 :124
20. Yeomanson CW, Evans DH : The frequency response of external transducer blood pressure measurement systems: A theoretical and experimental study. Clin Phys Physiol Meas 1983; 4:435
21. Soule DT, Powner DJ : Air entrapment in pressure monitoring lines. Crit Care Med 1984; 12:520
22. Toll MO: Direct blood-pressure measurements : Risks, technology evolution and some current problems. Med Bioi Eng Comput 1984; 22:2
23. Taylor BC, Ellis DM, Drew JM: Quantification and simulation of fluid-filled catheter/transducers systems. Med Instrum 1986; 20:123
24. Gibbs NC, Gardner RM : Dynamics of invasive pressure monitoring systems: Clinical and laboratory evaluation (unpublished manuscript)
25. Gardner RM , Bond EL, Clark JS : Safety and efficacy of continuous flush systems for arterial and pulmonary artery catheters. Ann Thorac Surg 1977; 23:534
26. Gardner RM, Warner HR, Toronto AF, Gaisford WD: Catheterflush system for continuous monitoring of central arterial pulse waveform. 1 Appl Physiol 1970; 29:911
27. Hoar PF, Wilson RM, Mangano DT, et al: Heparin bonding reduces thrombogenicity of pulmonary-artery catheters. N Engl 1 Med 1981 ; 305:993
28. Weinstein RA, Starn WE, Kramer L, et al : Pressure monitoring devices: Overlooked source of nosocomial infection. lAMA 1976; 236:936
29. Thomas F, Burke JP, Parker J, et al : The risk of infection related to radial vs. femoral sites for arterial catheterization. Crit Care Med 1983; 11 :807
30. Sommers MS, Baas LS: Nosocomial infections related to four methods of hemodynamic monitoring. Heart Lung 1987; 16:13
31. Simmons BP: Centers for Disease Control: Guidelines for prevention of infections related to intravascular pressure-monitoring systems. Infect Control1982; 3:68
32. Luskin RL, Weinstein RA, Nathan C, et al: Extended use of disposable pressure transducers: A bacteriologic evaluation. lAMA 1986; 255:916
33. Maloy L, Gardner RM : Monitoring systemic arterial blood pressure: Strip recording versus digital display. Heart Lung 1986; 15:627
34. Gardner RM, Monis SM, Oehler P: Monitoring direct blood pressure: Algorithm enhancements. IEEE Computers in Cardiology, Boston, MA, October 1986
35. Ellis DM ; Interpretation of beat-to-beat blood pressure values in the presence of ventilatory changes. 1 Clin Manit 1985; 1:65