system dynamics as a complementary method for real estate
DESCRIPTION
System Dynamics as a complementary method for Real Estate. June 27th, 2009 Martijn Eskinasi. What is system dynamics?. An explanatory and simulation methodology Used for both quantitative and qualitative modeling Used in expert approach and interactive learning processes Its claim to fame: - PowerPoint PPT PresentationTRANSCRIPT
System Dynamics as a complementary
method for Real Estate
June 27th, 2009
Martijn Eskinasi
What is system dynamics?
• An explanatory and simulation methodology
• Used for both quantitative and qualitative modeling
• Used in expert approach and interactive learning processes
• Its claim to fame:
– “Find robust policy measures for highly complex dynamic problems”

Basic ideas & concepts
• Structure of a system drives its dynamic behaviour in time
• Structure is based on causal loop, stocks and flows
• Policy measures are very tenacious• Because people cannot mentally simulate highly
complex dynamic systems
• Murphy's law in practice??
Causal loops and feedback
• Axioma of circular causalities and feedback• Reality consists of intertwined causal loops
– “Laundry list thinking” is not realistic, • at least does not lead to dynamic behaviour
• Identify causal relations– Positive and negative polarities
• Identify the causal loops!– Balancing and reinforcing

Some simple examples
Rent Demand
Structure Behaviour
O
B
W 0 1 W 0 2 W 0 3 W 0 4
4 0
6 0
8 0
Var
YieldCompression
Investorfrenzy
R
W 0 1 W 0 2 W 0 3 W 0 4
3 0
6 0
9 0
Rein
forc
ing
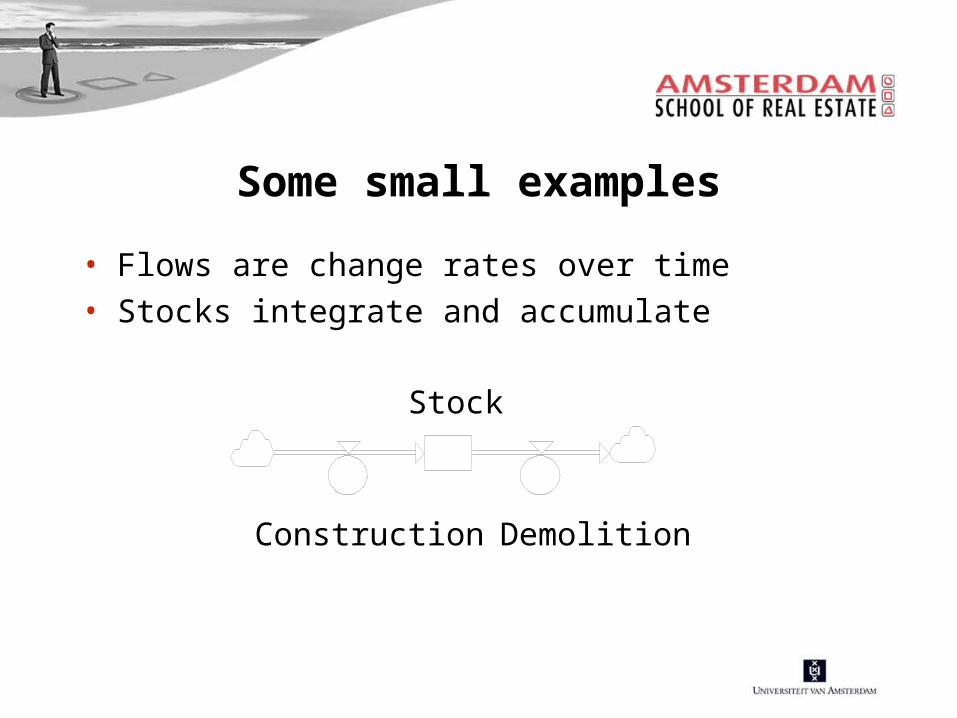
Some small examples
• Flows are change rates over time• Stocks integrate and accumulate
Stock
DemolitionConstruction
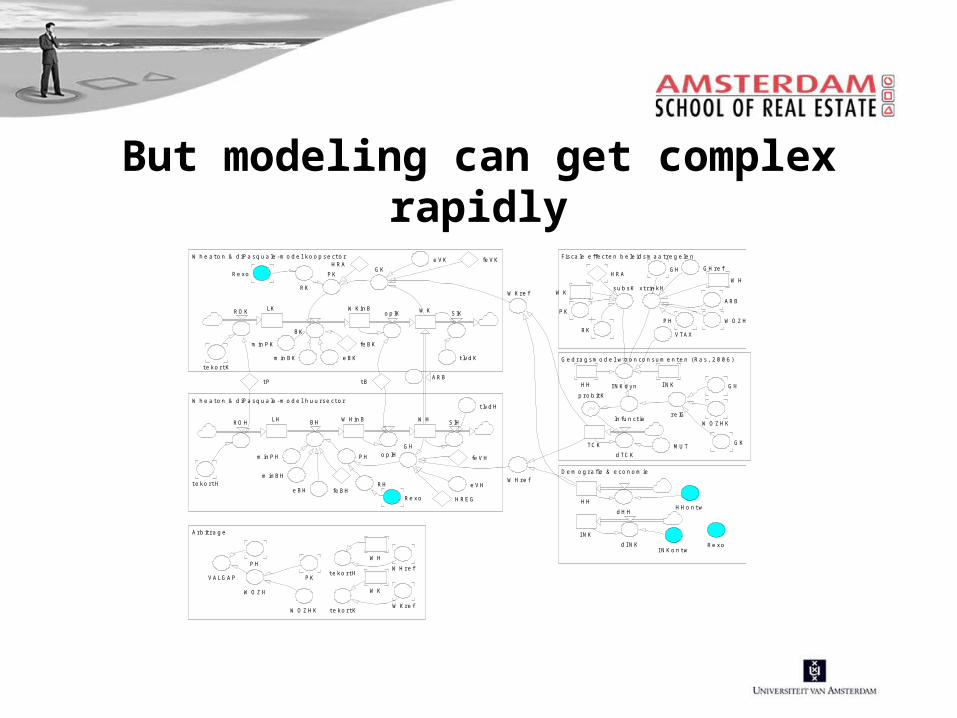
But modeling can get complex rapidly
Ge dra gsmo de l w o o nco nsume nte n (Ra s, 2006 )
De mo gra fie & e co no mie
W he a to n & d iP a squa le -mo de l ko o pse cto r
W he a to n & d iP a squa le -mo de l huu rse cto r
Arb itra ge
Fisca le e ffe cte n be le idsma a tre ge le n
W K
W H
W KinB
W HinB
LK
LH
ROK
ROH
BK
BH
o p lK
o p lH
S lK
S lH
tB
tlvdK
tlvdH
GK
GH
P K
P H
RK
HRA
ARB
minP K
minBK e BK
minP H
minBH
e BHRH
e VK
e VH
fe BK
fe VK
fe VH
fe BH
W Kre f
W Hre f
HRE G
pro b itK
re lG
HH
dHH
I NKdyn
P K
W OZH
GH
GK
W OZHK
W OZHK
P H
ln functie
TC K
dTC KMUT
W Hre f
W Kre f
W H
W K
te ko rtH
te ko rtK
subsKW K
P K
RK
HRA
xtrinkH
GH
W H
P H W OZH
ARB
GHre f
VTAX
HH
VALGAP
HHo n tw
I NK
d I NKI NKo n tw
I NK
Re xo
Re xo
Re xo
te ko rtH
te ko rtK
tP

Track record of SD in Real Estate
• J.W. Forrester (1969), Urban Dynamics• Bakken & Sterman (1993) Commercial RE flight
simulator• Barlas et al (2007) RE Price oscillations in Istanbul• Cheng (2005) Modeling Shanghai RE Markets• Klammt (2000) Modeling in CREM• Kummerow (1999) Cyclical Office Oversupply• Price & Kelly (2005) Boston Housing Dynamics• And much more
Evaluation of usefulness for RE research
Assets• Strong basic paradigm• Stock / flow concept• SD Society• Expert and interactive• Software
Drawbacks• No spatial dimension• Risk of complexity
www.systemdynamics.org

Putting SD to the test
Rent
Stock
Construction
Price
Demand curve
Interest
Stock adjustmentConstruction curve
Stock adjustment
Rent
Price
StockConstruction
O
Demand
Interest
O
Delay
Interest
B
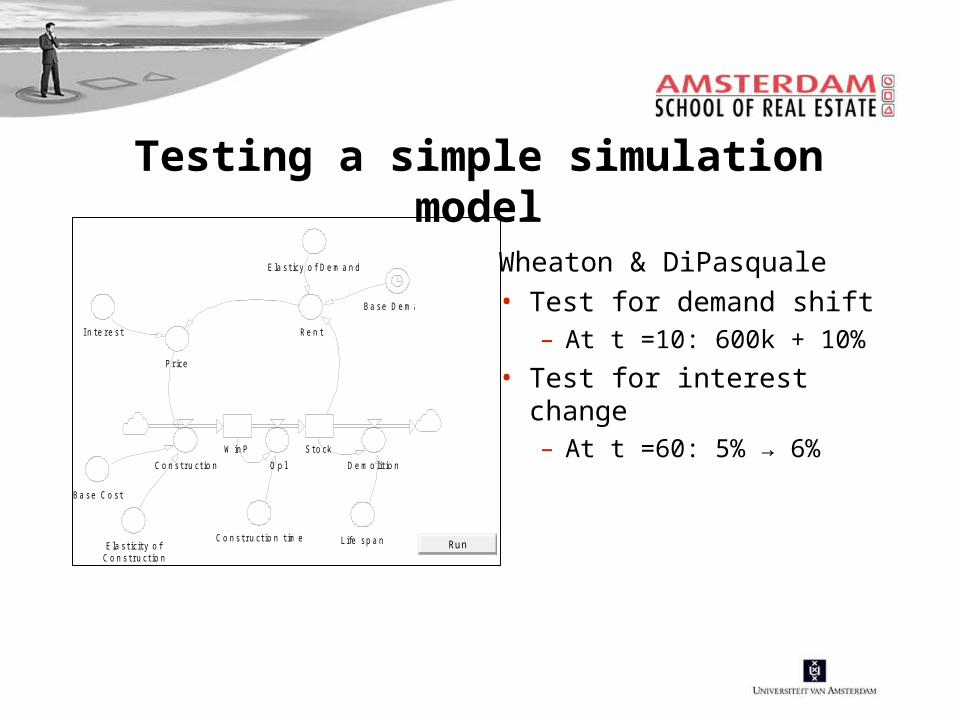
Testing a simple simulation model
Wheaton & DiPasquale• Test for demand shift
– At t =10: 600k + 10%
• Test for interest change– At t =60: 5% → 6%
Run
Sto ckW inP
Op l De mo lit io nCo nstructio n
Co nstructio n t ime Life spa n
Re nt
P rice
I n te re st
Ba se De ma nd
E la sticy o f De ma nd
Ba se Co st
E la sticity o fCo nstructio n

0 2 0 4 0 6 0 8 0 1 0 0
2 .9 0 0 .0 0 0
3 .0 0 0 .0 0 0
3 .1 0 0 .0 0 0
3 .2 0 0 .0 0 0
3 .3 0 0 .0 0 0
wo n
Sto
ck
0 2 0 4 0 6 0 8 0 1 0 00
1 0 .0 0 0
2 0 .0 0 0
3 0 .0 0 0
wo n / jr
Constr
uction
0 2 0 4 0 6 0 8 0 1 0 0
1 1 .5 0 0
1 2 .0 0 0
1 2 .5 0 0
1 3 .0 0 0
1 3 .5 0 0EU R p wo n jr
Rent
0 2 0 4 0 6 0 8 0 1 0 0
1 9 0 .0 0 0
2 0 0 .0 0 0
2 1 0 .0 0 0
2 2 0 .0 0 0
2 3 0 .0 0 0
EU R p wo n
Price
Conclusion and discussion
• System Dynamics is a useful method for RE Research– Complex systems and dynamic behaviour
– Stock and flows as building blocks
– Scientific community, track record, software
• A simple WdP model provides plausible results– Responds to market stimuli as expected
• We will see an upswing in SD RE Research– But that's ultimately up to you....