system failure: michigan’s broken municipal finance …€¦ · 1 this report, written by plante...
TRANSCRIPT

System Failure:Michigan’s Broken
Municipal Finance Model
Prepared by: Frank W. Audia, PartnerDenise A. Buckley, Associate
1
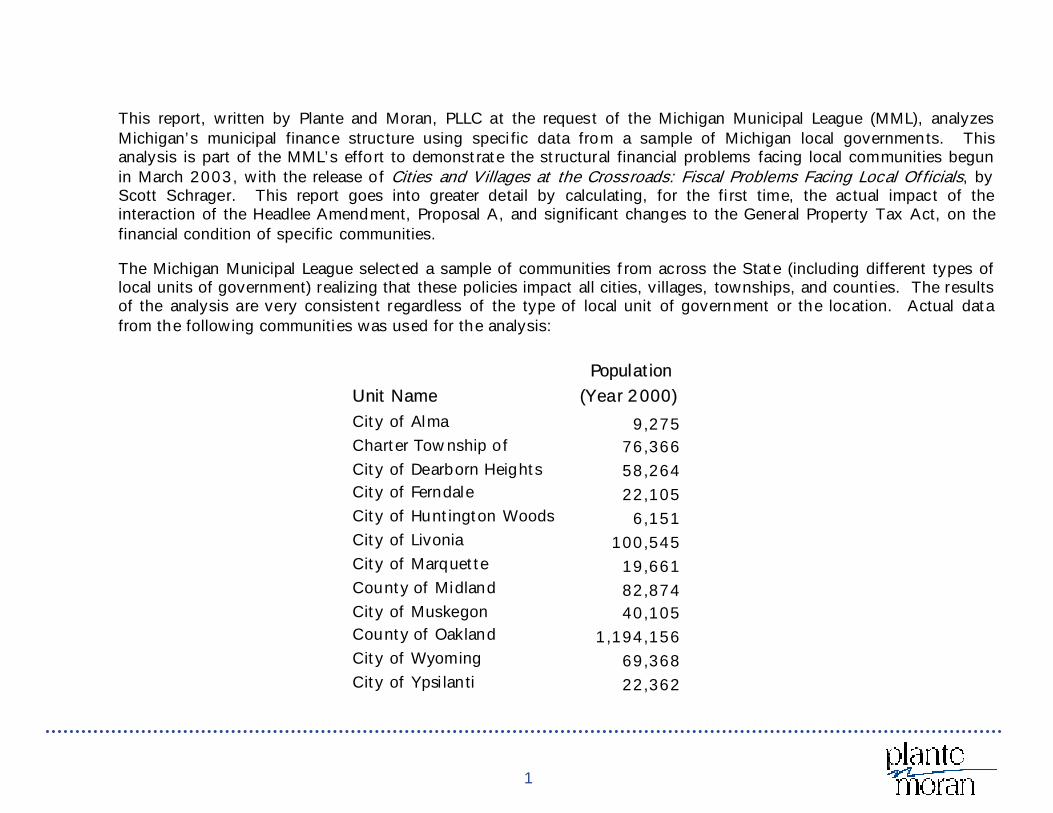
This report, written by Plante and Moran, PLLC at the request of the Michigan Municipal League (MML), analyzes Michigan’s municipal finance structure using specific data from a sample of Michigan local governments. This analysis is part of the MML’s effort to demonstrate the structural financial problems facing local communities begun in March 2003, with the release of Cities and Villages at the Crossroads: Fiscal Problems Facing Local Officials, by Scott Schrager. This report goes into greater detail by calculating, for the first time, the actual impact of the interaction of the Headlee Amendment, Proposal A, and significant changes to the General Property Tax Act, on the financial condition of specific communities.
The Michigan Municipal League selected a sample of communities from across the State (including different types of local units of government) realizing that these policies impact all cities, villages, townships, and counties. The results of the analysis are very consistent regardless of the type of local unit of government or the location. Actual data from the following communities was used for the analysis:
Unit Name Population (Year 2000)
City of Alma 9,275 Charter Township of 76,366 City of Dearborn Heights 58,264 City of Ferndale 22,105 City of Huntington Woods 6,151 City of Livonia 100,545 City of Marquette 19,661 County of Midland 82,874 City of Muskegon 40,105 County of Oakland 1,194,156 City of Wyoming 69,368 City of Ypsilanti 22,362
2
Property taxes are a critical revenue source for local governments. For fully developed communities, property taxes can represent fifty percent or more of a local government’s General Fund budget. Over the last 26 years, there have been two constitutional amendments - the Headlee Amendment and Proposal A - and other related statutory changes that have impacted property tax revenue of local governments.
The Headlee Amendment, ratified in 1978, was designed, among other things, to limit the ability of local governments to levy new taxes and to limit the growth of property tax revenue in general. In summary, the HeadleeAmendment requires voter approval prior to implementing new taxes. The Headlee Amendment also accomplished limiting the growth of property tax revenue by controlling how a local government’s maximum authorized millage rate is calculated particularly as it relates to growth on existing property. The provisions of the Headlee Amendment require that when growth on existing property is greater than inflation, the local government must “roll back” its maximum authorized millage rate so that the increase in property tax revenue caused by growth on existing property does not exceed inflation (commonly referred to as a “Headlee roll back”). Newly constructed property and other property not previously taxed are “exempt” from this calculation and cannot cause a millage rate roll back.
In March 1994, another major constitutional amendment – Proposal A - was passed which resulted in major changes to K through 12 school funding in Michigan (by increasing the State sales tax from 4 percent to 6 percent with the additional two percent earmarked for school aid funding and changing the structure of local property tax levies for schools). Proposal A also created a new methodology to determine property values for tax purposes. Prior to Proposal A, property taxes were levied on state equalized value. Following the passage of Proposal A, property taxes are now levied on taxable value. In summary, until a property is sold or “transferred” as defined by law, taxable value on each individual property cannot increase by more than the lesser of inflation or five percent annually. Effectively, regardless of how quickly existing property values may be growing, there is a cap on the growth rate of taxable value. State equalized value should continue to reflect actual changes in the value of the property and is not subject to an annual cap. When property is sold or transferred, taxable value is reset to state equalized value. This difference between state equalized value and taxable value when a property is sold or transferred and before taxable value is reset to state equalized value is commonly referred to as the “uncapped value”.
The remainder of this report analyzes the interaction of the Headlee Amendment and Proposal A 10 years after the passage of Proposal A. More importantly, the report also details several important changes made to the General Property Tax Act in 1994. This report is not recommending changes to Proposal A. The report intends to highlight the legislative changes after Proposal A made to the General Property Tax Act and their negative consequences on the finances of local governments.
3
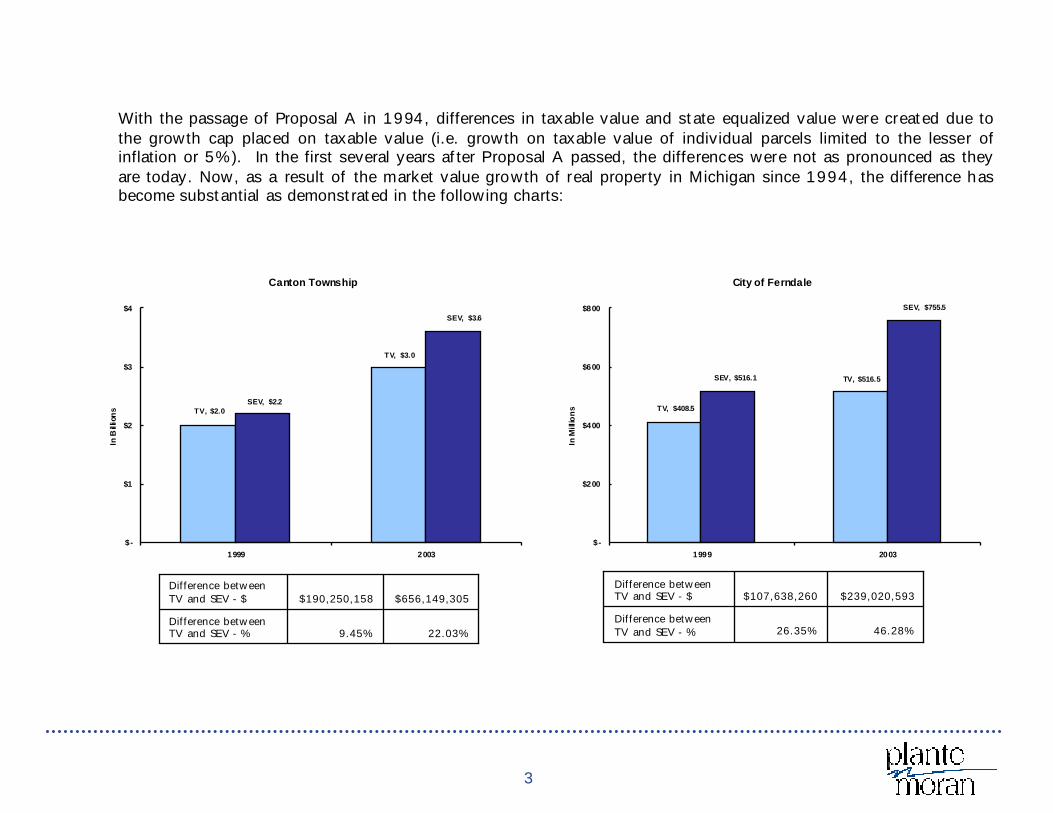
With the passage of Proposal A in 1994, differences in taxable value and state equalized value were created due to the growth cap placed on taxable value (i.e. growth on taxable value of individual parcels limited to the lesser of inflation or 5%). In the first several years after Proposal A passed, the differences were not as pronounced as they are today. Now, as a result of the market value growth of real property in Michigan since 1994, the difference has become substantial as demonstrated in the following charts:
Canton Township
TV, $2.0
TV, $3.0
SEV, $2.2
SEV, $3.6
$-
$1
$2
$3
$4
1999 2003
In B
illion
s
22.03%9.45%Difference between TV and SEV - %
$656,149,305$190,250,158Difference between TV and SEV - $
City of Ferndale
TV, $516.5
TV, $408.5
SEV, $755.5
SEV, $516.1
$-
$200
$400
$600
$800
1999 2003
In M
illio
ns
46.28%26.35%Difference between TV and SEV - %
$239,020,593$107,638,260Difference between TV and SEV - $

4
Midland County
TV, $2.9
TV, $3.3
SE V, $3.0
SEV, $3.8
$-
$1
$2
$3
$4
1999 2003
In B
illion
s
15.14%4.50%Difference between TV and SEV - %
$504,289,721$129,489,625Difference between TV and SEV - $
Oakland County
TV, $53.2
TV, $41.8
SEV, $67.1
SEV, $47.9
$-
$20
$40
$60
$80
1999 2003
In B
illion
s
26.15%14.65%Difference between TV and SEV - %
$13,905,555,772$6,116,511,164Difference between TV and SEV - $
See Chart B in the appendix for more detail.
The notable differences between taxable value and state equalized value in the charts above are significant for growing communities such as Canton Township and for more fully developed communities such as Ferndale. From 1999 to 2003 this gap between taxable value and state equalized value has doubled or even tripled for communities noted above. Local governments that are experiencing consistent annual additions to their tax base (i.e. through new construction) will have a smaller state equalized value/taxable value difference on a percentage basis (because new construction is being added equally to both taxable value and state equalized value) than a more fully developed community.
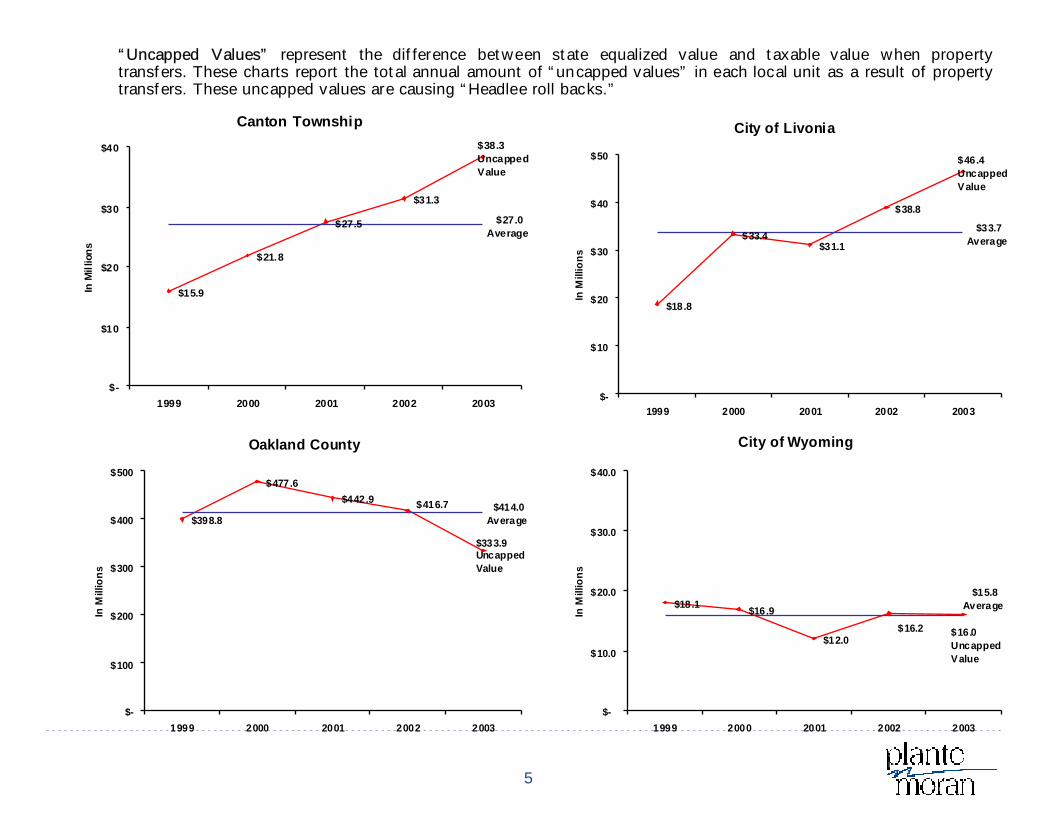
When property is “transferred” (i.e., sold) as defined in State law, taxable value is reset again to equal state equalized value. This process of adjusting taxable value upward to state equalized value is commonly called “uncapping.” For the tax years 1999 through 2003, the survey shows that property transfers resulting in “uncapped values” (i.e. the difference between state equalized value and taxable value when property is transferred) are significant and consistent annually in each community. The charts below demonstrate the consistency of uncapped property tax values for the last five years.
5
“Uncapped Values” represent the difference between state equalized value and taxable value when property transfers. These charts report the total annual amount of “uncapped values” in each local unit as a result of property transfers. These uncapped values are causing “Headlee roll backs.”
Canton Township
$15.9
$21.8
$27.5
$31.3
$38.3 Uncapped Value
$27.0Average
$-
$10
$20
$30
$40
1999 2000 2001 2002 2003
In M
illio
ns
City of Livonia
$18.8
$33.4$31.1
$38.8
$46.4Uncapped Value
$33.7Average
$-
$10
$20
$30
$40
$50
1999 2000 2001 2002 2003
In M
illio
ns
Oakland County
$398.8
$477.6$442.9 $416.7
$333.9 Uncapped Value
$414.0Average
$-
$100
$200
$300
$400
$500
1999 2000 2001 2002 2003
In M
illio
ns
City of Wyoming
$18.1 $16.9
$12.0$16.2 $16.0
Uncapped Value
$15.8Average
$-
$10.0
$20.0
$30.0
$40.0
1999 2000 2001 2002 2003
In M
illio
ns
6
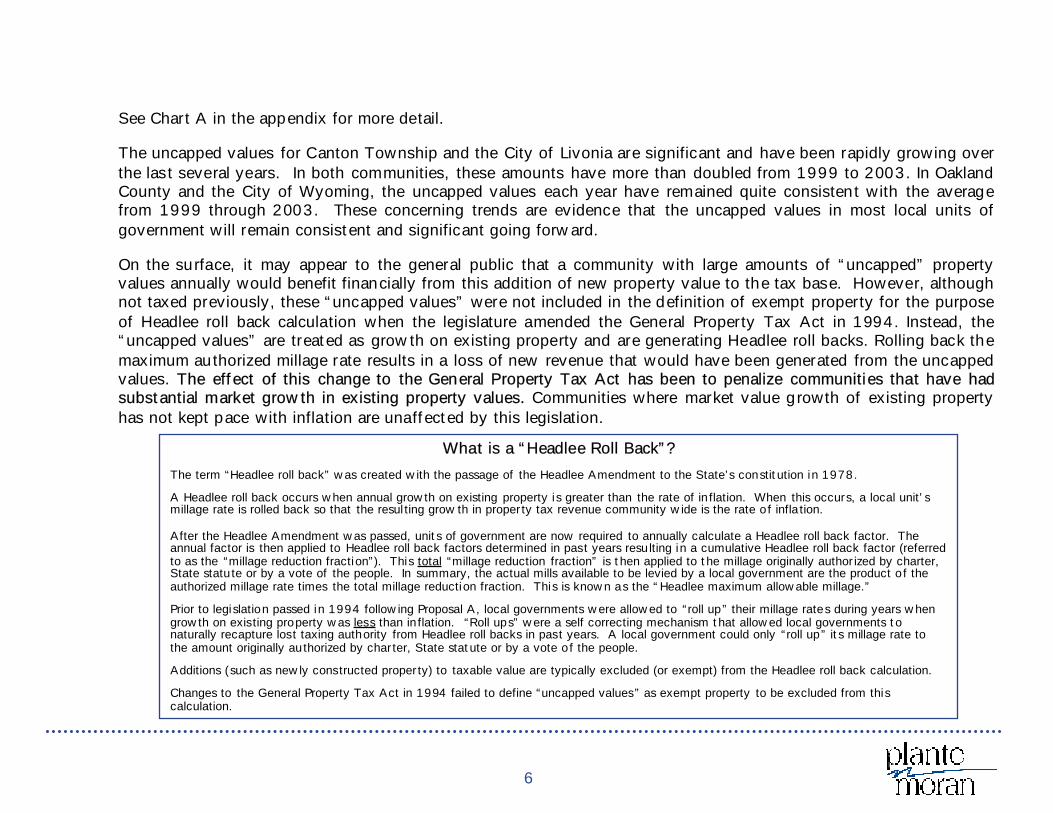
See Chart A in the appendix for more detail.
The uncapped values for Canton Township and the City of Livonia are significant and have been rapidly growing over the last several years. In both communities, these amounts have more than doubled from 1999 to 2003. In Oakland County and the City of Wyoming, the uncapped values each year have remained quite consistent with the average from 1999 through 2003. These concerning trends are evidence that the uncapped values in most local units of government will remain consistent and significant going forward.
On the surface, it may appear to the general public that a community with large amounts of “uncapped” property values annually would benefit financially from this addition of new property value to the tax base. However, although not taxed previously, these “uncapped values” were not included in the definition of exempt property for the purpose of Headlee roll back calculation when the legislature amended the General Property Tax Act in 1994. Instead, the “uncapped values” are treated as growth on existing property and are generating Headlee roll backs. Rolling back the maximum authorized millage rate results in a loss of new revenue that would have been generated from the uncapped values. The effect of this change to the General Property Tax Act has been to penalize communities that have had substantial market growth in existing property values. Communities where market value growth of existing property has not kept pace with inflation are unaffected by this legislation.
What is a “Headlee Roll Back”?
The term “Headlee roll back” was created with the passage of the Headlee Amendment to the State’s constitution in 1978.
A Headlee roll back occurs when annual growth on existing property is greater than the rate of inflation. When this occurs, a local unit’s millage rate is rolled back so that the resulting growth in property tax revenue community wide is the rate of infla tion.
After the Headlee Amendment was passed, units of government are now required to annually calculate a Headlee roll back factor. The annual factor is then applied to Headlee roll back factors determined in past years resulting in a cumulative Headlee roll back factor (referred to as the “millage reduction fraction”). This total “millage reduction fraction” is then applied to the millage originally authorized by charter, State statute or by a vote of the people. In summary, the actual mills available to be levied by a local government are the product of the authorized millage rate times the total millage reduction fraction. This is known as the “Headlee maximum allowable millage.”
Prior to legislation passed in 1994 following Proposal A, local governments were allowed to “roll up” their millage rates during years when growth on existing property was less than inflation. “Roll ups” were a self correcting mechanism that allowed local governments to naturally recapture lost taxing authority from Headlee roll backs in past years. A local government could only “roll up” its millage rate to the amount originally authorized by charter, State statute or by a vote of the people.
Additions (such as newly constructed property) to taxable value are typically excluded (or exempt) from the Headlee roll back calculation.
Changes to the General Property Tax Act in 1994 failed to define “uncapped values” as exempt property to be excluded from this calculation.
7
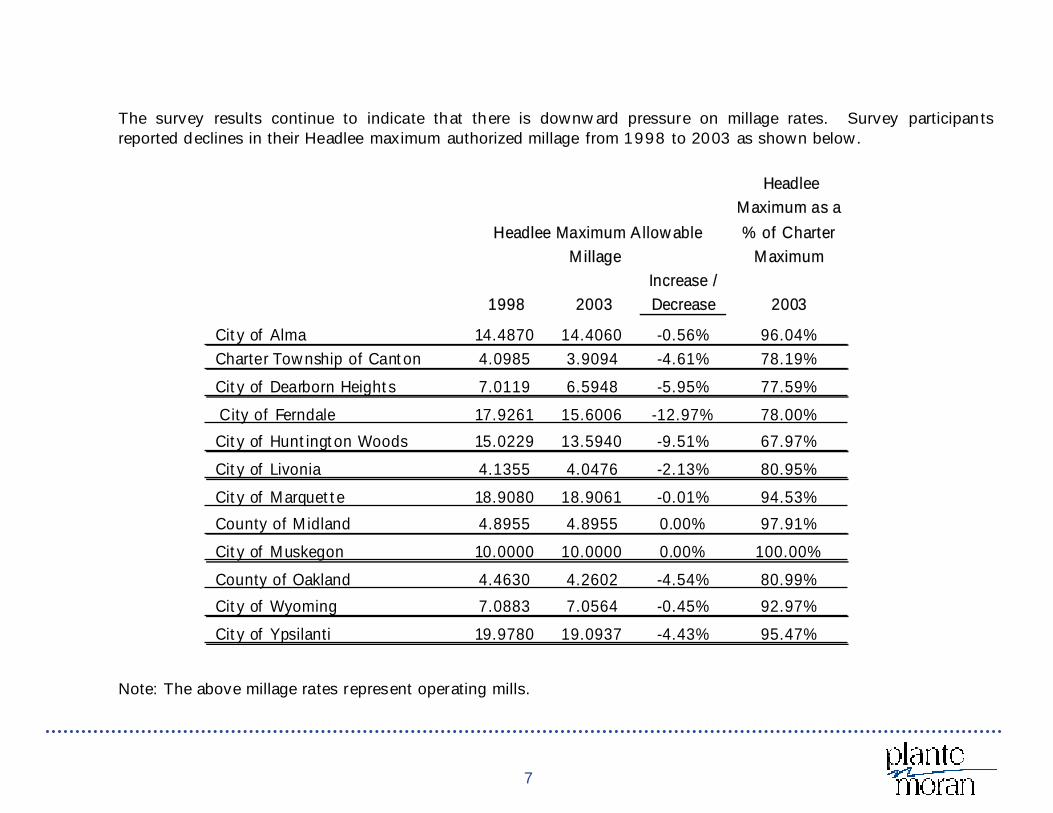
The survey results continue to indicate that there is downward pressure on millage rates. Survey participants reported declines in their Headlee maximum authorized millage from 1998 to 2003 as shown below.
Note: The above millage rates represent operating mills.
Headlee Maximum Allowable Millage
Headlee Maximum as a % of Charter
Maximum
1998 2003Increase / Decrease 2003
City of Alma 14.4870 14.4060 -0.56% 96.04% Charter Township of Canton 4.0985 3.9094 -4.61% 78.19%
City of Dearborn Heights 7.0119 6.5948 -5.95% 77.59%
City of Ferndale 17.9261 15.6006 -12.97% 78.00%
City of Huntington Woods 15.0229 13.5940 -9.51% 67.97%
City of Livonia 4.1355 4.0476 -2.13% 80.95%
City of Marquette 18.9080 18.9061 -0.01% 94.53%
County of Midland 4.8955 4.8955 0.00% 97.91%
City of Muskegon 10.0000 10.0000 0.00% 100.00%
County of Oakland 4.4630 4.2602 -4.54% 80.99%
City of Wyoming 7.0883 7.0564 -0.45% 92.97%
City of Ypsilanti 19.9780 19.0937 -4.43% 95.47%
8
See Chart C in the appendix for more detail.
The original legisation passed following the Headlee Amendment in 1978 recognized that sometimes property values increase annually less than the rate of inflation. For such circumstances, it allowed a “roll up” in the maximum authorized millage rate (limited to the original authorized millage rate). Because the Proposal A implementing legislation eliminated Headlee roll ups, the Headlee maximum authorized millage rate for local governments continuesto move farther away from the original authorized millage rate. The elimination of this self correcting mechanism which allowed for Roll Ups creates an almost permanent reduction of the millage authority of local governments.
The survey results demonstrate that the financial impact of the legislation changing the General Property Tax Act following Proposal A is punitive in nature. The combination of treating uncapped values as growth on existing property with limiting individual property taxable value growth to the rate of inflation produces a double reduction that was never intended by the voters on Proposal A in 1994. Further, the elimination of Headlee roll ups takes away a self correcting tool that was historically viewed as part of the Headlee formula until 1994. As a result, millage capacity is being effectively eliminated.
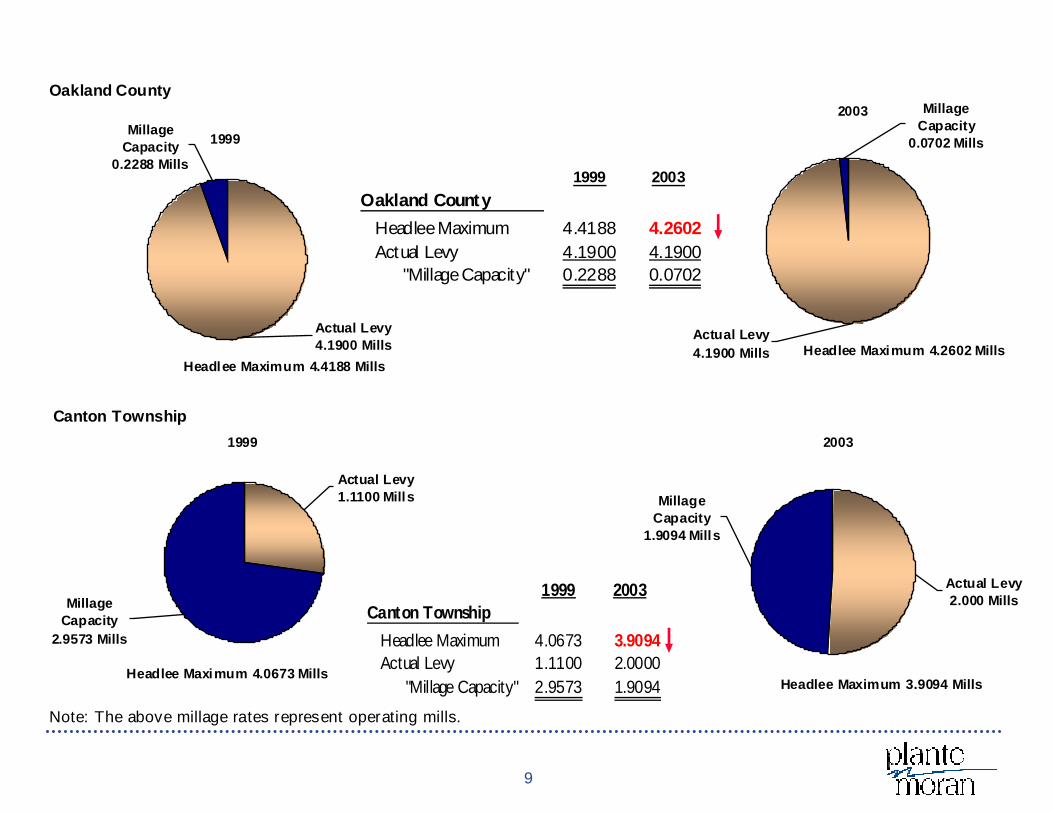
Millage capacity is defined as the difference between the Headlee maximum allowable millage rate and the actual millage rate levied. It represents the ability to increase the millage rate without a vote of the people. Declining millage capacity is not just an issue for more fully developed communities. As the data on page 9 indicates, both Canton Township and Oakland County experienced declines in their Headlee maximum allowable millage rates from 1999 to 2003 (which has almost eliminated any remaining millage capacity available to Oakland County).
9
1999
Actual Levy4.1900 Mills
Millage Capacity
0.2288 Mills
Headlee Maximum 4.4188 Mills
2003
Actual Levy4.1900 Mills
Millage Capacity
0.0702 Mills
Headlee Maximum 4.2602 Mills
1999
Millage Capacity
2.9573 Mills
Actual Levy1.1100 Mills
Headlee Maximum 4.0673 Mills
1999 2003Canton Township
Headlee Maximum 4.0673 3.9094Actual Levy 1.1100 2.0000
"Millage Capacity" 2.9573 1.9094
2003
Millage Capacity
1.9094 Mills
Actual Levy2.000 Mills
Headlee Maximum 3.9094 Mills
Canton Township
Oakland County
1999 2003
Oakland County
Headlee Maximum 4.4188 4.2602Actual Levy 4.1900 4.1900
"Millage Capacity" 0.2288 0.0702
Note: The above millage rates represent operating mills.

10
1999
Actual Levy6.9593 Mills
Millage Capacity
0.0000 Mills
Headlee Maximum 6.9593 Mills
2003
Actual Levy6.5948 Mills
Millage Capacity
0.0000 Mills
Headlee Maximum 6.5948 Mills
1999Millage Capacity
1.2084 Mills
Actual Levy18.7179
MillsHeadlee Maximum 19.9281 Mills
1999 2003City of Ypsilanti
Headlee Maximum 19.9281 19.0937Actual Levy 18.7179 19.0937
"Millage Capacity" 1.2084 0.0000
2003
Mil lage Capacity
0.0000 Mills
Actual Levy19.0937
Mills
Headlee Maximum 19.0937 Mills
City of Ypsilanti
City of Dearborn Heights
1999 2003
Dearborn Heights
Headlee Maximum 6.9593 6.5948Actual Levy 6.9593 6.5948
"Millage Capacity" 0.0000 0.0000
Note: The above millage rates represent operating mills.
11
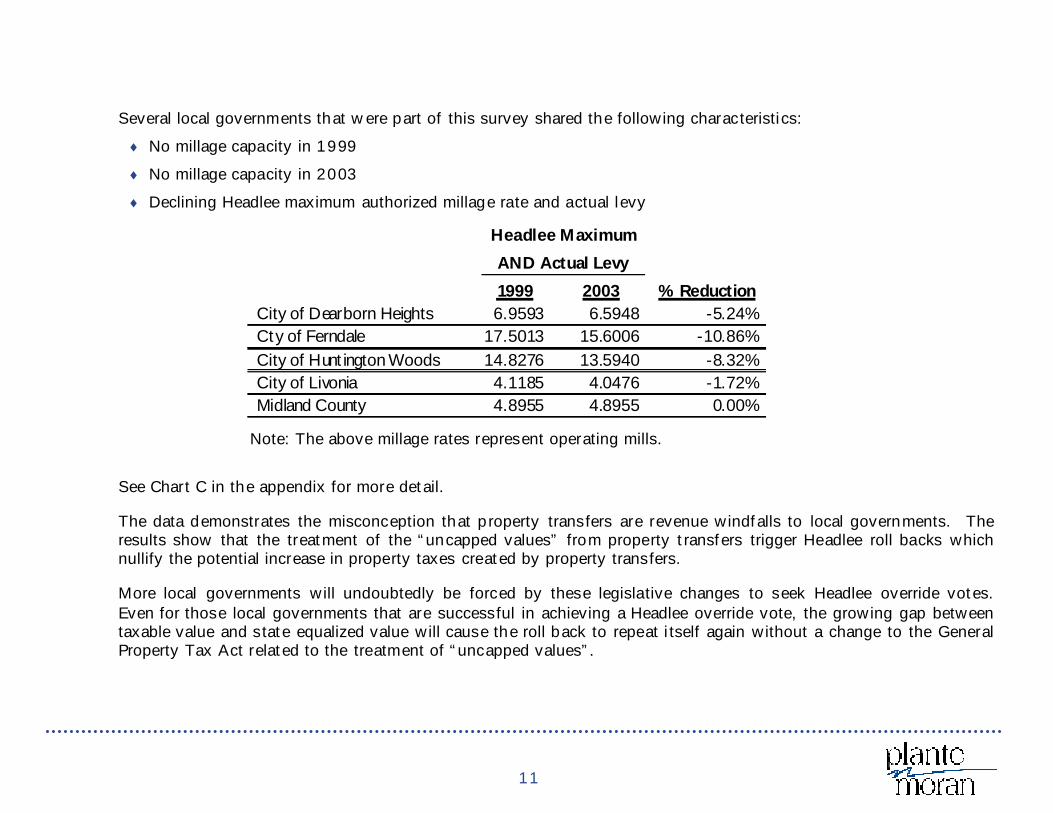
Several local governments that were part of this survey shared the following characteristics:
No millage capacity in 1999
No millage capacity in 2003
Declining Headlee maximum authorized millage rate and actual levy
See Chart C in the appendix for more detail.
The data demonstrates the misconception that property transfers are revenue windfalls to local governments. The results show that the treatment of the “uncapped values” from property transfers trigger Headlee roll backs which nullify the potential increase in property taxes created by property transfers.
More local governments will undoubtedly be forced by these legislative changes to seek Headlee override votes. Even for those local governments that are successful in achieving a Headlee override vote, the growing gap between taxable value and state equalized value will cause the roll back to repeat itself again without a change to the General Property Tax Act related to the treatment of “uncapped values”.
Headlee Maximum
AND Actual Levy
1999 2003 % ReductionCity of Dearborn Heights 6.9593 6.5948 -5.24%Cty of Ferndale 17.5013 15.6006 -10.86%City of Huntington Woods 14.8276 13.5940 -8.32%City of Livonia 4.1185 4.0476 -1.72%Midland County 4.8955 4.8955 0.00%
Note: The above millage rates represent operating mills.
12
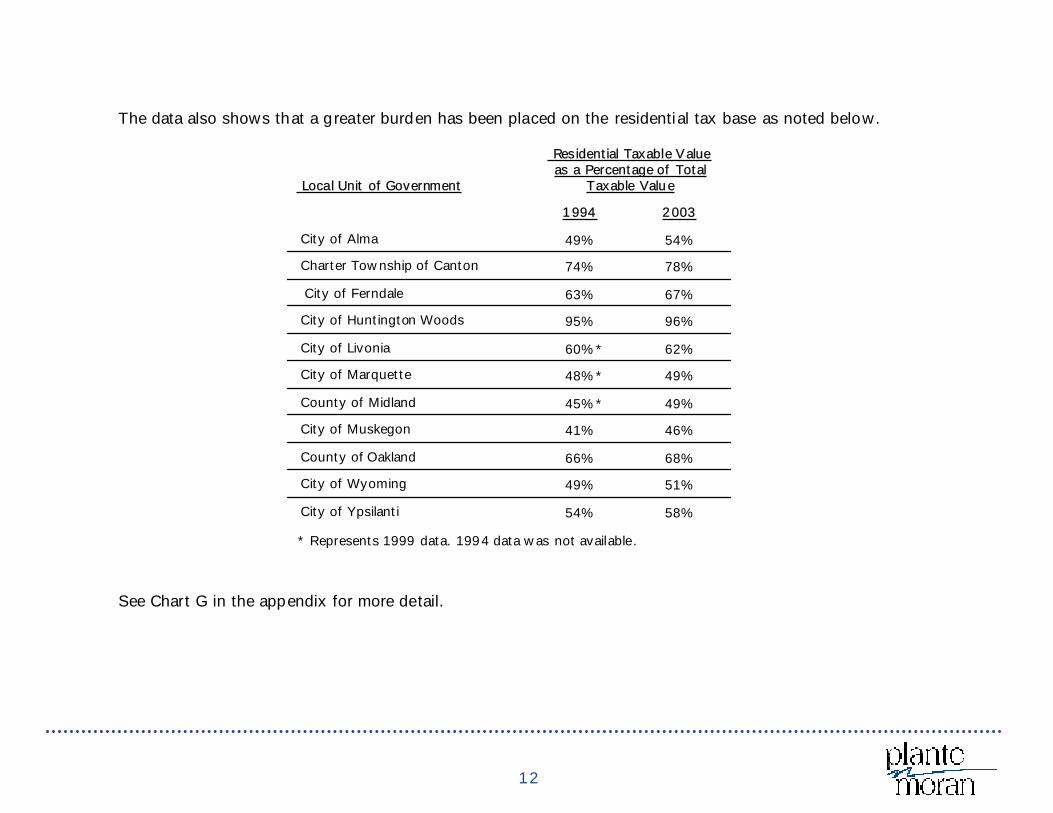
The data also shows that a greater burden has been placed on the residential tax base as noted below.
See Chart G in the appendix for more detail.
58%54%City of Ypsilanti
51%49%City of Wyoming
68%66%County of Oakland
46%41%City of Muskegon
49%45%*County of Midland
49%48%*City of Marquette
62%60%*City of Livonia
96%95%City of Huntington Woods
67%63%City of Ferndale
78%74%Charter Township of Canton
54%49%City of Alma
20031994
Residential Taxable Value as a Percentage of Total
Taxable Value Local Unit of Government
* Represents 1999 data. 1994 data was not available.
13
There are several major developments that have occurred with business property taxes that explain this shift. Businesses in Michigan pay "personal" property tax on assets used in the conduct of their trade or business. Examples include machinery, equipment, vehicles, furniture, etc. Beginning with the 2001 tax year, revised general personal property tax tables were implemented by the State Tax Commission. In addition to revisions made to the general personal property tax tables, the State Tax Commission also approved new personal property tax tables for utilities. The new tables made drastic changes to the determination of the transmission and distribution property of utilities. The combination of these changes to the personal property tax tables resulted in lower property tax values for business property. A recent Michigan Supreme Court case, WPW Acquisition Co v City of Troy has also resulted in lower property values. The General Property Tax Act includes what are intended to be offsetting provisions for the treatment of increases and decreases in value related to the assessment of certain real property performed based on the “occupancy” methodology. The theory of these offsetting provisions was that when occupancy of a particular building was reduced, a loss (or a decrease in value) would be taken to both the state equalized value and the taxable value of the particular property providing the property owner with tax relief when occupancy was declining. At the same time, when occupancy increased, it was expected that the change would be similarly and consistently recognized as an addition (or an increase in value) and both state equalized value and taxable value would increase. These provisions were intended to work together in harmony. However, in the WPW Acquisition Co v City of Troycase, the Michigan Supreme Court declared the additions (or increase in value) portion of this provision as unconstitutional. The losses (or decrease in value) provision, though, was not given consideration. Therefore, real property assessed using the "occupancy" methodology can experience decreases in taxable value during declining occupancy, but these losses in taxable value cannot be recovered as in the past and as was intended when occupancy increases.
Ignoring the known and well publicized taxable value disparities that can exist between neighbors (i.e. the person who has been in their home since Proposal A passed and the person who just bought their home right next door), many existing property owners that expected inflationary increases in their tax payments are annually receiving less than inflationary increases. Even though their taxable value is going up by the rate of inflation, property transfers are creating millage rate roll backs and reducing the millage rate levied. The net result? Less than inflationary increases in tax payments annually; not the represented intentions of Proposal A or Headlee.
14
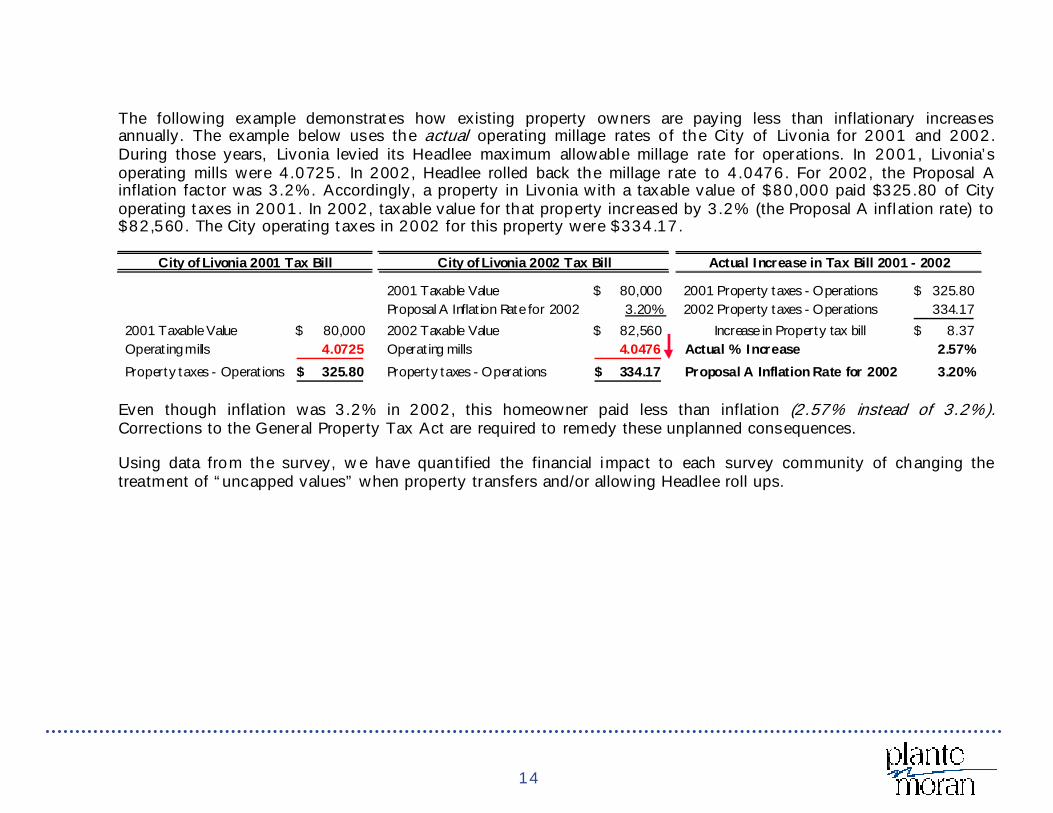
The following example demonstrates how existing property owners are paying less than inflationary increases annually. The example below uses the actual operating millage rates of the City of Livonia for 2001 and 2002. During those years, Livonia levied its Headlee maximum allowable millage rate for operations. In 2001, Livonia’s operating mills were 4.0725. In 2002, Headlee rolled back the millage rate to 4.0476. For 2002, the Proposal A inflation factor was 3.2%. Accordingly, a property in Livonia with a taxable value of $80,000 paid $325.80 of City operating taxes in 2001. In 2002, taxable value for that property increased by 3.2% (the Proposal A inflation rate) to $82,560. The City operating taxes in 2002 for this property were $334.17.
Even though inflation was 3.2% in 2002, this homeowner paid less than inflation (2.57% instead of 3.2%).Corrections to the General Property Tax Act are required to remedy these unplanned consequences.
Using data from the survey, we have quantified the financial impact to each survey community of changing the treatment of “uncapped values” when property transfers and/or allowing Headlee roll ups.
City of Livonia 2001 Tax Bill City of Livonia 2002 Tax Bill Actual Increase in Tax Bill 2001 - 2002
2001 Taxable Value 80,000$ 2001 Property taxes - Operations 325.80$ Proposal A Inflation Rate for 2002 3.20% 2002 Property taxes - Operations 334.17
2001 Taxable Value 80,000$ 2002 Taxable Value 82,560$ Increase in Property tax bill 8.37$ Operating mills 4.0725 Operating mills 4.0476 Actual % Increase 2.57%
Property taxes - Operations 325.80$ Property taxes - Operations 334.17$ Proposal A Inflation Rate for 2002 3.20%
15
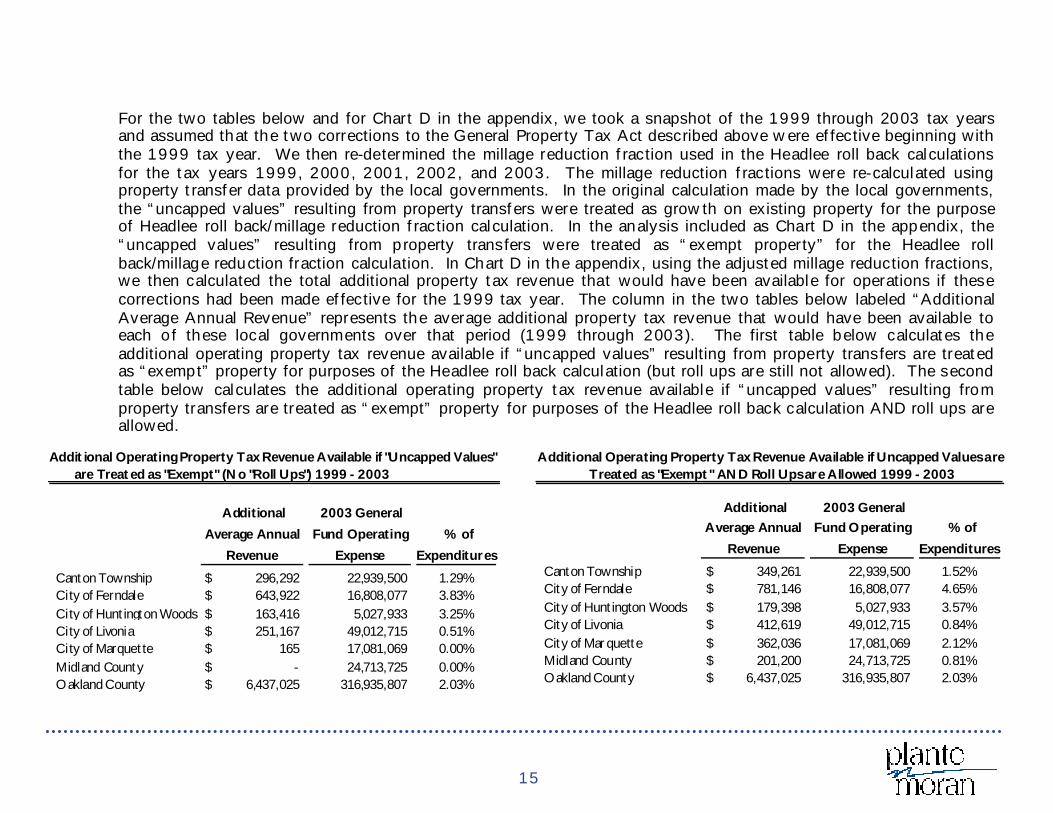
For the two tables below and for Chart D in the appendix, we took a snapshot of the 1999 through 2003 tax years and assumed that the two corrections to the General Property Tax Act described above were effective beginning with the 1999 tax year. We then re-determined the millage reduction fraction used in the Headlee roll back calculations for the tax years 1999, 2000, 2001, 2002, and 2003. The millage reduction fractions were re-calculated using property transfer data provided by the local governments. In the original calculation made by the local governments, the “uncapped values” resulting from property transfers were treated as growth on existing property for the purpose of Headlee roll back/millage reduction fraction calculation. In the analysis included as Chart D in the appendix, the “uncapped values” resulting from property transfers were treated as “exempt property” for the Headlee roll back/millage reduction fraction calculation. In Chart D in the appendix, using the adjusted millage reduction fractions, we then calculated the total additional property tax revenue that would have been available for operations if these corrections had been made effective for the 1999 tax year. The column in the two tables below labeled “Additional Average Annual Revenue” represents the average additional property tax revenue that would have been available to each of these local governments over that period (1999 through 2003). The first table below calculates the additional operating property tax revenue available if “uncapped values” resulting from property transfers are treated as “exempt” property for purposes of the Headlee roll back calculation (but roll ups are still not allowed). The second table below calculates the additional operating property tax revenue available if “uncapped values” resulting from property transfers are treated as “exempt” property for purposes of the Headlee roll back calculation AND roll ups are allowed.
Addit ional Operating Property Tax Revenue Available if "Uncapped Values" are Treated as "Exempt" (No "Roll Ups") 1999 - 2003
Additional
Average Annual
Revenue
2003 General
Fund Operating
Expense
% of
Expenditures
Canton Township 296,292$ 22,939,500 1.29%City of Ferndale 643,922$ 16,808,077 3.83%City of Huntington Woods 163,416$ 5,027,933 3.25%City of Livonia 251,167$ 49,012,715 0.51%City of Marquette 165$ 17,081,069 0.00%Midland County -$ 24,713,725 0.00%Oakland County 6,437,025$ 316,935,807 2.03%
Additional Operating Property Tax Revenue Available if Uncapped Values are Treated as "Exempt" AND Roll Ups are Allowed 1999 - 2003
Additional Average Annual
Revenue
2003 General Fund Operating
Expense
% of
Expenditures
Canton Township 349,261$ 22,939,500 1.52%City of Ferndale 781,146$ 16,808,077 4.65%City of Huntington Woods 179,398$ 5,027,933 3.57%City of Livonia 412,619$ 49,012,715 0.84%City of Marquette 362,036$ 17,081,069 2.12%Midland County 201,200$ 24,713,725 0.81%Oakland County 6,437,025$ 316,935,807 2.03%
16
See Chart D in the appendix for more detail.
These changes are necessary to remove some of the stress from the municipal finance model and provide local governments with limited financial relief to deal with other financial challenges. These two corrections to the General Property Tax Act – exempting “uncapped values” created by property transfers from the Headlee roll back calculation AND allowing Headlee roll ups will provide additional tax dollars that are within both the letter and the spirit of the Headlee Amendment and Proposal A.
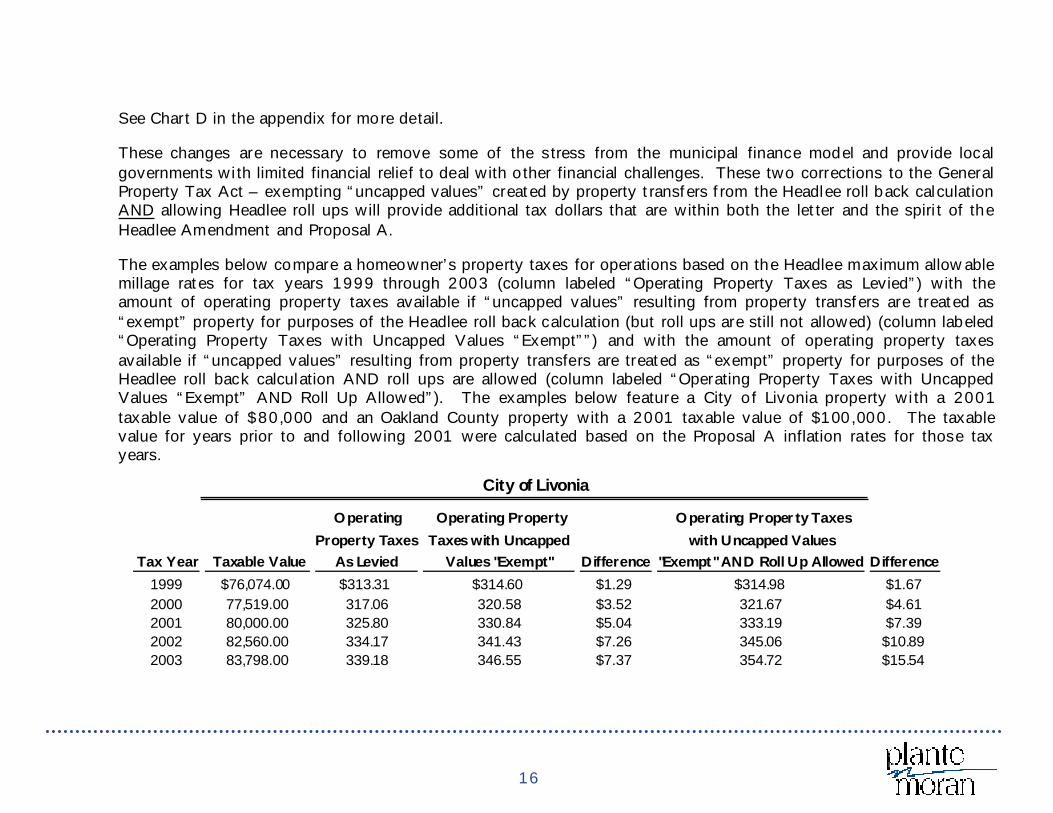
The examples below compare a homeowner’s property taxes for operations based on the Headlee maximum allowable millage rates for tax years 1999 through 2003 (column labeled “Operating Property Taxes as Levied”) with the amount of operating property taxes available if “uncapped values” resulting from property transfers are treated as “exempt” property for purposes of the Headlee roll back calculation (but roll ups are still not allowed) (column labeled “Operating Property Taxes with Uncapped Values “Exempt””) and with the amount of operating property taxes available if “uncapped values” resulting from property transfers are treated as “exempt” property for purposes of the Headlee roll back calculation AND roll ups are allowed (column labeled “Operating Property Taxes with Uncapped Values “Exempt” AND Roll Up Allowed”). The examples below feature a City of Livonia property with a 2001 taxable value of $80,000 and an Oakland County property with a 2001 taxable value of $100,000. The taxable value for years prior to and following 2001 were calculated based on the Proposal A inflation rates for those tax years.
City of Livonia
Tax Year Taxable Value
Operating
Property Taxes As Levied
Operating Property
Taxes with Uncapped Values "Exempt"
Difference
Operating Property Taxes
with Uncapped Values "Exempt" AND Roll Up Allowed
Difference
1999 $76,074.00 $313.31 $314.60 $1.29 $314.98 $1.672000 77,519.00 317.06 320.58 $3.52 321.67 $4.612001 80,000.00 325.80 330.84 $5.04 333.19 $7.392002 82,560.00 334.17 341.43 $7.26 345.06 $10.892003 83,798.00 339.18 346.55 $7.37 354.72 $15.54

17
As demonstrated in the tables above, the impact of these two policy changes to the City of Livonia resident with a taxable value of $80,000 in 2001 would have been an average of an additional $4.90 per year from 1999 through 2003 in operating property taxes (based on changing the treatment of “uncapped values” only) and additional $8.02 per year from 1999 through 2003 in operating taxes (based on changing the treatment of “uncapped values” and allowing roll ups). The impact of these two policy changes to the Oakland County resident with a taxable value of $100,000 in 2001 would have been an average of an additional $13.25 per year from 1999 through 2003 in operating property taxes under both scenarios.
These two policy changes would provide local governments with additional millage capacity to use when needed with little impact on taxpayers.
As part of the survey, financial projections were prepared by the sample communities. The projections, using realistic revenue and controlled expenditure growth assumptions, disclose dangerous trends negatively impacting the fund balance of these local governments.
Fund balance represents the cumulative difference between revenue and expenditures from the inception of a local government. Fund balance is also described as the difference between a fund’s assets and its liabilities and is sometimes called “fund equity” or “net assets”. Fund balance does not represent cash. It is important for local governments to maintain an adequate level of fund balance. Fund balance provides the necessary amount of working capital that a governmental unit requires to finance its day to day operations, meet payroll obligations and pay its bills timely. Unlike a business, local governments cannot just simply borrow money from a bank to make payroll. The Michigan Municipal Finance Act appropriately controls and specifies the ability of local governments to issue debt. In addition to needing fund balance to finance daily operations, fund balance provides local governments with the financial flexibility to deal with unplanned losses and expenditures.
Oakland County
Tax Year Taxable Value
Operating
Property Taxes
As Levied
Operating Property
Taxes with Uncapped
Values "Exempt"
Difference
Operating Property Taxes with
Uncapped Values "Exempt" and
Roll up Allowed
Difference
1999 95,092$ $420.19 $424.40 $4.21 $424.40 $4.212000 96,899 423.33 432.46 $9.13 432.46 $9.132001 100,000 432.59 446.30 $13.71 446.30 $13.712002 103,200 442.58 460.58 $18.00 460.58 $18.002003 104,748 446.25 467.49 $21.24 467.49 $21.24
18
Also, total fund balance is not typically reflective of the amount of fund balance that is truly available for working capital purposes, unplanned needs, etc. Any analysis based on total fund balance can lead to misleading conclusions. Planned or committed uses of fund balance (for capital purchases, to finance next year’s budget, to cover outstanding purchase orders) are reflected as reservations or designations of fund balance. Therefore, the amount that is really available is unreserved and undesignated fund balance. To maintain the financial stability of a local government, a general rule of the thumb is that General Fund unreserved/undesignated fund balance should be at least ten percent of its annual expenditures. For smaller units of government, the minimum amount of unreserved/undesignated fund balance may need to be as much as thirty percent of annual expenditures. As a result of significant unplanned cuts to state shared revenue, local governments are using fund balance.
The local governments participating in the survey reported the following:
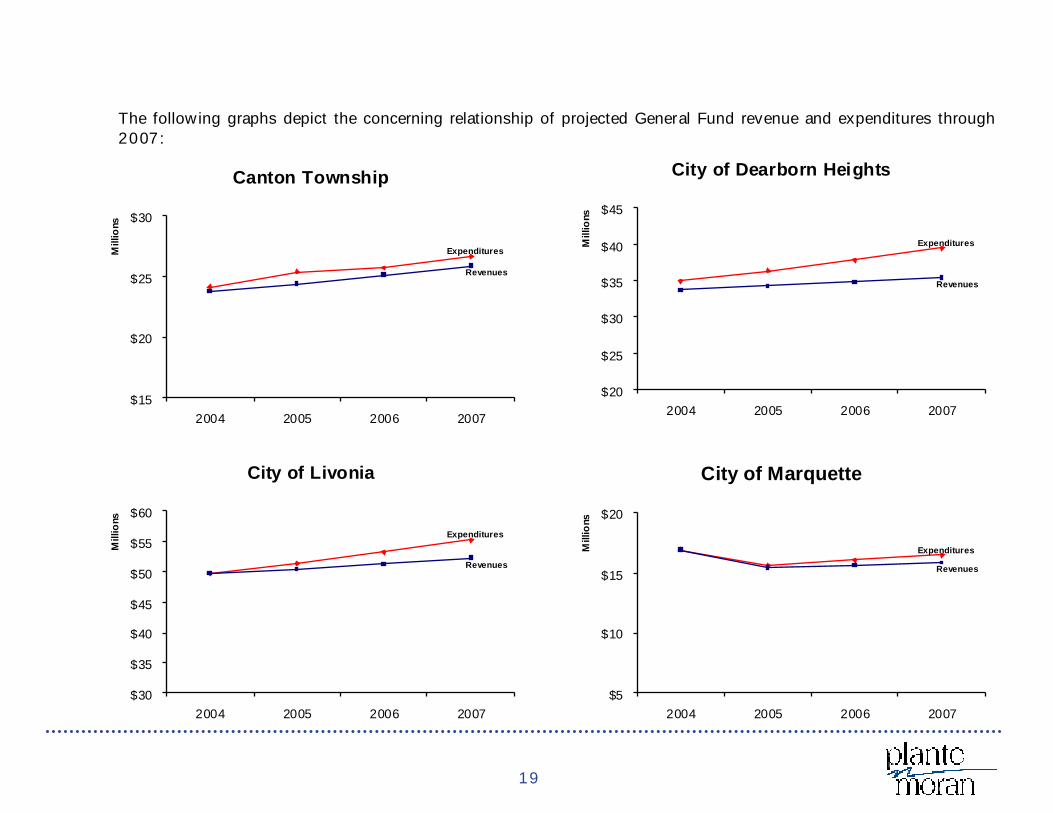
Each of the local governments projected structural shortfalls for General Fund revenue and expenditures for the years 2004 through 2007.
Six of the eleven local governments that prepared projections for General Fund revenue and expenditures through 2007 report they will be in a General Fund fund deficit by 2007.
Absent reductions to expenditures impacting service levels, local governments will use critical amounts of General Fund fund balance between 2000 and 2007.
19
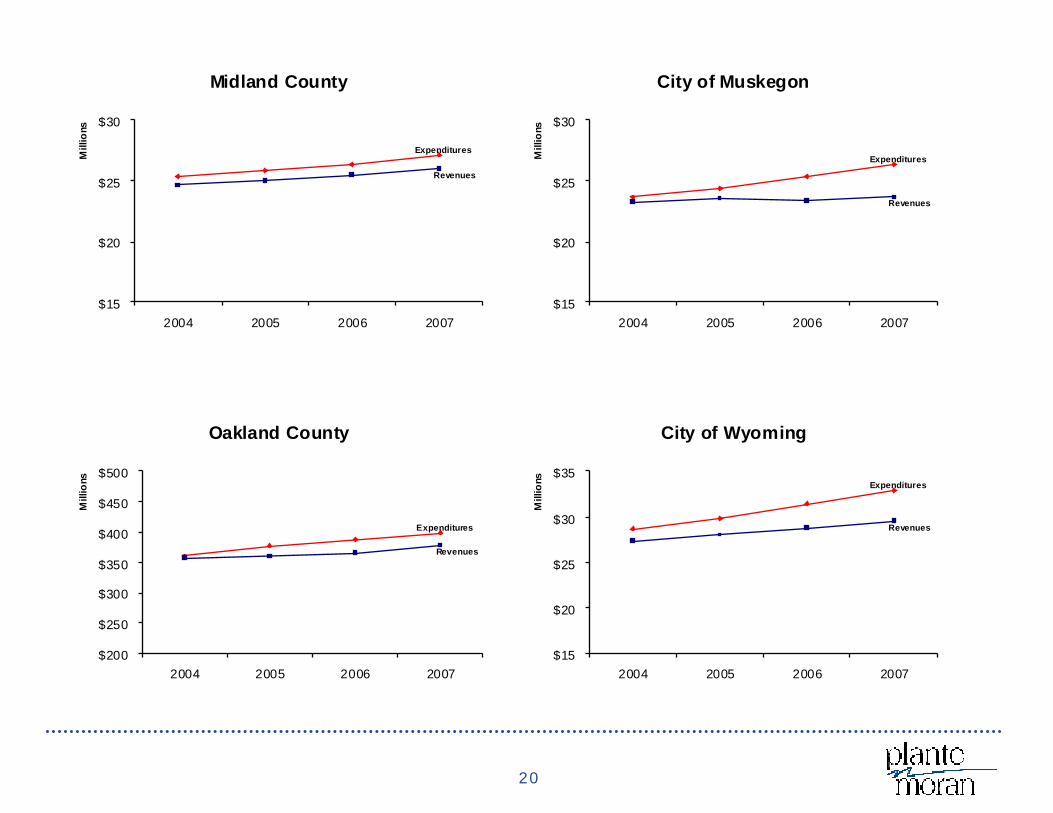
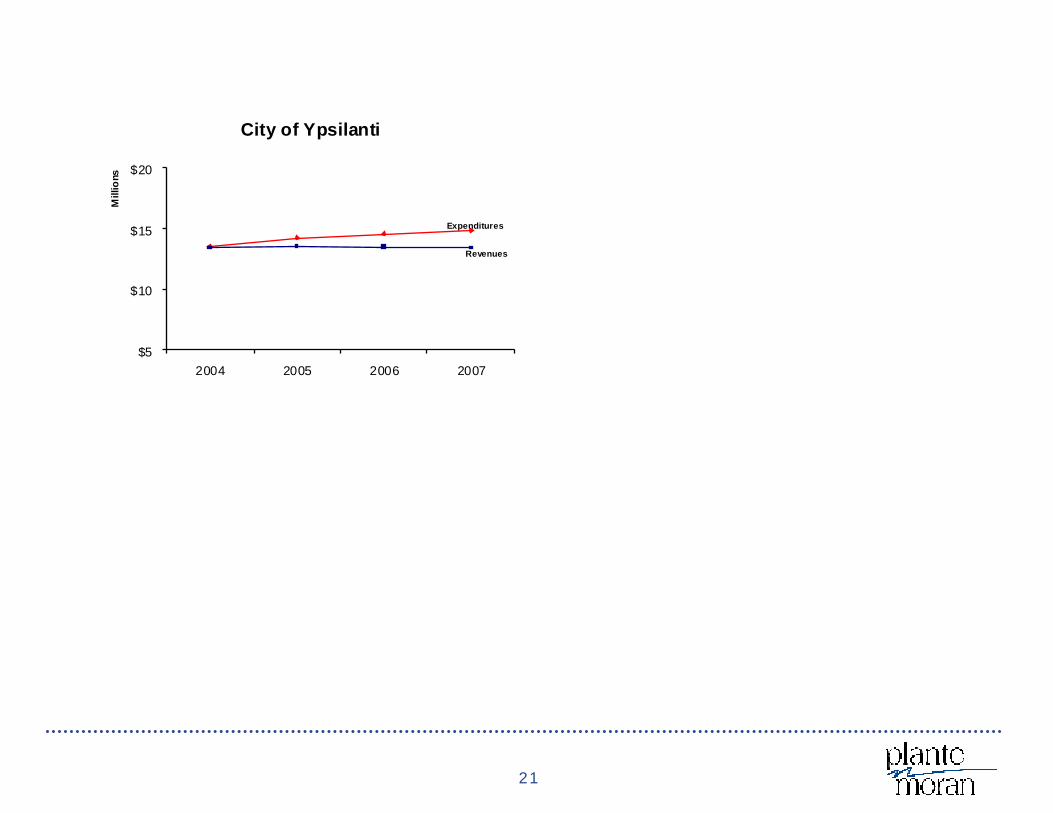
The following graphs depict the concerning relationship of projected General Fund revenue and expenditures through 2007:
Canton Township
Expenditures
Revenues
$15
$20
$25
$30
2004 2005 2006 2007
Mill
ions
City of Dearborn Heights
Expenditures
Revenues
$20
$25
$30
$35
$40
$45
2004 2005 2006 2007
Mill
ions
City of Livonia
Expenditures
Revenues
$30
$35
$40
$45
$50
$55
$60
2004 2005 2006 2007
Mill
ions
City of Marquette
Expenditures
Revenues
$5
$10
$15
$20
2004 2005 2006 2007
Mill
ions
20
Midland County
Expenditures
Revenues
$15
$20
$25
$30
2004 2005 2006 2007
Mill
ions
Oakland County
Expenditures
Revenues
$200
$250
$300
$350
$400
$450
$500
2004 2005 2006 2007
Mill
ions
City of Wyoming
Expenditures
Revenues
$15
$20
$25
$30
$35
2004 2005 2006 2007
Mill
ions
City of Muskegon
Expenditures
Revenues
$15
$20
$25
$30
2004 2005 2006 2007
Mill
ions
21
City of Ypsilanti
Expenditures
Revenues
$5
$10
$15
$20
2004 2005 2006 2007
Mill
ions
22
See Chart E in the appendix for more detail.
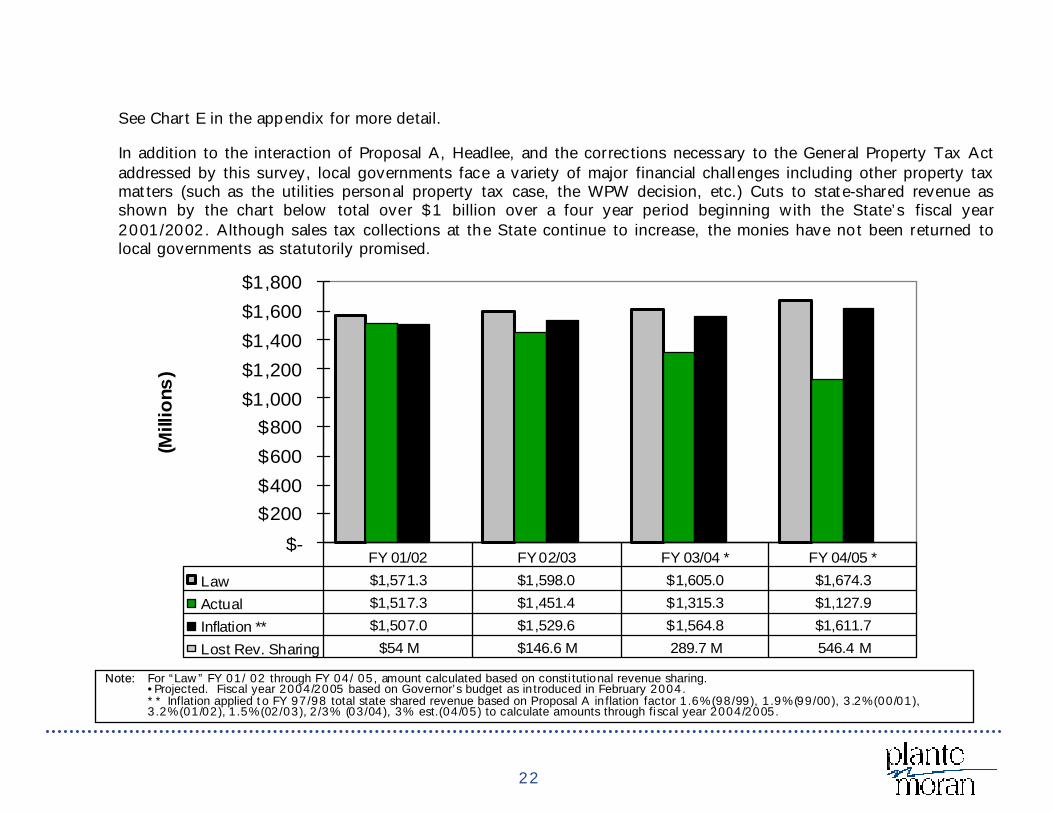
In addition to the interaction of Proposal A, Headlee, and the corrections necessary to the General Property Tax Act addressed by this survey, local governments face a variety of major financial challenges including other property tax matters (such as the utilities personal property tax case, the WPW decision, etc.) Cuts to state-shared revenue as shown by the chart below total over $1 billion over a four year period beginning with the State’s fiscal year 2001/2002. Although sales tax collections at the State continue to increase, the monies have not been returned to local governments as statutorily promised.
$-$200$400$600$800
$1,000$1,200$1,400$1,600$1,800
(Mill
ions
)
Law $1,571.3 $1,598.0 $1,605.0 $1,674.3Actual $1,517.3 $1,451.4 $1,315.3 $1,127.9Inflation ** $1,507.0 $1,529.6 $1,564.8 $1,611.7Lost Rev. Sharing $54 M $146.6 M 289.7 M 546.4 M
FY 01/02 FY 02/03 FY 03/04 * FY 04/05 *
Note: For “Law” FY 01/ 02 through FY 04/ 05, amount calculated based on constitutional revenue sharing. •Projected. Fiscal year 2004/2005 based on Governor’s budget as introduced in February 2004. ** Inflation applied to FY 97/98 total state shared revenue based on Proposal A inflation factor 1.6%(98/99), 1.9%(99/00), 3.2%(00/01), 3.2%(01/02), 1.5%(02/03), 2/3% (03/04), 3% est.(04/05) to calculate amounts through fiscal year 2004/2005.
23
Property taxes and state shared revenue are the major revenue sources for the General Fund of local governments. While local governments supplement these revenue sources with fees and charges for services, there are limitations and restrictions on the amount of fees and charges that local governments can enact. These limitations and restrictions have been further defined and constrained by the Bolt Case (December 1998 Supreme Court Case) and the State Construction Act (Public Act 245 of 1999).
As a result of these uncoordinated State policy, legislative and judicial decisions, the municipal finance model is broken. Absent changes, local governments are on a financial collision course.
plantemoran.com
APPENDIX