system identification of structures subjected to human ......system identification of structures...
TRANSCRIPT

1
Project Registration Number: MQP-YK1-AAY1
System Identification of Structures subjected to Human-Induced
Vibrations using State-Space Modelling
A Major Qualifying Project
Submitted to the Faculty
of
WORCESTER POLYTECHNIC INSTITUTE
In partial fulfillment of the requirements for
the Degree of Bachelor of Science
by:
_______________________________
Nicholaus A. Crossman
April 27, 2016
Project Advisor:
_______________________________
Yeesock Kim, Postdoc.
Assistant Professor
Civil & Environmental Engineering Department
This report represents the work of one WPI undergraduate student submitted to the faculty as evidence of completion of a degree
requirement. WPI routinely publishes these reports on its website without editorial or peer review. For more information about
the projects program at WPI, please see http://www.wpi.edu/Academics/Project.

2
Abstract
This report combines concepts of structural engineering with the field of biomechanics,
through human-induced, structural loading. The study analyzes the response of a steel I-beam
under the activity of jumping. A state-space system identification approach was utilized to produce
a model which could adhere to various impact tests and code simulations. This model was then
used to generate simulated output responses in order to monitor the overall health of the structure.
The report includes the analysis and design of the provided structure, along with the system
identification and continuous-time representation of the state-space model. A number of PZT
devices and computational software were used for this process. Results of this study were
evaluated to determine effects on human comfort and structural performance. The paper concludes
with finishing thoughts and future recommendations.
Keywords: human-body force (HBF), state-space, system identification (SID), structural
dynamics, natural frequency, fast Fourier transform (FFT)

3
Acknowledgements
I would like to thank everyone who provided insight and support throughout the duration
of this Major Qualifying Project. Furthermore, I would like to give a special thanks to the
following:
Advisor/Assistant Professor, Yeesock Kim, of the Civil and Environmental
Engineering Department for aiding me in my studies and connections
Dr. Yeon Sik Noh of the University of Connecticut for helping me to apply wireless
accelerometers to human bodies for data testing and acquisition
Laboratory technician, Russ Lang, for installing the steel I-beam used in this project
Laboratory manager, Don Pellegrino, for allowing and aiding me with the use the
laboratory wired accelerometers and impact hammer

4
Capstone Design Statement
To achieve the necessary criteria developed by the Accreditation Board for Engineering
and Technology (ABET), this Major Qualifying Project (MQP) incorporated a design experience
which considered appropriate engineering standards and realistic constraints. This section provides
a description of the design problem, the taken approach, and how the constraints were addressed.
Design Problem
This design problem encompasses the structural response analyzation of human-induced
loading with concerns towards human comfort and structural performance. Human-induced
activity can account for a substantial portion of the live loads acting on any given structure. Such
structures could be office floors, stadiums, pedestrian footbridges, or residential buildings. As a
dynamic impact, these induced loads may generate excessive vibrations, affecting comfort levels,
and safety and serviceability performance. This issue has been a concern in the civil industry for
many years, however the study of human-induced loading on a structure poses a vast amount of
complexity. Unlike natural impacts such as wind, snow, and seismicity, human-induced activity
depends solely on the individuals’. For instance, situations where system fatigue or human
discomfort may be present are often a result of various human motion responses under diverse
loading situations. Due to this intricacy, computational software such as MATLAB and Simulink
were needed.
Approach
To solve this problem, training was instituted for various piezoelectric (PZT) devices,
structural concepts, and engineering software. Once trained, a system had to be established for
testing purposes. With the aid of the Worcester Polytechnic Institute (WPI) Civil & Environmental

5
Engineering Department a standard steel I-beam was bolted into the floor, producing a nearly-
fixed connection. Numerous data tests were then generated and assessed accordingly. From this
data, output responses were developed using system identification and state-space representation
methods. These responses were analyzed to perceive the potential effects on human comfort and
structural performance, and recommendations were made accordingly.
Realistic Constraints
According to ABET General Criterion, realistic design constraints must be assessed within
the capstone experience. To achieve this standard, the following constraints were considered
within the aspects of the MQP: economic, health and safety, ethical, sustainability, social, and
constructability.
Economic
When matched with a structural design, perceived human comfort levels may be utilized
to design structures which can withstand excessive floor vibrations. Furthermore, future research
will entail fatigue limits, which may allow for a general understanding of the amplitude of cyclic
stress that can be applied to the steel I-beam prior to systematic failure. This data could prove
useful for establishments attempting to design future space, while constructing a more relaxed
environment.
Health and Safety
Since this project deals with human-induced loading and a standard steel beam, codes such
as the International Building Code (IBC) and ASCE-7 are not too beneficial. However, by

6
generating and scaling the human comfort levels perceived through various activities, the health
and overall safety of future participants can be ensured.
Ethical
This major qualifying project upholds the standards of the American Society of Civil
Engineers’ (ASCE) Code of Ethics. The Code of Ethics consists of seven canons, and although all
canons were considered during the process, Canon 1 appeared to be the most relevant and
important. Cannon 1 states that, “Engineers shall hold paramount the safety, health and welfare of
the public and shall strive to comply with the principles of sustainable development in the
performance of their professional duties” [14]. Recommendations in this report abide by this law
through the promotion public safety and structural enhancement.
Sustainability
Sustainability is not a direct factor in this project. However, though the utilization of
structural response data and the correlation amongst human comfort levels, establishments may be
able to develop structures with less internal vibrations. Through the reduction of floor vibrations,
human productivity may increase due to sustainable comfort levels, and therefore generate a
greater output in work.
Social
Social constraints also play an important role as the goal behind this project is to allow
establishments such as office buildings, sport complexes, or other high-activity environments to
operate in vibration-free zones. This could result in a more approachable surrounding for people
to socialize and attain productivity in.

7
Constructability
Although a complete system was not analyzed during this project, the steel I-beam
underwent numerous impact tests in distinct locations, and utilized various piezoelectric (PZT)
devices to verify optimal selections. Furthermore, a number of state-space models were
implemented using MATLAB’s system identification application. As a result, an SSEST model
estimation method was selected to support the tested load responses.

8
Professional Licensure Statement
A licensure is the granting or regulation of a license(s) which allows one to perform
specified acts legally. In this case, a professional licensure plays a significant role in one’s career
as it symbolizes that one has become a professional engineer (PE) and meets specific qualifications
in their education and work experience to uphold and protect the public. In the United States,
engineering licensure is governed by state through each state’s licensure board. However, a general
four-step process is required regardless:
1. Earn a four-year degree in engineering from an accredited engineering program
2. Pass the Fundamentals of Engineering (FE) exam
3. Complete four years of progressive engineering experience under a PE
4. Pass the Principles and Practice of Engineering (PE) exam
To further detail, the process of achieving a professional licensure first begins with
becoming an engineer intern. By graduating from an accredited four-year engineering program
approved by one’s state licensure board and successfully completing the FE exam, it signifies that
one has mastered the fundamental requirements necessary to continue forwards. It is then
necessary to gain professional experience in the field of engineering. Every state requires that
candidates complete at least four years of qualifying engineering experience, which is typically
held under the supervision of a PE. It is helpful to note that most of these qualifying experiences
occur after graduation rather than during. After years of experience, the next step is to learn one’s
state licensure requirements. Every state has its own licensure board which administers distinct
exams and required qualifications. Once this is understood, an engineer can prepare for and take
the PE exam in hopes to attain a professional licensure and become a PE. In order to maintain a

9
PE license, most states require that the PE continues their professional competency. In all cases,
however, a renewal fee must be instituted either annually or bi-annually. [15]
Obtaining a licensure proves significant importance to the profession of engineering, the
public, and the individuals themselves. A licensure is important to the profession as it proves that
one has met the standards, education, and experience to serve as a professional engineer and
uphold the standards of those with the same mastery. To the public, a licensure exhibits that one
has committed their art in protecting and servicing the people. It signifies that one has the
credentials to earn trust, respect, and take on higher levels of responsibility. For the individual, a
licensure symbolizes a sense of pride and achievement. It demonstrates an adoration for the field
and future work of the engineer. [15]

10
Table of Contents
Abstract ........................................................................................................................................................ 2
Acknowledgements ...................................................................................................................................... 3
Capstone Design Statement ........................................................................................................................ 4
Design Problem ........................................................................................................................................ 4
Approach .................................................................................................................................................. 4
Realistic Constraints ................................................................................................................................ 5
Economic .............................................................................................................................................. 5
Health and Safety ................................................................................................................................ 5
Ethical .................................................................................................................................................. 6
Sustainability ....................................................................................................................................... 6
Social ..................................................................................................................................................... 6
Constructability ................................................................................................................................... 7
Professional Licensure Statement ............................................................................................................... 8
Table of Contents ....................................................................................................................................... 10
1.0 Introduction ........................................................................................................................................ 14
2.0 Background ......................................................................................................................................... 17
2.1 Human Body Forces ....................................................................................................................... 17
2.1.1 Effects on Structural Performance ......................................................................................... 19
2.1.2 Effects on Human Comfort Levels ......................................................................................... 20
2.2 Prior Studies .................................................................................................................................... 22
2.2.1 Study 1 ..................................................................................................................................... 22
2.2.2 Study 2 ..................................................................................................................................... 24
2.2.3 Study 3 ..................................................................................................................................... 25
3.0 Methodology ........................................................................................................................................ 28
3.1 Structural Properties ...................................................................................................................... 28
3.2 Technology ...................................................................................................................................... 30
3.3 Phase I: Matrix & Property Altercation........................................................................................ 33
3.3.1 Step 1: Gather Structural Responses ...................................................................................... 34
3.3.2 Step 2: Model Responses .......................................................................................................... 36
3.3.3 Step 3: Match Responses ......................................................................................................... 38
3.4 Phase II: Model Estimation & System Identification .................................................................. 39

11
3.4.1 Step 1: Determine Best Estimation Method .......................................................................... 40
3.4.2 Step 2: Gather Human-Body Responses ................................................................................ 42
3.4.3 Step 3: Model Responses .......................................................................................................... 47
4.0 Results ................................................................................................................................................. 52
5.0 Discussion & Conclusions ................................................................................................................... 57
References .................................................................................................................................................. 61
Appendix A: Structural Properties ........................................................................................................... 65
Appendix B: Jumping Responses ............................................................................................................. 69

12
Table of Figures
Figure 1: Ground Reaction Force (GRF) .......................................................................................... 18
Figure 2: (a) Countermovement Jump; (b) Squat Jump ................................................................... 19
Figure 3: Recommended Peak Acceleration for Human Comfort ...................................................... 21
Figure 4: Human Perception Levels ................................................................................................. 22
Figure 5: (a) Picture of accelerometers during tests; (b) Reference Chandler’s Model ......................... 23
Figure 6: Design Criteria for Analytical Model ................................................................................. 27
Figure 7: Dynamic Equilibrium Equation for Finite Element System .............................................. 27
Figure 8: Semi-Fixed Steel I-Beam .................................................................................................. 28
Figure 9: SDOF System ................................................................................................................... 29
Figure 10: Wireless Accelerometer ................................................................................................... 31
Figure 11: Wired Accelerometer ....................................................................................................... 32
Figure 12: Impact Hammer ............................................................................................................. 32
Figure 13: Test in Progress............................................................................................................... 34
Figure 14: VI File Layout for Wired Accelerometer & Impact Hammer ........................................... 35
Figure 15: Input Response (Impact Hammer) .................................................................................. 35
Figure 16: Output Response (Wired Accelerometer) ......................................................................... 36
Figure 17: Response Data for Model ................................................................................................ 36
Figure 18: General State-Space Representation for a Linear System ................................................. 37
Figure 19: State-Space Model (Phase I) ............................................................................................ 37
Figure 20: Model Response Comparison ........................................................................................... 38
Figure 21: Method I (n4sid) ............................................................................................................. 41
Figure 22: Method II (ssest) ............................................................................................................. 41
Figure 23: Method III (ssregest) ....................................................................................................... 42
Figure 24: Wireless Accelerometer Setup .......................................................................................... 43
Figure 25: VI File Layout for Wireless Accelerometer ...................................................................... 44
Figure 26: Excel Data Conversion (sample) ...................................................................................... 44
Figure 27: Continuous Jumping Response (10 sec) ........................................................................... 45
Figure 28: Delayed Jumping Response (10 sec) ................................................................................ 45
Figure 29: Continuous Jumping Response (2.5 sec) .......................................................................... 46
Figure 30: Delayed Jumping Response (2.5 sec) ............................................................................... 46
Figure 31: FFT of Continuous and Delayed Jumping Responses ...................................................... 47

13
Figure 32: HBF (Continuous Jumping) ............................................................................................ 48
Figure 33: HBF (Delayed Jumping) ................................................................................................. 48
Figure 34: State-Space Model (Phase II) .......................................................................................... 49
Figure 35: Continuous Jumping Beam Response (10 sec) .................................................................. 50
Figure 36: Delayed Jumping Beam Response (10 sec) ...................................................................... 50
Figure 37: Continuous Jumping Beam Response (2.5 sec) ................................................................. 51
Figure 38: Delayed Jumping Beam Response (2.5 sec) ..................................................................... 51
Figure 39: Steel Beam Free Response (Dominant Frequency) .......................................................... 54
Figure 40: FFT Response Comparison ............................................................................................. 55
Figure 41: Synchronized Dynamic Load Equation ........................................................................... 59
Figure 42: Typical Values of Contact Ratio for Various Activities .................................................... 60
Figure 43: Steel I-Beam Dimensions ................................................................................................ 65
Figure 44: Beam Mass Calculations .................................................................................................. 65
Figure 45: Beam Stiffness Calculations (Pt. 1) .................................................................................. 66
Figure 46: Beam Stiffness Calculations (Pt. 2) .................................................................................. 67
Figure 47: Beam Stiffness (Pt. 3), Natural Frequency & Damping Coefficient Calculations .............. 68
Figure 48: Continuous Jumping Responses ...................................................................................... 69
Figure 49: Delayed Jumping Responses ........................................................................................... 70

14
1.0 Introduction
The study of human-induced vibrations plays a vital role in the field of civil engineering.
Each day, human body forces (HBF) generate a substantial portion of the live loads expelled on
structures such as floors, stadiums, assembly halls, and footbridges. These HBF can produce
excessive vibrations within a system, which can potentially effect human comfort levels and
structural performance. This has become a major concern in areas such as the United Kingdom
and South America, where “predicting the structural response due to crowd-induced vibrations is
now recognized as an important aspect in the design and/or performance assessment” [3].
The effects of human-induced loads date back all the way to the early 1800’s when soldiers
used to march in unity across footbridges. One of the first appearances of these effects occurred in
April 1831 where “a brigade of soldiers marched in step across England’s Broughton Suspension
Bridge…the bridge broke apart beneath the soldiers, throwing dozens of men into the water” [2].
Due to the synchronization of the soldiers’ movement, mechanical resonance was generated within
the structure which amplified the internal vibrations and resulted in systematic failure. In order to
avoid further issues armies commanded their men to break stride when crossing bridges; however
further analyzation of the occurrence was not prominent.
Human-induced loads have affected the design of more recent structures, too. Although the
United States has not received many concerns involving human-induced issues, regions such as
Europe, South America, and the United Kingdom have experienced a considerable amount of
detriment and human discomfort. This may be a result of the increased excitation of dynamic
crowd loads during sporting and musical events. Some examples of these occurrences have been
provided below:

15
In the summer of 1985, the Nya Ullevi Stadium, located in Gothenburg, Sweden,
experienced effects of human-induced vibrations during a number of concerts. During
these concerts, the audience jumped in time to the music which excited the clay layer
from the surface with the same frequency as the beat of the music. It was found that the
frequency was close to 2.4 Hz. This vibrated the whole deposit underneath the stadium,
causing structural damage and people to seek safer locations. [5]
In 1993, the Maracanã Stadium, located in Rio de Janeiro, Brazil, encountered heavy
human-induced vibrations during a number of ongoing football games. With a stadium
capacity of roughly 150,000 people, high levels acceleration and large displacements
could be felt during the games. The lowest natural frequency of the empty cantilever
stands was reported to be 4.6 Hz. Due to these vibrations, cracks were developed in the
beams. These cracks may have led to systematic failure if not taken care of sooner. [6]
On June 10, 2000, the Millennium Bridge, located in London, England, opened for a
crowd of over 1,000 people. As the crowd began to walk across the bridge, there was an
unexpectedly pronounced lateral movement of the deck. The frequency of excitation
was close to the mean pacing rate of walking of about 2 Hz. This movement was enough
to cause people to stop walking and retain their balance. The bridge was immediately
closed and limited to the number of people it could carry. [7]
Today, human-induced loads pose an increased concern within the civil industry as “the
aesthetic demand of human beings and recent advances in material and fabrication technologies
have enabled the design and construction of stylish, light and slender long span structures” [1].
Through the use of this design criteria, structures have become more flexible, “resulting in
relatively low natural frequencies that are more easily excitable by human occupants” [4].
However, the effects of these HBF are a topic not typically discussed within the civil industry.
Perhaps this is due to the intricacy and lack of technology necessary to produce accurate results,

16
or that excitations such as wind, fire, and seismicity are more influential in society. Nevertheless,
the impact of human-induced loads has become a crucial topic for future engineers.
This report focuses on the response analyzation of a steel I-beam under human-induced
jumping, using concepts of structural dynamics. The study includes the analysis and design of
the provided structure, along with the model estimation and continuous-time representation of
the state-space function. Results of the study were evaluated to determine the potential effects on
human comfort and structural performance. The report concludes with finishing thoughts and
future recommendations.

17
2.0 Background
Chapter 2.0 provides insight on the key concepts and background information utilized
within this study. This chapter was written to pertain specifically towards jumping for correlation
purposes. Section 2.1 discusses the context of human body forces and explores the potential effects
of human loading from both a structural and personal perspective. Section 2.2 evaluates a number
of past studies who have conducted dynamic analyzations of jump-like movements. Various
methods of analyzation were observed, along with their results and conclusions.
2.1 Human Body Forces
Human body forces (HBF), such as walking, running and jumping, generate a significant
amount of live loads deployed on structures each day. Increased attention has been brought to this
topic due to its potential effects on system performance and human comfort. However, HBFs prove
a difficult topic for engineers due to their complex and time-consuming nature. During this study,
the human activity of jumping was analyzed and evaluated based on the potential effects it had on
a provided structural member. In order to assess the situation properly, background information
was researched and implemented as seen necessary.
Like all human body forces, jumping or jump-like movements, act as a type of dynamic
loading. These loads obey under Newton’s Second Law, which states that:
𝐹 = 𝑚𝑎
𝑊ℎ𝑒𝑟𝑒,
𝐹 = 𝐹𝑜𝑟𝑐𝑒
𝑚 = 𝑀𝑎𝑠𝑠
𝑎 = 𝐴𝑐𝑐𝑒𝑙𝑒𝑟𝑎𝑡𝑖𝑜𝑛
(1)

18
Likewise, a corresponding exerted force, called a ground reaction force (GRF), can be determined
through the equation [31]:
𝐹𝐺𝑅 = ∑ 𝑚𝑖(𝑎𝑖 − 𝑔)
𝑠
𝑖 = 1
𝑊ℎ𝑒𝑟𝑒,
𝐹𝐺𝑅 = 𝐺𝑟𝑜𝑢𝑛𝑑 𝑅𝑒𝑎𝑐𝑡𝑖𝑜𝑛 𝐹𝑜𝑟𝑐𝑒
𝑔 = 𝑆𝑡𝑎𝑡𝑖𝑐 𝐴𝑐𝑐𝑒𝑙𝑒𝑟𝑎𝑡𝑖𝑜𝑛 𝑑𝑢𝑒 𝑡𝑜 𝐺𝑟𝑎𝑣𝑖𝑡𝑦 (9.81𝑚
𝑠2)
Figure 1: Ground Reaction Force (GRF)
The nature of jumping is an appropriate topic when introducing one to the field of structural
dynamics. This is due to the somewhat ‘simplicity’ of the movement. Unlike walking and running,
which contain various impacting factors due to the gait cycle, jumping acts as a rhythmic activity.
This can be noted for both continuous and single-jump patterns. Jumping is also typically measured
as either countermovement or squat [32].
(2)

19
Figure 2: (a) Countermovement Jump; (b) Squat Jump
In a countermovement jump, “the jumper starts from an upright standing position, makes a
preliminary downward movement by flexing at the knees and hips, then immediately and
vigorously extends the knees and hips again to jump vertically up off the ground” [32]. A squat
jump embodies most of the same actions as a countermovement, however the jumper starts from
a stationary semi-squatted position and does not employ a preliminary downward phase. In terms
of this report, a countermovement jump was analyzed as it is a “much more natural jumping
movement and most people can jump several centimeters higher in a countermovement jump than
in a squat jump” [32].
2.1.1 Effects on Structural Performance
The nature of jumping, or jump-like movements, has a high probability of impacting
structural performance compared to other movements. This is potentially due to the isolation of
system loading, which can be observed to a greater extent in single jumps and heel-drop impacts
as they act as impulsive loads [24]. Furthermore, the effects of crowd synchronization on jump-
like movements have been notorious for producing structural fatigue; as noted in Chapter 1.0.

20
According to recent studies, the typical frequency range for movements such as jumping
hovers roughly around 1.5 Hz to 3.5 Hz [22]. This can be detrimental for systems that are not
designed to handle such low frequencies, as mechanical resonance, or an increase in amplitude
range due to frequency correlation, could occur. However, a number of building codes have been
developed for structural guidance on addressing this issue. For instance, vibrations due to rhythmic
activities were recognized in a Commentary to the 1970 National Building Code of Canada (NBC),
where it was stated that “resonance due to human activities can be a problem if the floor frequency
is less than 5 Hz” [24]. It was also researched that structures that move significantly make it
impossible to jump at (or very near) the natural frequency of a structure; thus removing any
possible chance of resonance [28]. This is due to the fact that “as the human-induced vibrations
increased, feet-structures contact time simultaneously increased, so the body motion became more
bouncing-like than jumping” [28]. However, if structures are built stiffer, they are more likely to
generate higher human-induced forces. These are key concepts to keep in mind when designing
for human body forces.
2.1.2 Effects on Human Comfort Levels
Similar to structural performance, human comfort levels can also be significantly impacted
by jump-like movements. This is most likely a result from excessive vibrations, or an increase in
the response amplitude range within a system. However, when attempting to design for comfort
there are a few points to consider.
The first, is that the reaction of people who feel vibration depends very strongly on what
they are doing. For instance, according to Floor Vibrations due to Human Activity by Murray et
al., when dealing with a frequency range of 4-8 Hz, “people in offices or residences do not like
‘distinctly perceptible’ vibration (peak acceleration of about 0.5% of g), whereas people taking

21
part in an activity will accept vibrations approximately 10 times greater (5% of g)” [24]. Likewise,
people dining beside a dance floor, lifting weights in a gym, or standing in a shopping mall may
tolerate vibration up to 1.5% of g [24].
Figure 3: Recommended Peak Acceleration for Human Comfort
The second consideration, is that “there are no generally accepted international standards
for comfort criteria” [27]. Research from the Vibrations and Shock Handbook by Clarence W. de
Silva, indicated that levels of human comfort perception were generated based on a number of
physiological and physiological parameters. These parameters included the “occupant’s
expectations and experience, activity, body posture, and orientation; visual and acoustic cues; and
the amplitude, frequency, and acceleration of both the translational and rotational motion to which
the occupant was subjected” [27]. In this study, affected human perceptions of motion and
vibration in the frequency range of 0-1 Hz were produced. The following figure can provide one
with a suitable baseline for design criteria of tall structures such as offices and hotels.

22
Figure 4: Human Perception Levels
2.2 Prior Studies
Recent studies that have analyzed human induced loads have been investigated to assess
potential methods for research. All three studies pertain to the action of jump-like movements,
strictly for correlation purposes. Analyzing this data allowed for a stronger understanding of both
the issues and the possible solutions utilized.
2.2.1 Study 1
The first study, Human Induced Dynamic Loads Estimation Based on Body Motion,
conducted by Paolo Mazzoleni and Emanuele Zappa, discussed the effects of human jumping and
bobbing on a dynamometric platform [22]. 42 tests (21 jumping, 21 bobbing) were performed and
evaluated for “the vertical force induced by the movement of the volunteer on the ground, the
vertical acceleration of 8 parts of the body, and a video of the motion of the volunteer” [22]. The
investigated frequency range was 1.5 to 3.5 Hz, with a step frequency of 0.1 Hz.

23
Figure 5: (a) Picture of accelerometers during tests; (b) Reference Chandler’s Model
The first evaluation, vertical forces induced by the volunteers’ movement on the ground,
was the main focus when analyzing this report. Results compared the data between measured and
estimated forces at a frequency of 2.5 Hz. A formula for percentage error was the used to determine
the accuracy of the recorded data. Although the approximation was acceptable, Mazzoleni and
Zappa concluded that “high frequency errors may be due to an imperfect fastening of the
accelerometers” and “low frequency discrepancies…may be attributed to no negligible rotations
in such kind of movement” [22].
Evaluations for the vertical acceleration of body parts and volunteer motion were also
analyzed in this report. These tests used digital image correlation (DIC) code to develop reliable
acceleration estimations of individual body parts. The DIC results were then arranged in a 3D
matrix and video processing of human motion was applied using a greyscale 1024x521 global
shutter CCD camera. The processing system combined previous data with that of the 3D matrix,
using velocity as a third dimension. The results proved to be more accurate, when implanting the
percentage error formula, than those previously in the study. The authors concluded that this may
have occurred due to the fact that “a non-contact measuring technique is not subjected to problems

24
related to sensor fastening”, but rather, “the neglecting rotation of some parts of the body in these
kinds of movements” [22].
2.2.2 Study 2
Study 2, Structural Health Monitoring of a Stadium for Evaluating Human Comfort and
Structural Performance, administered by Hasan Ozerk Sazak, analyzed the human induced
vibrations occurring during football games with respect to human comfort levels defined by
international codes [8]. The structure under monitoring was a steel-framed stadium encompassing
25 acres and an approximate 45,000 seating capacity. The report focused on two student sections
of the stadium, as “students mostly get more excited during the games and also the university band
was located close” [8]. High sensitivity accelerometers, PCB 393C, were utilized to collect crowd-
induced, structural responses over a span of eight games. These responses were recorded before,
during and after each game in order to distinguish results. A single set of the experimental data
was then extracted and used as a forcing function for a developed finite element (FE) model.
To develop an FE model, Sazak initially compared the measured data with a symmetric
half-sine function, as it was assumed that “a series of identical half-sine wave pulses may be
represented by measured jumping force pulses” [8]. However, none of the jumping harmonics
aligned with previous data. Therefore, to achieve a reliable model, a small scale experiment was
conducted on a fixed, 4-foot, C-type beam. Accelerometers, PCB 603C01, were placed under the
girder of the beam at identical spans, lengthwise. Crowd impacts for jumping were then simulated
using a total of three participants and a number of different loading combinations. Data sets for
acceleration were recorded and compared with the acceleration results from the FE beam model
in order to “verify the validity of the time-history application” [8]. These results were based on the

25
first mode frequencies. A single matching forcing frequency, depicting a random-jumping
scenario, was extracted for further use.
Once the validated loading function was achieved, it was applied to a retrofitted FE model
representing the structure of the selected stadium sections at full capacity. The purpose of the
model was to “identify the changes in vibration level and dynamic characteristics with increasing
the stiffness of the section by implementing a retrofit to structural members” [8]. After retrofitting
a number of beams, and comparing their time domain and frequency domain results, “It was
identified that retrofit application was successful in both decreasing the vibration level and
increasing the stiffness [modal frequencies]” [8]. The observed results showed that “vibration
levels dropped nearly to half of its value before retrofitting and modal frequencies increased by
nearly thirty percent for the first two main frequencies”, thus removing the first mode frequency
out of damaging range [8].
The author concludes the study by stating that “synchronized motion events mostly created
uncomfortable or very uncomfortable situation for the spectators as per the ISO 2631 code” and
that “even when the maximum value of the vibration (raw signal) of an event was not very high,
the situation it created for the spectators (RMS signal for ISO 2631) may induce more
uncomfortable conditions depending on the duration of the event” [8].
2.2.3 Study 3
Study 3, Floor Vibration Induced by Dance-Type Loads: Verification, by B. R. Ellis and
T. Ji, discussed the testing procedures performed for verifying an analytical method of calculating
floor vibrations induced by dance-type loads [29]. Tests were recorded on a precast reinforced
concrete beam with dimensions 3.0 x 0.4 x 0.083 m and simply supported ends 0.1 m in.
Vibrational responses from movements such as jumping and stamping were monitored using

26
“three transducers mounted under the center of the beam, to measure acceleration, velocity and
displacement” [29]. Ellis and Ji recorded a series of experiments depicting human involvement for
a number of possible hypotheses:
1. Human involvement as an additional mass-spring-damper system on the beam
2. Human involvement as a load on the beam
3. Human involvement as a load and an additional mass-spring-damper system on the beam
Scenarios 1 and 3 were evaluated based on the assumption that “crowd[s] act as a rigid
mass, which implies that the added mass will effectively reduce the fundamental frequency of the
floor” [29]. The fundamental frequency of the beam was recorded both bare and damped situations.
When there was a person standing or sitting on the beam, the “frequency increased and the
damping value increased significantly whereas, when a mass equivalent to the mass of the person
was placed on the beam, the frequency decreased and the damping value remained unchanged”
[29]. Although this data suggested that a person acts as an additional mass-spring-damper system,
it was “identified experimentally that people jumping only act as a load and not as an additional
mass on the floor” [29].
Scenario 2 discussed human involvement strictly as a load on the beam. An analytical
model was developed using a set of equations which calculated the gravitational acceleration for
vibration due to rhythmic, dance-type activities. These equations were derived using “beam theory
and the first Fourier component of load” [29].

27
Figure 6: Design Criteria for Analytical Model
The model was then compared with numerical measurements obtained from responses of human
jumping at roughly 2.0 Hz. Measurements were accomplished using a direct integration method
within the finite element program, LUSAS, along with the standard dynamic equation for damped
forced vibration [29].
Figure 7: Dynamic Equilibrium Equation for Finite Element System
Results of this study noted that the analytical and numerical methods coincided once they
reached a steady-state; roughly 1.5 seconds in. Furthermore, the peak acceleration calculated
through the numerical method was nearly identical to that of the analytical method, illustrating
that the results were quite accurate. Ellis and Ji concluded the report stating that “it is not safe to
apply design criterion based on simply supported beam for all types of floors” [29].

28
3.0 Methodology
This chapter discusses the structural properties, technology and process taken towards
achieving a baseline model for the analysis of human-induced jumping loads on a steel I-beam.
The process employed during this project was broken down into two phases. The first phase was
considered to be the “trial and error” phase. This phase focused on the development of a state-
space model using matrix and beam property altercation. The second phase was an “alternative
method” phase. During this phase, a number of estimation algorithms were performed using
system identification (SID).
3.1 Structural Properties
This project focused on the impact analysis of human-induced jumping on a steel I-beam
provided by the Worcester Polytechnic Institute (WPI) Civil & Environmental Engineering
Department. Due to the rugged layout of the floor, the structure was bolted down to produce a
nearly-fixed support. Calculations were based on the length of the beam from support to support
and disregarded the one foot overhang on each side as shown below.
Figure 8: Semi-Fixed Steel I-Beam

29
During this study, the beam was treated as a damped single-degree-of-freedom (SDOF) system,
consisting of a mass (m), a stiffness (k), and a damping coefficient (c). These factors enabled the
use of functions such as state-space modelling and Fast-Fourier Transform (FFT), which have been
discussed later in the report. The standard process used to achieve these values has been presented
below. Further detail of these calculations can be found in Appendix A.
Figure 9: SDOF System
The mass, stiffness and damping parameters of the steel I-beam were generated using a number of
formulas, and deduced and calculated values. A fixed support system was assumed to develop a
foundation for testing.
𝑚 = 𝜌𝑉
𝑊ℎ𝑒𝑟𝑒,
𝜌 = 𝐷𝑒𝑛𝑠𝑖𝑡𝑦
𝑉 = 𝑉𝑜𝑙𝑢𝑚𝑒
𝑘 =12EI
𝐿3
𝑊ℎ𝑒𝑟𝑒,
𝐸 = 𝑀𝑜𝑑𝑢𝑙𝑢𝑠 𝑜𝑓 𝐸𝑙𝑎𝑠𝑡𝑖𝑐𝑖𝑡𝑦
(3)
(4)

30
𝐼 = 𝑀𝑜𝑚𝑒𝑛𝑡 𝑜𝑓 𝐼𝑛𝑒𝑟𝑡𝑖𝑎 𝑎𝑟𝑜𝑢𝑛𝑑 𝑡ℎ𝑒 𝐶𝑒𝑛𝑡𝑟𝑜𝑖𝑑
𝐿 = 𝐿𝑒𝑛𝑔𝑡ℎ
𝑐 = 2 ∗ m ∗ ω𝑛 ∗ ζ
𝑊ℎ𝑒𝑟𝑒,
𝜁 = 𝐷𝑎𝑚𝑝𝑖𝑛𝑔 𝑅𝑎𝑡𝑖𝑜 (2%)
𝜔𝑛 = 𝑁𝑎𝑡𝑢𝑟𝑎𝑙 𝐹𝑟𝑒𝑞𝑢𝑒𝑛𝑐𝑦
In order to achieve the natural frequency of the structure, the following equation was used:
𝜔𝑛 = √k
m
Using the presented material, values for mass, stiffness and damping were calculated out to be
roughly 1215 lb, 1.2E5 lb/in and 488 lb*s/in, respectively. The natural frequency was also
computed as approximately 10 Hz. These values were utilized throughout the study for comparison
and altercation purposes.
3.2 Technology
During this study two accelerometers, one wireless and one wired, and an impact hammer
were tested. All three mechanisms functioned under the piezoelectric (PZT) effect by using
“microscopic crystal structures that get stressed by accelerative forces, causing a voltage to be
generated” [16]. This section aims to discuss the following PZT devices along with their
corresponding specifications.
An accelerometer is a device that measures the acceleration of a system and illustrates the
data through a frequency response. Accelerometers evaluate using a specified sensitivity, or scale
factor, which can be noted as “the ratio of the sensor’s electrical output to mechanical input” [26].
(5)
(6)

31
This sensitivity may also have a stated tolerance, such as ±5% or ±10% [26]. Furthermore, each
accelerometer operates based on its own amplitude range, which defines the “maximum [or
minimum] amplitude vibration that can be measured before distortion occurs” [30]. This energy
may be specified in units of vibration, “g”, or gravitational acceleration; indicating the intensity of
a gravitational field expressed in meters per second squared (m/s2).
The wireless accelerometer, MMA8652FC, was implemented using the Bluetooth
program, BlueSoleil, and a portable dongle. The MMA8652FC is a three-axis sensor with 12 bits
of resolution. It contains a dynamic range of ± 2g, which produces a digital output sensitivity of
1024 counts/g [9]. During testing, the accelerometer was set to record data at a rate of 360 Hz, or
360 samples/sec. Furthermore, velcro padding was applied to the back to allow for a more
straightforward and secure application.
Figure 10: Wireless Accelerometer
A wired accelerometer was also needed to gather accurate testing data. This device, 780C, was
connected to the steel beam using a screw-in connection. The accelerometer contains an
acceleration range of ± 80g and produces an analog output sensitivity of 100 mV/g [10]. During
testing, the accelerometer recorded data at a rate of 1652 Hz.

32
Figure 11: Wired Accelerometer
To produce the most accurate model possible, an impact hammer was synchronized to the
wired accelerometer system. This device, Model 2304, had an output range of 5000 lbf and could
produce a maximum force of 8000 lbf. The weight of the head was 3.0 pounds and the device’s
total length was 15.2 inches [11].
Figure 12: Impact Hammer
The engineering programs applied in this project were LabVIEW, MATLAB and Simulink.
LabVIEW, or Laboratory Virtual Instrument Engineering Workbench, is a system design software
used for visual programming. This software aided in the gathering of impact responses which were
converted into text and excel files for further implementation. For this report, two virtual

33
instrument (vi) layouts were utilized to produce the given results. MATLAB, or Matrix
Laboratory, is a numerical computing program which uses fourth-generation programming
language to solve complex problems. MATLAB was employed to develop and analyze various
response files though a number of generated codes. Concepts such as state-space modelling and
Fast-Fourier Transform (FFT) were also evaluated through the use of this program. Simulink, a
program within MATLAB, was applied to this study as well. Simulink is a graphical program used
for modelling, simulating, and analyzing dynamic systems. This software was applied in order to
construct the final model of the project, along with the ability to compare multiple frequencies
using set model configuration parameters.
3.3 Phase I: Matrix & Property Altercation
Phase I focused on the development of a state-space model using matrix and structural
property altercation. State-space models “use state variables to describe a system by a set of first-
order differential or difference equations, rather than by one or more nth-order differential or
difference equations” [19]. This modelling method was utilized because it is can handle systems
with multiple inputs and outputs, provides a quick estimations, and produces time-domain
solutions [12]. The steps taken during this phase have been broken down into three segments:
1. Gather structural responses using the impact hammer
2. Run the impact force through a state-space system
3. Match the impact hammer structural response with the model output response
These steps have been discussed in further detail within the following sections.

34
3.3.1 Step 1: Gather Structural Responses
In order to develop a baseline model for human-induced loads, responses were generated
using the provided impact hammer and wired accelerometer. Originally the goal was to simply use
the wireless accelerometer for all tests, however, the device seemed to not produce any structural
response signals. This may have been a result of too low of sensitivity, or possible digital
connectivity issues through Bluetooth.
With the aid of Russ Lang and Don Pellegrino, laboratory technicians for the Civil &
Environmental Engineering Department at WPI, the steel I-beam and PZT devices were setup for
testing through National Instruments (NI). In order to record data, the wired accelerometer was
screwed in at the top-center of the beam’s flange. Impacts were struck at the direct center and
vibrational responses were recorded in a corresponding LabVIEW VI file.
Figure 13: Test in Progress

35
Figure 14: VI File Layout for Wired Accelerometer & Impact Hammer
Impacts during the testing process attempted to hover around 200 pounds, as this was the general
weight of my body at the time. However, since the sensitivity of the impact hammer was so high,
numerous data sets needed to be generated to provide accurate results. For the purposes of the
developed model in Phase I, the following response selections were used.
Figure 15: Input Response (Impact Hammer)

36
Figure 16: Output Response (Wired Accelerometer)
3.3.2 Step 2: Model Responses
Step two was to model the gathered responses through state-space system design. To
accomplish this, a code was developed using the engineering software MATLAB and Simulink.
Input data focused on a single frequency response for simplification and modelling purposes. The
selected impact force was registered at 201.5 pounds.
Figure 17: Response Data for Model

37
The general state-space representation of a linear system for a given number of inputs (u), outputs
(y), and state variables (x) has been illustrated below in Figure 18. This representation is applicable
to both single-degree-of-freedom (SDOF) and multi-degree-of-freedom (MDOF) systems.
Figure 18: General State-Space Representation for a Linear System
The final development of Phase I’s model required the implementation of the force and
acceleration data responses, along with the parameters set for the state-space system equation
mentioned above.
Figure 19: State-Space Model (Phase I)

38
A model output response was generated from the force of the impact hammer, labelled as
“Accel2”. The response was then compared to with that of the wired accelerometer for further data
analysis and comparison.
Figure 20: Model Response Comparison
When comparing the two responses, the model output response was coded as yellow while the
wired accelerometer response was coded as blue. One can tell that the initial two responses do not
align; the model output response seems to follow a standard sinusoidal curve at a lower amplitude
range than that of the wired accelerometer. In order to match these frequencies, the matrices and
structural properties used within the equation needed to be adjusted.
3.3.3 Step 3: Match Responses
Matching the frequency responses was a key aspect towards achieving an accurate state-
space model. By matching the model output response to the collected raw data response, future

39
implementations and advancements could be assessed. For example, if a model was developed
which illustrated the effects of a 200 pound jumping force on a given structure, tests could then be
run for other weight classes and implemented into the model to improve range and accuracy.
Likewise, if one was to integrate additional input variables such as walking and running, a
matched-response model would act as a suitable base.
Matching the state-space model output response with the response generated by the wired
accelerometer required the adjustment of state-space matrices and structural properties of the steel
I-beam. However, this was quickly discovered to be a long and tedious process. Since time was a
factor, an alternative method was essential for forwards progression.
3.4 Phase II: Model Estimation & System Identification
Phase II focused on the development of a baseline, state-space model using model
estimation and system identification. System identification (SID) is the process of using statistical
methods to construct mathematical models of dynamic systems. This process was chosen as it
allowed for quick estimation, provided the necessary state-space matrices, and was directly
applicable to multivariable systems with vector inputs and outputs [20]. The steps taken during
this phase have been broken down into three segments:
1. Determine the best state-space model estimation method
2. Gather human body responses
3. Integrate the responses into the estimation model
These steps have been discussed in further detail within the following sections.

40
3.4.1 Step 1: Determine Best Estimation Method
Incorporating the ideals of system identification into a state-space model required the
selection of an estimation method. To determine the most accurate model possible, black-box
estimation was implemented into the program MATLAB. Black-box estimation, or functional
estimation, treats software under tests without the knowledge of its internals [17]. The approach
works by evaluating what the available inputs for an application are and what the corresponding
expected outputs should be [18]. To allow for this, one must “specify the model order, and,
optionally, additional model structure attributes that configure the overall structure of the state-
space matrices” [19]. Black-box estimation was chosen because of its ease of use, simplicity, and
quick test case development [18].
Black-box estimation encompasses three estimation commands; n4sid, ssest, and ssregest.
N4SID is a non-iterative, subspace method that works on both time-domain and frequency-domain
data. This method can be used to generate an initial model and then refined later using the SSEST
command. SSEST is an iterative method that uses prediction error minimization algorithm. This
method also works on both time-domain and frequency-domain data, however is slower than
N4SID to process data. SSREGEST is a non-iterative method that works on discrete time-domain
and frequency-domain data. This command utilizes balance reduction and typically works best on
short, noisy data sets [19].
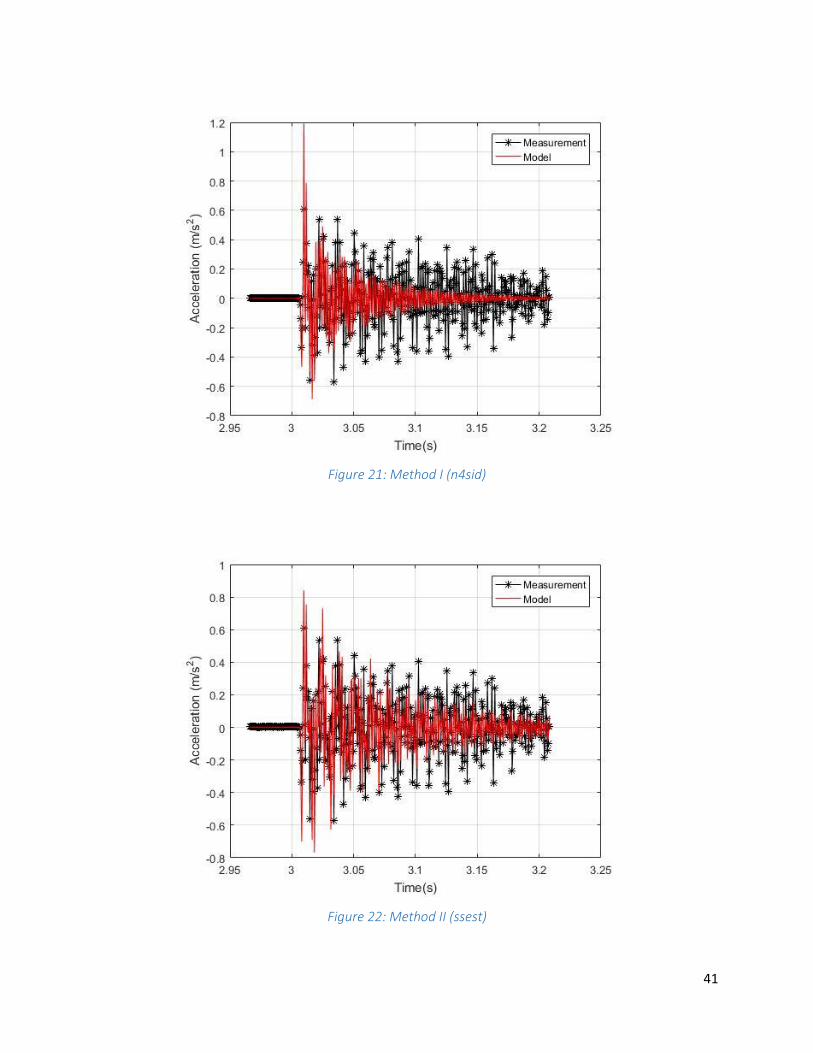
To determine the best estimate state-space model, all three estimation commands were
tested. Each command was programmed to focus on prediction and select the optimal model order,
1-10. The model order for commands N4SID and SSEST was 8, while the model order for
SSREGEST was 10. An input-output data object, denoted as ‘iddata’, was also required. This was
represented by the same force and frequency response set used in Phase I. Noise was added to each
model before simulation.
41
Figure 21: Method I (n4sid)
Figure 22: Method II (ssest)

42
Figure 23: Method III (ssregest)
Based on the data above, estimation command SSEST was selected to represent the state-space
model. This command generated a 60.11% match with the wired accelerometer data, far greater
than N4SID, at 31.33%, and SSREGEST, at 46.46%. This can be verified as the command SSEST
utilizes that of N4SID in order to initialize the state-space matrices. Therefore, although the
command takes longer to estimate, it typically provides a better fit to data [19]. Furthermore, the
SSEST command was the only command that automatically estimated continuous-time models.
Although the other two functions were also able to estimate continuous-time models, accomplished
through setting the sampling time to zero, there was no visible change when doing so.
3.4.2 Step 2: Gather Human-Body Responses
To attain human-induced jumping responses, a single human load was examined. For the
sake of convenience, my body was setup as the test subject. During the time of testing my weight

43
and height were roughly 200 pounds and 5 feet 9 inches. During the process the wireless
accelerometer was tightly attached around my right ankle. This location was chosen as it was the
closest to ground level and generated symmetric responses within the body. However, a degree of
error was almost guaranteed for this step since “the effect of accelerometer (and other sensors)
placement on different parts of the body… has received little consideration” [21]. A stiff-legged
jump height of approximately 4 inches was measured based on the rise of my heels as “the rise of
the jumper’s heels during the jump is very nearly the same as the rise of the jumper’s center of
mass” [32]. This was accomplished through the use of a meter ruler and a keen eye. Furthermore,
all tests were recorded barefoot in hopes of excluding any additional cushion, or damping factor,
which may have affected the data accuracy.
Figure 24: Wireless Accelerometer Setup
Tests were performed in the center of the beam and recorded for both continuous and
delayed patterns (spaced roughly 1.5 seconds apart) to illustrate two common activity scenarios.
A total of 15 tests were recorded throughout the study for each scenario, as previous studies state
that “at least 12 trials are needed to establish stable data in jumping” [28]. Six simulations for each

44
jumping pattern have been noted within Appendix A for further illustration. Through the use
LabVIEW, frequency vibrations were established based on the x, y, and z-axes of my body. Once
the data was collected, the LabVIEW files were then converted into excel files which illustrated
time in Column A, x-axis responses in Column B, y-axis responses in Column C, and z-axis
responses in Column D.
Figure 25: VI File Layout for Wireless Accelerometer
Figure 26: Excel Data Conversion (sample)

45
By positioning the accelerometer with respect to the x-axis, Column B was analyzed to provide
the forcing frequency vibration. A selected 10 second (3600 cycles) response was examined for
each scenario. Additionally, a 2.5 second (900 cycles) component for both tests was extracted and
analyzed further.
Figure 27: Continuous Jumping Response (10 sec)
Figure 28: Delayed Jumping Response (10 sec)
-2
-1.5
-1
-0.5
0
0.5
0 500 1000 1500 2000 2500 3000 3500 4000
Gra
vata
tio
nal
Acc
eler
atio
n (
g)
Time (1/360 sec)
Delayed Jumping Reponse (10.0 seconds)
-2.5
-2
-1.5
-1
-0.5
0
0.5
0 500 1000 1500 2000 2500 3000 3500 4000
Gra
vata
tio
nal
Acc
eler
atio
n (
g)
Time (1/360 sec)
Continuous Jumping Response (10.0 seconds)
46
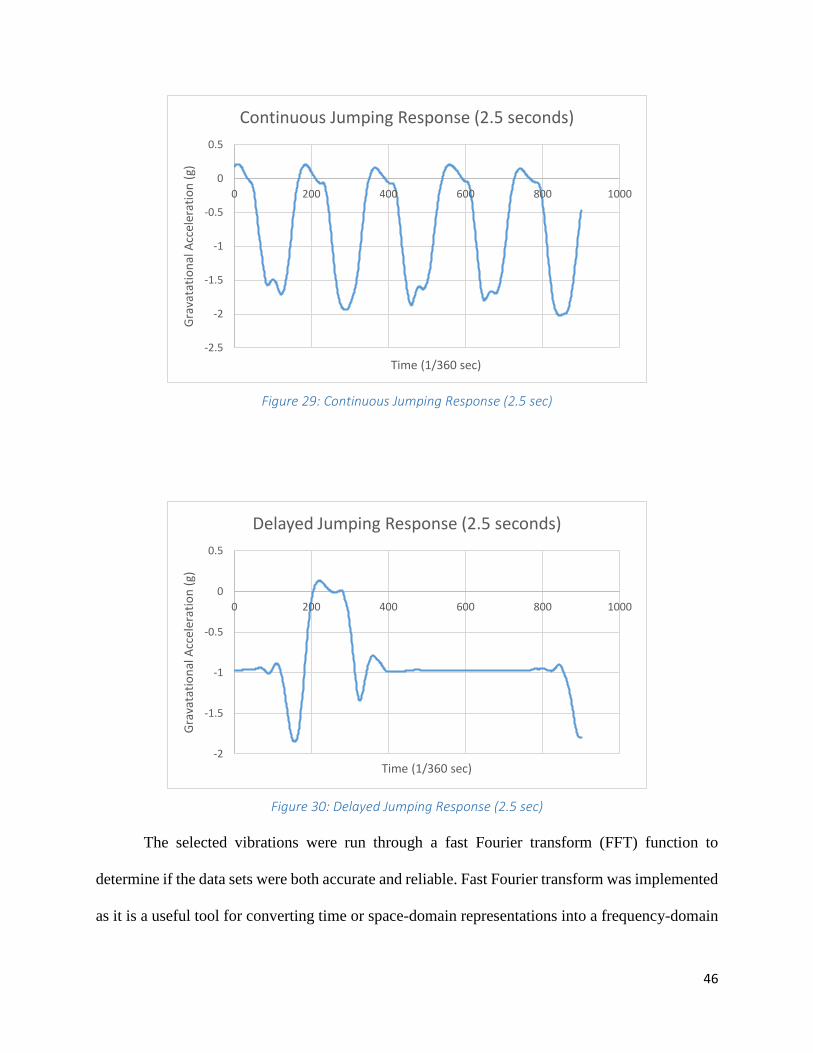
Figure 29: Continuous Jumping Response (2.5 sec)
Figure 30: Delayed Jumping Response (2.5 sec)
The selected vibrations were run through a fast Fourier transform (FFT) function to
determine if the data sets were both accurate and reliable. Fast Fourier transform was implemented
as it is a useful tool for converting time or space-domain representations into a frequency-domain
-2
-1.5
-1
-0.5
0
0.5
0 200 400 600 800 1000
Gra
vata
tio
nal
Acc
eler
atio
n (
g)
Time (1/360 sec)
Delayed Jumping Response (2.5 seconds)
-2.5
-2
-1.5
-1
-0.5
0
0.5
0 200 400 600 800 1000G
rava
tati
on
al A
ccel
erat
ion
(g)
Time (1/360 sec)
Continuous Jumping Response (2.5 seconds)

47
representation, or vice-versa [23]. For this project, the FFT function was able to generate the
dominant frequency ranges of the recorded responses.
Figure 31: FFT of Continuous and Delayed Jumping Responses
Referring back to recent studies, the typical frequency range for movements such as
jumping and bobbing hovers roughly around 1.5 Hz to 3.5 Hz. [22]. When analyzing the recorded
FFT responses, one can note that the dominant frequencies between the two scenarios were fairly
similar and met standard criteria. The continuous jumping response illustrated a distinct dominant
frequency of roughly 3.3 Hz, whereas the delayed response displayed a dominant frequency of
about 2.9 Hz.
3.4.3 Step 3: Model Responses
Once validated, a single jumping response of two seconds was extracted from each scenario
and inserted into a state-space model using the selected estimation method developed in Step 1.

48
These responses were multiplied by a mass of 200 pounds in order to generate the appropriate
forcing frequency.
Figure 32: HBF (Continuous Jumping)
Figure 33: HBF (Delayed Jumping)

49
Phase II’s model applied the provided, pre-formulated matrices for A, B, C and D of the state-
space equation. The output responses for each scenario were also recorded over a period of two
seconds.
Figure 34: State-Space Model (Phase II)
Once the output frequencies were assessed, structural responses were then generated with the use
of human-loading and the wired accelerometer; one should note that these responses were not
tested in synchronization with those from the human body. Similar to Phase I, a selected 10 second
response and 2.5 second extraction for each jumping scenario was analyzed and compared with
that of the model.

50
Figure 35: Continuous Jumping Beam Response (10 sec)
Figure 36: Delayed Jumping Beam Response (10 sec)
-0.5
-0.4
-0.3
-0.2
-0.1
0
0.1
0.2
0.3
0.4
16
13
12
25
18
37
24
49
30
61
36
73
42
85
48
97
55
09
61
21
67
33
73
45
79
57
85
69
91
81
97
93
10
40
51
10
17
11
62
91
22
41
12
85
31
34
65
14
07
71
46
89
15
30
11
59
13
Gra
vita
tio
nal
Acc
eler
atio
n (
g)
Time (1/1652 sec)
Continuous Jumping Beam Response (10.0 seconds)
-1
-0.8
-0.6
-0.4
-0.2
0
0.2
0.4
0.6
0.8
1
16
13
12
25
18
37
24
49
30
61
36
73
42
85
48
97
55
09
61
21
67
33
73
45
79
57
85
69
91
81
97
93
10
40
51
10
17
11
62
91
22
41
12
85
31
34
65
14
07
71
46
89
15
30
11
59
13
Gra
vita
tio
nal
Acc
eler
atio
n (
g)
Time (1/1652 sec)
Delayed Jumping Beam Response (10.0 seconds)

51
Figure 37: Continuous Jumping Beam Response (2.5 sec)
Figure 38: Delayed Jumping Beam Response (2.5 sec)
It was determined that the predictions of this model for real jumping loads did not match perfectly
with that of the measured responses. This may have been a result of a number of issues, such as
time synchronization between the wireless and wired sensors, and excessive noise generation.
Recommendations to counteract these matters have been discussed within the following sections.
-0.8
-0.6
-0.4
-0.2
0
0.2
0.4
0.6
0.8
1
11
54
30
74
60
61
37
66
91
91
07
21
22
51
37
81
53
11
68
41
83
71
99
02
14
32
29
62
44
92
60
22
75
52
90
83
06
13
21
43
36
73
52
03
67
33
82
63
97
9
Gra
vita
tio
nal
Acc
eler
atio
n (
g)
Time (1/1652 sec)
Delayed Jumping Beam Response (2.5 seconds)

52
4.0 Results
This project combined concepts of structural engineering with the field of biomechanics,
through human-induced, system loading. The report captured and analyzed the responses of a steel
I-beam under the activity of jumping, along with a number of human body vibrations, using state-
space system identification design. Originally, the established model would be used to generate
simulated output responses in order to monitor the overall health of the structure. However, with
limited time, the study focused solely on the development of a baseline model for future
implementation.
The final baseline model for human-induced jumping analyzation was generated using
methods of state-space modelling and system identification (SID). State-space modelling was able
to handle systems with multiple inputs and outputs, provide a quick estimations, and produce time-
domain solutions. Likewise, SID allowed for quick estimation, was directly applicable to
multivariable systems with vector inputs and outputs, and provided the necessary state-space
matrices for baseline creation. The SID estimation method, SSEST, was selected to produce these
necessary state-space matrices. This iterative method utilized prediction error minimization
algorithm, which generated a 60.11% match with that of the impact hammer and wired
accelerometer; far greater than N4SID, at 31.33%, and SSREGEST, at 46.46%. Once the matrices
were established, a number of human-induced vibrations for continuous and delayed jumping
patterns were recorded for suitable model integration.
The action of continuous jumping, opposed to delayed, is one that is much more frequently
observed in the world. This was no surprise as the continuous-rhythmic patterns appeared in every
study involving the analyzation of jump-like movements. Therefore, continuous data sets from this
report should align with those from previous studies; a value between 1.5 to 3.5 Hz. Results

53
indicated that this was true as continuous jumping produced a dominant frequency of roughly 3.3
Hz. On the other hand, delayed jumping was not evaluated in any of the researched studies, and
therefore, there was no reference for data precision. However, delayed jumps proved to be quite
similar, generating a dominant frequency of approximately 2.9 Hz. It was presumed that this
frequency would have been higher, however, the lower value may have been due to the fact that
my body acted as a damper when recording. Furthermore, in the article Floor Vibrations due to
Human Activity, it’s stated that “with the advent of limit states design and the more common use
of lightweight concrete, floor systems have become lighter, resulting in higher natural frequencies
for the same structural steel layout” [24]. Therefore, since steel is heavier than concrete per unit
volume, these tests may have generated a low frequency to that of an actual establishment.
The final baseline model consisted of the developed state-space SID matrices, as well as
the continuous and delayed jumping responses. The generated output responses from this model
were compared with the human-induced, structural responses. Frequencies were not perfectly
correlated with these measurements, possibly due to time synchronization issues between wireless
and wired sensors and/or excessive noise. Potential solutions for these complications include the
use of the same accelerometers for both structure and human movement and the application of
digital filters on the measured responses. These have been detailed further in the following section.
Nevertheless, these responses were still evaluated for their potential effects on structural
performance and human comfort.

54
Structural performance was determined using the approximated natural frequency of the
beam calculated in Section 3.1; roughly 10 Hz. To check for this value’s accuracy, an impact
hammer test was run through the fast Fourier transform function. This output also symbolized the
general dominant natural frequency of the system as the modal hammer generated a free response.
Figure 39: Steel Beam Free Response (Dominant Frequency)
It was noted that the two values did not coincide, which was more possibly due to an error in
structural properties. Therefore, the free response value of roughly 16 Hz was used to portray the
system’s natural frequency. The FFT of the actual structural, jump responses were then determined
and evaluated. This has been portrayed below in Figure 40; where green, black and red indicate
free vibration, continuous jumping and delayed jumping, respectively.

55
Figure 40: FFT Response Comparison
Results revealed that there could be a potential indication of resonance within the beam around 16
Hz. Continuous jumping patterns seemed to generate frequencies closer to the free response of the
system. This implied that continuous, harmonic movements are more likely to impact steel over a
period of time than delayed.
Human comfort was determined using criteria from Chapter 2.0. The “actual” responses,
Figures 35 and 36, were first tested based on the comfort perception chart (Figure 4) from the
Vibrations and Shock Handbook by Clarence W. de Silva. The continuous response illustrated an
average peak acceleration of roughly 0.25g, which verified a comfort perception level of 3. This
stated that “the majority of people will perceive motion; the level of motion may affect desk work;
long-term exposure may produce motion sickness” [27]. On the other hand, the delayed response
produced an average peak acceleration of approximately 0.60g, which indicated a comfort
perception level of 6; “most people cannot tolerate the motion and are unable to walk naturally”
[27]. This made relative sense as the delayed vibration was an impulsive load and therefore caused

56
more disruption. Criteria (Figure 3) from Floor Vibrations due to Human Activity by Murray et al.
was evaluated next. Values were determined based on the percent gravity of 9.81 m/s2. Using the
average peak accelerations above, continuous jumping produced a percent gravity of roughly
2.5%, whereas delayed jumping established a percent gravity of approximately 6.1%. Both of these
values stated that single-load jumping can be felt within indoor footbridges, shopping malls, and
dining and dancing venues [24]. Overall, the assessed values above seemed extremely high. This
was probably due to the fact that the perception levels were based on impacts within tall building
structures rather than a steel beam. Furthermore, this data revolved around the peak acceleration
point; illustrating the most significant effects.

57
5.0 Discussion & Conclusions
Chapter 5.0 discusses the overall results of the report, as well as concluding remarks and
recommendations for subsequent studies. It should be noted that the vision of this project was to
design a model which could analyze various human-induced loads for a given structure. However,
a steel beam was used to account for time, the number of group members and gain insight on the
subject of structural dynamics. Therefore, future work should be geared towards monitoring the
health of high-activity structures, such as the WPI Rooftop Field.
Key observations have been developed based on final results of this study. These points
have been listed below:
(1) Continuous jumping is the most typical pattern studied, whereas, delayed jumping
patterns are rarely evaluated
(2) Continuous jumping generates a greater frequency and is more likely to resonate on
the steel I-beam than delayed jumping
(3) State-space system modelling can be an excellent tool for handling systems with
multiple inputs and outputs, providing a quick estimations, and producing time-
domain solutions
(4) System identification modelling is beneficial for its quick estimation, direct
applicability to multivariable systems with vector inputs and outputs, and provision
of pre-formulated state-space matrices
(5) Tweaking matrices and structural properties for model correlation is a timely and
tedious process that is slightly aided by SID estimation methods
Through these observations, future studies should have a less difficult time in achieving specified
model parameters for proper data acquisition.
A number of propositions have also been provided for the future development of a more
precise and enhanced model. These propositions include details on accelerometer usage, the
application of filters, fabricated weight ranges and activity inputs, and simulated crowd excitations.

58
The first proposition for future work is to alter the usage of accelerometers. For instance,
model results might have indicated time synchronization issues between the wireless and wired
sensors. Therefore, it is recommended that future teams should use the same accelerometers for
both structure and human body, which would improve the performance of system identification.
Furthermore, there should be a change in the location of the accelerometer from the ankle to the
shin. In the study, Accelerometer Based on Body Sensor Localization for Health and Medical
Monitoring Applications by Navid Amini, Majid Sarrafzadeh, Alireza Vahdatpour, and Wenyao
Xu, they were able to “classify the shin area flawlessly, as the impact of each step on the shin [was]
significantly higher than other locations” [21]. This increase in impact would be valuable as it
would state the max amplitude of the system which could be used to set safety boundaries.
The application of digital filters is also recommended in order to diminish excessive noises
within the collected signals. Through the use of a digital filter, one can focus on a specific range
of frequencies to depict a much clearer response. For example, using a low-pass filter could allow
one to clearly identify the frequency range of human movements; 1.5-3.5 Hz. This occurs as an
ideal low-pass filter “leaves unchanged all frequency components of a signal below a designated
cutoff frequency, wc, and rejects all components above wc” [34]. Furthermore, the initial use of a
Finite Impulse Response (FIR) filter design is recommended over an Infinite Impulse Response
(IIR) filter design. This is due to the fact that FIR filters are subsequently easier to handle as they
“are widely used due to the powerful design algorithms that exist for them, inherent stability when
implemented in non-recursive form (the ease with which one can attain linear phase), have simple
extensibility to multi-rate cases and ample hardware support that exists for them among other
reasons” [35].

59
The third proposition is to fabricate a number of weight ranges (i.e. 140-160lbs, 160-
180lbs), along with the introduction of multiple activities (i.e. running, walking, jogging). One
could accomplish this by generating and evaluating the activity responses of 30 individuals for
each weight range. For example, 10 people around 160-166 lbs, 10 people around 167-173 lbs,
and 10 people around 174-180 lbs. For each individual and activity, at least 12 tests should be
recorded as reference to Racic et al., Experimental Identification and Analytical Modelling of
Human Walking Forces: Literature Review.
Simulated crowd excitation is the final proposition, as most structural issues revolving
around human impact are due to the effects of multiple people. Through the use of a human
induced-based equation, such as the one below in Figure 41, one can determine the synchronized
dynamic loading of an individual and/or group. This equation originates from the book Structural
Detailing in Concrete by M. Y. H. Bangash, and can be used to calculate the synchronized dynamic
load caused by “activities, such as jumping and dancing, which are periodic” [25] and mainly
dependent upon the static weight of human, period of loads, and contact ratio [6].
Figure 41: Synchronized Dynamic Load Equation

60
Figure 42: Typical Values of Contact Ratio for Various Activities
Further developments should also involve a combination of direct measurement and Monte Carlo
simulation. Monte Carlo simulation is “an analytical technique in which a large number of
simulations are run using random quantities for uncertain variables and the distribution of results
infer which values are most likely best” [33]. Therefore, the general approach would be to “collect
data for a small group of people, introduce certain parameters to quantify the main characteristics
and use the Monte Carlo method of sampling from some fitted probability distributions to generate
the loads for a large crowd” [6]. In order to take into account the lack of synchronization between
each individual, a phase lag, ψn, should be introduced to the Fourier series to represent the jumping
load such that:
(7)

61
References
[1] Kumar, Prakash, and Anil Kumar. "Human Induced Vibrations in Structures." International
Journal of Mechanical Engineering and Robotics Research 1.1 (2014): 44-54. IJMERR.
Int. J. Eng. & Rob. Res., Jan. 2014. Web. 19 Feb. 2016.
http://www.ijmerr.com/uploadfile/2015/0828/20150828054606377.pdf
[2] Howell, Elizabeth. "Why Do Soldiers Break Stride On A Bridge?" LiveScience. Live
Science, 22 May 2013. Web. 19 Jan. 2016. http://www.livescience.com/34608-break-
stride-frequency-of-vibration.html
[3] Nhleko, Sifiso. "Human-Induced Lateral Excitation of Public Assembly Structures." Thesis.
University of Oxford, 2011. Human-Induced Lateral Excitation of Public Assembly
Structures. University of Oxford, 2011. Web. 20 Feb. 2016.
http://www.eng.ox.ac.uk/civil/publications/theses/nhleko.pdf
[4] Reynolds, Paul, Aleksandar Pavic, and Zainah Ibrahim. "Changes of Modal Properties of a
Stadium Structure Occupied by a Crowd." Thesis. University of Sheffield. Changes of
Modal Properties of a Stadium Structure Occupied by a Crowd. The University of
Sheffield. Web. 20 Feb. 2016. http://sem-proceedings.com/22i/sem.org-IMAC-XXII-
Conf-s01p06-Changes-Modal-Properties-Stadium-Structures-Occupied-by-Crowd.pdf
[5] Bodare, A., and S. Erlingsson. "Rock Music Induced Damage and Vibration at NYA Ullevi
Stadium." Thesis. Missouri University of Science and Technology, 1993. Rock Music
Induced Damage and Vibration at NYA Ullevi Stadium. Scholars' Mine, 1 June 1993.
Web. 20 Feb. 2016.
http://scholarsmine.mst.edu/cgi/viewcontent.cgi?article=2173&context=icchge
[6] Sim, Jackie H H. "Human-Structure Interaction in Cantilever Grandstands." Thesis.
University of Oxford, 2006. Human-Structure Interaction in Cantilever Grandstands.
University of Oxford, 2006. Web. 20 Feb. 2016.
http://www.eng.ox.ac.uk/civil/publications/theses/sim.pdf
[7] Newland, David E. "VIBRATION OF THE LONDON MILLENNIUM FOOTBRIDGE:
PART 1 - CAUSE." Thesis. University of Cambridge. VIBRATION OF THE LONDON
MILLENNIUM FOOTBRIDGE: PART 1 - CAUSE. Cambridge Engineering. Web. 20
Feb. 2016. http://www2.eng.cam.ac.uk/~den/ICSV9_06.htm
[8] Sazak, Hasan Ozerk. "Structural Health Monitoring of a Stadium for Evaluating Human
Comfort and Structural Performance." Thesis. University of Central Florida, 2009.
Structural Health Monitoring of a Stadium for Evaluating Human Comfort and Structural
Performance. FCLA, 2010. Web. 26 Nov. 2015.
http://etd.fcla.edu/CF/CFE0003387/Sazak_Hasan_O_201008_MS.pdf

62
[9] "MMA8652FC, 3-Axis, 12-bit, Digital Accelerometer." Freescale Semiconductor. NXP, Oct.
2015. Web. 12 Jan. 2016.
http://cache.nxp.com/files/sensors/doc/data_sheet/MMA8652FC.pdf?pspll=1
[10] "General Purpose, Compact Accelerometer: 780B and 780C." Aerospace Measurement
Energy. Wilcoxon Research, Jan. 2014. Web. 12 Jan. 2016.
http://www.wilcoxon.com/prodpdf/780B and 780C spec (99014)B.pdf
[11] "Specifications." Model 2303/2304/2305: Modal Sledge Hammers. MEGGITT. Web. 15
Mar. 2016. https://www.endevco.com/wp-content/uploads/2303-2304-23054.pdf
[12] Signals & Systems. (2006, May 18). Retrieved December 6, 2015, from
http://bass.gmu.edu/~gbeale/ece_220/state_space_01.html
[13] Van Schijndel, Jos, and Paul Steskens. "System Identification for Indoor Climate Control."
Thesis. Eindhoven University of Technology. System Identification for Indoor Climate
Control. Eindhoven University of Technology. Web. 02 Feb. 2016.
http://arxiv.org/ftp/arxiv/papers/1203/1203.6728.pdf
[14] "Code of Ethics." Code of Ethics. ASCE: American Society of Civil Engineers, 23 July
2006. Web. 07 Mar. 2016. http://www.asce.org/code-of-ethics/
[15] "What Is a PE?" What Is a PE? National Society of Professional Engineers. Web. 13 Mar.
2016. http://www.nspe.org/resources/licensure/what-pe
[16] "A Beginner's Guide to Accelerometers." Robotics. Radio Control. Power Electronics.
Dimension Engineering. Web. 02 Mar. 2016.
http://www.dimensionengineering.com/info/accelerometers
[17] "Black-box vs White-box Testing." Technology Conversations. Technology Conversations,
2013. Web. 22 Mar. 2016. http://technologyconversations.com/2013/12/11/black-box-vs-
white-box-testing/
[18] "Black-box vs. White-box Testing: Choosing the Right Approach to Deliver Quality
Applications." Position Piece. Redstone, 2008. Web. 22 Mar. 2016.
http://www.cs.unh.edu/~it666/reading_list/Defense/blackbox_vs_whitebox_testing.pdf
[19] Ljung, Lennart. SystemID_Toolbox. Natick: MathWorks, Sept. 2015. PDF.
[20] Franklin, Gene F., J. David Powell, and Michael Workman. Digital Control of Dynamic
Systems. 3rd ed. Vol. 1. Ellis-Kagle, 2006. Print.

63
[21] Vahdatpour, A., Amini, N., Xu, W., & Sarrafzadeh, M. (2011). Accelerometer-based on-
body sensor localization for health and medical monitoring applications. HHS Public
Access, 1-1. doi:10.1016/j.pmcj.2011.09.002
[22] Mazzoleni, P., & Zappa, E. (2011). Human Induced Dynamic Loads Estimation Based on
Body Motion. Sensors, Instrumentation and Special Topics, 6, 7-7. Retrieved October 10,
2015, from Engineering Village.
[23] "Documentation." Fast Fourier Transform (FFT). MathWorks. Web. 12 Dec. 2015.
http://www.mathworks.com/help/matlab/math/fast-fourier-transform-fft.html
[24] Murray, T., Allen, D., & Ungar, E. (2003). Floor Vibrations due to Human Activity. Steel
Design Guide Series, 1(1), 71-71. Retrieved November 28, 2015, from Engineering
Village.
[25] Bangash, M. (1992). Introduction to Loads. In Structural Detailing in Concrete (Second ed.,
pp. 381-383). Thomas Telford.
[26] Practical Understanding of Key Accelerometer Specification. Endevco. PDF.
[27] De Silva, Clarence W. Vibrations and Shock Handbook. 1st ed. Vol. 1. Boca Raton: Taylor
& Francis Group, 2005. CRC Press. Web. 15 Jan. 2016.
[28] Racic, V., Pavic, A., & Brownjohn, J. (2009). Experimental Identification and Analytical
Modelling of Human Walking Forces: Literature Review (C. Morfey, Ed.). Journal of
Sound and Vibration, 49-49. Retrieved October 10, 2015, from Engineering Village.
[29] Ellis, B. R., and T. Ji. Floor Vibration Induced by Dance-type Loads: Verification. Tech. no.
1. Personal Pages, 1 Feb. 1994. Web. 15 Nov. 2015.
http://personalpages.manchester.ac.uk/staff/tianjian.ji/research/papers/b2-floor-
verification.pdf
[30] Reading Accelerometer Specifications. Wilcoxon Research. PDF.
[31] Racic, Vitomir, James M.W. Brownjoh, and Aleksandar Pavic. "Dynamic Loads Due to
Synchronous Rhythmic Activities of Groups and Crowds." Thesis. University of
Sheffield, 2011. Congress CIMNE. COMPDYN, 25 May 2011. Web. 2 Nov. 2015.
http://congress.cimne.com/eccomas/proceedings/compdyn2011/compdyn2011_full/139.p
df
[32] Linthorne, Nicholas P. Analysis of Standing Vertical Jumps Using a Force Platform. Rep.
School of Exercise and Sport Science, 8 May 2011. Web. 2 Mar. 2016.
https://www.brunel.ac.uk/~spstnpl/Publications/VerticalJump(Linthorne).pdf

64
[33] "What Is Monte Carlo? Definition and Meaning." InvestorWords.com. Web. 20 Apr. 2016.
http://www.investorwords.com/3114/Monte_Carlo.html
[34] "Documentation." Practical Introduction to Digital Filter Design. MathWorks. Web. 20 Apr.
2016. http://www.mathworks.com/help/signal/examples/practical-introduction-to-digital-
filter-design.html
[35] "Documentation." Designing Low Pass FIR Filters. MathWorks. Web. 20 Apr. 2016.
http://www.mathworks.com/help/dsp/examples/designing-low-pass-fir-filters.html

65
Appendix A: Structural Properties
Figure 43: Steel I-Beam Dimensions
Figure 44: Beam Mass Calculations

66
Figure 45: Beam Stiffness Calculations (Pt. 1)

67
Figure 46: Beam Stiffness Calculations (Pt. 2)

68
Figure 47: Beam Stiffness (Pt. 3), Natural Frequency & Damping Coefficient Calculations
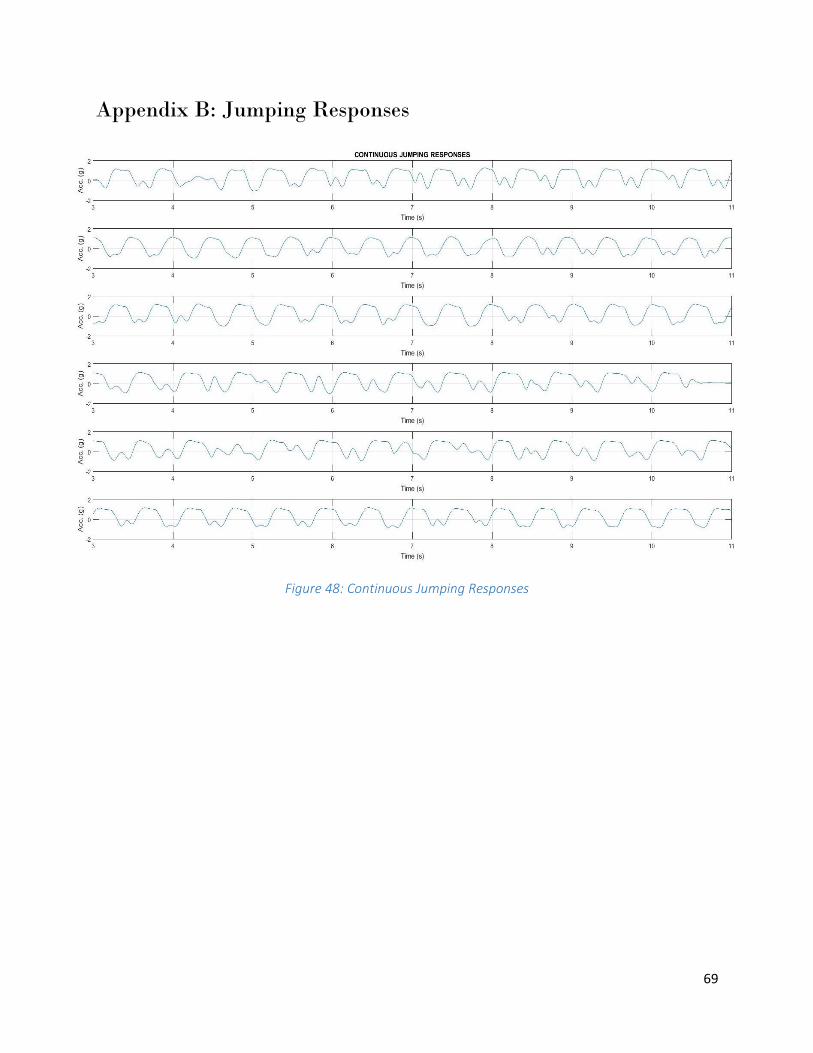
69
Appendix B: Jumping Responses
Figure 48: Continuous Jumping Responses

70
Figure 49: Delayed Jumping Responses