system integration and operation of a research … integration and operation of a research unmanned...
TRANSCRIPT

1
System Integration and Operation of a Research Unmanned Aerial Vehicle
Eric N. Johnson* and Daniel P. Schrage†
School of Aerospace Engineering, Georgia Institute of Technology, 270 Ferst Drive,
Atlanta, GA 30332-0150
*Lockheed Martin Assistant Professor of Avionics Integration, Member AIAA,
E-mail: [email protected]
†Professor, Fellow AIAA
Abstract
The use of flight simulation tools to reduce the schedule, risk, and required
amount of flight-testing for complex aerospace systems is a well-recognized benefit of
these approaches. However, some special challenges arise when one attempts to obtain
these benefits for the development and operation of a research Uninhabited Aerial
Vehicle (UAV) system. Research UAV systems are characterized by the need for
continual checkout of experimental software and hardware. Also, flight-testing can be
further leveraged by complementing experimental results with flight-test validated
simulation results for the same vehicle system. In this paper, flight simulation
architectures for system design, integration, and operation of an experimental helicopter-
based UAV, are described. The chosen helicopter-based UAV platform (a Yamaha R-
Max) is well instrumented: differential GPS, an inertial measurement unit, sonar
altimetry, and a 3-axis magnetometer. One or two general-purpose flight processors can
be utilized. Research flight test results obtained to date, including those completed in
conjunction with the DARPA Software Enabled Control program, are summarized.

2
I. Introduction
Recently, the effectiveness of commercial electronics and the maturation of
Unmanned Aerial Vehicle (UAV) technologies are such that sophisticated flight test
research can be done safely on a relatively small budget, including at the university level.
The fact that a pilot is not put at risk and highly capable computers and sensors are
available at lower cost makes things much easier. However, the sophistication necessary
to integrate hardware and software and then operate the system to achieve desired
research objectives remains.
The experience at the Georgia Institute of Technology in this area goes back to
initiation of the Association for Unmanned Vehicle Systems, International (AUVSI)
International Aerial Robotics Competition in 19911. This was followed by the U.S. Army
Autonomous Scout Rotorcraft Testbed (ASRT) project from 1994 to 1997. In 1997
Georgia Tech obtained two Yamaha R-50 remotely piloted helicopters (RPHs) for use in
flight controls research under the Army/NASA sponsored Center of Excellence in
Rotorcraft Technology (CERT) program, and represented a further shift to more capable
dedicated research vehicles. Flight control technologies, such as neural network adaptive
flight control, tested on these RPHs have gone on to flight tests on the X-36 and JDAM
programs as well as to NASA studies2-5.
Other researchers have also had success utilizing Yamaha helicopters, including
at Carnegie Mellon University, NASA Ames Research Center, and UC Berkeley6-9.
There has also been a number of efforts with smaller helicopters10,11, and fixed wing
aircraft. NASA has also been operating other research UAVs, including the previously

3
mentioned X-36 program. The same is true of other government laboratories, such as the
Air Force Research Laboratory and the Naval Research Laboratory.
Since 1998, Georgia Tech has been a part of the DARPA Software Enabled
Control (SEC) program12. In conjunction with these efforts, a Yamaha R-Max RPH, with
twice the payload of the R-50 was acquired. Subsequently, an open system UAV testbed
has been developed based on this platform. This research UAV is referred to as the
GTMax, Figure 1, and includes four major elements. These are: the basic Yamaha R-
Max RPH, a modular avionics system, baseline software (including middleware,
guidance, navigation, control, communications, and operator interface components), and
a set of simulation tools. In 2002 Georgia Tech was chosen to be the SEC rotary-wing
experiments lead, which includes working with other SEC technology developers in
integrating and testing their technologies on the GTMax system. An integrated
simulation and flight testing approach has been developed to support these activities. It is
a process that includes Software–In-The-Loop (SITL) and Hardware-In-The-Loop
(HITL) simulation as well as flight-testing. An SEC benchmark flight test was completed
in May 2002 and a series of planned mid-term and final experiments will be conducted
over the next 18 months.
This paper describes the development of the GTMax research UAV system,
including related simulation tools, and the system integration and operation process. The
GTMax system will first be described in some detail. Then, the simulation tools and
processes developed to support its development and research operation will be described.
Following this, significant flight test results over approximately 100 flights and
conclusions are summarized.

4
II. Research UAV System Description
As stated previously, the GTMax research UAV consists of four major elements.
These are: the basic Yamaha R-Max airframe, a modular avionics system, baseline
software, and a set of simulation tools.
Airframe
The GTMax utilizes the Yamaha R-Max industrial helicopter airframe, which has
the following characteristics:
• Rotor diameter: 10.2 feet; Length: 11.9 feet (including rotor)
• Engine: gasoline, 2 cylinder, water cooled, 246cc, 21 horsepower
• Max weight: 205 pounds; Payload including avionics: >66 pounds
• Endurance of approximately 60 min (hover)
• Generator, battery, and electric starter
• Yamaha Attitude Control System (YACS)
Baseline Hardware
The hardware components that make up the baseline flight avionics include
general purpose processing capabilities and sensing, and add approximately 35 pounds to
the basic airframe, leading to a total weight of approximately 157 pounds. Research
objectives can dictate additional equipment beyond this baseline. The digital interface to
the vehicle is via a modified Yamaha Attitude Control System (YACS) interface that
allows raw servo commands to be given without modification by this stability

5
augmentation system. The YACS also has other sensor outputs. The current baseline
research avionics configuration includes:
• 266 MHz Pentium II Embedded PC, 500 Mb Flash Drive
• 850 MHz Pentium III Embedded PC, 2 Gb Flash Drive
• Inertial Science ISIS-IMU Inertial Measurement Unit
• NovAtel OEM-4, differential GPS
• Honeywell HMR-2300, 3-Axis magnetometer
• Custom made ultra-sonic sonar altimeter
• Custom made optical RPM sensor
• Vehicle telemetry (RPM, Voltage, Remote Pilot Inputs, low fuel warning)
from YACS
• Actuator control interface to YACS
• 11 Mbps Ethernet data link and an Ethernet switch
• FreeWave 900MHz spread spectrum serial data link
• Axis 2130R pat, tilt, and zoom network camera
These components have been packaged into exchangeable modules: 2 computer
modules, the GPS module, the data link module (wireless Ethernet, wireless serial,
Ethernet switch), and the IMU module. These modules are placed in a vibration-isolated
rack below the main body of the helicopter, shown in Figure 2. Each module has its own
self-contained power regulation, air-cooling, and Electro-Magnetic Interference (EMI)

6
shielding. There is also a sonar/magnetometer assembly at the tail, a power distribution
system including circuit breakers near the module rack, and mounting points for camera
systems and other components under the nose. The power distribution system utilizes the
onboard generator, which outputs 12V DC. It includes a hot-swappable connection to
use external power. Each component has a dedicated individual circuit breaker.
Wiring external to the modules consists of RS-232 Serial, Ethernet, and 12V DC
only. Wiring is routed to one side of the module rack. The other side is kept free and
available for temporary hookups (e.g. Ethernet), status LEDs, and switches. The
complete wiring diagram is shown in Figure 3, including a typical configuration of RS-
232, Ethernet, and power wiring. Note the compartmentalization in modules and the
interface to the YACS via multiple serial lines.
Baseline Software
The operating systems utilized for typical onboard (Flight) software are:
VxWorks, QNX, Linux, or a combination. Operating system independence is maintained
to maximize the ability to support varied research programs. The operating system
independence is accomplished by extensive use of ANSI C/C++ (and the OpenGL API
for graphics used in simulations and graphical user interfaces). No special compilers are
required. Normally Microsoft Visual Studio is used for Windows and the GNU c-
compiler is used for Linux and QNX.
The onboard software runs on the two onboard computers, referred to as the
primary flight computer and the secondary computer. The Ground Control Station (GCS)
software runs on the ground, normally on one or more laptop computers, and is used to

7
for system operators to interact with the onboard systems. Simulation-specific software
refers to any software that is not used in the flight configuration. All of the above
software is included in the GCS or simulation-tool builds. Typically only the onboard
software is included in a primary flight computer or secondary computer build in addition
to any test-specific software.
The baseline navigation system running on the primary flight computer is a 17
state extended Kalman filter. The states include: vehicle position, velocity, attitude
(quaternion), accelerometer biases, gyro biases, and terrain height error. The system is
all-attitude capable and updates at 100 Hz13. The baseline flight controller is an adaptive
neural network trajectory following controller with 18 neural network inputs, 5 hidden
layer neurons, and 7 outputs for each of the 7 degrees of freedom14. These 7 degrees of
freedom include the usual 6 rigid-body degrees of freedom plus a degree of freedom for
rotor RPM. The controller can also be configured as a more conventional dynamics-
inverting controller.
The baseline flight controller and navigation system, which coupled with the
simple baseline trajectory generator, is capable of automatic takeoff, landing, hover,
flight up to the maximum attainable by the helicopter (around 85 feet/sec) and aggressive
maneuvering, discussed further in the results section below.
Generic and highly-capable data communication software has been developed to
support a large number of potential flight and simulator test configurations. First, these
routines supports serial data reading and writing as necessary for the Commercial Off
The Shelf (COTS) sensors and other custom components used. These same routines can
also be used to re-route any data through Ethernet or as memory within a single

8
executable. These data routings can be modified in real-time, by software switch. It
should be noted that almost all operating system specific software is limited to these
routines. These data communication routines are used to: interface with all sensors, the
wireless serial data link, and to repeat all wireless serial data over the wireless Ethernet
(for redundancy). Also, any data received over a link can be stored to a binary file. This
recorded data can then be played back to stimulate selected components. All data
received from the helicopter over either data link is stored in this manner during flight.
Simulation Tools
Early in the GTMax system design, the top-level simulation requirements to
support the development and operation of an experimental UAV were identified as:
1. Test all custom developed research software and guidance, navigation, and
control algorithms in a rigorous manner (more extensively than practical or safe in
a flight test setting)
2. Test onboard computer hardware, operating system implementation, and software
execution in real-time
3. Rehearse all procedures and flight test plans
4. Visualize recorded flight test data
5. Reconstruction of flight test events after-the-fact (e.g., incident reconstruction)
6. Can be utilized at the flight test location
From these, the following component requirements were derived:

9
1. Models of the sensors, aircraft, and aircraft interfaces – down to the level of
binary serial data (i.e., packets) with time delays
2. Injection of model error and environmental disturbances, of those expected to be
experienced in flight and worse
3. Flexible scene generation capability
4. Can operate a configuration of the simulation tools effectively using a single
conventional laptop computer
5. Reconfigurable data communication routines (discussed above) in the context of
flight software
The simulator tools that have been developed normally run on high-end personal
computers or laptops that use the Windows 2000/NT operating system or Linux, and is
written primarily in C/C++. It includes: an aircraft model, the aircraft interface model
(YACS), and sensor models (IMU, GPS, sonar, magnetometer, YACS, and camera). The
aircraft model has six rigid-body degrees of freedom plus engine, fuel, landing gear, and
rotor dynamics. The helicopter interface (YACS) model simulates the servo interface
unit functionality and RS-232 serial interface. The sensor models include errors,
mounting location and orientation, time delays, and digital interfaces. The scene
generator includes a 3-D graphics window, Figure 4, showing the aircraft and the terrain,
and has additional functionality to aid in data visualization or use in the Ground Control
Station.

10
The basic simulation tools allow for real-time display of all onboard data,
including plotting and logging. It also allows one to modify any data. The simulator can
run in real time or in a batch mode (faster than real time).
Between the generic communication routines and models for all system
components, and extremely large number of simulator configurations are possible. The
configurations include an all software configuration, SITL, where only the real flight
software is utilized. Many combinations of real hardware and simulated components are
possible, including: testing only the primary flight computer hardware, only the
secondary computer hardware, only the ground station, only a single sensor, or any
combination of one or more of these.
III. System Integration Process
The system integration process for a single research test flight that involves
changes to the baseline system involves five major steps:
1. Development of test plan, including definition of test objectives
2. Definition and implementation of changes to baseline hardware software
3. Software-In-The-Loop (SITL) simulation test
4. Hardware-In-The-Loop (HITL) simulation test(s)
5. Flight testing and data reduction
Earlier steps are repeated if a simulation or flight test fails in some manner. The
complete process can take any length of time depending on the nature of the test or
system change, even on occasion all on the same day.

11
To utilize the common-form of the SITL simulation configuration, illustrated in
Figure 5, the un-compiled software source code, which normally runs on the onboard
computer, is compiled into the simulation tool itself, allowing this software to be tested
on the simulation host computer. This allows all flight software to be tested without the
need to tie-up any flight hardware. The majority of research software development can
conducted using this configuration, since it can be used on most desktop computers or
laptops. Since this simulation tool includes detailed software interfaces and data
communication system properties, the amount of time spent doing HITL simulation and
tying up the flight hardware is effectively minimized.
Once any modification has been tested with the SITL configuration, any required
HITL simulation configurations are used. The configurations required depend on what is
being tested, but a test of a change to the primary flight computer is shown in Figure 6.
For this HITL simulation, the onboard computer is plugged into a simulation-host
computer. Here, the hardware under test is the onboard computer(s), servos, along with
all software that executes on the computer(s). The sensor and helicopter interface models
provide the proper interfaces to the onboard computer, so the onboard computer
configuration is identical to that used in a flight test. This HITL simulation configuration
is used to test all guidance, navigation, and control algorithms software and the primary
flight computer hardware, in real-time.
Another important configuration is the secondary computer HITL. In this
configuration, the simulation host includes the primary flight computer software, the
GCS, and the simulation. It then communicates with the secondary computer under test.

12
Other Simulator Configurations Used
Ground Control Station test: When there are changes to the Ground Control
Station (GCS) or the datalink, the GCS can be tested as HITL. This allows an operator
and the GCS hardware to interact with a simulated vehicle in the same way it is used in
flight. The GCS and onboard software/vehicle models can be run on two separate
machines on a network. This allows all the details of communicating data between the
GCS and the onboard computers to be tested thoroughly before tying up flight hardware.
Truck testing of navigation system: This configuration has been used to test the
onboard navigation software operating with the actual sensors without flying the vehicle.
This was accomplished first statically, and then dynamically on a truck. For some of
these tests a laptop has acted as the onboard computer (enabling easier access to data,
since the GCS and onboard software were running on the same machine) as well as the
actual flight computer.
Navigation data playback: Once onboard raw sensor data had been recorded in
flight, extensive use of this data has been made in improving the navigation system. This
was done by playing back this data in real time or faster than real time, and executing the
onboard navigation flight software.
Fake GPS data in the lab: Prior to any flight test activity, it is important, as a final
check, to bring up the flight software in the exact flight configuration to test basic
functionality statically on the ground. Because this is conveniently done indoors, there
may be no GPS data available. To facilitate this test, simulated GPS data is sent from a
simulator running on some other machine on the network to replace data coming from the
actual GPS receiver. This can be done for any other sensor that is temporarily off-line.

13
Image processing configurations: Several programs have required simulator
configurations that support testing of image processing subsystems. The first
configuration used allowed still images (from flight or other sources) to be send one-at-a-
time to the image processing subsystem running as part of the SITL configuration (on one
or more networked machines). The second configuration utilized recorded video data
from a flight test. To accomplish this, video was played back and sent to the onboard
video server (the flight hardware) and then to the image processor. The image processor
was either the flight hardware itself or an alternate networked machine, or even both
when needed. The third image-processing configuration was used to test tracking and
mapping algorithms and software. Here, the simulator generated fake video using the
simulator scene generator. One way this was configured was to place a monitor in front
of the GTMax onboard camera, utilizing the flight hardware for the camera, frame
grabber, and image processing computer.
GCS data playback: As stated above, the communication routines can be
configured to save and playback data sent over a serial line. All data received from the
helicopter in flight is recorded in this manner, allowing for reconstruction of events in the
case where all other data was lost.
IV. Research Flight Test Results
A number of research flight tests have been conducted on the GTMax, including
the development of the baseline guidance, navigation, and control algorithms, SEC
program tests and demonstrations, and the Aerial Robotics Competition mission.
Selected results are summarized here.

14
Open Control Platform
The Open Control Platform (OCP)12 was flight-tested performing low-level flight
control functions for the GTMax, including the reconfiguration of flight control software
while the helicopter was in automatic flight. The architecture used is illustrated in Figure
7, where the baseline software modules were configured as OCP software components,
and two copies of the controller component were developed. The first used the nominal
adaptive flight controller; the second was configured as a conventional inverting
controller. The OCP was able to swap between these two controller modules in real time,
even with components running at 50 and 100 Hz.
Neural Network Adaptive Flight Control
A Neural Network (NN) adaptive flight control system that tracks desired
helicopter trajectories has been tested extensively on the GTMax14. The system includes
the ability to handle large model errors. For these tests, a simple linear model
corresponding to the hover flight condition is the only model information provided a
priori to the system. Online training of the neural network is relied upon to correct for
the resulting model error over the entire speed flight envelope of the helicopter. The
system also inherently accounts for actuator position and rate saturation as well as time
delay.
A typical result is shown in Figure 8 for a “racetrack” pattern viewed from above
flown at 40 feet/second. This trajectory starts and finishes in hover and includes normal
turns at each of four waypoints. The maximum distance between commanded and
estimated position is approximately 10 feet, with average errors much lower. Figure 9

15
illustrates a typical speed trial, in this case reaching a maximum ground speed of
approximately 95 feet/sec. The first leg is upwind, the second is downwind. On the
upwind leg the speed is limited by saturating collective pitch. Rotor RPM is held
constant throughout at approximately 850. Aggressive maneuvers have also been tested,
including a reversal of course, starting and finishing at 50 feet/second. The maneuver
takes approximately 6 seconds, and allows the helicopter to come to a stop in
approximately 75 feet, and involves a pitch attitude in excess of 60 degrees.
Automatic Takeoff and Landing
Automatic takeoffs and landings have been performed using the Neural Network
adaptive flight control system described above14. The navigation system determines if
the helicopter is on the ground by comparing the altitude above ground level (AGL) with
a pre-selected value. That is, if the helicopter is within a few inches of the ground it acts
as though it is in contact with the ground. Commanded position is slaved to the current
position when the helicopter is declared on the ground. Also, the internal states of the
flight control system are frozen. Depending on whether the helicopter is attempting a
takeoff or a landing/hold, the rotor RPM is ramped either up to flight speed or down to
idle respectively. Also depending on objective, the collective pitch is ramped up or down
at a constant rate. Takeoffs are performed by ramping rotor RPM and collective until the
helicopter is detected airborne, at which point the trajectory generator produces a smooth
climb trajectory. Landings end with a slow vertical descent command until ground
contact is detected and rotor RPM and collective pitch are reduced to an idle state.
A plot of the first automatic takeoff of the GTMax is shown in Figure 10, where a
smooth climb to 30 feet of altitude and a hover were specified. The first automatic

16
landing and the GTMax is shown in Figure 11, where in this case a long slow descent of
0.5 feet per second is used until ground contact is detected.
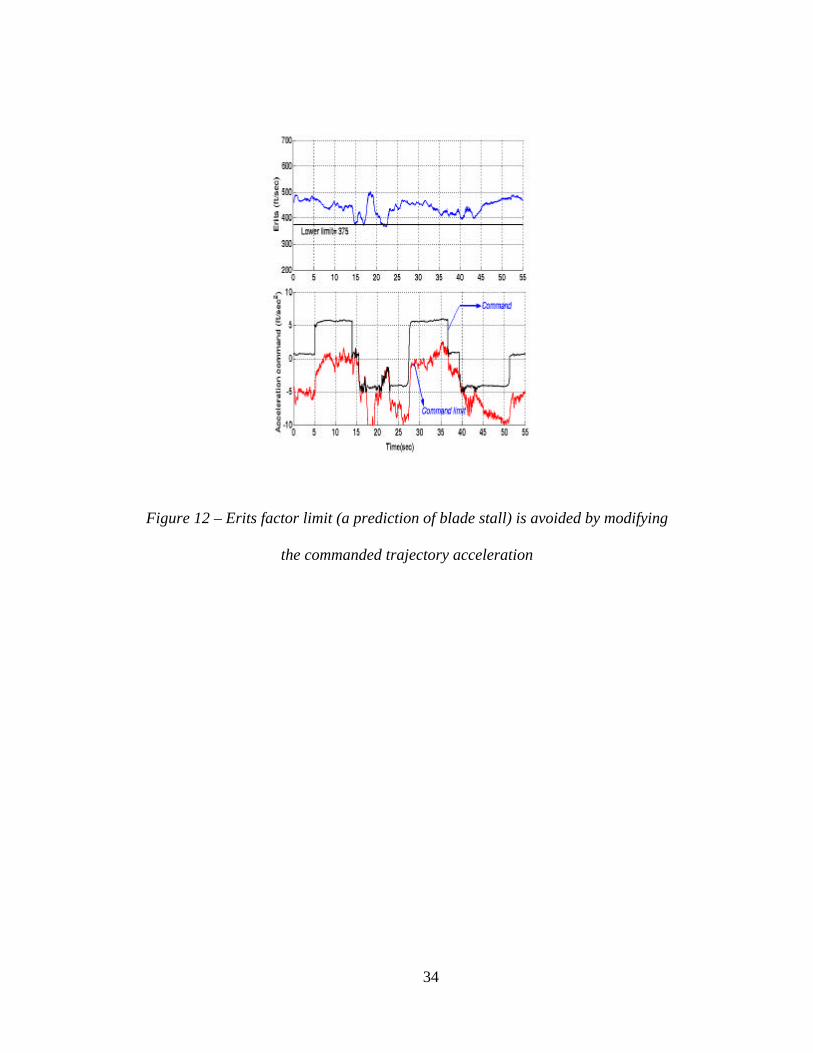
Automatic Flight Envelope Protection
An automatic flight envelope protection system that utilizes an online trained
neural network to predict and then avoid flight envelope limits. Flight tests conducted to
date include avoidance of a rotor stall prediction parameter (Erits factor, in units of
speed), set artificially conservative to facilitate safe testing15. The limit itself is avoided
by modifying the commanded trajectory acceleration, with commanded velocity and
position also modified accordingly. A typical result is shown in Figure 12. The OCP
was utilized to manage this software module on the secondary flight computer.
Fault Tolerant Control
The fault scenario of a stuck collective pitch actuator was simulated in flight by
limiting the deflection of swash plate actuators in such a way to prevent changes in
collective pitch. The range of acceptable rotor RPM command was experimentally
determined to be 700 to 950, all utilizing the baseline adaptive flight controller without
modification (normally rotor RPM is 850). Note that flight at 700 RPM required
saturated collective pitch in order to hover.
A fault tolerant control module was developed, running with the OCP on the 2nd
flight computer, generated a rotor RPM command that allows the existing flight
controller to continue to function, albeit at reduced performance. It was demonstrated
that this capability could be enough to safely recover the vehicle in such a scenario.

17
A typical flight test result is illustrated in Figure 13, where up and down step
responses of 10 feet were performed in between hover segments. Altitude hold
performance is significantly worse without collective pitch, but still effective.
Performance was not degraded significantly in other axes of flight control even though no
changes were made to these other elements.
International Aerial Robotics Competition Mission
In August 2002, the GTMax system was used to compete in the AUVSI
International Aerial Robotics Competition16. For this competition, a UAV system must
automatically identify a specific building in a prescribed search area, and then identify an
opening into the building. This must be done without any human assistance during a
mission attempt, and represents a high-mark for UAV automatic search and recognition
capabilities. A camera and frame grabber were added the basic GTMax, and the 2nd
computer was configured as a image processing subsystem running the Linux operating
system. Mapping and flight planning software components were added to the primary
flight computer. Due to radio frequency interference at the contest site, multiple attempts
had to be aborted due to loss of GPS lock. On the one attempt that was able to proceed to
its conclusion without loss of GPS, the system descended down to 50 feet of altitude and
circled each of the three buildings looking for the identification marking and openings
into the building. On this attempt, the correct building was identified, but the opening
automatically selected was from a neighboring building.
In July 2003, with the mission now moved to the McKenna MOUT site with its
15 buildings, an improved system was tested1. The improved system utilized the now-
baseline pan/tilt/zoom camera system and improved image-processing software. Four

18
attempts were made during the competition, on three of those attempts, the system
automatically flew a search pattern over this simulated European village, looking at all of
the walls of all of the buildings within. Three times, it automatically located the pre-
specified sign on one of the buildings and identified the correct "building of interest".
Recorded images are shown in Figure 14. The vehicle then automatically flew a search
pattern looking for openings into this building, and then gave the location of a valid
opening along with a picture of that opening, also shown in Figure 14.
V. Conclusions
The extensive use of a variety of simulation configurations has been of
considerable benefit for the recent development and operation of the GTMax UAV, and
for its use in research. The key features of a flexible data communication system, models
for all hardware components, and a simulation software infrastructure enable these
configurations. The benefits have included increased safety, effective participation of a
large number of researchers, the detection of errors early thus saving development time,
and the effective use of flight test data.
The use of a modular avionics architecture and the use of a reliable vehicle with a
relatively large payload capacity allows the GTMax to be configured quickly for a variety
of experiments. For example, it allowed the vehicle to be reconfigured for the aerial
robotics competition relatively easily by adding a camera and video server. The capacity
also allows efficient use of flight test time, allowing multiple unrelated flight test points
during a single flight.

19
In terms of results, the research UAV system described here has been utilized to
test: new software infrastructures for control, adaptive flight control in aggressive flight,
fault-tolerant control, automated envelope protection, automated search and recognition.
These results were obtained through approximately 100 flights spread over 23 days of
flying in a 16 month period.
References
1Proctor, A., Kannan, S., Raabe, C., Christophersen, H., and Johnson, E.,
“Development of an Autonomous Aerial Reconnaissance System at Georgia Tech,”
Proceedings of the Association for Unmanned Vehicle Systems International Unmanned
Systems Symposium & Exhibition, 2003.
2Brinker, J., and Wise, K. “Flight Testing of a Reconfigurable Flight Control Law
on the X-36 Tailless Fighter Aircraft.” Proceedings of the AIAA Guidance, Navigation,
and Control Conference, 2000.
3Idan, M., Johnson, M., and Calise, A. “A Hierarchical Approach to Adaptive
Control for Improved Flight Safety.” Journal of Guidance, Control, and Dynamics, Vol.
25, No. 6, 2002.
4Johnson, E., Calise, A., El-Shirbiny, H., and Rysdyk, R. “Feedback
Linearization with Neural Network Augmentation Applied to X-33 Attitude Control.”
Proceedings of the AIAA Guidance, Navigation, and Control Conference, 2000.
5Corban, J., Calise, A., Prasad, J.V.R., Hur, J., and Kim, N. “Flight Evaluation of
Adaptive High-Bandwidth Control Methods for Unmanned Helicopters,” Proceedings of
the AIAA Guidance, Navigation and Control Conference, 2002.

20
6O. Shakernia, C. S. Sharp, R. Vidal, D. Shim, Y. Ma, and S. S. Sastry, “A Vision
System for Landing an Unmanned Aerial Vehicle,” IEEE Int. Conference Robotics and
Automation, 2002.
7M. La Civita, G. Papageorgiou, W. C. Messner, T. Kanade, “Design and Flight
Testing of a High-Bandwidth H-infinity Loop Shaping Controller for a Robotic
Helicopter,” Proceedings of the AIAA Guidance, Navigation, and Control Conference,
2002.
8Nakanishi, H., Inoue, K., and Sato, A. “Development of Command and Control
Systems for UAVs,” Proceedings of American Helicopter Society 57th Annual Forum,
2001.
9Whalley, M., Freed, M., Takahashi, M., Christian, D., Patterson-Hine, A.,
Schulein, G., and Harris, R., “The NASA/Army Autonomous Rotorcraft Project,”
Proceedings of the AHS Annual Forum, 2003.
10Johnson, E., DeBitetto, P., Trott, C., and Bosse, M., “The 1996 MIT/Boston
University/Draper Laboratory Autonomous Helicopter System,” Proceedings of the 15th
Digital Avionics Systems Conference, 1996.
11Gavrilets, V., Martinos, I., Mettler, B., and Feron, E., "Flight Test and
Simulation Results for an Autonomous Acrobatic Helicopter,” Proceedings of the 21st
Digital Avionics Systems Conference, 2002
12Wills, L., Kannan, S., Sander, S., Guler, M., Heck, B., Prasad, J.V.R., Schrage,
D., and Vachtsevanos, G., "An Open Platform for Reconfigurable Control," IEEE
Control Systems Magazine, pp. 49-64, June 2001.

21
13Dittrich, J., and Johnson, E., “Multi-Sensor Navigation System for an
Autonomous Helicopter,” Proceedings of the 21st Digital Avionics Systems Conference,
2002.
14Johnson, E. and Kannan, S., “Adaptive Flight Control for an Autonomous
Unmanned Helicopter,” Proceedings of the AIAA Guidance, Navigation, and Control
Conference, 2002.
15Yavrucuk, I., Prasad, J.V.R., Calise, A., and Unnikrishnan, S., “Adaptive Limit
Control Margin Prediction and Avoidance,” Proceedings of the 58th AHS Annual Forum,
2002.
16Christophersen, H., Hart, M., Dhingra, M., Johnson, E., and Guily, R.,
“Development of an Autonomous Aerial Reconnaissance System at Georgia Tech,”
Proceedings of the Association for Unmanned Vehicle Systems International Unmanned
Systems Symposium & Exhibition, 2002.
Acknowledgement
The authors would like to acknowledge some of the many other direct
contributors to the work described in this paper: Henrik Christophersen, Scott Clements,
J. Eric Corban, Cameron Craddock, Christophe De Wagter, Manuj Dhingra, Joerg
Dittrich, Graham Drozeski, Richard Guily, Luis Gutierrez, Murat Guler, Jincheol Ha,
Bonnie Heck, Jeong Hur, Aaron Kahn, Suresh Kannan, Eric Martens, Brian Mendel,
Sumit Mishra, Alex Moodie, Wayne Pickell, J.V.R. Prasad, Alison Proctor, Hungsun
Son, Suraj Unnikrishnan, George Vachtsevanos, Linda Wills, and Ilkay Yavrucuk. The

22
majority of work are supported by the DARPA Software Enabled Control (SEC) Program
under contracts #33615-98-C-1341 and #33615-99-C-1500.

23
Figure 1 – GTMax Research UAV

24
Figure 2 – Vibration isolated avionics module rack, from left to right: data link
module, GPS module, computer module #1 (flight computer), computer module #2
(auxiliary)

25
Primary Flight Computer
Serial Extension Board
FreewaveDGR-115
DC/DC
5V
5V
Battery 12V
Au
xilia
ryM
odul
e
Aironet MC4800
EthernetHub
NovAtel RT-2 GPS Receiver
Secondary Computer
Radar Altimeter
ISIS-IMU
12V
DC/DC
DC/DC
HMR-2300Magnetometer
DC/DC
Sonar Altimeter
Power DistributionModule
Generator
Yamaha AttitudeControl System
RC Receiver YACS IMU
12V5V
RS-232 SerialEthernet
DC Power
Dat
a L
ink
Mod
ule
GP
S M
od
ule
IMU
/Rad
arM
odul
eF
ligh
t C
om
pu
ter
Mo
du
le
5V
12V
Primary Flight Computer
Serial Extension Board
FreewaveDGR-115
DC/DC
5V
5V
Battery 12V
Au
xilia
ryM
odul
e
Aironet MC4800
EthernetHub
NovAtel RT-2 GPS Receiver
Secondary Computer
Radar Altimeter
ISIS-IMU
12V
DC/DC
DC/DC
HMR-2300Magnetometer
DC/DC
Sonar Altimeter
Power DistributionModule
Power DistributionModule
Generator
Yamaha AttitudeControl System
RC Receiver YACS IMU
Yamaha AttitudeControl System
RC Receiver YACS IMU
12V5V
RS-232 SerialEthernet
DC Power
Dat
a L
ink
Mod
ule
GP
S M
od
ule
IMU
/Rad
arM
odul
eF
ligh
t C
om
pu
ter
Mo
du
le
5V
12V
Figure 3 – GTMax wiring diagram, including separation into modules, each with
their own power regulation, air-cooling, and EMI shielding

26
Figure 4 – Simulator scene generator and its use as a part of the Ground Control
Station (GCS) operator interface

27
Vehicle Model
SensorDrivers
SensorEmulation(w/ Error Model)
ActuatorDriver
SensorData
StateEstimate Control
ActuatorModel
State Control
SensorRaw Data
ActuatorRaw Data
Desktop Computer
OtherSystems
FlightController
NavigationFilter
Command Vector
GCS
Figure 5 – Nominal Software in the Loop configuration

28
Vehicle Model
SensorDrivers
SensorEmulation
(w/ Error Model)
ActuatorDriver
SensorData
StateEstimate Control
ActuatorSimulation
State Control
SensorRaw Data
ActuatorRaw Data
Desktop Computer
Flight Computer
FlightController
NavigationFilter
Command Vector
GCS
Figure 6 – Hardware in the Loop structure for testing changes to the primary
flight computer software or hardware

29
GPS
IMU
Magnetometer
sonar
GPS
IMU
Magnetometer
sonar
receiver commands
Vehicle Health
RMAX Attitude sensors
receiver commands
Vehicle Health
RMAX Attitude sensors
Navigation ModuleComponent
Navigation ModuleComponent
ControllerComponentController
Component
Sensors SerialInterface
Sensors SerialInterface
Vehicle SerialInterface
Vehicle SerialInterface
Controls API Input Port
Controls API Output Port
RMAX Actuator demultiplexerRMAX Actuator demultiplexerRMAX Actuator demultiplexer
Actuator SerialInterface
Actuator SerialInterface
ControlData_out
ControlData_in
NavControl_out
NavControl_in
NavData_out
NavData_in
50 Hz
50 Hz 50 Hz
100 Hz
I/OComponent
DataLink Interface Ethernet “Serial” Port
Serial port
Ethernet “Serial” Port
Serial port1 Hz & 10 Hz
1 Hz & 10 Hz
Input datalink portsread @ 100 Hz
m0 written at 10 Hzm1 written at 1 Hz
Figure 7 – Open Control Platform (OCP) implementation of baseline GTMax
guidance, navigation, flight control, and communication

30
200 300 400 500 600 700-300
-200
-100
0
100
200
300
400
500
600
700
North and East (ft)
Estimated PositionCommand Position
Figure 8 – Racetrack pattern flown at 40 feet/second starting and finishing in
hover, commanded position plotted once per second

31
9160 9180 9200 92200
20
40
60
80
Time (sec)
Gro
und
Spe
ed (
ft/se
c)
Figure 9 – Speed trial, first upwind (left) then downwind (right); speed limited by
saturating collective upwind on first leg

32
5058 5060 5062 5064 50660
5
10
15
20
25
30
Time (sec)
Alti
tude
(ft)
Figure 10 – Recorded altitude during an automatic takeoff and climb to a hover
at 30 feet of altitude

33
1915 1920 1925 1930 1935 19400
2
4
6
8
10
Alti
tude
(ft)
Time (sec)
Figure 11 – Recorded altitude during an automatic landing, after a descent at 0.5
feet/second
34
Figure 12 – Erits factor limit (a prediction of blade stall) is avoided by modifying
the commanded trajectory acceleration

35
3400 3420 3440 3460 3480 3500 3520262
264
266
268
270
272
274
276
278
280
Time (sec)
Alti
tude
(ft)
EstimatedCommand
3400 3420 3440 3460 3480 3500 3520800
850
900
950
Time (sec)
Rot
or A
ngul
ar R
ate
(RP
M)
Figure 13 – Utilizing rotor RPM to accommodate a simulated stuck collective
actuator, step responses; (top) altitude and altitude command, (bottom) measured
rotor RPM; note transient in RPM during climb and descent

36
Figure 14 – (top) Typical image of symbol (black circle with white “X”) used to
automatically identify building, raw on left, a processed image with green “+” on
symbol on right; (bottom) automatically selected opening to this building is the
door in the center of the image